
Leasing Industryin Poland
19
Leasing Industry in Poland Leasing Life European Conference Warsaw 2014 Mieczysław Woźniak Vice Chairman of the Polish Leasing Association
Transcript of Leasing Industryin Poland

Leasing Industry in PolandLeasing Life European ConferenceWarsaw 2014
Mieczysław Woźniak
Vice Chairman of the Polish Leasing Association

3.1 3.3
1.6
1.6 1.5
1.6
1.0
Leasing defined
in the Tax Law
Leasing defined
in the Accounting LawWorld economic crisis starts
New Business Forecast
Polish leasing market 1995 – 2013 milestones
Begining of 2007-2013 EU
budget perspective
1.5 2.5 4.06.0
8.0 7.8 6.3 7.510.5 11.8
13.7
19.6
29.6 29.8
20.9
25.729.5 29.8
33.7
40.0
1.0
1.7 1.21.4
0.8
0.61.9
2.5
2.02.1
1995 1996 1997 1998 1999 2000 2001 2002 2003 2004 2005 2006 2007 2008 2009 2010 2011 2012 2013 2014
Movables Real Estate
Leasing defined
in the Civil Code

Year 1995 2013
New business PLN 1 500m PLN 35 300m
Ranking in the European Leasing Market 16 8
Share of leasing in investment financing 4,5% 14,4%
1995-2013 snapshot. Key changes & developments
No. of leasing companies 102 32
Top 10 companies (market share) 71,5% 66%
Bank-owned companies in Top 10 4/10 10/10

2,031
3,050 3,274
2,073
1,595
1,629 1,468
1,631
594
PLN 296,27bn
Almost PLN 300bn of investment was financed by leasingsince 2004
11,82213,716
19,630
29,597 29,791
20,923
25,69629,513 29,758
33,66930,4211,930
2,458
2004 2005 2006 2007 2008 2009 2010 2011 2012 2013 I-IX 2014
Movables Real Estate

0.0%
10.0%
20.0%
30.0%
40.0%
50.0%
60.0%
70.0%
80.0%
90.0%
100.0%
0.0
10.0
20.0
30.0
40.0
50.0
60.0
70.0
80.0
90.0
100.0
Jan Jun Nov Apr Sep Feb Jul Dec May Oct Mar Aug Jan Jun Nov Apr Sep Feb
89,6 mld
49.856.6 56.5 54.9 53.4 55.3 55.9
61.1 60.8 61.5 62.1 64.571.4
1.8%
13.7%
-0.2%-2.8% -2.8%
3.6%0.9%
9.4%
-0.5%1.3% 0.9%
3.9%
10.7%
Jun Dec Jun Dec Jun Dec Jun Dec Jun Dec Jun Dec Jun
Leasing market O/S (Total market)O/S of investment loans
Importance of leasing vs. investment loans
07 07 07 08 08 09 09 09 10 10 11 11 12 12 12 13 13 14
Investment loans (mld PLN) Deposits/Loans ratio for companies
Jun '08
Dec '08
Jun '09
Dec '09
Jun '10
Dec '10
Jun '11
Dec '11
Jun '12
Dec '12
Jun '13
Dec '13
Jun '14
Total lease market (PLN bln) change as to the previous period
43.948.4 47.7 47.3 45.4 47.8 48.0
52.4 52.4 53.4 53.356.5
63.4
16.2%
10.2%-1.4% -0.9%
-3.9%
5.2%0.5%
9.1%
-0.1%2.0%
-0.3%
6.0%
12.2%
Jun '08
Dec '08
Jun '09
Dec '09
Jun '10
Dec '10
Jun '11
Dec '11
Jun '12
Dec '12
Jun '13
Dec '13
Jun '14
Leasing market O/S (Movables)
Movables lease market (PLN bln) change as to the previous period
5.9
8.2 8.8 7.6 8.0 7.5 7.9 8.7 8.4 8.1 8.8 8.0 8.0-47.0%
39.0%
7.3%
-13.6%
5.3%
-6.3%
5.3%10.1%
-3.4% -3.6%
8.6%
-9.1%0.0%
Jun '08
Dec '08
Jun '09
Dec '09
Jun '10
Dec '10
Jun '11
Dec '11
Jun '12
Dec '12
Jun '13
Dec '13
Jun '14
Leasing market O/S (Real Estate)
Real Estate lease market (PLN bln) change as to the previous period

Market structure by type of players
Akf leasing Polska S.A.
BGŻ Leasing Sp. z o. o.
BNP Paribas Lease Group Sp. z o. o.
BZ WBK Leasing S.A.
Caterpillar Financial Services Poland Sp. z o. o.
De Lage Landen Leasing Polska S.A.
Deutsche Leasing Polska S.A.
DnB Leasing Sp. z o. o.
Mercedes-Benz Leasing Polska Sp. z o.o.
Millennium Leasing Sp. z o.o.
mLeasing Sp. z o.o.
NOMA2 Sp. z o.o.
ORIX Polska S.A.
Pekao Leasing Sp. z o.o.
PKO Leasing S.A.
Polski Związek Wynajmu i Leasingu Pojazdów
15%
(by value of new business)
DnB Leasing Sp. z o. o.
Europejski Fundusz Leasingowy S.A.
Getin Leasing S.A.
Grupa Masterlease
Handlowy-Leasing Sp. z o. o.
Idea Leasing S.A.
IKB Leasing Polska Sp. z o. o.
Impuls-Leasing Polska Sp. z o. o.
ING Lease (Polska) Sp. z o. o.
Polski Związek Wynajmu i Leasingu Pojazdów
Raiffeisen-Leasing Polska Sp. z o.o.
Scania Finance Polska Sp. z o.o.
SG Equipment Leasing Polska Sp. z o.o.
SGB Leasing Sp. z o.o.
Siemens Finance Sp. z o.o.
VB Leasing Polska S.A.
VFS Usługi Finansowe Polska Sp. z o.o.
Volkswagen Leasing Polska Sp. z o.o.
85%
Captives Bank-owned


23%
31% 31% 32%
36%
Leasing share in Investments
22,0%
EUROPE 2013
Share of leasing in investment financing in Poland
2% 1% 1% 1% 1%
10.5%12.6% 13.1% 12.7%
14.4%
2009 2010 2011 2012 2013
Movables Real Estate Total
12,5%
1,5%
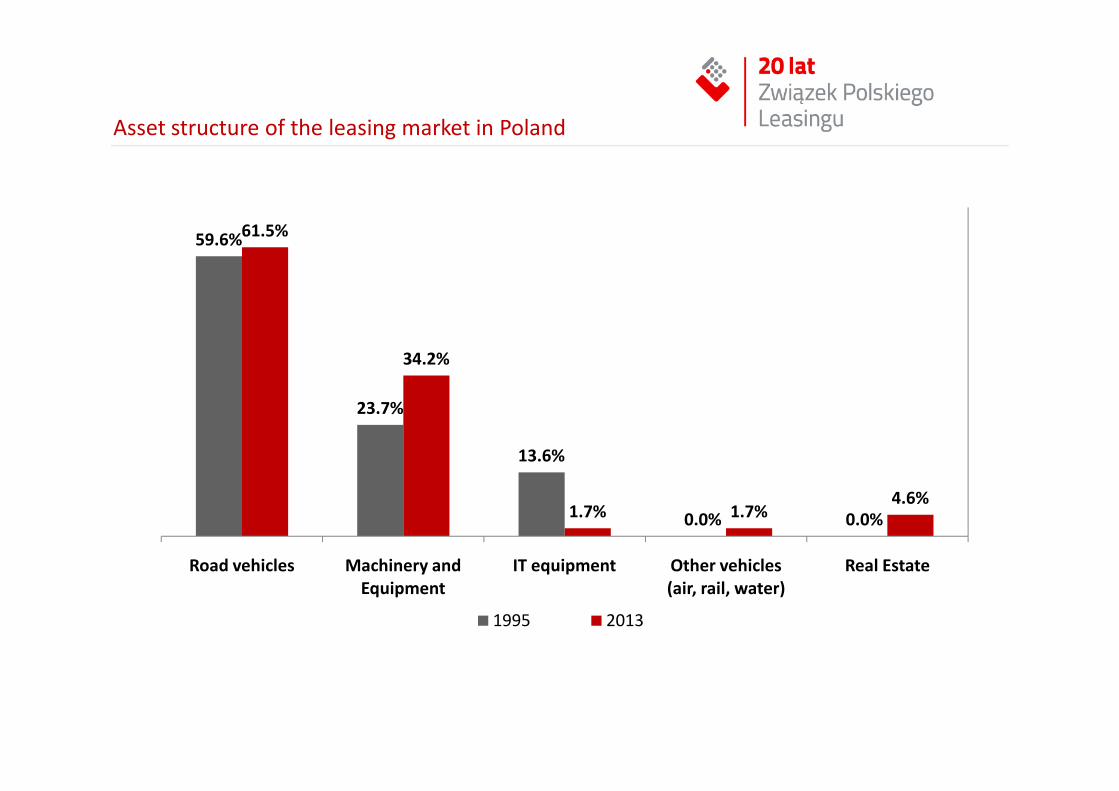
59.6%
23.7%
61.5%
34.2%
Asset structure of the leasing market in Poland
23.7%
13.6%
0.0% 0.0%1.7% 1.7%4.6%
Road vehicles Machinery and
Equipment
IT equipment Other vehicles
(air, rail, water)
Real Estate
1995 2013
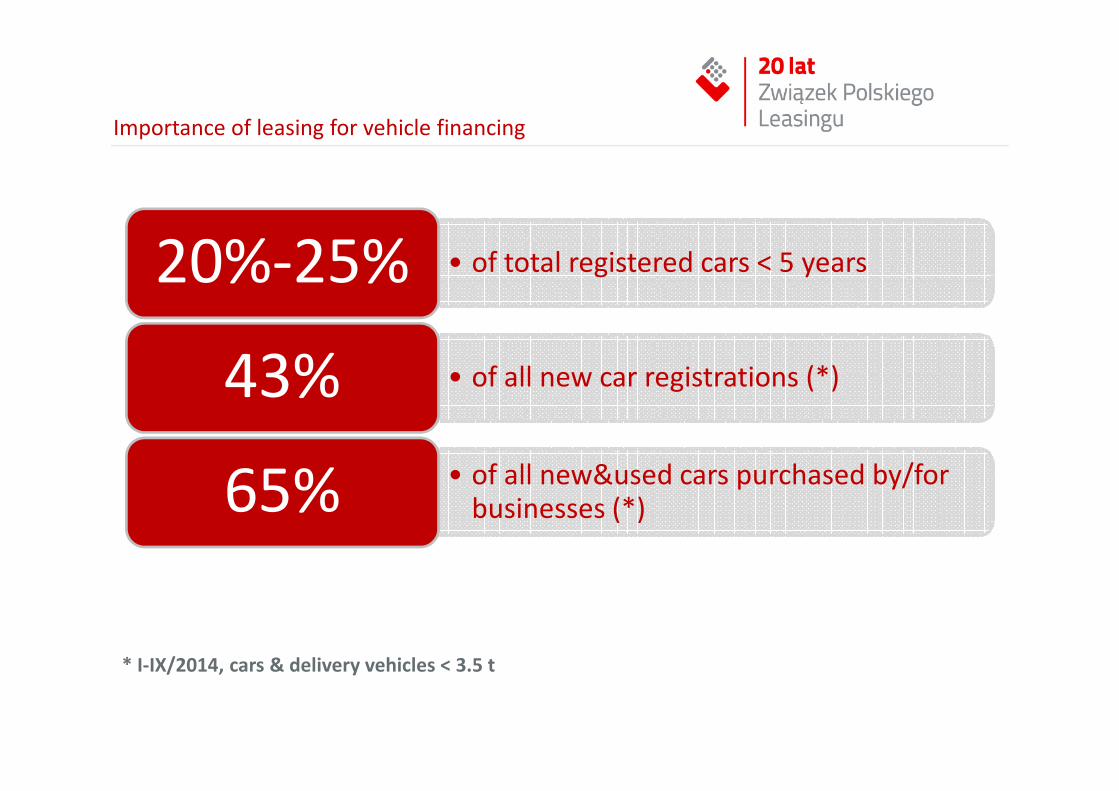
• of total registered cars < 5 years20%-25%
• of all new car registrations (*)43%
Importance of leasing for vehicle financing
43%
• of all new&used cars purchased by/for businesses (*)65%
* I-IX/2014, cars & delivery vehicles < 3.5 t

5.5%
14.0%
14.4%
27.9%
Medical
Construction
Plastics production and metalwork
Agricultural
(by type of machinery and equipment)
Structure of new leasing business for machinery & equipment
I-III Q 2014
26.9%
1.4%
2.9%
3.4%
3.6%
5.5%
Other
Catering
Food industry
Forklift trucks
Printing
Medical

31.2% 28.3%
16.7% 18.6%
15.5% 13.8%
Investment financed in 2010 and 2011, all SMEsCash/Equity Bank Loans
Leasing Other debt
Proportion of investment financed by:
The relevance of leasing financing in the European SME sector
36.7% 39.4%
2010 2011
Source: Oxford Economics/EFG
Facts and figures on SME financing in Europe:
� €224 bn total new business volume in 2011 with €110 bn fueling SMEs,� Representing roughly 19% of total investment finance for SMEs

302,449
381,830 373,616 355,376387,185 379,463
2008 2009 2010 2011 2012 2013
Number of clients
Source: GUS
Number of active leasing customers in Poland
28.4%
51.1%
64.3%
Micro Small Medium
Leasing penetration in SME segment (2009-2013)
Source: Monitoring kondycji sektora MMŚP w 2014 r (CBOS)

| 14
| 15

3.00%
3.50%3.45%
3.25%
3.00%
2014f 2015f 2016f 2017f 2018f
GDP Y/Y
0.20%
1.20%
2.00%
2.50% 2.50%
2014f 2015f 2016f 2017f 2018f
CPI (average)
Macroeconomics forecast – Poland
2.70%
-9.70%-6.30%
-0.10%
6.40% 6.5%
14.9%17.6%
9.6%
-1.2% -0.4%
8.5%
-1.6%-0.2%
7.0%8.7%
7.0% 6.0% 5.0%
2000 2001 2002 2003 2004 2005 2006 2007 2008 2009 2010 2011 2012 2013 2014f 2015f 2016f 2017f 2018f
Investment Y/Y

2012 vs. 2014 Leaseurope Annual Convention concludingremarks
2012 Annual Convention
2014 Annual Convention2014 Annual Convention

Our concluding remarks Key challenges of the industryfor the years to come
• Megatrends (urbanisation, demographics, social & cultural changes, connectivity, integrated mobility & transport solutions)
• Technological changes (big data, 3-D printing, etc.)
• Increasing share of service solutions, service component, specialists
• Collaborative economy and sharing societies, crowdfunding, asset sharing
• Consumer leasing vs social and cultural changes
• Ability to absorb and retain talents
• Constantly increasing regulatory & compliance requirements

D z i ę k u j e m y z a u w a g ę
ul. Rejtana 17 lok 21,
02-516 Warszawa
tel.: +48 22 542 41 36
fax: +48 22 542 41 37
E-mail: [email protected]
www.leasing.org.pl