
Learning to Teach from Anticipating Lessons through Comics ...
317
Learning to Teach from Anticipating Lessons through Comics-Based Approximations of Practice by Chia-Ling Chen A dissertation submitted in partial fulfillment of the requirements for the degree of Doctor of Philosophy (Education) in The University of Michigan 2012 Doctoral Committee: Associate Professor Patricio G. Herbst, Chair Professor Deborah Loewenberg Ball Professor Hyman Bass Associate Professor Elizabeth A. Davis
Transcript of Learning to Teach from Anticipating Lessons through Comics ...

Learning to Teach from Anticipating Lessons through ComicsBased Approximations of Practice
by
ChiaLing Chen
A dissertation submitted in partial fulfillment
of the requirements for the degree of Doctor of Philosophy
(Education) in The University of Michigan
2012
Doctoral Committee:
Associate Professor Patricio G. Herbst, Chair Professor Deborah Loewenberg Ball Professor Hyman Bass Associate Professor Elizabeth A. Davis

© Chia‐Ling Chen
2012

ii
DEDICATION
To my dearest father, Te‐Yu Chen, who devoted his whole heart to raising me
and shaping my life, who dreamt big dreams for me and believed in me.

iii
ACKNOWLEDGEMENTS
I am grateful to have my family, friends, and colleagues with me in this
journey.
I owe a tremendous debt of gratitude to Professor Patricio Herbst who has served
as my advisor through my graduate study. I am inspired by his passion and insights
for innovative research. I sincerely appreciate all the guidance and emotional
support Pat has offered me through these years.
I would like to also thank my other committee members, Professor Deborah
Ball, Professor Hyman Bass and Professor Betsy Davis. I am privileged to have them
challenge me to think deeply and better my work, and encourage me during the
work of this dissertation.
I have been fortunate to work with a group of talented and generous
colleagues in the GRIP (Geometry Reasoning and Instructional Practices). Working with
them has provided me with invaluable support, resources and professional growth. I want
to thank Wendy Aaron, Gloriana González, Hui-Yu Hsu, Manu Mehrotra, Takeshi
Miyakawa, Chieu Vu Minh, Travis Skindzier, Mindy Steffen and Michael Weiss for the
incredible opportunities to cooperate with them on various projects. I am particularly
thankful to Chieu and Mindy, who put great effort into developing the Depict tool.
Without them, the Depict tool would not have been possible, nor would my dissertation. I

iv
also want to thank Wendy, Gloriana and Hui-Yu for their help in the analysis and writing
through the process.
I am grateful to my friends, with whom I have shared laughter and tears during
these years. I appreciate their friendship and companionship through cold winters and
beautiful summers in Ann Arbor. I also thank my friends in Taiwan for always being
available a phone call away, and when I visited back home.
I am in great debt to my parents and my sister, who love and support me
unconditionally. My father, Te‐Yu Chen, and my mother, Shu‐Chen Chen, have
instilled traditional values and encouraged me to do my best in every challenge. My
sister, Chia‐Yi Chen, is my best friend and has taken good care of family matters
while I’ve been away. There is no doubt in my mind that without their support, I
would not have had the strength to complete this process. I am grateful to my aunts
and uncles for their support. I also want to thank my in‐laws and my brother‐in‐law
for their encouragement.
Finally, thanks to my husband, Chih‐Wei Wang, for his love and care for me.
His partnership and friendship have given me extraordinary strength in difficult
moments. His passion for life and profession has inspired me to finish this work.
I also appreciate him bringing joy to my life.

v
TABLE OF CONTENTS
DEDICATION ................................................................................................................................................ii
ACKNOWLEDGEMENTS ........................................................................................................................ iii
LIST OF FIGURES.......................................................................................................................................ix
LIST OF TABLES......................................................................................................................................xiii
LIST OF APPENDICES.............................................................................................................................xv
ABSTRACT................................................................................................................................................. xvi
CHAPTER 1 INTRODUCTION ................................................................................................................1 Rationale for Designing a Lesson‐Sketching Tool ............................................................4 Hypotheses and Research Questions.....................................................................................5 An Activity Theory Framework for the Study Design.....................................................7 Dissertation Overview...............................................................................................................11
CHAPTER 2 REVIEW OF LITERATURE..........................................................................................13 Learning from Interacting with Milieu ...............................................................................13 Using Representations of Teaching to Approximate the Practice..........................15 Graphic representations of teaching.............................................................................19
Lesson Planning ...........................................................................................................................21 Novice teachers’ planning..................................................................................................22 Comparison between novice and expert teachers ..................................................23 Summary of teachers’ lesson planning.........................................................................27
Lesson Planning as a Learning Activity .............................................................................28 Lesson Planning as a Contextualized Experience..........................................................29 Summary .........................................................................................................................................33
CHAPTER 3 METHODOLOGY .............................................................................................................35 Setting and Context.....................................................................................................................36 Data Collection and Sources ...................................................................................................37 Phase One: Lesson planning in text ...............................................................................38 Phase Two: Using Depict or describing lessons........................................................39
Introduction to Depict ...............................................................................................................42 Design rationale .....................................................................................................................43 Overview of Depict ................................................................................................................44

vi
Graphic features in Depict..................................................................................................45 Data Analysis .................................................................................................................................50 A multimodal data corpus..................................................................................................50 Discourse analysis of lesson events: Comparing two groups.............................53 Task analysis: Comparing lesson depiction and lesson plan..............................60 Graphic features and screen action analysis of Depict ..........................................61
Summary .........................................................................................................................................62
CHAPTER 4 ANTICIPATING TEACHER AND STUDENT ROLES IN LESSONS ................64 Characteristics of Lesson Planning in Text ......................................................................66 Tasks and class events.........................................................................................................66 Participants ..............................................................................................................................70 Teacher’s processes..............................................................................................................72 Class processes .......................................................................................................................74 Individual student processes............................................................................................76
Class Events Comparison between Lesson Depictions and Lesson Descriptions.............................................................................................................................................................77 Participants ..............................................................................................................................78 Teacher’s processes..............................................................................................................80 Class processes .......................................................................................................................80 Individual student processes............................................................................................81
Summary .........................................................................................................................................82
CHAPTER 5 TASK ANALYSIS OF LESSON PLAN AND LESSON DEPICTION...................86 Case #1: Ellie and Elliot’s work .............................................................................................87 Anticipating Task #1 ............................................................................................................87 Analytical commentary on Task #1...............................................................................94 Anticipating Task #2 ............................................................................................................95 Analytical commentary on Task #2............................................................................ 101 Anticipating Task #3 ......................................................................................................... 102 Analytical commentary on Ellie and Elliot’s lesson depiction ........................ 120
Case #2: Pamela and Sienna’s work ................................................................................. 126 Anticipating Task #1 ......................................................................................................... 126 Analytical commentary on Task #1............................................................................ 132 Anticipating Task #2 ......................................................................................................... 132 Analytical commentary on Task #2............................................................................ 138 Reviewing lesson slides ................................................................................................... 140 Anticipating Task 3 ............................................................................................................ 141 Analytical commentary on Task #3............................................................................ 144 Anticipating Task #4 ......................................................................................................... 145 Analytical commentary on Task #4............................................................................ 147 Analytical commentary on Pamela and Sienna’s lesson depiction ............... 149
Case #3: Serena and Beth’s work ...................................................................................... 152 Anticipating Task #1 ......................................................................................................... 152 Analytical commentary on Task #1............................................................................ 160 Transitioning from Task #1 and Task #2 ................................................................ 162

vii
Reviewing lesson slides ................................................................................................... 163 Anticipating Task #2 ......................................................................................................... 163 Integrating Task #2 with a follow‐up task .............................................................. 170 Analytical commentary on Task #2............................................................................ 179 Discussing Task#3 ............................................................................................................. 182 Analytical commentary on Beth and Serena’s lesson depiction..................... 183
Case #4: Samantha and Millie’s work.............................................................................. 187 Anticipating Task#1 .......................................................................................................... 187 Analytical commentary on Task #1............................................................................ 194 Anticipating Task #2 ......................................................................................................... 195 Analytical commentary on Task #2............................................................................ 199 Anticipating Task#3 .......................................................................................................... 199 Analytical commentary on Task #3............................................................................ 207 Anticipating Task#4 .......................................................................................................... 209 Analytical commentary on Task #4............................................................................ 212 Reviewing slides ................................................................................................................. 213 Analytical commentary on Samantha and Millie’s lesson depiction ............ 215
Syntheses of Lesson Depiction across Four Cases ..................................................... 218 The changing role of lesson plan in the lesson depiction activity ................. 218 Specifying teacher’s instructional moves................................................................. 221 Refining mathematical tasks.......................................................................................... 229 Individualizing students .................................................................................................. 234 Considering temporal factors in a lesson................................................................. 242
Conclusion ................................................................................................................................... 244
CHAPTER 6 USE OF DEPICT’S FEATURES................................................................................. 246 Use of Graphic Features......................................................................................................... 246 Templates............................................................................................................................... 246 Actions on templates......................................................................................................... 248 Speech bubbles .................................................................................................................... 251 Actions on speech bubbles ............................................................................................. 251 Inscribe .................................................................................................................................... 254 Caption boxes ....................................................................................................................... 256 Actions on caption boxes................................................................................................. 258 Gestures .................................................................................................................................. 259 Facial expressions .............................................................................................................. 261
Visualization of Lesson Slides ............................................................................................. 262 Conclusion ................................................................................................................................... 264
CHAPTER 7 CONCLUSION ................................................................................................................ 266 Revisiting the Research Questions ....................................................................................... 266 Learning from Interaction with a Milieu ........................................................................ 270 Graphic Representations as Semiotic Resources Mediating Learning.............. 272 Approximations of Practice in Depicting Lessons...................................................... 273 Limitations .................................................................................................................................. 275 Limitations of Depict ......................................................................................................... 275

viii
Limitations of the study................................................................................................... 276 Implications for Practice ....................................................................................................... 278 Implications for Research..................................................................................................... 280
APPENDICES .......................................................................................................................................... 282
REFERENCES.......................................................................................................................................... 292

ix
LIST OF FIGURES
Figure 1. The basic activity system framework. ...........................................................................8
Figure 2. Activity system for the Control group.........................................................................10 Figure 3. Activity system for the Depict group...........................................................................10
Figure 4. The learning situation........................................................................................................14
Figure 5. The interface of Depict shown when the study was conducted.......................45 Figure 6. The first task in Ellie and Elliot’s lesson plan. .........................................................87
Figure 7. EE‐S01‐v1: The question posed by the virtual teacher was copied directly from Ellie and Elliot’s text‐based lesson plan. ..................................................................89
Figure 8. EE‐S01‐v2: The virtual teacher sets up the question. ..........................................90
Figure 9. EE‐S02: A male student, sitting in the front row, answers with an expression.........................................................................................................................................91
Figure 10. EE‐S03: Teacher responds to the student’s answer and asks a follow‐up question. ............................................................................................................................................92
Figure 11. EE‐S04: More than one student were involved in response to the question. ............................................................................................................................................94
Figure 12. The second task in Ellie and Elliot’s lesson plan. ................................................95 Figure 13. EE‐S05‐dlt: This slide was deleted after the participants realized that the
table from previous task should be on the board............................................................97 Figure 14. EE‐S05: This slide was duplicated from the first slide to preserve the
board content. .................................................................................................................................98
Figure 15. EE‐S06‐v1: Multiple students participated verbally and nonverbally.... 101 Figure 16. The third task in Ellie and Elliot’s lesson plan................................................... 102
Figure 17. EE‐S07‐v1: The teacher responded to a student’s reply and suggested graphing the points.................................................................................................................... 104
Figure 18. EE‐S08‐v1: The teacher was graphing on the right side, instead of left side.................................................................................................................................................... 105
Figure 19. EE‐S01‐v3: The virtual teacher’s instruction was revised. .......................... 108
Figure 20. EE‐S06‐v2: A caption box indicates the time needed for student thinking............................................................................................................................................................. 109

x
Figure 21. EE‐S07‐v2: The virtual teacher suggests graphing points help better see the relationship between the two variables in the table........................................... 113
Figure 22. EE‐S08‐v2: The virtual teacher addresses the relationship between two representations. .......................................................................................................................... 116
Figure 23. EE‐S09: A student, who has not participated in the lesson yet, answers the question. ......................................................................................................................................... 117
Figure 24. EE‐S10: The teacher is graphing.............................................................................. 118 Figure 25. EE‐S11: Both the graph and the table are on the board. ............................... 119
Figure 26. EE‐S12: The teacher and students continue graphing points..................... 119
Figure 27. The first task in Pamela and Sienna’s lesson plan. .......................................... 126 Figure 28. PS‐S01‐v1: The virtual teacher asks a question without given information.
............................................................................................................................................................ 127 Figure 29. PS‐S01‐v2: The virtual teacher asks the question with given information.
............................................................................................................................................................ 128
Figure 30. PS‐S02‐v1: The student was thinking that the question was too easy. .. 130 Figure 31. PS‐S02‐v2: Multiple students think and act differently at the same
moment........................................................................................................................................... 131
Figure 32. The second task in Pamela and Sienna’s text‐based lesson plan. ............. 133 Figure 33. Sienna suggests the task help students better understand the question.
............................................................................................................................................................ 133 Figure 34. PS‐S03: The virtual teacher asks the student to present his earlier answer
in a table. ........................................................................................................................................ 134
Figure 35. PS‐S04: Bob presents his work on the board..................................................... 136 Figure 36. PS‐S05‐v1: Multiple students are involved in the lesson.............................. 138
Figure 37. PS‐S05‐v2: A caption box in the upper right corner is added to illustrate the sequential relationship of the students’ involvement. ....................................... 141
Figure 38. The third task in Pamela and Sienna’s lesson plan.......................................... 141
Figure 39. PS‐S06‐v1: Susie knows how to graph and she could better see the change of the two variables through graphing.............................................................................. 143
Figure 40. PS‐S07: A caption box describes the student’s actions.................................. 144
Figure 41. The fourth task in Pamela and Sienna’s lesson plan. ...................................... 145 Figure 42. PS‐S08: The virtual teacher reminds students to label the two axes. A
student who had not yet participated answers the question.................................. 147 Figure 43. The first task in Beth and Serena’s lesson plan................................................. 153
Figure 44. SB‐S01: The virtual teacher is drawing two graphs on the board. ........... 154

xi
Figure 45. SB‐S02: The virtual teacher is standing aside to not to block what is presented on the board............................................................................................................ 155
Figure 46. SB‐S03: The student’s response and the virtual teacher’s follow‐up question were modified from those written in the lesson plan. ............................ 156
Figure 47. SB‐S04: This slide was inserted to show the students’ reaction at the moment........................................................................................................................................... 158
Figure 48. SB‐S05: The virtual teacher points to the graph explaining it is a positive slope. ................................................................................................................................................ 159
Figure 49. SB‐S06: The virtual teacher points to the graph with a negative slope.. 159
Figure 50. The second task in Beth and Serena’s lesson plan........................................... 164 Figure 51. SB‐S07: The virtual teacher reminds students of the formula and explains
that students have to find out the slope of the graph. ................................................ 170 Figure 52. SB‐S08: A student named Mike answers the question................................... 174
Figure 53. SB‐S09: The virtual teacher asks a follow‐up question. ................................ 175
Figure 54. SB‐S10: Mike answers the question while other students are bored...... 177 Figure 55. The virtual teacher presented the equation on the board. .......................... 178
Figure 56. SB‐S11: The virtual teacher wrote the calculation of slope on the board to connect what the student just said and to the mathematical concept of slope............................................................................................................................................................. 179
Figure 57. The task Serena and Beth discussed but did not implement in lesson slides. ............................................................................................................................................... 183
Figure 58. The first task in Millie and Samantha’s lesson plan. ....................................... 187
Figure 59. MS‐S01‐v1: The teaching event is described as what had been written in the lesson plan. ............................................................................................................................ 188
Figure 60. MS‐S01‐final: The virtual teacher provides graph paper with axes as a resource for students to plot the points. .......................................................................... 189
Figure 61. MS‐S02: The virtual teacher reminds students of how to plot a point. .. 190
Figure 62. MS‐S03: The virtual teacher draws a coordinate plane with a point as an example to show how to plot points. ................................................................................. 190
Figure 63. MS‐S04: Multiple students are involved in the task........................................ 192
Figure 64. MS‐S05: The virtual teacher asks a follow‐up question. ............................... 193 Figure 65. MS‐S06: Students react differently to the question. ....................................... 193
Figure 66. MS‐S07: The virtual teacher makes a conclusion and introduces the day’s topic.................................................................................................................................................. 194
Figure 67. The second task in Samantha and Millie’s lesson plan. ................................. 196

xii
Figure 68. MS‐S08: The virtual teacher asks students to think about the slope from daily experience. ......................................................................................................................... 197
Figure 69. MS‐S09: One student gave an answer. .................................................................. 197
Figure 70. MS‐S10‐v1: The virtual teacher prompts for the connection between the word “slope” and the graph. .................................................................................................. 198
Figure 71. MS‐S11: A student makes a connection between slope and the steepness............................................................................................................................................................. 198
Figure 72. The third task in Samantha and Millie’ lesson plan......................................... 200
Figure 73. MS‐S12 The virtual teacher suggests using a table to better see the rate of change.............................................................................................................................................. 200
Figure 74. MS‐13: The teacher instructs students to follow the example on the board. ............................................................................................................................................... 201
Figure 75. MS‐S14: A double entry table with a pair of numbers filled in. ................. 202
Figure 76. MS‐S15: The students are working on the task. ............................................... 203
Figure 77. MS‐S16‐v1: The virtual teacher gave an instruction that was later revised............................................................................................................................................................. 204
Figure 78. MS‐S16: The virtual teacher asks students to find out the change of y‐ and x‐values in each column........................................................................................................... 205
Figure 79. MS‐S17: The value changes in each column are shown on the board..... 205
Figure 80. MS‐S18: A student poses his question and the virtual teacher responds............................................................................................................................................................. 206
Figure 81. MS‐S19‐v1: The teacher explains how to calculate the slope with the values previously obtained. ................................................................................................... 207
Figure 82. The fourth task in Samantha and Millie’s lesson plan.................................... 209
Figure 83. MS‐S20: The teacher gives an introduction of “rise over run” with an example of stairs. ........................................................................................................................ 210
Figure 84. MS‐S21: The illustration of changes in y‐ and x‐ coordinates helps students understand the concept of “rise over run.” .................................................. 211
Figure 85. MS‐S22: The teacher reminds students of a common error in calculating slope. ................................................................................................................................................ 211
Figure 86. MS‐S23: The teacher gives students more problems to practice. ............. 212 Figure 87. MS‐S10‐final: The virtual teacher’s instruction was revised when the
participants reviewed the slides.......................................................................................... 214 Figure 88. MS‐S19‐final: The participants revised the slide by adding an example.
(The inserted text showed in underline) ......................................................................... 215
Figure 89. The interaction with milieu in Depict .................................................................... 271

xiii
LIST OF TABLES
Table 3.1 Data Collection Phases and Lesson Planning Activities .....................................41
Table 3.2 Data Sources, Purposes, and Use in Answering Research Questions...........42 Table 3.3 Methodology and Research Questions ......................................................................53
Table 3.4 Types of Participant‐Process Structure Examined in Class Events...............59
Table 4.1 Number of Tasks in Each Lesson Plan Anticipated ..............................................67 Table 4.2 Number of Class Events in which Teacher and Students are Involved in
Lesson Plans ....................................................................................................................................69
Table 4.3 Average Number of Class Events Per Task of Participants involvement in Lesson Plans ....................................................................................................................................71
Table 4.4 Mann‐Whitney Test of Groups Comparing Teacher and Students role involvement in Class Events .....................................................................................................71
Table 4.5 Average Number of Class Events per Task of Teacher Processes in Lesson Plans....................................................................................................................................................72
Table 4.6 Mann‐Whitney Test of Groups Comparing Teacher Processes in Class Events .................................................................................................................................................73
Table 4.7 Average Number of Class Events per Task of Class Processes in Lesson Plans....................................................................................................................................................75
Table 4.8 Mann‐Whitney Test of Groups Comparing Class Processes in Class Events...............................................................................................................................................................76
Table 4.9 Average Number of Class Events per Task of Individual Student Processes in Lesson Plans ...............................................................................................................................77
Table 4.10 Average Number of Class Events Involving Types of Participants .............79
Table 4.11 Average Number of Class Events Involving Teacher Processes ..................80 Table 4.12 Average Number of Class Events Involving Class Processes.........................81
Table 4.13 Average Number of Class Events Involving Individual Student Processes...............................................................................................................................................................82
Table 6.1 Use of Templates and Actions on Templates ....................................................... 248
Table 6.2 Use of Speech Bubbles and Actions on Speech Bubbles.................................. 251
Table 6.3 Actions in Inscribe........................................................................................................... 255

xiv
Table 6.4 Use of Caption Boxes and the Content Revealed in This Feature................ 257
Table 6.5 Actions on Caption Boxes ............................................................................................. 258 Table 6.6 Use of Gestures on Characters.................................................................................... 261
Table 6.7 Use of Facial Expressions on Characters ............................................................... 261 Table 6.8 Phases in Which Changes in Lesson Slides Occur.............................................. 263

xv
LIST OF APPENDICES
Appendix A Students’ Mathematical Conceptions ................................................................. 282
Appendix B Guiding Questions for Annotating Student Work ......................................... 288 Appendix C Lesson Plan Worksheets .......................................................................................... 289

xvi
ABSTRACT
Teaching is complex and relational work that involves teacher’s interactions
with individual or multiple students around the subject matter. It has been argued
that observation experiences (e.g. field placement or watching video clips) are not
sufficient to help prospective teachers to develop knowledge of teaching. This study
aims to identify, examine, and illustrate the ways in which comics‐based
representations of teaching facilitate prospective teachers’ learning to teach.
Specifically, the author explored how the use of a technology supported lesson‐
sketching tool, Depict, enabled prospective secondary mathematics teachers to
attend to mathematical interactions between teacher and students in instruction
when anticipating the development of a lesson.
Drawing resources from Systemic Functional Linguistics, the author examined
the ways in which anticipations of classroom interaction about a planned lesson
differ when the anticipation was done using the Depict tool as compared with
talking through the written lesson plan. Using case study methodology, the study
investigated the aspects of the teaching work prospective teachers attended to
when engaged in depicting a lesson, and observed the ways in which prospective
teachers employed the graphic resources to support their lesson depiction.
The results reveal that prospective teachers using Depict tool to create comics‐
based lesson slideshows immersed themselves in classroom settings and

xvii
demonstrated their capacity to incorporate detailed teacher instructional actions,
student reactions and mathematical tasks in their lessons. The prospective teachers
unpacked their planned discrete class activities and attended to the relational
nature among teacher, students and mathematics in instruction.
The study indicates that the anticipation of a lesson, through creation of
comics‐based lesson depiction, could be a learning opportunity that approximates
the interactive nature of teaching practice. The study suggests that comics‐based
representations of teaching can be seen as semiotic resources that mediate
prospective teachers’ generation of teacher‐student moment‐to‐moment class
interactions, and facilitate their attention to instructional issues they have not
previously been aware of. The study also implies that in order to engage prospective
teachers in learning to do the work of teaching, teacher educators should consider
directing prospective teachers’ attention to issues of temporality, multimodality and
multivocality in instruction.

1
1. CHAPTER 1
INTRODUCTION
There is widespread agreement that teaching is complex work that requires
special kinds of knowledge. Learning the work of teaching and thus being able to
teach competently is challenging. Cohen and colleagues note that teaching does not
merely concern teachers’ actions. Instruction is an interactive process involving
interactions between teacher, students and content (Cohen, et al., 2003; Lampert,
2001, 2010). The National Council of Teachers of Mathematics (NCTM, 2000) clearly
states, “effective teaching requires knowing and understanding mathematics,
students as learners, and pedagogical strategies” (p. 17). As teaching is relational
work that involves teacher’s interactions with individual or multiple students
around the subject matter, it is challenging to divide the work of teaching and
determine what specific aspects of teaching are most important when training
novice teachers.
A common activity in which prospective teachers engage during teacher
preparation is to observe the work of teaching. However, it has been argued that
observation experiences (e.g. in a field placement or watching video clips) are not
sufficient to help prospective teachers to develop their knowledge of teaching (Ball,
1997; Ball & Cohen, 1999; Lampert & Ball, 1998). Hatch & Grossman (2009) also
note that novices’ learning opportunities are limited even when they are in the field

2
observing more experienced teachers. Prospective teachers have difficulties
knowing what aspects to attend to in teaching and how to examine the practice of
teaching from the teacher’s perspective (Lampert & Ball, 1998; van Es & Sherin,
2002).They have limited knowledge of why a teacher would act or interact with
students in certain ways.
Researchers and teacher educators have called for the need to ground teacher
learning in practice (Ball & Cohen, 1999; Lampert, 2010; Lampert & Ball, 1998).
Situated opportunities should be provided for novices, thus allowing them to learn
in and from practice. Grossman and colleagues (2009) report that students of
professions often learn through experiences that approximate the actual practices of
that profession. Lesson planning could be seen as such an approximation of teaching
practice. Developing a lesson plan is to anticipate “how” instructional events might
occur in the classroom.
Learning to plan a lesson is a common activity that prospective teachers
experience during their teacher preparation program as well as a common real‐
world activity that teachers do when preparing for teaching. Earlier studies on
teacher lesson planning have shown that teachers value lesson plans insofar as they
present a structured series of instructional activities to be implemented (Clark &
Yinger, 1980; Hill, et al., 1983; McCutcheon, 1980; Yinger, 1979, 1980). This list
serves as a “memory‐jogger” (McCutcheon, 1980) that reminds teachers what they
will need to do, where the activities will be conducted and how long it will take to
accomplish each activity. While it is essential to include teaching activities in a
lesson plan, it is less common for teachers’ lesson plans to incorporate, and for

3
lesson plan formats to request, students’ actions or reactions to the planned
activities, and the teacher’s further interactions with students if the lesson plan does
not provide guiding scaffolds. Further, lesson planning has been criticized for its
limited opportunity for learning because a lesson plan does not involve practicing
interactive aspects of teaching and getting feedback from it (Grossman & McDonald,
2008).
Lesson planning, however, could be seen as an activity that engages teachers
in attending to the complexity of the teaching work and as a learning opportunity to
approximate teaching practice. Researchers and teacher educators have proposed
different approaches to lesson planning that encourage teachers to “zoom in” on a
particular aspect of teaching practice. For example, Smith and colleagues suggest a
“thinking through a lesson protocol” that invites teachers to focus on assigning
mathematical tasks and on students’ thought processes (Smith, et al., 2008). The
protocol contains scaffolding questions that guide teachers to identify mathematical
goals, to hypothesize students’ thinking and to anticipate how to lead class
discussions. A “lesson play” involves teachers in designing classroom dialogues to
practice the communication of the content (Zazkis, et al., 2009). This activity
attempts to provide teachers opportunities to practice the verbal interactions with
students regarding students’ emerging conceptions.
Further, the activity of lesson planning has been suggested as a contextualized
process for teachers to experience the practice of teaching (Rosebery, 2005). The
lesson planning process allows teachers in the “imagined classroom” (p. 318) to
examine their understanding of the subject matter and to specify the learning goals

4
for students. Additionally, the planning process enables teachers to anticipate how
the events of a lesson may unfold and to expect what students’ responses would be
to certain activities and questions. In addition, the lesson planning process engages
teachers in projecting possible outcomes of the lesson. Therefore, lesson planning
can be seen as a way to approximate teaching practice that teachers can learn from
and develop their knowledge for teaching.
Rationale for Designing a LessonSketching Tool One way of engaging prospective teachers in the “imagined classroom”
anticipating a lesson is to help them visualize the teaching events of the lesson. The
activity of visualizing teaching events is especially important for novices because
they have limited experiences teaching and interacting with students around the
content in class. Media artifacts, such as comic books and slideshows, have been
developed to represent the work of teaching practice. It has been suggested that
these media artifacts allow teachers to project their perceptions of teaching on the
representations, and therefore call forth teachers’ knowledge for teaching (Herbst &
Chazan, 2003, 2006). However, novices are generally considered the audience and
consumers of these media representations of teaching (Crespo, et al., 2011). They
are rarely given opportunities to produce media‐based artifacts to represent their
actual or imagined teaching and to learn from such experience.
The purpose of this study is to identify, examine, and illustrate the ways in
which the making of comics‐based representations of teaching engage prospective
teachers in attending to instruction when lesson planning. Specifically, I explore the
use of a technology‐supported lesson‐sketching tool, Depict (Herbst & Chieu, 2011),

5
that aims to engage prospective secondary mathematics teachers in attending to the
mathematical interactions between teacher and students in instruction. This tool
was developed by the ThEMaT (Thought Experiments in Mathematics Teaching)
project at the GRIP1 (Geometry Reasoning and Instructional Practices) research
group.
Depict is a software tool that allows users to anticipate and present a lesson
via a slide show (Herbst & Chieu, 2011). Building upon the notion that learning
occurs when learners interact with a “milieu” and get feedback from it (Brousseau,
1997), Depict engages users in anticipating lesson events using cartoon‐based
characters and classroom settings to represent a lesson. Users are expected to
employ various graphic features, such as speech bubbles, facial expressions, and a
board content creation tool, to generate moment‐to‐moment teacher‐students
verbal and nonverbal communication in class events. This tool also allows users to
review how a lesson would unfold and modify the lesson. Through creating, viewing,
reviewing and revising the comics‐based representation of a lesson, prospective
teachers have the opportunity to approximate the teaching practice involving the
relational work among teacher, students and content in instruction.
Hypotheses and Research Questions I hypothesize that the Depict tool is a “milieu” (Brousseau, 1997) that
prospective teachers interact with (and against). The agent (prospective teacher)
1 GRIP (Geometry Reasoning and Instructional Practices) is a research group directed by Patricio G. Herbst. Support for the research reported in this article has been provided in part by the National Science Foundation, through grant ESI‐0353285; all opinions expressed are the sole responsibility of the authors and do not represent the views of the Foundation.

6
acts on this milieu through composing a comics‐based lesson slide show and
virtually enacting the lesson, and he or she gets feedback from the visualization of
the composed lesson. This feedback enables prospective teachers to attend to issues
in instruction that they may not have been aware of, such as the mathematical
appropriateness of the tasks, possible verbal and non‐verbal student reactions, and
teacher’s instructional explanations. Lesson planning in Depict, an activity I
hereafter refer as “depicting a lesson”, could be considered an approximation of
practice, thus supporting prospective teachers learning to teach.
My overarching question asks: How do richmedia resources facilitate
prospective teachers’ attention to interactions with students? The research questions
that guide the study are the following:
1. How do anticipations of classroom interaction about a planned lesson
differ when done using a multimedia lesson‐depicting environment as
compared with talking through the written lesson plan?
2. What do prospective teachers attend to in the work of teaching when
engaged in depicting a lesson?
a. What do prospective teachers anticipate regarding teacher
involvement in a lesson?
b. What do prospective teachers anticipate regarding students
involvement in a lesson?
c. What do prospective teachers anticipate regarding mathematical
work involved in a lesson?

7
3. How do prospective teachers employ the graphic resources to support
their lesson depiction?
In the following section, I use a framework to explain and illustrate the design
of the study, and briefly introduce the analytical approaches that attempt to resolve
the research questions.
An Activity Theory Framework for the Study Design The study aims to identify and examine the ways in which the lesson‐sketching
tool Depict engages secondary mathematics prospective teachers in attending to
mathematical interactions between teacher and students in instruction. That is, the
prospective teachers use Depict to anticipate a lesson involving the teacher and
student roles and their interactions around the content. The model of activity in
activity theory (Engeström, 1999) could help in explaining the activity and
experiences in which the prospective teachers in this study are engaged.
Figure 1 represents the basic model of an activity system (Engeström, 1999).
In this model, the subject is the individual or groups of actors that engage in the
activity. An object is the physical or mental product the subject produces. The
outcome is the learning that transpires through the activity. The tools, including
instruments or signs, mediate the actions to produce the object.

8
Figure 1. The basic activity system framework.
The study focuses on exploring the affordances of Depict and ways in which
Depict supports prospective teachers to develop deliberate attention toward
instruction. The subjects are the participants who are prospective teachers of
secondary mathematics. The object is the participants’ anticipation of lessons
involving teacher and student roles interacting around the content. The tool, Depict,
is designed and expected to mediate and develop the participant’s lesson
anticipation. The outcomes are the teacher education knowledge, skills, and
dispositions used in the making of lesson slideshows through Depict or embedded in
the final depictions.
To investigate whether and in what ways the prospective teachers are
engaged in using Depict to attend to instructional details, the study is designed as
follows: I examine and compare the prospective secondary mathematics teachers’
lesson plans in written, verbal and visual modes. All participants were grouped in
pairs to plan a 15‐minute lesson explaining the concept of slope in a text‐based
format (the written mode of a lesson plan). They were guided with questions that
encouraged them to pay attention to the mathematics work at play and the teacher’s

9
and students’ actions. Then these pairs of participants were randomly assigned into
two groups: the Depict group and Control (Description) group. The Depict group
participants used the tool to virtually implement their lessons and create a comics‐
based slide show to represent the lessons (visual mode of lesson). The Lesson
Description group participants were asked to elaborate their lessons aloud, with no
guiding prompts (verbal mode of lesson). By comparing the degrees of detail of
planned class events among the different modes, the results of the study attest to
the affordances of the Depict tool and the impact of visual representations of
teaching on prospective teachers’ learning to attend to instructional issues.
The mediation tools in the activity system are different in the Control group
and the Depict group. In the Control group, the subjects (participants) verbally
described how their lessons would unfold based on their lesson plans. The
mediation tools involved the lesson plan and a general prompting question: ”Could
you describe how this lesson would unfold?” The object is the participants’
description of a lesson. The outcome is the properties of participants’ verbal
description of lessons. In the Depict group, the participants were using Depict to
create lesson slideshows to represent their lessons. The mediation tools included
the lesson plans and the graphic features available in the Depict environment. The
object is the depiction of a lesson. The outcome is the properties of the products
generated from participants’ depicting of lessons. Figure 2 and Figure 3 illustrate
the activity systems involved in the Control and Depict groups.

10
Figure 2. Activity system for the Control group.
Figure 3. Activity system for the Depict group.
The study is designed to address three questions around the activity systems
in the two groups. The first goal is to compare objects – the similarities and
differences of lesson anticipations done through two different sets of mediation
tools. The second goal is to describe the outcome of the work done by the Depict
Group – explore the characteristics of lesson anticipation done with Depict. The
third goal is to investigate the mediating tool – the prospective teachers’ use of
Depict to produce lesson anticipation.
To answer Research Question One, I compare the differences of class events as
anticipated by the two groups: the Depict and Description groups. I draw resources

11
from Systemic Functional Linguistics (Halliday & Matthiessen, 2004) to examine
whether and in what ways lesson depiction in a visual mode supports prospective
teachers to anticipate lesson events that a verbal mode does not.
In Research Question Two, I seek to examine how lesson depiction develops
the mathematics tasks planned in the text format. I conduct a task analysis (Doyle,
1983; Herbst, 2003) to examine the goals, resources and operations involved in
tasks to investigate the degrees of detail with which the participants anticipate their
lessons. I also identify the instructional issues that the prospective teachers attend
to during lesson depiction.
For the final Research Question, I explore how prospective teachers utilized
the graphic features in Depict to attend to instructional details. I evaluate the use of
graphic features and users’ behavior (Bailey & Konstan, 2003).
I employ different methodologies to probe the affordances of a technology‐
supported lesson‐sketching tool. The analyses show how this comics‐based
representation of teaching enables prospective teachers to develop attention to the
work of instruction and supports their learning to teach.
Dissertation Overview The dissertation is presented as follows. Chapter Two presents a framework
for the study of teacher learning. I discuss related literature on representations of
teaching and lesson planning in teacher learning. I also describe a framework for
thinking about mathematics instruction. In Chapter Three, I present the design
rationale of the Depict tool, and introduce its graphic features. I also discuss the
study design and methodologies used in this research. Chapter Four to Six present

12
the results of three pieces of analysis: First, I show the differences of details of
planned class events between the Depict and Description groups. Second, I describe
how prospective teachers who use Depict attend to the complex instructional issues
relative to their lesson plans. Third, I present the result of the use of graphic
features and user’s behavior in Depict. In Chapter Seven, I summarize the results
and discuss the implications of the study.

13
2. CHAPTER 2
REVIEW OF LITERATURE
In this chapter, I first discuss a learning mechanism that forms the base of the
design of the learning tool provided in this study. Then, I review the use of
representations of teaching in approximating practice. I discuss the notion of lesson
planning, identify problems in novice teachers’ lesson planning and compare with
expert teachers’ lesson planning. I then review the learning opportunities afforded
through lesson planning, and discuss a situated perspective of planning lessons.
Learning from Interacting with Milieu
Learning occurs when the learner acts on a ”milieu” and gets feedback from
such action. This sequence of actions and feedback from interacting with the milieu
forms a “situation” (Brousseau, 1997). When the learner acts on the milieu, the
milieu is altered, and provides feedback for the learner. The learner must analyze
the situation by gathering information, making judgments, and initiating another
move.

14
Figure 4. The learning situation.
The notion of learning through interacting with a “milieu” provides a
foundation for the design of a lesson‐sketching tool proposed in this study. The tool,
Depict, provides a working space for users to create lesson slides using comics‐
based features to represent classroom interactions. Users (prospective teachers)
first create a piece of class events on the slides. From visualizing partially or wholly
completed lesson slides, users get feedback on how the class events might play out.
Consequently, users can judge whether to revise the events or proceed to designing
the next event. If revisions are deemed necessary, users modify the current
representation of the lesson slides. If users decide to proceed to creating new
events, they add new elements to the slides.
The tool is intended to form a “milieu” that engages prospective teachers in
anticipating class events. It is expected that, through the visual display of
representation of the lesson and the text involved in the teaching events,
prospective teachers will receive feedback on how their lesson would unfold, and
are then better able to address the issues and the aspects of teaching that might not
have occurred to them, had they planned their lessons through text alone. The

15
interaction with graphic elements in Depict is expected to facilitate prospective
teachers’ learning about teaching with insights on teacher and student interactions
around the content.
However, a feedback loop on its own does not necessarily promote learners’
awareness of what needs to be learned, due to the influence of the learners’
personal prior experience. In the context of learning to teach, feedback may come
from the learner’s own experience as a student. Learners’ knowledge of how
classroom interaction proceeds also serves as feedback. The effect of “the
apprenticeship of observation” (Lortie, 1975) may guide the prospective teachers to
represent lessons that they had previously experienced. Hence, the milieu involved
in the Depict tool can provide prospective teachers opportunities for learning
teaching. However, it may also require resources outside the milieu to provide
prospective teachers immediate feedback on their anticipation of lessons.
Using Representations of Teaching to Approximate the
Practice
Various formats of representation of teaching have been adopted in teacher
professional development, such as narrative cases and video records of classroom
interactions. It has been suggested that these representations of teaching are useful
resources to call forth and develop teacher knowledge. With the support of
technologies, learners of teaching are provided with tools to interact with
representations of teaching, such as conducting analysis, making annotations
(Beardsley, et al., 2007; Bryan & Recesso, 2006; van Es & Sherin, 2002) or creating

16
digital notebooks and journals (Davis, et al., 2004; Fishman, 2007; Lampert & Ball,
1998). In the following section, I review technology‐supported tools that
incorporate representations of teaching and provide a work platform for novice
teachers to engage in working with these representations and learning the practice.
Lampert and Ball (1998) call “records of practice” a collection of artifacts
about teaching which are developed from one’s own teaching, such as teacher
journals, teacher and student notebooks, videos, and transcripts. They are resources
that are used for studying the authors’ own teaching and are open to prospective
teachers who wish to study the work of teaching. The learners of teaching are able
to create their own “notebooks” to investigate particular issues in teaching by
selecting and composing pieces of artifacts from the database. Furthermore, such
notebooks serve as common texts that allow other learners of teaching to annotate
and comment on the same material.
There have been extensive efforts in developing software tools to support
archiving, editing, and annotating video records of teaching, such as Visibility
(Santagata, et al., 2007), VAST (Video Analysis Support Tool; van Es & Sherin, 2002) ,
VideoPaper Builder (Beardsley, et al., 2007), and VAT (Video Analysis Tool; Bryan &
Recesso, 2006) . These tools commonly provide scaffolds which guide users to
reflect on their own teaching or analyze others’ teaching (Rich & Hannafin, 2009),
for the purpose of “seeing” and learning the complexity of teaching practice
(Grossman, et al., 2009). For example, Sherin, van Es and colleagues developed a
video annotation tool, Video Analysis Support Tool (VAST), that allows teachers to
analyze their own or others’ teaching through guiding scaffolds (Sherin & van Es,

17
2005; van Es & Sherin, 2002). The tool aims to develop teachers’ capability to notice
classroom interactions. The tool guides the users to attend to three particular
aspects of instruction: (1) student thinking, (2) teacher’s role, and (3) discourse. In
their study on effectiveness of using VAST to learn to notice (van Es & Sherin, 2002),
they found that novices who had access to the tool were able to analyze the class
interactions more deliberately than those who did not use the tool. The novices who
used the tool were better able to identify noteworthy moments from the videos,
provide evidence to support their earlier identification of teaching or learning
principles, and interpret student thinking and teacher moves. The authors note that
these interpretation skills will inform teachers’ decision‐making in instruction.
Unlike the tools that engage users in centering learning experience on video
records of teaching, KNOW (Knowledge Networks On the Web) is a curriculum‐
centered tool with support from various forms of representations of practice
(Fishman, 2003, 2007). The tool contains resources, such as student work and
videos, to support teachers’ learning about the curriculum and demonstrate the
enactment of that curriculum. The tool also has an online forum that allows users to
discuss questions and issues around the curriculum. Moreover, the tool permits
users to create personal teaching logs to record their own actual practice of the
curriculum. These teaching logs also serve as references for their own or peers’
future practice. KNOW integrates classroom‐contextualized representations of
teaching with the intended curriculum and therefore prepares teachers to improve
their practice.

18
Similar to KNOW, CASES (Curriculum Access System for Elementary Science)
was developed to provide “educative curriculum materials” for novice teachers to
learn to teach inquiry‐oriented science (Davis & Krajcik, 2005; Davis, et al., 2004).
The representations of teaching available in the tool are created with emphasis on
their educative values. Unit plans play a major part in the tool, containing students’
ideas, content information, and instructional foci. It also contains text‐based real or
hypothetical teaching scenarios that illustrate particular instructional techniques
and situations. The tool also provides guiding prompts for reflection and encourages
users to keep personal online journals. Additionally, users are invited to go to an
online discussion forum to share ideas and get support for teaching. Overall, the
representations of teaching provided in the tool serve as reference resources for
planning lessons and learning pedagogical strategies. Unlike other tools reviewed,
the majority of the representations of teaching in CASES are not collected or
generated directly from actual teaching. Rather, they are developed with the
intention to demonstrate model instructional ideas. With these representations of
practice as educative resources, novices are expected to enrich their knowledge
base for teaching, and enculturate themselves in the community of teaching
practice.
The technology‐supported tools reviewed above share several similar
features: (1) These tools contain representations of teaching that portray aspects of
practice. The records of practice, in multimedia or in texts, are from three major
sources: first, raw materials collected from the act of teaching; second, the contents
processed from the raw materials, such as transcripts; third, new materials (e.g.

19
curricula, unit plans) developed for instructional purposes. (2) These tools provide
workspaces that allow learners of teaching to make text‐based annotations or
journal entries. (3) Learners of teaching are the audience or users of the
representations of teaching (Crespo, et al., 2011). Although in some cases, learners
have to create their own records of teaching before working with these resources,
they are seen as users of these representations when working in the tool. (4) These
tools provide contexts in which learners can practice skills (e.g. learning to notice,
learning particular instructional techniques) related to teaching in a safe
environment, a way to approximate practice, before doing the actual professional
work.
Graphic representations of teaching Graphic representations, such as animations, comic books and slideshows,
have been used to extend the use of text‐based stories and narrative cases. For
example, animated narrative vignettes (ANVs) (Tettegah, 2005) are two‐
dimensional representations that illustrate particular situations or stories. Learners
in school settings (e.g. elementary students) and learners in teacher education
settings (e.g. prospective teachers), have constructed animated narrative vignettes
to share their own real‐life stories and elicit discussions around specific issues
(Bailey, et al., 2006; Tettegah, et al., 2007).
Building upon the notion that stories and narrative cases are resources for
studying teaching (Carter, 1993; Clandinin & Connelly, 1996; Richardson & Kile,
1999), Herbst, Chazan and colleagues have used forms of comics‐based sequential
art (McCloud, 1994) to represent hypothetical mathematics teaching scenarios

20
(Herbst & Chazan, 2006). They propose that comics could be seen as a semiotic
resource for creating representations of teaching adopted in teacher education
(Herbst & Chieu, 2011).
In the present study, a technology‐supported tool is used to allow novice
teachers to sketch their lessons using graphic resources to create comics‐based
slideshows. Unlike other technology‐support tools containing collections of records
of practice, the tool in this study, called Depict, offers comics‐based graphic elements
that can illustrate virtual classroom interactions. The major element of the Depict
tool is a canvas that invites users to manipulate the given graphic resources and
create lesson slides that represent how their lesson would unfold. Instead of being
audiences or users of representations of teaching, novices generate the multimedia
artifacts in Depict themselves. It is expected that novices will practice their
instructional interactions with students and develop deliberate attention to
instructional issues prior to their actual teaching practice.

21
Lesson Planning Lesson planning is generally defined as what a teacher does that helps to
prepare for future action (Hill, et al., 1983; Yinger, 1980). Many previous studies on
teacher lesson planning have centered on conceptualizing teachers’ decision‐making
behavior and thinking processes during lesson planning. These researchers have
found that when planning a lesson, the content and materials are the main focus that
guide teachers in designing the activities of a lesson (Hill, et al., 1983; Peterson, et
al., 1978; Yinger, 1986); in other words, teachers spend the majority of their time
arranging instructional activities, and these activities, or the topics to be covered,
are the major components in structured written plans (Yinger, 1986).
A lesson plan organizes the instructional activities and serves as a framework
that guides teachers how to proceed during the instruction. It generally consists of a
list of activities, which is seen as a “memory‐jogger” (McCutcheon, 1980) that
reminds teachers what they will need to do, where the activities will be conducted
and how long it will take to accomplish each activity. A lesson plan is also seen as a
“script” (Shavelson, 1983) which helps teachers to incorporate the interactive
elements of teaching. However, teachers’ lesson planning is not necessarily reflected
in their written plan (Morine‐Dershiner, 1978‐79). That is, teachers may conduct
“mental‐planning” (McCutcheon, 1980) involving mental “lesson images” that are
not reflected in the written lesson plans, but which nevertheless influence the actual
implementation of lessons (Morine‐Dershiner, 1978‐79; Schoenfeld, et al., 2000).
Teachers may also have an “agenda” in mind, consisting of goals or actions that they
intend to implement later in class (Leinhardt, 1993).

22
Novice teachers’ planning Research which conceptualizes teachers’ planning processes has found that
when planning, teachers may consider students’ learning abilities or interests to a
certain extent, but their incorporation of students’ thinking and learning into
planned class activities is limited. Although teachers place significant emphasis on
the content or activities, they do not seem to focus equally on student thinking and
potential interaction with students when planning (Peterson, et al., 1978; Roskos &
Neuman, 1995). This is especially apparent when teachers are not familiar with
their students or have limited knowledge about student learning. For example, in a
study about beginning teachers’ planning for literacy instruction, Roskos and
Neuman (1995) found that the teachers, who were in their first year of kindergarten
teaching, spent a significant amount of time in planning activities and preparing
classroom settings to carry out the activities. However, their planned activities were
not well connected and were neither practical nor appropriate for children. Further,
although these teachers tended to imagine how the planned activities would play
out in class, these activities were fragmented, rather than integrated. These teachers
ended up “just doing activities” (p. 208) without giving substantial thought to how
teacher and students would interact around the subject in each activity.
Borko, Livingston, McCaleb, and Mauro (1988) conducted interviews with
twelve student teachers, in both elementary and secondary levels with different
content areas, about their lesson planning process. Interview questions included
how they planned, what they thought about and what influenced the planning. The
results showed that all student teachers mentioned planning the overall content and

23
teacher/student activities. Over half of the study participants attended to the goals
of lessons, the organization of instructions and curriculum materials. Only one
student teacher provided alternative plans for unexpected class events. These
student teachers did not attend to students’ attributes – such as affect, participation,
learning, or behavior – until they taught the lessons.
Comparison between novice and expert teachers Leinhardt (1993) identified that the agenda is one aspect of teaching that
illustrates the differences between expert and novice teachers. Leinhardt defines an
agenda as “an operational plan that is concise, focused, and descriptive; the general
set of goals and actions in which the teacher intends to engage for the next 40 to 50
minutes” (p. 19). An agenda is also considered to be “the teacher’s local mental
notepad of the more formal plan” (p. 20).
In that study, teachers were asked to describe their lesson before
implementing it: “What are you planning to do today?” Leinhardt found that the
novice teacher provided an agenda that could not help her manage the complex
instructional situation. She mentioned the artifacts and materials (e.g. paper clips,
books, erasers) to be used in the lesson, but did not specify the instructional goals of
the lesson. This lack of specific goals would hinder the teacher from adjusting her
actions during instruction. Additionally, the agenda included impractical activities
that were too long to accomplish in a single lesson, a trait shared with the novice
teacher in Roskos and Neuman’s study (1995). Furthermore, the teacher did not
include the content or topic of the lesson in her agenda.

24
Unlike the novice teacher’s lack of attention to the content and students’
involvement in the planned activities, the experienced teachers in Leinhardt’s study
specified the teacher’s and students’ actions. For example, one teacher noted how
she would make a connection between two representations of the same concept.
Similarly, another teacher’s agenda included the goal of the lesson and its
relationship with the prior lesson. Experienced teachers also predicted students’
possible behavior (Leinhardt, 1993).
In their comparison of expert and novice teachers’ lesson planning, Borko and
Livingston (1989) identified differences and similarities in novice and expert
teachers’ lesson agendas. In their mental planning, expert teachers attended to
details in their instruction. For example, they considered carefully how to introduce
a topic or how to best explain a concept so that their students would understand.
They also selected a collection of examples or problems for possible use. They
determined which specific examples or problems to use depending on their
interaction with students during instruction. An expert teacher reported his
thinking every morning when planning: He asked himself: ”How much time I’m
going to spend on this? …How exactly am I going to introduce the line and bar
graph? What am I going to have the kids do?” (p. 480) His self‐report reveals that in
his daily planning, he attended to his instructional moves, such as explaining
concepts and designing activities to engage students in learning, and he attended to
the time it might take to accomplish a particular activity. In addition, expert teachers
in different grade levels focused on different issues in instruction: secondary

25
teachers tended to focus on explanations and presentation of content, while
elementary teachers tended to attend to types of instructional activities.
Novice teachers in Borko and Livingston’s study were purposefully selected
based on their strong mathematics content and pedagogical knowledge. In addition,
the data was collected toward the end of their student teaching placement. The
above factors may explain why these novice teachers shared certain similar traits
with expert teachers when planning. For example, their lesson agendas involved
flexibility in timing, pacing, and selection of examples and mathematics problems.
Nevertheless, unlike expert teachers, these novices were only able to conduct short‐
term planning because they considered their content knowledge to be too limited to
plan extensively for a longer term. In addition, they experienced difficulty in
knowing how to present the content appropriately to students. Further, they noted
their inability to identify students’ learning difficulties.
Similarly, Livingston and Borko (1990) focusing on review lessons in
secondary mathematics classes, found that expert teachers had detailed mental
plans that allowed them to conduct their lessons flexibly. They aimed to address
students’ questions attentively and to give a comprehensive review that highlighted
the interrelationship among all major concepts. Additionally, they intended to
address students’ common misconceptions and errors.
Both novice teachers provided review problems for students to work on and
planned to respond students’ questions. They also worked on the problems in
advance, to prepare for accurate explanations and presentations. However, when
actually teaching, their explanations merely guided students in procedural problem

26
solving. They did not address nor integrate mathematical relationships among the
concepts or topics. Additionally, in their teaching, they failed to provide
comprehensible explanations or examples when responding to unexpected
questions from students.
Schoenfeld and colleagues developed a series of studies regarding experienced
and novice teachers’ lesson planning and teaching (Schoenfeld, et al., 2000;
Zimmerlin & Nelson, 2000). Their research is centered around the concept of a
“lesson image” – a term borrowed from Morine‐Dershiner’s (1978‐79) work on
teacher planning – which they explain as “the teacher's full envisioning, before
instruction, of how the lesson will play out in practice” (p. 250).
In their study about a student teacher teaching an Algebra 1 class, Zimmerlin
& Nelson (2000) found that although the student teacher had a complex “lesson
image” involving a series of activities with associated goals and students’ probable
responses, the actual classroom interaction did not occur as planned due to a
student’s unexpected answer, leaving the students confused at the end of class.
A similar study was conducted to investigate an experienced physics teacher’s
planning and teaching (Schoenfeld, et al., 2000). The teacher designed the lesson
and had great familiarity with the materials. When verbally describing his vision of
the lesson (the lesson image), he stated the goals of the lesson. Additionally, he
anticipated how the students would respond to each of the planned activities, the
questions students would raise, and how he would react to students. As a result, the
teacher’s lesson image was realized accordingly in his lesson. The researchers

27
concluded that the teacher’s knowledge in content and pedagogy enabled him to
smoothly implement the lesson.
Summary of teachers’ lesson planning Overall, the research reviewed above reveals that teachers – novices or
experts –attend to teacher actions in their planning, including ways to introduce,
explain or present concepts. They also prepare different problems or examples for
possible use (Borko & Livingston, 1989; Livingston & Borko, 1990).
However, novice teachers tend to ambitiously plan activities that are
impractical to accomplish due to their failure to consider students’ thinking
(Leinhardt, 1993; Roskos & Neuman, 1995). In addition, novices do not attend to
certain issues in instruction that experts take into account. For example, with regard
to teacher’s instructional actions, expert teachers tend to make connections and
address the relationships among topics (Leinhardt, 2001; Livingston & Borko, 1990)
or make a connection between two representations of the same concept (Leinhardt,
2001). Expert teachers also address possible misconceptions or errors (Livingston
& Borko, 1990). Regarding student participation, expert teachers attend to student
behavior (Leinhardt, 1993), students’ answers (Schoenfeld, et al., 2000) or possible
questions (Livingston & Borko, 1990; Schoenfeld, et al., 2000). Further, expert
teachers anticipate how they might respond to students’ questions (Schoenfeld, et
al., 2000). Expert teachers are also careful to allot an appropriate amount of time for
instructional activities (Borko & Livingston, 1989).

28
Lesson Planning as a Learning Activity To engage teachers in attending to the complexity of teaching – especially
novices who have limited knowledge of content, pedagogy, students and classroom
experiences – researchers and teacher educators have proposed different means
and strategies to help teachers in lesson planning. There seems to be agreement that
a typical linear or step‐by step lesson plan template has limited ability to enable
teachers to envision and learn the practice of teaching (John, 2006; Kagan & Tippins,
1992; May, 1986; Zazkis, et al., 2009). Different alternatives proposed for lesson
planning tend to guide teachers to “zoom in” on a particular aspect of teaching
practice.
Smith and colleagues propose a schema entitled Thinking Through a Lesson
Protocol (TTLP), aiming to help teachers focus on students’ mathematical thinking
and implementing mathematical tasks (Hughes, 2006; Smith, et al., 2008). The
protocol contains three steps with a series of scaffolding questions that guide
teachers to think through a lesson. The first part asks teachers to identify specific
goals for the mathematical task. The second part prompts teachers to hypothesize
students’ thinking and what questions they might ask to advance students’
understanding while students work individually or in small groups. The last part
leads teachers to think how to orchestrate a class discussion if students have come
up with different solutions for the assigned task. This protocol shifts teachers’
attention from the teacher’s actions to the students’ thinking while lesson planning.
Zazkis and colleagues (2009) propose an alternative model of lesson
preparation—a “lesson play.” A “lesson play” involves teachers in designing

29
classroom dialogue to attend to the communication of the content. This model
provides a context for teachers to practice “the interaction with students in general
and with students’ emerging conceptions in particular” (p.43). By creating
classroom teacher‐student verbal exchanges, it is claimed that one would attend to
the proper use of mathematical language, the explanations of concepts, and
students’ possible reasoning and thinking. One also has to deal with the
development of students’ thinking and the unexpected consequences that the
teacher might face.
Similar to the Thinking Through a Lesson Protocol, a lesson play draws
teachers’ attention to anticipating different students’ thinking and how the teacher’s
responses can advance students’ reasoning. Unlike other lesson planning formats
involving a descriptions of activities, a lesson play focuses on the teacher‐student
encounter moments that might happen in the classroom. In addition, a unique
feature afforded in a lesson play is that it requires teachers to anticipate individual
students’ responses, including naming students and determining which particular
student might participate in the discussion. While the lesson play presented by
Zazkis et al. demonstrates various potential benefits, it is not specified whether and
how novices are able to engage in this kind of activity to obtain the benefits
discussed above.
Lesson Planning as a Contextualized Experience Planning allows a person to “visualize the future” and think “in the future
tense” (Clark & Yinger, 1987). Lesson planning should involve teachers visualizing
what might happen in the lesson. Drawing upon the notion of imagining (Casey,

30
2000), Rosebery (2005) proposes that teachers be situated in an “imagined
classroom” when lesson planning. In the “imagined classroom”, teachers anticipate
the activities that they will implement, in addition to the possible interactions
between the teacher and students.
The phenomenologist Edward Casey explains ways of imagining when making
sense of one’s experience (Casey, 2000). He identifies three different ways of
imagining—imaging, imagining‐that, and imagining‐how. First, imaging refers to
“an imaginative presentation whose content possesses a specifically sensuous—an
‘intuitive’ or ‘imagistic’—form” (p. 41). To image in the context of lesson planning,
one would identify what the end product would be, such as the contents to be taught
and the goals of a lesson.
Second, “imagining‐that” indicates making relationships among the images.
For example, one imagines the “state of affairs” that may include “temporal
precedence, spatial contiguity, causal connection, and modification or qualification
of various kinds” (p. 42). “Imagining–that” in lesson planning may mean that
teachers design the sequence of instructional activities. Within each activity, they
decide the location in which to implement the activities, time spent on each teaching
event, and the arrangement of student group work or individual work.
Third, “imagining‐how” is to anticipate “how to do, think, or feel certain things,
as well as how to move, behave, or speak in certain ways” (p. 44). To “imagine‐how”
requires one to be an imaginer as an agent involved in the situations in order to
anticipate how an event would occur or how a task would be accomplished. In
lesson planning, “imagining‐how” indicates anticipating how a teacher interacts

31
with students mathematically, including the teacher’s actions (e.g. how to explain a
concept, how to represent the subject, how to pose questions, how to respond to
students), and students’ actions (e.g. what their thought processes might be, what
their responses might be). As the aforementioned studies on lesson planning show,
teachers do not always “imagine how” when they plan lessons. The anticipation of
classroom interactions is often missing in the process of lesson planning.
Building on Casey’s notion of imagination, Rosebery (2005) argues that lesson
planning is a contextualized process that teachers undertake to experience the
practice of teaching:
….lesson planning can be a situated, imaginative and lived experience, one in which a teacher calls on her theory of learning and teaching, her knowledge of her students, her knowledge of the subject matter, and her instructional objectives to create a scenario that she can use in situ to respond creatively to her students’ spontaneous talk and activity while at the same time keeping her instructional objectives in focus (p. 301).
Rosebery also draws upon the idea of the “lived‐in space”, proposed by
Nemirovsky and colleagues (1998), and states that lesson planning is a lived‐in
space that is “continually re‐created as one acts, explores possibilities, and practices
ways of doing things within it”. She also sees that lesson planning is “a place into
which and from which to project, enact, and evaluate intentions; to explore
possibilities; to juxtapose past, present, and future time; and so on” (p. 304).
In her study of a planning session on linear motion by an experienced teacher
named Mary, Rosebery described the teacher’s thinking as engaged in an “imagined
classroom” that allowed her to anticipate what might happen in the coming lesson.
During the planning session, Mary first reviewed the videotape from previous

32
lessons, and then thought through possible student reactions to the question she
had proposed at the end of the previous lesson.
Three different kinds of teacher thinking emerged from the planning session.
First, the teacher was able to specify the learning goal. The main focus for the
teacher was to propose different activities by imagining where and how the
students might experience them in the sequences of activities. After visualizing how
students might encounter the mathematical ideas in the proposed activities and
what difficulties students might have, the teacher revised the activities. Hence, the
teacher was engaged in her thinking of the lesson in the imagined classroom, and
consequently she was able to firmly identify the objectives of the lesson and
hypothesize how her students might learn.
Second, the teacher was able to use her understanding of students’
mathematical thinking to project possible thinking or responses to the proposed
activities. Reviewing the videotape of the previous lesson allowed Mary to interpret
and understand her students’ thought processes. With this understanding of
student thinking, she was able to decide what follow‐up activities might enable
students to learn. Specifically, she anticipated a particular student’s thoughts,
confusion, and reactions to the designed activity.
Third, the teacher was able to examine her own understanding of the subject
matter. She was in the imagined classroom of her past learning experience, and
examined how she came to learn speed, distance and time. By integrating her past
and present learning experiences of the subject, she was able to expand this
33
knowledge in order to anticipate and hypothesize how her students might learn the
concept.
Compared to the aforementioned studies on the psychological process of
lesson planning, the notion of lesson planning proposed by Rosebery is different in
that lesson planning is situated within an “imagined classroom”. Planning in this
context affords teachers opportunities to anticipate a lesson containing detailed
scenarios —how the events of the lesson would unfold, how students might think
and respond to certain activities and questions, and how the outcomes of the lesson
might develop.
Hence, as Rosebery claims, lesson planning in an imagined classroom could be
seen as an a priori process for teachers to anticipate the lesson, thus guiding them to
anticipate more predictable outcomes. Such a process of anticipation is considered
a learning experience for teachers in developing their knowledge of teaching.
However, in Rosebery’s study, it is not apparent what resources enable the
teacher to anticipate a lesson in the imagined classroom. For prospective teachers
who have little teaching experience in real classrooms, it is even more difficult to
anticipate a lesson in an imagined classroom. Therefore, to make the lesson
planning a learning experience for prospective teachers to develop their knowledge
for teaching, it is important to create resources that engage them in thinking and
planning the detailed classroom scenarios in an imagined classroom.
Summary I have identified common problems in novice teachers’ lesson planning and
instructional issues that expert teachers attend to during lesson planning.

34
Researchers and teacher educators have proposed scaffolds or tools that support
teachers to attend to particular aspects of teaching practice when lesson planning.
Lesson planning appears to be a potentially useful experience for learning how to
teach. However, it is not clear what kinds of resources engage prospective teachers
in learning. Representations of teaching have been extensively employed in teacher
learning settings because they allow prospective teachers to practice and learn
particular teaching skills. However, teaching is a complex task, involving
relationships among the teacher, students and content. The dissertation studies a
learning environment in which prospective teachers can approximate teaching
practice by anticipating a lesson that they had planned. The study shows that by
engaging in approximations of teaching, prospective teachers can learn to attend to
some aspects of the complexity of instruction.

35
3. CHAPTER 3
METHODOLOGY
This study explores how a novel approach to lesson anticipation facilitates
prospective teachers’ learning to teach. In particular, the study aims to understand
whether and how a lesson‐sketching tool, Depict, can engage prospective secondary
mathematics teachers in attending to the mathematical interactions between
teacher and students. The data for this study was a collected as part of the ThEMaT
(Thought Experiments in Mathematics Teaching) project, by members of the GRIP2
(Geometry Reasoning and Instructional Practices) research group.
This study poses the following research questions:
1. How do anticipations of classroom interaction about a planned lesson
differ when done using a multimedia lesson‐depicting environment as
compared with talking through the written lesson plan?
2. What do prospective teachers attend to in the work of teaching when
engaged in depicting a lesson?
3. How do prospective teachers employ the graphic resources to support
their lesson depiction?
2 GRIP (Geometry Reasoning and Instructional Practices) is a research group directed by Patricio G. Herbst. Support for the research reported in this article has been provided in part by the National Science Foundation, through grant ESI‐0353285; all opinions expressed are the sole responsibility of the authors and do not represent the views of the Foundation.

36
In this chapter I describe the process of data collection and I introduce the
lesson‐sketching tool, Depict. I then describe the analytic approaches that were used
to understand and resolve the research questions.
Setting and Context
This study was conducted with prospective secondary mathematics teachers
at the time that they were involved in a teaching practicum. This practicum was a
requirement for college juniors in the first (of three) semester of secondary teacher
preparation program at Midwest University. To pass the practicum, students
needed to both attend a weekly 1‐hour seminar and participate in a field placement.
Twenty‐three students enrolled in this course. These prospective teachers had been
paired up and assigned to observe middle or high school mathematics classes four
to five hours per week. The seminar was a site for these prospective teachers to
discuss issues regarding their experiences in field observation. It also served as a
site for prospective teachers to gain insights into the work of teaching mathematics,
thus better immersing themselves into the practice of teaching. The foci of this
seminar were mathematical literacy, how mathematical literacy mediates students’
thinking, attending to students’ mathematical work, and knowing students.
From the fourth to the sixth seminar meeting, activities in the course focused
on providing prospective teachers teaching experiences concerning students’
conceptions of linear function, for the purpose of subsequently planning a lesson on
the same topic. The topic of linear functions was chosen because of its importance
in the secondary mathematics curriculum.

37
To facilitate their learning of students’ conceptions of linear functions and to
use those in planning a related lesson, these teacher candidates engaged in three
learning activities during the seminar sessions. First, they read a document written
by one of the instructors that introduced the topic of student conceptions and
conceptions of slope. This document made the point that students’ errors can often
be traced to particular ways of thinking about a concept and described four
conceptions of slope (table, proportion, formula, graph) (see Appendix A). Second,
they were provided with a rubric regarding explaining concepts written by one of
the instructors (Herbst, 2011). The document describes practices involved in
explaining concepts and provides examples of class scenarios for each practice.
Third, they annotated students’ work on linear function with guiding prompts (see
Appendix B). The students’ work was selected from a corpus of three thousand
written artifacts about linear functions. These artifacts had been previously
collected from secondary school students for the purpose of practicing how to
assess students’ prior knowledge. The selected samples represented and illustrated
students’ common conceptions and associated errors regarding linear functions.
After they had annotated the students’ work in a set of 10 artifacts, the prospective
teachers had been asked to plan a lesson on introduction to slope. In the following
section, I describe their lesson planning activities and the data collection process.
Data Collection and Sources Data collection consisted of two phases. In Phase One, data collection took
advantage of an assignment that the prospective secondary teachers had, planning a
lesson in pairs using a text‐based planning format during the seminar meeting. In

38
Phase Two, nine pairs of prospective teachers were recruited to participate in a
voluntary, compensated, out of class experience in which they would elaborate on
their lessons in one of two different conditions: via lesson depiction or via lesson
description.
Phase One: Lesson planning in text The seminar assignment to plan a lesson engaged the prospective teachers in
planning a 15‐minute lesson explaining the concept of slope using text. The
participants worked in pairs with their field placement partner. Considering this
group of participants’ limited experiences in class observation, planning, and
teaching, it was appropriate to have them collaborate in pairs.
This work follows the assertion that instruction is an interactive process that
occurs between teacher, students and content (Cohen, et al., 2003). It is presumed to
be desirable for prospective teachers to attend to this interactive relationship when
planning the lesson. In order to direct the participants’ attention to the three
essential instructional constructs, they were guided by the following questions
when planning their lesson in text: (1) What is the mathematics that will be done?
(2) What will the teacher be doing? (3) What will students be doing? In addition, the
pairs were asked to estimate the time spent on each event and to make a timeline of
the lesson in the seminar assignment.
Each pair was provided with a packet of blank worksheets with guiding
questions (see Appendix C). This lesson plan instrument was developed based on
the rubric of explaining concepts provided for the prospective teachers earlier. In
addition, three resource artifacts were available, including their earlier annotations

39
on students’ written artifacts, the rubric of explaining concepts, and the document
explaining the concept of the slope.
Pairs had approximately fifty minutes to plan their lesson. If they finished the
planning, the instructors suggested they review their lesson and revise their lesson
plan if necessary. Some pairs reviewed their lesson by role‐playing.
Phase Two: Using Depict or describing lessons In the second phase, nine pairs of participants were recruited for further
participation in the study. Their participation was voluntary. These nine pairs were
randomly divided into two groups: the Depict group and the Control (Description)
group. Participants in the Depict group were invited to use Depict to create lesson
slides based on their lesson plans. Depict is a graphic composition tool that provides
a virtual classroom setting in which prospective teachers can depict a lesson as a
slide show using graphic resources. Participants in the Control group were invited
to describe orally how their lesson would unfold. Both the Depict group and the
Control group sessions were held outside the seminar class and participants were
compensated for their time.
The Depict group involved four pairs of participants. Each pair had one hour to
anticipate their lessons through a lesson depiction. In the first five minutes of this
session, the interviewer introduced the features of the tool. During the following
fifty minutes, the participants depicted lessons based on their lesson plan. The
participants were informed that they should start depicting their lessons from the
beginning task in their lesson plan but did not have to implement all the tasks. With
five minutes left in the session, the researcher asked the pair of participants to stop

40
depicting the lesson even if they had not yet finished all the tasks planned. The
researcher asked the participants what they had attended to in the lesson depiction
that they had not considered when planning in text. The participants were also
asked to assess the usability of the tool and to provide suggestions for future
development.
The Depict group sessions were recorded in both audio and video. One camera
recorded each pair’s discussion and interactions, and a second recorded the screen
actions projected on the projector screen. A screen recording software, Snapz Pro X
(Welch, 2008), was used to capture the screen activities that participants took part
in when creating the lesson slides in Depict.
The Control group consisted of five pairs of participants. Each pair was
interviewed for one hour. In the first five minutes, the pair reviewed their lesson
plan. The interview involved two stages. The first stage was a no‐prompt interview.
The interviewer asked the pair to elaborate on their lesson plan through the
following question: “Can you describe how this lesson would unfold?” The second
stage was conducted with an interview with guiding prompts. Immediately after the
first stage of interview, the interviewer went over the text written in the
participants’ lesson plan and prompted them with guiding questions, such as: “What
would you say?” “What would you do next?” In the last five minutes, the interviewer
asked the participants what they became aware of that they had not considered
when planning in the text format. The interview sessions were recorded in both
audio and video. Table 3.1 summarizes the data collection phases and the activities

41
that participants were involved in. Table 3.2 summarizes the data sources collected
in this study.
Table 3.1 Data Collection Phases and Lesson Planning Activities
Phase LessonPlanFormat
Description Guidingprompts TimeSpentonLessonplanning
PHASEONE
Text‐basedlessonplan
Ninepairsofprospectiveteachersplanneda15‐minutelessoninthetext‐basedformat
∙Whatisthemathematicsthatwillbe
done?
∙Whatwilltheteacherbedoing?
∙Whatwillstudentsbedoing?
∙Howlongmightittake?
Fiftyminutes
DepictGroup FourpairsofprospectiveteachersdepictedlessonsinDepict
N/A Fiftyminutes
PHASETWO
ControlGroup(Description
Group)
Fivepairsofprospectiveteacherswereinterviewed
Stage#1‐general(no)prompt:Couldyou
describehowthislessonwouldunfold?
Stage#2‐withprompts:Whatwouldyousay?Whatwouldyoudo
next?
Fiftyminutes

42
Table 3.2 Data Sources, Purposes, and Use in Answering Research Questions
Datasource Description Participants Goal ResearchQuestions
Text‐basedlessonplan
A15‐minlessononconceptionofslopeintext‐basedformat
9Pairs Tounderstandtheextenttowhich
prospectiveteachersplantheirlessons
withguidingpromptsinthetext‐
basedformat
RQ1
RQ2
Videoandaudiorecords(Depict
Group)ofparticipants’depictionoflessons
Participants’interactionsandconversationswhendepicting
lessons
4pairs Tounderstandprospectiveteachersdepictionoftheir
lessons
RQ1
RQ2
RQ3
ScreenactionscapturedinvideoformatandVideo
recordsofprojected
computerscreen
Participants’on‐screenactivities
inDepict
4pairs ToexamineprospectiveteachersinteractiveactivitieswithDepictandhowthefeaturessupportinlessondepiction
RQ1
RQ2
RQ3
Videoandaudiorecords(Control
group)
Participants’descriptionsoftheirlessons
5pairs Tounderstandtheextenttowhich
prospectiveteachersanticipatetheir
lessonswithoutandwithguidingprompts
RQ1
Introduction to Depict In this section, I introduce the lesson‐sketching tool, Depict. I start by
discussing the learning theory that informs the tool’s design. Then I introduce the
features and functionality of the tool.

43
Design rationale Depict is a software tool that allows users to anticipate and present a lesson
via a slide show. The design of Depict is based on the assumption that learning
occurs when learners interact with a “milieu” and get feedback from it (Brousseau,
1997). By milieu, Brousseau refers to the environment that the learner is acting on
and receiving feedback from. To create a “milieu” for learning, Depict provides users
opportunities to create, view, review and revise lesson slides (Herbst & Chieu,
2011). Users plan and anticipate what might happen in the teaching of the lessons.
Viewing and reviewing the lesson slides may help users examine and modify their
lessons.
Herbst and colleagues (2011) have proposed that two characteristics in
representations of teaching are important for prospective teachers to attend to
when learning to teach‐‐ temporality and individuality. Learners of teaching need to
attend to the temporal issues in instruction, including time spent on each activity
and the sequence among activities. Learners of teaching also need to pay close
attention to multivocal reactions of students, including attention to different
students at the same time and their different ways of thinking and ideas. Further,
learners of teaching need to be attentive to students’ multimodal ways of
communicating their thinking, such as verbal and gestural expressions and written
inscriptions.
The design of Depict attempts to provide users opportunities to be aware of
the above two demands of teaching. Consequently, in Depict, by creating, viewing
and reviewing sequences of lesson slides, users can anticipate the development of

44
lesson events, thus attending to temporal factors in teaching. In addition, users
utilize graphic features, such as classroom templates, expressions and gestures, to
attend to students’ verbal and nonverbal reactions.
Overview of Depict Depict is a tool developed to support representations of classroom interaction.
This study aims to engage users in anticipating lessons using cartoon‐based
characters and classroom settings and in examining how a lesson would unfold.
Depict has been updated to a new version since the study was conducted. I
introduce the interface and features available when the study was conducted, and
then I describe the differences in the new version.
When the study was conducted, the Depict interface consisted of three areas
(see Figure 5). The central area was the canvas or working space where users drag
one of the slide templates to in order to work on it and add other graphic elements,
such as students’ expressions. On the upper side of the canvas, users have options to
manage slides, such as creating, deleting, duplicating, opening saving and naming
slides. The left hand side of the canvas listed all the slides created thus far. The
buttons on the bottom left corner allowed users to arrange the order of created
lesson slides. Depict preserved all slides, even those later deleted. The right hand
side listed the graphic elements users can manipulate. These graphic features will
be introduced in the next section.
In the new version, above the canvas lists all the functions that allow users to
manage slides (e.g. creating, duplicating, arranging, inserting). On the right hand
side of the canvas, six graphic features are available for users to click, drag, and drop

45
onto the workspace. These graphic features include classrooms, furniture, supplies,
teachers, students and dialogue (Herbst & Chieu, 2011)
Figure 5. The interface of Depict shown when the study was conducted
Graphic features in Depict Six key graphic features allowed users to create slides to represent their
lesson: classroom templates, hand‐arm gestures, facial expressions, speech bubbles,
caption boxes and a boardwork creating tool, Inscribe. These graphic features
invited users to attend to classroom discourse and students’ verbal and nonverbal
interactions. In the following sections, I describe these features and how they may
encourage users to attend to different instructional issues.
Classroom templates
Classroom templates represent classroom settings in which teaching events
occur. For this study, six templates of classroom shots were available. These

46
templates represented typical classroom views. And the templates included
students and teacher represented using the character set ThExpians P (Herbst &
Chieu, 2011). These were static templates in which users could not select or arrange
characters and fixtures. The static nature of templates served as a shortcut to save
users’ time to compose various elements for each classroom setting. In addition, it
would encourage them to pay close attention to depicting the teaching events.
Four templates were provided with a view of the teacher. Users could choose
from a set of female or male teacher templates. These templates placed the virtual
teacher in four locations. Two (out of four) templates have the virtual teacher
standing at the board facing the class at the center and at the side. The other two
templates have the virtual teacher writing on the board at the center and side,
respectively. The board in this series of templates was blank, thus encouraging
users to create the board work. These templates illustrate what the class would look
like from an observer’s point of view. This point of view allows a prospective
teacher to observe and examine his or her teaching.
One of the templates shows a class of students sitting in rows facing the board.
This template illustrates the perspective that a teacher takes when standing at the
board. These virtual students represent diverse ethnic background (as shown by
skin color), gender (as shown by head shapes, eye shapes, and hairstyles), and
affiliation groups (as shown by their T‐shirts). The class setting is assigned with
fixtures, such as desks, chairs, bookshelves, posters and billboards. By default,
students have blank faces and no arms. Users are expected to assign gestures and
expressions to the virtual students if they want to change that default. This feature

47
is expected to enable prospective teachers to visualize various students in class and
their verbal and nonverbal reactions.
Another template is a close‐up shot of a board, which invites users to create
text or objects that the teacher or students may potentially produce. This template,
along with the ones with view of teacher, is expected to engage users to pay close
attention to the board content in their lessons.
Users can select a template from the scroll‐down menu on the right hand side
of the interface. Users can delete or duplicate a slide. On the left hand side, all the
created slides are listed, even those deleted. Users can move up or down the slides
to rearrange their order.
Hand‐arm gestures
While the templates give the virtual teacher character two arms, the virtual
student characters have none. Users can anticipate students’ gestural actions and
add these elements to the virtual students. Considering some typical students
gestural actions in high school settings, Depict provides ten gestures: left/right arm‐
neutral, raise left/right hand, explaining, pointing, thinking, writing, biting pencil,
and peace. These gestures may convey instructional meanings of students to the
teacher. For example, the “biting pencil” gesture illustrates that the student may be
confused and is thinking about a problem. The “raising left/right hand” gesture may
show that the student has a question, and is asking for clarification. The “pointing”
gesture may illustrate that the student is referring to something on the board.

48
Expressions
The virtual teacher and student characters are not given facial expressions.
Users are expected to attend to characters’ facial reactions when they depict a
lesson, especially to students’ expressions. Female and male characters have
different eye‐shapes. Both female and male characters have the same types of
expressions. These expressions are in three major categories: positive (excited),
neutral (neutral, neutral‐speaking) and negative (bored, confused/frustrated,
uncertain).
Adding expressions to characters may reveal the users’ attention to
characters’ nonverbal thoughts and moods. For example, a student is displaying a
“neutral” emotion, indicating that he/she may be listening to the lecture. A student
is “excited”, indicating that he/she has just solved a problem or understood a
concept that the teacher has just explained. A student is “bored”, showing that
he/she is not interested in the topic. A student is “confused”, showing that he/she
does not know the task requirement or the teacher’s explanation. The negative
types of expression draw more of teacher’ attention and require teacher’s further
prompts.
Speech bubbles
Users are expected to create teacher‐student dialogue via speech bubbles. By
specifying the dialogue, users must articulate the teacher’s instructions. Users must
consider students’ responses, including mathematical thoughts and possible
misconceptions.

49
To add a speech bubble, users have to click the “speech bubble” button on the
right hand side of the interface. A blank speech bubble then appears on the slide and
users can type text in it. Users can add more than one speech bubble on the same
slide.
Board content creating tool‐‐Inscribe
Inscribe is a tool that allows users to draw diagrams or create text as board
content. This tool is expected to encourage users to explicitly plan the notes,
questions, examples and representations that the virtual teacher would use. Users
may also anticipate the boardwork that students might produce during the lesson.
Objects created in Inscribe are saved in a Resources folder. This allows users to
retrieve these objects for further use. For example, users may retrieve an object
created earlier and attach it to a later slide as a way to keep the board content
consistent. Users may retrieve a stored object and modify it so as to show the
development of the board content.
Caption boxes
Caption boxes allow users to describe and illustrate the events that the given
templates or other graphic features cannot represent. This feature can be employed
in various occasions. For example, users may write “Students work in pairs for five
minutes” in a caption box to indicate that students are working on the assigned task.
A caption box “Teacher walks around to check students’ work” shows that the
virtual teacher is supervising students’ work, instead of standing at the board,
lecturing.

50
The graphic elements in Depict are expected to facilitate users’ (prospective
teachers) learning to attend to the multimodal communications in the classroom,
including verbal (speech bubbles), nonverbal (gestures, facial expressions), and
visual modes inscriptions. These graphic elements are expected to direct
prospective teachers’ attention to their own instructional activities and their
attention to students’ thinking. Depict aims to provide prospective teachers the
opportunities of anticipating the complexity of instructional events, and thus
facilitate their learning to teach.
Data Analysis The methodology for the analysis of data includes three approaches. First, I
use Systemic Functional Linguistics (Halliday & Matthiessen, 2004; Martin & Rose,
2003) to identify and compare the number of class events that the prospective
teachers planned or anticipated in the text‐based lesson plan, lesson depiction, and
lesson description context. Second, I perform task analysis (Doyle, 1983; Herbst,
2003) to examine how prospective teachers attended to details of their lessons
when rendering their lessons using Depict. Finally, I analyze both the use of features
and users’ behavior (Bailey & Konstan, 2003) to annotate how the prospective
teachers use Depict’s graphic features to implement their lessons and how those
features draw their attention to instructional details.
A multimodal data corpus To address the overarching research question ‐ how do rich‐media resources
facilitate prospective teachers’ attention to instruction ‐ I gathered a multimodal
data corpus. Multimodality refers to all modes of meaning‐making systems involved

51
in communication, such as text, images and speech; it creates “an integral
component of a larger sense‐making resource system” (Lemke, 2002). This corpus
allows me to examine how prospective teachers develop their lessons using
different resources. This corpus involves different modes of data sources, including
written, verbal and visual.
I consider the written lesson plans, lesson slide show created through lesson
depiction and lesson descriptions as distinct representations of teaching. Because
they all include class events, it is reasonable to identify what events prospective
teachers plan and anticipate in these different formats, and compare them.
To show the affordances of Depict, I employ three approaches. I hereby briefly
introduce these three approaches and the corresponding objectives and I will then
elaborate the methods in the following sections respectively. First, I draw resources
from Systemic Functional Linguistics (Halliday & Matthiessen, 2004) to compare the
class events anticipated by two groups: the Depict group and the Description group.
This comparison allows me answer Research Question#1 to find out whether lesson
depiction in a visual mode provides prospective teachers opportunities to attend to
class events that a verbal mode does not. In addition, this comparison clarifies how
lesson depiction enables prospective teachers to anticipate more of the classroom
interactions than lesson description.
To answer Research Question #2, I apply a task analysis (Doyle, 1983; Herbst,
2003)to examine the planned tasks and investigate the lesson depiction process to
determine how prospective teachers attend to the complexity of instruction relative
to planning in the written mode. Finally, to answer Research Question #3, I evaluate

52
the use of graphic features and users’ behavior (Bailey & Konstan, 2003) in lesson
depiction. In doing so, I examine how Depict’s graphic features facilitate the users’
attention to instructional details.
The following table illustrates the methods I adopt to answer corresponding
research questions:

53
Table 3.3 Methodology and Research Questions
Researchquestion
Approach/
Description
Method Steps Datasources
RQ1
ComparetheDepictgroupandthe
Descriptiongroup
Discourseanalysis‐SFL
1.Determinethenumberoftasksindifferentformatsoflessonplans. 2.Conjunctionanalysistodeterminetheclassevents. 3.Participant‐Processanalysisonclassevents 4.ComparetheaveragesofParticipantsandProcessespertask
Textlessonplan,lessondescription,discussionandlessondepiction
RQ2 Comparethetasksintextformatandtheir
developmentinlessondepiction
Taskanalysis 1.Identifythegoal,resourcesand operationsofataskinlessonplans. 2.Comparethedevelopmentsoftasksinlessondepiction
Textlessonplans;lessondepictiondiscussionandlessonslides
RQ3 InspecttheaffordancesofDepict’sgraphic
features
Graphicfeaturesandscreenaction
analysis
1.Inspecttheoccurrencesofeachfeatureused Investigatethetypesofactionsoneachfeature. 2.Observethemomentsinwhichmodificationsoccur
Theuseofgraphicfeaturesand
screenactionsintheDepictGroup
Discourse analysis of lesson events: Comparing two groups To examine the affordances of lesson depiction, it is important to differentiate
the details of teaching events anticipated in the lesson depiction condition from
those in the lesson description condition. I intend to first show and describe the

54
class events involved in the text‐based lesson plans that all participants created.
Then I inspect and compare how these class events were developed later in two
different conditions.
To answer Research Question#1 (How do anticipations of classroom
interaction about a planned lesson differ when done using a multimedia lesson‐
depicting environment as compared with talking through the written lesson plan?),
the analysis involves two steps.
In step one, I perform a task analysis to determine the number of tasks that
participants planned in each format: lesson plan, lesson depiction and lesson
description. I use the model of the academic task (Doyle, 1983, 1988; Herbst, 2003,
2006) to examine the tasks the lesson plans propose. According to Doyle (1988), the
three components of a task are: (1) the product (final goal that students need to
achieve); (2) resources (verbal or written information available to students); (3)
operations (manipulations of resources to achieve the task goal). At this stage, I only
identify the goals of each task and identify the number of tasks planned or
anticipated in each format of representations of lessons. It is important to consider
the degrees of details of teacher and student involvement per task and compare
those, because of the extent to which the amount of tasks may differ among different
representations of lessons. For example, the participants may ambitiously plan
many tasks in their written lesson plan, but may not provide extensive detail of how
teacher and students would interact to accomplish those tasks. In contrast, the
participants may predict fewer tasks when using the Depict tool because they would
need time to design the specific teacher‐student dialogues and interaction moves in

55
classroom activities. Hence it is appropriate to compare the degrees of details of
teacher‐students interactions anticipated per task between two conditions of lesson
anticipation. This step helps me to proceed in identifying the details of class events
in each task.
In step two, I use discourse analysis to evaluate the details of class events
involving teacher and student that participants anticipated through different
representations of lessons. To do this, I apply Systemic Functional Linguistics (SFL).
I follow Halliday and Matthiessen in assuming that ideational meanings are
construed in discourse. The ideational meanings refer to how discourse reveals
ones’ experiences in the world. These meanings can be revealed by an examination
of the transitivity structure of the clause: Processes3, Participants, and
Circumstances (Halliday & Matthiessen, 2004, p. 169).
To create text from three different representations of lessons, the interviews
were transcribed (for the description group). In the lesson depiction group, I
created multimodal textual transcriptions (Thibault, 2000) that include the
transcriptions of pairs’ discussion and the descriptions of the comics‐based lesson
slides4. With these transcripts and the text‐based lesson plans, I performed a
conjunction analysis to parse these representations of lessons into clauses. I
consider a lesson unfolded as a sequence of events, so conjunctions that show
additive and sequential relationships5 (such as “and”, “then”, “after”, “before”)
3 The terms of discourse analysis are capitalized. 4 For example, if a double‐entry table is presented on the board by the virtual teacher on the lesson slide, I describe it as “the teacher presents a double‐entry table on the board.” 5 According to Martin and Rose (2003), there are four kinds of logical relations—addition, comparison, time and consequence (p. 112‐113).

56
(Martin & Rose, 2003) help to identify class events that the prospective teachers
anticipate in their lessons sequentially.
I particularly looked at clauses where Participant‐Process structures are
related to the teacher’s or students’ experiences in lessons. Specifically, I looked at
the clauses in which the processes and participants are the teacher or student(s)
involved in class events. So a clause, such as “I’m going to make a new slide” from
the lesson depiction transcription does not count for the analysis purpose, because
“going to make a new slide” refers to the activity of lesson depiction and “I” refers to
a particular prospective teacher in the study, not the teacher role in a lesson. A
clause, “we’d give them a table with the time and each of our respective distances at
that time” from the interview transcription, is related to the teacher’s action in class.
Because “we” indicates the teacher who will “give” students a table. This analysis
resulted in a corpus of clauses related to activities or descriptions involving
teacher’s or students’ role in class. Then I classified these clauses according to
Participant‐Process system.
Processes are language choices that represent ones’ experiences. According to
Halliday and Matthiessen (2004), there are three major types of processes to
represent experiences. Clauses containing material processes are “clauses of doing‐
&‐happening: a ‘material’ clause construes a quantum of change in the flow of events
as taking place through some input of energy” (p. 179). In the context of class
events, a material clause could be “the teacher draws a table”, “students write down
the answers on the sheets” or “the teacher walks around.” While material processes
are related to outer experiences, mental clauses are “clauses of sensing: a ‘mental’

57
clause construes a quantum of change in the flow of events taking place in our own
consciousness” (p. 197). In the context of class events, a mental clause could be
“students remember the formula” or “students don’t like homework.” Finally,
relational clauses “serve to characterize and to identify” (p. 210). In the context of
class events, a relational clause could be “this student is smart” or “the teacher is in
the front of classroom.”
Besides the above three major types of processes, the verbal process is
considered as one of the subsidiary types of processes. Verbal clauses are “clauses of
saying” and “they contribute to the creation of narrative by making it possible to set
up dialogic passages” (p. 252). Verbal clauses could be represented through verbs
that report messages or through verbs accompanied with direct quotes. In the
context of class events, a verbal process that reports in a clause could be “the
teacher talks to the class”. A verbal process that is accompanied with a direct quote
in a clause could be “the student answers: ‘X’.
To inspect the differences of the teacher and students experiences among
various representations of lessons, it is important to ask the above experiences “by
whom?” Hence, I examine the Participant along with the process types. “Teacher”
and “students” are two major Participants in class events. To detect the extent to
which the prospective teachers were able to anticipate individual students’
involvement in their lessons, I further distinguish students’ involvement in class
events into two categories: “students as a class” and “students as individuals.” I
identify students are seen as a class when the participants referred them as “they”,

58
“students” or “the class”. Students are seen as individuals when the participants
named students or referred them as “’one student”, “he”, “she.”
Teacher and students, the two major Participants, might play either an active
role or a passive role in class events. For example, in a class event: “the teacher gives
worksheets to students”, “teacher” is an active Participant, and “students” are
passively participating in the event. Another example: “Bob replied to the teacher”,
Bob is an individual who participates in the class event, and the teacher passively
got the reply. Therefore, I distinguish the active and passive roles of teacher and
students in each class event. I label the passive roles of teacher and students as
“teacher as a recipient”, “students as a class of recipients” and “students as
individual recipients.”
To sum up, I identify the occurrences of types of Participants involved in class
events in lesson plan, lesson depiction and lesson description conditions. The types
of Participants include active and passive roles: “teacher”, “teacher as a recipient”,
“students as a class”, “students as a class of recipients”, “students as individuals” and
“students as individual recipients.” I also examine the occurrences of the
Participant‐Process structure in each class event. Within each type of active
Participants, I look at the Process types involved in class events—material, mental,
relational, and verbal.

59
Table 3.4 Types of Participant‐Process Structure Examined in Class Events
TypesofParticipant Participant‐Process
Activerole
Teacher‐Material Teacher‐Mental Teacher‐Relational Teacher‐Verbal
Teacher
Passiverole Teacherasarecipient
Activerole
SC‐Material SC‐Mental SC‐Relational SC‐Verbal
Studentsasaclass(SC)
Passiverole Studentsasaclassofrecipients
Activerole
SI‐Material SI‐Mental SI‐Relational SI‐Verbal
Studentsasindividuals(SI)
Passiverole Studentsasindividualrecipients
Due to differences in the total number of class events and the tasks planned in
each condition, I calculate the average of class events of each Participant‐Process
structure per task. Thus I can compare the degrees of detail the prospective teachers
could anticipate in their lessons.
Additionally, I use the Mann‐Whitney test, a non‐parametric test, to detect the
significance among variables between the Depict and the Description groups.
Because the relatively small size of the study sample, normal distribution of the data
could not be assumed, and the variance might be high from original scores. Hence, it
is appropriate to convert the scores to ranks and to use a non‐parametric test.

60
Further, because the study involves data from two independent samples between
two conditions, the Mann‐Whitney test can evaluate the differences of details of
class events between the two comparing groups.
Task analysis: Comparing lesson depiction and lesson plan To answer Research Question#2: What do prospective teachers attend to in
the work of teaching through lesson depiction? I examine how Depict supports
participants’ lesson anticipation. I conduct case studies to gather as much detailed
information as possible regarding prospective teachers’ lesson anticipation using
Depict (Yin, 2006). This approach allows me to explore different prospective
teachers’ experiences and learning from the activity of depicting lessons.
I conduct a more detailed task analysis to examine how lesson depiction
develops the tasks planned in the text format. Unlike an earlier approach in which I
only obtained the number of tasks in different representations of lessons, here I
examine the three elements of a task: goal, resources, and operations (Doyle, 1983,
1988; Herbst, 2003, 2006). It is important to employ these three components to
determine the tasks involved in a lesson because they allow me to investigate the
degrees of detail with which the participants anticipate their lessons. Particularly, it
helps to examine whether and in what ways they provide resources for students to
implement the tasks, and whether they identify students’ thinking and reactions
involved in the tasks.
I first investigate, in each pair of participants’ lesson plans, the three elements
of each task. I then inspect how the lesson depiction process changes these three
elements within the same task. For this purpose, I focus on the discussion between

61
the pairs as well as their work creating lesson slides in Depict. I parse transcriptions
of discussions and corresponding screen actions according to which task was being
undertaken. I then examine the pairs’ comments on the original tasks in the lesson
plan and their subsequent insights into the modifications of those tasks when
generated in lesson depiction. Additionally, I observe how the same tasks are
depicted via lesson slides. I then identify emerging themes and use the three
constructs in instruction (teacher, students, mathematics)(Cohen, et al., 2003) to
frame and synthesize the analysis.
Graphic features and screen action analysis of Depict To answer Research Question#3: How do prospective teachers employ the
graphic resources to support their lesson planning? I examine how Depict’s graphic
lesson planning. For this purpose, I enumerate the frequency of each features used
and observe users’ behavior while using the tool (Bailey & Konstan, 2003).
Specifically, I describe how prospective teachers utilized the graphic features and
interacted with the tool. The analysis includes three steps.
First, I inspect the frequency and ways in which each feature was utilized to
represent teacher‐student interactions. For example, in order to determine the level
of involvement by the teacher and students, I observe and compare the use of
teacher‐view and student‐view templates. I also examine the use of speech bubbles
to represent the teacher’s and students’ interventions.
Second, I examine the types of actions performed with each feature. I focus on
the moments that users created and modified the application of each graphic
feature. For example, I investigate the moments users create, duplicate and change a

62
teacher‐view or student‐view template. I look into the moments in which users
decided to include a caption box or edit its content.
In the final step, I probe the affordances of visualizing graphic representations.
I hypothesize that visualizing the lesson slides allows users to examine and refine
their anticipation of lesson events. Hence, I identify two moments, viewing and
reviewing, in which users can regard the lesson slides created thus far. I define
viewing as an action that occurs when users are looking at the slide they are
currently creating and have not yet gone to create the next slide. I define reviewing
as an action in which users are looking at a series of slides that they have created
that far. I then investigate instances of modification within each feature at these two
moments. For example, regarding the template feature, I look at whether and in
what ways users change their selections of templates when viewing or reviewing the
slides. I also look at whether and in what ways the users edit the contents in speech
bubbles or in caption boxes when viewing and reviewing the slides.
Summary In order to study how rich‐media resources facilitate prospective teachers’
attention to mathematical interactions with students, I investigate prospective
teachers’ lesson planning and anticipations done via different resources and tools.
The study consists of three pieces of analysis. The first part of analysis, in
responding to Research Question #1, I compare the similarities and differences of
lesson anticipations done through Depict and through lesson description. To do this,
I evaluate the details of class events involving teacher and student roles generated
from the two representations of lessons. In the second part of analysis, in answering

63
to Research Question #2, I conduct task analysis to examine how depicting lessons
develops the mathematical tasks planned in text format. Finally, in the last part of
analysis, in responding to Research Question #3, I inspect the use of graphic
features and observe user’s behavior to investigate how Depict enables prospective
teachers to attend to instructional details.

64
4. CHAPTER 4
ANTICIPATING TEACHER AND STUDENT ROLES IN
LESSONS
In this section, I address Research Question#1: How do anticipations of
classroom interaction about a planned lesson differ when done using a multimedia
lesson‐depicting environment as compared with talking through the written lesson
plan?
To examine the affordances of the Depict tool, it is important to differentiate
the details of class events anticipated via two different representations: lesson
depiction and lesson description. All participants worked in pairs to plan a 15‐
minute lesson explaining the concept of slope in the text format. Then these
participants were divided into two groups: the Depict group and the Control
(Description) group. The Depict group participants used the Depict tool to create a
comics‐based slide show to represent their lesson. The Description group
participants were asked to verbally describe their lesson. The study hypothesizes
that the Depict tool, with graphic resources, encourages prospective teachers to
attend to more instructional details, specifically teacher’s and students’
involvement, than their counterparts in the lesson description condition.
I drew resources from Systemic Functional Linguistics (SFL) to evaluate the
details of class events involving teacher and student roles in different

65
representations of lessons. I analyzed the Participant‐Process6 structure in each
clause related to teacher’s or students’ experiences in class. I defined a class event as
a clause in which the agent or the actor is the teacher or student. I identified types of
Processes of each Participant in active role, including material, mental, relational
and verbal Processes (Halliday & Matthiessen, 2004). I then identified the
Participants involved in each type of Process – the actor of material Process, the
senser of mental Process, the participant of relational Process, and the sayer of
verbal Process in each clause (class event). These Participants involved in each type
of Process are considered active roles in class events. I also identified the
client/recipient of material Process, the phenomenon of mental Process, the
Participant of relational Process, and the Receiver of verbal Process that are related
to teacher or students’ passive roles.
I considered students could participate in class events as a class or as an
individual. Hence, I looked at three major types of Participants: “teacher”, “students
as a class” and “students as individuals.” I also distinguished the active and passive
roles of teacher and students in each class event. Hence, the passive roles were
labeled as follows: “teacher as a recipient”, “students as a class of recipients” and
“students as individual recipients.” I calculated the total class events of each type of
Participant‐Process structure involved in different representations of lessons.
I also performed a task analysis (Doyle, 1983; Herbst, 2003) to determine the
number of tasks that the different representations of lessons include. I then
calculated the average of class events per task of each Participant‐Process structure.
6 The terms are capitalized to represent elements of discourse analysis.

66
It is important to take into consideration the degrees of details of teacher and
student involvement per task and compare those, because of the extent to which the
number of tasks may differ among different representations of lessons. For example,
the participants may ambitiously plan many tasks in their lesson plan, but may not
provide extensive detail of how teacher and students interact to accomplish the
tasks. In contrast, the participants may anticipate fewer tasks when using the Depict
tool because they would need time to design the specific dialogues between the
teacher and students.
In the following sections, I first show and describe the results of class events of
each Participant‐Process structure involved in the lesson plans that all participants
created. This aims to show the common traits that the participants planned using
text. Then I show and compare the detail of class events involved in Depict lessons
and lesson descriptions.
Characteristics of Lesson Planning in Text In the lesson plan, the participants worked in pairs to plan a 15‐minute lesson
explaining the concept of slope. They were provided with a packet of worksheets
containing questions that were designed to help guide the teachers in planning their
lessons. The participants were asked to make sure that their lessons addressed the
teacher, the students, and mathematical concepts. Afterward, their lesson plans
were collected for analysis.
Tasks and class events In this section, I first present the number of tasks in each lesson plan. Note that
I only identified tasks in lesson plan that were later anticipated in lesson depiction

67
or in lesson description. And I only examined the Participant‐Process structures in
class events in these tasks in lesson plan, lesson depiction and lesson description
conditions. I then show the total class events that each type of Participant was
involved in lesson plan.
Table 4.1 Number of Tasks in Each Lesson Plan Anticipated
Group Prospectiveteacher Numberoftasksanticipated
Depict Sienna&Pamela 4
Depict Samantha&Millie 4
Depict Ellie&Elliot 3
Depict Beth&Serena 4
Description Desmond&Wanda 9
Description Amanda&Wallace 6
Description Margot&Daedra 5
Description Douglas&Daliah 8
Description Jack&Sheila 6
The above table shows that the number of tasks the Description group
anticipated was relatively higher than that in the Depict group. The participants may
ambitiously plan many tasks in their lesson plan. And when they were later
interviewed, it might be relatively easy for them to describe their lessons. However,
the participants may anticipate fewer tasks when representing lessons using Depict
because they would need time to design the details in teacher‐students interactions.
The Participants in this piece of analysis were classified as teacher, students as
class, and students as individuals. They were considered to be playing either an
active role or a passive role in class events. By active role, I mean that Participants
appear in the role of actor of material Process, senser of mental Process, a
participant of relational Process or sayer of verbal Process. By passive role, I mean

68
that Participants appear in the role of recipient of material Process, phenomenon of
mental Process, participant of relational Process or receiver of verbal Process. For
example, in an event, “teacher talks to students”, teacher is a sayer, an active role,
while students are passively receiving messages from the teacher.
Table 4.2 shows the number of class events in which the teacher role, students
as class, and students as individuals, were involved actively or passively. The third
column shows the number of class events in which the teacher role was involved
either actively or passively. The numbers between the parentheses shows the
numbers of class events in which teacher role was active and passive respectively.
For example, among those in the Depict group, Sienna and Pamela’s lesson plan
contained 7 class events that involved the teacher role. The teacher role was actively
involved in all seven of these class events. This leaves that there was no class event
in which the teacher role was passively involved. That is, teacher was not
considered as a recipient in these class events in the lesson plan.

69
Table 4.2 Number of Class Events in which Teacher and Students are Involved in Lesson Plans
Group Prospectiveteacher
Teacher Students TotalofClassevents
Asaclass Asindividuals Depict Sienna&
Pamela 7(7/0) 0(0/0) 0(0/0) 7
Depict Samantha&Millie
11(11/0) 9(5/4) 0(0/0) 16
Depict Ellie&Elliot 13(13/0) 10(2/8) 0(0/0) 15 Depict Beth&Serena 18(18/0) 9(6/3) 0(0/0) 24
Description Desmond&Wanda
20(20/0) 9(2/7) 0(0/0) 22
Description Amanda&Wallace
15(15/0) 4(4/0) 0(0/0) 19
Description Margot&Daedra
26(26/0) 14(7/7) 0(0/0) 33
Description Douglas&Daliah
23(23/0) 4(1/3) 0(0/0) 24
Description Jack&Sheila 25(25/0) 7(2/5) 0(0/0) 27
The fourth column shows the numbers of class events in which the students
were involved as a class actively and passively. The numbers between the
parentheses shows the occurrences of class events in which students‐as‐class were
active and passive respectively. For example, in the Depict group, Samantha and
Millie’s lesson plan contained 9 class events that involved students as a class. The
collective student role was actively involved in 5 of 9 class events. This leaves 4 class
events in which the collective student role was passively involved. That is, the
collective student role was considered as a recipient in these 4 class events in the
lesson plan.
The fifth column in the above table shows that none of the prospective
teachers considered students as individuals involved in class events. The last

70
column shows the total number of class events identified in lesson plans. The
number of class events in the Description group was generally higher than the
Depict group because the tasks anticipated in the Description group are more than
those in Depict group. Hence, it is reasonable to calculate the average of class events
per task in which types of Participants were involved and compare them.
Participants In this section, I present the mean average of class events of types of
Participants’ involvement per task in the lesson plans. Table 4.3 shows the average
of class events involving each type of Participants per task in the lesson plans that
nine pairs of prospective teachers created. For example, in Sienna and Pamela’s
lesson plan, there were 4 tasks and 7 class events in which the teacher role was
involved (see above two tables). Therefore, there are on average 1.75 class events
per task in which the teacher role would be involved (either actively or passively).
Overall, these prospective teachers anticipated more teacher involvement
than student involvement per task; in other words, their lesson plans contained
little student participation. This observation is consistent with research on novice
teachers’ lesson planning (Leinhardt, 1993). Furthermore, the prospective teachers
generally anticipated that they would interact with students collectively, and rarely
included one‐on‐one exchanges.
The results of the Mann‐Whitney test show that, between the Depict group and
the Description group, when using a text‐based lesson planning tool, there were no
significant differences in their anticipation of the extent to which the three types of
Participants would be involved in the lesson (see Table 4.4).

71
Table 4.3 Average Number of Class Events Per Task of Participants involvement in Lesson Plans
Group Prospectiveteacher
Teacher Students
Asaclass (SC)
Asanindividual (SI)
Total
Depict Sienna&Pamela 1.75 0.00 1.25 1.25
Depict Samantha&Millie
2.75 2.25 0.00 2.25
Depict Ellie&Elliot 4.33 3.33 0.00 3.33
Depict Beth&Serena 4.50 2.25 0.00 2.25
Description Desmond&Wanda
2.22 1.00 0.00 1.00
Description Amanda&Wallace
2.50 0.67 0.00 0.67
Description Margot&Daedra
5.20 2.80 0.00 2.80
Description Douglas&Daliah
2.88 0.50 0.00 0.50
Description Jack&Sheila 4.17 1.17 0.00 1.17
Table 4.4 Mann‐Whitney Test of Groups Comparing Teacher and Students role involvement in Class Events
DepictGroup(n=4) DescriptionGroup(n=5)
MeanRank
SumofRanks
MeanRank
SumofRanks
U P
Teacher 5.00 20.00 5.00 25.00 10.000 1.000
Studentsasaclass 5.75 23.00 4.40 22.00 7.000 .461
Studentsasindividuals
5.63 22.50 4.50 22.50 7.500 .264
In the following sections, I further discuss how each type of Participant’s
Processes are involved in the lesson plans. I organize these sections by types of
Participants (teacher, students as a class, student as an individual) respectively.

72
Teacher’s processes The following table (see Table 4.5) shows the average number of class events
per task in which different types of teacher’s processes are involved in lesson plans.
I consider that the teacher role could be involved as active or passive in class events.
In class events, when the teacher role is involved passively, I labeled it as “teacher as
recipient.” When the teacher role is considered active in class events, I categorize
teacher’s active involvement according to different types of Processes: material,
mental, relational, and verbal. After identifying the number of class events in each
Teacher‐Process category, I divided that number by the number of tasks in the
lesson plan to the average number of class events per task in each category.
Table 4.5 Average Number of Class Events per Task of Teacher Processes in Lesson Plans
Group Participants Teacher‐
Recipient (Passive)
Teacher‐Active
T‐
Material
T‐Mental
T‐
Verbal
T‐
Relational
Total
Depict Sienna&Pamela 0.00 0.25 0.00 1.50 0.00 1.75
Depict Samantha&Millie 0.00 1.25 0.00 1.50 0.00 2.75
Depict Ellie&Elliot 0.00 2.00 0.00 2.34 0.00 4.33
Depict Beth&Serena 0.00 2.75 0.00 1.75 0.00 4.50
Description Desmond&Wanda
0.00 1.00 0.00 1.23 0.00 2.22
Description Amanda&Wallace 0.00 0.67 0.00 1.83 0.00 2.50
Description Margot&Daedra 0.00 2.20 0.00 3 0.00 5.20
Description Douglas&Daliah 0.00 0.38 0.00 2.5 0.00 2.88
Description Jack&Sheila 0.00 1.67 0.17 2.34 0.00 4.17

73
Overall, the teacher role was not considered as a recipient in the lesson plans.
This may indicate that the participants viewed the teacher role as a leading actor
who initiates the instructional events, and they did not include any events where the
students would interact with the teacher.
In the lesson plans, the “teacher” role was primarily involved in verbal and
material Processes and minimally in relational and mental Processes. The lack of
consideration of relational Process may indicate that the participants did not regard
teacher’s characterization, identification or quality as being important to their
lesson plans. Besides, teacher’s mental Process was rarely included in the lesson
plans.
The result of Mann‐Whitney test shows that there were no significant
differences between the two groups’ anticipation of teacher involvement of these
Processes (see Table 4.6). This result shows that all prospective teachers in this
study share similar traits when considering the teacher role’s involvement in text‐
based lesson planning.
Table 4.6 Mann‐Whitney Test of Groups Comparing Teacher Processes in Class Events
DepictGroup(n=4) DescriptionGroup(n=5)
MeanRank SumofRanks MeanRank SumofRanks U P
Teacher‐Material 5.50 22.00 4.60 23.00 8.000 .624
Teacher‐Mental 4.50 18.00 5.40 27.00 8.000 .371
Teacher‐Verbal 3.88 15.50 5.90 29.50 5.500 .266
Teacher‐Relational 5.00 20.00 5.00 25.00 10.000 1.000

74
Class processes The following table (see Table 4.7) shows the average number of class events
per task in which students would be involved as a class in the lesson plans. Students
as a class were involved in two different roles—as recipients and as active
participants. Student recipients are seen as taking a passive role in the class events;
for example, in an event entitled “teacher shows them definition on the board”,
“them” is referring to students who are passively given information. In an event
entitled “teacher asks them to solve the problem”, students are given instruction but
do not interact with the teacher. In contrast, as non‐recipients, students were
considered active participants in class through material, mental, verbal, and
relational Processes. For example, in an event “students work on the given
problem”, students are active participants through material Process by working on
the task. The results show that the prospective teachers generally expected their
students to be involved as a class of recipients (see Column: SC‐Recipient) rather
than a class of active Participants.

75
Table 4.7 Average Number of Class Events per Task of Class Processes in Lesson Plans
Group Participants SC‐Recipient
(Passive)
Studentsasaclass(SC)
(Activeparticipants)
SC‐
Material SC‐
Mental SC‐
Verbal SC‐
Relational Total
Depict Sienna&Pamela
0.00 0.00 0.00 0.00 0.00 0
Depict Samantha&Millie
1.00 0.75 0.25 0.00 0.25 1.25
Depict Ellie&Elliot 2.67 0.33 0.33 0.00 0.00 0.66 Depict Beth&Serena 0.75 0.00 1.25 0.25 0.00 1.5
Description Desmond&Wanda
0.78 0.22 0.00 0.00 0.00 0.22
Description Amanda&Wallace
0.00 0.00 0.17 0.50 0.00 0.67
Description Margot&Daedra
1.40 0.40 0.60 0.20 0.20 1.4
Description Douglas&Daliah
0.38 0.00 0.00 0.00 0.13 0.13
Description Jack&Sheila 0.83 0.17 0.17 0.00 0.00 0.34
Regarding students’ active involvement, students as a class were rarely
anticipated to be verbally participating in the lessons. Instead, students were
expected to think or perform an action to a certain extent. Few descriptions of
students regarding their identification or characterization were generated in lesson
plans. These results show that students were expected to “do” things during the
lesson. Although they were expected to “know” or “think” in certain ways, the
teachers did not anticipate the exact ways in which students might verbally express
their thoughts.
The results of Mann‐Whitney test show that there were no significant
differences between the two groups with regard to their anticipation in these

76
categories (see Table 4.8). This shows that all prospective teachers in this study
share similar considerations regarding students’ involvement in the lesson plan.
Table 4.8 Mann‐Whitney Test of Groups Comparing Class Processes in Class Events
DepictGroup(n=4) DescriptionGroup(n=5)
MeanRank
SumofRanks
MeanRank
SumofRanks
U P
Studentsasclass‐Material
5.25 21.00 4.80 24.00 9.000 .798
Studentsasclass‐Mental 6.00 24.00 4.20 21.00 6.000 .317
Studentsasclass‐Verbal 4.63 18.50 5.30 26.50 8.500 .662
Studentsasclass‐Relational
4.88 19.50 5.10 25.50 9.500 .884
Individual student processes In the lesson plans, the prospective teachers could not successfully anticipate
individual students’ participation, with the exception of Sienna and Pamela’s plan
(see Table 4.9). This pair of participants anticipated that the teacher would request
individual students to come to the board to accomplish assigned tasks at different
times. These individual students are recipients of teacher’s direction at the moment
when they are called, and then they, as individuals, would finish the assigned tasks
in the role of active Participants.

77
Table 4.9 Average Number of Class Events per Task of Individual Student Processes in Lesson Plans
Group Prospectiveteacher
SI‐ Recipient (Passive)
Studentsasindividuals(SI) (Activeparticipants)
SI‐
Material SI‐
Mental SI‐
Verbal SI‐
Relational Total
Depict Sienna&Pamela
0.50 0.75 0.00 0.00 0.00 1.25
Depict Samantha&Millie
0.00 0.00 0.00 0.00 0.00 0.00
Depict Ellie&Elliot 0.00 0.00 0.00 0.00 0.00 0.00 Depict Beth&
Serena 0.00 0.00 0.00 0.00 0.00 0.00
Description Desmond&Wanda
0.00 0.00 0.00 0.00 0.00 0.00
Description Amanda&Wallace
0.00 0.00 0.00 0.00 0.00 0.00
Description Margot&Daedra
0.00 0.00 0.00 0.00 0.00 0.00
Description Douglas&Daliah
0.00 0.00 0.00 0.00 0.00 0.00
Description Jack&Sheila 0.00 0.00 0.00 0.00 0.00 0.00
Class Events Comparison between Lesson Depictions and Lesson Descriptions In this section, I compare the details of lesson events anticipated from the
lesson depiction group and the lesson description group. For the lesson depiction
group, I integrated all the semiotic resources created from their proposed activities
and generated text‐based transcriptions of their lesson depiction plans, including
the comics‐based lesson slides, the discussion around the depiction, and the screen
actions taken. In the Description group, I transcribed the interviews in which the
prospective teachers were asked to verbally describe how their lesson would

78
unfold. They were given no prompts, only the single interview question: “could you
describe how your lesson would unfold?” As with the text‐based lesson plans, I used
conjunction analysis to identify clauses as class events in the transcriptions
(Halliday & Matthiessen, 2004). Then I identified the Participant‐Process system to
categorize these class events. Finally, I compared the average number of class events
per task in which types of Participants and Processes were involved in the lesson
depiction group and in the lesson description group.
I first present the comparison of Participants involved between lesson
depiction and lesson description. I then discuss in detail each type of Participant‐
Process structure and the comparison between the two groups.
Participants To show whether there is a difference in the level of anticipation of
Participants between the two conditions, I first present and compare the average
number of class events per task in which each type of Participant is involved in each
condition. I then identify whether the differences between the two conditions reach
statistical significance using the Mann‐Whitney test.
The prospective teachers in the lesson depiction condition anticipated more
teacher and student participation than those in the lesson description condition.
Regarding the teacher role in lessons, the Depict group in average had 8.938 class
events per task that involved teacher, while the Description group in average had
3.344 class events per task involving the teacher role. Regarding the role of students
in lessons (including collective and individual), the Depict group on average

79
anticipated 9.667 class events per task and the Description group had 1.727 class
events per task.
The Depict group anticipated that lessons would be made up of more student
involvement (9.667 events per task) than teacher participation (8.938 events per
task). In addition, the Depict users anticipated more individual student involvement
(6.792 events per task) than full‐class participation (2.895 event per task). In
contrast, the participants in the lesson description group did not anticipate any
individual student involvement. This difference in the anticipation of individual
student involvement was significant (Mann‐Whitney U (2‐tailed); U= .000, p< .007).
With regard to the anticipation of students’ involvement in general, combining their
collective and individual activity, the two conditions are significantly different
(Mann‐Whitney U (2‐tailed); U= .000, p< .014).
Table 4.10 Average Number of Class Events Involving Types of Participants
Students
Group
Teacher Asaclass Asanindividual Total
LessonDepiction 8.938 2.875 6.792 9.667
LessonDescription
3.344 1.727 0 1.727
These results indicate that the prospective teachers using Depict expected
more teacher involvement, as well as student engagement in their lesson, than the
other group. Additionally, the participants using Depict attended more to the
involvement of individual students than the class as a whole. In contrast, in the
verbal description of their lessons, the prospective teachers only viewed students as
a class and did not identify instances of individual student participation.

80
Teacher’s processes Generally, the Depict users envisioned more teacher involvement in each type
of Process than their counterparts in the lesson description condition (see Table
4.11). Among these variables, the only one that is significantly different between the
two groups is verbal Process (Mann‐Whitney U (2‐tailed); U=1.000, p<.027),
perhaps as a result of the speech bubble feature in the Depict tool that encourages
users to create dialogues.
Depict users considered “teacher” a passive participant in their lessons that
students may interact with. For example, in an event “students responds to teacher’s
question”, teacher is passively given with responses from students. The prospective
teachers in lesson description group, however, did not anticipate that teacher role
could be passive.
Table 4.11 Average Number of Class Events Involving Teacher Processes
Group TeacherasRecipient (Passive)
Teacher(Active)
Teacher‐Material
Teacher‐Mental
Teacher‐Verbal
Teacher‐Relational
LessonDepiction
0.063 3.563 0.167 3.917 1.229
LessonDescription
0.000 1.811 0.133 1.294 0.107
Class processes The prospective teachers in the lesson description group anticipated
interacting more with students as a class of recipients (0.864 events per task, see
Table 4.12) than those in the lesson depiction condition (0.708 events per task).

81
This comparison may indicate that the prospective teachers in the lesson
description condition were more likely to view students as passive Participants.
However, the difference between the two groups was not significant (Mann‐Whitney
U (2‐tailed); U= 9.000, p=.806)
As for the class Processes, the Depict users generated more anticipations than
the other group, which may imply that in the lesson depiction condition, the
participants were better able to attend to students’ participation in general. This
may be partly a result of the fact that the classroom template with the view of
students in the Depict tool allows users to visualize the presence of students and
hypothesize students’ engagement. However, the group differences in the above
variables did not achieve statistical significances from Mann‐Whitney test.
Table 4.12 Average Number of Class Events Involving Class Processes
Group Studentsasaclassof
recipients
Studentsasaclass(SC)
SC‐Material SC‐Mental SC‐Verbal SC‐Relational
LessonDepiction
0.708 0.354 1.104 0.292 0.417
LessonDescription
0.864 0.309 0.418 0.033 0.102
Individual student processes The lesson description prospective teachers did not generate any anticipation
of individual students’ involvement (see Table 4.13). Given their limited classroom
observations and teaching experiences, these prospective teachers may not have
had any context to envision individual student participation in their lessons.
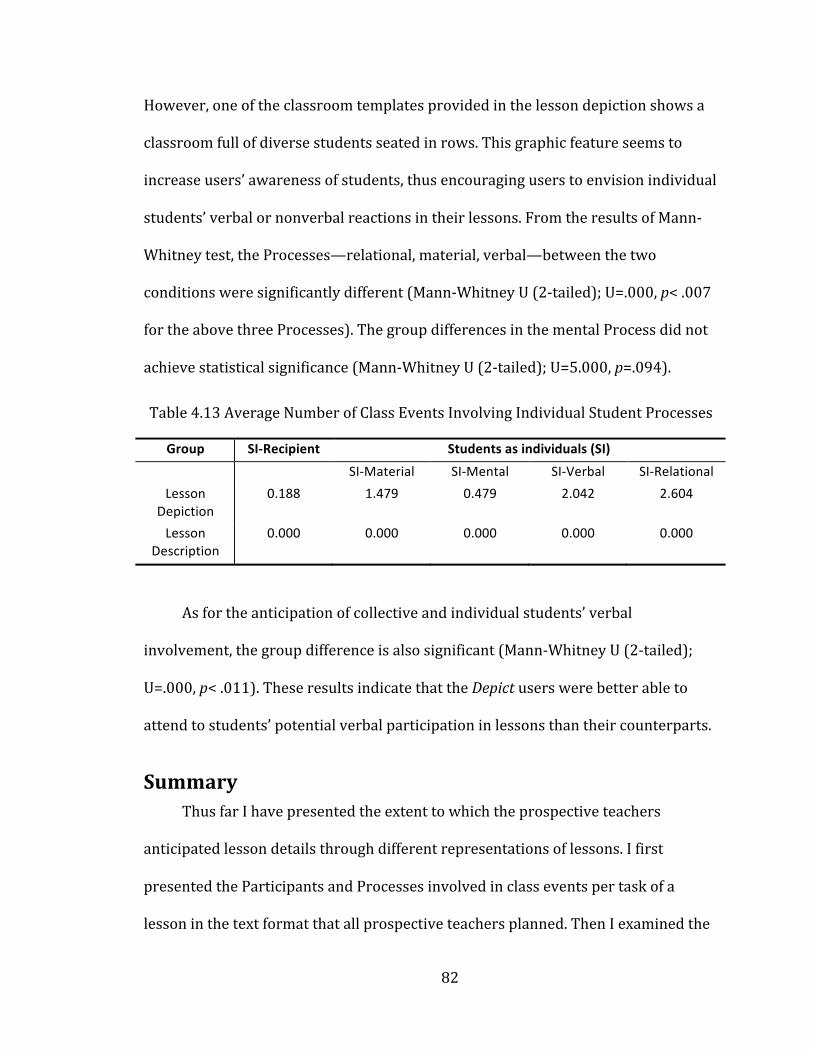
82
However, one of the classroom templates provided in the lesson depiction shows a
classroom full of diverse students seated in rows. This graphic feature seems to
increase users’ awareness of students, thus encouraging users to envision individual
students’ verbal or nonverbal reactions in their lessons. From the results of Mann‐
Whitney test, the Processes—relational, material, verbal—between the two
conditions were significantly different (Mann‐Whitney U (2‐tailed); U=.000, p< .007
for the above three Processes). The group differences in the mental Process did not
achieve statistical significance (Mann‐Whitney U (2‐tailed); U=5.000, p=.094).
Table 4.13 Average Number of Class Events Involving Individual Student Processes
Group SI‐Recipient Studentsasindividuals(SI)
SI‐Material SI‐Mental SI‐Verbal SI‐Relational
LessonDepiction
0.188 1.479 0.479 2.042 2.604
LessonDescription
0.000 0.000 0.000 0.000 0.000
As for the anticipation of collective and individual students’ verbal
involvement, the group difference is also significant (Mann‐Whitney U (2‐tailed);
U=.000, p< .011). These results indicate that the Depict users were better able to
attend to students’ potential verbal participation in lessons than their counterparts.
Summary Thus far I have presented the extent to which the prospective teachers
anticipated lesson details through different representations of lessons. I first
presented the Participants and Processes involved in class events per task of a
lesson in the text format that all prospective teachers planned. Then I examined the

83
same variables in both the lesson depiction and lesson description conditions. In the
following section, I summarize the results.
The prospective teachers generally showed similar tendencies of planning in
the text, which I will now enumerate. First, in the written lessons, “teacher” plays a
dominant role and the students rarely participate. The prospective teachers only
considered students’ collective involvement and they did not anticipate individual
students’ participation. Second, the “teacher” is actively involved in lessons through
verbal and material Processes. This observation concurs with previous studies that
teachers typically plan lessons with a series of activities that reminds them what to
do or prepares teachers’ future actions (Hill, et al., 1983; McCutcheon, 1980;
Shavelson, 1983; Yinger, 1980). Third, the prospective teachers generally
anticipated that students would passively participate in lessons (i.e. they would be
“recipients”). Regarding students’ active participation, they were only expected to
think or perform an action to some extent. For example, “students think about
subtracting negative numbers”; “Students put their (coordinate) points into a table”.
Finally, in the lesson plan, the prospective teachers were rarely able to anticipate
individual students’ involvement. Overall, the results show that although thinking
about teacher’s leading role in activities in their lesson plans, these prospective
teachers did not focus equally on students’ active participation when planning. This
observation is consistent with the research on novice teacher lesson planning
(Borko, et al., 1988; Peterson, et al., 1978; Roskos & Neuman, 1995)

84
Comparing the Participants and Processes involved in the lesson depiction and
in the lesson description, the prospective teachers in the two groups showed
different trends of lesson anticipation, as the following paragraphs illustrate.
First, the Depict users anticipated more teacher and student involvement in
class events per task in their lessons than their lesson description counterparts. In
particular, similar to the planning in the text, the prospective teachers in the lesson
description condition did not anticipate any individual student participation.
Second, the Depict participants anticipated more teacher active involvement in
various types of Processes than their counterparts. Third, the Depict users
anticipated that the “teacher” might be involved as a recipient, while the lesson
description teachers did not. This may show that lesson depiction allows the
prospective teachers to envision that the teacher could have a passive role with
which students interact.
Fourth, the Depict users anticipated more collective students’ Processes than
the lesson description participants. Anticipating students’ possible behavior or
thinking in lesson is recognized as a characteristic in expert teachers’ planning
(Lampert, 2001; Leinhardt, 1993; Schoenfeld, et al., 2000). However, the lesson
description participants were more likely to view students collectively as passive
Participants.
Finally, while the participants in the lesson description did not envision any
individual student participation, their counterparts were able to incorporate
students’ individuality into their lesson plans. The Depict users in particular were

85
able to include students’ verbal involvement, a significant difference from the other
group.

86
5. CHAPTER 5
TASK ANALYSIS OF LESSON PLAN AND LESSON
DEPICTION
In this section, I seek to address Research Question#2: What do prospective
teachers attend to in the work of teaching when engaged in depicting a lesson? I
examine and compare the tasks that each pair of participants planned in the text
format and those they anticipated using Depict to create lesson slides.
All four pairs of participants planned more tasks in text than they did in Depict.
I examine and compare the tasks that were both planned and anticipated in the two
formats. I identify the goals that the participants intend students to achieve in each
task, the resources that the participants make available for students to accomplish
those goals, and the operations that the participants anticipate students would need
to take for achieving the tasks. I compare the above three elements of tasks in each
pair of participants’ lesson plans and lesson depiction.
Within each task, I also describe the screen actions that the participants made
when depicting lessons. I particularly focus on the moments that the participants
created, viewed, reviewed, and revised slides. I then examine how and to what
extent these screen actions in Depict afforded the participants opportunities to
attend to the complexity of the interactive work of teaching.

87
Case #1: Ellie and Elliot’s work In Ellie and Elliot’s work, three tasks from their lesson plan were anticipated
in Depict. They implemented these three tasks using twelve lesson slides. They
planned to have students observe a given table with two variables and graph the
table.
Anticipating Task #1 The first task required students to read a given table. In their lesson plan, Ellie
and Elliot wrote:
The teacher will give the students a table such as hours Total Distance (miles) 1 2 3
30 60 90
They will ask the students questions that connect to their prior knowledge, such as “How many miles did the car travel during the first/second/third hour?” (assuming the children have had practice looking at tables). This will take approximately 1-2 minutes.
Figure 6. The first task in Ellie and Elliot’s lesson plan.
The goal of this task from the lesson plan is for students to answer the
questions regarding the distances traveled after a certain amount of time (one, two
and three hours). The resource provided for students to achieve the goal is the table.
The pair of participants assumed that students have prior knowledge of reading a
table, thus are able to answer the questions. However, Ellie and Elliot did not specify
the operations required to read the table. For example, the operation involves
subtracting total distance at n hours from total distance at (n‐1) hour to see how far
they traveled in one hour.
88
When Ellie and Elliot began to depict the lesson, they intended to copy their
lesson plan. They first chose a slide template with the virtual teacher standing at the
center and facing class at the board. They drew the table as the one in the lesson
plan on the board. This table consists of two columns: the left column indicates the
time in hours and the right one shows the total distance in miles. The table also
includes three pairs of numbers to represent the hours and the total distance in
miles. Then Ellie copied from the lesson plan and typed “how many miles did the car
travel during the first hour?” into a speech bubble for the virtual teacher (see EE‐
S01‐v1).

89
Figure 7. EE‐S01‐v17: The question posed by the virtual teacher was copied directly from Ellie and Elliot’s text‐based lesson plan.
After Ellie typed up the dialogue, Elliot read the slide and commented that the
teacher would not pose the question to the students without setting up the question
first:
79 Elliot ….. I mean she wouldn’t be like, she wouldn’t‐‐ I don’t think that
would be like the first thing she would say to the class, you know, …
After they realized that they needed to elaborate on their lesson plan, they
modified the virtual teacher’s instruction to include the context story of the table
about a traveling car, and demonstrated an example of how to read a pair of
7 All slides are remade from the original slides. Original slides are stored in Depict and are retrieved from the screen capture tool. However, the texts in speech bubbles or caption boxes are written in a font that is too small to read. The texts in the remade slides are magnified. The callout arrows may be in different orientations than those in the original slides. The callout windows may be at different locations in the remade slides. The texts and all graphic elements are kept the same as in the original slides.

90
numbers from two columns in the table. She then posed a question prompting
students to read another pair of numbers from the table. The virtual teacher also
has a female‐excited expression on her face (see Figure 8).
Figure 8. EE‐S01‐v2: The virtual teacher sets up the question.
Upon finishing the first slide, Ellie and Elliot duplicated it. In doing so, they
could have all graphic elements from the first slide without composing them again.
All they had to do was to change the virtual characters’ dialogue. However, when
they were viewing the duplicated slide and thinking about what might happen next,
they realized that there should be students’ responses to the teacher’s initial
question. A slide template with a class of students should be the next slide. And the
slide that was duplicated with the teacher standing at the board could be moved to
later.

91
131
Ellie Um, should we have a kid, a kid should probably answer. I guess we
should have done the kids face on this one. I’ll just move that one to
later. Who do you think would answer? [laughs]
They inserted the slide template with a class of students. They chose a male‐
neutral speaking expression for a student who was sitting in the first row and
assigned a speech bubble with the answer to the previous question.
Figure 9. EE‐S02: A male student, sitting in the front row, answers with an expression.
The next slide was the teacher’s response to the student’ answer and a follow‐
up question (see Figure 10). In this slide, duplicated from the first slide with a table

92
on the board, the virtual teacher was standing at the board and at the center. Elliot
also assigned the virtual teacher with a neutral‐right arm8.
Figure 10. EE‐S03: Teacher responds to the student’s answer and asks a follow‐up question.
The follow‐up slide is a student’s answer to the teacher’s question. This slide
has the view of a class of students. Elliot first typed up the response in a speech
bubble, but later dragged it closer to a student sitting in the first row, rather than
the one who answered the previous question.
Ellie pointed to the student who answered the previous question on the
computer screen and suggested that he would know the answer too and would raise
his hand. Then Elliot had this student raise his right hand and had a male‐neutral
expression. The student who was answering the current question has a male‐neutral
speaking expression (see Figure 11).
8 Due to a technical defect of Depict software tool, in this slide, the table on the board blocked the virtual teacher’s original right arm. So Elliot assigned a neutral right arm to the virtual teacher.

93
157 Ellie I bet that kid would probably raise his hand.
158 Elliot This guy?
159 Ellie Let’s take out the first one.
160 Elliot [laughs] You want to give it to him then?
161 Ellie No, I’m just—He could have his arm up.
162 Elliot Okay, good one. [laughs]
Unlike a previous slide, in which there was only one student answering with a
neutral‐speaking expression, in the current one, two students were involved in the
mathematical task. Besides the student who was providing the answer, another
student raised his hand showing that he would also know the answer.

94
Figure 11. EE‐S04: More than one student were involved in response to the question.
Analytical commentary on Task #1 The above is the first task in Ellie and Elliot’s lesson and is easy to accomplish.
However, the degree of attention to instructional details increased when the pair
depicted the lesson. In their lesson plan, they only stated that the teacher would give
students a table and ask them questions from the table. However, they did not
specify how the teacher would set up the task. Also absent were students’ actions in
response to teacher’s question.
When depicting the lesson, the pair identified specific teacher actions to
provide resources for students to accomplish the task. First, the virtual teacher
presented the table on the board and provided a context of a car travelling that
students might be familiar with. Second, the virtual teacher offered an example of
how to read a pair of numbers from two columns. The pair of prospective teachers

95
also depicted students’ verbal and nonverbal reactions, particularly, multiple
student responses.
Anticipating Task #2 The second task was asking students to observe the pattern of the values from
the table and to predict how far the car would travel after a certain amount of time.
This task required students to make an inference about information beyond that
given in the table. In the lesson plan, Ellie and Elliot wrote:
After presenting and briefly discussing the table of values, we could ask, “How fast is the car going?” and “How far will the car have traveled after 10 hours?” The first question gets the students think about the connection between the two columns. That is, speed is a function of distance and time, not just one or the other. Also the second question is difficult and inconvenient to answer w/ only the students’ current knowledge. This segment should take 1-2 mins.
Figure 12. The second task in Ellie and Elliot’s lesson plan.
They planned to ask students two questions. The first question was to ask
students “how fast is the car going?” According to Ellie and Elliot, this question “gets
the students thinking about the connection between the two columns. That is, speed
is a function of distance and time, not just one or the other” (see Figure 12). The goal
of this question was for students to observe the pattern of the values from the given
table. Ellie and Elliot acknowledged that students would need to make the
connection between the two columns from the table in order to answer the first
question. However, they did not mention the resources that students would need for
doing the task.

96
The second question asked of students was “how far will the car have traveled
after 10 hours?” The goal of this question is to predict the distance of 10‐hour travel.
And they noted that this question “is difficult and inconvenient to answer with only
the students’ current knowledge.” They anticipated that students might have
difficulty in answering the question given their limited current knowledge. They
recognized the current knowledge as a resource, but they did not see this resource
as sufficient for students to accomplish the goal.
Ellie and Elliot modified the task when depicting the lesson. Particularly, they
provided resources for students and anticipated students’ possible responses. After
the students’ answer to the previous task, Ellie and Elliot decided to have the virtual
teacher respond and prompt further questions. They chose a slide template of the
teacher standing at the center facing the class with a blank board (see Figure 13).
And they discussed having the virtual teacher ask students to predict how far the
car would travel after 10 hours. This question required students to read the table,
interpret the given information from the table and make a prediction. Before typing
up the virtual teacher’s question, Elliot commented:
182 Elliot I guess we should probably duplicate.... duplicate this because we
want the table up there, right?
Elliot noticed that the table is a resource for students to answer the question.
Therefore, there is a need to make the table available for students. Hence, Elliot
duplicated the first slide in which the teacher was standing at the board facing the
class and a table was up on the board. And then he typed up the virtual teacher’s

97
question: ”Ok, good. So can anyone predict how far the car will have traveled after
10 hours?”
Figure 13. EE‐S05‐dlt: This slide was deleted after the participants realized that the table from previous task should be on the board.

98
Figure 14. EE‐S05: This slide was duplicated from the first slide to preserve the board content.
After typing up the teacher’s question, Elliot suggested that students may be
puzzled, and Ellie agreed and proposed that students need time to think about the
question:
187
Elliot Then I think there should be some puzzled people. And once again
we can’t get this table on here9. [pause 10s] Think anyone else is
gonna come up with an answer?
188 Ellie I think they would think about it for a while.
189 Elliot Let’s put some puzzled looks, or uncertain. Let’s put it [a facial
expression] on that guy. [laughs] Okay.
190 Ellie Um.
9 Elliot was referring to a technical problem that the table on the board was shown out of scale.

99
Elliot first put male‐uncertain expressions on two students who were sitting in
the first row and the third row respectively. Then he put a female‐uncertain
expression on a student who was sitting in the second row.
Then Ellie and Elliot continued discussing what students would think about
the teacher’s question. They hypothesized the differences in students thinking. They
anticipated that students may not be able to get the answer for the distance traveled
after 10 hours, but students may be able to observe the pattern of the given three
pairs of numbers regarding time and distance. To identify students’ possible
thoughts on the question, Elliot reviewed the previous slide (see EE‐S05) in which
the virtual teacher posed the question. He pointed to the two columns of the table
on the screen to indicate that the distance is equal to time multiplied by thirty (Turn
#193). Ellie also proposed that students might find the difference of the distance
between every one hour was thirty, thus students might add thirty ten times to
obtain the answer (the distance traveled after 10 hours). This instance showed that
the pair was able to hypothesize students’ different ways of thinking. Later, they
concluded that students might be able to observe the relationship between the two
variables, even though students might not get the answer to the teacher’s question
right away.
191 Elliot What do you think they will be thinking about?

100
192 Ellie I don’t know, I think someone might make the connection that it’s
going (30 miles every hour.)10
193 Elliot (times 30, times 30) times 30, times 30, right?
194 Ellie Uhhuh. [pause 5s] I don’t know they might say something like,
can’t you‐‐ I don’t know add 30 ten times or something like that.
195 Elliot Mmhmm.
196 Ellie Like maybe not get the answer but kind of see the relationship.
As a result, in the same slide with a class of students, another student who was
sitting in the first row replied: “Isn’t it, like, going up by 30 each time?” with a male‐
neutral speaking expression. This slide showed the student’s observation of the
changing pattern from the information given in the table. This pattern is that with
each additional hour, the distance increases by 30 miles. In this slide, in addition to
the nonverbal responses of uncertainty shown from three students, the fourth
student has both verbal and nonverbal reactions.
10 Parentheses indicate overlapping speech.

101
Figure 15. EE‐S06‐v111: Multiple students participated verbally and nonverbally.
After the student’s response, Ellie and Elliot discussed how the virtual teacher
should reply and rephrase the student’s idea. They first chose a slide template with
the teacher standing at the center and facing the students as slide #7, and typed up
the teacher’s response: “very good! So you are saying that every hour, the car is
going 30 miles.”
Analytical commentary on Task #2 Comparing what they had planned in the lesson plan, Ellie and Elliot became
aware of several significant instructional features in lesson depiction. First, they
duplicated a previous slide in which a table was on the board, which provided a
resource for students to answer a follow‐up question. Second, they predicted
students’ possible difficulties in responding to the question and their possible
11 Later, when Ellie and Elliot reviewed this slide, they made a slight change on it, which will be labeled as EE‐S06‐v2.

102
emotional reactions, as well. Third, they realized that students needed time to
contemplate the question. Fourth, Ellie and Elliot hypothesized what students could
achieve given their current knowledge. They anticipated that students may be able
to observe the pattern of the two columns in the table, but would not predict the
total distance of 10‐hour travel. Although in the lesson plan, they noted that the
question would be difficult for students, they did not probe further about what
students could achieve given their current knowledge.
Anticipating Task #3 The third task posed in the lesson plan was graphing the given values from the
table and extending the graph with new values. Ellie and Elliot wrote:
The teacher and the students collaboratively graph the table. She will help the students see a pattern and help them to extend the graph using new values. She will help them to see that as x changes by a unit of 1, y changes by 30. The mathematics that will be used is transferring data from a table to a graph and evaluating the information a graph gives us.
Figure 16. The third task in Ellie and Elliot’s lesson plan.
Ellie and Elliot identified the goal of this task as to graph the values on a
coordinate plane and ultimately evaluate information from a graph. Students would
need to observe a pattern between a table and a graph and transfer data from one
representation to another. Students would also need to graph points on a coordinate
plane. Although they stated that the teacher would help students in graphing the
table, they did not specify how the teacher would help or what explanations would
be provided as a resource.

103
As Ellie and Elliot continued depicting the lesson, they were working on how
to introduce the third task. They read and referred to their lesson plan of what their
intention was for the task. In the previous task, they had indicated that it was hard
to answer the question regarding predicting the distance of 10‐hour travel given
students’ current knowledge. Hence, the question may set up the need to graph the
given information in the table. They discussed students’ prior knowledge and
whether students would be able to graph points from the table.
213
Ellie So we, yeah. [pause 6s] We said that it was um, that question’s
hard to answer with the current knowledge that they have. So
maybe we—[pause 5s] So maybe right there she can start
graphing it?
214 Elliot Okay, do you‐‐ I mean do they even know about graphs?
215 Ellie I think we assumed they knew what a graph looked like and what
a table looked like but not in this like‐‐
216 Elliot Well if I said like find the point ((9,5)).
217 Ellie (Oh yeah.) I think they would know that.
218 Elliot Yeah, I think so too. [pause 5s]
After the agreement that students would know how to graph points, Elliot
typed:” Can we graph this?” right after the virtual teacher’s earlier response to
students in EE‐S07. He also chose a female‐neutral speaking expression on the
teacher’s face.

104
Figure 17. EE‐S07‐v1: The teacher responded to a student’s reply and suggested graphing the points.
Ellie commented that no student would respond to the teacher’s proposal
regarding graphing the points, so the teacher should proceed to graph the table in
the next slide. Elliot chose a slide template with the teacher writing on the left side
of the board. Then, after creating the speech bubble for the teacher, Elliot realized
that there was a table on the left side of the board, so the teacher should graph the
points on the right side of the board. Then he changed the slide template to the one
of the teacher writing on the right side of the board and created a caption box
written with “table” on the left side of the table in order to save the time it would
take to create the table.
Elliot’s changing of the slide background indicates that viewing the slide helps
them examine the board work they presented in class and allows them to think

105
about how to manage the board work. It also helps them to visualize the space and
the context of the classroom that they are engaged in.
After changing the slide background in which the virtual teacher was standing
on the right side of the board and writing, Elliot typed in the speech bubble:” So, if
we think about the numbers in the table as sets of two points, we can graph these
points, right?” and he asked Ellie’s opinion about the virtual teacher’s explanation of
the relationship between the table and the graph.
Figure 18. EE‐S08‐v1: The teacher was graphing on the right side, instead of left side.
230 Elliot And the table should still be there. So I guess, or on her other
side. [types] [pause 25s] What do you think?
231 Ellie I don’t know, I think sets of two points would be kind of
confusing. [Elliot: I know, I know.] But if you said so, um, the
number of miles traveled depends on how‐‐ how long the car is

106
gone, so we’ll say our X values are independent, y’know what I
mean, I‐‐ or the hours and the distance traveled is our dependent.
I don’t know that they—(I know, I don’t know that they would
know that either.)
232 Elliot (I feel like that would be kind of confusing too.)
233 Ellie Um…
Ellie and Elliot were discussing how to explain the connections between the
table and the graph, specifically the connection between the two variables in the
table and the coordinate points in the graph. Like what was proposed by Ellie in
Turn 231, she first described the two variables in the table, the relationship between
distance and time. Then she tried to relate to the notions of dependent and
independent variables and the coordinate values in a graph. As a result, both Ellie
and Elliot were not content with the idea.
They reviewed the lesson plan and found that the task was to graph the table.
In Ellie and Elliot’s lesson plan, two tasks were presented—the second task was
reading the table and the third task was graphing the table. However, the transition
from one task to another was absent in the text, which is what Ellie and Elliot were
working on at the moment. They were trying to make connections between two
presentations and find out how to better explain it to the students, but they had
difficulties in doing so.
So far, Ellie and Elliot had created eight slides. However, they were stuck at the
point where the virtual teacher needed to explain the connection between the table

107
and graph representations. Hence, the interviewer asked them to review the slides
that they had composed from the beginning.
They reviewed the lesson starting from the first slide. On the first slide, the
virtual teacher was introducing the table and asking a question based on the given
information from the table. When introducing the table, the virtual teacher was
saying:” This is a table that describes a trip to New York.” Elliot edited this
introduction and made it explicit that it is a car’s trip. Then he commented on the
slide:
241
Elliot … I feel like it should say, on the left side is the hours, just so—
just to say this basically, so we can see that the car travel total
distance 30 miles in the first hour.
As a result, after the virtual teacher introduced the context of the table, she
further explained what each column of the table represents: “In the left column, we
have the time in hours that the car has been driving. In the right column, it shows us
how far the car has gone.” (see Figure 19) Elliot claimed that there was a need for
the virtual teacher to do so because it would help students see the relationship
between the two columns.
245
Elliot …Um, because well, for‐‐ I guess, it’ll help them maybe see a
relationship between this—the hour and the distance, I guess. And
you’re really making it explicit, I don’t know how good they are at
reading tables, so… [pause 30s] [types]

108
Figure 19. EE‐S01‐v3: The virtual teacher’s instruction was revised.
They continued reviewing the slides. In Slide #6, three students were showing
uncertainty about the teacher’s previous question about predicting the distance
traveled after 10 hours. And a student responded to the question. When reviewing
this slide, Ellie commented that they needed to provide time for students’ thinking
about the question. Then Elliot typed in a caption box with “After a few moments.”
258 Ellie Wait, oh wait. I think you should say like after a minute or
something, like after thinking occurs.
259 Elliot Yeah. In a few moments. [Ellie: [nods]] In‐descript amount of
time. [pause 6s]
When Ellie and Elliot were composing Slide #6, Ellie had proposed that
students would need time to think in order to answer the teacher’s question.
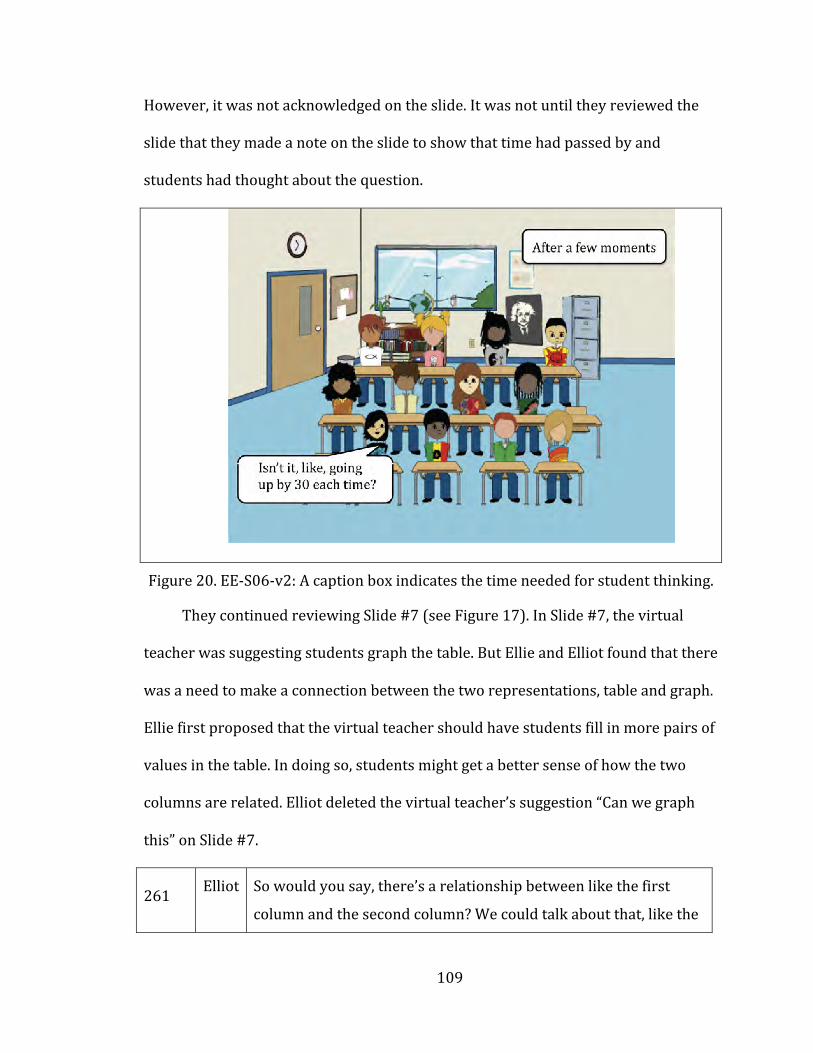
109
However, it was not acknowledged on the slide. It was not until they reviewed the
slide that they made a note on the slide to show that time had passed by and
students had thought about the question.
Figure 20. EE‐S06‐v2: A caption box indicates the time needed for student thinking.
They continued reviewing Slide #7 (see Figure 17). In Slide #7, the virtual
teacher was suggesting students graph the table. But Ellie and Elliot found that there
was a need to make a connection between the two representations, table and graph.
Ellie first proposed that the virtual teacher should have students fill in more pairs of
values in the table. In doing so, students might get a better sense of how the two
columns are related. Elliot deleted the virtual teacher’s suggestion “Can we graph
this” on Slide #7.
261 Elliot So would you say, there’s a relationship between like the first
column and the second column? We could talk about that, like the

110
time and hours or the time and distance.
262 Ellie Um.
263 Elliot Instead of saying can we graph this.
264 [Silence 7s]
265 Ellie Maybe she could say like, um, so we could continue‐‐ or like if the
table continued on then‐‐
266 Elliot Yeah, that’s good, that’s what we should do.
267
Ellie But then be like‐‐ but it might take us a while to‐‐ to like, can‐‐ are‐
‐ you fill in, you know, every hour and the distance traveled does
that make sense? But if we just graphed it—or maybe we could
just look at a graph and see it easier or something, or find a
relationship to‐‐
268
Elliot I think they should fill in a couple more values of the table, that’s a
good idea. Because that would help them see the relationship. Or
should we just talk about it?
However, when considering the extra time that might be spent on filling in
more values in the table, Ellie reflected on the goal of the lesson, which was to
introduce the slope. She was thinking about students’ prior knowledge. Students
might have known how to observe the pattern from a table. Since the goal of the
lesson was to introduce slope, the virtual teacher should spend time on introducing
the concept of “rise over run,” which was not yet covered in the lesson depiction so
far (Turn 269‐273).

111
Ellie then came up with a solution for considering both the time issue and the
filling of the table. She proposed that the virtual teacher work with students in filling
in more values in the table and suggest graphing to better see the relationship.
269
Ellie Um. I don’t know I feel like the‐‐ I don’t know. Like the main point
of the lesson is the slope [Elliot: You want to get to the graph?] and
hopefully she would have covered like‐‐ well no you want to get to
like finding the slope like rise over run or what it means and,
y’know what I mean?
270 Elliot Right. What are you saying‐‐ so would‐‐
271 Ellie Right, I would assume that, at this point she’s um… but they’ve
learned about maybe.
272 Elliot Found some patterns?
273 Ellie Yeah, found some relationships before.
274 Elliot Okay.
275 Ellie I don’t know.
276 Elliot So what do you think she would say next, we could fill out—well
did she ask‐‐
277
Ellie Well you could have her do a couple more, but then maybe like
say… I don’t know. That it’s‐‐ you know what, sometimes it’s not
going to be easy to just go in and fill in every line of the table, so
you might want to find a relationship or a way to‐‐
Hence, Ellie noted how to make a connection between the table and the graph.
Specifically, she identified the need for graphing a table, which is to better see the

112
relationship of the two variables from the table. The pair had not attended to this
issue when planning in text, and they were not aware of the issue when first
composing the slide either.
After the discussion, Elliot typed in Slide # 7 ”So there is some sort of
relationship between how long the car has been driving and how far it has gone?”
With Ellie’s suggestion, Elliot continued typing on the slide “Maybe we could see this
relationship better if we tried graphing these points.” The virtual teacher introduces
the need for graphing the table. She states a relationship between two variables in
the table, and explains that graphing may help to see this relationship. Ellie and
Elliot made a transition from the previous task of reading a table to the following
task of graphing the table. Such transition between two tasks had not been stated in
their lesson plan.

113
Figure 21. EE‐S07‐v2: The virtual teacher suggests graphing points help better see the relationship between the two variables in the table.
After revising Slide #7, Ellie and Elliot continued reviewing Slide #8 (see
Figure 18), the last slide they created before reviewing. In Slide #8, the virtual
teacher was explaining the relationship between the values in the table and the
points on the graph. However, they were not content with the explanation when
composing this slide.
When they were reviewing Slide #8, they agreed that they needed to
emphasize the connection between the two variables in the table and the x and y
values on the coordinate plane. They found that the explanation the virtual teacher
gave earlier was not clear, and thus deleted all the text in the speech bubble.
However, they had difficulty in coming up with a better explanation.
They expected that the virtual teacher would need to make the corresponding
relationship explicit between the two variables in the table and x and y value. Ellie

114
typed: “So if the number of hours the car has traveled is our x‐value and the total
distance is our y‐value,” However, they were still not certain how to address that
corresponding relationship when graphing points.
286 Elliot Yeah. [types] What’s the next slide say12?
287
Ellie There she is like solve X is the number of hours and Y is the total
distance traveled. [Elliot: Yeah.] Where’s the point where—yeah,
how would we graph or plot the first point on our table or
something. And…
288 Elliot Here, why don’t you type that. If we say the hours it’s like the X
value.
289 Ellie [types] Um, so I don’t know. So if… the number of hours the car
has traveled, oops.
290 Elliot Is our X value.
291
Ellie Is our… and the total distance is our Y value and I don’t know—
what would you—how do you… okay. [pause 5s] I don’t know. We
plot that, I don’t want to say like plot the first point.
When thinking about how to graph points with applying the values from the
table, Ellie showed her concern about using the word “plot” to represent the
graphing of the points. She wasn’t sure that students had known that an ordered
pair represents the coordinates of a point, thus knowing how to “plot” a point from
an ordered pair (Turn 295). Then Ellie and Elliot decided that after addressing the
two variables as x and y values, the virtual teacher asked students to find a point on
12 Elliot went on to check Slide #8 they created earlier.

115
the graph. She asked: ”how could I find where our first point on the graph is? What
two numbers should I use?”
291
Ellie Is our… and the total distance is our Y value and I don’t
know—what would you—how do you… okay. [pause 5s] I
don’t know. We plot that, I don’t want to say like plot the first
point.
292 Interviewer Why not say that?
293 Ellie Why not?
294 Interviewer Yeah.
295
Ellie I don’t know because I feel like maybe they don’t—maybe
they haven’t made the connection that (1,30) would be the
point y’know what I mean, like maybe they don’t know that
one and 30 go together or I don’t know. It’s hard when you
don’t know what the kids know. Um… I [pause 5s] maybe I
don’t know, she can plot the first point and say like, what does
this point tell me or, or how does this point relate to the table
or something.
296
Elliot I think she should just say something like… I think she should
just say something like what would our first‐‐ how could I
find where our first point on the graph is?
297 Ellie Okay.
298
Elliot [types] Like, maybe like what two numbers should I use? Just
like something like that. [pause 8s] Does that look okay? I
don’t know, I think they will pick up on that, I don’t think
we’ve said anything that’s too shocking to the kids, as long as

116
it wasn’t too fast or anything. This guy would probably
answer it, or girl.
The discussion around Slide #7 and Slide #8, in which Ellie and Elliot were
creating, reviewing and revising, shows that they became aware of the need to make
transitions between tasks. Specifically, they made efforts to make the connections
explicit between the two variables in the table, x and y values, and the coordinates of
points on the graph.
Figure 22. EE‐S08‐v2: The virtual teacher addresses the relationship between two representations.
After the virtual teacher posed the question in Slide #8, Elliot chose a slide
template of view of students as Slide #9. He commented that students would know
the answer. He first typed up the answer “1 and 30, maybe?” in a speech bubble, and
then suggested that the answer would come from another student who had not
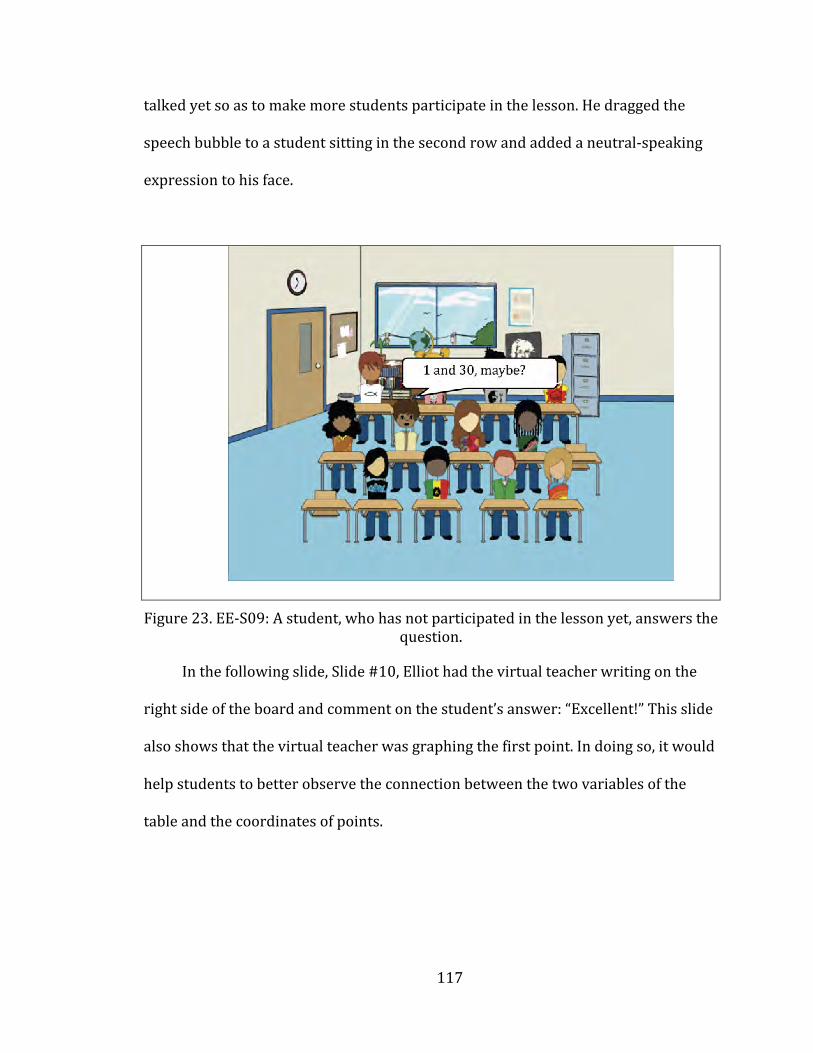
117
talked yet so as to make more students participate in the lesson. He dragged the
speech bubble to a student sitting in the second row and added a neutral‐speaking
expression to his face.
Figure 23. EE‐S09: A student, who has not participated in the lesson yet, answers the question.
In the following slide, Slide #10, Elliot had the virtual teacher writing on the
right side of the board and comment on the student’s answer: “Excellent!” This slide
also shows that the virtual teacher was graphing the first point. In doing so, it would
help students to better observe the connection between the two variables of the
table and the coordinates of points.

118
Figure 24. EE‐S10: The teacher is graphing.
In Slide #11, the graph was drawn on the right side of the board (see Figure
25). This graph consisted of a point and two numbers marked on x‐ and y‐axes. A
caption box with “table” was on the left side of the board. With both the table and
the graph on the board, the virtual teacher asked students to find the relationship
between the first row of two columns in the table on the left side of the board, and
the first point drawn on the coordinate plane on the right side of the board. Elliot
commented that this graphing process would be continued and he used a caption
box to indicate this process in the next slide (see Figure 26).

119
Figure 25. EE‐S11: Both the graph and the table are on the board.
Figure 26. EE‐S12: The teacher and students continue graphing points.
After repeating this process with the points (2, 60), (3, 90)….

120
Thus far, Ellie and Elliot had spent approximately fifty minutes in composing
twelve lesson slides. The interviewer then asked them to review the slides they
composed that far to see if they would make any revision. They reviewed their
depiction from Slide #6 to Slide #12, for which they had spent approximately thirty
minutes thinking of a better way to explain the transition between two
representations. They did not make any revision during or after reviewing these
lesson slides at this time.
Analytical commentary on Ellie and Elliot’s lesson depiction
Differentiating the lesson plan and Depict lesson slides
When Ellie and Elliot were first asked to depict their lesson, they intended to
copy their lesson plan. However, after they typed up the first question the virtual
teacher would ask, they realized that the teacher should have set up the question by
introducing the context of the table on the board and explaining the two columns.
Subsequently, they treated their lesson plan created beforehand as a reference
when depicting their lesson. They spent time thinking about the teacher’s action
and the students’ possible responses. This shows that the lesson plan could not fully
illustrate how the teacher would behave or interact during instruction. The activity
of lesson depiction allowed the participants to immerse themselves in the teacher’s
role and afforded them the opportunity to approximate the practice of teaching.
Attending to the interactions between teacher and students when depicting the lesson
The work of viewing slides afforded Ellie and Elliot the opportunity to attend
to the interactions between the teacher and students during instruction. For

121
example, when composing Slide #2, they intended to use the same template as in the
previous slide, in which the virtual teacher was present. However, later they
realized that there should be students’ responses to the teacher’s previous question.
Hence, they inserted a slide template with the view of students and hypothesized a
student’s possible response.
Attending to learning resources when depicting the lesson
The activity of viewing slides allowed the pair of participants to examine the
learning resources available for students to accomplish instructional tasks. For
example, when composing Slide #5 on a new template with a blank board, Ellie and
Elliot discussed what question the virtual teacher should use to prompt students to
make an inference from the given information. They became aware that the table
presented earlier should still be up on the board as a resource for students. Thus,
instead of using the new slide template of a blank board, they deleted it and
duplicated a previous slide. Viewing the slide they were going to compose helped
the pair of participants visualize and examine whether the contextual resources are
available for facilitating the students’ thinking and learning.
Attending to specific teacher moves when depicting the lesson
Another example also shows that viewing the slides allowed the pair of
participants to specifically consider possible teacher moves. When composing Slide
#8, in which the virtual teacher was supposed to graph the table on the board, Elliot
originally chose a slide template of a teacher writing on the left side of the board.
However, when Ellie and Elliot were working on what the teacher would say or do
in the slide, they realized that the table should still be on the left side of the board

122
and the virtual teacher would need to write or graph on the other side. In Slide #8 in
which the virtual teacher was going to make the connection between the table and
the graph, the pair of teachers thus needed to consider the availability of the table in
order for the students to have the table as a resource to graph the points on a
coordinate plane.
Reviewing lesson slides helps to examine and revise instructional moves
Reviewing slides is another important feature in Depict that allowed the pair
of participants to examine and modify their instructional moves. When Ellie and
Elliot were stuck at thinking about how to make a transition from reading the table
to graphing it, they reviewed the slides from the beginning. In Slide #1 in which the
virtual teacher was introducing the table, they realized they needed to explain the
two columns of the table respectively. The virtual teacher would thus help students
better see the relationship between the two variables. This move might also be
beneficial thereafter, when students were making the connection between the two
variables and an ordered pair of a coordinate point.
As the participants continued reviewing the slides, they made major revisions
on those in which the virtual teacher explained the transition between two tasks. In
the original Slide #7, the virtual teacher was proposing that students graph the table
without any explanation of reason or connection between the table and graph. In the
original Slide #8, the virtual teacher was giving direct instruction on how to transfer
the numbers from the table to the coordinates of points on a graph. However, when
reviewing these slides, they realized that what the virtual teacher said in Slide #7

123
and Slide #8 was not explicit enough to help students understand the relationship
between the two variables in the table and the ordered pairs of the coordinate
points.
In the revised slides, the virtual teacher first suggested a certain relationship
between the two variables in the table and proposed that graphing may clarify the
relationship. The virtual teacher then addressed the relationship between the two
variables and x‐and y‐ values and asked students to identify the first point on the
coordinate plane.
Making transitions between tasks when depicting the lesson
Although Ellie and Elliot had difficulty making the connection between the
table and the graph when depicting the lesson, through reviewing and revising the
slides, the participants were able to made a transition between two tasks. They
explicitly established relationship between two variables and x‐ and y‐ values
apparent to the students. Such transitions had not been addressed in their lesson
plan. And it was challenging for them when they were depicting the lesson.
Reviewing slides helped them specify the teacher’s moves in making such a
transition explicit for the students, so as to help them better understand the
connection between two representations.
Anticipating students’ verbal and nonverbal reactions
In addition to attending to the teacher’s actions, Ellie and Elliot anticipated
students’ possible verbal and nonverbal reactions. Such anticipation had been
absent in their lesson plan. When they first anticipated students’ responses in Slide
#2, they only attended to one student, who gave a correct answer. In Slide # 4, in

124
which students’ responses were expected after the teacher’s question, two students
were attended to. One student gave the answer and the other student who answered
the previous question also raised his hand, indicating he would also know the
answer. In Slide #6 in which students had to make an inference about information
beyond what is given, more students were involved. In addition to one student who
gave the correct answer, some students showed uncertainty in their expressions.
Furthermore, time was given for students to think about the question. In Slide #9, a
student, who was responding a question, was noted as one who had yet not
participated.
Lesson depiction allowed the participants to attend to instructional issues that
they had not considered when planning the lesson in text. Through interacting with
Depict, viewing or reviewing slides, they specified the teacher’s moves. They made
the virtual teacher set up the question by providing the context of the given problem
and explaining the given information. They intended to help students better
understand the question and answer it. They also provided time as a resource for
student thinking. They attended to consistent board content, so the information
previously presented on the board could serve as a resource for a later task. The
activity of lesson depiction also facilitated this pair of teachers’ thinking about
making a connection between two tasks. In particular, they made efforts in thinking
how to make the relationship between two representations explicit and
comprehensible to students. They also made such relationship verbally and visually
accessible to students. Finally, they were aware of the issue of students’

125
participation in class. Not only did they attend to individual students, but also to
multiple students at the same time.
Lesson depiction allowed this pair of participants to attend to issues of making
resources available to students. It also made them re‐examine the goals of tasks they
intended for students to achieve by specifying the teacher’s actions. Moreover, it
allowed them to identify the operations that students would need to perform in
order to accomplish the tasks.

126
Case #2: Pamela and Sienna’s work In Pamela and Sienna’s work, four tasks from their lesson plan were
anticipated through lesson slides in Depict. They implemented these four tasks with
eight lesson slides. They provided a real‐life problem and intended for students to
represent the problem in a table and then graph the table. However, their lesson
plan was not very articulated and the mathematics problem in the lesson was not
appropriately chosen regarding its mathematical sophistication.
Anticipating Task #1 In Sienna and Pamela’s lesson plan, they wrote:
Discuss issue of walking up stairs at a constant pace (3 stairs in 3 seconds) Ask how long it would take to walk up 100 stairs
Figure 27. The first task in Pamela and Sienna’s lesson plan.
It can be assumed that the goal of the task is to ask students to predict how
long it would take to walk up 100 stairs. The resource is the given information that
one walks up 3 stairs in 3 seconds. It is not clear in their text how the teacher will
discuss the issue regarding walking up stairs and what kinds of operations that
students would need to do in order to answer the question regarding the time taken
for walking up 100 stairs.
When beginning to compose the first lesson slide, Sienna and Pamela seemed
to intend to copy what was written on their lesson plan. Sienna first had the virtual
teacher introduce the day’s topic: ”Today we are going to be discussing slope, but
first we’re going to relate this to walking up stairs at a constant pace.” Then based

127
on their text, the teacher was supposed to ask the question: “how long it would take
to walk up 100 stairs?” Sienna typed in the second speech bubble on Slide #1: ”How
long would it take to walk up 100 stairs?” When this pair of participants viewed this
slide, they realized that they needed to include many details that were not included
in their lesson plan.
Figure 28. PS‐S01‐v1: The virtual teacher asks a question without given information.
Then they modified the virtual teacher’s question to read: ”how long would it
take to walk up 100 stairs if you walk up one stair every second?” Sienna and
Pamela realized that the question posed to students should include given
information, so that students would be able to answer.
In the first version of the question: ”How long would it take to walk up 100
stairs?” it did not include any given information and it is impossible to answer. It

128
was not until Sienna and Pamela viewed the slide that they noticed that the question
needed to include the given information.
Figure 29. PS‐S01‐v2: The virtual teacher asks the question with given information.
After finishing Slide #1, Sienna proposed to have some responses from
students. She suggested that students might not be able to answer the question, but
could make a deduction from the given information13. Further, Sienna suggested
that the virtual teacher could later ask a student to graph the points using the
numbers from other’s responses.
Instead of only anticipating correct answers from students, Sienna proposed
what students might be and might not be able to do: Students might be unable to
answer the question right away, but they might be able to deduce from the given
13 The pair’s expectation on students’ capability on the assigned task was low. The analysis here intends to identify how lesson depiction facilitates prospective teachers’ attention to instructional details. The mathematical sophistication of the assigned task, the prospective teachers’ perception of students’ ability or the quality of the text lesson plan are not the foci of this piece of analysis.

129
information. She also considered the continuity and relativity of the two consecutive
tasks that students’ initial responses could be taken as a resource for graphing later.
When anticipating students’ responses, Pamela selected a slide template with
the view of students as Slide#2. She then typed up a response from a student sitting
in the second row. When thinking about what expression this student might have,
Pamela suggested that this student would have a “duh” expression. However, they
could not find any expression in Depict that corresponded to what they wanted to
show. As a result, Pamela chose a male‐neutral expression and described the
student’s thought in a caption box. In the caption box, Sienna typed: ”Student is
thinking ‘duh, this is obvious’.”

130
Figure 30. PS‐S02‐v1: The student was thinking that the question was too easy.
Later, Pamela and Sienna agreed that there should be other possible responses
from students. Pamela suggested that there be a student who might not understand
the previous student’s answer. And Sienna suggested the thought about the
straightforward nature of the question could come from another student.
The student’s thought about the nature of the question was originally assigned
to the student who answered the question. However, when the pair viewed the
caption box containing “duh” response on the slide, Sienna suggested this response
should come from another student. Hence, Pamela dragged the caption box to the
bottom right corner of Slide#2, indicating the first student from right in the first row
was thinking that. And she moved the mouse over to the left side of the slide and
suggested that “… we can also have someone from over here, that’s kinda say, ‘well I
don’t understand why—where’s he getting these from?’” A question was then posed

131
from the first student from left in the first row: ”why did you skip three?” This
student also had a female‐confused expression and was raising her left hand. The
student who thought the question too easy had a male‐bored expression. Students’
verbal and nonverbal responses in Slide#2 to the virtual teacher’s question were not
planned in the text.
Figure 31. PS‐S02‐v2: Multiple students think and act differently at the same moment.
In Slide#2, the pair of participants involved three students in the class and
they also attended to the interactions among the students. These students had
diverse verbal or non‐verbal responses. One of the students was able to explain his
thinking process aloud but could not answer the question. Another student was
thinking the question was too easy. One other student did not understand his
classmate’s answer and expressed her confusion.

132
Analytical commentary on Task #1 The first task in the lesson plan asked students to predict the time spent on
walking up 100 stairs. When writing the plan, the pair of participants had not
attended to any resources and operations that students would need to implement
the task. However, when depicting the lesson, resources and operations became
apparent to them. For example, the virtual teacher posed the question:” how long
would it take to walk up 100 stairs if you walk up one stair every second?” The given
information of one stair per second was not explicit in the lesson plan. When
composing the slide, Sienna and Pamela did not provide this given information
either; it was not until they read what they initially typed that they realized what
they needed to include.
Students’ verbal and nonverbal responses became apparent to the pair in
lesson depiction. In Slide #2, three students were involved in different thinking
about the teacher’s question. One shared his thinking process but did not
necessarily answer the question. Another thought the question was easy and thus
looked bored. A third student could not follow her classmate’s answer and was
confused. The participants anticipated students’ thinking along different lines. While
some are thinking about how to answer the question, others are thinking about the
nature of the question itself.
Anticipating Task #2 The second task in Sienna and Pamela’s lesson plan involved having students
draw a table on the board to show sets of points that refer to the numbers of steps
and the time taken. The goal of this task is to use a table to represent the

133
relationship between the two variables. The resource was not explicitly mentioned.
The pair did not specify what kinds of operations students would need to perform in
the task.
Suggest having one student write a table format of the points. The points here are (0,0), (1,1), (2,2), (3,3) which are # of steps and time in seconds.
Figure 32. The second task in Pamela and Sienna’s text‐based lesson plan.
When depicting the lesson, Sienna referred to the task in the text and
suggested the virtual teacher ask a student to represent the previous answer in a
table. She further commented that this task of representing the sets of numbers in a
table would help students better understand the question of walking up stairs in a
constant pace.
202 Pamela Okay so can we go onto the next slide and have the teacher make
some comments.
203
Sienna Yeah then she can say why doesn’t someone come up here and
put these in a table so then maybe they would under—they would
connect it a little bit better to what they hopefully would have
previously done.
Figure 33. Sienna suggests the task help students better understand the question.
In Slide#3 (see Figure 34), the virtual teacher asks the student who answered
the previous question in Slide#2 to come to the board and present his answers in a
table format. They named the student Bob.
x y

134
Figure 34. PS‐S03: The virtual teacher asks the student to present his earlier answer in a table.
In the next slide, this pair intended to show the boardwork that Bob had done.
Pamela chose a slide template with a blank board as Slide#4. She then opened the
drawing tool and drew a big cross to represent a double entry table. Pamela typed
three pairs of numbers in the two columns in which the numbers obtained from
Bob’s previous answer. Sienna reminded her partner that she needed to write
“stairs” and “seconds” at the top of each column. Then Sienna typed, “seconds” and
“stairs” in the top left column and the top right column respectively. After the
headings were typed in the table, Pamela asked whether x‐ and y‐values should be
reversed in the two columns. However, they did not have other resources to
confirm which way was correct. They decided to leave them as what Sienna had
typed, which was the x‐value on the left and the y‐value on the right. Then they
attached the table to the board.

135
Sienna described Bob’s action in a caption box that Bob drew the table without
talking. Sienna and Pamela explained that high school students usually do what they
are asked to do and do not make more efforts unless they are asked to do so. They
also commented that Bob thought that everyone else should also understand what
he had written on the board, so there was no need to give further explanations.
A speech bubble in the bottom right corner coming from the virtual teacher
indicates that she appreciated Bob’s work. When viewing this slide, Pamela
suggested that the virtual teacher should ask Bob to further explain his answer and
respond to Susie’s earlier confusion. Sienna then typed up the virtual teacher’s
question to Bob and described the teacher’s action in a caption box. This teacher’s
move had not been included in their lesson plan.
Before the pair of participants went on to create the next slide, they viewed
the current one. Pamela proposed that there should be a description about Bob’s
returning to his seat after drawing the table (see Figure 35).

136
Figure 35. PS‐S04: Bob presents his work on the board.
In this slide, the virtual teacher’s and Bob’s actions were described explicitly in
caption boxes. First, Bob came up to the board to draw a double entry table to
represent the relationship between the time taken and the total steps walked up.
However, he returned to his seat without explaining his work on the board. The
virtual teacher acknowledged Bob’s work and then prompted Bob to explain more
in responding to Susie’s question.
In the next slide, Sienna and Pamela both agreed to have a slide template with
the class of students because Bob had just returned to his seat and he had to
respond to the teacher’s request. Pamela commented that Bob would not be able to
explain the question well, because a typical high school student would think the
answer is obvious and could not think of any further explanation. As a result, Bob
would respond: ”It works for 3 too, but you don’t need to include every number.”

137
313
Pamela Okay. He’s probably not going to be the best at explaining it so he’s
probably just going to say, I don’t know, that’s just how it works? I
mean, I think that would be a typical response in a classroom from
a kid, it’s just‐‐ well it just works.
314 Sienna Mmhmm.
315 Pamela “Just trust me.”
Because Bob did not provide further explanation of his answer, Sienna
suggested that Susie would still be confused and someone else in the class could
help in explaining to Susie. Then Pamela put a confused expression on Susie’ face.
Another student, who sat in the third row and later was given an excited expression,
made further explanation regarding the pattern between the time taken and the
steps.
After the student’s explanation, a speech bubble in the bottom right corner
contains the virtual teacher’s question: “Does that make sense to everyone?” Pamela
then suggested that after the explanation, other students had “an understanding of
where the data points are coming from or they see the pattern at least.” This
comment shows that Pamela anticipated the goal that the students would need to
accomplish in the current task. This goal had not been specified in the pair’s lesson
plan.
A caption box beside the teacher’s question then described that the students in
the class would have a better understanding of the relationship between the two

138
variables after the student’ further elaboration of the table. In Slide #5, it illustrates
the interactions among the students in the lesson. For example, Bob gave an answer
but could not provide a clearer explanation. Susie was confused by Bob’s unclear
answer. Then another girl jumped in helping explaining the relationship between
the two variables.
Figure 36. PS‐S05‐v1: Multiple students are involved in the lesson.
Analytical commentary on Task #2 The second task in the pair’s lesson plan was to have students present sets of
order pairs of two variables in a table. However, the goal of the task had not been
clearly stated. When depicting this lesson, Sienna explicitly stated that the
representation of a table helps students better identify the relationship between
two variables, thus understanding the stair problem. Hence, through the

139
representation of the task in Depict, the pair of participants identified the
operations.
The activity of lesson depiction encouraged the participants to individualize
students and anticipate different students’ possible responses. For example, in Slide
#3 (see Figure 34), the student, who had answered the question earlier, was called
to the board by his name (Bob) to draw a table. Other students were also identified
by name. Individualizing students allows the participants to see students as more
than a class. It then allows the participants to anticipate that students may have
diverse reactions or thoughts. They had not individualized students in their lesson
plan.
Seeing students as individuals allowed the pair to elaborate their
characteristics. In Slide#4 (see Figure 35), they anticipated that Bob would draw a
table on the board without explaining it. The pair agreed that a typical high school
student would not make more effort unless asked to.
The activity of lesson depiction provided this pair of participants a context to
discuss mathematics. When drawing a table as a student’s board work, the pair
discussed where to place the two variables as x‐ and y‐values in the two columns. It
showed that specifying board content on lesson slides provides an opportunity for
participants to discuss mathematics. The discussion revealed a need for additional
resources to push the participants to articulate the mathematics in their lesson. The
creation and visualization of the board work in Depict provides a context for
examining the mathematics, but such supports were absent in the text‐based format
of lesson plan.

140
The pair of participants developed a series of teacher‐student interactions in
lesson depiction that were not noted in their lesson plan. For example, in Slide #4,
the virtual teacher asked Bob to elaborate his answer. This move resulted from
Susie’s confusion from a previous slide.
Reviewing lesson slides Sienna and Pamela were prompted to review their lesson slides from the
beginning after they implemented the second task. They did not make any
comments or revisions until Slide #5. This slide includes several students
interacting simultaneously. When the pair was reviewing this slide, Sienna
commented that because there were multiple dialogues in the same slide, a caption
box was needed to describe the sequential relationship of the students’ involvement.
In addition, a student who was involved in the dialogue was identified with a name.

141
Figure 37. PS‐S05‐v2: A caption box in the upper right corner is added to illustrate the sequential relationship of the students’ involvement.
Anticipating Task 3 The third task in Sienna and Pamela’s lesson plan was to graph the table. The
activities in this task involve graphing points and connecting them in a line (see the
figure below). However, the goal of this task was not clearly stated. The resources
for graphing are sets of numbers from a previous answer, students’ prior knowledge
of graphing and classmates’ cooperative work. They did not specify the operations
required in the task.
Ask another student to plot these points on a graph with class help and draw a line connecting these points. This will check their prior knowledge.
Figure 38. The third task in Pamela and Sienna’s lesson plan.

142
The pair created a slide template with the teacher standing at the center facing
students as Slide #6. The virtual teacher said:” Maybe it would help14 to see this on a
graph. Does anyone want to come up and show how to graph the points in Bob’s
table?” The virtual teacher explicitly suggested that graphing points helps students
to see the relationship between the two variables of time and the amount of stairs.
This is also the goal of the graphing task.
Sienna suggested there be a student who would voluntarily graph the points.
And Pamela agreed and proposed that Susie, the girl who was confused, would
know how to graph the points. Pamela further suggested that even though Susie was
still confused, she could better see the pattern of change between the two variables
through graphing.
375
Pamela Oh yeah, we can have like um, Susie like oh, I know this,
y’know, like at least she knows how to do that but she’s still
confused and she goes up to do it she’ll maybe start to see
the pattern the one stair every second two stairs every two
seconds, so she can say oh, well I know how to graph.
In Slide#6, Susie raised her hand and said she knew how to graph the points
from Bob’s table (see Figure 39). A caption box described that Susie was not
frustrated anymore.
14 Sienna later revised it to” Maybe it would be helpful to see…”

143
Figure 39. PS‐S06‐v1: Susie knows how to graph and she could better see the change of the two variables through graphing.
In the next slide, the participants intended to show the board work that Susie
made. Pamela selected a slide template with a blank board as Slide#7. After viewing
the template, Pamela commented: ”Okay so we had the white—the board from
before which was the points, which would be on the left, right?” She realized that in
order for Susie to graph points, the sets of numbers from the table needed to be on
the left hand side of the board as a resource for her.
Pamela started graphing Susie’s board work on the right side of the board in
the drawing tool. She first sketched two segments perpendicular to each other in
order to represent two axes on a coordinate plane. Then she put four roughly
equally distributed hash marks on each axis. She then put three coordinate points
on the plane, at the positions of (1,1), (2,2), and (4,4). A caption box described
Susie’s actions of graphing points and returning to her seat.

144
Figure 40. PS‐S07: A caption box describes the student’s actions.
Analytical commentary on Task #3 The third task was to ask students to graph points from the table presented
earlier. However, the goal was not stated in the pair’s lesson plan. When depicting
the lesson, the pair explicitly identified that the goal of graphing points from a table
is to help students see the relationship of two variables. Hence, lesson depiction
afforded the pair opportunities to identify the goal of their intended task. In this
case, the goal was to connect what had been done previously. When planning the
lesson in text, they only considered activities, and did not make the connection
between two adjacent tasks. Lesson depiction allowed the participants to see the
tasks as connected.
The activity of lesson depiction allowed participants to anticipate students’
work and allowed them to examine whether they had provided resources for

145
students to accomplish the task. For example, when composing Slide#7 in which a
student was supposed to draw a graph on the board, the pair of teachers knew the
table presented earlier should be on the left side of the board as a resource for the
current task.
Anticipating Task #4 The fourth task in Sienna and Pamela’s text‐based lesson plan was to observe
patterns from the graph. The goal of this task is to have students recognize that the
two variables change at the same rate. The resource available for students is the
table and the graph on the board. In their text, the pair intended for the teacher to
point to both representations on the board, to help students to observe the constant
rate of change. However, it is not mentioned what kinds of operations students need
to perform to make such observation.
Ask: What do notice about how the time change (how many seconds have passed) as you take additional steps on the stairs? As one variable (point to graph & table) gets bigger, the other gets bigger at the same rate, so you aren’t speeding up and slowing down. This is a positive slope.
Figure 41. The fourth task in Pamela and Sienna’s lesson plan.
After the pair finished composing Slide #7 in which a student came up to the
board and graphed points, they discussed how to make students recognize the
pattern between the two variables from the current graph. Sienna proposed to have
the teacher or a student connect the three points in a line, so students would
identify that the point (3,3) is on the line too. Later, however, they reflected on the
goal of the graphing points, which is to have students observe the relationship
between the two variables in the table and the graph. They noted that it is not

146
important whether the line was drawn. They indicated that students need to notice
the pattern that as the time increases and it gets farther on the x‐axis, the other
variable increases on the y‐axis.
When they identified the operation that students were expected to perform,
which was to observe the two variables increase accordingly on the x‐and y‐axes,
they found out that there were no labels on the axes for students to refer to.
Therefore, Sienna proposed to have the virtual teacher write “seconds” and “stairs”
on the two axes in the following slide.
Pamela selected a slide template with teacher standing at the center facing
students as Slide#8. Then Sienna went into the drawing tool to label the two axes
with “stairs” and “seconds.” When Sienna was doing so, Pamela further suggested to
label “x” and “y” on the two axes, because, she argued, students commonly confuse
the x‐axis and y‐axis. After amending the graph in the drawing tool and attaching it
to the board, Sienna made a caption box indicating that the virtual teacher would
label the two axes and remind students the importance of labeling them.
When considering what the virtual teacher would say next, Pamela pointed to
the lesson plan and suggested that the virtual teacher would ask students for what
they had noticed about the time change in relation to the distance change. Thus
Sienna typed up in a speech bubble: ”What do you notice about the amount of stairs
we’ve gone up as more time passes?” Pamela then suggested a student’ response
could come from one who had not yet participated in class. They anticipated that
this student would observe that the points on the graph formed a straight line. This
was based on the pair’s earlier discussion that neither students nor the virtual

147
teacher had to draw the line connecting the points on the graph, but students would
need to identify the pattern of change between two variables. Later, the virtual
teacher commented on the student’s response with further elaboration that the
change of two variables is constant.
Figure 42. PS‐S08: The virtual teacher reminds students to label the two axes. A student who had not yet participated answers the question.
Analytical commentary on Task #4 The activity of lesson depiction encouraged the participants to examine the
goal of the intended task and identify needed and relevant instructional moves.
When discussing whether there was a need to have a student or the virtual teacher
draw a line connecting points on the graph, the pair reflected on the goal of the task:
to have students observe the relationship between two variables. Hence, they
decided that it was not critical to draw a line connecting existing points on the
graph. Besides, the pair also noted that the operation that students would need to

148
perform was to observe the pattern that as one variable increases on x‐axis, the
other variable increases as well.
The activity of lesson depiction prompted the participants to examine the
resources they had made available to students. After determining the operations
that students might need to perform as identifying the constant increase pattern of
two variables, the participants realized that there were no labels on the two axes for
students to refer to were they to make the observation regarding two variables.
Hence, in the next slide, Slide #8, the pair had the virtual teacher label the axes and
remind students to do so. In addition, when labeling the two axes with “seconds”
and “stairs”, Pamela further suggested labeling with “x” and “y.” She recognized that
students commonly confuse the x‐axis and y‐axis. This possible confusion was not
recognized in their lesson plan or when they started depicting the slide. It is only
when they had the coordinate graph visible on the board that they identified a key
concept about which students might get confused.
The consideration of the sequential classroom interactions helped the
participants re‐examine their earlier instructional moves. When the pair made the
coordinate plane, they had not labeled the two axes. They did not become aware of
the omission until they were considering the following events. As a result, they
turned this omission into a virtual teacher’s reminder to students of the importance
of labeling the axes. This suggests that the activity of lesson depiction allowed
participants to see the lesson sequentially and thus helping them to examine issues
in instruction that they had not been previously aware of.

149
The activity of lesson depiction allowed the pair of participants to attend to
different individual students. For example, when anticipating students’ possible
responses after the virtual teacher’s question in Slide#8, the pair proposed to have a
student who had not yet participated in the class answer the question.
Analytical commentary on Pamela and Sienna’s lesson depiction
Differentiating the lesson plan and Depict lesson slides
Similar to other participants, Pamela and Sienna intended to copy their lesson
plan when asked to depict their lesson. They copied the first question the virtual
teacher would ask on the lesson slide. However, after typing it up in a speech
bubble, they realized that they had not provided enough given information for
students to complete the task. Consequently, they included more information so that
students could answer the question. This instance seems to suggest that even
though the lesson plan had guiding questions that prompted the participants to
attend to teacher, students and mathematics, the participants had not been
completely aware of detailed instructional issues. Depicting the lesson seemed to
help them become aware of some details previously omitted about instruction in
their planned lesson.
Pamela and Sienna attended to other instructional details in their depicting of
the lesson that they had not considered in their lesson plan. I will now illustrate
these details in the following sections.

150
Individualizing students
The pair of participants saw students as individuals by naming them. For
example, in Slide#3, the virtual teacher asked a student, named Bob, who answered
the previous question to present his answer on the board. In later slides, other
students were also identified by names. In addition, in Slide#8, a student who they
noted that had not yet participated in class, answered the question. Individualizing
students seems to help the participants to anticipate that students may have diverse
thoughts or responses. It also appears to help the participants to anticipate the
interactions among students.
Attending to students’ verbal and nonverbal reactions
This pair of participants anticipated students’ possible verbal and nonverbal
reactions when depicting their lesson. Such anticipation was not included in their
lesson plan. For example, in Slide #2, three students were involved verbally or
nonverbally in responding to the virtual teacher’s earlier question. While a student
shared his thinking process aloud, another student was confused and questioned his
classmate’s answer. A third student was bored with the thought that the question
was too easy for him.
Elaborating the goals of mathematical tasks
When depicting their lesson, Pamela and Sienna had opportunities to discuss
and examine the goals of the tasks in their lesson plan. For example, the second and
third tasks from their lesson plan were not clear regarding the goals and operations
that students would be engaged in. However, when creating the lesson slides, they

151
elaborated what they expected students would be able to achieve and what kinds of
thinking process they anticipated students would have.
Examining mathematical representations on the board
The activity of creating board content in Depict provided a context for the
participants to discuss mathematics. When drawing a double‐entry table on the
board, the pair had a different understanding of where to place the two variables as
x and y values in the two columns. Their discussion revealed that their
mathematical knowledge in teaching was limited and showed a need for additional
resources for developing such knowledge. However, it seems to suggest that the
creation and visualization of the board content provides a context for examining
their understanding of mathematics and the ways in which they intended to present
in their lesson.
Identifying resources for students
The pair of participants became aware of the need of resources for students to
complete the tasks when depicting a lesson. Specifically, the activity of creating
board work allowed the pair to attend to the sequential relationship between two
adjacent tasks and to provide resources from a previous task for completing the
current one. For example, in the third task of the lesson, the pair intended to ask a
student to draw a graph on the board. When creating Slide #7, the pair specifically
noted that the table presented earlier should be on the board as a resource for the
current task.

152
Case #3: Serena and Beth’s work Beth and Serena depicted three of the tasks they had planned and discussed
the fourth. In this section, I only compare and discuss these tasks. When depicting
the lesson, Serena and Beth decided to modify the task structure, that is, to integrate
two of the tasks. As a result, two tasks were represented with eleven lesson slides,
and they discussed the last task without composing lesson slides due to time
constraints. These three tasks involved observing the differences of two graphs with
different slopes, identifying slope from linear equation and finding slope from the
change pattern of sets of points in a table.
Anticipating Task #1 In Beth and Serena’s lesson plan, the first task is to have students identify the
differences between positive and negative slopes of lines shown in graphs. Two
resources are provided for students to accomplish the task. First, graphs of two lines
with different slopes are shown to students. Second, students’ prior knowledge
about slope or linear function may help them better relate to how it is represented
in graphs. The operations students were required to perform include applying their
prior knowledge and observing that the two graphs go in different directions. After
the introduction of positive and negative slopes, the pair intended to give a brief
introduction of the day’s topic regarding the definition and representations of
slopes.

153
Show students 2 graphs Ask students: (1) what is different about these 2 graphs? (expected student response: one goes one way and the other goes another way) (2) Why do they “go different ways”? Tell students that different slopes are different. One slope is positive and one is negative. Refer to prior knowledge: (When you have learned about slope and /or linear functions before) We will focus on what slope means, how it’s defined; how we find it and different ways it is represented.
Figure 43. The first task in Beth and Serena’s lesson plan.
When composing the first slide, Serena selected a slide template with the
virtual teacher writing on the board. Based on their lesson plan, Serena first drew
two sets of coordinate axes side by side using the drawing tool. She then drew a line
on the left coordinate system. The line was stretched from the lower left corner to
upper right corner, indicating its positive slope. Then she drew another line on the
right coordinate system. The line was stretched from the upper left corner to lower
right corner, indicating its negative slope. None of these lines passed through the
origin of the coordinate system.
After Serena drew the graphs, Beth suggested labeling the x‐ and y‐axes. The
labeling of axes had been missing in their lesson plan. Serena then labeled the axes
on the two graphs and attached it to the board (see Figure 44).

154
Figure 44. SB‐S01: The virtual teacher is drawing two graphs on the board.
After the virtual teacher presented the graph on the board, the pair of
participants planned to have her turn around facing students and ask the question
about the differences between the two graphs. Serena selected a slide template with
the virtual teacher standing at the center facing students. She then suggested
posting the graphs drawn earlier on the left side of the board. Beth identified that if
the graph was posted on the left side of the board, then the virtual teacher had to
stand aside in order not to block what had been presented on the board. Hence
Serena changed the slide template to the one with the teacher standing on the right
side of the class. Then Beth typed in a speech bubble to have the virtual teacher ask
students to compare the differences between the two graphs on the board (see
Figure 45).

155
Figure 45. SB‐S02: The virtual teacher is standing aside to not to block what is presented on the board.
Serena duplicated Slide#2 as Slide#3 because the pair intended to keep the
board content the same in Slide#3. The pair planned to have a student respond to
the teacher’s question. They anticipated that a student, who they named Jamie, and
who was sitting in the first row, would have an answer. Jamie was in the class that
the pair was observing in their field placement. Beth first typed up Jamie’s response:
“One goes one way and the other goes the other way.” This response was copied
from their lesson plan. After typing the response up on the slide, the pair read
through it and decided to revise it to “One graph goes one way and the other graph
goes the other way.”
Later, according to the lesson plan, the virtual teacher was supposed to ask a
follow‐up question about the reason of the differences between the two graphs.
Beth copied from their lesson plan and typed in a speech bubble: ”In response to

156
student: Why do the graphs go different ways?” After viewing the question in the
speech bubble, Beth suggested to have the virtual teacher ask: “Why do the graphs
go different directions?”
Figure 46. SB‐S03: The student’s response and the virtual teacher’s follow‐up question were modified from those written in the lesson plan.
Serena duplicated Slide#3 as Slide#4 to keep the same board content in the
background. The pair read their lesson plan and discussed what would happen next.
In the text, they had planned to have the teacher tell students that the slope of one
graph is positive and the other is negative. Beth reflected that if a question was
posed in the previous slide, then there should be responses from students or the
virtual teacher would have to answer herself. However, when considering the
typical teacher‐student interactions in the class they observed in the field
placement, they anticipated that the students would not respond and the teacher
would have to explain herself.

157
143
Beth Well okay so we asked why the directions are different.
Someone is going to respond unless we answer our own
question. (So do you want the same person to respond?)15
144 Serena (Do you think the same person would respond?)
145 Beth I think we assumed they wouldn’t.
146 Serena Yeah I don’t think—I don’t know if they would. Last Thursday
they wouldn’t have.
147 Beth Yeah that’s true.
148 Serena But…
149 Beth Um, I honestly—I don’t think they would respond. So‐‐
150 Serena So I think we should just say—just give the answer to the
question that she just asked.
151 Beth Yeah we’ll say like, we’ll do the little thingy with the caption
and it’s like no student responded so then we responded.
Later, they also reflected that even though there was no response from
students, the question posed earlier was to set up the need for the following
instructional activities.
166 Beth Plus I think we asked that question intentionally knowing
they wouldn’t know the answer so that‐‐
167 Serena It sets up the need for what’s coming next.
15 Parentheses indicate overlapping speech.

158
Hence, instead of composing the slide using the duplicated background with
the graph on the board and teacher standing in front of the class, Serena inserted a
new slide as Slide#4 with a blank background and typed in a caption box to note
that no students responded the teacher’s question (see Figure 47).
Figure 47. SB‐S04: This slide was inserted to show the students’ reaction at the moment.
In the following two slides, the virtual teacher explained that the two graphs
have different slopes. When the participants were composing this slides, they
commented that they would walk around the classroom and point to the graphs
when explaining. The pair assigned pointing gestures on both slides as to show that
the virtual teacher pointed to the graph when referring.
No student responds to this question posed by the teacher.

159
Figure 48. SB‐S05: The virtual teacher points to the graph explaining it is a positive slope.
Figure 49. SB‐S06: The virtual teacher points to the graph with a negative slope.

160
In each of the two slides above, a pointing gesture was assigned to illustrate
that the virtual teacher points to the corresponding graph when explaining. It shows
that the participants were able to ignore the disbelief of the representation itself
and make use of the representation of lesson slides to illustrate their anticipation of
the lesson.
Analytical commentary on Task #1 The creation of board content in Depict allowed the pair to visualize and
examine the details they intended to present. When the pair planned their lesson in
text‐based format, they intended to present two graphs with a positive and a
negative slope respectively. However, they sketched the graphs without labeling the
axes. When depicting the lesson, they copied the two graphs from their lesson plan
to the board in the drawing tool. After viewing what was drawn on the board, they
realized that they needed to label the axes.
The work of viewing slides helped the participants to visualize and modify the
board work and the virtual teacher’s sequential moves in the classroom. For
example, when beginning to compose Slide#2, they intended to have the virtual
teacher face students and ask them questions. Thus the pair selected a slide
template with the teacher standing on the left side of the board. When viewing the
selected template, the participants realized that the board work presented earlier
was on the left side. In order not to block what had been presented on the board, the
virtual teacher should stand on the right side instead. Visualizing the classroom
setting on lesson slides provided the participants a context to examine what had

161
happened before and what should happen subsequently regarding the board work
and the teacher’s moves.
The activity of depicting a lesson enabled the participants to articulate what
they, as the teacher, should say to students. It also helped them to anticipate student
responses. When composing Slide#3, the pair intended to follow their lesson plan to
determine the teacher’s question and a student’s response. However, they found
that they would need to articulate the dialogues. Although it is not clear why the
pair of teachers modified the dialogues, it is apparent that lesson depiction provided
the opportunity for them to examine the dialogue they intended.
The activity of depicting a lesson helped the participants to anticipate
interaction between the teacher and students. For example, viewing the slide
template (duplicated from Slide#3 in which the virtual teacher posed a question)
enabled the pair to realize that there should be students’ responses after the
question, or the teacher would have to answer herself. This interaction had not
been attended to in the pair’s lesson plan.
Further, when anticipating the interaction between the teacher and students,
the pair referred to typical teacher‐student interactions in the class they were
observing in their field placement. They hypothesized that no students would
respond. As a result, they added a blank slide describing that no student responds at
the moment.
When depicting their lesson, the pair attended to specific behaviors they
would enact. For example, in Slide#5 and Slide#6, they commented they would walk
around and point to the graphs on the board specifically when explaining. The

162
virtual teacher used gestures to point to the graphs. These specific moves
demonstrate that the pair immersed themselves in the context of classroom
explaining and interacting with students verbally and nonverbally. However, such
anticipation of teacher’s moves was absent in their lesson plan.
As can be seen on Slide #5 and #6, the virtual teacher was originally talking to
the class using her right arm. However, a pointing gesture also appeared to indicate
that the virtual teacher was pointing to the graph. The pair of participants made a
note in the virtual teacher’s speech bubble, explaining the pointing action. They
were aware of the limitation of the representation and had written description to
compensate. They seemed to neglect the realism of the representation of lesson
slides; instead, they made use of this media to illustrate what they intended to
happen.
Transitioning from Task #1 and Task #2 At the end of the first task of their lesson plan, Beth and Serena intended to
give students a brief introduction to the day’s topics. When depicting the lesson, the
pair intended to follow what had been written in the text. They discussed whether
their students would understand the virtual teacher’s introduction involving
multiple topics. They reflected that the students in the class they were observing in
the field placement were used to hearing long introductions from their teacher.
205
Beth Do you want to shorten that at all, I think it’s kinda long. I
don’t think they’ll focus on what slope means, how it’s
defined, how will you find it in different ways it’s represented
it, is that too long?

163
206 Serena I think they are used to hearing things like that.
207 Beth Yeah.
208 Serena I think it’s shorter than what they are used to hearing.
209 Beth That’s true.
When planning the lesson in text, the pair did not seem to take any student
role into consideration. However, when depicting the lesson, the pair took the
students from their field observation as a reference when anticipating the virtual
teacher’s instructional moves. They were engaged in anticipating a lesson that they
thought they would be teaching.
Reviewing lesson slides When finished the first task, the pair reviewed the lesson slides they had
created that far. Beth and Serena played the role of teacher and students
respectively to read through the dialogues that had been anticipated in their lesson
slides. They did not make any changes while reviewing. This may owe to the fact
that they did not encounter any difficulty in composing slides in the first place.
Anticipating Task #2 The second task described in Beth and Serena’s lesson plan is not
comprehensive. Based on what they wrote, it can be assumed that they intended to
ask students to predict the changing pattern of two variables through a graph. They
also intended to instruct students in using the slope formula to find out the equation

164
of the graph16. The resource that they counted on students to have was the equation
of a linear function (y=mx+b) that they assumed students had learned before.
However, it was not stated what operations students would have to perform to
achieve the task.
Seen slope before in linear eqn y=mx+b, where slope in that equation is m and m is
equal to/can be found by
€
y2 − y1x2 − x1
. This describes a linear relationship between
points. Example: 1 step / 1 desk; if I walk 4 steps then which desk will I be at? Refer to predicting a pattern with the points on a graph. Relate this to y=x.
Figure 50. The second task in Beth and Serena’s lesson plan.
When discussing the lesson slides, the pair made it explicit how students’ prior
knowledge of linear function relates to slope (Turn 246‐247). They intended to
present the formula, m=
€
y2 − y1x2 − x1
, on the board and explain to students that one can
find out the slope using the formula.
The pair employed what they assumed was students’ prior knowledge about
linear functions as a resource to introduce students how to find the slope from the
16 The pair of prospective teachers seemed to assume students would already know the more complicated formula for slope, while they in fact still had to learn the concept of slope.
246 Serena On the board? And do we want this on the board, or no?
247
Beth Yeah, so we could say like, so remember when you learned
before about another way to represent is with the linear
equation, y = mx + b, and then we’ll say um, so the slope in
that equation, you find it using this. [Serena: Okay.]

165
equation. However, when discussing about how to represent the equation of the
slope, they realized that the slope formula, m=
€
y2 − y1x2 − x1
that was written on their
lesson plan and represented by letters, could be too confusing to students. They
considered that using numbers obtained from an example to illustrate the concept
of slope might be easier for students to understand.
264 Beth So I was thinking about this, do we want to have letters like
this? Or do we want to have numbers?
265 Serena Numbers right?
266 Beth I think so, I think it’ll be less confusing. Especially the way we
wrote the letters right there, like y2 and y1.
267 Serena Yeah that’s‐‐
268 Beth I think that’s too confusing.
The example proposed in their lesson plan was that if one goes one step, then
he will be at the first desk. This example is with the linear function of y=x where it
has slope of one. The pair intended to follow this example and illustrate it
graphically on the lesson slide. Serena drew a coordinate plane in Inscribe. She drew
two lines across each other at the origin as x and yaxes. Then she drew an arbitrary
line stretching from the lower left corner up to the upper right corner, and asked
Beth if they needed to make the line cross the origin. They agreed to do so without
further discussion.

166
Then Serena arbitrarily drew two hash marks as units on each axis. The two
hash marks on each axis were sparsely marked. They discussed if they would need
to mark all the units on each axis. Serena reflected that the cooperating teacher in
the field placement once told her that a teacher has to make unit marks on the two
coordinate axes; otherwise, students would think they did not exist. Hence, Serena
went on drawing seven and six hash marks on the x‐ and y axis respectively. These
marks were for the most part equally spaced.
After marking the axes, Serena and Beth picked two points on the line as the
example, for the purpose of finding the slope of the line. They picked point (2,2) and
(5,5) and Serena typed the coordinates of both points on the graph. However, after
viewing the coordinates of the two points, Serena commented that the two chosen
points were “too special of a case” (Turn 294). Beth agreed that the slope of the line
would be one and “it might generalize to everything” that students “might think all
the slopes are the same.” Serena argued that as the first example of finding the
271
Serena Okay. And then we have this point here, and this one here, and
here. Should we tick all the lines? I think we should do all of
them.
272 Beth Oh, yeah I see what you mean.
273 Serena ‘Cause that’s, I asked her about that in the drill and she’s like
they will think they don’t exist, what?
274 Beth Yeah I was wondering about that too.

167
slope students would encounter, this kind of example might be easier for them. But
Beth countered that the choice of numbers in this example would be confusing
because the x and y values are the same and the x and y values of change are the
same too.
294 Serena So we have two two [coordinate point] and then we have five
five [coordinate point] is that too special of a case?
295
Beth Oh ‘cause the slope’s gonna be one you mean? Um, yeah I
guess we don’t want to have a special case, ‘cause then it
might generalize it to everything.
296 Serena Yeah but it might make it easier for the first one they do.
297 Interviewer So if you present this special case, what the student would
think about?
298 Beth Well then they might think all the slopes are the same.
299 Interviewer Yeah.
300
Beth Plus, like if you used these same numbers it’s not clear which
one’s the Y and which one’s the X. Or y’know you change Y to
change X (they’re both gonna be five minus two.)
301 Serena (They’re both gonna be three.)
302 Beth Yeah it’s gonna be tricky.
As a result, the pair decided to revise the example. Serena first moved the line
around and made it away from the origin. But Beth reminded her that the slope of
the line would still be the same. Hence, Serena deleted the line and the two points.

168
She first extended the negative y‐axis and drew three hash marks on it. She then
drew a line passing below the origin, and asked if it was desirable to pick a point on
the intercept on the negative y‐axis. They then arbitrarily chose two points, (0, ‐2)
and (4,3). However, when viewing the line with the two points, Beth commented
that the slope of this line was still one17 and suggested to pick two points first then
draw the line.
316 Beth You still made the slope one.
317 Serena I did?!
318 Beth Yeah. Yah two over two.
319 Serena This, this is five.
320 Beth Yeah, put the points first like where you want it and then
draw the line.
In the above activity, Beth and Serena found that the example they chose
initially was a special case that might confuse students. However, they seemed to
choose another example arbitrarily by picking up two points from a drawn line.
They did not think deeply about the choice of numbers for the example in their
lesson.
Finally, Serena deleted everything in the drawing tool. She first picked a point
at (4,5) and then connected it with point (0, ‐2) with a line. She labeled the
coordinates of these two points and attached the whole graph to the right side of the
17 The slope of the line which passes through (0,‐2) and (4,3) is, however, 5/4, not 1.

169
board. Later, she attached the previous graphs (two graphs with negative and
positive slopes respectively) to the left side of the board. Beth commented that
presenting the previous graphs and current graph on the board side by side helps
students to compare the differences and similarities of the graphs: “It’s like a
progression on the board, they have something to look back to and compare to, like
when we find this slope then they will be able to compare it to, ‘oh yeah, that’s why
that one was positive’.”
In the same slide (see Figure 51), the virtual teacher explained what was
written on the board. She first reminded students of the equation formula that they
had learned before and explained that students would need to find the slope of the
graph on the board.

170
Figure 51. SB‐S0718: The virtual teacher reminds students of the formula and explains that students have to find out the slope of the graph.
Integrating Task #2 with a followup task After composing Slide#7 in which the virtual teacher provided the formula
and asked students to find the slope of a given graph, Beth and Serena viewed the
slide, discussed and clarified the task. Beth first questioned whether there was a
need to provide the linear equation formula on the board (as shown in Slide#7). She
suggested that it would be better to provide the equation of the given graph to
students. In doing so, students were left to identify the slope from the given
equation. Serena clarified that the task was to have students find the slope and
identify “m” in the equation as the slope. Hence, she was inclined to have students
calculate the slope themselves.
18 Later, when Serena and Beth reviewed this slide, they changed some wordings as the virtual teacher was saying: “Many of you have seen slope before in this the equation y=mx+b. Here is an example of a graph and, we will find the slope of this graph.”

171
Then Beth reflected on the following task proposed in their lesson plan and
compared those tasks to the one presented in Slide#7. She found the two
consecutive tasks were related and could be integrated together. The pair decided to
proceed with the later task, which was to ask students to find the slope given two
points on a line.
390
Beth Okay so, but like I’m just saying like if we write this equation
and then we write a graph and then draw an example from
the graph it’s like well why did we even throw that equation
up there?
391 Serena I think to find—like to show it’s relationship in the equation,
what is M, what is slope, where can I use it?
392 Beth So if we’re gonna do it‐‐
393 Serena ‘Cause then we‐‐
394 Beth I don’t think these two should be disconnected anymore.
395 Serena You think it should be the same?
396 Beth Like ‘cause we’re doing this right now, like we changed it from
this.
397 Serena So then lets go right into this.
398 Beth Yeah, lets just cut that, it doesn’t make any sense.
399 Serena Okay sounds good.
400 Beth Okay.

172
Serena duplicated Slide #7 as Slide#8 as a way to keep all the board content
and the virtual teacher’s standing position the same. The pair discussed whether
they needed to write up the calculation of the slope on the board or they would ask
students to do the calculation on their own. Then, they discussed whether students
would be able to do it if they were asked to do the task. Serena first commented that
students would not know how to calculate the slope. Beth wondered what students
would respond given that they had learned the equation before. And Serena
anticipated that students would forget what they had learned. Beth conjectured that
students would possibly remember “rise over run” as an answer.
Then they decided not to have the same slide background as Slide #7 in which
the virtual teacher was writing on the board. Instead, they intended to have the
virtual teacher turn around facing students and ask students to find the slope.
410 Beth Do you think they know the answer?
411 Serena I don’t think so.
412 Beth Even if they don’t, I wonder what they would say. Like, well if
they’ve already learned it before. But‐‐
413 Serena I don’t think they remember it exactly.
414 Beth Well I would guess one of their answers would be like slope
is rise over run.
415 Serena Yeah. Okay.
416 Beth So‐‐

173
417 Serena So then we shouldn’t have this slide.
418 Beth (Should have)
419 Serena (We should have) a new slide that has her turning to the
classroom?
420 Beth And asking them to find the slope?
After changing the slide template for Slide#8, the pair discussed how the
virtual teacher would pose the question about asking students to find the slope.
Before typing up the virtual teacher’s question, Beth also proposed how students
would respond to the question and how the teacher would follow up with the
students’ answers. Thus, the pair not only considered the teacher’s initial move at
the moment, but also they attended to students’ possible responses and the
sequences of the interactive moves between the teacher and students in their
lesson.
429 Serena She’s asking how do you, how would you find slope? Or how
do you think we can find the slope?
430 Beth Hmm. [hums]
431 Serena What can we use to find the slope, this line?
432 Beth Okay so if you say that then someone would say um, like the
two points. [looks at Serena]
433 Serena [nods]

174
434 Beth And then we’d say okay now how do you use the two points,
so it would be like kinda back and forth.
435 Serena Yeah.
When considering the students’ response, they anticipated Mike, a student in
their placement class, would answer the question.
Figure 52. SB‐S08: A student named Mike answers the question.
The pair continued composing the next slide in which the virtual teacher kept
prompting students how to use two points to find the slope. Serena duplicated
Slide#8 as Slide #9, and Beth typed up the virtual teacher’s question.
Serena asked whether the virtual teacher would directly ask Mike to answer
the question. Beth explained that the virtual teacher would like Mike to elaborate

175
his answer and hence Mike should answer the follow‐up question. The pair
discussed what his answer would be and how he usually behaved in class.
Figure 53. SB‐S09: The virtual teacher asks a follow‐up question.
As the pair discussed more about Mike’s possible responses, they realized the
need to have a classroom scene with students in which they could visualize Mike’s
expression and more of other students’ verbal and nonverbal responses.
453 Serena … Him again?
454 Beth Umm…yeah because we want him to elaborate on his
answer.
455 Serena Okay. So then maybe he’d be like “I don’t know, rise over
run?” I feel like‐‐
456 Beth Yeah, that he might be a bit unsure?

176
457 Serena Yeah.
458 Beth So…
459 Serena Sometimes he gets apathetic in his answers too.
460 Beth Yeah. Um…
461 Serena I don’t know, if he can’t say I don’t know, so. [laughs]
462 Beth Yeah. Maybe like um, I think you would—should we like have
it show the class?
463 Serena And their expressions?
464 Beth Yeah.
465 Serena Okay, so lets just get rid of this.
466 Beth Yeah.
In the slide template with a class of students, Slide#10, several students were
involved in the lesson. Besides Mike who answered the question with an uncertain
expression, other four students were seen bored or not excited. These students
were identified with individuals from the class the pair was observing in the field
placement.

177
Figure 54. SB‐S10: Mike answers the question while other students are bored.
Serena duplicated Slide#9 as Slide#11 in which the slide has the board content
as the background. The pair discussed what to present on the board to show the
calculation of the slope of the graph. They considered writing what the student had
said about “rise over run.” They also considered writing the description of the value
changes in y‐ and x‐coordinates. They then concluded that writing both notions on
the board is “better for them” (Turn 537) because it helps to connect what the
student did, the mathematical concept and the calculation of the example (“because
then it takes what they did to ‘math’ to the number”, Turn 538). Hence the virtual
teacher presented the following illustration on the board:

178
Figure 55. The virtual teacher presented the equation on the board.
531
Beth So do—are you going to write like slope equals—are you
gonna write, are you going to write out in words like um,
change in Y and then change in X.
532 Serena Okay. So‐‐
533 Beth Or do you want to write what he said, rise over run?
534 Serena Lets write rise over run (equals) [Beth: (I think that‐‐)]
change in Y over change in X equals [inaudible].
535 Beth So write out two things of words you mean?
536 Serena Yeah.
537 Beth Okay, that’s fine, I think that’s better for them, (honestly).
538 Serena (Yeah because) then it takes what they did to “math” to the
number.
539 Beth Yeah, I like that.
As can be seen in Slide#11, the virtual teacher wrote down different algebraic
representations of slope connected by equal signs, including “rise over run”, the “M”

179
formula and the calculation in numbers from the example. In addition, the virtual
teacher explained this representation.
Figure 56. SB‐S11: The virtual teacher wrote the calculation of slope on the board to connect what the student just said and to the mathematical concept of slope.
Analytical commentary on Task #2 The activity of depicting a lesson gave the participants an opportunity to
examine whether the representations of the concepts are comprehensible. In Beth
and Serena’s lesson plan, they intended to introduce the formula for slope of a linear
function that students had supposedly learned before. However, when depicting the
lesson, they thought the formula might be confusing being represented by letters. As
a result, they modified the plan and intended to use a word example to calculate
slope.
The work of developing the representations on the board in Depict allowed the
participants to examine their own understanding of the representations and

180
anticipate students’ understanding of them. For example, when the pair was
drawing a coordinate plane and marking the units, they first wondered whether
there was a need to mark all the units. Then they reflected from their field
experience that the cooperating teacher advised them that marking the units helps
students realize that all the units exist.
It was challenging for Beth and Serena to choose appropriate numbers in an
example to illustrate the concept of slope. Based on their lesson plan, they intended
to find an example with the slope of one. However, when representing the example
on the coordinate plane, they found that the example might be a special case that
might mislead students. In that example, the x and y‐values are identical and the x‐
and y‐ values of changes are the same as well. The choices of numbers would get
students confused. It seemed helpful to have the participants visualize what they
would present to students. In doing so, the pair would have the opportunity to
examine the mathematical appropriateness of the examples deployed in their lesson
and anticipate the kinds of operations involved in that example.
When depicting the lesson, the participants had to present and arrange board
work. This activity helped them identify and provide necessary resources to
facilitate students’ learning. When presenting the example graph on the board, the
pair noticed the need to keep the graphs presented earlier on the other side of the
board (see Figure 51). They hypothesized that presenting two sets of graphs side by
side would help students to review what had been discussed before and to compare
the two.

181
The activity of depicting a lesson allowed the participants to evaluate the
planned tasks and the connections among them. For example, when the pair was
viewing a slide that they had just created (Slide#7), they realized that the two
consecutive tasks in their text‐based plan could be integrated. This shows that the
pair first had considered that the tasks planned in the text as separate. However, the
activity of lesson depiction enabled them to see tasks as related and connected.
The activity of depicting a lesson allowed the participants to consider the
sequential interactive moves between the teacher and students. Particularly, the
pair thought about how the teacher would pose questions, whether students would
be able to answer them, what students could be capable of responding, and how the
teacher could pose a follow‐up question. For example, after Slide#7 in which the
virtual teacher proposed to find the slope of the graph on the board, the pair
discussed students’ thinking. They wondered whether students would be able to
find the slope. Based on their understanding of the students they had observed in
the field placement, they hypothesized that their students would not know the
answer. However, they further pondered the kinds of responses the students would
give. In addition, they anticipated how the teacher could prompt further thinking.
When depicting the lesson, the pair consistently referenced the typical
teacher‐student interactions in the class they were observing in the field placement.
They individualized students and hypothesized how students in that class would
react verbally and nonverbally. For example, in Slide#8 in which the virtual teacher
asked how to find the slope of the given graph, a student identified as Mike
responded to the question. Later, after the virtual teacher prompted a follow‐up

182
question, Mike responded again in Slide#10. He was anticipated as “a bit unsure”
when answering and “sometimes he gets apathetic in his answers too. (Turn 456,
459)” In the same slide in which Mike was giving his answer, other few students
were nonverbally involved: they were given “bored” facial expressions.
When depicting a lesson, the participants anticipated the interactive moves
between the teacher and students and specified the reasons for those moves. For
example, after Mike answered the teacher’s question of how to find a slope, the pair
made the virtual teacher probe for further answers (see Slide#8 and Slide#9). The
pair intended to have Mike respond again because “we want him to elaborate on his
answer.”
The work of writing specifically what to present on the board allowed the
participants to consider which mathematical representations might help students
understand better. For example, when thinking about what to present on the board
to show the calculation of the slope of the given graph in Slide#11, the pair intended
to integrate different mathematical representations and enable students to better
understand the relationship among different representations. The pair thus had the
virtual teacher write several algebraic representations of slope on the board,
connected by equal signs. They considered students would better make connections
among different representations of the same notion.
Discussing Task#3 The pair had implemented two tasks with eleven lesson slides. They
integrated the second task with a follow‐up task from their lesson plan. Due to time

183
constraints, the pair discussed the following task but could not represent it with
lesson slides.
In this task, the pair intended to use the table format to help students relate to
the concept of slope. They intended to show a table with four sets of points and help
students identify the patterns of change between quantities in the two columns. The
task was not thoroughly planned, because the pair did not specify the coordinate
points and how they would explain to relate the observation from the table to the
concept of slope. Regarding this task, they wrote:
EX #2 (from table) Show 4 points & make a table Figure all pattern of numbers on each side of table separately and connect to slope (from change in pattern & predicting numbers)--check 2 sets of points
Figure 57. The task Serena and Beth discussed but did not implement in lesson slides.
When they read the task in the lesson plan, they commented that they would
use the points from the graph from the previous task and put those points into a
table, so it “is using the same example (to) connect it to the different
representations.” It shows that they identified the connectedness among the tasks in
their lesson and did not treat the tasks as separate as they had done when planning
in text.
Analytical commentary on Beth and Serena’s lesson depiction When using Depict, Beth and Serena attended to details that they had not
considered in their written lesson plan. I discuss in the following sections.

184
Attending to teacher behavior
The work of viewing slides provides an opportunity for the participants to
attend to teacher’s behavior in the classroom setting. For example, when selecting a
template for their second slide, they became aware of the board content on the one
side. So they made the virtual teacher stand on the other side of the board.
In addition, the pair commented that they would walk around to point to the
graphs on the board when explaining.
Articulating teacher verbal directions
The work of creating dialogues in Depict allowed the pair of participants to
articulate what they, as the teacher, should say to students. They found that their
planning in text, regarding the teacher’s question and a student’ response, had not
been clear enough to represent the teacher‐student verbal exchange.
Attending to representations of concepts
The work of depicting a lesson encouraged the pair to examine the
comprehensibility of the representations of the concepts. For example, in their
lesson plan, they intended to introduce the formula of slope represented by letters.
However, when depicting the lesson, they reflected this kind of representation
might be confusing. Consequently, they decided to employ an example to illustrate
the idea of slope.
Projecting field experiences to lesson slides
When anticipating teacher‐student interactions, the pair referred to their
observations from field placement. They observed that typically, students did not

185
show interest in learning. Hence, they hypothesized that no students would respond
at the moment.
Another example also shows that the pair anticipated students’ reactions
based on their observation from the field placement. When the pair planned a
transition between two adjacent tasks, they intended to give an introduction to the
day’s topics. They discussed whether their students would understand the
introduction involving multiple topics. They then reflected that their students from
the field placement were used to hearing the long description of topics.
Consequently, they created a speech bubble involving the long introduction of the
topics.
Attending to board content
The use of Inscribe to create board content allowed the pair to visualize and
examine their presentations of the mathematical work. They first presented two
graphs, copied from their lesson plan, on the board and intended to ask questions
about the graphs. However, after viewing the graphs on the board, they realized that
the axes in the graphs had not been labeled. They did not attend to this omission
until they viewed it on the board.
Examining choices of examples
The activity of presenting board content afforded the pair opportunities to
examine the mathematical appropriateness of examples. From their lesson plan, the
pair originally intended to find an example with slope of one to illustrate the
concept of slope. However, when presenting the example in Inscribe, they realized
that the choice of the example was too general that would confuse students.

186
Overall, the activity of creating board content in Depict seems to allow Beth and
Serena to examine issues in instruction that they had not attended before. For
example, they became aware of their choices of examples in their lesson and the
representations of concepts on the board. They also specified teacher’s behavior and
verbal directions in the lesson. In addition, they identified the class with their field
placement class and projected students’ typical reactions to their lesson depiction.

187
Case #4: Samantha and Millie’s work Samantha and Millie composed twenty‐three lesson slides to implement four
tasks from their lesson plan. They intended to have students graph coordinate
points and have them observe the changing patterns in a table. Then they planned to
employ graphs to illustrate the concept of “rise over run.”
Anticipating Task#1 The first task in Samantha and Millie’s lesson plan was to have students graph
points on graph paper and have them observe the collinearity of the points. The
resources were the graph paper with four points that teacher would give to
students; however, it was not specified which four coordinate points would be given
to students. The operation was that students would have to connect the given four
points with a line on their graph paper.
Teacher gives students graph paper and ~4 (linear) points to plot. Then they connect the points in a line. The teacher points out that this is a straight line, so this is one way of seeing that we have a linear function.
Figure 58. The first task in Millie and Samantha’s lesson plan.
When depicting the lesson, Samantha chose a slide template with the virtual
teacher standing at the center facing students as Slide#1. She copied from what had
been written in the plan to a caption box on the slide to describe the teaching event:
“The teacher gives each kid a piece of graph paper and four (linear) points to plot.”
The virtual teacher then talked to the students that the class was going to have an
exercise, which was to graph the points on the given coordinate axes.

188
Figure 59. MS‐S01‐v1: The teaching event is described as what had been written in the lesson plan.
When creating the virtual teacher’s verbal instruction to the class, Samantha
realized that the graph paper given to students should include the coordinate axes
for them to graph the points. So Samantha revised the description of the teaching
event in the caption box that the virtual teacher gave each student “a piece of graph
paper with axes and four (linear) points to plot.” The given resources for students to
graph points then include both four coordinate points and the graph paper with
axes. The later resource was not anticipated in the lesson plan.

189
Figure 60. MS‐S01‐final: The virtual teacher provides graph paper with axes as a resource for students to plot the points.
To remind the students of plotting points, the virtual teacher provided an
example on the board. She drew a coordinate plane and marked a point at (2,3) on
the board. This example might help students to retrieve their prior knowledge of
graphing. This example can be seen as another resource that helps students in the
graphing task, but had not been identified when the pair initially planned the lesson.

190
Figure 61. MS‐S02: The virtual teacher reminds students of how to plot a point.
Figure 62. MS‐S03: The virtual teacher draws a coordinate plane with a point as an example to show how to plot points.

191
The following slide, Slide #4, illustrates students’ participations. Some student
characters were assigned with writing arms to show that they were working on the
task. A caption box says “After a couple minutes of working” indicating that it
required time for students’ work on the task. Then a student, who had a male‐
neutral speaking expression, raised his hand to claim that he had finished the work
and asked what to do next. One other student showed her confusion and frustration
on her face.
In their lesson plan, Samantha and Millie had not anticipated any students’
involvement in the task or their reactions to the task. However, when depicting the
lesson, in response to the teacher’s assigned task, to plot points on the graph paper,
the pair anticipated that the students would be working on the task and they needed
time to do it. Besides, the pair anticipated students’ verbal and nonverbal reactions
during and after working on the task. For example, one student was confused.
Another student was raising his hand and speaking when finishing his task.

192
Figure 63. MS‐S04: Multiple students are involved in the task.
After the class worked on the task, the virtual teacher followed up with a
question to ask students to observe the points they had graphed (see Slide#5). In
the following slide, Slide#6, which shows a view of the class, multiple students
reacted in different ways. First, a student raised her hand and shared her
observation. Then another student agreed with her classmate’s answer with
excitement. However, one other student who was sitting in the third row showed to
be bored.
This sequence of interactive moves between the teacher and students had not
been planned in text. In their lesson plan, they had only written “The teacher points
out that this is a straight line.” However, in their lesson depiction, the pair had the
virtual teacher ask students for their observation from what they had worked on.
And then they anticipated how students would react verbally or nonverbally.

193
Figure 64. MS‐S05: The virtual teacher asks a follow‐up question.
Figure 65. MS‐S06: Students react differently to the question.
In the following slide, Slide#7, the virtual teacher, building up from the
students’ work in graphing and their observation, concluded that there is a

194
relationship between a line and a linear function. And then she introduced the topic
of the day—slope, which was identified as the second task in Samantha and Millie’s
lesson plan.
Figure 66. MS‐S07: The virtual teacher makes a conclusion and introduces the day’s topic.
Analytical commentary on Task #1 The necessary resources for accomplishing tasks became apparent when the
pair created the lesson slides. First, when they were developing the virtual teacher’s
verbal instruction of the graphing task, they became aware that the graph paper
given to students should include coordinate axes as an additional resource for the
task. Second, the virtual teacher provided an example of graphing a point on the
board to remind students how to do the task. Showing an example of how to do a
task is a resource for students to better implement the task.

195
The role of students became visible when the participants depicted the lesson.
For example, in response to the virtual teacher’s assigned task, the pair decided that
students would need to work and that they would need time to do so. Slide #4
showed that several students were writing, indicating they were working on the
assigned task. A caption box described that time had passed. In addition, the pair
anticipated students’ verbal and nonverbal reactions. For example, in the same slide,
a student raised his hand and told the teacher that he had finished the task. The pair
also anticipated that another student was nonverbally involved, given her confused
expression.
The participants’ lesson plan gave the teacher a dominant role, but students
were actively involved in the task in their lesson depiction. For example, in their
lesson plan, the pair only mentioned to have the teacher address that the coordinate
points students had graphed form a straight line. However, in their lesson depiction,
the pair anticipated a sequence of interactive moves that involved the virtual
teacher’s prompting questions and multiple students’ engagement.
Anticipating Task #2 The second task was not thoroughly planned in the lesson plan. Samantha and
Millie intended to have students relate slope to linear function. However, they did
not specify what they, as a teacher, would do to help students make connections
between these two concepts. They only mentioned that they expected students to
apply their daily‐life notion of slope and relate it to the graph they had created.

196
Introduce slope as a topic related to linear functions. Asks students to use prior knowledge of “slope” (as used outside the classroom) to try to figure out the slope of the line or at least to try to determine the relationship between “slope” and the line.
Figure 67. The second task in Samantha and Millie’s lesson plan.
From Slide #8 to Slide#11, as planned in the text, the pair intended to help
students make a connection between the idea of slope and the line in a graph. In
Slide#8 the pair first had the virtual teacher ask students to think about slope from
their daily experience. With a student’s response in Slide#9, the virtual teacher then,
in the subsequent slide, prompted students to think about the slope of the line they
had just constructed. In response to the prompt, the pair anticipated that students
would make an observation about the relationship between the slope and the
steepness in Slide#11.

197
Figure 68. MS‐S08: The virtual teacher asks students to think about the slope from daily experience.
Figure 69. MS‐S09: One student gave an answer.

198
Figure 70. MS‐S10‐v119: The virtual teacher prompts for the connection between the word “slope” and the graph.
Figure 71. MS‐S11: A student makes a connection between slope and the steepness.
19 The slide was revised later when the pair reviewed it.

199
Analytical commentary on Task #2 It is unclear from their lesson plan what Samantha and Millie intended to do in
the second task. The pair planned to ask students “to use prior knowledge of
‘slope’…to try to figure out the slope of the line or at least to try to determine the
relationship between ‘slope’ and the line.” However, they did not mention how the
teacher would help students to accomplish the task.
In their lesson slides, they specified the teacher’s instructional moves and
students’ responses. They had the virtual teacher discuss with students daily‐life
notions of slope. Further, the virtual teacher had students to relate slope to
steepness. The pair also anticipated what the students would do in the event. The
activity of lesson depiction enabled the participants to unpack the teaching event
and explicitly anticipate the teacher and students interactions in the lesson.
Anticipating Task#3 The third task in Samantha and Millie’s lesson plan was to find the slope from
a table. They intended to have students fill a table with the coordinates of points.
Then they would ask students to calculate the changes in y and x‐ values and
observe the constant ratios. The resources provided for this task were four given
points from the previous task. Students would need to fill in the coordinates of these
points in a table, calculate the ratios of changes in y‐ and x values, and note that the
ratios stayed the same.

200
Students put their ~4 points into a table. They now have 2 representations (slope
and table) of slope. They compute ratios
€
ΔyΔx
and find that they are constant.
Figure 72. The third task in Samantha and Millie’ lesson plan.
Following from the previous slide in which a student made a connection
between the slope and steepness, the virtual teacher responded in Slide#12 and
introduced that the slope of line is the rate of change. She further suggested using a
table to observe the rate of change.
Figure 73. MS‐S12 The virtual teacher suggests using a table to better see the rate of change.
The virtual teacher then instructed students to use a table to represent the
given four points from the previous task. She drew a double entry table on the board
and filled in the first point respectively. Along with the table, the virtual teacher also
wrote: ”for the point of (2,3)” to illustrate the relationship between the ordered pair

201
of the point and numbers filled in the table. This is to show students an example of
how to represent ordered pairs of points in a table format. This can be seen as a
resource to help students in accomplishing the task, which had not been mentioned
in the pair’s lesson plan.
Figure 74. MS‐13: The teacher instructs students to follow the example on the board.

202
Figure 75. MS‐S14: A double entry table with a pair of numbers filled in.
After the virtual teacher assigned the task, the pair created a slide template
with a class of students as Slide#15. The pair described that students were working
on the task of filling in points in a table format20.
20 Samantha edited the wording in the caption box from “The students plot the points” to “The students put the points…”

203
Figure 76. MS‐S15: The students are working on the task.
After students had finished the task, the virtual teacher assigned a follow‐up
task in Slide#16. Millie had the virtual teacher ask students to divide the first y‐
coordinate by the second and do the same with x‐coordinate21. However, after she
typed it up and the pair viewed the slide together, they found it was better to have
students observe the change in y‐ and x values. Hence, Millie revised it to: “Now,
working in the ‘y’ column, see how much the value changes for each point. Then do
the same for the ‘x’ column.” And then Millie created a new slide with a blank board
as Slide#17. In this slide, the table presented earlier was filled with two more pairs
of numbers. In addition, the differences between each row in each column were
indicated on the sides of the table. This instructional move of showing the points
21 Here Millie seemed to try to get x1/x2=y1/y2 if the line goes through the origin where y=mx. However, the result of x1/x2=y1/y2 is not the slope. Additionally, it was not clear whether the example shown thus far was the case of y=mx.

204
and marking the changes in values had not been noted in Samantha and Millie’s
lesson plan.
In their text, they had intended to ask students to calculate the ratios of change
of y‐value and that of x‐value. However, to calculate the ratios of two variables,
students would first have to find out the change in y‐ and x‐ values. This operation
had not been taken into consideration when the pair had planned in the text‐based
format. In their lesson depiction, the pair developed this instructional move that
requires students to calculate the value changes of each point in x‐ and y‐ columns.
This move provides an additional resource for students to the following task.
Figure 77. MS‐S16‐v1: The virtual teacher gave an instruction that was later revised.

205
Figure 78. MS‐S16: The virtual teacher asks students to find out the change of y‐ and x‐values in each column.
Figure 79. MS‐S17: The value changes in each column are shown on the board.

206
The following slide involves a conversation between a student and the teacher,
an event not included in the lesson plan. In Slide#18, the virtual teacher was
standing at the center facing the class. A student was asking a question regarding
the differences of value changes in each column. He asked: “Do you have to say +1
and ‐2 like that? Can’t you just say 1 and 2?” Then the virtual teacher gave the
explanation that the negative sign showed the decreasing values in the y‐column.
The question that the student posed addressed an important concept of changes in
slope and illustrated a possible misunderstanding that students may have. This
event would not be made possible if the pair were not making the representation of
value changes on the board.
Figure 80. MS‐S18: A student poses his question and the virtual teacher responds.
In the following slide, as planned in their text, the virtual teacher asked
students to calculate ratios of the value changes in y‐ and x columns. And the

207
teacher further explained that these ratios would be the same. Additionally, a
student reflected that the ratio is the slope.
Figure 81. MS‐S19‐v122: The teacher explains how to calculate the slope with the values previously obtained.
Analytical commentary on Task #3 Similar to Task#1, at the beginning of Task#3, the virtual teacher provided an
example of how to enter the coordinates of a point in a double entry table. The
teacher wrote the point by its coordinates and entered those in the table. These
multiple representations show the relationship between the ordered pair and the
pair of numbers in the table. Showing a specific example in different representations
serves as resources for students to implement the task. These resources had not
been included in the pair’s lesson plan.
22 The slide later was revised when the participants reviewed it.

208
The participants refined the tasks when depicting the lesson. For example, in
their lesson plan, the pair had intended to have students calculate the rate of change
among values in the y‐ and x‐columns. When depicting the lesson, the pair
anticipated several intermediate instructional moves that would lead to the task
planned in the text. In Slide#16, the virtual teacher first instructed students to work
in each column to “see how much the value changes for each point.” In the
subsequent slide, the differences between each row in the table were marked on the
board (see Slide#17, Figure 79).
The activity of creating and viewing the board work allowed the participants
to generate the examples they intended to employ in their lesson. In their lesson
plan, they mentioned that they would have students graph four points. However,
they did not specify which four coordinate points they would give. When composing
this lesson slide, the pair was not initially aware of the need to specify them, either.
It was not until the next step, calculating the value changes of points, that they
generated specific pairs of points.
The activity of creating and viewing the board work allowed the participants
to address students’ possible misunderstanding and key concepts. For example,
after the value changes in y‐ and x‐ columns in the table were shown on the board,
the pair identified a key concept. They hypothesized that students might wonder
whether there was any importance in noting the value changes with positive and
negative signs. Then the virtual teacher had to explain that the negative sign
represented the decreasing nature of the change. This teacher‐student interaction

209
would not have been possible had the pair not depicted the slide to include the
board work.
Anticipating Task#4 In the following task, the pair intended to use graphs to show the changes in y‐
and x‐values, then to introduce the concept of “rise over run”. Further, they intended
to address a common error when calculating the slope. The resources utilized in the
task could be the graphs that students had created earlier and the ratio that
students calculated in the previous task. It is not clear what kinds of operations
students would need to perform in the task.
The teacher utilizes their graphs by showing how the ratio applies (up some amount and over, etc). The teacher explains that the ratio is often called “rise
over run”, and points out the common error of
€
ΔxΔy
.
Teacher hands out tables and has students graph the line and figure out the slope using the table.
Figure 82. The fourth task in Samantha and Millie’s lesson plan.
In the Slide#20, the virtual teacher gave an introduction to “rise over run” and
explained what this meant in graph. This piece of explanation had not been included
in the pair’s lesson plan. When developing the virtual teacher’s introduction, Millie
first typed in the speech bubble: “Yes, it is! Great thought. We also call this “rise over
run”, because as you can see if you look at your graph, the change in y is how much
you are going up or down, and the change in x is how much you are going side to
side.” When viewing the speech, she considered providing a stair example to better
illustrate the idea of the change in y‐values. As a result, she inserted the sentence

210
“kind of like stairs” right after the explanation about change of y‐values (see Figure
83).
Figure 83. MS‐S20: The teacher gives an introduction of “rise over run” with an example of stairs.
In the next slide, Slide#21, the virtual teacher presented a graph with three
points connected with a straight line. She also marked the changes in y‐ and x‐
coordinates between points. Along with the virtual teacher’s explanation, this
illustration of changes in two coordinates is an important visual resource for
students to understand the concept of “rise over run.” This resource was not
mentioned in the pair’s lesson plan. Later the virtual teacher reminded students of a
common error in calculating slope in Slide#22.

211
Figure 84. MS‐S21: The illustration of changes in y‐ and x‐ coordinates helps students understand the concept of “rise over run.”
Figure 85. MS‐S22: The teacher reminds students of a common error in calculating slope.

212
In the following slide, as planned in the text, the virtual teacher gave students
more problems to practice. They intended to have students practice graphing from
given tables and calculating slopes. In the slide, the virtual teacher gave an
instruction to the task. And a caption box describes the teacher’s action of giving
students problems to practice.
Figure 86. MS‐S23: The teacher gives students more problems to practice.
Analytical commentary on Task #4 This task primarily involved teacher’s verbal instructions and did not involve
much student work. In their lesson plan, Samantha and Millie did not specify how
the teacher would explain the concept. Lesson depiction enabled them to make the
instructional moves explicit. These instructional moves included verbal and visual
explanations that would help students better understand the concept.
In Slide #20, the virtual teacher gives a verbal explanation of “rise over run”
with an example of stairs. The virtual teacher also illustrated the changes in y and x‐

213
coordinates in a graph as a visual explanation that would enhance students’
understanding. These specific instructional moves, providing verbal and visual
illustrations, were not anticipated in the pair’s lesson plan.
Reviewing slides When reviewing the slides, the pair made revisions on the virtual teacher’s
instructions in several places. In Slide #10 the virtual teacher asked an additional
question to connect the notion of slope and the graph students just created. The pair
changed the wording in two places to make the directions explicitly connected to
the work the students had just done (see Figure 87). First, they deleted “So going
along those lines” and change it to “So going with that thought.” Then they revised
the last sentence from “Like the one you just constructed?” to “Like the slope of the
line you just constructed?”

214
Figure 87. MS‐S10‐final: The virtual teacher’s instruction was revised when the participants reviewed the slides.
When reviewing Slide #19 (see Figure 81) Samantha suggested a revision on
the virtual teacher’s instruction. The virtual teacher was guiding the students to
calculate the ratio of value changes in y‐ and x‐ columns and concluding the ratio the
same. Originally, the virtual teacher had given a long description. However, when
reviewing, the pair added an example that the class just worked on to illustrate that
the ratios obtained from calculations stayed the same.

215
Figure 88. MS‐S19‐final: The participants revised the slide by adding an example. (The inserted text showed in underline)
The activity of reviewing allowed the participants to articulate the virtual
teacher’s directions. In Samantha and Millie’s case, they intended to make the
directions more clearly by strengthening the relationship between the concept and
the examples the class had worked on. In doing so, students might better
understand teacher’s explanations.
Analytical commentary on Samantha and Millie’s lesson depiction
Attending to resources for implementing tasks
The pair became aware of providing resources for students to implement
tasks. In their lesson plan, the pair had intended to provide graph papers for
students to work at the beginning of the lesson. When anticipating the lesson, the
pair realized the need to provide the graph paper with axes drawn for students to
better work on the task. In addition, when asking students to work on the task of

216
graphing given points on a coordinate plane, the pair demonstrated an example of
how to implement the task.
In another instance, the pair also showed an example before students worked
on the task. The task was asking students to fill a double entry table with the
coordinates of points. The virtual teacher employed two representations to show
the relationship between an ordered pair and its representation in a table.
Attending to student participation
The pair became aware of students’ participation in lessons. For example,
when assigning a task to the class, the pair noted in a caption box that students
would need time to work. Consequently, on the slide with the view of a class, several
students were depicted writing, indicating they were working on the task.
Besides, the pair anticipated students’ verbal and non‐verbal participation. For
example, in the same slide, while some students were writing, a student raised his
hand and expressed that he had finished the task. Another student, however, was
confused.
Specifying teacher‐student interactions
The activity of depicting a lesson allowed the participants to specify teacher’s
instructional moves and students’ corresponding responses. For example, the
second task in the participants’ lesson plan was unclear of how the instruction
would proceed and how the teacher would help students to accomplish the task.
Refining mathematical tasks
The activity of depicting a lesson allowed the participants to examine and
refine the mathematical tasks they intended to implement. The participants refined

217
the tasks when depicting the lesson. They designed several intermediate
instructional moves in lesson slides so as to implement the task in the original
lesson plan.
Generating specific examples
The activity of depicting a lesson afforded the pair to specified the examples
given in a task. In the pair’s lesson plan, they intended to have students graph four
coordinate points. However, they did not plan the exact points in the task. When
initially creating the lesson slide, the pair was not aware of the need either.
However, when depicting the subsequent task, calculating the value changes of
points, the pair realized the incompleteness of the prior task.

218
Syntheses of Lesson Depiction across Four Cases
The primary aim of this analysis is to understand the qualities and features of
the anticipation of lessons that participants were able to do with the lesson‐
sketching tool, Depict. In this section, I synthesize the analysis across four pairs of
participants‘ work in lesson depiction. I examine in what ways the participants
attended to instructional issues when depicting lessons. First, I discuss how the
participants’ image of lesson changed when they depicted it. Then I discuss the
instructional issues the participants anticipated in their creation of lesson slides. I
adopt the three constructs of the instructional triangle—teacher, mathematics and
students (Cohen, et al., 2003) —to frame this later part of the analysis.
The changing role of lesson plan in the lesson depiction activity The role of a lesson plan changed when participants began to depict their
lesson. I found that while they assumed that copying what had been written in the
lesson plan would be sufficient, they soon independently realized (from looking at
lesson slides, not being told) that their lesson plans lacked detail and that they
would need greater elaboration of what would happen in their lessons when
depicting lessons. Below I describe how the participants’ use of the lesson plan
evolved over the course of depicting a lesson.
In planning their lessons using text, pairs of participants had been asked to
attend to three elements of instruction by answering three specific questions: (1)
What is the mathematics that will be done? (2) What will the teacher be doing? (3)
What will the students be doing? Then, four (out of nine) pairs of participants were

219
randomly assigned to the Depict group. In this group, they were asked to implement
their text‐based lesson by creating lesson slides using Depict. They needed to
represent their lesson plans with graphic representations, including cartoon‐based
characters and classroom settings.
The lesson depiction depended upon the content of the lesson plan. Thus, the
lesson as planned in both formats (text and lesson depiction) would have no major
content differences. However, the analysis shows that these participants attended
more thoroughly to instructional issues when depicting lessons than when planning
in text.
At the beginning of depicting the lesson, the participants intended to copy
what had been written in the text and reproduce it on the lesson slides. They soon
realized that they could not do so and began to treat the lesson plans as a reference
or framework for their lesson. They then immersed themselves in the teacher role
to attend to the virtual teacher’s instructional moves, such as verbal explanations
and problem representations. They also anticipated students’ possible responses.
These are all important features of real classroom interactions.
For example, when Ellie and Elliot began to create the first slide in Depict, they
immediately copied the question the teacher was going to pose from their lesson
plan. However, after typing up the question in a speech bubble in Depict, they soon
realized that they could not just copy it directly; instead, they needed to consider
carefully how the virtual teacher would pose a question and how students might
respond. Specifically, they realized that they would need to provide a context for the
question before actually posing it to students.

220
This was also the case in Samantha and Millie’s work. The first task in their
lesson plan had been written: “Teacher gives students graph paper and ~4 (linear)
points to plot.” Hence, on their first lesson slide, Samantha first typed up the exact
same text in a caption box describing the event. However, after viewing the slide,
she realized that the virtual teacher should provide students with graph paper and
coordinate axes to accomplish the task. She then revised the caption box. In the
revised slide, she had the virtual teacher talking to the class: ”Class, today we are
going to start off with an exercise. I would like each one of you to plot the four
points on the axes given to you.” This example shows that although this pair had
planned the events in the text format, the details of the events concerning how the
teacher should address the class were absent in that plan. Only when the
participants were depicting the lesson did they attend to these issues.
This shows a major distinction between the two representations of a lesson. A
lesson plan does not serve the same role as the lesson depiction. The activity of
lesson depiction invites the participants to specifically consider their lesson goals
and designs in ways that lesson planning does not.
In the following sections, I will discuss in detail the instructional
considerations that the participants attended to in their lesson depiction and that
they neglected when planning in text. I first discuss those instructional moves by the
teacher that the participants anticipated in lesson depiction. I then identify the
modification of mathematical tasks that the participants made, and the ways in
which the participants attended to students’ thinking and reactions in lesson

221
depiction. Finally, I discuss the temporal factors that were considered in lesson
depiction.
Specifying teacher’s instructional moves When depicting a lesson, the participants were engaged in discussing and
articulating teacher’s instructional moves. The degree to which they attended to
those moves seemed to be different from how they had considered them in their
lesson plan. They carefully elaborated the explanations and the presentations of
problems that the virtual teacher would provide for students, so as to help students
understand. They also paid close attention to the representations they provided and
the arrangement of the board content.
In the following sections, I discuss the ways in which the instructional moves
that the participants attended to and specified when they depicted lessons. First, I
describe in what way the participants modified the verbal directions in lessons.
Then I show how the participants examined the instructional examples involved in
mathematical tasks of their lesson. I also discuss the participants’ attention to the
presentations of the board work. Finally, I identify the participants’ specification of
the virtual teacher’s behavior in the context of classroom.
Attending to teacher’s verbal directions
The activity of depicting a lesson required the participants to develop
dialogues between the virtual teacher and students. Since they had not specified the
teacher’s verbal directions in their lesson plan, the participants spent considerable
time discussing how to articulate the virtual teacher’s verbal directions when
depicting lessons.

222
In the following sections, I identify three aspects of teacher’s verbal directions
that the participants elaborated while depicting a lesson. First, the participants
became aware of the need to give specific directions for the mathematical tasks they
were assigning. Second, they conceptualized the directions and sought explanations
that were clear to students. Additionally, they paid close attention to the ways of
expressing the directions.
Recognizingtheneedofgivingspecificdirections
When the participants started depicting their lessons, they intended to employ
the tasks as planned in their lesson plan. In their text, they had designed those tasks.
They assumed that they would only need to transcribe the question written on their
lesson plan as what the virtual teacher would say it to the class.
For example, in Sienna and Pamela’s first lesson slide, they typed up the first
question of the lesson so that the virtual teacher would say to the class: “How long
would it take to walk up 100 stairs?” However, upon reading the slide, they soon
realized that the question should include given information; otherwise, it would not
be possible for students to answer. Hence, they revised the question to: “How long
would it take to walk up 100 stairs if you walk up one stair every second?”
A similar instance occurred in Ellie and Elliot’s depiction of lesson. When
beginning the depiction, they thought they would only need to copy the teacher’s
question. However, similar to their colleagues, after typing up the question on the
slide, they were aware that the virtual teacher would not pose a question without
providing an introduction to the day’s topic and a description of the given

223
information. Moreover, they had the virtual teacher demonstrate an example to
guide students to better accomplish the task.
Conceptualizingthedirections
The work of lesson depiction enabled the participants to conceptualize their
directions and discuss what they would say as a teacher to students. In their lesson
plans, the participants did not specify how they would do so.
In Ellie and Elliot’s lesson plan, they had planned to lead students to graph
coordinate points from a given table. However, they had difficulties in providing a
good explanation to address the connections between the two variables in the table
and the coordinate points in a graph. Finally23, they decided to lead the students to
identify the changing pattern between the two variables in the table and suggested
using a graph to better see the changing relationship.
Another example occurred in Beth and Serena’s work. They had been planning
to show the slope formula and explain the concept of slope. However, they reasoned
that the slope formula, m=
€
y2 − y1x2 − x1
, represented by letters, might be too confusing to
students. Therefore, they decided to use numbers obtained from an example to
illustrate the concept of slope. Later, they considered talking about what students
might have known of the idea of “rise over run” when explaining the slope too.
Additionally, they intended to give a detailed explanation of the formula. They
23 In Ellie and Elliot’s Slide #8 (see Figure 18), they first had the virtual teacher say to the class: “so, if we think about the number in the table as sets of two point, we can graph these points, right?” After typing this instruction in the speech bubble, Ellie commented that the connection between the “numbers in the table” and “sets of two points” would be confusing. She then suggested introducing the two variables in the table as independent and dependent variables. However, both of the prospective teachers were thinking that this connection was confusing too.

224
decided to have the virtual teacher write all the related notions of slope on the
board (see Figure 55).
Beth and Serena had not planned that way in their lesson plan. Rather, they
had intended to introduce the formula first and then to have students practice with
an example. However, in depicting the lesson, they anticipated students’ possible
confusion and decided to explain the concept of slope with related notions. They
considered that it would help students better connect what the students have
known, the mathematical concept and the calculation of the example.
Enactinginstructionbycraftingdialogue
When depicting lessons, the participants had the chance to examine what the
virtual teacher should say to students. When creating speech bubbles in Depict, the
participants had to specify the dialogue that the virtual teacher would have with
students. This activity encouraged the participants to articulate what to say in the
class. And more importantly, they examined whether the word choices were
appropriate or comprehensible given students’ current knowledge. For example,
when Ellie and Elliot were discussing how to direct the virtual students to graph
coordinate points from the information in a given table, they paid attention to what
would be appropriate to say. The pair thought about addressing the relationship
between the two variables from a table and x‐ and y‐ values, and then asking
students to “plot” the points. However, Ellie commented that students might not
know how to “plot” the point if they had not known the relationship between an
ordered pair and the coordinates of a point. They reflected on students’ knowledge
and noticed the importance of word choices. This instance shows that the activity of

225
depicting a lesson allowed the participants to attend to the proper use of
mathematical language. It shares a similar characteristic of “lesson play” (Zazkis, et
al., 2009) in which an alternative model of lesson preparation involves designing
classroom dialogue. The above instance also shows that the activity of depicting a
lesson allowed the participants to approximate teaching practice (Grossman, et al.,
2009), specifically in attending to how the teacher should verbally interact with
students. Creating dialogues allows prospective teachers to anticipate how to
address and explain concepts so as to make them comprehensible to students. This
also allows prospective teachers to craft appropriate questions to students and
anticipate how students might respond given their current knowledge. Further, it
also provides prospective teachers opportunities to plan how the teacher might
respond to students’ answers or possible questions accordingly.
Clarifying tasks
When depicting lessons, the participants had opportunities to examine the
mathematical tasks they intended to show to class. In the following sections, I first
discuss the way in which the participants specified tasks included in their lesson
plan while depicting lessons. I also show how the participants examined the
mathematical appropriateness of the number choices in the examples.
Specifyingtasks
When depicting lessons, the participants were aware that they would need to
make the task specific. They had not attended to this issue when they had planned
using text.

226
This feature was apparent in Millie and Samantha’s work. They intended to
have students plot points on graph paper at the beginning of the lesson. However, in
the lesson plan, they had not specified what coordinate points to give students to
plot. When beginning to depict the lesson, they did not specify the given points
either. It was not until they depicted a few slides that they thought about the need
for specifying the points to be plotted.
The activity of depicting lessons enabled the participants to specify their task.
By designing a task with specific values, the participants had the opportunity to
examine the mathematical appropriateness of the task. I discuss the instructional
moves afforded by that opportunity in the following section.
Examiningtheappropriatenessofnumberchoicesinatask
When planning in text, the participants had not examined the consequences of
their assigned tasks. That is, they were not aware of the need to inspect whether the
number choices in the tasks were mathematically appropriate. However, when
depicting lessons, this instructional issue became apparent to them and they had the
chance to modify the tasks planned.
For example, the second task in Serena and Beth’s lesson asked students to
find the slope of the line through two given points using the formula. Originally, they
followed the examples from their text‐based lesson plan. In their lesson plan, they
had points with identical x and y coordinates. Thus, in the lesson slide, they decided
to pick points (2,2) and (5, 5) for students to find the slope. However, they realized
that these points were too special of a case that may confuse students: the x‐ and y‐
values are identical and the changes in x‐ and y‐ values are identical too. Although

227
they noted this example might be easier for students to work on given that it would
be their first problem of finding a slope, they concluded that they needed to change
the numbers.
It is important to consider the mathematical appropriateness of the examples
in a lesson (Mason & Pimm, 1984; Zaslavsky, 2010). Poorly chosen numbers, as in
Serena and Beth’s original ones, may cause students’ confusion and
misunderstanding and impede their learning (Zaslavsky & Zodik, 2007). The work
of anticipating tasks in lesson slides helped the participants to more carefully attend
to this instructional issue.
Examining teacher’s written inscriptions on the board
When depicting lessons, the participants would need to specify what to
present on the board. This move allowed them to examine whether their
inscriptions on the board were correct and appropriate.
For example, when Serena and Beth were drawing a coordinate plane on the
board on a lesson slide, they had a discussion about how to present the coordinate
plane correctly. They discussed if they would need to label all the unit marks on
each axis. They reflected upon the cooperating teacher’s advice from their field
observation that there is a need to label the unit marks, otherwise, students would
think the units did not exist. The activity of depicting a lesson, specifically attending
to board work, allows the participants to examine the appropriateness of their
board content presentations.

228
Specifying teacher’s behavior
When depicting lessons, the participants identified the virtual teacher’s
specific moves in the context of the classroom. Given the visualization of classroom
scenes in Depict, the participants would anticipate the virtual teacher’s physical
movement or placement.
For example, Beth and Serena commented that when the virtual teacher was
explaining the differences between two slopes in graphs, she would walk around
and point to the graphs respectively. As a result, in their lesson slides, they had
pointing gestures next to the designated graphs to indicate that the virtual teacher
was pointing to the graphs while explaining.
When depicting their lesson, Ellie and Elliot specified where the virtual
teacher would stand and create the board work. In the second task of their lesson,
the virtual teacher involved students in graphing points obtained from a table
presented earlier on the board. They realized that the virtual teacher should stand
on the right side of the board graphing, given that a table drawn earlier was on the
left side. The virtual teacher had to show the table as a reference for the up‐coming
task of graphing the table.
The above two examples illustrates that the activity of depicting a lesson
engaged the participants in an “imagined classroom” (Rosebery, 2005) to anticipate
detailed class scenarios. This would help them anticipate more predictable
outcomes of lessons.

229
Refining mathematical tasks In depicting lessons, the participants had chances to examine the tasks in their
lessons. Particularly, they made two kinds of modifications in their lesson slides.
First, they became aware of the need for connectivity and transitions of tasks in
their lessons and refined the tasks accordingly. Further, they provided various
resources for students to accomplish the assigned tasks. In the following sections, I
discuss the above two changes that the participants made while depicting lessons.
Seeing tasks as continuous
When planning in text, the participants seemed to list the tasks one by one,
and did not think of the connections between tasks. Planning fragmented activities
or tasks is a common trait shared with other novices identified in earlier studies
(Leinhardt, 1993; Roskos & Neuman, 1995). When depicting a lesson, the
participants immersed themselves in the teacher‐student interaction, which enabled
them to re‐examine the tasks and the relationship among them.
Makingtransitionsbetweentasks
When Ellie and Elliot depicted their lesson, they had difficulties representing
two consecutive tasks planned in the format. The first task was for students to read
a given table, and the following one was having students graph the table. Ellie and
Elliot realized that there was a need to make a transition between these two tasks,
in order for students to better understand the relationship between the two
representations, table and graph. As a result, the pair had the virtual teacher explain
explicitly how to graph points from a given table. Particularly, the virtual teacher
stressed the relationship between the variables in a table and the coordinates of

230
points in a graph. This instance showed that the participants recognized the need
for the connectedness between tasks and tried to manage this flow in their lesson
when depicting it. This instance also illustrated that the participants became aware
of the need to make a connection between two symbolic systems. This move is
considered essential in expert teachers’ instructional explanations (Leinhardt &
Steele, 2005).
Integratingtasks
Another way that the participants managed the continuity of tasks was by
attending to the relation between tasks and consolidating them when they noticed
that adjacent tasks were repetitive. For example, in Beth and Serena’s lesson plan,
they had the following two consecutive tasks: the teacher introduces the formula of
slope, represented by letters; then the students practice calculating slope using the
formula with particular numbers. When depicting the lesson, they speculated that
the formula represented by letters might confuse students, and thus decided to
introduce the formula by way of an example in which they calculated the slope for a
particular pair of points. In addition, they had the virtual teacher explain the concept
of slope (the ratio of the changes in y and x coordinates for two given points) while
applying the formula with an example. This instance showed that the activity of
depicting lessons enabled the participants to see the relationship between
consecutive tasks. Additionally, they identified the goal for each task and integrate
them.

231
Decomposingtasks
When depicting lessons, the participants would get to realize that the tasks
planned earlier in the format were too unwieldy to accomplish and they need to
decompose the tasks. As a result, the participants specified intermediate
instructional moves to refine the tasks so that the virtual teacher could help
students accomplish the tasks step by step.
For example, in the third task in Samantha and Millie’s lesson plan, they had
intended to have students calculate the ratios of value change of y and x
coordinates. They realized that in order to achieve this goal, the virtual teacher
would have to first ask students to find out the value changes of both coordinates for
each point. This intermediate instructional move showed that the pair decomposed
the task when depicting the lesson. While it is identified a common characteristic
that novice teachers’ planned activities are impractical to accomplish (Leinhardt,
1993), the activity of depicting lessons allowed the participants to refine the tasks
and realize them in series of reasonable and manageable instructional moves.
Providing resources for mathematical tasks
When depicting lessons, the participants provided various resources, for the
purpose of helping students accomplish the assigned tasks. Below I describe
different types of resources that the prospective teachers provided in their lesson
slides.

232
Verbalresources
The participants gave careful thought to the virtual teacher’s explanations for
the tasks when they were depicting lessons. These explanations were resources that
would help students better accomplish the tasks in the lesson.
For example, in Ellie and Elliot’s first task in the lesson slides, the virtual
teacher provided three sorts of verbal resources for students. First, the virtual
teacher gave a context story about the task to problematize the subject matter that
they thought might help students engage in the task more easily (Engle & Conant,
2002; Hiebert, et al., 1997). Second, the virtual teacher provided an explanation of
the given representation (a table) that might help students better understand the
given information. Finally, the virtual teacher demonstrated a way of reading the
table that would help students better accomplish the assigned task.
While in the lesson plan, the pair only assigned tasks without considering
needed resources; in their lesson depiction they employed verbal directions as
resources when assigning tasks. They saw these verbal directions or explanations as
guidance needed by students to better complete the tasks.
Visualresources
Visual resources might help students better understand and accomplish tasks.
When depicting lessons, the participants made use of board work to specify visual
resources for assigned tasks. For example, in their slides, Millie and Samantha
represented the changes in y‐ and x‐ coordinates both in a table and a graph to help
students better understand the concept of “rise over run”, a customary way of
remembering the concept of slope.

233
Another example was seen in Beth and Serena’s lesson depiction. When
explaining the concept of slope, they intended to integrate all related concepts and
show them at the same time. To do this, they wrote several different algebraic
representations of slope on the board, connected by equal signs. Their goal with this
representation was to make connections between prior knowledge and the new
formula of slope. The participants attempted to use multiple representations of
related mathematical concepts and demonstrated the connectedness among these
representations, in order to promote students’ understanding (Stein, et al., 2000).
The above examples showed that the participants attended to students thinking and
gave specific resources that would help students’ learning. This is characteristic of
instructional explanations (Leinhardt, 1993; Leinhardt & Steele, 2005).
Showinganexampleofhowtodoatask
When depicting lessons, the participants would show examples for students to
use as resources when working on the assigned tasks. This kind of instructional
move had not been planned in text. The participants seemed to realize the need to
do so once they had the virtual teacher assign tasks. For example, Ellie and Elliot
verbally provided an example of how to read a table with two variables before
asking students to do so. Similarly, before asking students to graph points on graph
paper, Samantha and Millie had the virtual teacher draw a coordinate plane with a
point as an example for students to follow. These examples can be seen as resources
that would help students accomplish the tasks.

234
Specifyingmaterialresources
Material resources involved in tasks could support students to work on the
tasks. The activity of depicting a lesson allowed the prospective teachers to specify
the material resources they would provide for students. For example, at the
beginning of Millie and Samantha’s lesson, they intended to engage students in an
activity of graphing several points given by their coordinates. While depicting this
lesson, they became aware of the need to provide graph paper with coordinate axes
as an additional resource that might help students in working on the graphing
activity. This type of resource became apparent when the prospective teachers were
developing the tasks in lesson depiction.
Individualizing students While in the lesson plan, students were invariable seen as an undifferentiated
class, in the context of depicting a lesson, individual students became visible to the
participants: They attended to individual students’ possible reactions and thinking.
Personifying students
Participants attributed personality to the virtual students. In some cases, they
would assign names to students to individualize them. They projected the students’
characters from their field observation placement to the virtual ones in lesson slides
(Herbst & Chazan, 2006).
In Ellie and Elliot’s lesson slides, they had one student answer the virtual
teacher’s first question regarding making connections between two variables.
When moving on to the second question the virtual teacher proposed, they had
another student involved in answering the question. However, when composing this
235
lesson slide, Ellie pointed to and commented on the student who just answered the
first question: “I bet that kid would probably raise his hand”, indicating that the
virtual student would also know the answer. It shows that Ellie was aware of
students’ participation and was personifying the student with the character’s grasp
of the problem.
The participants would consider customary class interactions they had seen in
their field placement and apply these observations in depicted lessons. When Beth
and Serena were discussing the content in their lesson slides, they anticipated that it
would be the class from their field placement that they would be teaching. Hence,
the teacher‐student interactions and students’ typical reactions in the class were the
important references when the pair developed their lesson slides.
For example, when depicting the first task in which the virtual teacher was
asking a follow‐up question from the previous one, Beth and Serena discussed how
the virtual students would respond. They reflected on what had happened in class
the week before in their field placement and concluded that none of the students
that they knew would have been motivated to answer that question. Then they
created a blank slide with a caption box stating: “No student responds to this
question posed by the teacher.”
Upon completing the depiction of the first task, the pair intended to follow the
task as planned in text. In their lesson plan, they intended to give students a brief
introduction of the day’s topics, including the definition of slope, how to find the
slope, and different ways slope is represented. Upon reading the original plan, they
realized that the introduction would be too long for students to comprehend it.

236
However, they reflected that the students in their field placement had been used to
hearing long introductions, and decided that the plan would not need any
adjustment.
In addition to taking the typical teacher‐student interaction into consideration,
Beth and Serena named the virtual students after the ones from the field placement
and attended to individual students’ typical reactions in class. For example, in the
pair’s lesson depiction, a student they named Mike answered an initial question (see
SB‐S08, Figure 52). In the following slide, the virtual teacher prompted Mike to
elaborate his answer. Beth and Serena discussed what Mike’s answer would be and
how he would usually behave in the class. Beth suggested that Mike would answer
with a little bit of uncertainty. Serena commented, “sometimes he gets apathetic in
his answer too.” Hence, the pair decided that there was a need to put on a slide that
showed the whole class, so they could show Mike’s expression along with his
answer24.
Naming and choosing which student to participate in depicting a lesson are
similar features in a “lesson play” (Zazkis, et al., 2009). Additionally, the activity of
depicting a lesson engaged the participants in considering students’ characters
involved in their lessons.
Involvingmultiplestudentsinclassactivities
While the lesson plan seemed to discourage the participants from anticipating
students’ participation, the depiction of lessons took the participants to involve
multiple students in class activities. In some cases, they would anticipate multiple
24 This instance also demonstrates that the participants attended to the student’s multimodal communication (verbal and facial expression) in class.

237
students simultaneously responding to one prompt. In other cases, they would
involve different students participating in the lesson at different times.
Attendingtostudentsatthesamemomentofaclassactivity
The participants could see multiple students in the virtual class at the same
time. For example, in the second task of Ellie and Elliot’s lesson, they had the virtual
teacher ask students to predict the traveling distance of a car after ten hours based
on some information given on the board. They first anticipated that some students
might be puzzled. Then they had one student answer the question. Therefore, in
their Slide #6 (see Figure 20), three students showed uncertain expressions, and
one student who was sitting in the first row replied to the question. These students’
verbal and nonverbal reactions were simultaneously attended to. Another instance
appeared in Millie and Samantha’s work. At the beginning of their lesson, the virtual
teacher gave students graph paper and asked them to graph four given points on a
coordinate plane. After the posed task, a slide showed a class of students (see MS‐
S04, Figure 63). On this slide, several virtual students were seen writing, indicating
they were working on the task. Additionally, a student, sitting in the second row,
raised his hand and expressed that he had finished the task. This shows the pair
identified that multiple students would need to be involved at the moment at which
the task was posed. This instance indicates that the participants attended to the
simultaneity of classroom events (Doyle, 1986).
Attendingtostudents’participationatdifferentmoments
The participants attended to students’ participation across time in lesson
depiction. They would notice students’ participation in the lesson. Hence, when

238
anticipating students’ responses, they would consider those virtual students who
had not yet participated in class and gave those students opportunities to respond.
For example, toward the end of Sienna and Pamela’s lesson, the pair discussed what
the students’ answer would be to the virtual teacher’s question. Pamela suggested
that the response could come from a student who had not yet participated in class. A
similar example occurred in Ellie and Elliot’s work. In the third task of their lesson,
the pair was discussing a student’s possible answer to the virtual teacher’s earlier
question. They first typed up the answer in a speech bubble at an arbitrary place on
the slide. Elliot then suggested that the answer could come from another student
who had not yet talked so as to involve more students in the lesson.
Attendingtointeractionsamongstudents
The participants attended to the interactions among students when depicting
lessons. For example, in Millie and Samantha’s work on the first task in their lesson
depiction, they had one virtual student answer a teacher’s question. At the same
time, another girl from the virtual class agreed with that student’s answer. Another
example illustrates more interactions among students throughout the lesson. In
Sienna and Pamela’s depiction, Bob first gave an answer to the teacher’s question.
However, his answer was not comprehensible to his classmates. One of them, called
Susie, questioned Bob’s answer. Then Lily tried to explain and clarify Bob’s answer.
This instance illustrates that the activity of lesson depiction not only encouraged the
participants to attend to different students, but also to consider the interactions
among them.

239
Noting students’ nonverbal participation
When depicting lessons, the participants were aware of students’ emotions
and non‐verbal reactions in class activities. They showed students’ nonverbal
responses on their lesson depiction. They had not had this kind of anticipation while
planning lessons in text.
Hand gestures were generally applied to two kinds of occasions in the lesson
slides. The virtual students raised their hands to show their willingness to answer
the questions, or they raised their hands while answering the questions. The virtual
students had writing gestures indicating their working on the problem at the
moment.
In most cases, the virtual students who were speaking showed neutral
expressions. In some occasions, the virtual students appeared confused and
uncertain regarding the virtual teacher’s questions.
The participants anticipated students’ emotions too. They had the virtual
students happy or excited when the students solved the problems or grasped the
concepts. In addition, the participants anticipated some students to be bored with
the mathematics problems and did not show interest in class. For example, in the
second task in Pamela and Sienna’s depiction, several students were involved in the
class interaction: Bob provided an answer to the virtual teacher’s question, but
Susie was confused. In Slide #5, Lily showed excitement when she was elaborating
on Bob’s idea. Later, in Slide #6, a caption box reads: “Susie’s frustration is gone and
now she is excited that she knows how to graph the points from Bob’s table.”
Although this slide did not show students’ facial expressions, the description in the

240
caption box indicates that the pair anticipated students’ possible emotions and
reactions.
In Millie and Samantha’s work on the first task, the virtual teacher asked
students to graph given points and observe the pattern among these points. In their
Slide #6, a student raised her hand and answered the question. Another student
sitting in the second row agreed with the answer and showed her excitement.
However, another student sitting in the back of the class appeared to be bored.
The participants also anticipated nonverbal responses not available in the
Depict tool. Sienna and Pamela created an expression to better represent a virtual
student’s thought. At the beginning of the lesson, the pair was depicting that a
student was thinking that the teacher’s question was too easy. Pamela and Sienna
commented that the student was thinking, “ ‘duh’, this is obvious.” This example
shows that the participants are sometimes capable of anticipating students’
unspoken thoughts even without graphic prompts that encourage them to do so. Of
course, the general properties of Depict enable teacher initiative, even when it
doesn’t direct it. It also shows that the participants anticipated students’ thinking
along different lines that while some students were thinking about how to answer
the question, others might be thinking about the nature of the question itself.
Hypothesizing students’ thinking
When depicting lessons, the participants were able to attend to students’
thinking. For example, they speculated what the students’ answer might be,
students’ confusion, students’ difficulties in understanding given what they
hypothesized would be their current knowledge. This differs from the lesson plan in

241
which individual students’ actions, such as their possible responses, emotions,
thinking, or learning difficulties were rarely addressed (in spite of the fact that they
had all already looked at and annotated students’ individual work on linear function
problems).
Anticipatingstudents’uncertainty,difficulties,andconfusion
When depicting lessons, the participants anticipated some possible
uncertainties and incorrect responses from students. Additionally, the participants
considered students’ possible difficulties in accomplishing the assigned tasks.
However, this kind of anticipation was not addressed in their lesson plans.
For example, Ellie and Elliot hypothesized that the task they assigned might be
too difficult for students to answer given their prior knowledge. But the pair
recognized that some students might be capable of doing something easier related
to the task. Consequently, in their lesson depiction, they had several students with
confused expressions and a student replied with the observation of given
information without a direct answer.
Samantha and Millie hypothesized students’ possible confusion in their lesson.
In the third task of the lesson, the virtual teacher had students calculate the value
changes of x‐ and y‐ coordinates and then presented the work on the board. The
value changes involved the increase and decrease of values, thus being presented
with positive and negative signs with numbers. Samantha and Millie hypothesized
that students might be unsure of the differences between the increase and decrease
of values. A student asked, “Do you have to say +1 and ‐2 like that? Can’t you just say
1 and 2?” Then the virtual teacher addressed the concept of the increase and

242
decrease of values. By anticipating students’ possible questions, the participants
were able to address the important issues of tasks in their lessons.
Hypothesizingstudents’priorknowledge
When anticipating students’ possible responses to the assigned tasks, the
participants would need to consider and have discussion regarding students’ prior
knowledge and their capability to respond to the tasks. Although in this study, the
participants did not have a thorough understanding of students’ prior knowledge
for each task, they did become aware of this important aspect in anticipating
students’ possible responses.
For example, while Ellie and Elliot were depicting their lesson, they constantly
had discussion regarding students’ prior knowledge. They hypothesized that
students would know how to observe the value‐changing pattern from a given table.
When discussing how to explain the connection between the table and graph
representations, Ellie commented: “I don’t know. It’s hard when you don’t know
what the kids know (Turn 295).” They had difficulties in designing this instructional
move because they did not have a full grasp of students’ prior knowledge. It showed
their awareness of the need to attend to students’ prior knowledge.
Considering temporal factors in a lesson Temporal aspects of a lesson became more apparent when the participants
depicted their lessons. Although they were asked to estimate how long each
segment of a lesson would take when planning in text‐based format, the participants
generally underestimated the time required. Moreover, they were not aware of the
need to allocate time for students’ responses to a teacher’s request. That is, they
243
would need to allow a period of time for students to work on the problems the
teacher proposed.
In Samantha and Millie’s lesson slides, they showed consideration of time
needed for students to work, which was missing in the lesson plan, in spite of being
prompted. In their slides, after the virtual teacher posed a task to the class,
Samantha and Millie used a slide template that showed the class of students. On this
slide, they assigned several students writing gestures, indicating the students were
writing and working. On the bottom left corner of the same slide, a caption box was
to read: “After a couple minutes of working,” indicating the time given to students to
work on the task.
Ellie and Elliot attended to the same issue in their lesson depiction. In their
slide #5, the virtual teacher was posing a question that required students to read
information from a given table on the board. After composing this slide, Ellie
commented: ”I think they would think about it for a while.” This comment was not,
however, acknowledged on the slide. It was not until reviewing a set of slides
created thus far that they created a caption box on the upper right corner of the
slide, stating: “After a few moments.” It showed that time had passed and students
were given time to think about the question.
Although the participants did not show their capability of estimating time
precisely in lesson depiction, they showed that they were at least aware of the fact
that students would not be able to complete the assigned tasks instantly. Instead,
students would need time to process thinking, and the teacher had to anticipate this
issue in planning their lesson.

244
Conclusion This chapter has described the features of lesson anticipation using Depict.
While the participants’ considerations of instructional detail were generally missing
in the lesson plans, they were able to attend to issues in instruction.
Regarding teacher involvement in instruction, the participants specified
teacher ‘s instructional moves when depicting lessons. They were engaged in
discussing and articulating the explanations and the presentations of problems that
the virtual teacher would need to provide for students, so as to help students
understand better. They also paid close attention to the representation and the
arrangement of the board content. The degree to which they attended to these
moves seemed to be different from how they had considered them in their text‐
based lesson plans.
Regarding the mathematical work involved in a lesson, the participants refined
the mathematical tasks so as to make them manageable and feasible to accomplish.
When depicting lessons, the participants came to view tasks as connected and
realized the need for making transitions between those tasks. In addition, they were
aware of the need of intermediate steps to make the tasks manageable for students.
Further, they provided resources (verbal, visual or material) for students to work on
those tasks.
Regarding student involvement in instruction, the participants individualized
students and anticipated students’ possible thinking and reactions. While in
planning in text, there was little student involvement in lessons, individual students
became visible to the participants when they depicting lessons. They attributed

245
personality to individual students and hypothesized students’ questions and
confusion. Further, the participants anticipated students’ nonverbal participation.
Overall, the participants using Depict unpacked general descriptions of
teaching into moment‐to‐moment teacher and student interactions around
mathematics in instruction. The participants specifically attended to teacher’s
instructional moves, students, and mathematical tasks.

246
6. CHAPTER 6
USE OF DEPICT’S FEATURES
In this section, I address Research Question #3: How do prospective teachers
employ the graphic resources to support their lesson depiction? I discuss what the
lesson‐sketching tool, Depict, afforded the participants in anticipating lessons.
Particularly, I discuss how the participants made use of the tool’s features to attend
to instructional moves while depicting lessons. Additionally, to examine the
affordances of visualization of lesson slides, I also identify the actions that the
participants took while interacting with Depict that allowed them to attend to the
details of their lessons in ways they had not in the lesson plans.
Use of Graphic Features
Templates Depict includes templates of classroom shots. In this study, these were static
templates; specific characters were assigned to specific locations in the room, with
all students sitting in rows and columns, and users could not add characters or shift
their locations25. Users could choose a template as background for each slide from
six available templates that differed amongst themselves by the location of the
camera (and thus what part of the class was visible). Four templates provided a
25 A later version of Depict has more flexibility in adding characters and assigning their location, see Lessonsketch.org and Herbst & Chieu (2011).

247
view of a teacher who was seen standing at different locations, writing on the board,
or talking to the class. Another template provided a view of the students’ faces. The
last template was a close‐up shot of a blank board that allowed users to present
board content. While this template could show a close‐up shot of board content, the
templates with view of teacher also included a blank board and allowed users to
present board work.
Participants composed a total of fifty‐four slides to depict the lessons that they
had planned in text. Among those, thirty‐four slides offered a view of the teacher.
Twelve slides showed view of students. The majority usage of teacher‐centered
templates shows that the teacher role dominated these participants’ lessons. At the
same time, it is notable that the participants did anticipate students’ responses
because they represented them using the student‐view template.
Six other slides were shown with close‐up shot of board work. Regarding the
board work in lesson depiction, although there were only six slides with close‐up
shots on the board work, fifteen other slides showed board content on the templates
with view of teacher.
Two other slides were represented using no template and instead using a
blank background over which participants wrote descriptions of class activities. A
blank page was not initially one of the designed templates. However, the
participants made use of blank pages to describe class events that did not
necessarily require representation with graphic background.

248
Table 6.1 Use of Templates and Actions on Templates
Creatingabackground Changing
atemplate
Total
Selecting
atemplate
Duplicating
apreviousslide
Viewofteacher(noboardcontent)
19 0 0 19Viewofteacher
Viewofteacher(includingboard
content)
5 6 4 15
Total:34
Viewofstudents 11 0 1 12
Board 6 0 0 6
Blankpage 1 0 1 2
Total 42 6 6 54
Actions on templates I identified two major actions that the participants took on templates while
depicting lessons. In what follows, I will define these actions and discuss what I
observed participants doing.
The first category of action, creating a background, describes each of two
possible actions in Depict. One is selecting a template (from the given ones) and the
other is duplicating a previously composed slide. The former refers to how users
would start to compose a new slide from scratch: They clicked a pull‐down window
on the right hand side of the Depict canvas, choosing one template from a collection
of templates, and dragged this template onto the canvas. The majority of the
creation of lesson slides fell in this category.

249
Another action classified under creating a background consists of duplicating a
previous slide. Users could choose to duplicate a composed slide in order to retain all
its graphic elements. They could afterward make piecemeal changes (e.g., change of
board content). For this study, I only identified those duplicated templates that were
kept in the final sets of lesson slides. That is, a duplicated slide that got deleted in
the process of lesson depiction was not counted.
The participants as a whole did six duplication of slides. Of these six duplicated
slides, all included a view of the teacher; these slides also had board content. This
suggests that the participants made use of this feature to preserve the graphic
features, especially the board work, and carried them over to the following class
activities. The participants were aware of the board work as resources for the
subsequent class events.
There was no duplication of slides with view of the students. This may be
explained by the possibility that the participants, with little to no teaching
experiences would initially ignore student responses. Although the study shows that
the participants anticipated students’ responses using the template with view of
students, they only expected brief student involvement. A possible explanation is
that the participants assumed students’ engagement only occurred when they
would need to follow the teacher’s lead and would not dominate the class for a
longer period of time.
The second category of action, change of template, refers to the action whereby
users replace a selected template and depict class events on the replaced one. The

250
category changing a template describes each of the following possible series of
actions:
The first series of actions includes selecting a template, deleting it, and then
selecting another template. The second series of actions includes duplicating a
previous slide, deleting it, and then selecting another template. The third possible
series of actions includes selecting a template, moving it down the stack of slides,
and then selecting another template. The final possible series of actions includes
duplicating a slide, moving down the duplicated slide, and then selecting a new
template. When finally staying with a desired template, users may choose to
duplicate a previously created slide to retain the graphic background or select a new
template from the pull‐down window in the tool.
There were six incidents of changing a template while the participants were
depicting lessons. Among these six incidents, two‐thirds occurred when the
participants replaced the template background with board work. That is, they
attended to the need to continuously show the board work created in an earlier
activity. For example, they changed the virtual teacher’s physical placement in order
not to block the board work—They did that by changing the template with the
virtual teacher standing on the left side of the board to another template in which
the teacher was standing on the right side.
Other instances of changing a template could attest to the participants’
attention to students’ reactions. The participants tended to select a teacher shot or
duplicate a previous teacher‐shot slide for the subsequent event. However, when
viewing a template focused on the virtual teacher, they might realize the need for

251
students’ reactions in the subsequent event. This would explain why the
participants would move down the selected template, indicating they would save it
for later. They then selected a new template with the view of students or selected a
blank slide describing students’ responses.
Speech bubbles Users of Depict can add speech bubbles to the cartoon characters to represent
the dialogue between teacher and students. In specifying the dialogue, the
participants would need to elaborate the virtual teacher’s explanations and
instructions and consider possible student responses. I hypothesized that the
speech bubble feature would support users’ attention to details concerning subject
matter and student thinking.
The right end column in the following table (see Table 6.2) summarizes the
number of occurrences of speech bubbles in the lesson slides. In fifty‐four lesson
slides, fifty‐seven speech bubbles were created to represent either teacher or
students’ discourse. Among these speech bubbles, the number of speech bubbles for
the teacher was approximately one and half times the speech bubbles for students.
Table 6.2 Use of Speech Bubbles and Actions on Speech Bubbles
Creating Dragging Editing Formattingtext Total
Teacher’sspeech 23 0 12 1 36
Students’speech 16 3 2 0 21
Total 39 3 14 1 57
Actions on speech bubbles I identified four types of actions that users would take while using speech
bubbles in lesson depiction. The first type is creating a generic speech bubble. The

252
second is dragging, an action of the re‐assigning a speech bubble from one speaker
to another. A third is editing, an action of revising content in speech bubbles. The
fourth type of action is formatting the writing of the contents of the speech bubble.
The first type of action on speech bubbles is creating. Users have to click on a
“speech bubble” button on the right hand side of the canvas and a speech bubble will
appear on the template. Users then need to type in text to create the virtual
teacher’s or students’ discourse. To distinguish this type of action and the other
actions on speech bubble, I further define the creation of speech bubble (similar to
that of a template) as an action that does not involve any other action, such as
content change, once the speech bubble is created. From the analysis, approximately
two‐thirds of speech bubbles were created and with no other actions involved.
The second type of speech bubble action, dragging, refers to moving a created
speech bubble from the current character to another one. This action happened only
on students’ speech bubbles. It may imply that the participants were viewing
multiple students simultaneously and dragged the speech bubble around to assign
the responses to the students they thought would speak at that moment. In some
instances, the participants commented on their dragging of speech bubbles to reveal
their intention to involve more students in class activities.
The third type of action, editing, refers to how users revise the content of
speech bubbles they have already created earlier. This action may be observed from
several possible behaviors. Users may delete all content in a speech bubble and re‐
create new content in that speech bubble. Users may insert words or sentences in

253
the existing content. Additionally, users may remove the words or sentences they
consider redundant. Users may also modify word choices.
Fourteen instances of editing on speech bubbles occurred in this study. The
majority of these actions were aimed at revising the virtual teacher’s speech. Editing
mainly happened right after the participants read through a current speech bubble.
Among those incidents, two instances of editing occurred when the participants
were working on the first speech bubble they had ever created. From the other
analysis of this study (see Chapter 5, Case #1 and Case #2), these two instances
occurred when the participants intended to copy their lesson plan when beginning
to depict the lesson. However, after typing up the virtual teacher’s initial question to
the class, they found that they had not given enough detail in the virtual teacher’s
verbal instructions.
Editing also occurred when the participants reviewed a set of lesson slides
they had composed that far. They modified the word choices or articulated the
virtual teacher’s verbal expressions.
The fourth type of speech bubble action is formatting text. The formatting
function provided in the tool thus far was limited to capitalizing characters in text.
This action occurred once in the study while the participants capitalized certain
letters in the speech bubble to indicate emphasis that the virtual teacher would
make in her speech (see Case #4, Millie and Samantha’s work, Slide#22 and related
discussion). It may imply that the participants attended to how the teacher’s verbal
messages would be delivered in the real‐life situation. It also supports the

254
hypothesis that lesson depiction encourages prospective teachers to anticipate in
detail how their lesson would unfold.
Inscribe Inscribe is a board writing and drawing tool embedded in Depict. It allows
users to create board work for lesson slides. Users create background‐transparent
inscriptions using Inscribe and then attach those objects to slides, placing them on
the white board or on students’ sheets. In this study, the participants made use of
this tool to present mathematics problems to students or anticipate students’ work.
I identify three types of actions the participants performed with Inscribe. The
first type of action, creating new objects, refers to when users open Inscribe and use
any of the features, such as drawing a line or typing text, to produce an object they
intend to show on the board. In this study, a majority of participants’ actions in
Inscribe fell in this category.
The second action I identified is editing. It refers to users’ addition of elements
to or modification of an inscription already created. When users create the board
work, they have a chance to view the work either in Inscribe or after attaching it on
the board on the templates. Therefore, the action of editing may occur when users
are viewing the currently created object in Inscribe before attaching it to the blank
board, or when users are viewing the object from the board.

255
Table 6.3 Actions in Inscribe
ActionsinInscribe Numberofoccurrences
Creatingnewobjects 11
Editing 4
Attachingapre‐createdobject 1
Total 16
The analysis shows that four editions are done. The Inscribe tool allowed the
participants to specify and examine the written inscriptions and mathematical
representations they intended to show in their lessons. For example, from Case #2,
in Sienna and Pamela’s lesson slides, they created a graph they hypothesized a
student would draw on the board. However, when viewing it on the slide, the pair
found that they did not label the two axes. They then wrote “x” and “y” on the two
axes and additionally labeled the two variables. To do so, they argued, would help
clear students’ common confusion of x and y axes.
Further, the tool allowed the participants to inspect the mathematical
appropriateness of the mathematics problems they intended to adopt. For example,
in Beth and Serena’s lesson slides, they created a graph with two coordinate points
as an example adopted in their lesson. However, when viewing this example in
Inscribe, they thought the number choices in this example were too special as cases
and so they might confuse students. As a result, they modified the example.
The third type of action in Inscribe, attaching a precreated object, refers to an
action that users performed when they attached a previously made object, stored in
Inscribe, to a newly composed slide. This occurred only once: when the pair of
participants attached a set of graphs (two coordinate planes), drawn earlier on the

256
board from the previous slide, to the current slide in which the virtual teacher posed
a question regarding this set of graphs. This action shows that the participants were
aware of the need to show the board work consistently and identify the board work
as a resource for the assigned task. Although this type of action only happened once
in the study, the participants made use of another feature, duplicating slides, to
carry the graphic elements to the next slides (see related discussion in Template
section).
Caption boxes The caption box is a feature that allows users to describe events or note other
information that may not be possible to convey through existing graphic elements.
In this study, the participants employed this feature to represent various kinds of
events or objects in their lessons. Eighteen caption boxes were presented in the
lesson slides.
I differentiate these caption boxes according to how they related to the
temporality of events reported: Captions were classified into past, current and
future events. Seven caption boxes described events about what had happened in
the past, such as “the student came to the board and returned to his seat.” In
addition, there were seven caption boxes that showed events about what was
happening in the present. For example, a caption box described a student’s
unspoken thoughts at the moment. Finally, the participants made use of caption
boxes to specify future events in their lessons. For example, in Samantha and Millie’s
last slide, a caption box described what would happen after the virtual teacher
introduced the class a follow‐up activity: “Teacher hands out tables of values and

257
has students graph them and figure out the slopes.” Four instances of this category
were observed.
Table 6.4 Use of Caption Boxes and the Content Revealed in This Feature
Pastevent Currentevent Futureevent Total
Teacheraction 1 1 1 3
Studentaction 5 4 1 10
Teacher&StudentsInteraction 1 0 2 3
Boardwork 0 2 0 2
Total 7 7 4 18
I further examine how the participants utilized caption boxes to describe
teacher and student involvement in class events. Among the eighteen caption boxes
used in this study, over half were used to describe students’ actions. Besides, three
more caption boxes were used to indicate teacher and students’ exchanges in class.
The other three were used only to describe the teacher’s actions. Caption boxes
were also employed to show the current content on the board. For example, the
participants wrote “table” in a caption box on the board to indicate that a table
shown in a previous slide was still present.
From this analysis one can observe that the participants mainly employed
caption boxes to describe students’ involvement in class activities. This provides
evidence that supports the hypothesis that participants could anticipate and attend
to students’ possible behavior or reactions in their lesson depiction, an attribute not
apparent in their lesson plans.

258
Actions on caption boxes Caption boxes seemed to be used extensively for describing class events
involving teacher and students characters. However, over one third of the caption
boxes were not created at the moment the participants first composed the slide
where they would eventually be placed. I identify three major actions that the
participants made to include caption boxes on the lesson slides.
Table 6.5 Actions on Caption Boxes
ActionsonCaptionboxes Numberofoccurrences
Editingacaptionbox 4
Addingacaptionbox 2
Draggingacaptionbox 1
Total 7
The first action, editing, refers to users’ modification of the content in the
caption box. In four instances, the participants refined the content of caption boxes
to make the event descriptions explicit. For example, a pair of participants described
in a caption box that the virtual teacher was giving students graph papers to
accomplish a graphing task. When they were viewing this text, they edited it to
include coordinate axes in the graph paper. This instance shows that the
participants included more detail in their class event when viewing the slide. They
provided specific resources for students to complete the assigned task.
The second action, adding a caption box, occurs when users create a caption
box after they have finished composing a slide, have begun composing the following
slide, and then return to the preceding slide. Therefore, the creation of a caption box
on a slide while this is being composed would not count as adding a caption box. In

259
this study, two instances occurred in which the participants added caption boxes
when they were reviewing a set of lesson slides they had created. One pair of
participants added a caption box to indicate that time had passed and students had
pondered the question posed earlier. This attention to time was absent in their
lesson plan. Another instance occurred when a pair of participants added a caption
box to show the order of multiple speech bubbles and events presented on the same
slide. It may suggest that the participants were aware of the temporality of class
events.
The third type of action, dragging a caption box, similarly to dragging a speech
bubble, refers to users’ re‐assigning of a caption box they had created in one
location (character) to another location (character) on the same slide. There was
one instance of dragging a caption box. This caption box was describing a student’s
unspoken thoughts. The participants first assigned this caption box to a student who
simultaneously answered the question. However, when the pair was viewing the
slide of the view of students, they decided to have another student involved, thus
dragging the caption box with the unspoken thought to this student. This case
resembles the one of dragging a student’s speech bubble in that both represent
students’ thinking; after viewing the slide of the view of students, the participants
involved more students verbally or nonverbally in class events.
Gestures The version of Depict used in this study contained icons that represented
hand‐arm gestures. In the template with view of students, student characters had
not been given hands or arms. It was expected that if the participants would

260
anticipate instructional meanings conveyed through students’ gestures they would
add these graphic elements to student characters.
The participants assigned students two types of gestures. In most cases,
student gestures were shown as raising a hand when trying to respond to teacher’s
questions. In other instances, multiple students were assigned writing gestures to
illustrate they were working on the assigned tasks. Participants did not use any of
the other icons for gestures available in Depict.
In the templates with view of the teacher, the teacher character was given both
arms. Participants could have depicted lessons without changing teacher’s gestures
or locations. However, in this study, the participants added gestures to the teacher
in two occasions. These two instances show that the participants closely attended to
the teacher’s instructional behavior.
In the first case, the participants assigned extra gestures to the virtual
teacher26 to show that the virtual teacher was speaking. Another case happened
when the participants added pointing gestures beside the graphs on the board while
these gestures were detached from the virtual teacher’s body. This addition allows
them to demonstrate that the virtual teacher was pointing to the board content
while explaining. This addition overcame the graphic constraint that the virtual
teacher character was static on the given templates. This instance also shows that
when depicting a lesson, the participants were aware of the role of the teacher’s
gestural interactions with students during instructions
26 The gestures assigned to show the virtual teacher’s speaking may not be shown in the final version of lesson slides due to a programming bug: The objects created from Inscribe blocked the gestures.

261
Table 6.6 Use of Gestures on Characters
Character’sgesture Numberofoccurrences
Notes
Teachergesture 4 2attachedtothevirtualteacher’sbody
2detachedfromthevirtualteacher’sbody
Studentgesture 9 6raisinghand
3writing
Total 13
Facial expressions There are six types of facial expressions available in the version of Depict used
here. The following table summarizes the number of occurrences of each type of
facial expression presented on the teacher or student character in the participants’
lesson depiction.
Table 6.7 Use of Facial Expressions on Characters
Neutral Neutralspeaking
Excited Uncertain Bored Confused
/Frustrated
Total
Teacher 0 8 5 0 0 0 13
Student 5 7 2 4 3 2 23
Total 5 15 7 4 3 2 36
Table 6.7 shows that the participants in this study anticipated more student
facial expressions than teacher expressions. The participants made use of many of
the facial expressions to anticipate students’ responses.
In the above section, I discussed the participants’ use of graphic features in
Depict, and their various types of actions with each feature. In the following section,
I further examine how visualization of graphic elements on lesson slides plays a key
role in enabling the participants to attend to the detail in instructional moves and

262
students’ reactions that did not catch their attention in their initial compositions of
lesson slides.
Visualization of Lesson Slides To depict a lesson through lesson slides, the participants needed to utilize
different kinds of features and integrate them in Depict. As discussed, the
participants made use of graphic features and employed them differently to depict
their lessons.
While the employment of graphic features differed, visualization of these
graphic features played a key role in further prompting the participants to elaborate
and revise their lessons. Particularly, the participants, through visualizing partially
or wholly completed lesson slides, attended to detail in their instructional moves
and students’ possible reactions.
In the following table (see Table 6.8), I synthesize the participants’ actions,
specifically involving changing graphic elements or content in their lesson slides. I
also examine the moment in which they made these changes. To do this, I identify
two specific phases, viewing and reviewing, that enabled the participants to refine
their lessons.
I define viewing as a phase that occurs when users are looking at the slide they
are currently composing and have not yet gone to compose the next slide. It may be
a semi‐composed slide or a slide just completed. In contrast, reviewing is defined as
a phase taken after they have composed several slides and they then view through
that series of slides.

263
It is important to identify at which phase participants’ certain actions on the
slides occurred. This identification can show that visualizing slides, including
viewing and reviewing, helps the participants attend to instructional issues they
neglected when planning in the text‐based format or when composing lesson slides
earlier.
Table 6.8 Phases in Which Changes in Lesson Slides Occur
Template Speechbubble Inscribe Captionbox
Changing Editing Dragging Editing Editing Dragging Adding
Viewtochange
6 9 3 4 4 1 0
Reviewtochange
0 5 0 0 0 0 2
Among the actions on graphic features discussed earlier, changing templates
and editing on speech bubbles, using the Inscribe tool and caption boxes are major
actions related to making changes in lesson depiction. Additionally, dragging speech
bubbles and caption boxes reveal that these graphic objects, initially assigned to one
character, could be changed to another character on lesson slides. Finally, adding
caption boxes was seen as a modification to lesson slides.
The majority of the actions related to revising lesson slides occurred when the
participants were viewing the slides. It shows that the visualization of a lesson slide,
whether partially or wholly completed, helped the participants to examine and
refine the instructional events presented on this format; while planning a lesson in
the text‐based format cannot afford such opportunity.

264
Some other actions related to revising lesson slides occurred when the
participants were reviewing the slides. First, the actions of adding caption boxes on
lesson slides were taken during the participants’ review. Additionally, more than
half of the editions in speech bubbles were made during the participants’ review.
Specifically, these editions were all on the teacher’s speech bubbles. The
participants refined the virtual teacher’s verbal instruction, such as providing an
explanation of a given table or giving a more specific explanation of a concept, so as
to make it more comprehensive to virtual students and help them to accomplish the
tasks assigned later on.
The result shows that reviewing a set of composed lesson slides allowed the
participants to perceive their lessons as sequential and continuous instructional
events that they are able to examine them. Particularly, the participants could
manage the consistency of the mathematical tasks in the lesson, and anticipate the
teacher’s instructional moves and students’ possible thinking accordingly.
Conclusion In this chapter, I examined the use of each graphic feature in Depict and
identified types of actions on each feature. The different applications of graphic
features in lesson slides seemed to indicate the participants’ attention to different
aspects in instruction.
Regarding the use of templates, the majority usage of teacher‐view templates
shows that the teacher role dominated the participant’s lessons. The use of student‐
view template indicates the participants’ anticipation of students’ responses. The

265
presence of board content in slides demonstrates the participants’ attention to
written inscriptions and presentations of content in their lessons.
Similar to the use of templates, the assignments of speech bubbles to different
characters may reveal the users’ lesson anticipation involving teacher and student
roles. The creating and editing of speech bubbles afford the users opportunity to
elaborate the verbal messages communicated in lessons. The dragging of student
speech bubble reveals that the participants attended to multiple individual students
and intended to involve more students’ participation in lessons.
The creation or edition of objects using Inscribe, the board writing and
drawing tool, allow the participants to generate and examine the appropriateness
and the correctness of their presentations. The use of caption boxes allowed the
users to describe teacher and students actions or teacher‐student interactions. The
use of facial expression and gesture features on slides allowed the participants to
attend to the teacher’s or the students’ nonverbal reactions in lessons.
Visualization of graphic features played an important role in allowing the
users to reflect and revise their lessons. The users’ modifications of graphic
elements or content occurred in the viewing and reviewing phases. It appears to
show that Depict is a “milieu” (Brousseau, 1997) that the visualization of a single
lesson slide or a series of completed slides provides feedback for the users to
examine and to detail the moment‐to‐moment teacher‐student interactions. This is a
unique feature and support that planning a lesson in text cannot provide.

266
7. CHAPTER 7
CONCLUSION
The results of the study provide evidence that Depict, a technology tool that
allows creating comics‐based lesson slideshows to represent interactive aspects of
lessons, enables prospective teachers to attend to instructional issues that they had
not considered when planning. In the following sections, I present a summary and
explanations of the findings, limitations and implications of the study, and
suggestions for future research directions.
Revisiting the Research Questions In this section, I summarize the findings in Chapter 4, 5, and 6 as answers to
my research questions.
1. How do anticipations of classroom interaction about a planned lesson
differ when done using a multimedia lessondepicting environment as
compared with talking through the written lesson plan?
The prospective teachers’ lesson planning strategies in the text and verbal
conditions share similar traits, which have been identified in the literature. Their
lessons consisted of sequences of activities in which the teacher plays a leading role
that initiates those activities (Clark & Yinger, 1979, 1987; McCutcheon, 1980). The
prospective teachers seemed to fail to consider how they would interact with their
students during instruction, in particular how they would orchestrate explanations

267
that attend to student thinking and advance their learning. This lack of
consideration of teacher‐student interaction has been recognized in novice teachers’
lesson planning (Borko & Livingston, 1989; Leinhardt, 1993; Peterson, et al., 1978;
Roskos & Neuman, 1995). This lack of consideration of teacher‐student interaction
when planning can leave novice teachers unprepared to appropriately respond to
unexpected questions or answers from students (Livingston & Borko, 1990; Nicol,
1998; Zimmerlin & Nelson, 2000). Attending to student thinking is an important
issue that teacher educators and researchers have sought to address (Ball, 1997,
2001; Ball, et al., 2008; Crespo, 2000; Franke & Kazemi, 2001; Kazemi & Franke,
2004). It is important to engage prospective teachers in lesson planning activities
that facilitate their attention to student thinking.
When describing lessons verbally, the prospective teachers were better able to
anticipate students’ involvement than when they wrote written plans. However,
they perceived students in a passive role, simply receiving the teacher’s instruction.
Additionally, the prospective teachers saw students as a collective and did not
anticipate individual students’ involvement. Anticipating students’ possible
responses and anticipating how to interact with those responses are important
practices in planning and teaching (Ball, 1997; Crespo, 2000; Franke & Kazemi,
2001; Schoenfeld, et al., 2000). This lack of attention to student individuality may
prevent prospective teachers from envisioning students’ possible thought processes
and responses, and consequently prevent them from generating instructional
strategies that might respond to students’ reactions.

268
When depicting lessons, the prospective teachers anticipated more teacher
and student involvement in their lessons than their counterparts did when
describing lessons orally. The prospective teachers who depicted their lesson
particularly anticipated that the “teacher” could be a passive role that students
interact with. Further, while the prospective teachers in lesson description did not
envision any individual student participation, Depict participants considered
students’ individuality in their lessons.
2. What do prospective teachers attend to in the work of teaching when
engaged in depicting a lesson?
a. What do prospective teachers anticipate regarding teacher
involvement in a lesson?
Overall, the prospective teachers specified teacher’s instructional moves when
depicting lessons. In particular, they composed carefully what the teacher would
say, such as the explanations and the presentations of problems that a teacher
would need to provide for enhancing student understanding (Borko & Livingston,
1989; Lampert, 2001; Leinhardt, 2001; Livingston & Borko, 1990). They also
attended to the representations of concepts and the arrangement of the board
content (Lampert, 2001; Leinhardt, 1993; Leinhardt & Steele, 2005). They examined
the mathematical appropriateness of instructional examples given in tasks (Mason
& Pimm, 1984; Zaslavsky & Zodik, 2007; Zodik & Zaslavsky, 2008). In addition, they
specified the teacher’s behavior in the classroom (Leinhardt, 1993; Rosebery, 2005).
b. What do prospective teachers anticipate regarding student
involvement in a lesson?

269
The prospective teachers individualized students’ participation in lessons.
They attributed personality to students so as to anticipate students’ possible actions
and thinking. They attended to the simultaneity of students’ participation in lessons
(Doyle, 1986). They became aware of students’ non‐verbal participation, including
gestures, facial expressions and unspoken thoughts (Lemke, 2002). Further, the
prospective teachers hypothesized students’ thinking and prior knowledge (Ball,
1997; Even & Tirosh, 1995). They also anticipated students’ uncertainty or learning
difficulties (Lampert, 2001; Schoenfeld, et al., 2000).
c. What do prospective teachers anticipate regarding
mathematical work involved in a lesson?
Overall, the activity of depicting lessons allowed the prospective teachers to
examine the design of mathematical tasks. Specifically, they attended to the
connected nature of adjacent tasks and sought to make connections or consolidate
the tasks. They also became aware of the need for decomposing tasks so as to make
them manageable and workable. To help students better accomplish the
mathematical tasks, the prospective teachers tended to provide resources in
different forms. For example, the prospective teachers demonstrated an example of
the task so as to make it easier for students to accomplish the task on their own. In
another example, the prospective teachers gave an explanation of the given
representation (a table) to help students better understand the given information of
the task.
3. How do prospective teachers employ the graphic resources to support
their lesson depiction?

270
From the observation of the use of the graphic features and user behaviors in
Depict, the visualization of lesson slides seems to play an important role in
encouraging prospective teachers to discuss and modify their anticipation of
interactions with virtual students. By viewing and reviewing, the prospective
teachers got feedback and were thus able to examine, elaborate and revise their
design of lesson events. It formed feedback loops from a “milieu” (Brousseau, 1997)
that affords opportunities for the learning of teaching .
Learning from Interaction with a Milieu In a learning situation, a learner acts on a milieu and gets feedback from such
milieu (Brousseau, 1997). When the prospective teachers started creating lesson
slides using Depict, they generally viewed the task as being simply to copy what had
been written in their lesson plans. However, when viewing the partially or wholly
completed slides, they became aware of the need to develop more detail in their
lessons and attend to moment‐to‐moment interaction between teacher and
students.
Figure 89 illustrates the prospective teachers’ experiences in anticipating
lessons using the Depict tool. When depicting a lesson, the prospective teachers
employed different graphic features available in Depict. The feedback was conveyed
through their interpretation of graphic representations of class interactions.
Through this sequence of action and feedback loops, the prospective teachers were
able to examine, reflect and refine their lessons.

271
Figure 89. The interaction with milieu in Depict
For example, in depicting a lesson, the prospective teachers first created a
speech bubble on the slide containing a question that the teacher would pose to the
class. However, when reading the content of that speech bubble and viewing the
slide, the prospective teachers found that they had not yet provided enough context
and information to enable students to answer the question. As a result, they
modified the question in the speech bubble and proceeded to probe what would
happen after.
The results from analyzing the use of graphic features and users’ behavior in
Depict show that the prospective teachers made changes on their lesson slides after
viewing or reviewing them. They attended to instructional issues they had not
previously been aware of. They specified what the teacher would say, instead of just
describing class activities in general terms. They also attended to students’
individual or collective involvement in class activities.
However, as the feedback from depicting a lesson may be influenced by the
effect of “ the apprenticeship of observation” (Lortie, 1975), the learners may act on
the depiction of a lesson based on what they think the teaching should be like.
Although the learners can learn to attend to instructional details that they have not

272
had before, they do not necessarily learn exemplary instruction. Due to this, the
limitations of the study and suggestions for supporting the interaction with milieu
will be discussed in later sections.
Graphic Representations as Semiotic Resources Mediating Learning
The study involved a comparison between two groups: Lesson description and
Depict. These two groups formed two different activity systems (see Chapter 1) in
that the tools involved in the systems were different, thus the outcomes are
expected to differ (Engeström, 1993, 1999). The tools in the lesson description
activity system available for pairs of prospective teachers included the lesson plans
and their language. The tools for Depict teachers to anticipate lessons were the
lesson plans and the Depict.
This study shows that the extent to which the prospective teachers anticipated
lesson details, regarding teacher and students roles’ involvement in class events,
varied in the two groups (see Chapter 4). The results reveal that the prospective
teachers using Depict anticipated more teacher and student involvement in their
lessons. They attended to students’ individual or collective active participation;
while the teachers in the lesson description condition were more likely to view
students collectively as passive participants.
This finding suggests that the graphic resources in Depict play a key role in
facilitating the prospective teachers’ anticipating teacher‐students interactions in
lessons. These graphic features encouraged the prospective teachers to create,
review and revise their representations of lessons. Hence, the comics can be seen as
273
semiotic resources (Herbst, et al., 2011) that mediate the pairs of prospective
teachers’ discussion about the ways of virtually enacting their lessons. The comics‐
based semiotic resources mediate the teachers’ generation of teacher‐student
moment‐to‐moment class interactions.
Approximations of Practice in Depicting Lessons Approximations of practice provide novices with opportunities to practice
their professional work in settings with different degrees of authenticity (Grossman,
et al., 2009). The activity of planning a lesson may be considered as a less authentic
approximation of practice if teachers only select learning activities and determine
topics to be covered. It does not require one to fully participate in the context of
interacting with a class of students. However, the activity of anticipating a lesson in
Depict affords the prospective teachers the opportunities to virtually enact their
lesson and engage in simulated instruction.
Indeed, this study shows that the lesson plans generated in text or verbally
included mathematical tasks that were impractical to implement and lacked detail
regarding interactions with students (Leinhardt, 1993). These lessons did not
illustrate the “nature of classroom activity”, and they were “simply a collection of
sequentially described actions by teachers and students” (Leinhardt & Steele, 2005,
p. 99). On the other hand, the prospective teachers who used the Depict tool to
create comics‐based lesson slideshows immersed themselves in the classroom
setting and demonstrated their capacity to incorporate detailed instructional
actions by the teacher, student reactions, and mathematical tasks in their lessons.
The prospective teachers unpacked their planned discrete class activities and

274
attended to their relational nature among teacher, students, and mathematics
(Cohen, 2011; Cohen, et al., 2003; Lampert, 2010). The activity of depicting lessons
affords the novices opportunities to approximate the interactive nature of teaching
practice by accessing and practicing “elements of interactive teaching in settings of
reduced complexity” (Grossman & McDonald, 2008, p. 190).
Depict should not be seen as merely a lesson planning software tool. Creating
comics‐based lesson slideshows is a contextualized learning environment
(Rosebery, 2005). For example, when depicting a lesson, the prospective teachers
enriched the substance of the instructional dialogues for the purpose of advancing
students’ learning. In particular, the prospective teachers elaborated the
presentations and explanations of the mathematics problems posed to students, so
as to help students better understand the questions. The activity of preparing
appropriate presentations and comprehensive explanations prior to teaching
practice has been identified in expert teachers’ lesson planning or lesson agendas
(Borko & Livingston, 1989; Lampert, 2001; Leinhardt & Steele, 2005). Depict
provides a tool for prospective teachers to approximate this aspect of teaching
practice.
Depict invited the prospective teachers to generate examples that they
intended to employ in their lessons, and examine the ”correctness” (Zodik &
Zaslavsky, 2008) of these examples. While useful examples are crucial in supporting
the learning and exploration of mathematics concepts, choosing appropriate
examples is challenging and requires special kinds of teacher knowledge (Hiebert, et
al., 1997; Leinhardt, 2001; Leinhardt & Steele, 2005; Zaslavsky, 2010). Depict

275
provides a context for prospective teachers to formulate instructional examples,
thus potentially developing their knowledge for teaching.
The comics‐based environment is not photorealistic. However, the ways in
which Depict engaged prospective teachers in approximating the teaching practice
can be considered a type of “pedagogy of enactment”(Grossman & McDonald, 2008;
Kazemi & Hubbard, 2008). It engages prospective teachers in experiences that
“simulate the sorts of situations teachers confront in the midst of instructional
practice and thus engage teachers in the ways of knowing involved in classroom
teaching” (Kazemi & Hubbard, 2008, p. 438), and it demonstrates its high degree of
authenticity in relation to practice (Grossman, et al., 2009).
Limitations
Limitations of Depict While Depict is a “milieu” (Brousseau, 1997) that allows prospective teachers
interact with graphic features and thus generate learning, the quality of the
feedback that users get from the “milieu” may be tainted by the effect of “ the
apprenticeship of observation” (Lortie, 1975). The users/learners may depict a
lesson based on what they think the teaching should be like. In this way, the learners
can attend to details of instruction that they have not been aware of and thus learn
the work of teaching. But the learners do not necessarily learn instruction that is
exemplary according to any specific criterion.
In the analysis done for this study, several instances were found that the
participants did not have competent knowledge in mathematics and did not have
good understanding of students’ knowledge. The lack of sufficient mathematics

276
knowledge for teaching resulted in an improper and impractical design of teacher‐
student interactions. Hence, it would be helpful to provide learners with immediate
and timely resources and feedback to compensate for these shortcomings. External
resources, such as textbooks and student work artifacts, can help prospective
teachers to identify students’ prior knowledge and ways of thinking or common
misconceptions. Therefore, future research is needed to investigate the ways in
which a virtual setting with various types of resources enables teachers to develop
practice‐based knowledge for teaching.
Limitations of the study A limitation to this study concerns the size of the sample. A future study
should be conducted with a larger sample of prospective teachers. While this study’s
detailed examination of prospective teachers’ depicted lessons and verbal
descriptions of lessons helped to explore the quality and nature of these two types
of activities, it is needed to investigate the work of lesson anticipation produced by a
larger sample of prospective teachers, in order to make more valid claims.
Despite this limitation, this study explored the affordances of using graphic
resources in Depict to attend to instructional details. The study found that the
prospective teachers attended to instructional moves, mathematical tasks and
student thinking when using the tool. The findings provide a rich description of the
language used during the activity of depicting a lesson, thus generating a list of
advantages of using Depict. This study also identified different characteristics of
lesson anticipation when done with two different mediation tools (verbal
description and Depict). Future research conducted with a larger number of

277
prospective teachers could be helpful in discovering more characteristics of lesson
anticipation using the Depict tool and could provide further grounds to
conceptualize the activity of depicting a lesson. This would be helpful in developing
a checklist or a rubric for assessing teachers’ lesson planning and anticipation.
Another limitation to this study is that the participants were not asked to
revise their written lesson plans after they had anticipated their lessons using
Depict. A future study could be conducted with a follow‐up lesson plan revision after
users anticipate lessons in Depict. In this way, it can be examined whether and in
what ways prospective teachers’ learning about instruction has attained.
One other limitation of the study is the limited use of Depict: the participants
only used the Depict tool once. Systematic incorporation of the Depict tool into
activities in a teacher preparation program should be considered and studied. In
this way, the development of teacher knowledge could be tracked and investigated,
and the impact of learner‐generated representations of teaching in teacher learning
could be examined. It would be useful to determine in what ways the Depict tool
supports the development of teacher knowledge and what specific aspect of
knowledge is enhanced. It would be also useful to examine whether and how the
learning experience in Depict impacts prospective teachers’ actual teaching practice.
Future applications of the Depict tool in teacher preparation settings are
suggested as follows: The lesson slides created from Depict could serve as records of
a prospective teacher’s practice in learning teaching. These representations could
become references for future enactment of lesson activities. In addition, these
artifacts could be seen as “common media”, like videotaped or animated

278
representations of teaching, to elicit discussion about teaching and learning among
peers or with teacher educators (Herbst, et al., 2011; van Es & Sherin, 2002) and
hence promote insights into the complexity of teaching. Furthermore, the ways in
which prospective teachers create Depict lesson slides can serve as an indicator of
the degree of their attention and sensitivity about instructional issues. These
representations can be used for evaluating teacher learning.
Implications for Practice The study’s findings have implications for teacher education. The study
suggests that lesson planning is a contextualized learning experience. Instead of
imagining “what” to do in a lesson (Casey, 2000), teachers should be engaged in
experiences that help them imagine “how” the events of lessons would unfold. While
learning to plan a lesson is a common activity that prospective teachers do during
their teacher preparation programs and scaffolding tools have been provided to
engage prospective teachers in developing thorough lesson plans, the study
suggests a comics‐based virtual environment for prospective teachers to immerse
themselves in the “imagined classroom” (Rosebery, 2005) as the teacher role in the
classroom setting. By anticipating moment‐to‐moment teacher‐students
interactions, this tool enables prospective teachers to simultaneously attend to
teacher moves, students and mathematics, the essential elements in instruction.
The findings also imply that in order to engage prospective teachers in
learning about and to do the work of teaching, teacher educators should consider
directing prospective teachers’ attention to issues of temporality, multimodality and
multivocality in instruction (Herbst, et al., 2011). The study reveals that the

279
prospective teachers attended to issues of temporality, multimodality and
multivocality in instruction when using Depict. In Depict, the prospective teachers
viewed and reviewed lesson slides. This allows them attend to temporal aspect in
teaching‐‐ examine, arrange and modify the temporal order of instructional events.
The awareness of temporality seems to help the prospective teachers to examine
and refine mathematical tasks in their lessons.
Another important characteristic of anticipating lessons using Depict is
allowing prospective teachers to attend to student involvement. By creating board
content and viewing templates of classroom, the prospective teachers attended to
multimodal communication with students regarding mathematics content. Further,
the prospective teachers attended to multiple students’ diverse responses in their
lesson anticipation.
In particular, students were seen as individual active participants.
Individualizing students can help the prospective teachers further attend to
students’ thinking. There have been great efforts in developing teachers’ ability to
attend to student thinking (Crespo, 2000; Franke & Kazemi, 2001; Kazemi & Franke,
2004). For example, a lesson planning tool, Thinking Through a Lesson Protocol
(TTLP), is proposed to guide teachers focusing on students’ mathematical thinking
and implementing mathematical tasks while planning lessons (Smith, et al., 2008).
The activity of depicting a lesson provides an alternative approach to develop
novices’ knowledge about student thinking in relation to mathematical tasks.
The study’s findings also suggest that prospective teachers may benefit from
generating comics‐based representations of teaching on their own. Different forms

280
of representations of teaching have been extensively employed in teacher education
settings. The ways in which these representations of teaching are utilized differ.
However, learners of teaching are generally considered to be consumers or
observers of these artifacts (Crespo, et al., 2011). This study provided opportunities
for novice teachers to generate their own representations of teaching. This activity
allowed them to anticipate what their teaching might look like, examine the lesson
events, and simultaneously attend to instructional detail that they have not been
aware of.
A possible follow up to this study could compare depiction with other lesson
anticipation activities that did not involve depiction: Might they also facilitate
prospective teachers’ learning to attend to temporality, multimodality and
multivocality in instruction. For example, teacher educators could ask prospective
teachers to create classroom dialogues to anticipate how their lesson would unfold.
These dialogues could be contrasted with uses of the Depict tool. They could be
useful for understanding novices’ learning about instruction and teaching with
different resources. Specifically, it would be helpful to detect whether learner‐
generated comics‐based representations of teaching play a unique role in
prospective teachers’ learning to teach.
Implications for Research This study suggests that comics‐based representations of teaching could be
semiotic resources that mediate prospective teachers’ learning about instruction.
There have been extensive studies and discussions about semiotic resources
employed in classroom learning. For example, the use of discourse, gestures, signs

281
and symbols play important roles in facilitating students’ mathematics and science
learning (Arzarello, et al., 2009; Lemke, 2002; Roth & Lawless, 2002). However, the
use of semiotic resources in teacher learning has not been fully discussed and
explored, especially comics‐based resources. Therefore, further studies could
investigate the ways in which graphic resources facilitate prospective teachers’
learning to teach.
The analysis of Depict users’ generating class events via graphic
representations is a methodological contribution of the study, showing how to
transcribe depicting actions in software tool into text and then how to analyze such
transcriptions using linguistic tools. As a result of transcription and analysis, I was
able to determine the class events anticipated through graphic representations. This
method helped me to compare the class events generated through other activities
(i.e. written lesson plan, verbal lesson description). This transcription is necessary
and crucial because it allows identifying the ways in which teachers anticipate their
lessons and comparing them. It would be helpful to develop a thorough
transcription system to transcode the depicting actions on Depict using Systemic
Functional Linguistics (SFL) terms.

282
APPENDICES
Appendix A Students’ Mathematical Conceptions
Patricio Herbst
Students don’t come to us as empty slates. They know things. And they use what they know to handle the problems we give them. They do that even when their answer is not the one we wish they gave—students’ errors can often be explained in terms of what they know rather than in terms of what they don’t know. For example, when a 5th grader writes that 7 – 9 = 2, one can explain what they were thinking by realizing that earlier in life, when the student started doing subtractions, he learned to subtract the smaller from the larger. It is likely that the student thought about that problem as 9 – 7. To teach secondary mathematics we need to be aware of what students already know. This is important because we will be posing problems to them and expecting them to use their knowledge to make sense of those problems. It is also important because they will be answering those problems, often erroneously. These errors show evidence of the ways that students are connecting new experiences with old knowledge, not deficiency or ill will on their part. As teachers we need to learn to embrace student errors. We need to work with students’ errors. When teaching a new concept in high school, it is unlikely that the concept will have no relationships with concepts students knew from before. For example, subtraction among integers is related to subtraction among whole numbers in that both of them “undo” addition or that both of them can be represented as moving to the left in the number line. We will be helping both our students and ourselves if we take old knowledge into account when we teach new knowledge. But new ideas will be somewhat different than the prior knowledge. For example, subtraction among integers can hardly be thought of as “take away,” without having to complicate the metaphor. (You could use “take away” by thinking about going into debt when you take away more than you had, but the interpretation gets increasingly strained for calculations like -9 -7:“If I am missing 9 stuffed animals and my sister steals 7 from me, how many stuffed animals will I be missing?”). Since new ideas will be different from what students already know, as teachers we will not only have to work with those existing ideas but also against them.

283
Our job is to create conditions for students to question what they know and make it evolve into something new. In secondary mathematics, ideas get much more complicated than subtraction, so it is important for you to investigate deeply what students may know that can assist them in learning new ideas and that can prompt them to make errors. In the above analysis of subtraction, we used three “conceptions” of subtraction to make sense of what may be happening when you bring students from subtraction among whole numbers to subtraction among integers. Those conceptions were:
• Subtraction is taking away • Subtraction is moving to the left on the number line • Subtraction is undoing addition
Mathematically, you know that the third one (undoing addition) is the most general one. But for teaching, you need to know all of them, since all of them are useful at different times. (For example, “take away” is great to make up problems for young children.). The rest of this document will illustrate for you the conceptions students have of one of the most important ideas in schooling: the idea of linearity and, especially, students’ conceptions of slope.
Conceptions of slope Consider first the following overview. It provides four conceptions of linear function, that we could call (going around, counterclockwise) “table,” “proportion,” “equation,” and “graph.” The figure presents them in abstract language to appeal to your mathematical taste, and makes the point that all of them are mathematically correct. They can be useful at different times and they can bring up different kinds of errors.

284
In friendlier (but less exact) terms you could express those conceptions as follows
• A linear function is a table where the quantities vary at the same rate • A linear function is a proportion between two quantities • A linear function is a formula that says what to do to one quantity to get the other • A linear function is a straight line
Each of those conceptions brings with it a conception of slope.
• Slope is the rate of change of the quantities in a table • Slope is the scale factor of the proportion • Slope is the factor one multiplies the independent variable by • Slope is the tangent of the angle that the line makes with the X-axis (or a measure
of the steepness of the line) Let’s see them with examples and also anticipate some errors. Table Operations:
That when displayed in tables such as X Y x1 y1 x2 y2 x3 y3 x4 y4 have that
for any two associated pairs of values xy
That when graphed on a Cartesian coordinate system fall on a Euclidean line
whose slope (tangent of the angle with the horizontal axis) equals the
constant ratio
That can be expressed as the set [(x,y), x ∈ X and y ∈ Y, such that y = m ⋅ x + b] where m and b are constants.
That vary proportionally (pending possibly a change of origin), namely Y-Y0=k*(X-X0).
Linear functions are particular kinds of correspondences between two numerical magnitudes X and Y

285
1. Subtract to find difference between y-values and between corresponding x-values, then compare differences to see if the rate is constant, or use the difference to “work up” to the desired value by repeated addition or multiplication according to the number of increases in x.
2. Subtract to find the differences between a pair of y values and the corresponding pair of x values. Compare those two differences by creating a ratio in simplest form. Choose different pairs and form their ratios to see if the rate is constant, or use the ratios to find a missing value.
Consider the linear function given by the following table
X Y 1 4 2 7 3 10 4 13
What is the slope? Easy, for each unit change in the X the Y changes by 3, so the slope is 3.
Students start having experiences with these kind of linear patterns early in elementary school. They actually see problems that look more like the following Continue the pattern past 20: 4, 7, 10, 13, … In these exercises it is tacit that the number you must give next in the pattern is the one that corresponds to the next (1 more) after the number you wrote before: the tacit independent variable is the set of whole numbers. This is apparent in problems like Complete the missing numbers in the pattern:
4 7 16 22
Now consider the following tables: X Y X Y 3 5 3 7 5 11
In the table on the left, What do you think students might say if you ask them what the slope is? What might they write for the y-value in the last row? 5 11
7 17 10 21 9 23 10
In the table on the right, what do you think students might say if you ask them to do two more rows of the pattern?
To find the slope in a table one would need to find how the changes in Y and the changes in X vary together. In the table on the left, that since a change in 2 in the x variable (5 – 3 = 2) corresponds to a change in 6 in the y-variable (11 – 5 = 6), then a change in 1 (10-9=1) which is half of 2, should correspond to a change in 3, which is half of 6, thus the corresponding value for 10 is 26. Likewise in the table on the right since a change of 5 corresponds a change of 10, and to a change of 2 corresponds a change of 4, then to a

286
change of 7 (to X=17) would correspond a change of 14, (Y=35) and to a change of 3 (to X=13) would correspond a change of 6. A common error students make is to continue the pattern in the Y-variable without using the X-value to control it. Proportion Operations: Cross multiply; algebraic manipulations, multiplication, division; find ratios of quantities; comparison; multiplying a quantity by a constant rate of change Consider the following situations:
• Fast-walkers burn calories rapidly during the first five minutes (the “ramp-up” stage) and then continue to burn calories at a steady (but lower) rate thereafter. If I fast-walk 15 minutes, I burn 45 calories during the first 5 minutes and 100 calories in total. How many calories would I burn if I fast-walk 30 minutes?
• Joe the Handy Man charged clients a flat “house call” charge plus a
fixed hourly rate. Last month we paid $65 for a one hour job, and this week we paid $95 for a 1.5 hour job. How much would Joe charge for a 2.5 hour job? How much for a half hour job?
• A cell phone carrier has a rate plan that gives 800 minutes for
$60/month, and another rate plan that gives 2000 minutes for $100/month. How much should I expect to pay for a plan that gives me 500 minutes?
Students have done problems of “this sort” since they started learning about multiplication. The problems sound like “proportion-type” problems, and with some extra considerations (e.g., calories spent in ramp-up time, fixed cost of house call, fixed cost for a phone line) they do have a proportion inside them. A student might solve the first problem, for example, by reasoning as follows: In the 15 minute walk, after the ramp-up I burn 55 calories in 10 minutes. In the 30 minute walk, after the ramp-up I walk for 25 minutes, so I need to solve the proportion
I can solve this by cross-multiplying:
and then solve for x by dividing by 10: x = 137.5. This is how many calories I burn after the initial ramp-up period, so the total I burn is 182.5 calories. Although the procedure one would follow for the other two examples would not be exactly the same as in the first, they can also be solved by proportional reasoning. What

287
would those solutions look like? How would they be different from one another? What kinds of mistakes would a student be likely to make, and why? Formula Operations: Use algebraic manipulations to put equations into slope-intercept form; substitute values for x and/or y, b, m in order to find other values. Consider the following expressions
Y – 3X = 5 Y – 5 = 3X
2X + 3Y = 5
What is the slope in each of them? What do you think students might answer? Graph Operations: Locate points; “up and over,” “rise over run,” or change in y over change in x for slope; eye the graph for steepness and direction; visualize and quantify shifts in the plane (e.g., seeing a line as being a translation along the y-axis of a line through the origin) Consider the following problems
• Suppose that you drew the line through points (15, 48) and (30, 96), what is the slope of that line?
• A line of slope 3 passes through (31, 96), does it also pass through (15,
48)? • Suppose that you drew the line through points (15, 48) and (31, 96),
what would be the y-value for x = 62? How do you think students might do those problems? What kinds of errors could you expect students to make? A concluding thought When students solve problems they reach to anything they know to produce an answer. Likewise when they learn from their teacher, they connect new ideas to the old ones they know. It is natural that within that sense making activity, some errors will appear. By knowing what students’ conceptions are and what errors they might make, we will be better prepared to understand what they are thinking and to plan how to teach them.

288
Appendix B Guiding Questions for Annotating Student Work
Some questions to focus your annotations (you need not answer all of these questions, they are given to orient you on what you might comment)
• Does the student's work include evidence that they were thinking about slope? What is that evidence?
• Does the student's work include evidence that they were thinking about linear functions? What is that evidence?
• If they were not thinking about slope or linear functions, what else might they have been thinking about? Is it reasonable for them to have thought about that?
• What might the student have been thinking that is not explicitly written? What is your evidence for this?
• What, if anything, is missing from the student's answer? • What terminology does the student use? Is it used correctly? If not, how is it
being used? • What notation does the student use? Is it used correctly? If not, how is it used? • What representations of "linear function" does the student use? Are they used
correctly? How are they used? • What further questions would you ask if you met the student?
About mathematics literacy:
• Does the work include verbal content? If so, is it written in full sentences? Is it coherent?
• Comment about the student’s use of logical connectors and other words that are important mathematically (e.g., so, such as, if/then, therefore, either/or, because, and, only if, etc.)
• Comment about the student’s use of symbolic statements—are they well written or are they ambiguous? For example, sentences that involve symbols like =, sentences that include product of quantities, etc.
• Comment about the student’s use of tables—are they completed well? Are they reliable to read off information? Does the student read the tables well?
• Comment about the student’s use of graphs and other pictorial representations. What assumptions do they make? Are conventions about the use of graphs respected?
• How is the work organized on the page? Is the "reading order" clear? Are the important elements of the student’s thinking written prominently on the page?
• If you were the student’s teacher, what (if anything) would you suggest be modified about the way the student communicates in writing
289
Appendix C Lesson Plan Worksheets
Teachers’ Names: Course: Lesson: Explanation of slope FYI: Relevant goals, from the MI Curriculum Framework As students mature from the middle school on, they develop a solid understanding of both linearity and proportionality. Students should Explore and describe visual and numeric patterns, including linear expressions and
patterns Explore patterns (graphic, numeric, etc.) characteristic of families of functions Connect an initial state to a final state and generalize a rule that describes a pattern of
change. Develop a mathematical concept of function and recognize that functions display
characteristic patterns of change (e.g., linear, quadratic, exponential). Tonight you are going to plan a 15-minute explanation of slope to your class placement (or, if not applicable, to a regular algebra I class). At this point in your development as teacher, we will understand a "plan" to be a timeline or a list of segments you make in a lesson (that is, indicating what is going to happen and when). (There is, of course, much more to planning than this — but for tonight we are going to focus on this facet only.) Your job has two parts. First, produce a timeline of your lesson, showing the order and duration of each segment. Second, describe each of those segments. The rubric on “explaining concepts” can help you figure out what to do. Use the following timeline to insert the intermediate points that define the segments in your explanation. Then describe those segments in the following pages. (The back shows an example timeline for another lesson.)
0 15

290
Example: Lesson on polygons Explanation of the formula for the number of diagonals of a polygon
1: Probe knowledge of “diagonal.” Pose “big” problem—how many diagonals in a polygon of 12 vertices? Hear some estimates. (1 min) Ask: wouldn’t it be nice to predict the number without having to draw and count? Let’s figure out if there is a pattern. Ask about a quadrilateral, a pentagon, hexagon, etc. (8 min) 2: Draw a table and put there the results they found. Ask if they see a pattern. Ask them to predict the value for 12. Add the column: diagonals through one vertex; complete table with class. Ask if they see a pattern. Ask them to predict the value for 14. (6 min) 3: Ask if they could predict a value without having to fill the whole table, say for 85 sides. Prompt for formula. Write formula and describe what each factor means. Explain why you divide by 2, common error. (7 min) 4: Give possible problems they will have to do. (4 min)
0 25
1 2 3 4

291
Segment #_____ In your description, please include: Checklist—in this segment we are… √ What is the mathematics that will be done? Problematizing the concept What will the teacher be doing? Connecting to prior knowledge What will students be doing? Representing the concept How long might it take? Exemplifying the concept Identifying core principles of the concept Identifying key errors Establishing the boundaries of the concept Assessing and holding students accountable Description of segment:

292
REFERENCES
Arzarello, F., Paola, D., Robutti, O., & Sabena, C. (2009). Gestures as semiotic resources in the mathematics classroom. Educational Studies in Mathematics, 70(2), 97‐109.
Bailey, B., & Konstan, J. (2003). Are informal tools better? Comparing DEMAIS, pencil and paper, and authorware for early multimedia design. Proceedings of the ACM Conference on Human Factors in Computing Systems (Vol. 5 pp. 313‐320). Ft. Lauderdale, FL.
Bailey, B., Tettegah, S., & Bradley, T. J. (2006). Clover: Connecting technology and character education using personally‐constructed animated vignettes. Interacting with Computers, 18(4), 793‐819.
Ball, D. L. (1997). What do students know? Facing challenges of distance, context and desire in trying to hear children. In B. J. Biddle, T. L. Good & I. F. Goodson (Eds.), International handbook of teachers and teaching. Dordrecht, The Netherlands: Kluwer.
Ball, D. L. (2001). Teaching, with respect to mathematics and students. In T. Wood, B. S. Nelson & J. Warfield (Eds.), Beyond classical pedagogy : Teaching elementary school mathematics (pp. 11‐22). Mahwah, N.J.: Lawrence Erlbaum Associates, Inc.
Ball, D. L., & Cohen, D. K. (1999). Developing practice, developing practitioners: Toward a practice‐based theory of professional education. In G. Sykes & L. Darling‐Hammond (Eds.), Teaching as the learning profession: Handbook of policy and practice (pp. 3‐32). San Francisco: Jossey Bass.
Ball, D. L., Thames, M. H., & Phelps, G. (2008). Content knowledge for teaching: What makes it special? Journal of Teacher Education, 59(5), 389‐407.
Beardsley, L., Cogan‐Drew, D., & Olivero, F. (2007). Videopaper: Bridging research and practice for pre‐service and experienced teachers. In R. Goldman, R. Pea, B. Barron & S. Derry (Eds.), Video research in the learning sciences (pp. 479‐493). Mahwah, NJ: Erlbaum.
Borko, H., & Livingston, C. (1989). Cognition and improvisation: Differences in mathematics instruction by expert and novice teachers. American Educational Research Journal, 26(4), 473‐498.

293
Borko, H., Livingston, C., McCaleb, J., & Mauro, L. (1988). Student teachers' planning and post‐lesson reflections: Patterns and implications for teacher preparation. In J. Calderhead (Ed.), Teachers' professional learning. Philadelphia, PA: The Falmer Press.
Brousseau, G. (1997). Theory of didactical situations in mathematics: Didactique des mathématiques, 19701990 (N. Balacheff, M. Cooper, R. Sutherland & V. Warfield, Trans.). Dordrecht ; Boston Kluwer Academic Publishers.
Bryan, L. A., & Recesso, A. (2006). Promoting reflection among science student teachers using a web‐based video analysis tool. Journal of Computing in Teacher Education, 23(1), 31‐39.
Carter, K. (1993). The place of story in the study of teaching and teacher education. Educational Researcher, 22(1), 5‐12, 18.
Casey, E. S. (2000). Imagining : A phenomenological study (2nd ed.). Bloomington: Indiana University Press.
Clandinin, D. J., & Connelly, F. M. (1996). Teachers' professional knowledge landscapes: Teacher stories‐‐stories of teachers‐‐school stories‐‐stories of schools. Educational Researcher, 25(3), 24‐30.
Clark, C. M., & Yinger, R. J. (1979). Research on teacher planning: A progress report. Journal of Curriculum Studies, 11(2), 175‐177.
Clark, C. M., & Yinger, R. J. (1980). The Hidden World of Teaching: Implications of Research on Teacher Planning. Research Series No. 77: Institute for Research on Teaching, College of Education, Michigan State University, East Lansing.
Clark, C. M., & Yinger, R. J. (1987). Teacher planning. In J. Calderhead (Ed.), Exploring teachers' thinking. London: Cassell Educational Limited.
Cohen, D. K. (2011). Teaching practice and its predicaments. Cambridge, MA: Harvard University Press.
Cohen, D. K., Raudenbush, S. W., & Ball, D. L. (2003). Resources, instruction, and research. Educational Evaluation and Policy Analysis, 25(2), 119‐142.
Crespo, S. (2000). Seeing more than right and wrong answers: Prospective teachers' interpretations of students' mathematical work. Journal of Mathematics Teacher Education, 3(2), 155‐181.
Crespo, S., Oslund, J. A., & Parks, A. N. (2011). Imagining mathematics teaching practice: Prospective teachers generate representations of a class discussion. ZDM, 43 (1), 119‐131.

294
Davis, E. A., & Krajcik, J. S. (2005). Designing educative curriculum materials to promote teacher learning. Educational Researcher, 34(3), 3‐14.
Davis, E. A., Smithey, J., & Petish, D. (2004). Designing an online learning environment for new elementary science teachers: Supports for learning to teach. In Y. B. Kafai, W. A. Sandoval, N. Enyedy, A. S. Nixon & F. Herrera (Eds.), Proceedings of the 6th International Conference of the Learning Sciences, ICLS2004. Mahwah, NJ: Lawrence Erlbaum.
Doyle, W. (1983). Academic work. Review of Educational Research, 53(2), 159‐199.
Doyle, W. (1986). Classroom organization and management. In M. C. Wittrock (Ed.), Handbook of research on teaching (3 ed., pp. 392‐431). New York: Macmillan.
Doyle, W. (1988). Work in mathematics classes: The context of students' thinking during instruction. Educational Psychologist, 23(2), 167‐180.
Engeström, Y. (1993). Developmental studies of work as a testbench of activity theory: The case of primary care medical practice. In S. Chaiklin & J. Lave (Eds.), Understanding practice: Perspectives on activity and context (pp. 64‐103). Cambridge, UK: Cambridge University Press.
Engeström, Y. (1999). Activity theory and individual and social transformation. In Y. Engeström, R. Miettinen & R. Punamkäki (Eds.), Perspectives on activity theory. Cambridge, UK: Cambridge University Press.
Engle, R. A., & Conant, F. R. (2002). Guiding principles for fostering disciplinary engagement: Explaining an emergent argument in a community of learners classroom. Cognition and Instruction, 20, 399‐483.
Even, & Tirosh, D. (1995). Subject‐matter knowledge and knowledge about students as sources of teacher presentations of the subject‐matter. Educational Studies in Mathematics, 29(1), 1‐20.
Fishman, B. (2003). Linking on‐line video and curriculum to leverage community knowledge. In J. Brophy (Ed.), Advances in research on teaching: Using video in teacher education (Vol. 10, pp. 201‐234). New York: Elsevier.
Fishman, B. (2007). Fostering community knowledge sharing using ubiquitous records of practice. In R. Goldman, R. Pea, B. Barron & S. Derry (Eds.), Video research in the learning sciences (pp. 495‐506). Mahwah, NJ: Erlbaum.
Franke, M. L., & Kazemi, E. (2001). Learning to teach mathematics: Focus on student thinking. Theory Into Practice, 40(2), 102‐109.

295
Grossman, P., Compton, C., Igra, D., Ronfeldt, M., Shahan, E., & Williamson, P. (2009). Teaching practice: A cross‐professional perspective. Teachers College Record, 111(9), 2055‐2100.
Grossman, P., & McDonald, M. (2008). Back to the future: Directions for research in teaching and teacher education. American Educational Research Journal, 45(1), 184‐205.
Halliday, M. A. K., & Matthiessen, C. (2004). An introduction to functional grammar (3nd ed.). London: Hodder Arnold.
Hatch, T., & Grossman, P. (2009). Learning to look beyond the boundaries of representation: Using technology to examine teaching (overview for a digital exhibition: Learning from the practice of teaching). Journal of Teacher Education, 60(1), 70‐85.
Herbst, P. (2003). Using novel tasks in teaching mathematics: Three tensions affecting the work of the teacher. American Educational Research Journal, 40(1), 197‐238.
Herbst, P. (2006). Teaching geometry with problems: Negotiating instructional situations and mathematical tasks. Journal for Research in Mathematics Education, 37(4), 313‐347.
Herbst, P. (2011). Explaining concepts and propositions. Deep Blue at the University of Michigan. Retrieved from http://hdl.handle.net/2027.42/84658.
Herbst, P., & Chazan, D. (2003). ThEMaT: Thought Experiments in Mathematics Teaching: Proposal to the National Science Foundation, Education and Human Resources Directorate, Division of Elementary, Secondary, and Informal Education, Teachers' Professional Continuum Program.
Herbst, P., & Chazan, D. (2006). Producing a viable story of geometry instruction: What kind of representation calls forth teachers' practical rationality? . In S. Alatorre, J. L. Cortina, M. Sáiz & A. Méndez (Eds.), Proceedings of the 28th Annual Meeting of the North American Chapter of the International Group for the Psychology of Mathematics Education (Vol. 2, pp. 213‐220). Mérida, México: Universidad Pedagógica Nacional.
Herbst, P., Chazan, D., Chen, C.‐L., Chieu, V. M., & Weiss, M. (2011). Using comics‐based representations of teaching, and technology, to bring practice to teacher education courses. ZDM, 43 (1), 91‐103.
Herbst, P., & Chieu, V. M. (2011). Depict: A tool to represent classroom scenarios technical report. . Deep Blue at the University of Michigan. Retrieved from http://hdl.handle.net/2027.42/87949.

296
Hiebert, J., Carpenter, T. P., Fennema, E., Fuson, K., Wearne, D., & Murray, H. (1997). Making sense: Teaching and learning mathematics with understanding. Portsmouth, NH. : Heinemann.
Hill, J., Yinger, R. J., & Robins, D. (1983). Instructional planning in a laboratory preschool. The Elementary School Journal, 83(3), 182‐193.
Hughes, E. K. (2006). Lesson planning as a vehicle for developing pre‐service secondary teachers' capacity to focus on students' mathematical thinking. Unpublished doctoral dissertation. University of Pittsburgh, Pittsburgh, PA.
John, P. D. (2006). Lesson planning and the student teacher: Re‐thinking the dominant model. Journal of Curriculum Studies, 38(4), 483‐498.
Kagan, D. M., & Tippins, D. J. (1992). The evolution of functional lesson plans among twelve elementary and secondary student teachers. The Elementary School Journal, 92(4), 477‐489.
Kazemi, E., & Franke, M. L. (2004). Teacher learning in mathematics: Using student work to promote collective inquiry. Journal of Mathematics Teacher Education, 7(3), 203‐235.
Kazemi, E., & Hubbard, A. (2008). New directions for the design and study of professional development: Attending to the coevolution of teachers' participation across contexts. Journal of Teacher Education, 59(5), 428‐441.
Lampert, M. (2001). Teaching problems and the problems of teaching. New Haven, CT: Yale University Press.
Lampert, M. (2010). Learning teaching in, from, and for practice: What do we mean? Journal of Teacher Education, 61(1‐2), 21‐34.
Lampert, M., & Ball, D. L. (1998). Teaching, multimedia, and mathematics: Investigations of real practice. New York: Teachers College.
Leinhardt, G. (1993). On teaching. In R. Glaser (Ed.), Advances in instructional psychology (Vol. 4, pp. 1‐54). Hillsdale, NJ.: Lawrence Erlbaum Associates.
Leinhardt, G. (2001). Instructional explanations: A commonplace for teaching and location for contrast. In V. Richardson (Ed.), Handbook of research on teaching (4th ed., pp. 333‐357). Washington, DC: American Educational Research Association.
Leinhardt, G., & Steele, M. D. (2005). Seeing the complexity of standing to the side: Instructional dialogues. Cognition and Instruction, 23(1), 87‐163.

297
Lemke, J. L. (2002). Mathematics in the middle: Measure, picture, gesture, sign, and word. In M. Anderson, A. Sáenz‐Ludlow, S. Zellweger & V. V. Cifarelli (Eds.), Educational perspectives on mathematics as semiosis: From thinking to interpreting to knowing (pp. 215‐234). Ottawa, Ontario: Legas.
Livingston, C., & Borko, H. (1990). High school mathematics review lessons: Expert‐novice distinctions. Journal for Research in Mathematics Education, 21(5), 372‐387.
Lortie, D. (1975). Schoolteacher: A sociological study. Chicago: University of Chicago Press.
Martin, J. R., & Rose, D. (2003). Working with discourse: Meaning beyond the clause. London: Continuum
Mason, J., & Pimm, D. (1984). Generic examples: Seeing the general in the particular. Educational Studies in Mathematics, 15(3), 277‐289.
May, W. (1986). Teaching students how to plan: The dominant model and alternatives. Journal of Teacher Education, 37(6), 6‐12.
McCloud, S. (1994). Understanding comics. New York: Harper.
McCutcheon, G. (1980). How do elementary school teachers plan? The nature of planning and influences on it. The Elementary School Journal, 81(1), 4‐23.
Morine‐Dershiner, G. (1978‐79). Planning in classroom reality: An in‐depth look. Educational Research Quarterly, 3(4), 83‐99.
NCTM (2000). Principles and standards for school mathematics. Reston, VA: National Council of Teachers of Mathematics.
Nemirovsky, R., Tierney, C., & Wright, T. (1998). Body motion and graphing. Cognition and Instruction, 16(2), 119‐172.
Nicol, C. (1998). Learning to teach mathematics: Questioning, listening, and responding. Educational Studies in Mathematics, 37(1), 45‐66.
Peterson, P. L., Marx, R. W., & Clark, C. M. (1978). Teacher planning, teacher behavior, and student achievement. American Educational Research Journal, 15(3), 417‐432.
Rich, P. J., & Hannafin, M. (2009). Video annotation tools: Technologies to scaffold, structure, and transform teacher reflection. Journal of Teacher Education, 60(1), 52‐67.
Richardson, V., & Kile, R. (1999). Learning from videocases. In M. A. Lundeberg, B. B. Levin & H. L. Harrington (Eds.), Who learns what from cases and how? : The

298
research base for teaching and learning with cases (pp. 121‐138). Mahwah, NJ: Erlbaum.
Rosebery, A. (2005). "What are we going to do next?": Lesson planning as a resource for teaching. In R. Nemirovsky, A. Rosebery, J. Soloman & B. Warren (Eds.), Everyday matters in science and mathematics: Studies of complex classroom events (pp. 299‐327). Mahwah, NJ.: Lawrence Erlbaum Associates, Inc.
Roskos, K., & Neuman, S. B. (1995). Two beginning kindergarten teachers' planning for integrated literacy instruction. The Elementary School Journal, 96(2), 195‐215.
Roth, W.‐M., & Lawless, D. (2002). When up is down and down is up: Body orientation, proximity, and gestures as resources. Language in Society, 31, 1‐28.
Santagata, R., Zannoni, C., & Stigler, J. W. (2007). The role of lesson analysis in pre‐service teacher education: An empirical investigation of teacher learning from a virtual video‐based field experience. Journal of Mathematics Teacher Education, 10, 123‐140.
Schoenfeld, A. H., Minstrell, J., & van Zee, E. (2000). The detailed analysis of an established teacher's non‐traditional lesson. Journal of Mathematical Behavior, 18(3), 281‐325.
Shavelson, R. J. (1983). Review of research on teachers' pedagogical judgments, plans, and decisions. The Elementary School Journal, 83(4), 392‐413.
Sherin, M., & van Es, E. A. (2005). Using video to support teachers' abiltiy to notice classroom interactions. Journal of Technology and Teacher Education, 13(3), 475‐491.
Smith, M. S., Bill, V., & Hughes, E. K. (2008). Thinking through a lesson: Successfully implementing high‐level tasks. Mathematics Teaching in the Middle School, 14(3), 132‐138.
Stein, M. K., Smith, M. S., Henningsen, M., & Silver, E. A. (2000). Implementing standardsbased mathematics instruction: A casebook for professional development. New York: Teacher College Press.
Tettegah, S. (2005). Technology, narratives, vignettes, and the intercultural and cross‐cultural teaching portal. Urban Education, 40(4), 368‐393.
Tettegah, S., Bailey, B., & Taylor, K. (2007). Clover: Narratives and simulations in virtual environments. The Journal of Negro Education, 76(1), 43‐56.

299
Thibault, P. J. (2000). The multimodal transcription of a television advertisement: Theory and Practice. In A. Baldry (Ed.), Multimodality and multimediality in the distance learning age. Campobasso: Palladino Editore.
van Es, E. A., & Sherin, M. (2002). Learning to notice: Scaffolding new teachers' interpretations of classroom interactions. Journal of Technology and Teacher Education, 10(4), 571‐596.
Welch, A. (2008). Snapz Pro X (computer software). Rochester, New York: Ambrosia Software, Inc. .
Yin, R. K. (2006). Case study methods. In J. L. Green, G. Camilli & P. B. Elmore (Eds.), Handbook of complementary methods in education research (pp. 111‐122). Mahwah, NJ: Lawrence Erlbaum Associates.
Yinger, R. J. (1979). Routines in teacher planning. Theory into Practice, 18(3), 163‐169.
Yinger, R. J. (1980). A study of teacher planning. The Elementary School Journal, 80(3), 107‐127.
Yinger, R. J. (1986). Examining thought in action: A theoretical and methodological critique of research on interactive teaching. Teaching and Teacher Education, 2(3), 263‐282.
Zaslavsky, O. (2010). The explanatory power of examples in mathematics: Challenges for teaching. In M. K. Stein & L. Kucan (Eds.), Instructional explanations in the disciplines. Boston, MA Springer Science+Business Media, LLC.
Zaslavsky, O., & Zodik, I. (2007). Mathematics teachers' choices of examples that potentially support or impede learning. Research in Mathematics Education, 9, 143‐155.
Zazkis, R., Liljedahl, P., & Sinclair, N. (2009). Lesson plays: Planning teaching versus teaching planning. For the Learning of Mathematics, 29(1), 40‐47.
Zimmerlin, D., & Nelson, M. (2000). The detailed analysis of a beginning teacher carrying out a traditional lesson. Journal of Mathematical Behavior, 18(3), 263‐279.
Zodik, I., & Zaslavsky, O. (2008). Characteristics of teachers' choice of examples in and for the mathematics classroom. Educational Studies in Mathematics, 69(2), 165‐182.