Learning to love logging - GeoMEM Ltd logs” James Tweedie ... produce a complete log. ... The...
2
GeoDrilling International January / February 2011 • www.geodrillinginternational.com 26 Viewpoint “The range of software currently available covers most requirements and budgets, allowing users to produce good-quality borehole logs” James Tweedie W e drill for two main reasons: to access resources and to obtain information. These aims are not mutually exclusive and are frequently combined. This statement is also a bit of a simplification as there are a wide range of more specific requirements in different industries. Drilling produces a large amount of information that can be very useful for decision-making if it is processed and presented in the correct way. The main sources of data are: 1 The drill itself. Operational parameters such as the rotation speed, torque, penetration rate, fluid pressure, feed force and the date/time of each operation; 2 Borehole location surveys – co-ordinates of points down the hole plus ancillary data; 3 Borehole lithological, structural, geotechnical and related logs; 4 Down-hole geophysics; and 5 Assay and chemical analyses. With current technology we can record data for items 1, 2 and 4 at closely spaced intervals, which generates large quantities of data. Usually, this has to be filtered and processed before it is suitable for display and decision making. Logging of the core itself involves employing a geologist or other trained person to describe the rock, its structure and other characteristics. This involves qualitative, semi-quantitative and quantitative data gathering. Borehole logs are a distillation of information from numerous sources. They enable decisions to be made for future work, as well as providing detailed descriptions suitable for publication in reports and for archiving. Logs may be referred to decades after the initial project as sites are reinvestigated. I know of one current project where logs from the early 1900s are being used as input for planning/modelling. Software offering A number of borehole-logging packages are available that produce high-quality report logs of almost any type you care to create. In other words, they replace the laboriously hand-drawn logs of the past and are the product of the data gathering now associated with drilling. These applications have originated in different industries, as shown in the table. Some remain focused on the original industry, while others have broadened in scope with successive releases. And some are integrated into a larger borehole data- management system such as HoleBase, but those are beyond the scope of this article. All of the programmes take data from a variety of sources and combine them to produce a complete log. Data is defined by one of the following parameters – depth interval, depth point and, in some cases, by time. The graphic logs are based on a template that completely defines the layout of the log and the data that appears on the page. The layout usually consists of a combination of header, footer and main graphic log body. Data is input into a series of spreadsheet or database tables, or by direct import from external files. Learning to love logging James Tweedie looks at how borehole-logging software can best be used to process and present drilling data Software Developer, country Year of first release Original application area Approx cost (£) Strater Golden Software, US 2004 Exploration, mining, environmental, oil & gas ** 300 LogPlot Rockware, US 1985 Exploration, mining ** 420 WinLoG 4 GAEA, Canada 1996-97 Geotechnical, engineering ** 600 Applecore Ranger, Canada Early 1990s Oil & gas [Mac] 1,200 WellCAD ALT, Luxembourg 1993 Oil & gas – Winlog HRH, UK – Oil & gas – ** These applications now cover most areas of borehole logging. – Not known 1 Short section of an oil and gas log produced by AppleCORE, showing the amount of detail and control provided over the lithological log, and structural and fossil symbols 2 Part of a Strater lithological assay log, showing good use of photos and colour to emphasise different characteristics 2 1 Personal log In 1980-81, when working with Consolidated Goldfields at the Gairloch copper-zinc-gold prospect, I developed a basic borehole-logging programme on a 16Kb Commodore PET computer. By 1985-86, this software had evolved into one of the first commercial borehole-logging packages, called DRILLOG, and it enjoyed some success in the UK and abroad until the early 1990s. My knowledge of this area is as a geologist with field core-logging experience, and as a programmer and user of borehole-logging software. Since 1985, I have been supplying and supporting this type of software through GeoMEM. 26-27GDI1101.indd 26 31/01/2011 11:36
Transcript of Learning to love logging - GeoMEM Ltd logs” James Tweedie ... produce a complete log. ... The...
GeoDrilling International January / February 2011 • www.geodrillinginternational.com
26 Viewpoint
“The range of software currently
available covers most requirements
and budgets, allowingusers to produce
good-qualityborehole
logs”
James Tweedie
We drill for two main reasons: to access resources and to obtain information. These aims are not
mutually exclusive and are frequently combined. This statement is also a bit of a simplification as there are a wide range of more specific requirements in different industries.
Drilling produces a large amount of information that can be very useful for decision-making if it is processed and presented in the correct way. The main sources of data are:1 The drill itself. Operational parameters The drill itself. Operational parameters
such as the rotation speed, torque, penetration rate, fluid pressure,
feed force and the date/time of each operation;
2 Borehole location surveys – co-ordinates of points down the hole plus ancillary data;
3 Borehole lithological, structural, geotechnical and related logs;
4 Down-hole geophysics; and5 Assay and chemical analyses.
With current technology we can record data for items 1, 2 and 4 at closely spaced intervals, which generates large quantities of data. Usually, this has to be filtered and processed before it is suitable for display and decision making.
Logging of the core itself involves employing a geologist or other trained person to describe the rock, its structure and other characteristics. This involves qualitative, semi-quantitative and quantitative data gathering.
Borehole logs are a distillation of information from numerous sources. They enable decisions to be made for future
work, as well as providing detailed descriptions suitable for publication in reports and for archiving. Logs may be referred to decades after the initial project as sites are reinvestigated. I know of one current project where logs from the early 1900s are being used as input for planning/modelling.
Software offeringA number of borehole-logging packages are available that produce high-quality report logs of almost any type you care to create. In other words, they replace the laboriously hand-drawn logs of the past and are the product of the data gathering now associated with drilling.
These applications have originated in different industries, as shown in the table. Some remain focused on the original industry, while others have broadened in scope with successive releases. And some are integrated into a larger borehole data-management system such as HoleBase, but those are beyond the scope of this article.
All of the programmes take data from a variety of sources and combine them to produce a complete log. Data is defined by one of the following parameters – depth interval, depth point and, in some
cases, by time. The graphic logs are based on a
template that completely defines the layout of the log and the data that appears on the page. The layout usually consists of a combination of header, footer and main graphic log body. Data is input into a series of spreadsheet or database tables, or by direct import from external files.
Learning to love loggingJames Tweedie looks at how borehole-logging software can best be used to process and present drilling data
Software Developer, country Year of first release Original application area Approx
cost (£)
Strater Golden Software, US 2004Exploration, mining, environmental, oil & gas **
300
LogPlot Rockware, US 1985 Exploration, mining ** 420
WinLoG 4 GAEA, Canada 1996-97Geotechnical, engineering **
600
Applecore Ranger, Canada Early 1990s Oil & gas [Mac] 1,200WellCAD ALT, Luxembourg 1993 Oil & gas –Winlog HRH, UK – Oil & gas –** These applications now cover most areas of borehole logging. – Not known
1 Short section of an oil and gas log
produced by AppleCORE, showing the amount of detail
and control provided over the lithological
log, and structural and fossil symbols
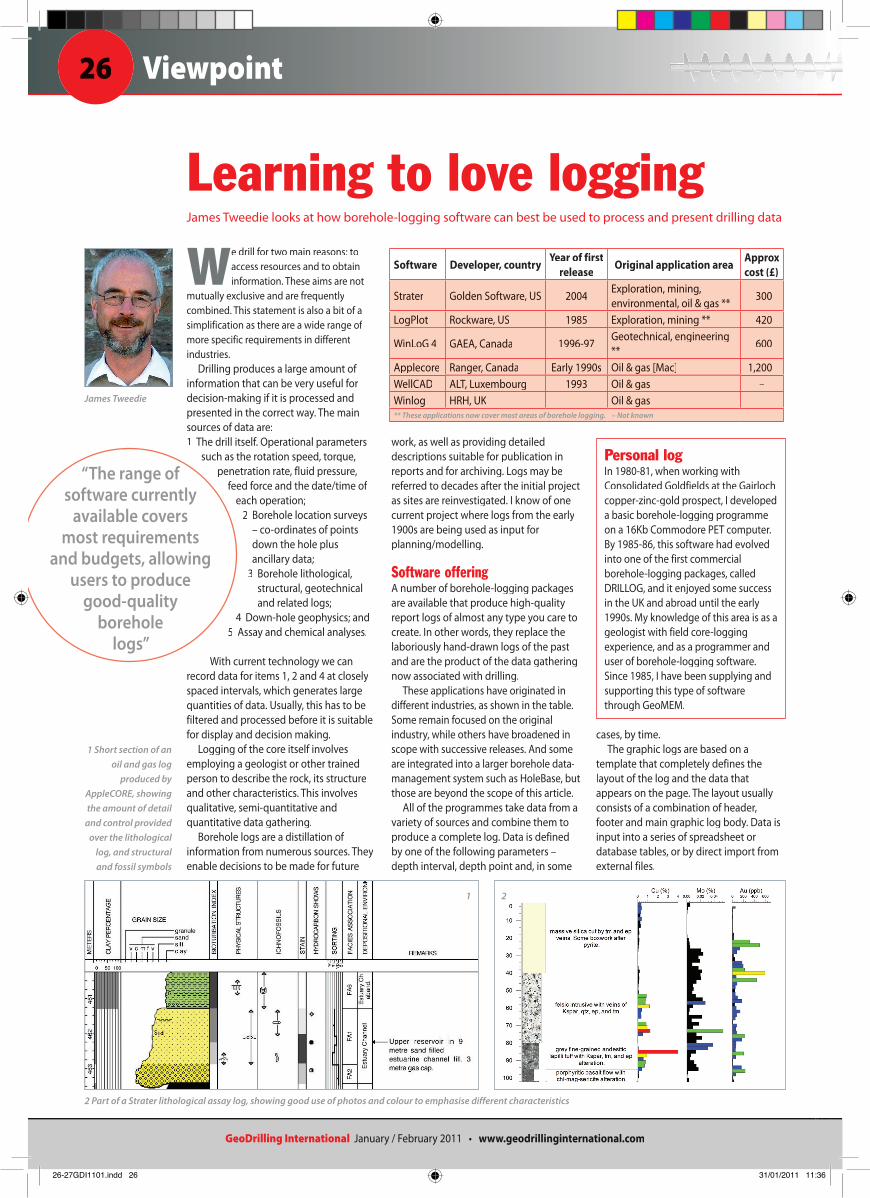
2 Part of a Strater lithological assay log, showing good use of photos and colour to emphasise different characteristics
21
Personal logIn 1980-81, when working with Consolidated Goldfields at the Gairloch copper-zinc-gold prospect, I developed a basic borehole-logging programme on a 16Kb Commodore PET computer. By 1985-86, this software had evolved into one of the first commercial borehole-logging packages, called DRILLOG, and it enjoyed some success in the UK and abroad until the early 1990s. My knowledge of this area is as a geologist with field core-logging experience, and as a programmer and user of borehole-logging software. Since 1985, I have been supplying and supporting this type of software through GeoMEM.
26-27GDI1101.indd 26 31/01/2011 11:36

GeoDrilling International January / February 2011 • www.geodrillinginternational.com
27Viewpoint
As a minimum, most applications include the following: a graphic lithological log; descriptive text column(s); depth and interval columns (down-hole depth, sample depths, sample intervals, instrument depths, etc); line trace columns (geophysics); and histogram columns (geochemical data).
It is possible to print a good range of descriptive and other information in the header and footer zones, such as location, name of the client, dates, comments, scale and company logo.
Additional functionality includes, but is not limited to: photographic images; down-hole instrumentation graphics; well construction graphics; industry-specific import and export options (eg LAS, AGS format files); and industry-specific data displays. Some offer the ability to create a ‘graph’ of one edge of the graphic log, based on a down-hole variable that is related to the lithology, such as grain size, geophysical trace, RQD, or similar. The AppleCORE plot is a good example.
Some developers, such as GAEA, provide field versions of their software that run on data-logging units (usually rugged, handheld computers) for field logging and later transfer to the office PC. This may, or may not, be advantageous as it speeds up data input and transfer, but perhaps at the cost of small observations and notes made in a field notebook.
The range of logs that can be produced by the various programmes includes: assays; civil engineering; environmental; exploration; geophysical; geotechnical; LAS plots; lithological; mining and quarrying; mud log; trial pit; well construction; and water. These may be produced alone or in combination.
In almost all cases, the power and flexibility of the template system allows a mix-and-match approach, with users able to incorporate relevant data from almost any source. Most developers supply a good range of templates with their software that can be used as supplied or (more commonly) adapted as needed.
Most aspects can be customised, allowing the graphic-log legend patterns to be modified as needed (say, to fit with British Standards). Some come with BS patterns already available.
Decisions, decisionsWhen it comes to deciding on the best log software for your application, the following should be considered:• What is your end requirement? Is it just
to produce quality logs for reports or do you need the data for downstream processes?
• What are your data sources? Can you import or enter the data easily into the logging software?
• Are any extra modules needed to process certain data (e.g. LAS logs)?
• Do you require specially formatted data such as AGS?
• What range of templates and other support libraries are supplied?
• How easy is it to customise these templates and does the supplier offer a customisation service?
• Do the plotting options cover your present and future requirements?
• If necessary, can you export/transfer the data for use in other packages?
• What level of support/maintenance is offered? Are there further annual charges for support?
Too simpleI am sometimes asked for a simple, single-purpose logging application (often with an accompanying low-cost expectation). Unfortunately, to develop this single-purpose software would require a versatile plotting engine,
which is actually about 70% of the more complex
system. So, from a commercial point
of view, it is better to go the whole hog and provide a system for most purposes rather than
just one. It can take several
programmers years to develop a good log-
plotting system from scratch, which is why most of those available now have a long development history.
As far as I am aware, only Golden Software has released an entirely new system – the low-cost Strater – on the market in the past decade.
That said, the range of software currently available covers most requirements and budgets, allowing users to produce good-quality borehole logs for analysis, interpretation, publication and archiving.
James Tweedie is director of GeoMEM, which specialises in providing borehole-logging software for drilling applications. Visit www.geomem.com or contact Mr Tweedie at [email protected]
“All of the programmes take
data from a variety of sources and combine
them to produce a complete log”
3 Upper part of a Strater geophysical trace log, showing multiple traces and scales per column, and depths in both metric and imperial units
4 Columns from a Strater log, showing well construction and two different plot types for ground contaminants
5 Exploration log, produced by LogPlot. Metal assays shown as histograms; chemical analyses as line plots; and lithology, alteration, mineralisation as graphic logs. Colour change used to highlight recovery histogram
6 Environmental log, produced by LogPlot, with detailed well construction column and chemical line plots
4
3
5
6
26-27GDI1101.indd 27 31/01/2011 11:36