
Pornrad Srisawad Department of Physics, Naresuan University, Thailand Yu-Ming Zheng
Upload
brianna-obrienCategory
view
217download
0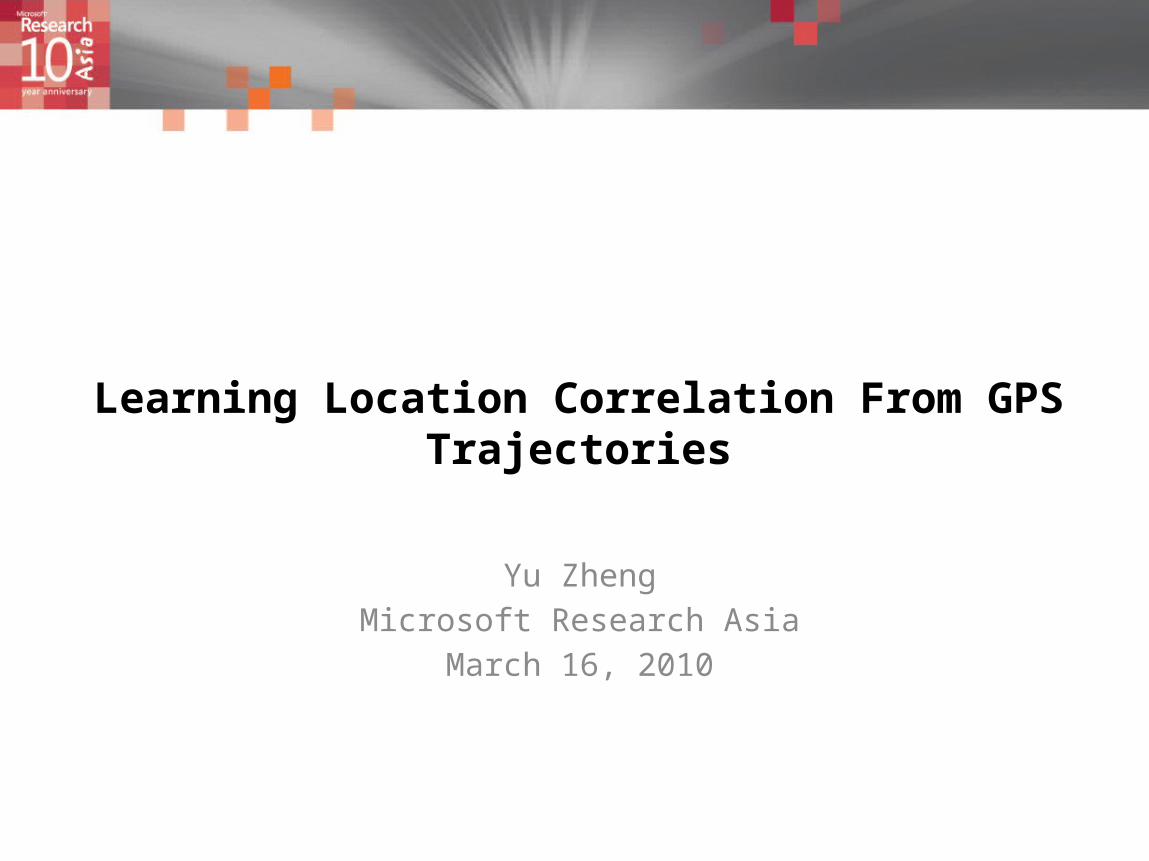
Learning Location Correlation From GPS Trajectories
Yu Zheng
Microsoft Research Asia
March 16, 2010
Background
2
Locations are correlated in the space of human behaviorThese location might not belong to the same business categoriesThey would not be co-located
Cafe Cinema
Different categories
Jewel shop A
Jewel shop B
Jewel shop C
Far awayFar away
Far away
What We Do
Mine the correlation between locations from GPS trajectoriesThe relation between locations in the space of human behaviorEnable a location recommendation system
3
Challenges
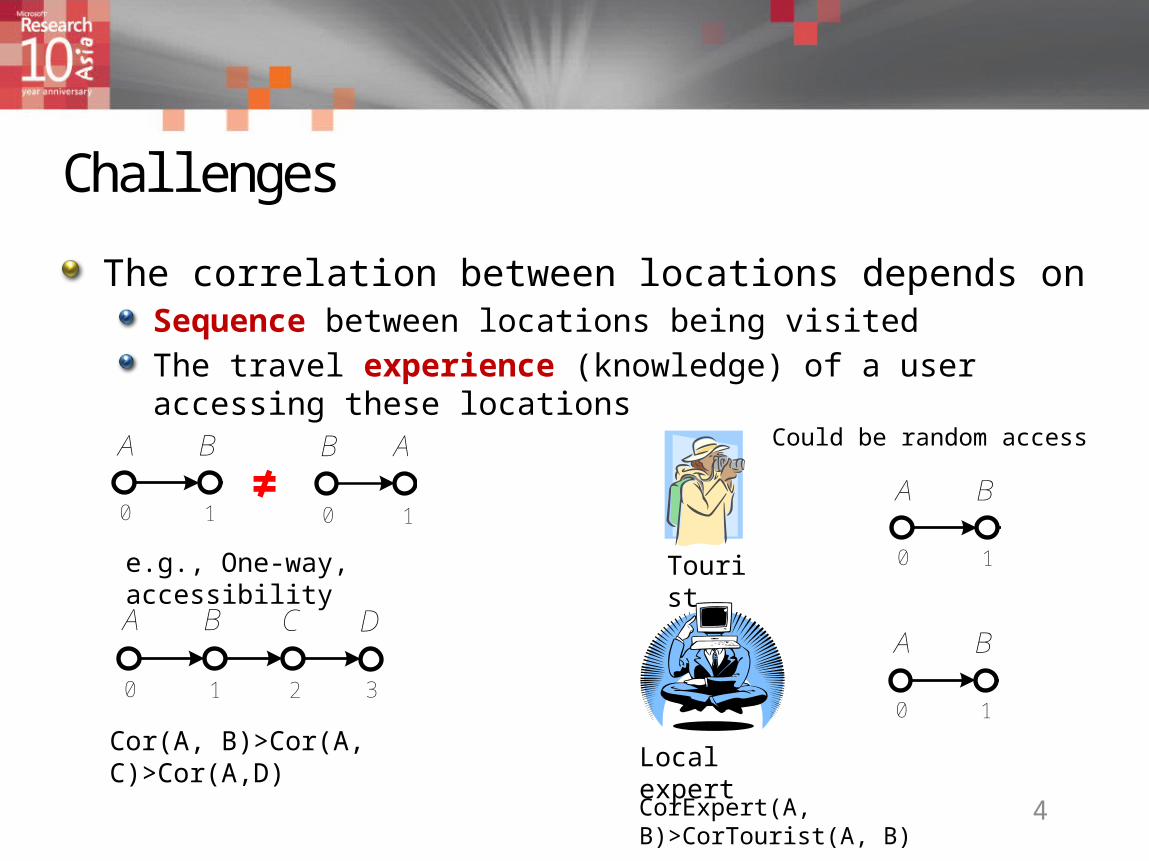
The correlation between locations depends onSequence between locations being visitedThe travel experience (knowledge) of a user accessing these locations
4
A B C A C B CA
u1 u2 u3Trip1 Trip2 Trip3
B
1 20 1 20 1 20
A B C A C B CA
u1 u2 u3Trip1 Trip2 Trip3
B
1 20 1 20 1 20≠
e.g., One-way, accessibility
Cor(A, B)>Cor(A, C)>Cor(A,D)
Tourist
Local expert
A B C
1 20
D
3
A B C A C B CA
u1 u2 u3Trip1 Trip2 Trip3
B
1 20 1 20 1 20
A B C A C B CA
u1 u2 u3Trip1 Trip2 Trip3
B
1 20 1 20 1 20
CorExpert(A, B)>CorTourist(A, B)
Could be random access
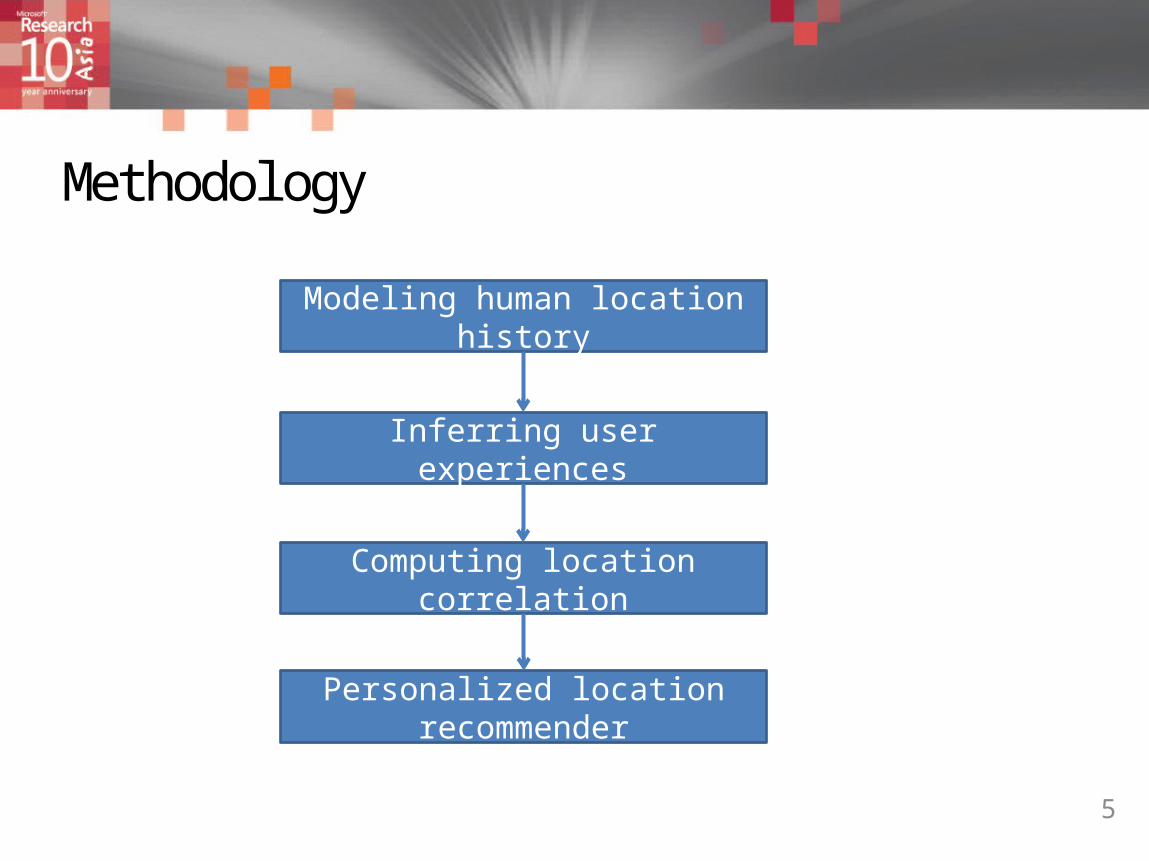
Methodology
5
Modeling human location history
Inferring user experiences
Computing location correlation
Personalized location recommender
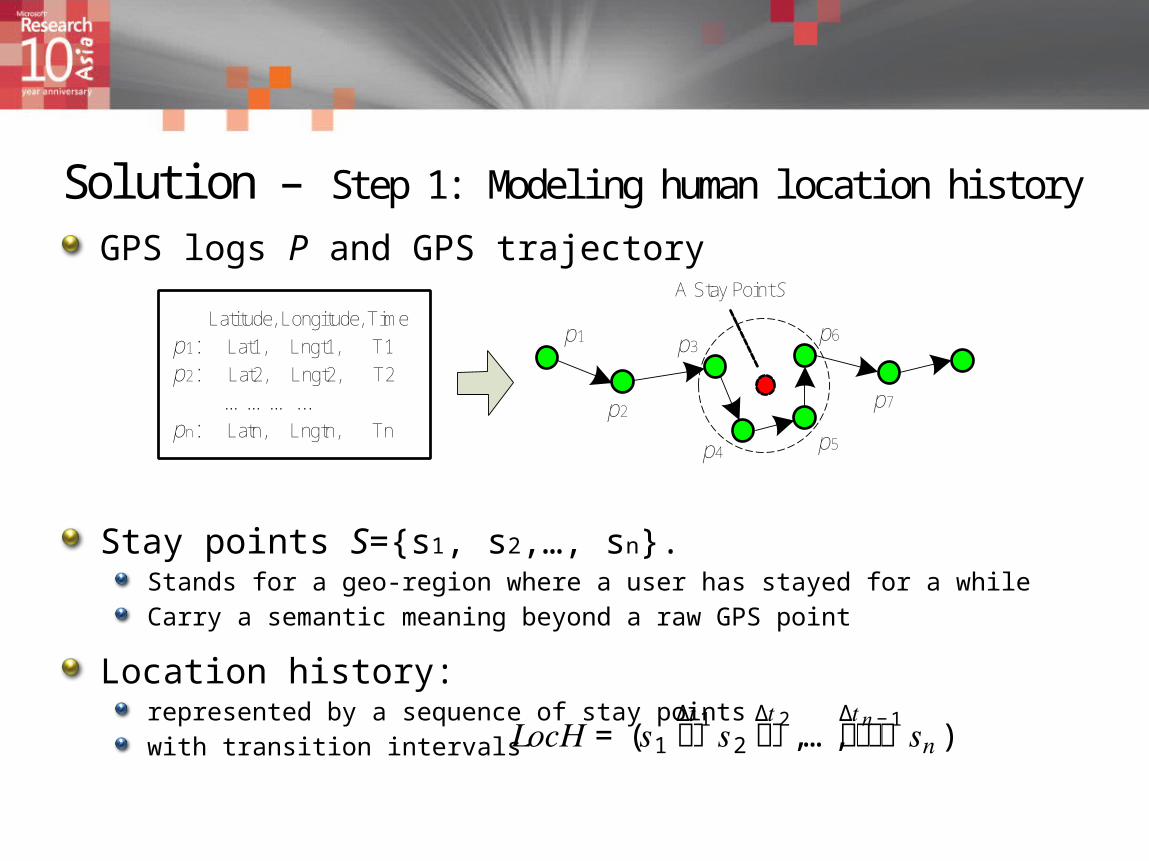
Solution – Step 1: Modeling human location history GPS logs P and GPS trajectory
Stay points S={s1, s2,…, sn}.Stands for a geo-region where a user has stayed for a whileCarry a semantic meaning beyond a raw GPS point
Location history: represented by a sequence of stay pointswith transition intervals
p4
p3
p5
p6
p7
A Stay Point S
p1
p2
Latitude, Longitude, Time
p1: Lat1, Lngt1, T1
p2: Lat2, Lngt2, T2
………...pn: Latn, Lngtn, Tn
𝐿𝑜𝑐𝐻= (𝑠1 ∆𝑡1ሱሮ 𝑠2 ∆𝑡2
ሱሮ ,…,∆𝑡𝑛−1ሱۛ ۛ ሮ 𝑠𝑛)
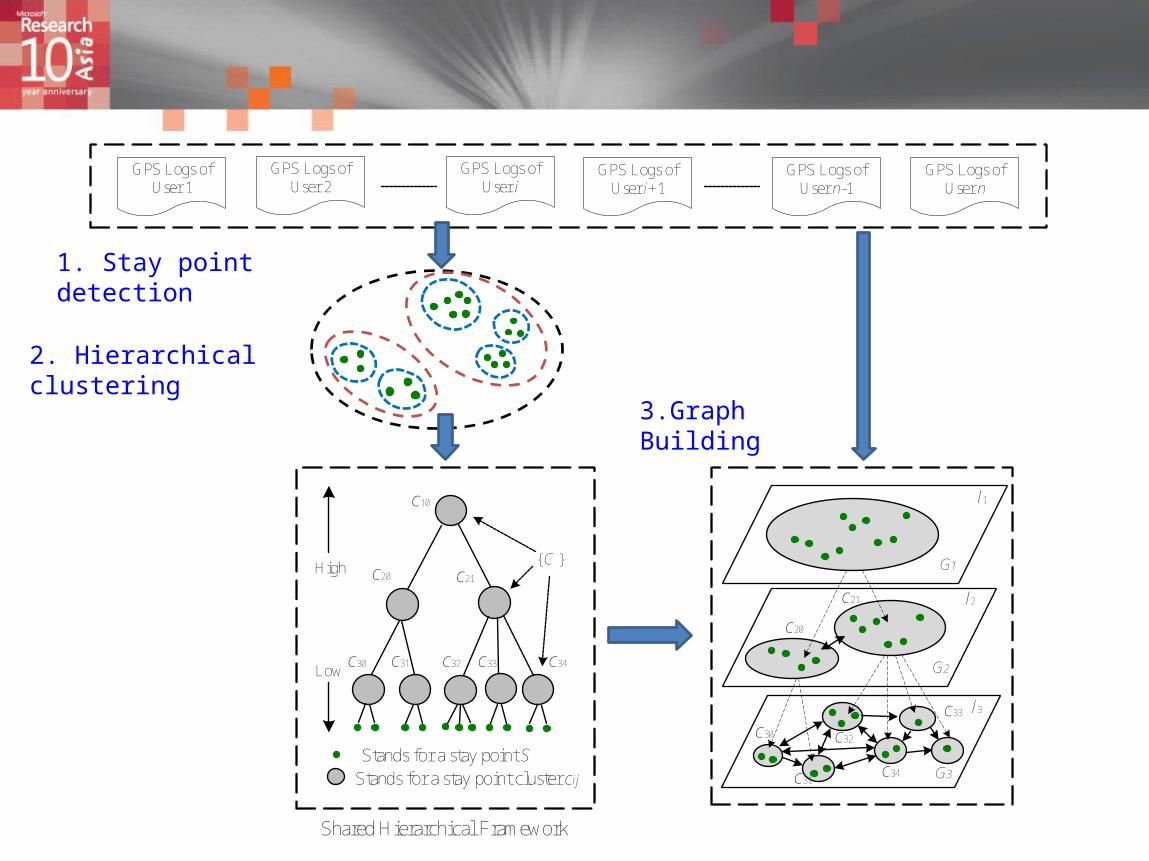
GPS Logs of User 1
GPS Logs of User 2
GPS Logs of User n
GPS Logs of User i
GPS Logs of User i+1
GPS Logs of User n-1
Stands for a stay point SStands for a stay point cluster cij
{C }High
Low
Shared Hierarchical Framework
c10
c20 c21
c30 c31 c32 c33 c34
1. Stay point detection
2. Hierarchical clustering
l1
G3
G1
G2
c30
c31
c32
c33
c34
c20
c21 l2
l3
3.Graph Building
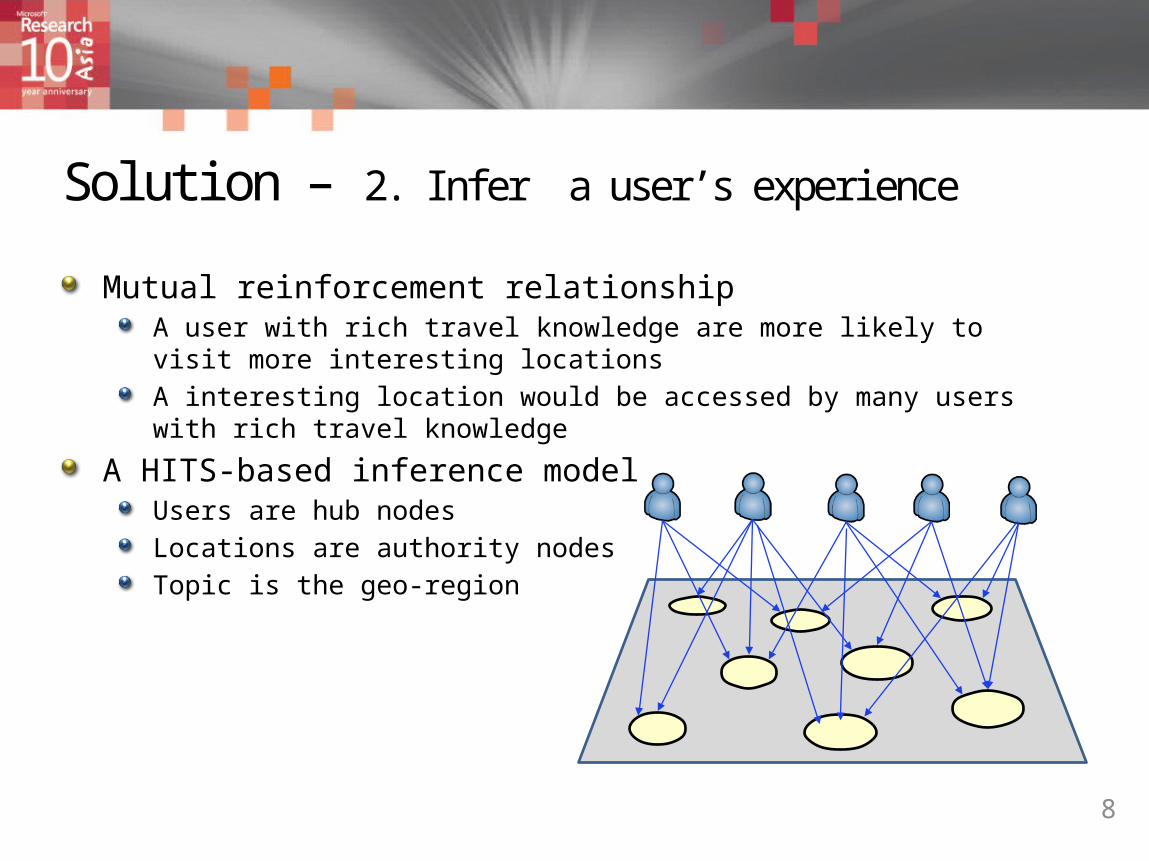
Solution – 2. Infer a user’s experience
Mutual reinforcement relationshipA user with rich travel knowledge are more likely to visit more interesting locationsA interesting location would be accessed by many users with rich travel knowledge
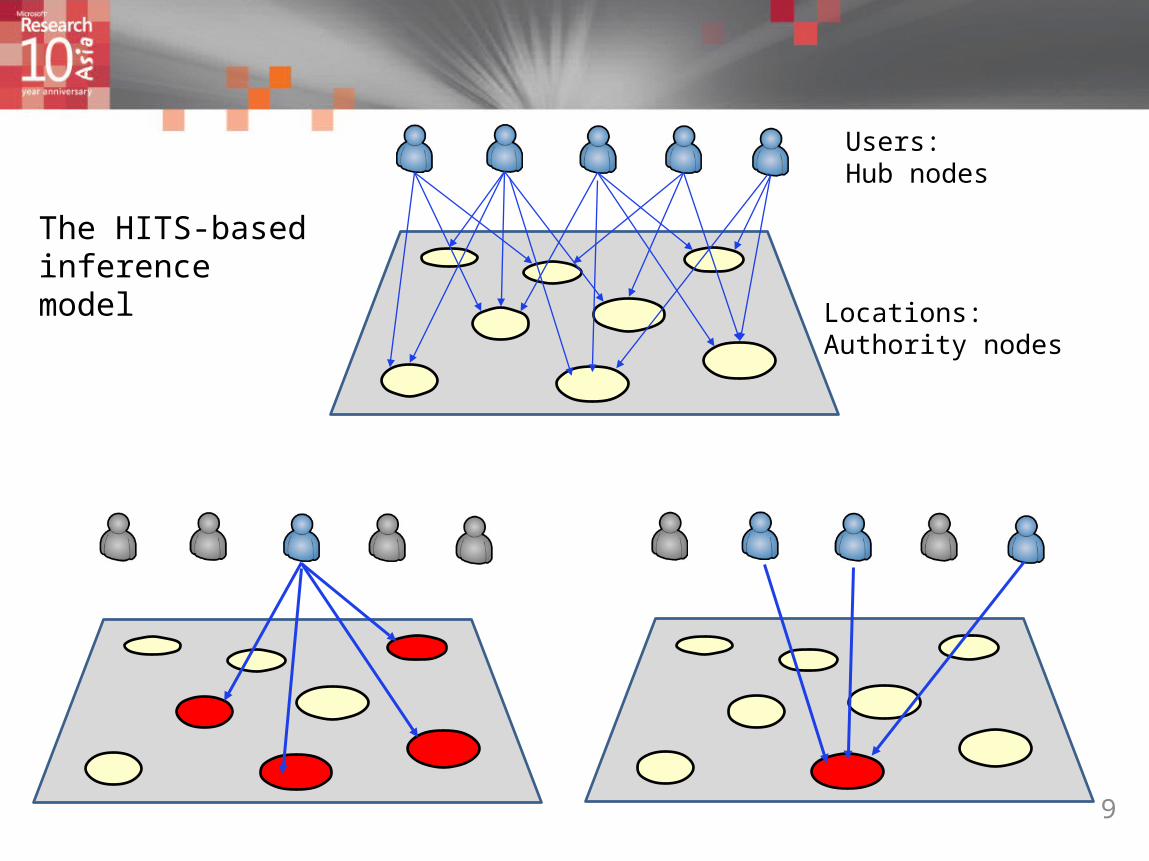
A HITS-based inference modelUsers are hub nodesLocations are authority nodesTopic is the geo-region
8
9
Users: Hub nodes
Locations: Authority nodes
The HITS-based inference model
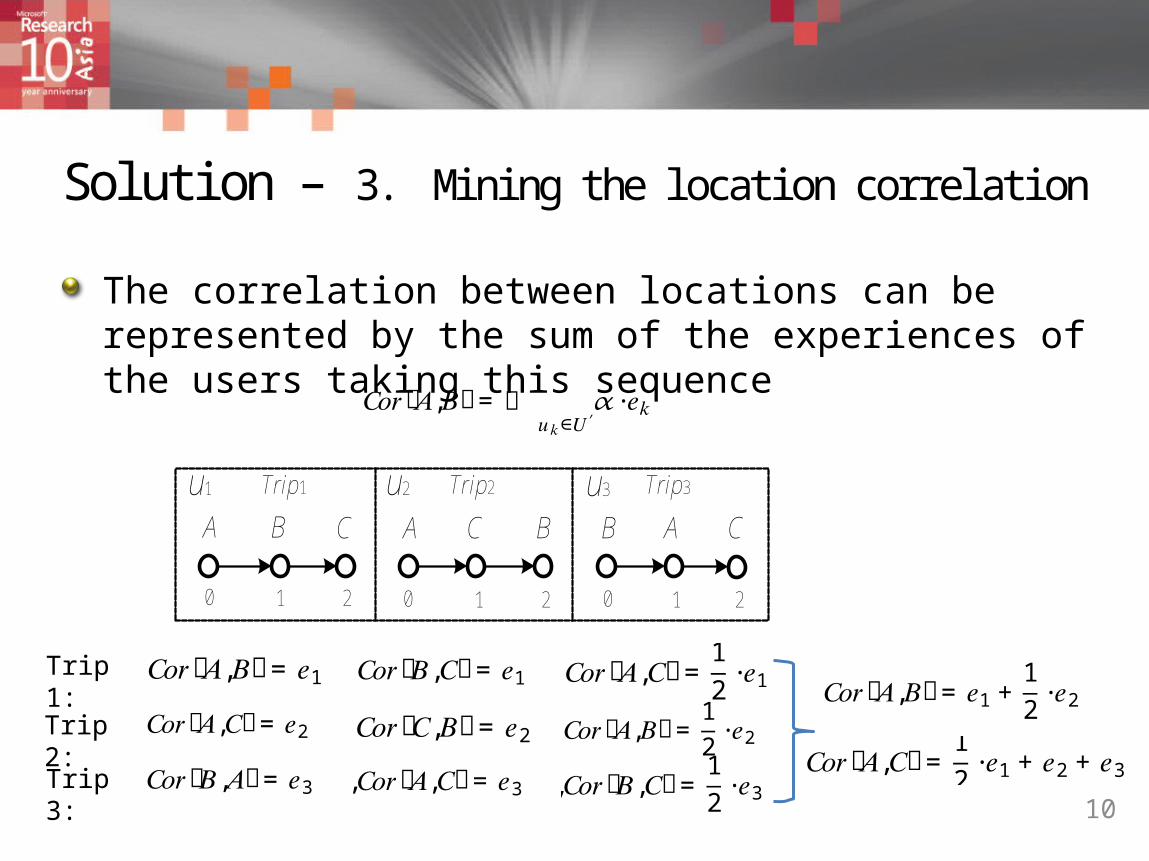
Solution – 3. Mining the location correlation
The correlation between locations can be represented by the sum of the experiences of the users taking this sequence
10
A B C A C B CA
u1 u2 u3Trip1 Trip2 Trip3
B
1 20 1 20 1 20
𝐶𝑜𝑟ሺ𝐴,𝐵ሻ= 𝑒1 𝐶𝑜𝑟ሺ𝐵,𝐶ሻ= 𝑒1
𝐶𝑜𝑟ሺ𝐴,𝐵ሻ= 𝛼∙𝑒𝑘𝑢𝑘∈𝑈′
Trip 1:
𝐶𝑜𝑟ሺ𝐴,𝐶ሻ= 12∙𝑒1 𝐶𝑜𝑟ሺ𝐴,𝐶ሻ= 𝑒2 𝐶𝑜𝑟ሺ𝐶,𝐵ሻ= 𝑒2 𝐶𝑜𝑟ሺ𝐴,𝐵ሻ= 12∙𝑒2 𝐶𝑜𝑟ሺ𝐵,𝐴ሻ= 𝑒3,𝐶𝑜𝑟ሺ𝐴,𝐶ሻ= 𝑒3,𝐶𝑜𝑟ሺ𝐵,𝐶ሻ= 12∙𝑒3 𝐶𝑜𝑟ሺ𝐵,𝐴ሻ= 𝑒3,𝐶𝑜𝑟ሺ𝐴,𝐶ሻ= 𝑒3,𝐶𝑜𝑟ሺ𝐵,𝐶ሻ= 12∙𝑒3 𝐶𝑜𝑟ሺ𝐵,𝐴ሻ= 𝑒3,𝐶𝑜𝑟ሺ𝐴,𝐶ሻ= 𝑒3,𝐶𝑜𝑟ሺ𝐵,𝐶ሻ= 12∙𝑒3
Trip 2:Trip 3:
𝐶𝑜𝑟ሺ𝐴,𝐵ሻ= 𝑒1 + 12∙𝑒2
𝐶𝑜𝑟ሺ𝐴,𝐶ሻ= 12∙𝑒1 + 𝑒2 + 𝑒3
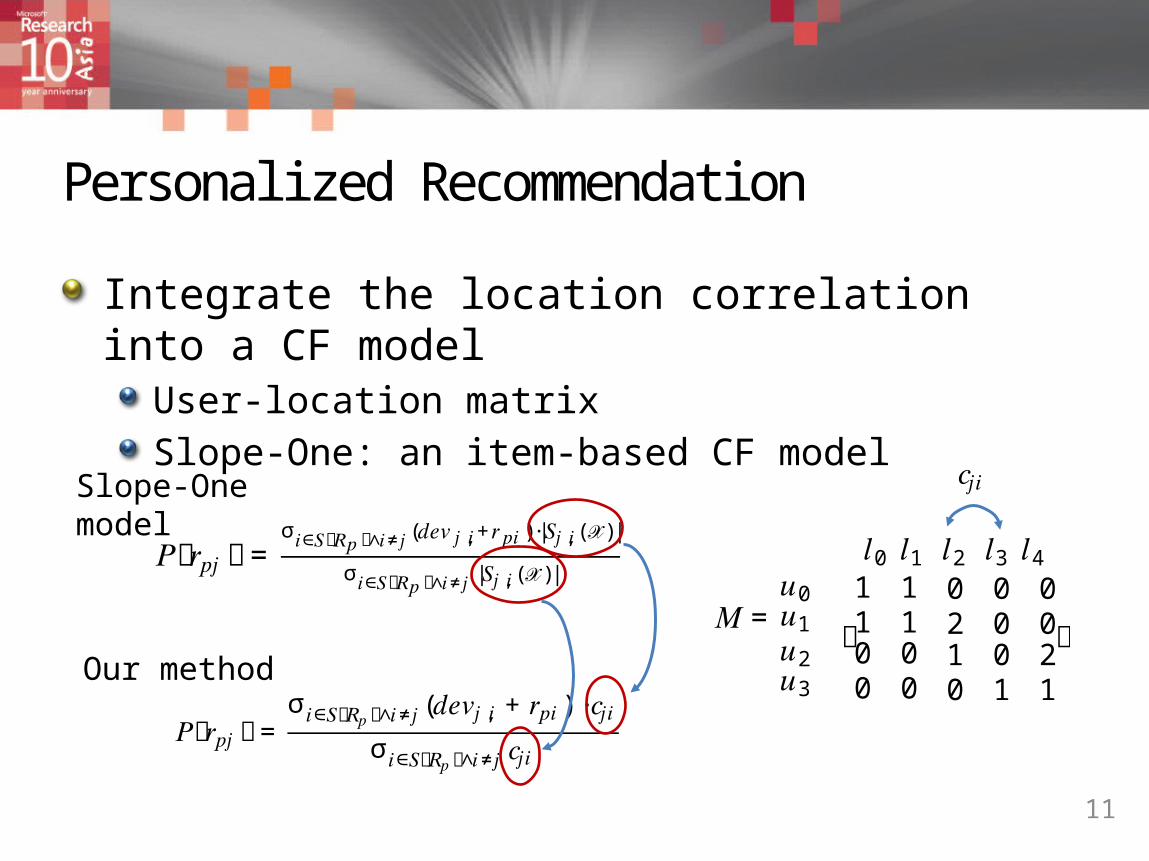
Personalized Recommendation
Integrate the location correlation into a CF modelUser-location matrixSlope-One: an item-based CF model
11
𝑃൫𝑟𝑝𝑗൯= σ (𝑑𝑒𝑣𝑗,𝑖+𝑟𝑝𝑖 )∙|𝑆𝑗,𝑖(𝒳)|𝑖∈𝑆൫𝑅𝑝൯∧𝑖≠𝑗σ |𝑆𝑗,𝑖(𝒳)|𝑖∈𝑆൫𝑅𝑝൯∧𝑖≠𝑗
𝑃൫𝑟𝑝𝑗൯= σ (𝑑𝑒𝑣𝑗,𝑖 + 𝑟𝑝𝑖) ∙𝑐𝑗𝑖𝑖∈𝑆൫𝑅𝑝൯∧𝑖≠𝑗σ 𝑐𝑗𝑖𝑖∈𝑆൫𝑅𝑝൯∧𝑖≠𝑗
𝑀=𝑙0 𝑙1 𝑙2 𝑙3 𝑙4𝑢0𝑢1𝑢2𝑢3
൦
1 1 0 0 01 1 2 0 00 0 1 0 20 0 0 1 1൪
Slope-One model
Our method
𝑐𝑗𝑖
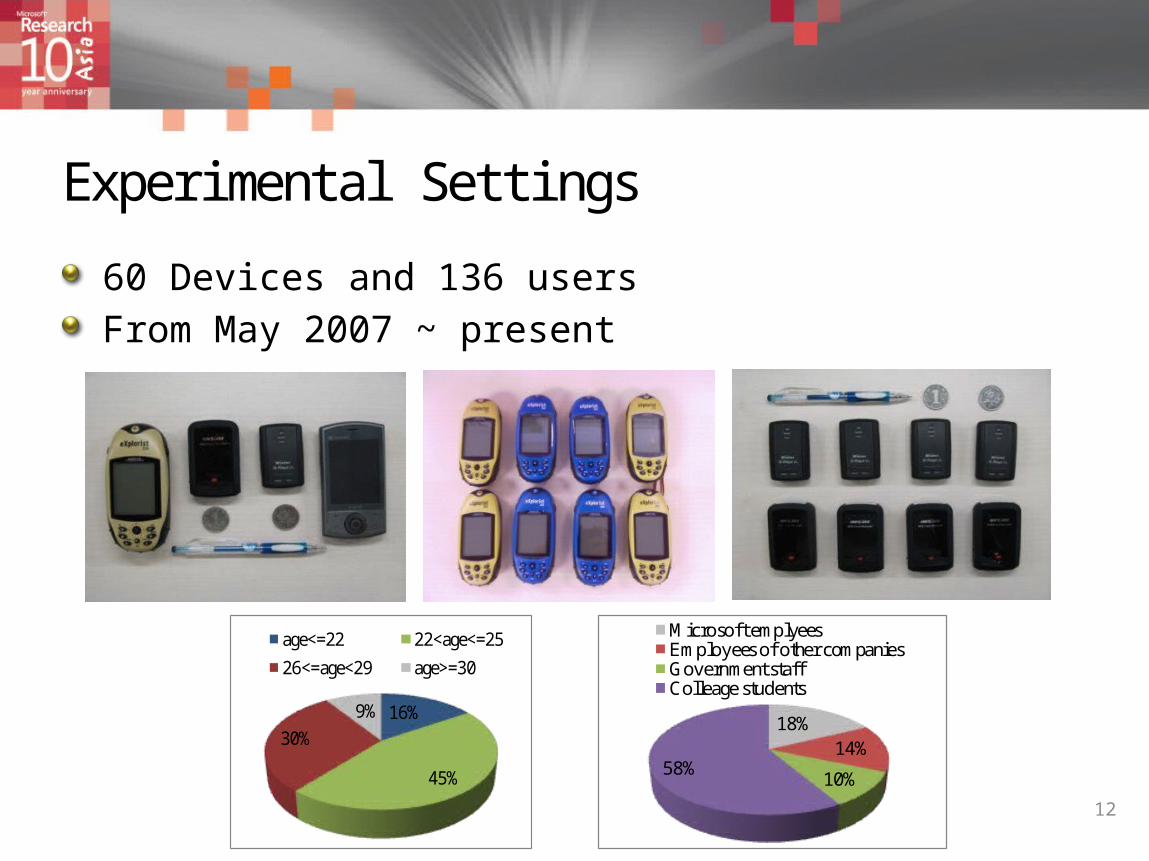
Experimental Settings
60 Devices and 136 usersFrom May 2007 ~ present
12
16%
45%
30%
9%
age<=22 22<age<=25
26<=age<29 age>=30
18%14%
10%58%
Microsoft emplyeesEmployees of other companies Government staffColleage students
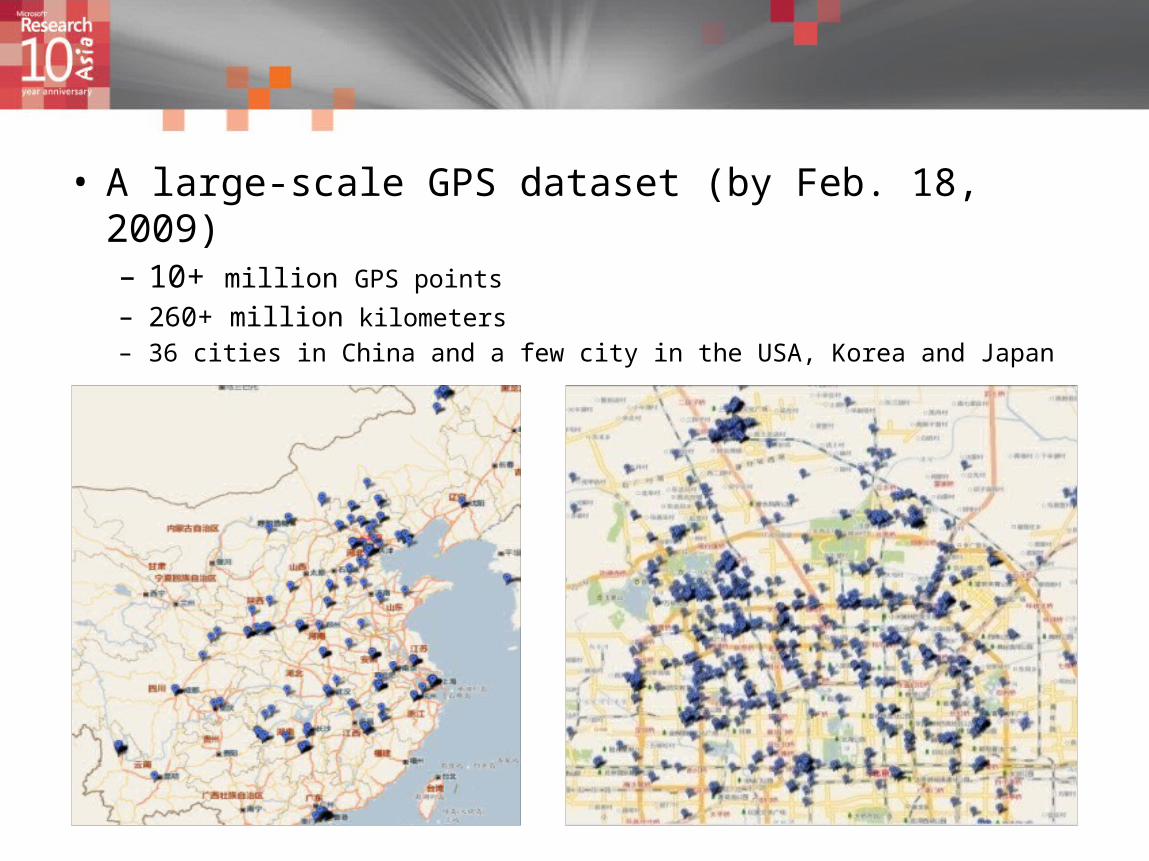
• A large-scale GPS dataset (by Feb. 18, 2009)– 10+ million GPS points– 260+ million kilometers– 36 cities in China and a few city in the USA, Korea and Japan
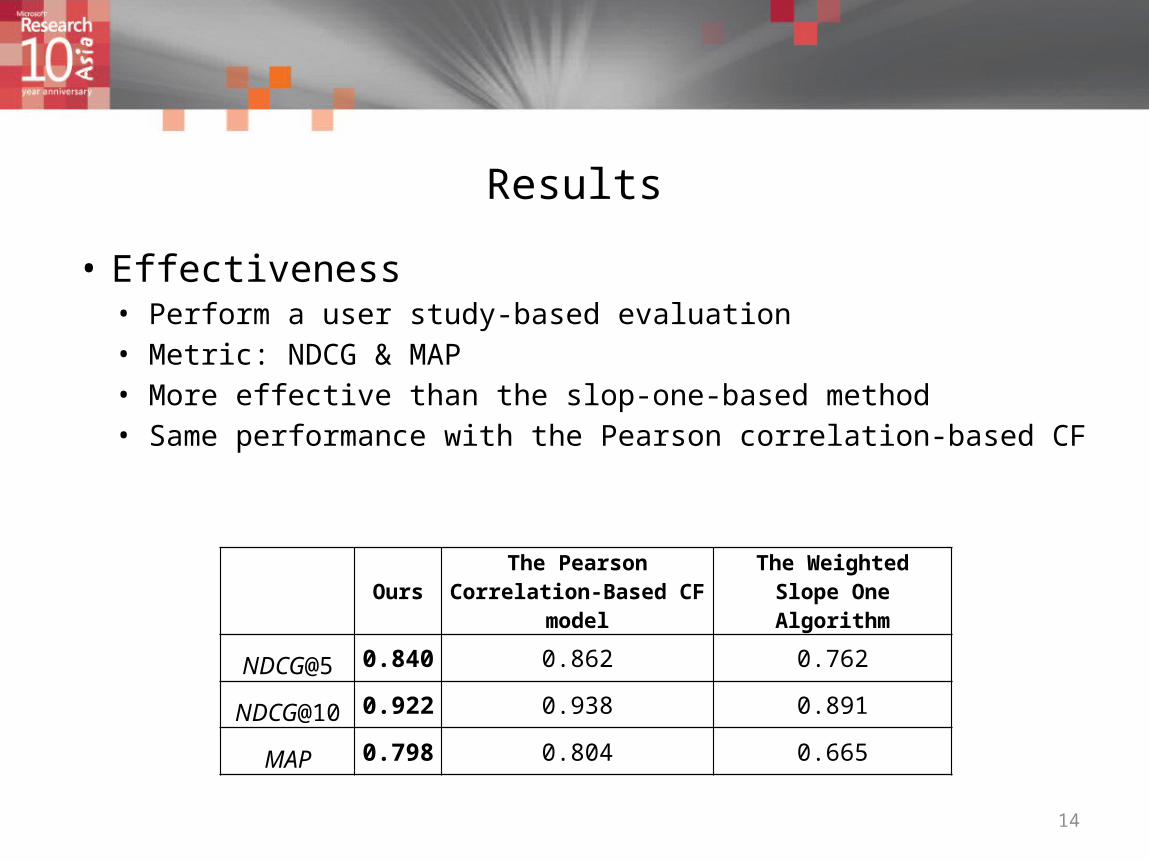
Results
OursThe Pearson Correlation-
Based CF modelThe Weighted Slope
One Algorithm
NDCG@5 0.840 0.862 0.762
NDCG@10 0.922 0.938 0.891
MAP 0.798 0.804 0.665
14
• Effectiveness• Perform a user study-based evaluation• Metric: NDCG & MAP• More effective than the slop-one-based method • Same performance with the Pearson correlation-based CF
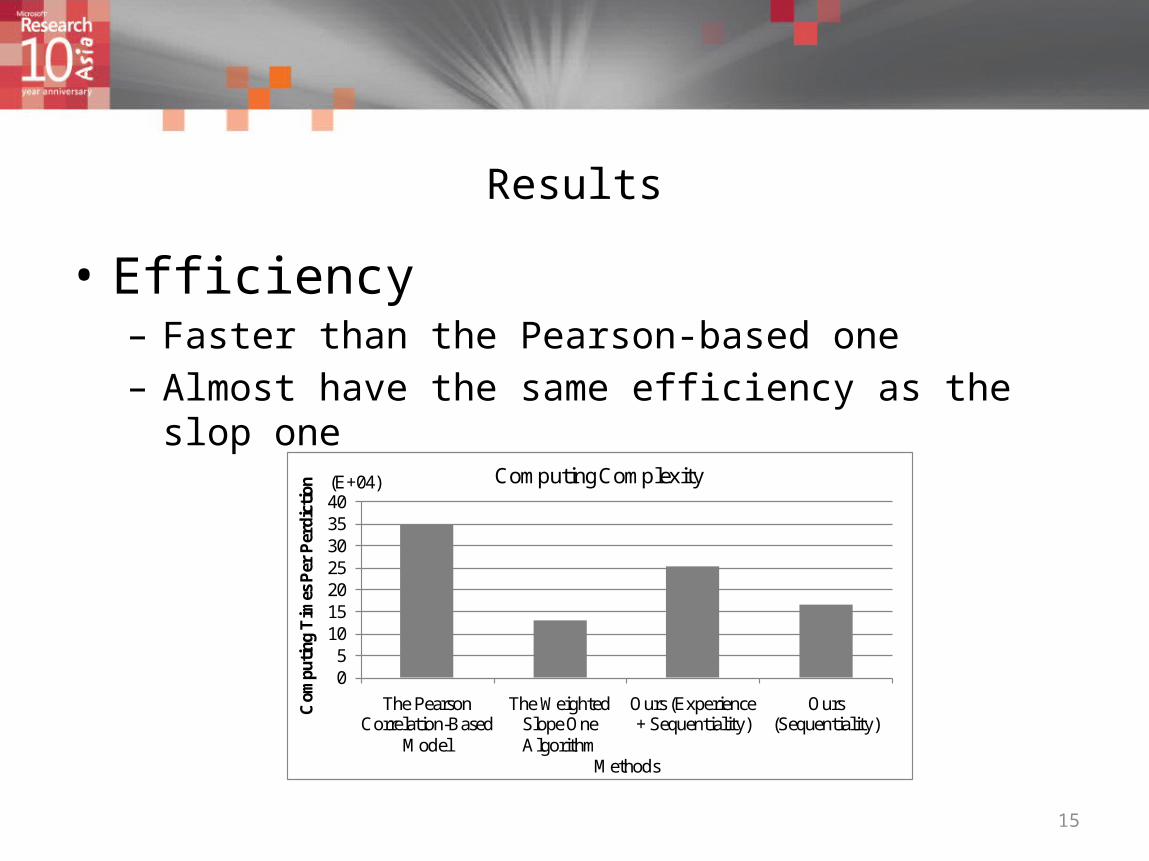
Results
• Efficiency– Faster than the Pearson-based one– Almost have the same efficiency as the slop one
15
05
10152025303540
The Pearson Correlation-Based
Model
The Weighted Slope One Algorithm
Ours (Experience + Sequentiality)
Ours (Sequentiality)
Com
puti
ng T
imes
Per
Per
dict
ion (E+04)
Methods
Computing Complexity
Conclusion
The correlation between locations in the space of human behaviorSequence propertyUser experience
Conduct a personalized location recommender based on the correlationThe recommender is
Efficient than the Pearson correlation-based method and Effective than the slop one based approach
16