Learning for Tomorrow’s Problems
52
Learning for Tomorrow’s Problems First Results from PISA2003 Ghent, 2005 Inge De Meyer Jan Pauly Luc Van de Poele Ministry of the Flemish Community Education Department Department of Education
Transcript of Learning for Tomorrow’s Problems

- 1 -
Learning for Tomorrow’s Problems First Results from PISA2003
Ghent, 2005
Inge De Meyer Jan Pauly Luc Van de Poele
Ministry of the Flemish Community
Education Department Department of Education

- 2 -
THE PISA SURVEY- INTRODUCTION Key features of the PISA Survey and of the first two PISA assessment cycles:
PISA - General PISA2000 PISA2003 PISA (Programme for International Student
Assessment) is a large scale, three-yearly international study that assesses knowledge and skills in 15-year-old students. The study is coordinated by the Departments of Education of participating countries, under the supervision of the Organisation for Economic Co-operation and Development (OECD).
All PISA survey cycles assess student
literacy in three cognitive domains: reading, mathematics, and science. However, within each cycle, the focus is on one assessment area while the other two are regarded as minor domains. Cognitive tests in PISA do not only capture the level of students’ knowledge. The PISA literacy concept is mainly concerned with the extent to which students can apply their knowledge to real world issues. It measures how well they understand concepts, master processes and are able to apply their skills in a variety of situations.
PISA assesses the students in their own school environment. The sample is drawn from the 15-year-old student population, regardless of their grade. All participating students carried out cognitive tasks in a test booklet for two hours; then answered a background questionnaire about themselves, their learning habits, and their attitudes towards school. Principals of participating schools also completed a background questionnaire about their school. The data collected by means of contextual questionnaires is used to explain variation in student performance.
The data collected through PISA assessment
cycles make it possible to measure change in student performance over time. PISA provides participating countries with fixed criteria and regular updates on how well their students perform according to those criteria. Countries will have the opportunity to see the effects of educational reforms, and how change in educational outcomes compares to international benchmarks.
The first PISA survey was conducted in 2000 in 32 countries and 11 partner countries conducted the study in 2002.
In PISA2000, the focus
was on reading literacy, the main domain for that cycle. Mathematical literacy and scientific literacy were included as minor domains.
About 265,000 students
participated in PISA2000 worldwide. The Flemish sample consisted of 124 schools, from which 3,890 fifteen-year-old students were assessed. This sample was fully representative of the Flemish education system as regards networks (public and private), education types and programmes. A number of BuSO schools (addressing special education needs) were also included in the sample.
All three cognitive domains
were assessed a first time in PISA2000.
PISA2003, reported on here, was conducted in 41 countries, including all 30 OECD countries and 11 partner countries. See the list of countries and map on the opposite page.
In PISA2003, the main domain was
mathematical literacy. In addition to reading and scientific literacy, students’ problem solving knowledge and skills were also assessed in this survey cycle.
In PISA2003, about 276,000 fifteen-
year-old students were assessed worldwide. Over 5,000 Flemish students from 162 schools participated in this cycle. The Flemish PISA sample is fully representative of Flemish secondary education and the BuSO was again explicitly included.
PISA2003 yields a first picture of changes that may occur in student performance over time. The data are indeed comparable between 2000 and 2003 for both reading literacy and two out of four mathematical literacy subscales. Such comparisons have certain limitations: since data are only available from two points in time, it is not possible to assess to what extent the observed differences are indicative of longer-term trends.
- 3 -
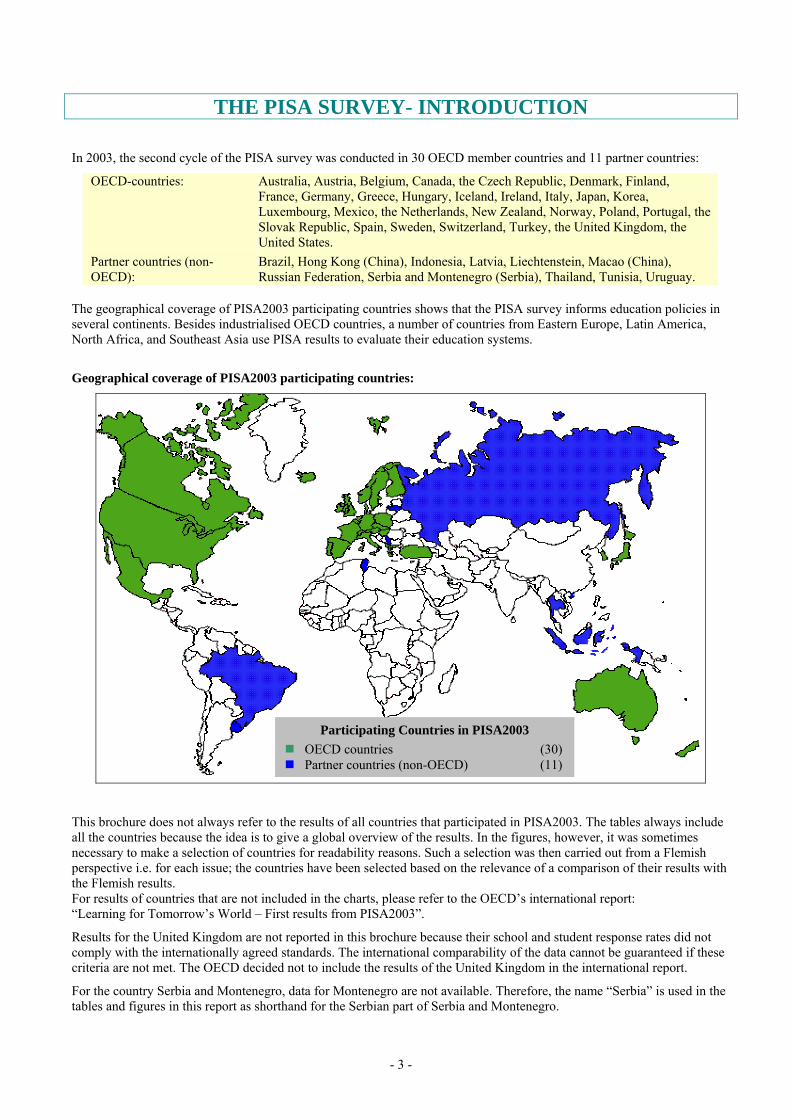
THE PISA SURVEY- INTRODUCTION In 2003, the second cycle of the PISA survey was conducted in 30 OECD member countries and 11 partner countries:
OECD-countries: Australia, Austria, Belgium, Canada, the Czech Republic, Denmark, Finland, France, Germany, Greece, Hungary, Iceland, Ireland, Italy, Japan, Korea, Luxembourg, Mexico, the Netherlands, New Zealand, Norway, Poland, Portugal, the Slovak Republic, Spain, Sweden, Switzerland, Turkey, the United Kingdom, the United States.
Partner countries (non-OECD):
Brazil, Hong Kong (China), Indonesia, Latvia, Liechtenstein, Macao (China), Russian Federation, Serbia and Montenegro (Serbia), Thailand, Tunisia, Uruguay.
The geographical coverage of PISA2003 participating countries shows that the PISA survey informs education policies in several continents. Besides industrialised OECD countries, a number of countries from Eastern Europe, Latin America, North Africa, and Southeast Asia use PISA results to evaluate their education systems.
Geographical coverage of PISA2003 participating countries:
This brochure does not always refer to the results of all countries that participated in PISA2003. The tables always include all the countries because the idea is to give a global overview of the results. In the figures, however, it was sometimes necessary to make a selection of countries for readability reasons. Such a selection was then carried out from a Flemish perspective i.e. for each issue; the countries have been selected based on the relevance of a comparison of their results with the Flemish results. For results of countries that are not included in the charts, please refer to the OECD’s international report: “Learning for Tomorrow’s World – First results from PISA2003”.
Results for the United Kingdom are not reported in this brochure because their school and student response rates did not comply with the internationally agreed standards. The international comparability of the data cannot be guaranteed if these criteria are not met. The OECD decided not to include the results of the United Kingdom in the international report.
For the country Serbia and Montenegro, data for Montenegro are not available. Therefore, the name “Serbia” is used in the tables and figures in this report as shorthand for the Serbian part of Serbia and Montenegro.
Participating Countries in PISA2003 OECD countries (30) Partner countries (non-OECD) (11)

- 4 -
OVERVIEW OF THE PISA2003 RESULTS The table on the opposite page shows the overall PISA2003 results for all participating countries. For each domain, the Flemish mean performance is compared with the mean performance of the other countries. Flanders’ top ranking in most assessment areas immediately catches the eye. In PISA2000, Flanders was in the top three for “Mathematical literacy”, with mean scores slightly lower than Japan and Korea, but with no statistically significant difference. Japan scored 14 points higher on average than Flanders, but since the uncertainty (standard error) is relatively large, this difference was not regarded as statistically significant. In PISA2003, Flanders’ mean performance in mathematical literacy was the highest of all participating countries. The gap between Flanders and runners-up Korea and Finland is similar to the gap between Japan and Flanders in PISA2000. However, in PISA2003, because the standard error has become smaller in many countries, Flanders performs significantly better than other countries (except Hong Kong, China). The results from PISA2003 can be compared to those from PISA2000 for two of the subscales of the mathematical literacy domain (i.e. “Space and shape” and “Change and relationships”). This comparison is explained in greater detail in this brochure but, at this point, it can be summarised as follows: the Flemish performance clearly rose on both subscales. The fact that Flanders made it to the top is partly due to the rise in Flemish performance and at least as much to the drop in performance observed in other countries (Korea and definitely Japan) for PISA2003. The Flemish performance in mathematics is impressive, since students in Flanders scored higher than in PISA2000, while the mean score was already quite high at the time. The picture is somewhat different for “Scientific literacy”. Flanders scores significantly lower than Finland, Japan, Hong Kong (China), and Korea. Results in this domain are slightly higher than in 2000 but this difference is not statistically relevant. The position of Flanders relative to other countries is virtually unchanged. Canada scores significantly lower than Flanders in PISA2003 while it was the other way round in PISA2000. However, this is due to a significant drop in Canadian performance. A comparison with neighbouring countries reveals that Flemish 15-year –olds do not perform significantly higher than their Dutch peers, but significantly higher than their peers in France, Germany, and Luxembourg do. The change between PISA2000 and PISA2003 in performance on the scientific literacy scale is analysed in greater detail in this report.
As regards “Problem solving”, a third assessment area in PISA2003, Flanders scores quite well indeed. Although the mean performance was slightly higher in Korea, Finland, and Hong Kong (China), this difference is not statistically significant: Flanders clearly belongs to the group of top performing countries. Japan also belongs to this group, albeit with a slightly lower mean performance than Flanders. However, Flanders’ high scores in problem solving do not come as a surprise, since almost 100% of high performance in this new domain can be explained by the results in the three other assessment areas (mathematical literacy, scientific literacy and reading literacy). In PISA2000, the main focus was on “Reading literacy” and the Flemish situation hardly changed since the previous cycle. Flanders is again ranked in the third position according to participating countries’ mean performance. As was the case in PISA2000, the reading literacy mean scores for Canada, Australia, and Korea do not differ significantly from the Flemish mean. With a mean score of 525 points on the reading literacy performance scale, Liechtenstein has joined the top group in 2003. Finland is again the only country to score significantly higher than Flanders within the top performing group. In contrast to the previous cycle, New Zealand, Ireland, and Japan scored significantly lower than Flanders in PISA2003. Japan’s drop in performance stands out particularly: in PISA2003, the Japanese mean score for reading literacy is not statistically different from the OECD average. The comparison between PISA2000 and PISA2003 will also be examined in greater detail for reading literacy further on in this brochure.

- 5 -
OVERVIEW OF THE PISA2003 RESULTS
Mean performance per country in each PISA domain
Mathematical literacy Scientific literacy Problem solving Reading literacy
Countries Mean St. Error
Countries Mean St. Error
Countries Mean St. Error
Countries Mean St. Error
Flanders 553 (2.1) Finland 548 (1.9) Korea 550 (3.1) Finland 543 (1.6) Hong Kong 550 (4.5) Japan 548 (4.1) Hong Kong 548 (4.2) Korea 534 (3.1) Finland 544 (1.9) Hong Kong 539 (4.3) Finland 548 (1.9) Flanders 530 (2.1) Korea 542 (3.2) Korea 538 (3.5) Flanders 547 (2.1) Canada 528 (1.7) Netherlands 538 (3.1) Flanders 529 (2.1) Japan 547 (4.1) Australia 525 (2.1) Liechtenstein 536 (4.1) Liechtenstein 525 (4.3) New Zealand 533 (2.2) Liechtenstein 525 (3.6) Japan 534 (4.0) Australia 525 (2.1) Macao-China 532 (2.5) New Zealand 522 (2.5) Canada 532 (1.8) Macao-China 525 (3.0) Australia 530 (2.0) Ireland 515 (2.6) Belgium 529 (2.3) Netherlands 524 (3.1) Liechtenstein 529 (3.9) Sweden 514 (2.4) Macao-China 527 (2.9) Czech Rep. 523 (3.4) Canada 529 (1.7) Netherlands 513 (2.9) Switzerland 527 (3.4) New Zealand 521 (2.4) Belgium 525 (2.2) Hong Kong 510 (3.7) Australia 524 (2.1) Canada 519 (2.0) Switzerland 521 (3.0) Belgium 507 (2.6) New Zealand 523 (2.3) Switzerland 513 (3.7) Netherlands 520 (3.0) Norway 500 (2.8) Czech Rep. 516 (3.5) France 511 (3.0) France 519 (2.7) Switzerland 499 (3.3) Iceland 515 (1.4) Belgium 509 (2.5) Denmark 517 (2.5) Belg. German 499 (2.7) Belg. German 515 (3.0) Sweden 506 (2.7) Czech. Rep. 516 (3.4) Japan 498 (3.9) Denmark 514 (2.7) Ireland 505 (2.7) Belg. German 514 (3.0) Macao-China 498 (2.2) France 511 (2.5) Hungary 503 (2.8) Germany 513 (3.2) Poland 497 (2.9) Sweden 509 (2.6) Germany 502 (3.6) Sweden 509 (2.4) France 496 (2.7) Austria 506 (3.3) Poland 498 (2.9) Austria 506 (3.2) United States 495 (3.2) Germany 503 (3.3) Slov. Rep. 495 (3.7) Iceland 505 (1.4) Denmark 492 (2.8) Ireland 503 (2.4) Iceland 495 (1.5) Hungary 501 (2.9) Iceland 492 (1.6) Slov. Rep. 498 (3.3) Belg. German 492 (2.8) Ireland 498 (2.3) Germany 491 (3.4) Belg. French 498 (4.3) United States 491 (3.1) Belg. French 496 (4.0) Austria 491 (3.8) Norway 495 (2.4) Austria 491 (3.4) Luxembourg 494 (1.4) Latvia 491 (3.7) Luxembourg 493 (1.0) Russ. Fed. 489 (4.1) Slov. Rep. 492 (3.4) Czech. Rep. 489 (3.5) Poland 490 (2.5) Latvia 489 (3.9) Norway 490 (2.6) Hungary 482 (2.5) Hungary 490 (2.8) Spain 487 (2.6) Poland 487 (2.8) Spain 481 (2.6) Spain 485 (2.4) Italy 486 (3.1) Latvia 483 (3.9) Luxembourg 479 (1.5) Latvia 483 (3.7) Norway 484 (2.9) Spain 482 (2.7) Portugal 478 (3.7) United States 483 (2.9) Luxembourg 483 (1.5) Russ. Fed. 479 (4.6) Belg. French 477 (5.0) Russ. Fed. 468 (4.2) Belg. French 483 (4.6) United States 477 (3.1) Italy 476 (3.0) Portugal 466 (3.4) Greece 481 (3.8) Portugal 470 (3.9) Greece 472 (4.1) Italy 466 (3.1) Denmark 475 (3.0) Italy 469 (3.1) Slov. Rep. 469 (3.1) Greece 445 (3.9) Portugal 468 (3.5) Greece 448 (4.0) Russ. Fed. 442 (3.9) Serbia 437 (3.8) Uruguay 438 (2.9) Thailand 425 (2.7) Turkey 441 (5.8) Turkey 423 (6.7) Serbia 436 (3.5) Serbia 420 (3.3) Uruguay 434 (3.4) Uruguay 422 (3.3) Turkey 434 (5.9) Uruguay 411 (3.7) Thailand 420 (2.8) Thailand 417 (3.0) Thailand 429 (2.7) Turkey 408 (6.0) Serbia 412 (3.6) Mexico 385 (3.6) Mexico 405 (3.5) Mexico 384 (4.3) Brazil 403 (4.6) Indonesia 360 (3.9) Indonesia 395 (3.2) Brazil 371 (4.8) Mexico 400 (4.1) Tunisia 359 (2.5) Brazil 390 (4.3) Indonesia 361 (3.3) Indonesia 382 (3.4) Brazil 356 (4.8) Tunisia 385 (2.6) Tunisia 345 (2.1) Tunisia 375 (2.8)
The Bonferoni method of adjustment for multiple calculation of statistically significant differences has not been incorporated in this table, which explains that minor differences may occur versus the OECD Report, in which all countries are drawn into the comparison.
Significantly higher than Flanders Not significantly different from Flanders Significantly lower than Flanders

- 6 -
MATHEMATICAL LITERACY PISA mathematical literacy is concerned with all skills students use to analyse, reason and communicate as they pose, solve and interpret mathematical problems. The concept “mathematical literacy” reaches beyond merely processing conventional mathematical tasks. In PISA, students were confronted with real-life problems set in a variety of contexts and they needed to activate their mathematical knowledge and skills in order to solve those problems. The situations involved were of four sorts: the use of mathematics in personal day-to-day activities; in school situations; in occupational situations; and in situations relating to the broader community.
PISA defines mathematical literacy as: “…an individual’s capacity to identify and understand the role that mathematics plays in the world, to make well-founded judgements and to use and engage with mathematics in ways that meet the needs of that individual’s life as a constructive, concerned and reflective citizen.”
As for reading literacy in PISA2000, the students’ mathematical literacy scores in PISA2003 are grouped into six proficiency levels. This classification by increasing level of task difficulty is based on the nature of the competencies that students use to deal with the mathematical problems. Proficiency Level 1 is the lowest level of mathematical literacy and Level 6 is the highest. Students scoring below Level 1 may be capable of performing some mathematical operation, but they were unable to utilise mathematical skills in the situations required by the easiest PISA tasks. The table below summarises the kind of mathematical competencies needed to attain the different proficiency levels.
Summary descriptions for the six levels of proficiency in mathematical literacy:
Level What students can typically do Level 6
(> 668 score points) Students can conceptualise, generalise, and use models of complex problem situations. They can link different information sources and representations and flexibly translate among them. Students at Level 6 are capable of advanced mathematical thinking and reasoning. These students can apply this insight and understandings along with a mastery of symbolic and formal mathematical operations and relationships to develop new strategies for attacking novel situations. Students at this level can formulate and precisely communicate their actions and reflections regarding their findings.
Level 5 (607 - 668 score
points)
Students can develop and work with models for complex situations. They can select, compare, and evaluate appropriate problem solving strategies for dealing with complex problems. Students at Level 5 can work strategically using broad, well-developed reasoning skills and different representations. They can reflect on their actions and formulate and communicate their interpretations and reasoning.
Level 4 (545 – 606 score
points)
Students can work effectively with explicit models for complex concrete situations that may involve constraints or call for making assumptions. Students at Level 4 select and integrate different representations, including symbolic, linking them directly to aspects of real-world situations. They can construct and communicate explanations and arguments based on their interpretations, arguments, and actions.
Level 3 (483 - 544 score
points)
Students can execute clearly described procedures. They can select and apply simple problem solving strategies. Students at Level 3 can interpret and use representations based on different information sources. They can develop short communications reporting their interpretations and results.
Level 2 (421 - 482 score
points)
Students can interpret and recognise situations in contexts that require no more than direct inference. They can extract relevant information from a single source and make use of a single representational mode. Students at Level 2 can employ basic algorithms, formulae, and procedures.
Level 1 (358 - 420 score
points)
Students can answer questions involving familiar contexts where all relevant information is present and the questions are clearly defined. They are able to identify information and to carry out routine procedures according to direct instructions in explicit situations. They can carry out logical tasks.
Below Level 1 (< 358 score points)
PISA applies an easy-to-understand criterion to assigning students to a given proficiency level: each student is assigned to the highest level for which s/he would be expected to answer correctly the majority of assessment items. Thus, for example, all students assigned to Level 3 would be expected to solve correctly at least 50 per cent of the items with the corresponding difficulty level.
600
500
400

- 7 -
MATHEMATICAL LITERACY The table below shows the mean percentage of students at each proficiency level in the OECD countries in the left column and in Flanders in the right column. About one third of all students who participated in PISA2003 scored in the top three proficiency levels of mathematical literacy. This proportion is significantly higher in Flanders, where every third student scores in the top two levels. The proportion of Flemish students at Level 6 is even 3 times higher than the international mean. Along the same lines, significantly less Flemish students perform at the lowest levels of mathematical literacy. Proficiency Level 2 is used as an international benchmark: from Level 2, students begin to apply specific mathematical skills in order to solve problems. On average, in OECD countries, over two-thirds of the students score at Level 2 or higher. In Flanders, 90 per cent of the students score at Level 2 or above.
PISA measures students’ mathematical abilities in different mathematical contexts. Student performance is reported on four subscales that reflect the different contexts involved:
“Space and shape” is related to spatial and geometric phenomena and relationships; it is mainly based on geometry.
“Change and relationships” is related to mathematical manifestations of change, functional relationships, and dependency among variables. This subscale is closely linked to algebra.
“Quantity” is related to numeric phenomena and quantitative relationships and patterns. “Uncertainty” is related to probabilistic and statistical phenomena, and relationships that become
increasingly important in our information societies.
The PISA assessments include both complex and relatively simple tasks for each of the four subscales. Students’ scores on the subscales are also based on the level of difficulty of the tasks they were able to solve correctly. The average of a student’s scores on each the four subscales reflects his/her overall mathematical performance. Like the mathematical literacy domain, the four subscales are divided into six consecutive proficiency levels. The tables on the following two pages summarise the respective abilities required by students in order to attain the different levels on each subscale.
Percentage of students by highest level of proficiency on the mathematical literacy scale
OECD average Flanders
Level 6 Above 668 score points
Level 5 From 607 to 668 score points
Level 4 From 545 to 606 score points
Level 3 From 483 to 544 score points
Level 2 From 421 to 482 score points
Level 1 From 358 to 420 score points
Below level 1 Below 358 score points
4%
11%
19%
24%
21%
13%
8%
12%
22%
23%
19%
13% 7% 5%

- 8 -
MATHEMATICAL LITERACY SPACE AND SHAPE (~geometry) CHANGE AND RELATIONSHIPS (~algebra)
Lev. 6 Solve complex geometrical problems involving multiple representations and sequential calculation processes; identify relevant information and link it to different but related information; use reasoning, significant insight and reflection; generalise results and findings, communicate solutions and provide explanations and argumentation.
Interpret complex mathematical information in the context of an unfamiliar real-world situation; interpret periodic functions in a real-world setting; insightful use of algebra or graphs to solve problems; use technical insight and abstract reasoning; coherently communicate logical reasoning and arguments.
Lev. 5 Solve problems that require appropriate assumptions to be made, or that involve working with provided assumptions; use well-known geometrical algorithms (such as Pythagoras’ theorem) in unfamiliar situations; interpret multiple representations of geometric phenomena; use spatial reasoning and insight to solve geometrical problems; work strategically and carry out multiple and sequential processes.
Solve problems by making advanced use of algebraic and other formal mathematical expressions and models; interpret complex formulae in a scientific context; link mathematical representations to complex real-world situations; use complex and multi-step problem solving skills; reflect on and communicate reasoning and arguments. (Cf. sample item "Walking" on page 13 of this publication.)
Lev. 4 Solve problems that involve visual and spatial reasoning and argumentation in unfamiliar contexts; link different representations of the same geometric pattern; carry out sequential processes; perform simple calculations and follow a sequence of steps; apply skills in spatial reasoning and representation.
Interpret and work with multiple representations, including explicit mathematical models of real-world situations, in both familiar and unfamiliar contexts; employ considerable flexibility in interpretation and reasoning; relate text-based information to a graphic representation; analyse a given mathematical model involving a complex formula; communicate explanations and arguments.
Lev. 3 Solve problems that involve elementary visual and spatial reasoning in familiar contexts; work with familiar mathematical models and use elementary problem solving skills; perform simple calculations and apply simple algorithms. (Cf. sample item "Number Cubes" on page 11 of this publication.)
Solve problems that involve linking multiple related representations (a text, a graph, a table, a formula); identify relevant criteria in a text and apply them; use reasoning involving proportions in familiar contexts and communicate arguments.
Lev. 2 Solve problems involving a single mathematical representation where the mathematical content is direct and clearly presented; recognise simple geometric patterns; use basic technical terms and apply basic geometric concepts (e.g. symmetry) in familiar contexts and real-world situations.
Link a simple text with a single graphical representation (graph, table); work with simple algorithms, formulae and procedures to solve problems; interpret simple motion, speed and time relationships; locate relevant information in a graph; use interpretation and reasoning skills at an elementary level.
Lev. 1 Solve simple problems in a very familiar context using familiar pictures or drawings of geometric objects and applying basic calculation skills.
Locate relevant information in, or read a value from, a simple table or graph; perform simple calculations involving relationships between two familiar variables.
Meaning of the proficiency levels on the mathematical literacy subscales

- 9 -
MATHEMATICAL LITERACY
QUANTITY (~arithmetic) UNCERTAINTY (~probability)
Devise strategies for working with models of several complex mathematical processes and relationships; interpret and understand complex information and symbolic expressions; link multiple complex information sources; use sequential calculation processes in unfamiliar contexts; formulate conclusions, arguments and precise explanations.
Use high-level reasoning skills and insight into probability to create mathematical representations of real-world situations; employ complex reasoning using statistical concepts; show understanding of basic ideas of sampling and carry out calculations with weighted averages; communicate complex arguments and explanations.
Lev. 6
Interpret and use complex models of real-world situations (including graphs and complex tables); use reasoning and interpretation skills with different representations; carry out sequential processes; use problem solving skills in real-world contexts that involve substantial mathematisation; communicate reasoning and argument.
Apply probabilistic knowledge in problem situations in an unfamiliar context; use reflection and insight into standard probabilistic situations and in carrying out a sequence of related calculations; link information from multiple sources; communicate reasoning and explanations. (Cf. sample item "Test Scores" on page 17 of this publication.)
Lev. 5
Work with simple models of complex situations; accurately apply a given numeric algorithm involving a number of steps; analyse and apply quantitative relationships; interpret different representations of the same situation; combine information from multiple sources; use a variety of calculation skills to solve problems. (Cf. sample item "Skateboard" on page 15 of this publication.)
Show understanding of basic statistical concepts; use knowledge of basic probability to solve simple problems in less familiar contexts; show insight into aspects of data from tables and graphs; translate text description into appropriate probability calculation; use and communicate argumentation based on interpretation of data.
Lev. 4
Use simple problem solving strategies in familiar contexts; interpret a text description of a complex calculation process, and correctly implement the process; locate relevant data from a table; carry out explicitly described calculations and processes, convert units.
Interpret statistical information and data from tables and non-standard graphs; identify outcomes of a well-defined and familiar probability experiment; show insight into aspects of data presentation and link data to suitable chart type; communicate reasoning.
Lev. 3
Interpret a simple quantitative model and apply it using basic arithmetic calculations; interpret simple tabular data, link textual information to related tabular data; carry out basic arithmetic calculations; perform simple calculations involving the basic arithmetic operations.
Locate relevant statistical information presented in a simple and familiar graph; understand and explain simple statistical calculations; link text to a related graph, in common and familiar forms; read values from a familiar data display, such as a bar graph.
Lev. 2
Solve problems of the most basic type in which all relevant information is explicitly presented; interpret a simple, explicit mathematical relationship, and apply it; read and interpret a simple table of numbers, total the columns and compare the results; solve the simplest problems.
Understand basic probability concepts in the context of a simple and familiar experiment (e.g. involving dice or coins); listing and counting of combinatorial outcomes in a limited and well-defined game situation.
Lev. 1

- 10 -
MATHEMATICAL LITERACY – SPACE AND SHAPE A quarter of the mathematical tasks given to students in PISA are related to spatial and geometric phenomena and relationships. The “Space and shape” subscale is predominantly the curricular discipline of geometry. Students need to look for similarities and differences when analysing the components of (geometrical) shapes, to recognise shapes in different representations, as well as to understand the properties of objects and their relative positions. On the opposite page, you will find a sample item for the “Space and shape” subscale and on page 8 of this publication a table provides a detailed description of the skills related to each proficiency level on that subscale.
Space and shape
Countries Mean St. Error
Hong Kong 558 (4.8) Japan 553 (4.3) Korea 552 (3.8)
Flanders 551 (2.4) Switzerland 540 (3.5)
Finland 539 (2.0) Liechtenstein 538 (4.6)
Belgium 530 (2,3) Macao–China 528 (3.3)
Czech. Rep. 527 (4.1) Netherlands 526 (2.9)
New Zealand 525 (2.3) Australia 521 (2.3) Canada 518 (1.8) Austria 515 (3.5)
Belg. German 514 (3.3) Denmark 512 (2.8)
France 508 (3.0) Slov. Rep. 505 (4.0)
Iceland 504 (1.5) Belg. French 501 (4.0)
Germany 500 (3.3) Sweden 498 (2.6) Poland 490 (2.7)
Luxembourg 488 (1.4) Latvia 486 (4.0)
Norway 483 (2.5) Hungary 479 (3.3)
Spain 476 (2.6) Ireland 476 (2.4)
Russ. Fed. 474 (4.7) United States 472 (2.8)
Italy 470 (3.1) Portugal 450 (3.4) Greece 437 (3.8) Serbia 432 (3.9)
Thailand 424 (3.3) Turkey 417 (6.3)
Uruguay 412 (3.0) Mexico 382 (3.2)
Indonesia 361 (3.7) Tunisia 359 (2.6)
Brazil 350 (4.1)
The table alongside shows the ranking of the PISA2003 countries according to their mean performance on the ‘Space and shape’ subscale. As regards this mean performance, Flanders belongs to the top group, which also comprises three Asian countries. There are no significant differences between these four countries. No other country scores significantly better. In other words, on ‘Space and shape’, Flanders has a significantly higher score than Switzerland, Finland, the Netherlands, and all other countries. For the ‘Space and shape’ subscale, as for the ‘Change and relationships’ subscale, a comparison can be made with the performance of Flemish students in PISA2000. We will go into this comparison in detail further in this brochure. However, when the countries are ranked according to the distribution of their students over the different proficiency levels in ‘Space and shape’, a completely different picture emerges. The figure on the opposite page shows the countries ranked according to the percentage of students at Levels 2, 3, 4, 5, and 6. Level 2 was selected as the basis of comparison, as it is the minimum level that students must reach to be able to apply mathematics actively as described in the PISA definition (see p. 6 of this brochure). When this criterion is applied, Finland comes first, and not Hong Kong (China). In Finland, as the table shows, only 10% of the students score lower than Level 2. This is about the same as Flanders and the three Asian countries in the lead. However, Finland and the Netherlands have much fewer students in the 2 highest proficiency levels. In Flanders, 33% of the students belong to Levels 5 and 6, whereas in Finland, it is only 23%. The contrast is even sharper when the comparison is made with the OECD country mean. In an average OECD country, only 6% of the students attain the highest proficiency level of ‘Space and shape’. In Flanders, this percentage is more than double. Fourteen per cent of the Flemish PISA students are able to solve problems correctly at Level 6. The high percentage of Flemish 15-year-old students scoring at the top proficiency level on the ‘Space and shape’ subscale explains Flanders’ outstanding score on that subscale.

- 11 -
668.7
606.6
Level
544.4
482.4
420.4
358.3
MATHEMATICAL LITERACY – SPACE AND SHAPE Sample item used in the PISA “Space and shape” subscale
NUMBER CUBES On the right, there is a picture of two dice. Dice are special number cubes for which the following rule applies: “The total number of dots on two opposite faces is always seven.” Question 3: NUMBER CUBES You can make a simple number cube by cutting, folding and gluing cardboard. This can be done in many ways. In the figure below you can see four cuttings that can be used to make cubes, with dots on the sides. Which of the following shapes can be folded together to form a cube that follows the rule that the sum of opposite faces is 7. For each shape, circle ‘Yes’ or ‘No’ in the table below”.
Shape Follows the rule that the sum of opposite faces is 7?
I Yes / No II Yes / No III Yes / No IV Yes / No
Full Credit: 503 score points Code 1: No, Yes, Yes, No, in that order.
17 13 14 14 15 15 18 19 16 20 18 18 17 19 22 17 20 19 19 22 20 19 19 23 22 22 25 22 25 22 25 22 22 26 24 25 25 23 22 21 16 15 14
2519 20 19 20 21
25 2521
2522 23 20
24 2619
23 22 2124 22 20 21
23 22 2325
22 2320 22 20 21
20 19 17 15 15 139
7 6 6
25
22 22 22 2023
23 2221
2121 21
2020
20
1920 19 19
1818 17 18
17 16 17 1516 15
1514
14 15 1110 9 7 7
32 2 2
15
20 18 19 1716
14 1516
1214 13
1613 10
1412 12 12
1012 12 11 9 9 8 6 8 7
8 7 8 7 44 3 2 2
816 14 14 16 10 7 6 12 6 8 7 10 6 3
12 5 7 9 4 6 8 6 4 5 3 2 3 25 2 4 3
55505039292923222116
1515121311121011111011109886887776655446554437 7 7 8 8 8 10 10 9 11 11 11 10 11 12 11 12 14 12 13 14 13 13 16 15 15 17 16 17 17 18 16 17 22 22 24 27 23 26 28 26 26 23
6
1
3
11 1
12
100
75
50
25
0
25
50
75
100
Finl
and
Hon
g K
ong
Japa
n
Bel
. Fla
nder
s
Kor
ea
Liec
hten
stei
n
Mac
ao-C
hina
Net
herla
nds
Switz
erla
nd
Can
ada
New
Zea
land
Aus
tralia
Bel
gium
Den
mar
k
Icel
and
Cze
ch R
ep.
Fran
ce
Bel
. Ger
man
Aus
tria
Swed
en
Bel
. Fre
nch
Slov
. Rep
.
Ger
man
y
Luxe
mbo
urg
Pola
nd
Latv
ia
Spai
n
Nor
way
Irel
and
Hun
gary
Uni
ted
Stat
es
Rus
s. F
ed.
Italy
Portu
gal
Gre
ece
Serb
ia
Thai
land
Uru
guay
Turk
ey
Mex
ico
Indo
nesi
a
Tuni
sia
Bra
zil
6
5 4 3 2 1
Bel
ow 1
Percentage of students at each level of proficiency on the “Space and shape” subscale
Note: due to rounding off, the sum of the percentages not always equals 100
< Level 1 Level 1 Level 2 Level 3 Level 4 Level 5 Level 6 Percentage of students
I II III IV

- 12 -
MATHEMATICAL LITERACY – CHANGE AND RELATIONSHIPS The second subscale of the mathematics domain in PISA2003 relates to the curricular discipline of algebra. “Change and relationships” involves mathematical manifestations of change as well as functional relationships and dependency among variables. Mathematical relationships are often expressed as equations or inequalities, but relationships of a more general nature (e.g., equivalence, divisibility, etc.) are relevant in this context. Relationships are given in a variety of different representations, including symbolic, algebraic, graphic, tabular, and geometric representations. Since different representations may serve different purposes, it is of key importance that students can link different representations of a phenomenon.
Change and relationships
Countries Mean St. Error
Flanders 562 (2.4)
Netherlands 551 (3.1)
Korea 548 (3.5)
Finland 543 (2.2)
Hong Kong 540 (4.7)
Liechtenstein 540 (3.7)
Canada 537 (1.9)
Japan 536 (4.3)
Belgium 535 (2,4)
New Zealand 526 (2.4)
Australia 525 (2.3)
Switzerland 523 (3.7)
France 520 (2.6)
Macao–China 519 (3.5)
Belg. German 516 (3.6)
Czech. Rep. 515 (3.5)
Iceland 509 (1.4)
Denmark 509 (3.0)
Germany 507 (3.7)
Ireland 506 (2.4)
Sweden 505 (2.9)
Belg. French 501 (4.6)
Austria 500 (3.6)
Hungary 495 (3.1)
Slov. Rep. 494 (3.5)
Norway 488 (2.6)
Latvia 487 (4.4)
Luxembourg 487 (1.2)
United States 486 (3.0)
Poland 484 (2.7)
Spain 481 (2.8)
Russ. Fed. 477 (4.6)
Portugal 468 (4.0)
Italy 452 (3.2)
Greece 436 (4.3)
Turkey 423 (7.6)
Serbia 419 (4.0)
Uruguay 417 (3.6)
Thailand 405 (3.4)
Mexico 364 (4.1)
Tunisia 337 (2.8)
Indonesia 334 (4.6)
Brazil 333 (6.0)
From the international viewpoint, the greatest difference between the highest and lowest ranking countries can be observed for the ‘Change and relationships’ subscale. The difference in mean score between Flanders and Brazil is no less than 229 points, or almost 4 proficiency levels. The other countries with the highest scores for the ‘Space and shape’ subscale (Japan, Hong Kong (China), and Korea) do not do as well for this subscale. On average, Flanders ranks 11 points higher than the second country in the ranking, which is the Netherlands. The difference with the Netherlands is statistically significant. Based on the mean performance on this subscale, Flanders’ result is downright spectacular. Further on in this brochure, a comparison is made with the results of PISA2000 for this subscale too. As regards the distribution over the different levels of proficiency, the pattern that emerges is similar to that of the ‘Space and shape’ subscale. When the countries are ranked according to the percentages of their students at the second, third, fourth, fifth, and sixth proficiency level, Flanders only comes fifth (see the figure on the opposite page), in spite of being the unrivalled champion in the ranking according to the mean score. The figure showing the distribution over the proficiency levels shows that, just like for the ‘Space and shape’ subscale, the reason for the excellent average Flemish performance on the ‘Change and relationships’ subscale lies with the percentage of 15-year-olds that achieve the highest proficiency levels. There is no other participating country where so many students reach Levels 5 and 6 (38%). Moreover, with 17% students at Level 6, Flanders ranks far above the other countries as regards the percentage of students at this highest level of proficiency. Flemish students are clearly able to solve more difficult algebra problems than 15-year-olds from any other country. In Flanders, only 12% of the students do not make it to Level 2. Among the countries at the very bottom of the ranking, this figure ranges from 58% (Thailand) to 80% (Indonesia), but in European countries such as Sweden and Germany too, the number of students in the lowest proficiency levels is about twice as many as in Flanders. Finland and the Netherlands are the only countries with significantly fewer students who do not make Level 1.

- 13 -
668.7
Level
606.6
358.3
544.4
482.4
420.4
MATHEMATICAL LITERACY – CHANGE AND RELATIONSHIPS Sample item used in the PISA “Change and relationships” subscale
WALKING
The picture shows the footprints of a man walking. The pacelength P is the distance between the rear of two consecutive footprints. For men, the formula, 140=
Pn , gives an approximate relationship between n and P where,
n = number of steps per minute, and P = pacelength in metres. Question 4: WALKING If the formula applies to Jan’s walking and Jan takes 70 steps per minute, what is Jan’s pacelength? Show your work? Full Credit: 611 score points Code 2: P = 0,5 m or P = 50 cm or P = ½ (unit not required)
16 16 16 17 13 15 18 15 16 18 18 2315 18 21 17 20 20 17 20 18 20 22 21 23 23 18 22 22 24 23 24 24 24 23 22 23 20 22 17 11 13 12
23 24 22 25
1721
2421 21 23 24
27
1823 24
2124 24
21 22 21 22 23 22 24 2420
24 23 23 24 24 23 20 18 16 1614 12
97 6 5
22 24 2424
2123
23
20 2122 22
22
20
22 1921
21 2120 18 20
19 18 18 17 18
1818 18 16 17 15 15
1211
9 78 5
33 2 2
19 17 1716
2119
1419 16
14 1410
17
14 1314
12 1114 12 13 11 10 10 8 8
138 8 8 8 7 6
54
3 24
2
01
11 9 11 717 10 7 11 11 8 6 2
126 6 9 4 5 7 7 6 5 4 4 3 2 6 3 3 3 2 3 2
21
13
1 3 3 3 5 6 5 5 6 6 6 5 8 5 6 8 6 6 8 9 9 9 8 10 10 10 12 11 11 10 11 12 14 1823 30
27 3032
4760
59 60
7 7 7 8 7 8 9 10 9 10 9 11 10 12 12 10 12 12 12 13 13 14 15 14 15 14 13 15 15 16 15 16 17 19 20 19 24 21 26 24 17 20 20
11
100
75
50
25
0
25
50
75
100
Net
herla
nds
Finl
and
Kor
ea
Can
ada
Bel
. Fla
nder
s
Hon
g K
ong
Aus
tralia
Liec
hten
stei
nJa
pan
New
Zea
land
Fran
ce
Irel
and
Bel
gium
Mac
ao-C
hina
Cze
ch R
ep.
Switz
erla
ndIc
elan
d
Den
mar
k
Bel
. Ger
man
Swed
enG
erm
any
Aus
tria
Hun
gary
Slov
. Rep
.
Nor
way
Uni
ted
Stat
es
Bel
. Fre
nch
Latv
ia
Luxe
mbo
urg
Pola
nd
Spai
nR
uss.
Fed
.
Portu
gal
Italy
Gre
ece
Uru
guay
Serb
ia
Turk
ey
Thai
land
Mex
ico
Bra
zil
Tuni
sia
Indo
nesi
a
6 5 4 3 2 1
Bel
ow
Note: due to rounding off, the sum of the percentages not always equals 100
Percentage of students at each level of proficiency on the “Change and relationships” subscale Percentage of students < Level 1 Level 1 Level 2 Level 3 Level 4 Level 5 Level 6

- 14 -
MATHEMATICAL LITERACY – QUANTITY “Quantity” involves numbers as well as quantities. This subscale relates to the understanding of relative size, the recognition of numerical patterns, and the use of numbers to represent quantities and quantifiable attributes of real-world objects. Furthermore, quantity deals with the processing and understanding of numbers that are represented in various ways, with mental arithmetic, estimating, and understanding the meaning of operations. This subscale is most closely associated with the curricular discipline of arithmetic, as shown by the sample item on the opposite page.
Quantity
Countries Mean St. Error
Flanders 551 (2.0)
Finland 549 (1.8)
Hong Kong 545 (4.2)
Korea 537 (3.0)
Liechtenstein 534 (4.1)
Macao – China 533 (3.0)
Switzerland 533 (3.1)
Belgium 530 (2,3)
Netherlands 528 (3.1)
Canada 528 (1.8)
Czech. Rep. 528 (3.5)
Japan 527 (3.8)
Belg. German 521 (3.2)
Australia 517 (2.1)
Denmark 516 (2.6)
Germany 514 (3.4)
Sweden 514 (2.5)
Iceland 513 (1.5)
Austria 513 (3.0)
Slov. Rep. 513 (3.4)
New Zealand 511 (2.2)
France 507 (2.5)
Ireland 502 (2.5)
Belg. French 502 (4.5)
Luxembourg 501 (1.1)
Hungary 496 (2.7)
Norway 494 (2.2)
Spain 492 (2.5)
Poland 492 (2.5)
Latvia 482 (3.6)
United States 476 (3.2)
Italy 475 (3.4)
Russ. Fed. 472 (4.0)
Portugal 465 (3.5)
Serbia 456 (3.8)
Greece 446 (4.0)
Uruguay 430 (3.2)
Thailand 415 (3.1)
Turkey 413 (6.8)
Mexico 394 (3.9)
Tunisia 364 (2.8)
Brazil 360 (5.0)
Indonesia 357 (4.3)
Flanders, Finland, and Hong Kong (China) achieve the highest mean scores for ‘Quantity’ (see the table alongside). The difference between the mean scores of these three countries is not significant. All the other countries have lower scores. For this subscale, it is not possible to compare the results with those of PISA2000. The figure on the opposite page compares the countries on the basis of the distribution of their students over the different proficiency levels for the ‘Quantity’ subscale. Compared to the subscales ‘Space and shape’ and ‘Change and relationships’, an average OECD country has slightly fewer 15-year-olds who excel on this subscale (only 4% of the students attain Level 6). This also applies to Flanders (with 12% at Level 6), even though Flanders ranks highest for the ‘Quantity’ subscale with the highest mean score and the largest percentage of students in the highest proficiency levels. The percentage of Flemish students at or below the lowest proficiency level is very small, but in this respect, Flanders is no different from the other countries.

- 15 -
668.7
Level
420.4
606.6
544.4
482.4
358.3
Percentage of students at each level of proficiency on the “Quantity” subscale
MATHEMATICAL LITERACY – QUANTITY Sample item used in the PISA “Quantity” subscale
SKATEBOARD Eric is a great skateboard fan. He visits a shop named SKATERS to check some prices. At this shop you can buy a complete board. But you can also buy a deck, a set of 4 wheels, a set of 2 trucks and a set of hardware separately and assemble the board yourself. The prices for the shop’s products are:
Product Price in zeds Complete skateboard
82 or 84
Deck 40, 60 or 65
One set of 4 Wheels
14 or 36
One set of 2 Trucks 16
One set of hardware (bearings, rubber pads, bolts and nuts) 10 or 20
Question 3: SKATEBOARD Eric has 120 zeds to spend and wants to buy the most expensive skateboard he can afford. How much money should Eric spend on each of the 4 parts? Put your answer in the table below.
Part Amount (zeds) Deck Wheels Trucks Hardware
Full Credit: 554 score points
Code 1: 65 zeds on a deck, 14 on wheels, 16 on trucks and 20 on hardware
15 17 18 14 13 16 18 16 18 17 21 21 17 20 15 20 17 19 19 20 23 20 18 22 24 22 23 18 23 26 26 22 22 25 27 25 22 23 20 2115 16 15
27 25 2621 19
24 25 24 23 2427 27
2326
2126
23 24 24 2527
2422
26 2725 25
2225
28 2522 22
23 2220
18 1413 12
8 7 6
27 26 25
2624
25 24 25 22 2322 23
2423
22
2222 22 23 22
2121
22
21 1920 19
2119
1615
16 1514 12
1110
67 5
3 2 2
18 16 1619
21
17 14 16 16 1511 11
1512
1712
15 13 13 11 912 14
9 8 10 913
9 56
8 8 5 44
42
3
76 5 9 12 6 6 7 7 7 4 3 7 4
8 4 6 5 4 3 2 5 5
1 3 2 4 5 4 4 4 4 5 4 4 6 5 7 6 6 5 6 7 6 6 9 6 7 8 8 10 9 7 11 14 14 13 14 19 26
28 3235 51 49 52
5
252521252326202021181616171513121413141210121211111110119109111010109987787
1
11
3311343223
2
1 11
1
1
100
75
50
25
0
25
50
75
100
Finl
and
Kor
ea
Mac
ao-C
hina
Hon
g K
ong
Bel
. Fla
nder
s
Liec
hten
stei
n
Can
ada
Switz
erla
nd
Net
herla
nds
Cze
ch R
ep.
Swed
en
Aus
tria
Japa
n
Den
mar
k
Bel
gium
Slov
. Rep
.
Bel
. Ger
man
Aus
tralia
Icel
and
Fran
ce
Irel
and
New
Zea
land
Ger
man
y
Luxe
mbo
urg
Pola
nd
Hun
gary
Nor
way
Bel
. Fre
nch
Spai
n
Latv
ia
Rus
s. F
ed.
Uni
ted
Stat
es
Italy
Portu
gal
Serb
ia
Gre
ece
Uru
guay
Thai
land
Turk
ey
Mex
ico
Bra
zil
Tuni
sia
Indo
nesi
a
6
5 4 3 2 1
Bel
ow 1
Percentage of students
Note: due to rounding off, the sum of the percentages not always equals 100
< Level 1 Level 1 Level 2 Level 3 Level 4 Level 5 Level 6

- 16 -
MATHEMATICAL LITERACY – UNCERTAINTY A quarter of the mathematical tasks given to students in PISA2003 involve probabilistic and statistical phenomena. The “Uncertainty” subscale focuses on understanding experiments; locating and interpreting data, no matter in what form the information is represented; and the ability to work with statistical processes and terminology (e.g. the average).
Uncertainty
Countries Mean St. Error
Hong Kong 558 (4.6)
Flanders 551 (2.3)
Netherlands 549 (3.0)
Finland 545 (2.1)
Canada 542 (1.8)
Korea 538 (3.0)
New Zealand 532 (2.3)
Macao – China 532 (3.2)
Australia 531 (2.2)
Japan 528 (3.9)
Iceland 528 (1.5)
Belgium 526 (2,2)
Liechtenstein 523 (3.7)
Ireland 517 (2.6)
Switzerland 517 (3.3)
Denmark 516 (2.8)
Norway 513 (2.6)
Sweden 511 (2.7)
France 506 (2.4)
Belg. German 506 (3.5)
Czech. Rep. 500 (3.1)
Austria 494 (3.1)
Poland 494 (2.3)
Germany 493 (3.3)
Belg. French 493 (4.1)
Luxembourg 492 (1.1)
United States 491 (3.0)
Hungary 489 (2.6)
Spain 489 (2.4)
Slov. Rep. 476 (3.2)
Latvia 474 (3.3)
Portugal 471 (3.4)
Italy 463 (3.0)
Greece 458 (3.5)
Turkey 443 (6.2)
Russ. Fed. 436 (4.0)
Serbia 428 (3.5)
Thailand 423 (2.5)
Uruguay 419 (3.1)
Mexico 390 (3.3)
Indonesia 385 (2.9)
Brazil 377 (3.9)
Tunisia 363 (2.3)
In the ranking according to mean score for the ‘Uncertainty’ subscale, Hong Kong (China) is in the top position, with an insignificant lead on Flanders, the Netherlands, and Finland (see the table alongside). In fact, this is the only subscale for mathematical literacy where Flanders’ average is not significantly higher than the Dutch average. The Flanders’ high position as regards the ‘Uncertainty’ subscale is rather surprising. It is generally assumed that the Flemish curriculum for 15-year-olds gives less room to statistics and theory of probability than those in other countries, which get lower scores on average. The result indicates that Flemish 15-year-olds are capable of dealing successfully with less familiar situations. In the ranking according to the distribution of proficiency levels in the ‘Uncertainty’ subscale, Hong Kong (China) is not at the top (see the figure on the opposite page). Hong Kong (China) has approximately 2% fewer students in Level 2 and higher than Finland, and approximately 2% more students below Level 2 than Finland. As with the ‘Space and shape’ subscale, Flanders does not have the highest percentage of students that score at Levels 5 and 6. With 32%, Flanders follows immediately behind Hong Kong (China) (34%). The slightly higher percentage of 15-year-olds in Flanders that does not make Level 2 (11.2%) accounts for Flanders’ seventh position in this ranking. The Netherlands has a slightly lower percentage of students in the highest 2 levels for ‘Uncertainty’ (29%). The high position of the Netherlands is therefore due to the low percentage of students that score below Level 2 (8%).

- 17 -
Level
668.7
358.3
420.4
482.4
544.4
606.6
MATHEMATICAL LITERACY – UNCERTAINTY Sample item used in the PISA “Uncertainty” subscale
TEST SCORES The diagram below shows the results on a Science test for two groups, labelled as Group A and Group B. The mean score for Group A is 62.0 and the mean for Group B is 64.5. Students pass this test when their score is 50 or above.
Question 1: TEST SCORES Looking at the diagram, the teacher claims that Group B did better than Group A in this test. The students in Group A don’t agree with their teacher. Give one mathematical argument the students in Group A could use to convince the teacher that Group B may not necessarily have done better.
Full Credit: 620 score points Code 1: One valid argument is given. Valid arguments include the following: number of students that passed, influence of the weakest student or number of students scoring 80 or more.
15 17 16 17 13 19 15 19 18 18 21 17 18 21 19 17 21 21 21 26 24 21 25 26 23 23 22 22 2128 27 28 26 27 26 25 27 23 30
21 20 17 15
27 23 26 25
19
27
1924 24 23
2724 23
26 2420
24 23 2527 24
2227 27
24 24 24 23 22
26 24 2622 23
18 17 1716
14
10 67
4
2723
26 26
25
24
23
23 23 2222
24 2422
2121
20 20 2219
1920
18 1718 18 17 19 18
15 16 1513 12
9 8 77 4
31 3
1619
16 16
21
15
2015 15 15
1215 15 13
1316
12 1211 8
9 127 7
9 9 10 10 104 6 4
5 4
3 3 12 1
7 10 7 7 135
12 6 7 9 4 7 5 4 6 8 6 6 3 2 3 4 1 2 3 3 3 3 4
3
48
4335
3518
27201919
1314998109987677556666645544444232212
322937
313323272625201918181816151515151514131414121212111110109109998767675
11
1
11111
100
75
50
25
0
25
50
75
100
Finl
and
Net
herla
nds
Can
ada
Kor
ea
Hon
g K
ong
Mac
ao-C
hina
Bel
. Fla
nder
s
Icel
and
Aus
tralia
New
Zea
land
Irel
and
Japa
n
Liec
hten
stei
n
Den
mar
k
Switz
erla
nd
Bel
gium
Nor
way
Swed
en
Fran
ce
Pola
nd
Cze
ch R
ep.
Bel
. Ger
man
Spai
n
Hun
gary
Aus
tria
Luxe
mbo
urg
Uni
ted
Stat
es
Ger
man
y
Bel
. Fre
nch
Latv
ia
Slov
. Rep
.
Portu
gal
Italy
Gre
ece
Rus
s. F
ed.
Turk
ey
Serb
ia
Uru
guay
Thai
land
Mex
ico
Indo
nesi
a
Bra
zil
Tuni
sia
6
5 4 3 2 1
Bel
ow 1
Scores on a Science test
0 1 2 3 4 5 6
0 - 9
10-1
9
20-2
9
30-3
9
40-4
9
50-5
9
60-6
9
70-7
9
80-8
9
90-1
00
Score
Num
ber o
f stu
dent
s
Group A Group B
Percentage of students at each level of proficiency on the “Uncertainty” subscale Percentage of students < Level 1 Level 1 Level 2 Level 3 Level 4 Level 5 Level 6
Note: due to rounding off, the sum of the percentages not always equals 100

- 18 -
MATHEMATICAL LITERACY– COMPARISON WITH PISA2000 For all PISA domains (reading literacy, mathematical literacy and scientific literacy), a set of “link items” is used repeatedly from one survey cycle to the next. These items are common to the consecutive cycles and are used to link reporting scales across cycles. This procedure makes it possible to compare results from PISA2000 with those of PISA2003 for those countries that participated in both survey cycles. For reading and scientific literacy, the design of the scales remains unchanged across the first two PISA survey cycles. Results from PISA2003 can be converted to the PISA2000 reporting scales by means of a linear transformation. Therefore, mean scores for those two literacy domains can safely be compared between 2000 and 2003. The results of this comparison will be discussed in further detail in this publication in the sections dedicated to “Reading literacy” and “Scientific literacy”. The comparison is not quite that straightforward for mathematical literacy, which was only a minor domain in PISA2000. Due to the limited testing time devoted to mathematics in 2000, only items used in the “Space and shape” and “Change and relationships” subscales were tested at the time. In 2003, the mathematical literacy assessment framework was expanded by adding two new subscales, i.e. “Quantity” and “Uncertainty”. The mean score on the combined mathematical literacy scale in PISA2003 is the average of the scores on the four subscales mentioned above. In PISA2000, the mean score on the combined mathematical literacy score was the average of the scores on the two subscales “Space and shape” and “Change and relationships”. The countries’ mean performance in the PISA 2003 mathematical literacy domain is not comparable as such with their mean score in the mathematical literacy domain in PISA 2000. The design of those two constructs was not the same from one PISA cycle to the next. The comparison of countries’ mathematical literacy performance between PISA2000 and 2003 must be made at the level of subscales. Countries for which data are available for both survey cycles can compare their mean scores on both the “Space and shape” and the “Change and relationships” subscales. However, such differences need to be interpreted with caution. Firstly, since data are only available from two points in time, it is not possible to assess to what extent the observed differences are indicative for longer-term trends. Secondly, while the overall approach to measurement used by PISA is consistent across cycles, small refinements continue to be made, so it would not be prudent to read too much into small changes in results at this stage. Furthermore, sampling and measurement error limit the reliability of comparisons of results over time. Both types of error inevitably arise when assessments are linked through a limited number of common items over time. In order to be regarded as statistically significant on a 95% confidence interval, differences in performance between two cycles need to be larger than for other comparisons. The figures on the following pages show the differences between PISA2000 and PISA2003 on the two subscales “Space and Shape” and “Change and relationships”.

- 19 -
MATHEMATICAL LITERACY– COMPARISON WITH PISA2000 “Space and shape” On average across OECD countries, performance on the “Space and shape” scale has remained broadly similar to that of PISA2000. In 2000, the OECD country mean was 494 score points whereas in 2003 it was 496 score points. However, the pattern is uneven when examining performance changes in individual countries (see the figure below).
250
300
350
400
450
500
550
600
Icel
and
Mex
ico
Den
mar
k
Aus
tralia
Aus
tria
Can
ada
Finl
and
Fran
ce
Gre
ece
Hun
gary
Irela
nd
Japa
n
New
Zea
land
Nor
way
Por
tuga
l
Spa
in
Sw
eden
Sw
itzer
land
Uni
ted
Sta
tes
Liec
hten
stei
n
Rus
sian
Fed
erat
ion
Ger
man
y
Kor
ea
Hon
g K
ong-
Chi
na
Bel
gium
- Fr
ench
Cze
ch R
epub
lic
Italy
Pol
and
Thai
land
Bel
gium
Bra
zil
Indo
nesi
a
Latv
ia
Bel
gium
-Fla
nder
s
PISA 2000 Performance PISA 2003 PerformancePerformance on the PISA "Space and shape" scale
The Czech Republic, Italy, Poland, Thailand, Belgium, Brazil, Indonesia, Latvia, and Flanders have seen significant performance increases in the “Space and shape” scale from PISA2000 to PISA2003. In Flanders, the score increase is the highest of all OECD countries from this group (36 score points). A more detailed look at which groups of students scored better in 2003 on the ‘Space and shape’ subscale shows that these are mainly the high achievers, both for Belgium and for Flanders. The scores of the 75th, 90th, and 95th percentiles show a significant increase compared to PISA2000, whereas those in the lowest percentiles (i.e., the 5th and 10th percentiles) are not significantly different. The picture for Poland is exactly the reverse. Here, the improvement of the average performance is mainly due to the better performance of the groups of low achievers. The higher average performance of the 5%, 10%, and 25% weakest students is also the reason why the gap between the Polish high and low achievers on the ‘Space and shape’ subscale in PISA2003 is smaller than in PISA2000. Both in Iceland and in Mexico, the PISA score for the ‘Space and shape’ subscale fell significantly between PISA2000 and PISA2003. In Iceland, it is mainly the group of low achievers that scores significantly lower in PISA2003, whereas in Mexico, the decrease is found across the entire group of students. In the majority of countries that have reliable data for both PISA cycles (in 23 of the 34 ‘countries’ plotted), the average score in 2003 on the ‘Space and shape’ subscale is not significantly different from that of 2000.
Differences in mean scores between PISA2003 and PISA2000 on the “Space and shape” subscale
Countries performing significantly higher (on the 95% confidence level): in PISA2000 in PISA2003
Countries are ranked in ascending order of the difference between PISA2003 and PISA2000 performances. The results of the German Community of Belgium are not included because their PISA2000 sample wasn’t reliable.

- 20 -
MATHEMATICAL LITERACY– COMPARISON WITH PISA2000 “Change and relationships” On average across OECD countries, the difference between the OECD mean score on this subscale in PISA2000 and in PISA2003 was the biggest overall change observed in any domain or subscale assessed in PISA. The OECD mean on the “Change and relationships” subscale has increased from 488 score points in PISA2000 to 499 score points in PISA2003. As was the case for “Space and shape”, changes have been very uneven across countries (see figure below). In the Czech Republic, Poland, Latvia, and Liechtenstein, the average score on the ‘Change and relationships’ subscale in PISA2003 has risen by more than 30 score points – the equivalent of about half a proficiency level. In Brazil, the increase is even larger than the value of a complete proficiency level, and the average score in 2003 is exactly 70 points higher than in PISA2000. In Finland, Hungary, Spain, Belgium, Canada, Germany, Korea, Flanders, and Portugal, the score differences range from 13 to 23 points, which are still significant differences. Among the other countries, the only country where the difference between the two measurement points is also significantly different is Thailand. Here, however, the average performance on the ‘Change and relationships’ subscale in 2003 is lower than in 2000, showing a significant decline in performance between the two cycles. The differences in all other countries (19 of the 34 ‘countries’ plotted) are no longer statistically significant once measurement errors and linking errors are accounted for. Just like with the ‘Space and shape’ subscale, the cause of the score differences in some countries lies with the performance of one specific group of students. In Poland, for instance, the significantly higher score on the ‘Change and relationships’ subscale is again due to the better average performance of its low achievers. With the significantly better results of students in the groups with the 5%, 10%, and 25% lowest scores, Poland has reduced the gap between its high and its low achievers on this subscale as well. The variation in the scores also decreases for this subscale in comparison with PISA2000. A similar situation, though less pronounced, is found in Hungary, Latvia, and Liechtenstein. In Greece, the Russian Federation, Switzerland, and the French Community of Belgium, the performance of the low achievers in PISA2003 is also significantly better than in 2000, but in these countries, this does not lead to a significantly better average performance on the ‘Change and relationships’ subscale. In contrast to the above-mentioned group of countries, the better average performance on the ‘Change and relationships’ subscale in 2003 in Canada, Finland, Germany, Korea, Portugal, and Flanders is mainly due to the better scores of the groups of high achievers. In these countries, the average scores of the 5%, 10%, and 25% weakest students in PISA2003 are barely different from their scores in 2000.
250
300
350
400
450
500
550
600
Thai
land
Aus
tralia
Aus
tria
Den
mar
k
Fran
ce
Gre
ece
Icel
and
Irel
and
Italy
Japa
n
Mex
ico
New
Zea
land
Nor
way
Swed
en
Uni
ted
Stat
es
Hon
g K
ong-
Chi
na
Indo
nesi
a
Rus
sian
Fed
erat
ion
Swits
erla
nd
Bel
gium
- Fr
ench
Finl
and
Hun
gary
Spai
n
Bel
gium
- Fr
ench
Can
ada
Cze
ch R
epub
lic
Ger
man
y
Kor
ea
Bel
gium
- Fl
ande
rs
Pola
nd
Portu
gal
Bra
zil
Latv
ia
Liec
hten
stei
n
PISA 2000 Performance PISA 2003 PerformancePerformance on the PISA "Change and relationships" scale
Countries performing significantly higher (on the 95% confidence level): in PISA2000 in PISA2003
Differences in mean scores between PISA2003 and PISA2000 on the “Change and relationships” subscale
Countries are ranked in ascending order of the difference between PISA2003 and PISA2000 performances. The results of the German Community of Belgium are not included because their PISA2000 sample wasn’t reliable.

- 21 -
The middle 50% of the student population
STUDENT-LEVEL DIFFERENCES – HIGH VS. LOW ACHIEVERS The previous sections of this brochure mainly discussed the participating countries’ mean scores in various assessment areas. The mean score, however, does not give information about variation in student performance. An outstanding mean score for a country’s high achievers can mask a significant group of low achievers and vice versa. For this reason, the distribution of the performance must also be analysed. This distribution is expressed in percentiles.
Ten per cent of a country’s students score less than the 10th percentile and another 10% of a country’s students score higher than the 90th percentile. The 50th percentile is the median (i.e. the score of the middle student when all students are ranked by their score). This section will no longer refer to the median. The total length of the bars in the figures below corresponds to the middle 90% of a country’s student population, this means that 90% of the students score between the two extremities of the bar. It is the difference between the point above which the top 5% of the students score and the point below which the lowest 5% of students score; put more simply, the bar reflects the difference between the 95th and the 5th percentiles (as shown on the insert on the left). The same way, one half of a country’s students score between the 25th and the 75th percentile of that country’s performance distribution. The black shaded area around the value of 50 shows the 95% confidence interval of the mean.
The figure below immediately shows that, in the domain of ‘Mathematical literacy’, there are very great differences between the strongest and the weakest students, both for Belgium as a whole and for the three Communities. In fact, Belgium has the greatest distribution of all the participating countries. In Flanders, there is a difference of 347 points between the highest-scoring 5% and the lowest-scoring 5% of 15-year-olds. The performances of the highest-scoring students belong to Level 6, and those of the lowest-scoring students to Level 1. The fact that Flanders ranks at the top for mathematical literacy is due to a relatively large leading group that scores exceptionally well. No less than 22% of the Flemish students belong to Level 5 and 12% of the students rank at Level 6. These percentages are the highest of all the participating countries. The group of lower-scoring students (11.4% of the Flemish 15-year-olds score below Level 2 on mathematical literacy) may be rather alarming, but it should be pointed out that the lowest-scoring 15-year-olds in Flanders still do relatively well in comparison to other countries. Their scores are almost identical to those of the lowest-scoring students in the highest-ranking countries in the middle group. Moreover, in Flanders, students in special-needs education (BuSO) were included in the sample. This partly explains the relatively large number of Flemish students with low scores. Finland is the only country that manages to combine a top performance on the mathematical literacy scale with a (very) small distribution.
200
250
300
350
400
450
500
550
600
650
700
750
Bra
zil
Tun
isia
Indo
nesi
a
Mex
ico
Tha
iland
Uru
guay
Tur
key
Serb
ia
Gre
ece
Ital
y
Port
ugal
Rus
s. Fe
d.
Uni
ted
Stat
es
Lat
via
Spai
n
Hun
gary
Pola
nd
Lux
embo
urg
Nor
way
Bel
gium
- Fr
ench
Slov
. Rep
.
Irel
and
Ger
man
y
Aus
tria
Swed
en
Fran
ce
Den
mar
k
Bel
gium
- G
erm
an
Icel
and
Cze
ch. R
ep.
New
Zea
land
Aus
tral
ia
Switz
erla
nd
Mac
ao-C
hina
Bel
gium
Can
ada
Japa
n
Lie
chte
nste
in
Net
herl
ands
Kor
ea
Finl
and
Hon
g K
ong
Bel
gium
- Fl
ande
rs
5101520253035404550556065707580859095
Distribution of student performance on the mathematical literacy scale
Countries are ranked by increasing mean score

- 22 -
STUDENT-LEVEL DIFFERENCES – HIGH VS. LOW ACHIEVERS In the domain of Reading literacy, Flanders comes third in the ranking according to the mean score. The distribution of the scores (see the figure below) makes it clear why Flanders is in third position. The best-performing Flemish 15-year-olds score significantly higher than the same group of students in Finland and Korea, but on the other hand, the Flemish group of low achievers is larger than those of the two higher-ranking countries (28% of the students score below Level 3, see also the figure showing the distribution over reading literacy levels on p. 35 of this brochure). Both Finland and Korea combine a high average score with a small distribution. This was also the case in PISA2000. With a difference of 333 points between the highest 5% and the lowest 5% scores, Flanders does not have a markedly great distribution compared to the other participating countries. However, this variation increased compared to PISA2000. Finland, on the contrary, shows a further decrease of this distribution. However, the main reason for this decrease is the significant drop in the performance of the top students.
200
250
300
350
400
450
500
550
600
650
700
750
Tun
isia
Indo
nesi
a
Mex
ico
Bra
zil
Serb
ia
Tha
iland
Uru
guay
Tur
key
Rus
sian
Fed
.
Slov
. Rep
.
Gre
ece
Ital
y
Bel
gium
- Fr
ench
Port
ugal
Lux
embo
urg
Spai
n
Hun
gary
Cze
ch R
ep.
Lat
via
Aus
tria
Ger
man
y
Icel
and
Den
mar
k
Uni
ted
Stat
es
Fran
ce
Pola
nd
Mac
ao-C
hina
Japa
n
Bel
gium
- G
erm
an
Switz
erla
nd
Nor
way
Bel
gium
Hon
g K
ong
Net
herl
ands
Swed
en
Irel
and
New
Zea
land
Lie
chte
nste
in
Aus
tral
ia
Can
ada
Bel
gium
- Fl
ande
rs
Kor
ea
Finl
and
In the domain of Scientific literacy, the differences between the countries as regards the distribution of the scores are much less marked than for the other domains, just as in PISA2000 (see the figure on the opposite page). Once again, Finland combines a high average score with a relatively small distribution. In Flanders, the distribution is greater. In the 5th percentile, the Flanders’ performance is as good as those of Japan, Liechtenstein, Australia, and the Netherlands, but lower than Finland. However, in comparison with Switzerland, France, Sweden, and Germany, the weakest group of Flemish students performs significantly better. In the 95th percentile, Flemish students continue to do as well in scientific literacy as 15-year-olds in Australia and the Netherlands, but this time, the performance of the Japanese students is significantly better. The Japanese score in the 95th percentile is significantly higher than the Finnish score, which, in turn, is significantly higher than the Flemish score. Compared to PISA2000, the scientific literacy scores in Japan increased significantly among the top students and decreased significantly among the poorer students. In Finland too, the scores of the best-performing 15-year-olds increased significantly compared to the last cycle. In Australia, the recent scores of the lowest-achieving students are significantly lower than those of PISA2000.
Distribution of student performance on the reading literacy scale
Countries are ranked by increasing mean score

- 23 -
STUDENT-LEVEL DIFFERENCES – HIGH VS. LOW ACHIEVERS
200
250
300
350
400
450
500
550
600
650
700
750
Tun
isia
Bra
zil
Indo
nesia
Mex
ico
Tha
iland
Tur
key
Serb
ia
Uru
guay
Port
ugal
Den
mar
k
Gre
ece
Bel
gium
- Fr
ench
Lux
embo
urg
Nor
way
Ital
y
Spai
n
Lat
via
Rus
sian
Fed
.
Aus
tria
Uni
ted
Stat
es
Bel
gium
- G
erm
an
Icel
and
Slov
. Rep
.
Pola
nd
Ger
man
y
Hun
gary
Irel
and
Swed
en
Bel
gium
Fran
ce
Switz
erla
nd
Can
ada
New
Zea
land
Cze
ch R
ep.
Net
herl
ands
Mac
ao-C
hina
Aus
tral
ia
Lie
chte
nste
in
Bel
gium
- Fl
ande
rs
Kor
ea
Hon
g K
ong
Japa
n
Finl
and
In most participating countries, the difference between the 5% highest-achieving students and the 5% lowest-achieving students is the smallest in the Problem solving domain. For Flanders, however, the situation is almost the same as in other domains. The highest-achieving students (95th percentile) score as well as those in Hong Kong (China) and Korea and better than those in Finland. When ranked according to average score, these three countries precede Flanders. However, not a single country has a significantly higher average score than Flanders in this domain (see the comparative table on p. 5 of this report). Therefore, it is once again because of the greater share of lower-achieving students in Flanders than in the other three top countries (30% of Flemish 15-year-olds score below Level 2 on problem solving, see also the figure with the distribution over proficiency levels on p. 48) that places Flanders a few places lower in this ranking. Yet the problem solving performance of the lowest-scoring Flemish 15-year-olds cannot be called poor compared to those of students in other countries and in other domains. Compared to PISA2000, another noteworthy finding is the great difference between the high achievers and the low achievers in Japan, and this difference exists in problem solving and other domains.
200
250
300
350
400
450
500
550
600
650
700
750
Tun
isia
Indo
nesi
a
Bra
zil
Mex
ico
Tur
key
Uru
guay
Serb
ia
Tha
iland
Gre
ece
Ital
y
Port
ugal
Uni
ted
Stat
es
Rus
sian
Fed
.
Spai
n
Lat
via
Pola
nd
Nor
way
Slov
. Rep
.
Lux
embo
urg
Bel
gium
- Fr
ench
Irel
and
Hun
gary
Icel
and
Aus
tria
Swed
en
Ger
man
y
Bel
gium
- G
erm
an
Cze
ch R
ep.
Den
mar
k
Fran
ce
Net
herl
ands
Switz
erla
nd
Bel
gium
Can
ada
Lie
chte
nste
in
Aus
tral
ia
Mac
ao-C
hina
New
Zea
land
Japa
n
Bel
gium
- Fl
ande
rs
Finl
and
Hon
g K
ong
Kor
ea
Distribution of student performance on the scientific literacy scale
Countries are ranked by increasing mean score
Countries are ranked by increasing mean score
Distribution of student performance on the problem-solving scale

- 24 -
Gender differences in mathematics performance
OECD country mean Flanders Male Female Difference Male Female Difference Mathematical literacy – total 506 494 11 561 546 15 ‘Space and shape’ subscale 505 488 17 563 539 24 ‘Change and relationships’ subscale 504 493 11 569 554 15 ‘Quantity’ subscale 504 498 6 555 546 9 ‘Uncertainty’ subscale 508 496 13
557 544 13
STUDENT-LEVEL DIFFERENCES – GENDER DIFFERENCES MATHEMATICAL LITERACY At first glance, the PISA results seem to confirm the cliché that boys are better at mathematics than girls. In all the participating countries, with the exception of Japan, Austria, Belgium, Norway, Poland, Australia, the Netherlands, Hong Kong (China), Indonesia, Latvia, the French Community of Belgium, Serbia, Thailand, and the German-speaking Community of Belgium, boys score significantly better (see the figure below). In Iceland, however, female students score significantly better than male students do. The gender difference is not alarmingly great anywhere, though, standing at 11 score points in an average OECD country. In Flanders too, the advantage of the male 15-year-olds (15 points) is statistically significant. This was not the case in PISA2000. Since then, therefore, the difference between boys and girls has increased a little. Compared to the neighbouring countries, Flanders shows a smaller gender difference than Luxembourg, but a greater gender difference than Germany, France, and the Netherlands. In the Netherlands, in fact, the difference between boys and girls is not significant. The same applies in the French and German-speaking Communities of Belgium.
-29 -23 -21 -19 -19 -18 -17 -17 -17 -16 -15 -15 -15 -15 -14 -12 -12 -12 -11 -11 -10 -9 -9 -9 -8 -8 -8 -8 -7 -7 -6 -6 -6 -5 -5 -4 -4 -3 -1 -1 4 6 15
-35
-30
-25
-20
-15
-10
-5
0
5
10
15
20
Lie
chte
nste
inK
orea
Mac
ao-C
hina
Gre
ece
Slov
. Rep
.It
aly
Lux
embo
urg
Switz
erla
ndD
enm
ark
Bra
zil
Tur
key
Cze
ch R
ep.
Flan
ders
Irel
and
New
Zea
land
Port
ugal
Tun
isia
Uru
guay
Can
ada
Mex
ico
Rus
s. Fe
d.G
erm
any
Spai
nFr
ance
Japa
nH
unga
ryA
ustr
iaB
elgi
umFi
nlan
dSw
eden
Uni
ted
Stat
esN
orw
ayPo
land
Aus
tral
iaN
ethe
rlan
dsH
ong
Kon
gIn
done
sia
Lat
via
Bel
. Fre
nch
Serb
iaT
haila
ndB
el. G
erm
anIc
elan
d
When the four subscales are taken together, we see that the gap between male and female students is smallest for ‘Quantity’ and greatest for the ‘Space and shape’ subscale. This is the case both for the OECD country mean and for the Flemish data. In Flanders, the differences between the performance of boys and girls may be slightly greater, but they are not statistically significantly greater than the OECD country mean. Except for the ‘Quantity’ subscale, the Flemish gender differences on the four subscales are statistically significant.
■ Statistically significant ■ Statistically not significant
Females perform better
Males perform better
Differences in PISA scores

- 25 -
Gender differences in reading literacy performance
STUDENT-LEVEL DIFFERENCES – GENDER DIFFERENCES READING LITERACY The picture for the domain of reading literacy (see the figure below) looks completely different. Just as in 2000, girls display a clear advantage over boys. With the exception of Liechtenstein, this difference is statistically significant in all participating countries. Moreover, the differences are great to very great. In an average OECD country, the advantage for the girls is 34 points (more than half a proficiency level). In Finland (that showed the greatest difference in 2000), the boys gained a little ground on the girls by gaining 7 points. However, the difference there is still 44 points. In 2003, Iceland is at the top, with an advantage for the girls of no less than 58 points, which is only 14 points short of a complete proficiency level. In Flanders, the female students lead has shrunk a little compared to 2000. In 2000, male students still scored 35 points lower than female students. Now, the gap has decreased to 28 points, i.e., a little less than half a proficiency level. The gender gap in Flanders is smaller than the differences found in Luxembourg, France, Germany, the French Community, and the German-speaking Community (where the difference is very great, just below the level of Iceland). In the Netherlands, the gender difference for reading literacy (21 points) is smaller than in Flanders. A more detailed comparison between 2000 and 2003 is drawn further on in this brochure.
58 5449 47 45 44 43 43 42 40 39 39 39 39 39 38 37 37 37 36 35 35 33 33 33 32 32 32 31 31 29 29 28 28 25 25 24 22 21 21 21 17 13
0
10
20
30
40
50
60
70
Icel
and
Bel
g. G
erm
anN
orw
ayA
ustr
iaB
elg.
Fre
nch
Finl
and
Serb
iaT
haila
ndG
erm
any
Pola
ndIt
aly
Aus
tral
iaU
rugu
aySp
ain
Lat
via
Fran
ceG
reec
eB
elgi
umSw
eden
Port
ugal
Switz
erla
ndB
razi
lT
urke
yL
uxem
bour
gSl
ov. R
ep.
Uni
ted
Stat
esH
ong
Kon
gC
anad
aC
zech
Rep
.H
unga
ryIr
elan
dR
ussi
an F
ed.
Flan
ders
New
Zea
land
Den
mar
kT
unis
iaIn
done
sia
Japa
nN
ethe
rlan
dsM
exic
oK
orea
Lie
chte
nste
inM
acao
-Chi
na
SCIENTIFIC LITERACY In the domain of scientific literacy too, there are differences between boys and girls. In approximately one third of the participating countries, the boys score significantly higher. Still, the differences are less clear in this domain than they are for mathematical literacy and reading literary. The difference in performance is statistically significant in only 16 countries (see the figure on the next page). In Flanders, on average, there are no statistically significant differences for scientific literacy. The overall picture of gender differences in this domain is largely the same as that found in 2000. For this domain too, a more detailed comparison is drawn further in this brochure.
Differences in PISA scores ■ Statistically significant ■ Statistically not significant
Females perform better

- 26 -
Gender differences in scientific literacy performance
Gender differences in problem solving performance
STUDENT-LEVEL DIFFERENCES – GENDER DIFFERENCES
-26 -18 -17 -16 -15 -13 -12 -11 -10 -9 -9 -8 -8 -7 -6 -6 -6 -6 -6 -5 -5 -5 -4 -4 -4 -2 -2 -10 0 0 0 1 3 3 4 5 6 8 8 10 10 13
-30
-25
-20
-15
-10
-5
0
5
10
15
Lie
chte
nste
inK
orea
Den
mar
kN
ew Z
eala
ndSl
ov. R
ep.
Lux
embo
urg
Gre
ece
Can
ada
Switz
erla
ndM
exic
oR
ussi
an F
ed.
Flan
ders
Mac
ao-
Pola
ndPo
rtug
alIt
aly
Ger
man
yB
razi
lC
zech
Rep
.U
nite
d St
ates
Swed
enN
ethe
rlan
dsJa
pan
Uru
guay
Spai
nIr
elan
dN
orw
ayIn
done
sia
Tur
key
Fran
ceA
ustr
alia
Bel
gium
Hun
gary
Aus
tria
Hon
g K
ong
Lat
via
Serb
iaFi
nlan
dT
haila
ndB
el. F
renc
hT
unis
iaIc
elan
dB
el. G
erm
an
PROBLEM SOLVING
As mentioned earlier in this brochure, the results for the problem solving domain can be almost completely accounted for by the performance of students in the other domains. Moreover, the items are not drawn from any particular domain of knowledge. One may therefore presume that there will be fewer gender differences in the problem solving domain. However, the analytical skills required both for mathematics and for solving problems are very similar, and there is a strong correlation between the PISA performances in both domains. Consequently, it is interesting to see whether the lead of male students in the mathematical literacy domain is also found in the problem solving domain. As shown by the figure below, a significant difference in average performance was only found in 7 countries. Moreover, in 6 of these 7 cases it is in fact the girls who outperform the boys. As in most other domains, the gender difference is the greatest in Iceland, to the advantage of the girls. In Flanders, the difference is not statistically significant. In the German-speaking Community, girls score significantly higher than boys do. Because of these data and the correlation with the mathematical literacy domain, the OECD assumes that girls should perform better in mathematics, and concludes that this may indicate that there is room for improvement in mathematics education.
-12 -11 -8 -7 -7 -5 -5 -5 -4 -3 -3 -3 -2 -2 -2 -2 -10 0 1 1 1 2 2 3 3 3 3 4 4 5 6 6 6 7 7 8 9 10 10 12 19 30
-15
-10
-5
0
5
10
15
20
25
30
35
Lie
chte
nste
inM
acao
-K
orea
Slov
. Rep
.C
zech
Rep
. B
razi
lM
exic
oD
enm
ark
Net
herl
ands
Uru
guay
Tun
isia
Flan
ders
Lux
embo
urg
Rus
sian
Fed
.T
urke
yG
riek
enla
ndIr
elan
dC
anad
aPo
rtug
alFr
ance
Uni
ted
Stat
esPo
land
Japa
nSw
itzer
land
Lat
via
Aus
tria
New
Zea
land
Bel
gium
Hun
gary
Ital
yH
ong
Kon
gG
erm
any
Spai
nA
ustr
alia
Indo
nesi
aSe
rbia
Nor
way
Bel
. Fre
nch
Swed
enFi
nlan
dT
haila
ndB
el. G
erm
anIc
elan
d
A comparative analysis of performances achieved by male students and female students shows us that the pattern is strongly dependent on the specific domains. In many countries, male students outperform female students in mathematical literacy, whereas in almost all countries females outperform males in reading literacy. No significant gender difference can be observed for problem solving (which requires cross-curricular competencies and skills from the various disciplines). These findings may point to the fact that both male and female students rely on their own specific strengths when they are required to combine several disciplines.
Differences in PISA scores ■ Statistically significant ■ Statistically not significant
Females perform better
Males perform better
■ Statistically significant ■ Statistically not significant Differences in PISA scores
Females perform better

- 27 -
STUDENT-LEVEL DIFFERENCES – IMPACT OF THE ESCS The differences in students’ performance are caused and influenced by a great variety of factors. PISA2000 already showed that students from families with high socio-economic status did better than those from families with low socio-economic status in all countries. However, the extent of this correlation varies considerably between countries. Some countries manage to reduce the impact of the students’ socio-economic background on their performance, thus enabling them to achieve a very high average performance. PISA studies the relationship between the socio-economic status of students and their performance based on an index. This PISA index of economic, social and cultural status (ESCS) combines the following economic, social, and cultural background variables of the students:
their parents’ profession; their parents’ educational attainment; the educational resources available to the students at home; the number of books at home.
The index is standardised to have a mean of 0 across the OECD countries and a standard deviation of 1. The relationship between the students’ performance and their score on the index of socio-economic status can be represented graphically with lines, known as socio-economic gradients. This report exclusively makes use of the gradients for the combined scale of mathematical literacy. Seeing that the impact of the students’ socio-economic background on their learning performance is comparable to its impact on the other PISA domains (reading literacy, scientific literacy, and problem solving), it suffices to show only the data on the major domain. Socio-economic gradients are characterized by their level, their slope (or properly, gradient), and their length:
~ the mean performance in mathematical literacy
The higher the gradient is located, the higher the mean mathematical literacy performance achieved by students of that country.
~ the differences in mathematical literacy performance caused by the socio-economic status (ESCS)
The steeper the gradient, the more significant the impact of socio-economic background on student performance i.e. steeper gradients reveal larger inequalities in student performance due to socio-economic factors.
~ student-level differences in terms of their socio-economic status (ESCS)
The longer the gradient, the larger the disparity between students from that country in terms of their socio-economic background i.e. the greater the variation within the student population of that country.
The figure on the following page shows the socio-economic gradients for mathematical literacy of the three Belgian Communities compared to the international gradient for mathematical literacy. The international socio-economic gradient for mathematical literacy (the white line) is the line that best represents the relationship between the mathematical performance of students and their socio-economic status in an average OECD country. These lines run from the 5th percentile to the 95th percentile, or, in other words, from the point beneath which the 5% of students with the lowest socio-economic status are situated to the point beyond which the 5% socio-economically most privileged students are situated. The figure confirms, first and foremost, the good performance of Flemish students in mathematical literacy: the Flemish gradient lies considerably higher than the international gradient. This difference applies irrespective of the socio-economic background of the Flemish students: on average, Flemish students from families with a low ESCS perform significantly better than students from similar families in the OECD countries, and Flemish students from more privileged families score considerably better than their counterparts from high-SES families in an average OECD country. The levels of the gradient lines of the other Belgian Communities do not diverge significantly from the international gradient of mathematical literacy. In the French Community of Belgium, students perform on average less well than students in an average OECD country do, but this difference is not significant.
GRADIENT (slope)
LENGTH
LEVEL (average height)

- 28 -
STUDENT-LEVEL DIFFERENCES – IMPACT OF THE ESCS
-3 -2 -1 0 1 2 3PISA-index of economic, social and cultural status
358
420
482
544
606
668
Mat
hs p
erfo
rman
ce
The socio-economic gradients for mathematical literacy of the three Belgian Communities in comparison to the international socio-economic gradient
België
Level 4
Level 3
Level 2
Level 1
Flanders
French Com.
German Com.
International
Level 6
Level 5
Belowlevel 1
The figure on the opposite page compares the Belgian socio-economic gradients for mathematical literacy with the international gradient and with the gradients of a number of neighbouring countries. The gradients of these countries are divided into three groups:
red lines: in these countries, the ESCS has a greater impact on the performance for mathematical literacy than the impact of ESCS in an average OECD country
~ steep gradients
grey lines: in these countries, the ESCS has an impact on the performance for mathematical literacy that is not significantly different from the impact of ESCS in an average OECD country
blue lines: in these countries, the ESCS has a smaller impact on the performance for mathematical literacy than the impact of ESCS in an average OECD country
~ gentle gradients
There are considerable differences between the gradients plotted for countries as regards the impact of students’ socio-economic status on their performance. For instance, the three Belgian Communities, together with Germany, belong to the group of ‘countries’ where performance shows a strong correlation with socio-economic status (see the figure on the opposite page). In Italy, Spain, and Finland, the opposite is true: the students’ socio-economic background in these countries has a significantly smaller than average impact on their performance. In the remaining countries (Luxembourg, France, and the Netherlands), the impact of ESCS does not differ from its impact in an average OECD country.
The slope of the gradients in this figure also stands out. Both the Flemish gradient for mathematical literacy and that of the French Community are much steeper than the international gradient. In both Communities, there is a stronger correlation between the socio-economic background of the students and their performance for mathematical literacy than in an average OECD country. Consequently, there is greater inequality between Belgian students from different socio-economic groups. As regards the length of their gradients, the Belgian Communities are very similar. In other words, the differences between the students as regards their socio-economic background are almost the same in Flanders and in the French and German-speaking Communities of Belgium.

- 29 -
STUDENT-LEVEL DIFFERENCES – IMPACT OF THE ESCS Most of the gradients in the figure below display a predominantly linear course (e.g. France, Finland, the Netherlands, and Belgium). In these countries, every increase on the socio-economic index corresponds to an equivalent, constant increase on the scale for mathematical literacy. The international gradient displays a similar linearity, albeit to a lesser extent. The slope (or gradient) of the black line is slightly steeper in the lower levels of the socio-economic index than in the higher levels. In other words, the international gradient levels off at a higher socio-economic status. This implies that, in an average OECD country, socio-economic factors have a slightly greater impact on the performance of students from families with lower social status than on the performance of students from families with a high ESCS. Italy is a good example: from a certain point onwards, the social differences between students clearly have less influence on their abilities to solve PISA tests. In other words, in Italy, it makes less difference for students whether their socio-economic status is high or very high. The gradient very clearly levels off when it reaches the higher ESCS values. Both the Flemish gradient and that of the French Community show a slight curve. The curvature of the gradient of the French Community follows the line of the international gradient for mathematical literacy, displaying a similar slight levelling off on the right. On the other hand, the Flemish gradient curves slightly in the other direction. In Flanders, therefore, the impact of the students’ socio-economic home situation on their mathematical performance does not decrease as the ESCS increases. The correlation even becomes slightly stronger in Flanders in the higher ESCS group.
-3 -2 -1 0 1 2 3PISA-index of economic, social and cultural status
358
420
482
544
606
668
Mat
hs p
erfo
rman
ce
The socio-economic gradients for mathematical literacy of Belgium, Flanders and some neighbour countries
België
Level 4
Level 3
Level 2
Level 1
Belgium
3
Flanders
5
French Com.
International
4
1
1 Germany2 Luxemburg3 France4 The Netherlands5 Italy6 Spain7 Finland
6
7
Countries with an impact of the ESCS above the OECD averageCountries with an impact of the ESCS not statistically different from the OECD averageCountries with an impact of the ESCS below the OECD average
Level 6
Level 5
Belowlevel 1
2
This figure again confirms the excellent performance of Flemish students for mathematical literacy. Not only does the starting level of the Flemish gradient lie far above the starting point of the international gradient for mathematical literacy, it also transcends the starting points of most other gradients. Just like the Finnish and the Dutch gradients, the Flemish line starts at the third level of mathematical literacy, while the other gradients commence in Level 2 or even in Level 1. The performances for mathematical literacy of the Flemish students from families with a lower socio-economic background are significantly better than the performance of students from similar backgrounds in most other countries. Flemish education succeeds in achieving a high average performance for mathematical literacy for all groups of students, irrespective of their socio-economic background. However, the results of students from families with a high ESCS are exceptionally good.

- 30 -
STUDENT-LEVEL DIFFERENCES – IMPACT OF THE ESCS Data from the two preceding figures make it possible to group PISA countries according to their performance in mathematical literacy and to their degree of equality. In PISA2003, this degree of equality in education was measured by the impact of socio-economic status on student performance on the mathematical literacy scale. First, there are countries that combine a high mean performance in mathematical literacy with a relative equality between different socio-economic groups. Those countries’ mean scores on the combined mathematical literacy scale are significantly higher than the OECD mean on that same scale, while their gradients are not as steep as the “international” gradient. Countries from that group demonstrate that it is possible to achieve comparatively high performance with a fair degree of equality between privileged and underprivileged socio-economic groups (e.g. Finland, cf. table below). In Flanders and Belgium, the mean scores on the combined mathematical literacy scale are significantly higher than the international mean. However, Flanders and Belgium are the only two countries that combine a high performance with a very strong impact of socio-economic background on student performance. Other countries featuring a significant degree of student-level “inequality” based on their socio-economic background perform either at the level of the OECD country mean (e.g. Germany or the French-speaking Community of Belgium) or below that level (e.g. Hungary).
Classification of PISA countries according to their mean performance on the mathematical literacy scale and to their degree of (in)equality Countries scoring above the
OECD country mean on the mathematical literacy scale
Countries with a mean score on the mathematical literacy scale that does not significantly differ from the OECD country mean
Countries scoring below the OECD country mean on the mathematical literacy scale
Countries with less student-level inequalities based on their socio-economic background
Australia, Canada, Finland, Hong Kong (China), Iceland,
Japan, Macao (China)
Indonesia, Italy, Latvia, Norway, Russian Federation,
Serbia, Spain, Thailand
Countries in which the degree of equality does not significantly differ from the average impact of socio-economic background across OECD countries
Czech Republic, Denmark, France, German-speaking Community of Belgium,
Korea, Liechtenstein, Netherlands, New Zealand,
Sweden, Switzerland
Austria, Ireland Brazil, Greece, Luxembourg, Mexico, Poland, Portugal, Tunisia, Turkey, United
States, Uruguay
Countries with more student-level inequalities based on their socio-economic background
Flanders, Belgium French Community of Belgium, Germany, Slovak
Republic
Hungary

- 31 -
Percentage of non-native 15-year-old students in the PISA2003 sample
STUDENT-LEVEL DIFFERENCES – ORIGIN & LANGUAGE PISA not only tests 15-year-olds on their knowledge and skills with regard to the domains indicated above. A background questionnaire also enables the study to measure, for instance, the effect of immigration and language spoken at home on the performance of the students. For example, the questionnaire covers whether or not the 15-year-olds themselves and both their parents were born in the country where they are assessed, and asks students about the language they usually speak at home. However, these background questions do not yield any information on how long the students have been living in the country where they are being assessed, nor on the extent to which the student’s mother tongue is similar or related to the language used for the test. In spite of these ‘shortcomings’, it is still possible to make analyses on the basis place of birth and language spoken at home. On the basis of the place of birth of the 15-year-olds and their parents, three categories of students are distinguished in PISA:
Native students Students born in the country where the assessment took place and with at least one parent born in that country.
First-generation students Students born in the country where the assessment took place, but with foreign-born parents.
Non-native students Students born outside the country where the assessment took place and whose parents are foreign-born.
In an average OECD country, 4% of 15-year-olds are first-generation students; 5% are students from immigrant families. However, there are great differences between the participating countries as regards the distribution. This is shown in the figure below. It does not cover all the countries, because the proportion of non-native and/or first-generation students in the PISA2003 sample is negligibly small (e.g. Finland, Japan, Korea, and Poland). Just like in PISA2000, a striking finding for Flanders is the relatively small percentage of non-native and/or first-generation 15-year-olds. First-generation students and non-native students together only represent 7% of the sample; exactly the same percentage as in PISA2000. A comparison with the other Belgian Communities and the neighbouring countries again shows that the proportion of non-native and/or first-generation students in those samples is quite a bit larger: 17.7% in the German-speaking Community, 15.4% in Germany, 11% in the Netherlands, 18.3% in the French Community, 14.3% in France, and no less than 33.2% in Luxembourg.
1 2 2 2 3 3 4 4 6 6 6 7 7 7 8 8 8 9 9 10 11 12 1623
58
2 3 3
156 3 3
9 6 5 713 9 4
9 61
11 11 9 311
17
20
18
0
10
20
30
40
50
60
70
80
Irela
nd
Nor
way
Port
ugal
Bel
g. G
erm
an
Serb
ia
Den
mar
k
Flan
ders
Aus
tria
Swed
en
Bel
gium
Rus
sian
Fed
.
New
Zea
land
Ger
man
y
Net
herla
nds
Liec
hten
stei
n
Uni
ted
Stat
es
Latv
ia
Switz
erla
nd
Can
ada
Bel
g. F
renc
h
Fran
ce
Aus
tral
ia
Luxe
mbo
urg
Hon
g K
ong
Mac
ao-C
hina
First generation Non-native
Percentage of students
Note: due to rounding off, the numbers in the figure sometimes differ from the numbers mentioned in the text

- 32 -
STUDENT-LEVEL DIFFERENCES – ORIGIN & LANGUAGE The comparison in the figure below, between the average performance for mathematical literacy by non-native and first-generation students, shows, for the great majority of countries, large and statistically significant advantages for the native students. In Serbia, Australia, Macao (China), Canada, and Liechtenstein, the difference is not significant. In Hong Kong (China), there is even a significant advantage for first-generation students. In the French Community (56), Austria (56), Denmark (70), the German-speaking Community (66), Switzerland (59), and the Netherlands (59), the advantage of native students over first-generation students is about the size of an entire proficiency level (63 points). In Germany (93) and Belgium (91), this difference is as large as a proficiency level and a half, but Flanders is at the absolute top in this respect, with a difference of no less than two entire proficiency levels (122 points). These findings are especially alarming for countries that combine a significant performance difference with a relatively high percentage of first-generation students, such as the United States, Luxembourg, France, Germany, Switzerland, and the Netherlands. As is to be expected, the performance of non-native students is even lower than those of first-generation students in most countries. The greatest gap between the performance of native students and non-native students is found in Belgium (109 points). The main cause of this great difference is the fact that the Belgian data are the average of the results from the three Belgian Communities. When the average performance of the immigrant students from the French Community is compared to that of native students in Flanders, it soon becomes clear that the difference at the Belgian level must be great. For the first-generation students, there are no statistically significant differences between the Belgian Communities. However, the Flemish 15-year-old non-native students score significantly better than their counterparts do in the French Community of Belgium. Likewise, non-native students in the German-speaking Community perform significantly better than those in the French Community. Another striking aspect of the average score of the Flemish non-native students is that it is higher than the average score of the Flemish first-generation students. Just as in PISA2000, this high score is due to the large group of students in this category that speaks Dutch at home. In all probability, these are Dutch students (from the Netherlands) enrolled in Flemish schools, who may or may not live in Belgium.
358
420
482
545
607
669
Native 439 472 490 499 507 514 515 517 520 520 524 525 527 528 528 537 543 545 545 551 557 567
First generation 433 457 468 460 476 458 459 483 449 472 458 432 522 496 532 543 484 454 508 492 570 445
Non-native 451 452 453 438 462 419 452 425 455 448 481 454 525 523 517 530 453 437 482 472 516 472
SER RUS USA NOR LUX BFr AUT SWE DEN FRA BGer GER AUS NZL MAC CAN SWI BEL LIE NLD HKC BFl
Place of birth and student performance on the mathematics scale

- 33 -
STUDENT-LEVEL DIFFERENCES – ORIGIN & LANGUAGE In some countries, when the home language of the students is taken into account, the performance gap remains as great or becomes even greater. In Flanders, 15-year-olds whose home language is identical to the language of assessment (or another official language or national dialect) score 119 points higher than students who speak a different language at home. In other words, Flemish students who do not speak Dutch at home are clearly at a disadvantage. In PISA2000, this disadvantage was already clear in the area of reading literacy; now, the same conclusion must be drawn for mathematical literacy. However, an important remark that must be made here is that the great difference is partly due to the extraordinarily good performance of Flemish students in general, and that the absolute difference in performance should therefore be put in this perspective. Because if one looks at the average score of the students whose home language is different to the test language, a different official language, or a national dialect, one sees that the scores of these students in Flanders (with an average score of 450) are not statistically significantly better or worse than those achieved by comparable students in neighbouring countries. The figure below represents the percentage of students whose home language is different to the language of assessment and compares their performance with those of students whose home language is overall the same as the test language, and those who speak a different language at home. Countries where the number of students speaking a foreign language at home is so small as to be negligible were not included in this figure. For a good interpretation of this figure, readers must bear in mind what ‘the same language’ and a ‘different language’ mean. In the background questionnaire for the Flemish students, students were offered a choice between the following answers to the question ‘What language to you usually speak at home?’: Dutch, French, German, a Flemish dialect, English, another language spoken in the EU (Italian, Spanish, Portuguese, etc.), Arabic, Turkish, an East-European language, or another language. Students who indicated Dutch, French, German, or a Flemish dialect therefore belong to the group of 15-year-olds whose ‘home language is the same as the language of assessment, another official language, or another national dialect’. Obviously, this group also includes Dutch students who were in the Flemish sample. Therefore, it is not correct to categorise students whose home language is ‘the same as the language of assessment…’ as ‘natives’ and students whose home language is ‘different’ as ‘non-natives’ (meaning foreign-born or first-generation students).
525 526
445
464
508
460
510
456444
516
463
434
452 452
425
449
482468
455
488
474
450
399
506
550538
525539
526513
490
527
487
523 517510
518
471
544530
549
499
555
517
569
447
0
5
10
15
20
25
30
Luxe
mbo
urg
Liec
hten
stei
n
Can
ada
Bel
g. G
erm
an
Switz
erla
nd
New
Zea
land
Aus
tria
Uni
ted
Stat
es
Aus
tralia
Latv
ia
Ger
man
y
Swed
en
Bel
g. F
renc
h
Fran
ce
Rus
sian
Fed
.
Bel
gium
Mac
ao-C
hina
Net
herla
nds
Nor
way
Hon
g K
ong
Den
mar
k
Flan
ders
Gre
ece
358
420
482
544
606Left scale Right scale
Percentage of students who speak a language at home most of the time that is different from the language of assessment, from other official languages or from other national dialects (left scale) and performance of students on the combined mathematical literacy scale, by language group (right scale)
Percentage of students Mean performance of students who speak a language at home most of the time that is the same as the language
of assessment, from other official languages or from other national dialects Mean performance of students who speak a language at home most of the time that is different from the language of
assessment, from other official languages or from other national dialects
Percentage of students
Maths performance

- 34 -
READING LITERACY In PISA2003, the areas of reading literacy, scientific literacy and problem solving were given smaller amounts of assessment time than mathematical literacy, the main domain in the 2003 assessment. The analyses presented in this section on reading literacy focus on overall reading performance and compare outcomes for PISA2003 with PISA2000. Reading literacy focuses on the ability of students to use written information in situations they encounter in real life. In PISA, reading literacy is defined as:
“understanding, using and reflecting written texts, in order to achieve one’s goals, to develop one’s knowledge and potential and to participate in society”.
Reading literacy was the main domain in the PISA2000 survey cycle. As for mathematical literacy in PISA2003, subscales and levels of proficiency were designed to assess reading literacy. These constructs are briefly described below. The three subscales for reading literacy require different kinds of skills from the students:
Retrieving information
~ to locate one or several pieces of information in a text
Interpreting information ~ to construct meaning and draw inferences from one or more parts of a text.
Reflecting about information ~ to relate a text to one’s prior knowledge, experience and ideas
In PISA2000, students earned a score for each of these subscales, based on the level of difficulty of the tasks they were able to do. The sum of these scores was their general reading proficiency. In PISA2003, due to the limited time for assessing students in the domain of reading literacy, the results can only be reported on one single reading scale, which includes the three different types of tasks.
The reading performance of students assessed in PISA2003 is reported on a five level-scale, as in PISA2000. For each level of proficiency, there is a description of the abilities needed to perform at the respective levels. Please refer to the brochure ‘Worldwide Learning At Age 15. First Results from PISA2000’ (De Meyer et al, 2002) for a detailed description of the abilities required per level on each subscale. The table below summarises these per level of proficiency:
Level What students can typically do Level 5 (more than 625 score points)
Students can perform highly complex reading tasks that contain extensive competing information or deeply embedded pieces of information. They demonstrate a full understanding of such texts, are able to critically evaluate or hypothesise, drawing on specialised knowledge. They can deal with concepts that are contrary to expectations.
Level 4 (from 553 to 625 score points)
Students can perform difficult reading tasks such as locating embedded information in a text and dealing with ambiguities. They can construe the meaning of the section of a text. They use formal or general knowledge to hypothesise about or critically evaluate a text.
Level 3 (from 481 to 552 score points)
Students can locate and integrate several parts of a text in order to identify an underlying idea, understand a relationship, or construe the meaning of a word or phrase. They make connections or comparisons, give explanations, and evaluate the main idea of a text.
Level 2 (from 408 to 480 score points)
Students can perform basic reading tasks: they can locate one or more pieces of information and construe meaning within a limited part of the text when only low-level inferences are required.
Level 1 (from 335 to 407 score points)
Students can only perform the most basic reading tasks. They can locate explicitly stated information in a text, recognise the main theme in a text, and make a simple connection between information in the text and common, everyday knowledge.
600
700
500
400

- 35 -
READING LITERACY The figure below shows, per country, the percentage of students by proficiency level in the PISA2003 test on reading literacy. The percentage of students whose performance is below Level 3 is shown underneath the horizontal line that starts from the ‘0’ (the X-axis). These students have only elementary reading skills, whereas the students whose performance is rated at Level 3 or higher have more developed reading skills. The countries are placed in decreasing order according to their percentage of students whose reading proficiency is at least Level 3.
15 17 18 16 19 18 20 21 19 21 23 1828
19 23 21 21 23 24 25 23 20 24 23 26 25 21 24 26 27 26 25 25 28 2430 31 25
3428 33
24 275 5 7 8 8 9 8 10 9 910
914 11 12 12 11 11 12 13 13
12 13 13 1313
14 14 14 14 15 1517 20
21 2423
30
2730
2937
87 5 6 7 6 5 6 9 7 7 5 6 12 9 7 6 8 9 10
820
1312 27
1425
17 3426
32 33 31 26 30 2835 32 26 30 31 26
4128 31 29 27 30 30 33 28 26 30 27 31 30 26 29 30 30 30 28 27 28
20 25 21 17 17 16 16 11 8
33 3129 28 27
2726
2425 26
25
19
24 22 21 23 23 21 2021 22 21 21 20 19
20 19 18 18 18 18 17 15
119
86 3
21
15 1213 17 13 15 6 9
16 11 9 132
8 10 10 7 5 9 10 7 8 6 6 7 5 5 5
00
0
8
245
12 5 2 4 3 3
1
51
29
4 4
9
24
64 5 4
5 2
8
100
75
50
25
0
25
50
75
100
Finl
and
Kor
ea
Can
ada
Bel
gium
- Fl
ande
rs
Liec
hten
stei
n
Aus
tralia
Hon
g K
ong-
Chi
na
Irel
and
New
Zea
land
Swed
en
Net
herla
nds
Belg
ium
Mac
ao-C
hina
Bel
gium
- G
erm
an
Switz
erla
nd
Nor
way
Japa
n
Fran
ce
Pola
nd
Den
mar
k
Uni
ted
Stat
es
Ger
man
y
Icel
and
Aus
tria
Latv
ia
Cze
ch R
epub
lic
Bel
gium
- Fr
ench
Luxe
mbo
urg
Spai
n
Hun
gary
Portu
gal
Italy
Gre
ece
Slov
ak R
epub
lic
Uru
guay
Rus
sian
Fed
erat
ion
Turk
ey
Bra
zil
Thai
land
Mex
ico
Serb
ia
Tuni
sia
Indo
nesi
a
In an average OECD country, the reading literacy performance of 58% of the students corresponds to Level 3 or higher. Among these countries, the performance ranges from less than 20% in Serbia, Tunisia, and Indonesia to 70% or more in Liechtenstein, Flanders, Canada, Korea, and Finland. Just like in PISA2000, Finland not only gets the highest average score for reading literacy, but also has the greatest percentage of students whose performance belongs at reading literacy Level 3 or higher.
Similarly, the Flemish reading results for PISA2003 are almost identical to those of PISA2000. As was already apparent from the introductory table on p. 5 of this publication, the average reading score in Flanders places it, together with Australia, Canada, Korea, and Liechtenstein, in the top group of countries, compared to which only Finland achieves significantly better results. The good Flemish reading performance is confirmed by the percentage of Flemish students whose performance belongs to the highest reading literacy levels. With an average of almost three in four students (72%) in the highest three PISA levels, Flanders ranks fourth in the international ranking (see the figure above). However, if the ranking were done on the basis of the percentage of students at the highest proficiency level, Flanders, with its 17%, would come out first. In no other country do as many students reach the highest PISA reading level in PISA2003 as in Flanders.
The reading skills of students whose performance is Level 1 or below are barely developed. These students have problems understanding everyday texts and documents and constitute a high-risk group as regards participation in higher education and life-long learning. Reducing the percentage of ‘high-risk students’ is one of the EU benchmarks: by 2010, the percentage of students at Level 1 or below must have been reduced by 20% compared to PISA2000.
In PISA2003, in an average OECD country, 19% of the students belong to this high-risk group. In Finland and Korea, only 5% of the students score at the lowest reading literacy level, and about 1% score below it, but in both Tunisia and Indonesia, more than 60% of the students belong to these two categories. Besides, it is not just in partner countries (non-OECD countries) where one finds that a considerable proportion of the students belong to the high-risk group in the area of reading. The countries where 20% or more of the students rank at or below Level 1 are Mexico, Turkey, the Slovak Republic, Greece, Italy, Portugal, Hungary, Spain, Luxembourg, the French Community, Austria, Germany, and the German-speaking Community of Belgium. As regards the percentage of high-risk students in the area of reading literacy, Flanders does better than this group of countries. In Flanders, approximately 12% of the 15-year-olds assessed belong to the group whose performance for reading literacy ranks at or below Level 1.
■ Below level 1 ■ Level 1 ■ Level 2 ■ Level 3 ■ Level 4 ■ Level 5
Note: due to rounding off, the sum of the percentages not always equals 100.
Percentage of students at each level of proficiency on the reading scale Percentage of students

- 36 -
READING LITERACY As both cycles of the PISA study used the same scales and constructs to measure reading literacy, it is possible to compare the reading performance of PISA2000 with those of PISA2003. As already stated earlier in the section on mathematical literacy, such a comparison must be approached with due caution: since data are only available from two points in time, they do not allow a prediction to be made of how differences will develop in the longer term. The figure below indicates the difference in reading scores for the 34 PISA countries for which there are comparable data for 2000 and 2003. Both Flanders and the French Community are included in these 34 countries.
350
400
450
500
550
600
Japa
n
Mex
ico
Rus
sian
Fed
erat
ion
Aus
tria
Hon
g K
ong-
Chi
na
Icel
and
Spa
in
Italy
Irela
nd
Thai
land
Uni
ted
Sta
tes
Fran
ce
New
Zea
land
Can
ada
Nor
way
Den
mar
k
Cze
ch R
epub
lic
Finl
and
Aus
tralia
Bel
gium
- Fl
ande
rs
Sw
eden
Gre
ece
Bel
gium
Belg
ium
- Fr
ench
Hun
gary
Sw
itzer
land
Bra
zil
Ger
man
y
Por
tuga
l
Kor
ea
Indo
nesi
a
Pol
and
Latv
ia
Liec
hten
stei
n
PISA 2000 Performance PISA 2003 Performance
In 22 countries, the reading performance of PISA2000 was not significantly different from that in PISA2003. Flanders is one of those countries. In 2000, the average performance of Flanders on the general scale for reading literacy was 532; in PISA2003, it is 530. In other words, the Flemish reading results remained stable across both assessment cycles. Within the 95% confidence interval, three countries achieved a significantly better reading score in 2003 than in 2000: Poland, Latvia, and Liechtenstein. Among these countries, the performance of Poland is the most remarkable. In Poland, the highest average score for reading literacy in PISA2003 is mainly due to the group of low achievers getting better scores than in 2000. In PISA2000, the lowest 10% of the Polish students made an average reading score of 343, while the same group scores 374 points on average in 2003. Naturally, this also reduces the distribution in the Polish reading performance. The other side of the diagram shows the nine countries, which, within the 95% confidence interval, achieved a significantly lower reading score in PISA2003 than in PISA2000. For Japan, Austria, Iceland, Spain, and Italy, this difference can be explained by the low achievers getting lower scores than in the last cycle. The performance of the high achievers remained the same in PISA2003 as it was in PISA2000, but the students in the weaker groups did considerably worse. In these countries, of course, the distribution in the performance for reading literacy grew wider in comparison with PISA2000. For Austria, this evolution is partly due to the sample. In 2003, part-time vocational education was included in the Austrian sample, whereas it had been excluded from PISA2000.
Countries performing significantly higher (on the 95% confidence level):
in PISA2000 in PISA2003 Performance on the PISA reading scale
Countries are ranked in ascending order of the difference between PISA2003 and PISA2000 performances. The results of the German Community of Belgium are not included because their PISA2000 sample wasn’t reliable.
Differences in mean scores between PISA2003 and PISA2000 on the reading scale

- 37 -
READING LITERACY Besides comparing the general reading performance achieved in countries in the two PISA cycles, one can also compare the differences between boys and girls in the field of reading as measured by the two PISA studies. As was shown earlier in this report, in PISA2003, girls did better on reading literacy in all countries except Liechtenstein. In an average OECD country, in PISA2003, girls score 34 points higher than boys do. This is almost identical to the difference found in PISA2000 (32 points). These average score differences of about half a proficiency level were significant in the two cycles. In 2003, in all the participating countries except Liechtenstein, the girls achieved significantly better reading results than the boys did. In Liechtenstein, the reading score of the girls in PISA2003 was 17 points higher on average than that of the boys, but this difference is not significant. The difference in reading proficiency between boys and girls varies from country to country. In Poland, Germany, Thailand, Serbia, Finland, the French Community of Belgium, Austria, Norway, the German-speaking Community of Belgium, and Iceland, the girls’ advantage is 40 points or more. In these countries, the average performance of the boys falls in Level 2 for reading literacy, while that of the girls lies in Level 3. An exception to this rule is Finland, where the average girls’ proficiency is Level 4, and that of the boys Level 3. In Flanders, the difference in reading proficiency between boys and girls is not as great as in the group mentioned above. In PISA2003, the girls scored on average 28 points more for reading literacy. This difference is statistically significant, but not large enough to state that boys and girls perform at a different proficiency level. The average reading performance of Flemish girls and Flemish boys lies at Level 3. A comparison of the differences in reading performance between boys and girls in PISA2000 with those in PISA2003 shows that the girls’ advantage has remained consistent (see the figure below). However, in some countries the difference is greater in 2003 than in 2000 (e.g. Iceland, Austria, Spain, and the French Community of Belgium), or vice versa (e.g. in Finland, Latvia, and New Zealand), but in spite of these fluctuations, the girls’ advantage remains significant across the board, except for Liechtenstein in PISA2003. In Flanders, the better average reading performance of the girls was slightly more marked in PISA2000. In 2000, the girls scored an average of 35 points more for reading literacy than the boys did. That is a difference of seven score points between PISA 2000 and PISA 2003.
60
40
20
0
20
40
60
Icel
and
Bel
gium
- G
erm
anN
orw
ayA
ustri
aB
elgi
um -
Fren
chFi
nlan
d
Serb
iaTh
aila
ndG
erm
any
Pola
ndIta
lyA
ustra
liaU
rugu
ay
Spai
nLa
tvia
Fran
ceG
reec
eB
elgi
umSw
eden
Portu
gal
Switz
erla
ndB
razi
lTu
rkey
Luxe
mbo
urg
Slov
ak R
epub
lic
Uni
ted
Stat
esH
ong
Kon
g - C
hina
Can
ada
Cze
ch R
epub
licH
unga
ryIr
elan
d
Rus
sian
Fed
erat
ion
Bel
gium
- Fl
ande
rsN
ew Z
eala
ndD
enm
ark
Tuni
sia
Indo
nesi
aJa
pan
Mex
ico
Kor
eaLi
echt
enst
ein
Mac
ao-C
hina
OEC
D a
vera
geN
ethe
rland
s*
PISA 2003 PISA 2000
Males perform better
Females perform better
Dark colours represent differences that are statistically significant. * The Dutch response rate in PISA2000 was too low to ensure comparability.
Score point difference
Gender differences in reading performance in PISA2003 and PISA2000

- 38 -
SCIENTIFIC LITERACY In 2006, scientific literacy will be the main assessment domain of the PISA survey. Both in 2000 and in 2003, scientific literacy was assessed as a minor domain. As for the other assessment areas, the emphasis of the PISA science tasks is on the application of science knowledge and skills in real-life situations. It is not merely a test on student achievement in science subjects in their quality as curricular components. PISA defines scientific literacy as:
“the capacity to use scientific knowledge, to identify questions and to draw evidence-based conclusions in order to understand and help make decisions about the natural world and the changes made to it through human activity”.
Scientific literacy is structured around three dimensions: scientific knowledge or concepts, scientific processes and the situations or context in which the knowledge and processes are assessed. Scientific knowledge is organised as follows:
Physical systems Living systems
Knowledge of Science
Earth and space systems Science and technology Scientific enquiry Scientific explanations Science and technology in society
Knowledge about Science
Science and technology in society The items of the PISA test belong to one or several of those categories. The three scientific processes assessed in PISA are:
Describing, explaining and predicting scientific phenomena
~ recognising scientific phenomena, construct explanations and correctly evaluate the impact of the relevant phenomenon
Understanding scientific investigation ~ recognising questions or issues that could be investigated scientifically and recognising evidence required for that purpose
Interpreting scientific evidence and conclusions
~ using scientific findings as evidence to support assumptions or conclusions
The contexts in which PISA2003 assesses scientific literacy were “Science in life and health”, “Science in Earth and environment”, and “Science in technology”. The PISA tasks include problems that affect people as individuals, as members of a community or as world citizens. Considering the relatively limited amount of data collected in PISA2003 with regard to scientific literacy (60 minutes testing time versus 390 minutes testing material for mathematical literacy), it was not possible to divide the scientific literacy scale into levels of proficiency. The performance in science was therefore reported on a single scale on which an average score of 500 points was the only set value. The same scale was used for the PISA2000 and the PISA2003 assessments, which makes it possible to compare the mean performance of countries between the two cycles, as we have done for reading literacy. The introductory table on p. 5 of this brochure shows that Flanders belongs to a group of countries that scores significantly lower for scientific literacy than the group with the four top countries for sciences. However, the Flemish average score of 529 lies significantly above the OECD country mean for scientific literacy (which is exactly 500) and above the science scores of most other European countries. This situation is very similar to the Flemish science performance in PISA 2000. Then too, the group made up of Korea, Japan, and Finland achieved a significantly better performance than the ‘main pack’ to which also Flanders belonged. The figure on the opposite page shows to what extent the results for scientific literacy for PISA2000 and PISA2003 are similar.

- 39 -
SCIENTIFIC LITERACY
350
400
450
500
550
600
Aus
tria
Nor
way
Mex
ico
Can
ada
Kor
ea
Irela
nd
New
Zea
land
Thai
land
Sw
eden
Den
mar
k
Uni
ted
Sta
tes
Spa
in
Aust
ralia
Japa
n
Icel
and
Hon
g K
ong-
Chi
na
Indo
nesi
a
Hun
gary
Por
tuga
l
Bel
gium
- Fr
ench
Bel
gium
- Fl
ande
rs
Italy
Fran
ce
Pol
and
Bel
gium
Cze
ch R
epub
lic
Bra
zil
Finl
and
Sw
itzer
land
Ger
man
y
Gre
ece
Latv
ia
Rus
sian
Fed
erat
ion
Liec
hten
stei
n
PISA 2000 performance PISA 2003 performancePerformance on the PISA science scale
In PISA2003, twelve countries achieved an average score for scientific literacy, which - within a 95% confidence interval - is significantly higher than their score in PISA2000. In France, Poland, Belgium, the Czech Republic, Brazil, Finland, Switzerland, and Germany, the difference is due to the better performance of the high achievers. In other words, the groups of students that scored highest in PISA2000 for sciences (to be precise, the 75th, the 90th, and the 95th percentile) have now put up an even better performance in these countries in PISA2003. Flanders shows the same trend. The average performance in the domain of scientific literacy in 2003 is higher than in 2000, but this difference of 10 score points is not statistically significant. However, a closer look at the Flemish sample and in particular at the differences among the high achievers and the low achievers shows that, here too, the group of high achievers did significantly better in PISA2003 than in PISA2000. In the group of low achievers, though, there is no noticeable score difference between the two PISA cycles. Neither in Flanders, nor in the French Community, is the difference in PISA scores for scientific literacy between PISA2000 and PISA2003 significantly different. This is due to a large uncertainty margin (standard error). However, at the Belgian level (which is an average of the performance of the three Communities) because of the larger student sample and smaller standard error, the score difference between 2000 and 2003 is significant within a 95% confidence interval. In five countries, the average performance for scientific literacy in PISA2003 within a 95% confidence interval is significantly lower than in 2000. In Austria, the difference is most marked, but there is also a decline in Norway, Mexico, Canada, and Korea. The situation in Korea is the most remarkable: while the 5% top students (the 5% of the students with the highest science scores) did significantly better in PISA2003 than the same group did in 2000, the groups of low achievers got significantly lower scores than in PISA2000, bringing down the average Korean score. A similar situation is observed in Japan and Sweden, but there, the difference between the average science performances in the two cycles is not significantly different. In half of the countries, the performance assessed by PISA2003 is not significantly different from that of PISA2000. Moreover, caution is advised in interpreting the significant differences reported above. As mentioned earlier in this brochure, it is not possible to distinguish any real trends on the basis of these data, as they are drawn from only two points in time.
Countries performing significantly higher (on the 95% confidence level):
in PISA2000 in PISA2003
Differences in mean scores between PISA 2003 and PISA 2000 on the science scale

- 40 -
SCIENTIFIC LITERACY Just as for the domain of reading literacy, the tests on scientific literacy also allow a comparison between the differences in the performance of boys and girls across the two PISA cycles. However, the picture is more complex than the one for reading literacy. In PISA2003, boys scored on average significantly higher for scientific literacy in 13 countries. As a result, boys across the OECD countries scored an average of 6 points more than girls in 2003. In 2000, internationally, the two groups still had exactly the same average score. In only 3 countries do girls get a significantly higher score in the domain of scientific literacy than boys in PISA2003. In Flanders, the difference between the science performance of boys and girls in PISA2003 is 8 score points to the advantage of the boys. However, this difference is not statistically significant. The comparison between the science results of PISA2000 and those of PISA2003 shows, in the first place, that the gender differences in this domain are smaller than the differences in other PISA domains, and that there is greater fluctuation between the two assessments. In 12 of the 27 countries where boys had a high average score in PISA2003 (both significant and non-significant), girls achieved a higher average performance in 2000 (see the figure below). In 2000, the girls’ advantage was significant only in New Zealand and in the Russian Federation. In most other countries, the score differences were around 6 points. Boys did significantly better than girls in the two PISA cycles in Korea and in Denmark. There was not a single country where the group of girls achieved a significantly better performance than the boys in the domain of scientific literacy in both PISA cycles. In Latvia, Finland, the French Community of Belgium, Thailand, and Iceland, girls scored better than boys both in 2000 and in 2003, but each time, one of the two performance differences was not significant.
-40
-20
0
20
40
Liec
hten
stei
n
Kor
ea
Den
mar
kN
ew Z
eala
nd
Slo
vak
Rep
ublic
Luxe
mbo
urg
Gre
ece
Can
ada
Sw
itzer
land
Mex
ico
Rus
sian
Fed
erat
ion
Bel
gium
- Fl
ande
rsM
acao
-Chi
na
Pol
and
Por
tuga
lIta
ly
Ger
man
y
Cze
ch R
epub
licU
nite
d S
tate
s
Sw
eden
Japa
n
Uru
guay
Spa
in
Irela
nd
Nor
way
Indo
nesi
a
Turk
ey
Fran
ceA
ustra
lia
Bel
gium
Hun
gary
Aus
tria
Hon
g K
ong
- Chi
na
Latv
iaS
erbi
a
Finl
and
Bel
gium
- Fr
ench
Thai
land
Tuni
sia
Icel
and
Bel
gium
- G
erm
an
OE
CD
ave
rage
Net
herla
nds*
Males perform better
Females perform better
Dark symbols represent differences that are statistically significant (both for PISA2000 and PISA2003). * The Dutch response rate in PISA2000 was too low to ensure comparability. In Flanders, the average science score for boys and girls in PISA 2000 was almost the same. The difference was one point to the advantage of the girls. In 2003, the boys scored on average 8 points more, but once again, the difference between the two groups is not significant. The non-significant difference in performance for scientific literacy of Flemish boys and girls in PISA2000 is therefore confirmed in the 2003 cycle. In other words - in Flanders, boys and girls are a match for each other when it comes to scientific literacy.
PISA2003 Advantage for the boys Advantage for the girls
PISA2000 ● ○ Advantage for the boys ● ○ Advantage for the girls
Gender differences in science performance in PISA2003 and PISA2000
Score point difference

- 41 -
PROBLEM SOLVING In PISA2003, problem solving was included as a supplementary assessment domain. This focus was added to the survey because a number of OECD countries were concerned that students’ capabilities in reading literacy, mathematical literacy, and scientific literacy may not reflect their overall capability to solve problems. Were PISA assessments too restrictive, and did the domain-based assessment framework rule out valid inferences about students’ overall problem solving skills in real-life situations? To address this, and evaluate students’ cross-curricular competencies in solving problems, OECD countries established a framework for the “Problem solving” assessment domain. Students were confronted with complex real-life situations and asked to solve a problem in that setting. To carry out such tasks, students systematically needed to combine several concepts and cognitive processes, which could not be linked to a single cognitive domain. PISA defines problem solving as:
“an individual’s capacity to use cognitive processes to confront and resolve real, cross-disciplinary situations where the solution path is not immediately obvious and where the content areas or curricular areas that might be applicable are not within a single subject area of mathematics, science or reading..”
PISA distinguishes between three different types of problem solving processes:
~ Choosing a solution among several alternatives, which all come with specific constraints
~ Identifying the relationships between parts of a system and/or designing a system to express the relationships between parts
~ Diagnosing and correcting a faulty or underperforming system or mechanism
Like the scales of proficiency in other PISA domains, the PISA problem solving scale is divided in consecutive proficiency levels. This scale has three distinct performance levels, described in the table below.
Level What students can typically do at each level Level 3
(> 592 score points) Reflective, communicative problem solvers Students proficient at Level 3 think about the underlying relationships in a problem and relate these to the solution. They approach problems systematically. They construct their own representations to help them solve the problem and verify that their solution satisfies all requirements of the problem. These students communicate their solutions using accurate written statements and other representations.
Level 2 (499 - 592 score points)
Reasoning, decision-making problem solvers Students proficient at Level 2 apply various types of reasoning to analyse situations and to solve problems. They combine and synthesise information from a variety of sources. They are able to combine various forms of representations (e.g. text, numerical information, and graphical information) and draw inferences based on two or more sources of information. They can also handle unfamiliar representations (e.g. flow diagrams).
Level 1 (405 - 498 score points)
Basic problem solvers Students proficient at Level 1 understand the nature of a problem and retrieve information related to its major features. They can solve problems where they have to deal with only a single data source containing discrete, well-defined information. They can apply information to check a limited number of well-defined conditions within the problem. However, they do not deal successfully with multi-faceted problems.
Below level 1 (< 405 score points)
Weak or emergent problem solvers Students with performances below Level 1 fail to apply even the most basic problem solving processes. At most, they can deal with straightforward problems with highly structured tasks that require the students to give responses based on raw facts or observations. Students at this level experience significant difficulties in all three problem solving processes.
DECISION-MAKING
SYSTEM ANALYSIS AND DESIGN
TROUBLE SHOOTING
600
500
400

- 42 -
PROBLEM SOLVING The three following sample units give an idea of how PISA assesses problem solving skills in 15-year-old students. Each unit refers to one of the three problem solving processes measured in the PISA survey. Decision-making
“Cinema Outing” is an example of a decision-making problem. It presents students with a significant amount of information and a set of well-defined decisions to make based on the information given:
CINEMA OUTING
This problem is about finding a suitable time and date to go to the cinema.
Joost, a 15-year-old, wants to organise a cinema outing with two of his friends, who are of the same age, during the one-week school vacation. The vacation begins on Saturday, 24th March and ends on Sunday, 1st April.
Joost asks his friends for suitable dates and times for the outing. The following information is what he received. Fred: “I’ve to stay in on Monday and Wednesday afternoons for music practice between 14.30 and 15.30”
Steven: “I’ve to visit grandmother on Sundays, so it can’t be Sundays. I have seen Pokamin and don’t want to see it again.”
Joost’s parents insist that he only goes to movies suitable for his age and does not walk home. They will fetch the boys home at any time up to 10 p.m.
Joost checks the movie times for that week. This is the information that he finds.
TIVOLI CINEMA
Advance Booking Number: 019/2423000 24 hour phone number: 019/2442007 Bargain Day Tuesdays: All films €3
Films showing from Fri 23rd March for two weeks:
Children in the Net Pokamin
113 Mins 105 Mins 14.00 (Mon-Fri only) 21.35 (Sat/Sun only)
Suitable only for persons of 12 years and over
13.40 (Daily) 16.35 (Daily)
Parental Guidance, General viewing, but some scenes may be unsuitable for young children
Monsters from the Deep Enigma
164 Mins 144 Mins 19.55 (Fri/Sat only)
Suitable only for persons of 16 years and over
15.00 (Mon-Fri only) 18.00 (Sat/Sun only)
Suitable only for persons of 12 years and over
Carnivore King of the Wild 148 Mins 117 Mins 18.30 (Daily) 14.35 (Mon-Fri only)
18.50 (Sat/Sun only)
Suitable only for persons of 16 years and over
Suitable for persons of all ages

- 43 -
Level
499
592
405
PROBLEM SOLVING
Question 1: CINEMA OUTING
Taking into account the information Joost found on the movies and the information from his friends, which of the six movies should Isaac and the boys consider watching?
Movie Choose Yes or No to indicate whether the three boys should consider watching the movie
Children in the Net Yes / No
Monster from the Deep Yes / No
Carnivore Yes / No
Pokamin Yes / No
Enigma Yes / No
King of the Wild Yes / No
Full Credit: 522 score points Code 2: Yes, No, No, No, Yes, Yes, in that order.
Question 2: CINEMA OUTING
If the three boys decided on going to “Children in the Net”, which of the following dates is suitable for them? A Monday, 26th March B Wednesday, 28th March C Friday, 30th March D Saturday, 31st March E Sunday, 1st April
Full Credit: 468 score points Code 1: C. Friday, 30th March
In order to correctly respond to Question 1 about “Cinema Outing”, students must merge different pieces of the information provided (such as who has already seen which movie and the showing times of the various films) and correctly take them into consideration. Typically, students proficient at Level 2 will be able to respond correctly to this question. Such students are capable of making decisions while handling profuse material and considering a wide variety of boundary constraints.
Question 2 about “Cinema Outing” is a less demanding task. It requires students to make a decision when only temporal constraints have to be satisfied. A correct performance on question 2 corresponds to Level 1 on the PISA problem solving proficiency scale: students only need to use a single, clearly stated factor in addressing a well-defined aspect of the problem.
3 2 1
Bel
ow 1

- 44 -
Level
592
405
499
PROBLEM SOLVING System analysis and design
“Children’s Camp” is an example of a system analysis and design problem. Students receive all the information they need to assign a summer camp’s participants to different dormitories. To perform this task correctly, they have to understand the various constraints and their interrelationships, and fill in the table in a way that complies with them. Students who correctly fill in the table for Question 1 perform at proficiency level 3 of the problem solving scale. Full credit requires students to combine all of the following pieces of information:
- the number of participants and their gender - the presence of at least one adult counsellor in each of the dormitories with children - the match between the gender of the adults and children involved - the capacities of the dormitories.
This is all but easy. Students must shift between the desired state, the constraints, and the current status of their emerging solution. The task requires that students constantly monitor and adjust partially correct solutions. Students who do not succeed in complying with all the constraints but do offer a solution that considers most factors receive a partial credit. These students are expected to perform at least at proficiency level 2 on the problem solving scale.
CHILDREN’S CAMP The Zedish Community Service is organising a 5-day Children’s Camp. 46 children (26 girls and 20 boys) have signed up for the camp, and eight adults (four men and four women) have volunteered to attend and organise the camp.
Figure 1: Adults Figure 2: Dormitories Mrs. Grietjes Name Number of beds Mrs. Chantal Red 12 Ms. Merel Blue 8 Ms. Kelly Green 8 Mr. Stevens Purple 8 Mr. Nelissen Orange 8 Mr. Willems Yellow 6 Mr. Peters White 6
Dormitory rules: 1. Boys and girls must sleep in separate dormitories. 2. At least one adult must sleep in each dormitory. 3. The adult(s) in a dormitory must be of the same gender as the children.
Question 1: CHILDREN’S CAMP
Fill the table to allocate the 46 children and eight adults to dormitories, keeping to all the rules.
Name Number of boys Number of girls Name(s) of adult(s) Red Blue Green Purple Orange Yellow White
Full credit: 650 score points Code 2: 6 conditions to be satisfied (e.g. Total girls = 26, total boys = 20, total adults = four
female and four male, etc.)
3
2
1
Bel
ow 1

- 45 -
PROBLEM SOLVING Trouble shooting
The sample unit “Irrigation” presents students with a system of irrigation canals and gates in which they have to identify and solve some problems. Question 1 only measures whether students understand how the gates in the irrigation network operate. The task requires them to take over the gate settings from the table and then check whether there is a path by which water can flow through the system. They need to make a one-to-one transformation of the data from the table to the flow diagram, which can be done successfully by all students performing at proficiency level 1 or above.
Questions 2 and 3 of the “Irrigation” unit feature a difficulty level that matches proficiency level 2 on the problem solving scale. Students need to understand the irrigation system, but also to identify possible faults in the diagram and to evaluate the consequences of these faults, i.e. to troubleshoot the mechanism. Question 2 requires students to keep in mind the representation while applying deductive and combinatorial reasoning in order to find a solution. Similarly, Question 3 is a Level 2 problem because it requires students to handle several interconnected relationships at once. Both the settings of the remaining gates and the possible flow patterns determine whether the water will flow through Gate G or not.
IRRIGATION
Below is a diagram of a system of irrigation channels for watering sections of crops. The gates A to H can be opened and closed to let the water go where it is needed. When a gate is closed no water can pass through it. This is a problem about finding a gate which is stuck closed, preventing water flowing through the system of channels.
Figure 1: A system of irrigation channels
Michael notices that the water is not always going where it is supposed to.
He thinks that one of the gates is stuck closed, so that when it is switched to “open”, it does not open.
A
E
D C
H F G
B
Out In

- 46 -
592
405
499
Niveau
PROBLEM SOLVING
Question 1: IRRIGATION
Michael uses the settings given in Table 1 to test the gates.
Table 1: Gate Settings A B C D E F G H
Open Closed Open Open Closed Open Closed Open
With the gate settings as given in Table 1, draw all the possible paths for the flow of water in Figure 1, assuming that all gates are working according to the settings.
Full credit: 497 score points Code 1: Flow paths as shown below:
Question 2: IRRIGATION
Michael finds that, when the gates have Table 1 settings, no water flows through, indicating that at least one of the open gates is stuck closed.
Decide for each problem case below whether the water will go through all the way.
Problem Case Circle “Water will go through” or “Water will NOT go through”
Gate A is stuck closed. All other gates are working properly as set in Table 1. Water will go through / Water will NOT go through
Gate D is stuck closed. All other gates are working properly as set in Table 1. Water will go through / Water will NOT go through
Gate F is stuck closed. All other gates are working properly as set in Table 1. Water will go through / Water will NOT go through
Full credit: 544 score points Code 1: will NOT, will, will, in that order.
3
2
1
Ond
er 1
A
E
DC
HF G
B
Out In
A
E
DC
HF G
B
Out In

- 47 -
499
405
592
Niveau
499
PROBLEM SOLVING
Question 3: IRRIGATION Michael wants to be able to test whether gate D is stuck closed. In the following table, show the settings for the gates to test whether gate D is stuck closed when it is set to “open”.
Settings for gates (each one “open” or “closed”)
A B C D E F G H
Full credit: 532 score points Code 1: A and E are not both closed. D must be open. H can only be open if water cannot get to it (e.g., other gates are closed preventing water from reaching H). Otherwise H must be closed.
These three sample units not only reflect the three processes by which PISA measures problem solving skills; they also discover the sort of questions on each of the three levels of ability. The table below summarises the three sample units according to their place on the PISA problem solving scale:
450
500
550
600
650
700
Children's Camp (full credit) - 650
Irrigation question 2 - 544
Irrigation question 3 - 532
Children's Camp (partial credit) - 529Cinema Outing question 1 - 522
Irrigation question 1 - 497
Cinema Outing question 2 - 468Level 1
Level 2
Level 3
> 592 score points
499 - 592 score points
405 - 498 score points
3
2
1
Ond
er 1
Position of the three sample units on the PISA problem solving scale
PISA
pro
blem
solv
ing
scal
e

- 48 -
PROBLEM SOLVING One way to report national performances on the PISA problem solving scale is to rank them by the percentage of students at each level of proficiency. In the figure below, all students from each participating country are classified by their highest level of problem solving proficiency. The percentage of students at or below Level 1 appears below the horizontal axis, which starts at “0”. The percentage of students at or above Level 2 appears above the same horizontal axis. This representation shows at a glance how many students have higher-level problem solving skills compared to only basic problem solving skills in each country. Countries are ranked in descending order of percentage of students in levels 2 and 3.
40 37 34 34 30 31
3523
7
202326303322 22 21 21 20 27 26 25 27 26 24 27 28 30 30 29 28 28 32 32 32 32 30 37 34 34 33 37 35 36 34 34 35 36 36 31
4039
777364585143424733
2425242320201819171713
191614121215141211101211141081096109855
43 41 36 34 3542 39 36 37 34 39 37 39 36 36 38 40 37 35 33 38 34 33 34 33 32 31 30 24 18 16 16 12 11 9 4 2
30 3236 36 24 26 28 25 27 28 23 23 20 22 22 23 17 15 17 17 18 12 14 14 15 12 12 12 12 12 11 9
5 3 2 4 1 2
-100
-75
-50
-25
0
25
50
75
100
Finl
and
Kor
ea
Hon
g K
ong-
Chi
na
Vla
ande
ren
Japa
n
Mac
ao-C
hina
Aus
tralia
New
Zea
land
Can
ada
Liec
hten
stei
n
Bel
gium
Switz
erla
nd
Fran
ce
Den
mar
k
Net
herla
nds
Cze
ch R
epub
lic
Ger
man
y
Bel
gium
- G
erm
an
Swed
en
Icel
and
Aus
tria
Hun
gary
Bel
gium
- Fr
ench
Irela
nd
Luxe
mbo
urg
Slov
ak R
epub
lic
Nor
way
Pola
nd
Spai
n
Latv
ia
Rus
sian
Fed
erat
ion
Uni
ted
Stat
es
Italy
Portu
gal
Gre
ece
Uru
guay
Thai
land
Serb
ia
Turk
ey
Mex
ico
Bra
zil
Indo
nesi
a
Tune
sia
The figure shows that country results vary greatly: in some countries, the great majority of students can solve problems at proficiency Level 2 or above; in others, only a small group of students attain this level. On average, about half of the students in OECD countries score at Level 2 or above. The national percentages of students at Level 2 or above range from 70 per cent or more in Finland, Korea, Hong Kong (China), Flanders and Japan, to less than 5 per cent in Indonesia and Tunisia. Together with Japan and Hong Kong (China), Flanders is one of the three countries featuring the highest percentage of students (more than one third) performing at the top level of proficiency on the problem solving scale i.e. the level of Reflective, communicative problem solvers. There are also large disparities when it comes to the percentage of students with a low proficiency profile (unable to solve Level 1 problems). The percentage of “students at risk” is lower than 10 per cent in Finland, Korea, Macao (China), Hong Kong (China), Australia, Canada and Flanders, but more than half of all participating students in Turkey, Mexico, Brazil, Indonesia and Tunisia perform below Level 1. Flemish 15-year-olds achieve outstanding scores in the problem solving domain. Over one third of Flemish students master the skills associated with the highest difficulty level and another third performs at the level of reasoning, decision-making problem solvers.
Percentage of students
Percentage of students at each level of proficiency on the problem solving scale
■ Below level 1 ■ Level 1 ■ Level 2 ■ Level 3
Note: due to rounding off, the sum of the percentages not always equals 100.

- 49 -
PROBLEM SOLVING Another way to report problem solving results is to estimate a mean problem-score for each country. The synoptic table on page 5 shows that the Flemish mean score is very high for problem solving. Finland, Hong Kong (China) and Korea are the only countries to achieve a higher mean score, but none scored significantly higher than Flanders. However, mean scores do not provide information about differences within countries. This section looks further into the distribution of problem solving results, expressed in percentiles (cf. pages 21-23 of this publication for more detailed explanations). The gradation bars in the figure below show the range of performance in each country. The length of the bar is a measure of the total variation within the student population of a country. The Belgian gradation bar is the third longest (only Japan and Uruguay have longer bars): Belgium has one of the widest ranges of performance distribution for problem solving. Even though differences between the Belgian Communities influence this distribution, there remains a wide gap between the lowest and highest achievers in Belgium.
The variation is a bit smaller for Flanders, but the score difference between the 95th and the 5th percentiles is still considerable. If one takes a closer look at the Flemish gradation bar, one sees that the top of the bar is at a similar level as the top of the Korean bar – the country with highest mean performance for problem solving. In other words, Flanders’ high-achievers perform at the same level as high-achievers in Korea. However, when one looks further down the distribution, one sees that the scores of Flemish low-achievers lie almost 40 score points below the score of the Korean low-achievers. This difference is equivalent to almost one half of a proficiency level.
200
250
300
350
400
450
500
550
600
650
700
750
Tun
isia
Indo
nesi
a
Bra
zil
Mex
ico
Tur
key
Uru
guay
Serb
ia
Tha
iland
Gre
ece
Ital
y
Port
ugal
Uni
ted
Stat
es
Rus
sian
Fed
.
Spai
n
Lat
via
Pola
nd
Nor
way
Slov
. Rep
.
Lux
embo
urg
Bel
gium
- Fr
ench
Irel
and
Hun
gary
Icel
and
Aus
tria
Swed
en
Ger
man
y
Bel
gium
- G
erm
an
Cze
ch R
ep.
Den
mar
k
Fran
ce
Net
herl
ands
Switz
erla
nd
Bel
gium
Can
ada
Lie
chte
nste
in
Aus
tral
ia
Mac
ao-C
hina
New
Zea
land
Japa
n
Bel
gium
- Fl
ande
rs
Finl
and
Hon
g K
ong
Kor
ea
The wider range of the Flemish performance is characterised by a relatively wide range in the bottom part of the distribution, under the median. The lower segments of the bar appear longer than the top segments. The group of Flemish low-achievers (percentiles 5 and 10) includes BuSO-students (students in special secondary education), which were explicitly included in the Flemish sample. Their scores undoubtedly had an impact on the Flemish distribution.
Top Flemish students perform at a very high level in problem solving, a performance equalled by no more than five other countries. The scores of Flemish low-achievers are not quite as impressive. Students from this group perform at the same level as equivalent student groups in e.g. Japan, New Zealand, Liechtenstein, Australia, and Denmark. Only Finland and Korea succeed in combining (very) high mean scores for problem solving with a relatively low variation. In other words, disparities between high and low achievers are smaller in those two countries than in other PISA countries.
Distribution of student performance on the problem-solving scale
Countries are ranked by increasing mean score

- 50 -
Difference between student performance in mathematics and problem solving
PROBLEM SOLVING Problem solving differs from mathematics, reading, and science in that it is not a traditional school subject. The skills that problem solving assesses are required in curricular subjects as well as in cross-curricular areas. A comparison of countries’ performances in problem solving and in mathematical literacy shows a strong correlation between those two domains. Countries achieving high scores for mathematical literacy generally perform well in problem solving, too. Across all participating countries, the correlation between both domains is 0.89. This high correlation is not surprising. On the one hand, PISA problem solving tasks mainly address students’ analytic reasoning skills. On the other, PISA mathematical literacy items focus more on applications of mathematics in real-life situations than on typical mathematical knowledge and skills. Although the problem solving tasks do not require much knowledge of mathematical content, there is an overlap between the skills that need to be applied in order to solve tasks correctly in both assessment domains.
Overall, a country’s performance in mathematical literacy is closely associated with its problem solving performance. However, in most countries, students score significantly better in one domain than in another. Relevant data are presented in the figure below. For each country, the mean score for problem solving was deducted from the mean score in mathematical literacy. If a country performs relatively better in mathematics than in problem solving, one can interpret this as showing that the students in the country do better in mathematics than their level of generic problem solving skills leads to expect. In contrast, if a country performs relatively better in problem solving, this may suggest that students did not achieve their full potential in mathematics than that reflected in their current performance, since their level of generic problem solving skills is relatively higher.
6
-15-13
-11-10-10-9-8-8-8-6-5-4-4-4-3-2-1-1
11112233
18 17 1614
12 10
6 6 6 5 5 4 4 4
-20
-15
-10
-5
0
5
10
15
20
Net
herl
ands
Serb
ia
Tur
key
Tun
esia
Uru
guay
Icel
and
Slov
ak R
epub
lic
Lie
chte
nste
in
Flan
ders
Uni
ted
Stat
es
Nor
way
Switz
erla
nd
Irel
and
Bel
gium
Pola
nd
Can
ada
Spai
n
Hon
g K
ong-
Chi
na
Bel
gium
- Fr
ench
Bel
gium
- G
erm
an
Lat
via
Mex
ico
Swed
en
Cze
ch R
epub
lic
Lux
embo
urg
Aus
tria
Indo
nesi
a
Den
mar
k
Finl
and
Gre
ece
Ital
y
Port
ugal
Mac
ao-C
hina
Aus
tral
ia
Tha
iland
Kor
ea
Fran
ce
New
Zea
land
Rus
sian
Fed
erat
ion
Ger
man
y
Hun
gary
Japa
n
Bra
zil
Significant difference Not significant difference
PISA score points
Problem solving performance better than mathematics
Mathematics performance better than problem solving
Although the score point difference is not spectacular, it sometimes makes a significant difference in a country’s rank for both domains. In the Netherlands, students scored on average 18 points higher in mathematics than in problem solving. With a score of 538 points, the Netherlands is in fifth position for mathematical literacy (see the table on page 5 of this brochure) and belongs to the group of top-performing countries in this domain, behind Flanders and Hong Kong (China). However, for problem solving, the Netherlands is in the 13th position (including Flanders in the calculation). This indicates that Dutch mathematics instruction may be highly effective. The reverse is observed in Hungary. Hungarian students performed below the OECD country mean for mathematical literacy, but they demonstrate a mastery of problem-skills at a level very close to the OECD country mean.
On average, Flemish students score 6 points higher in mathematics than in problem solving. This is a small difference, but nevertheless it confirms that mathematics instruction has a high level of quality in Flanders. While the Flemish mean performance for problem solving is quite high – ranked at the fourth position overall but with no statistically significant differences among the top countries – Flanders succeeds in performing even higher on the mathematical literacy scale.

- 51 -
RESULTS FROM PISA 2003 – SUMMARY
This brochure presents and discusses the first results from PISA2003. While the OECD international report “Learning for Tomorrow’s World – First results from PISA2003” mostly refers to Belgium as a whole and just occasionally mentions Flemish results, the present publication examines these results from the Flemish perspective. Relevant data for Flanders are explicitly added to all the figures and graphs; and the results of further analyses of Flemish data are discussed.
PISA2003 studies the capacity of 15-year-olds to apply knowledge and skills in the mathematical literacy, scientific literacy, reading literacy and problem solving domains. A score is assigned to each student, and this score corresponds to the difficulty level of the hardest task that s/he was able to solve. PISA steps away from the “right” or “wrong” dichotomy and places every 15-year-old on a continuum. Similarly, every PISA task is associated with a given score on the same proficiency scale. The “Mathematical literacy” domain is divided into four subscales: “Space and shape”, “Change and relationships”, “Quantity” and “Uncertainty”. The domain and the subscales are divided into 6 levels of proficiency, whereby Level 6 is the highest. Flemish students performed very high, so that Flanders is at the top of the group of top-performing countries for “Mathematical literacy” and for the four subscales.
For the first time, it is now possible to evaluate change in performance. A comparison can be made with results from PISA2000 for the “Space and shape” and “Change and relationships” subscales. In PISA2003, Flemish 15-year-olds performed significantly better than in PISA2000 on both subscales. Progress reported by Flanders on the “Space and shape” subscale is the largest of all OECD countries. A comparison of percentile scores reveals that the group of Flemish high achievers did (even) better in PISA2003 than in PISA2000. Student-level differences PISA2003 also examines how student characteristics influence achievement. Gender, ESCS, language spoken at home and native country are accounted for. Results from PISA2003 show that there are disparities between performances of male and female students. In Flanders (and in two thirds of all participating countries) males outperform females in mathematical literacy and on 3 out of 4 subscales. Conversely, Flemish girls score higher than boys in reading literacy. No significant differences were observed in the scientific literacy and problem solving domains. A student’s ESCS also has an impact on his/her performance, and this impact is particularly high in Flanders. However, the Flemish education system is successful in that it achieves a high mean performance in mathematical literacy for all students, no matter what their ESCS is.
Language spoken at home and country of birth appear to have a significant impact on student performance. The proportion of first-generation and non-native students was relatively small in the Flemish sample, but they performed significantly lower in mathematical literacy (the gap is equivalent to two levels of proficiency). When the language mostly spoken at home is also accounted for, it appears that students who speak a language at home that differs from the test language achieve significantly lower scores. However, the exceptionally high score of students who do speak the test language at home partly accounts for this wide performance gap. Results in the other PISA domains PISA2003 also assessed students’ knowledge and skills in the reading literacy, scientific literacy, and problem solving domains. Furthermore, results can be compared between PISA2000 and PISA2003 for reading literacy and scientific literacy. Of all participating countries, Flanders has the highest percentage of students performing at the top level of proficiency on the reading literacy scale. The Flemish performance in PISA2003 does not significantly differ from that in PISA2000. For scientific literacy, Flanders performs below the four countries at the top of the scale, a rank comparable to PISA2000. Flemish results did not significantly improve or drop. In the problem solving domain, more than one third of Flemish students attain the highest level of proficiency. Flemish high achievers perform at a very high level, equalled in no more than four other countries.
Student competencies
Comparison with PISA 2000
The comparison of performances in mathematical literacy in PISA2000 and PISA2003 is discussed on pages 18-20.
Performances on the mathematical literacy scale are analysed in detail on pages 6-17.
Performances in the other PISA2003 domains are discussed on pages 34-50.
Student-level differences are discussed on pages 21-33.

Learning for Tomorrow’s Problems First Results from PISA2003. This brochure examines the first results from the second PISA survey cycle (Programme for International Student Assessment), which took place in 2003. Cross-country comparisons of student performance are discussed extensively and the relative impact of certain student characteristics is analysed. The outcomes are consistently linked to the situation in Flanders. For the first time, results can be compared to those from PISA2000 on a number of subscales and in certain domains. PISA provides some of the answers to the following questions: are students well prepared to meet the challenges of the future? Are they able to analyse, reason and communicate their ideas effectively? Do they have the capacity to continue learning throughout life? It assesses to what extent students near the end of compulsory schooling have acquired some of the knowledge and skills that are essential for full participation in society. The knowledge and skills evaluated in the PISA2003 cycle belong to the domains of “Mathematical literacy”, “Scientific literacy”, “Reading literacy” and “Problem-solving”. Performances of 15-year-old students from over 40 countries are compared and discussed. The comprehensive initial report for PISA2003 (“Learning for Tomorrow’s World - First results from PISA2003”) was drafted and published by the OECD and is available in English, French and German. That report only refers to Belgian figures i.e. it reports combined results of the Flemish, French and German-speaking Communities of Belgium. Flanders is only occasionally mentioned by itself. Both the international report and this brochure report go well beyond an examination of average student performance and relative standing of countries according to a number of classifications. They also discuss how student-level characteristics influence student performance: for example gender, language spoken at home, country of birth and socio-economic background are taken into consideration. Since comparisons can be made between results from PISA2000 and PISA2003, countries that have achieved significant progress from one cycle to the next are discussed.
The international report can be ordered online. The data underlying the report are also available for consultation:
www.pisa.OECD.org
For further information about Flemish results from PISA:
Universiteit Gent – Vakgroep Onderwijskunde [Ghent University – Department of Education]
Henri Dunantlaan 2, 9000 Gent - Belgium [email protected]
Flemish PISA 2003 Report on the Internet: www.ond.vlaanderen.be/onderwijsstatistieken