
Learn about Dell’s Employee Resource Groups around the world
Upload
august-evelyn-newmanCategory
view
215download
0
Learn more about stroke
Free on line e-learning resource
www.strokecorecompetencies.org

Scottish Stroke Care Audit
Annual Meeting
24th June 08
RCPE

Acknowledgements
• Robin Flaig
• Mike McDowall
• Audit coordinators
• Contributing clinicians and managers
• Margaret Farquhar & team RCPE

Menu
• A Scottish perspective• Performance of individual hospitals 2005 – 2007
learning lessons from good and bad practice– Inpatients– Outpatients
• Swallowing - Karen Krawczyk • Plans to review NHSQIS standards• Future plans for the audit• Tea• Carotid endarterectomy

Reasons for variation in “Performance”
• Method of collection data
• Definitions, case ascertainment and audit period
• Method of analysing data
• Which numerator and denominator
• Chance
• Actual performance of service

Proportions
• Numerator / Denominator = Proportion• 100 patients admitted• 60 enter stroke unit• Proportion is 60/100 = 0.6 or 60%• NHS QIS ask % admitted SU within 1 day• Denominator is 100 for NHSQIS
standards?• Most challenging

Data Quality
• Complete ascertainment?
• Data extraction?– Finding info– Clinical support
• Keeping up to date

National Performance
72
5144
78
57
77
56 51
86
6670
100
80
100
0
20
40
60
80
100
120
SU
SU<1d
Swal
l <1d
CT <2
d
Aspiri
n <2d
2005 2007 NHSQIS

Comparisons between hospitals
Inpatients

Stroke unit care

Organised inpatient (stroke unit) careAbsolute outcomes at 6-12 months
-3 (-6, -1)*26 %22 %Dead
-2 (-5, 0)*20 %18 %Institutional care
0 (-2, 3)16 %16 %Home (dependent)
5 (1, 8)*38 %44 %Home, (independent)
Risk differenceControlStroke unitOutcome
SUTC (2001)SUTC (2001)

Mean delay (days) from admission to entry into any Stroke Unit
Hospital
8
7
6
5
4
3
2
1
0
Mean (
days)
20052007
Year

Hospital
100
80
60
40
20
0
Perc
enta
ge
20052007
Year
% of patients admitted to a Stroke Unit ≤ 2 days of admission (NHS QIS Standard = 70%)

Hospital
100
80
60
40
20
0
Perc
enta
ge
20052007
Year
% of patients admitted to a Stroke Unit ≤ 2 days of admission (NHS QIS Standard = 70%)

How did you improve access?
• Direct admissions? • Day & night?• Medical staffing out of hours?• Do you have a medical assessment unit?• How many beds for how many admissions?• Fixed bed numbers or flexible?• Ring fenced beds?• How do you clear your beds?

Why is access getting worse?
• Lack of SU beds?
• Filled with non stroke patients?
• Problems with discharge?

Swallow screen

Why screen for swallowing problems
• 50% of patients cannot swallow safely
• Increased risk of pneumonia & death
• Need for fluids
• Need for nutrition – modified diet or tube
• Need for medication

Mean delay (days) from admission to Swallow screen
Hospital
5
4
3
2
1
0
Mean d
ays
to S
wallo
w s
creen
2005
2007
Year

% of patients with a Swallow screen on day of admission
(NHS QIS Standard = 100%)
Hospital
100
80
60
40
20
0
Perc
enta
ge
20052007
Year

How did you improve performance?
• Who does the screening?
• How were they trained?
• Where do they do it?
• How is it documented?
• Are they missing cases?

Brain scanning

Brain scanning
• To exclude alternative diagnoses• To distinguish haemorrhage and infarction• To allow safe use of antithrombotic treatment

Mean delay (days) from admission to Scan
Hospital
Scotlan
d
Wes
tern
Isles
Shetlan
d
Orkne
y
VH, K
irkca
ldy
QMH
Caithne
ss
Belfo
rd
Lorn
& Is
lands
Raigmor
eDGRI
Bord
ers
Forth
Vall
ey
Wish
aw
Monkla
nds
Hairmyr
es
Crossh
ouse
AyrVO
LRAH
IRH
SGH
WI,
Glasgo
w
Stob
hill
RI, G
lasgow
WGH
SJH
RIE
PRI
Ninew
ells
ARI
7
6
5
4
3
2
1
0
Mean (
days)
20052007
Year

% of patients Scanned ≤2 days of admission (NHS QIS = 80%)
Hospital
100
80
60
40
20
0
Perc
enta
ge
20052007
Year

Brain scanning
• Most places with a scanner meet NHSQIS standards
• HTA review suggested immediate scan is most cost effective timing
• English strategy emphasises earlier scanning
• ? A case for changing the NHSQIS standard

Early aspirin use

Effect of two weeks of aspirin in acute ischaemic stroke
Treat 1000 patients
• 9 avoid recurrence
• 12 avoid death or dependency
• 10 more make a complete recovery

Effect of aspirin in acute stroke: hours from stroke onset

% of patients with Ischaemic event given Aspirin ≤2 days of admission
(NHS QIS Standard = 100%)
Hospital
100
80
60
40
20
0
Perc
enta
ge
20052007
Year

Almost everyone is improving?
• Protocol or ICP?
• Rapid scanning?
• No scanning?
• Immediate reporting or PACS on ward?
• Nurse prescription?

Blood pressure loweringafter stroke

PROGRESS - StrokeAll participants
Pro
por
tion
wit
h e
ven
t
Follow-up time (years)
28% risk reduction95%CI 17 - 38%
p<0.0001
0.00
0.05
0.10
0.15
0.20
0 1 2 3 4
PlaceboActive

% of stroke patients discharged alive on any anti-hypertensive medication
Hospital
100
80
60
40
20
0
Perc
enta
ge
20052007
Year

% of stroke patients discharged alive on any anti-hypertensive
medication
Hospital
100
80
60
40
20
0
Perc
enta
ge
20052007
Year

Why such variation in blood pressure lowering?
• Chance – low numbers?
• Different views on risks vs benefits?
• Preferring to start after discharge
• Different levels of co-morbidity?
• Presence or absence of protocols?
• Data collection?

Antiplatelet or anticoagulant treatment after ischaemic
stroke

Absolute effects of antiplatelet treatment - % with vascular
events
0
5
10
15
20
25
Acute stroke Secondary prevention
AntiplatletControl
Treat 100036 avoid event in 29 months
Treat 10009 avoid event in 2 weeks

% of Ischaemic patients discharged on Antiplatelet, Warfarin
Hospital
100
80
60
40
20
0
Perc
enta
ge
20052007
Year

% of Ischaemic patients discharged on Antiplatelet, Warfarin
Hospital
100
80
60
40
20
0
Perc
enta
ge
20052007
Year

Lowering cholesterol after ischaemic stroke


% discharged on statin
Hospital
100
80
60
40
20
0
Perc
enta
ge
20052007
Year

Warfarin for patients with ischaemic events and Atrial
Fibrillation

Effect on stroke risk in the randomised trials of warfarin vs aspirin in fibrillating patients
(Hart et al 1999)

% of Patients in AF discharged on Warfarin
Hospital
100
80
60
40
20
0
Perc
enta
ge
20052007
Year

Why such variation in Warfarin use?
• Chance – low numbers
• Different views on risks vs benefits
• Delaying treatment till after discharge
• Different levels of co-morbidity
• Variation in quality of anticoagulation service

Outpatients

High early risk of stroke after TIA
0
2
4
6
8
10
12
14
0 7 14 21 28
Days
Ris
k o
f st
roke
(%
)
OXVASC
OCSP
Lancet 2005; 366: 29-36
10% risk of stroke by 7 days

EXPRESS: Clinic-referred population
0
2
4
6
8
10
0 30 60 90
Days from medical attention
Ris
k o
f st
roke
(%
)
P<0.0001
Slow clinic
Same day clinic

Mean (days) from receipt of referral to examination
Hospital
50
40
30
20
10
0
Mean (
days)
20052007
Year

Patients with Days from receipt of referral to examination <14 days
– NHS QIS (80%)
Hospital
100
80
60
40
20
0
Perc
enta
ge
20052007
Year

Patients with Days from receipt of referral to examination <7 days - NHS QIS (80%)
Hospital
100
80
60
40
20
0
Perc
enta
ge
20052007
Year

How do you do it?
• Method of getting referrals?
• Management of clinic slots?
• Number of clinic slots – capacity?
• Informing patients of appointments

Delays in accessing Neurovascular clinic
• Is the NHSQIS standards of 14 days out of date?

Mean (days) from examination to 1st Carotid Duplex
Hospital
30
25
20
15
10
5
0
Mean (Days)
20052007
Year

Mean days from Examination to Brain Scan, for Scan done
Hospital
50
40
30
20
10
0
Mean (Days)
20052007
Year

NHS QIS swallowing
Karen Krawczyk

Reviewing NHS QIS standards

Plan
• Raise the standards to fit in with latest evidence and SIGN guidelines– Earlier scanning -? 80% in 1 day– Earlier access to SU - ? 80% in 1 day– Earlier access to Neurovascular clinics – 90% in 7 days– Target for thrombolysis– Targets for applying secondary prevention
• Publish revised criteria with SIGN guidelines in Dec 08
• Scope major revision to cover whole patient pathways – aim 2010

Consultation on the “Refreshed Stroke Strategy”

Future plans for audit
• ISD taking over management of audit
• Possible restructuring– Local data entry and storage as now but
download into central data repository– Allow local data analysis– Quality assurance and linkage easier– Easier maintenance of software

Other stroke related national audits
• SAIVMS – an audit of the management of Intracranial vascular malformations
• SCIP – using routine data to monitor survival after carotid intervention
• SHARE – a planned audit to monitor delivery of thrombolysis in Scotland

Scottish Hyperacute stroke Activity Register and Evaluation
(SHARE)
• Aims to monitor introduction of thrombolysis services in Scotland
• Funded by Scottish Government for 2 yrs• Lead by Peter Langhorne• Collect minimum dataset on each treated patient• Allow data entry by several means
– SSCAS– Web– SITS

Tea

Oxford, EnglandHenry Barnett
London, Ontario
MelbourneNovember, 2000
Carotid surgery


The vast majority of TIA patients do not get near a surgeon!
1000TIA patients
300recognised by GP
and referred tohospital
40with severe
stenosis
500present to
medical attention
250in the carotid
territory
30willing to takerisk of surgery

The effectiveness of surgery with increasing delays
32.7
16.0
11.2 9.413.8
3.4
0.0 -2.9
-20.0
-10.0
0.0
10.0
20.0
30.0
40.0
50.0
0-2 2-4 4-12 12+
Weeks between symptomatic event and randomisation
AR
R (
%),
95
% C
I
70-99% 50-69%

Number patients who had a Carotid Interventions performed in 2007
60
50
40
30
20
10
0
Num
ber
of patients

Mean number of days from event to Carotid Surgery
180
160
140
120
100
80
60
40
20
0
Mean (days)

Average delays (days) from event to surgery
0.0
20.0
40.0
60.0
80.0
100.0
120.0
ARI
Ninewel
ls PRI
Straca
thro
Tays
ide O
ther
sou
rces RIE
St Joh
nsW
GH
RI-G
Stobh
illW
I-GSGH
IRH
RAH Ayr
Cross
house
Hairm
yres
Forth
Valle
y
Borde
rsDGRI
Raigm
ore
QMH
VH, Kirk
caldy
Scotla
nd
Me
dia
n d
ela
y (
da
ys
)
seen to op
referral to seen
exam to referral
event to exam

Reducing delays to surgery in Lothian
17 19
7 4
77
32
14 11
9
6
9
20
8
8
0
10
20
30
40
50
60
2004 2005 2006 2007
Year
Med
ian
del
ay (
day
s)
Event to exam Exam to ref Ref to seen Seen to surg

Reducing the delays to carotid surgery
• Reducing delays to TIA assessment• Streamline investigation
– Same day confirmatory scan for significant stenosis– Agreed protocol with surgeons
• Faxed referrals• Involving enough surgeons to ensure capacity• Appropriate surgical prioritisation

Percentage of patients who Survived 30 days from intervention
100
80
60
40
20
0
Hospital
Perc
enta
ge
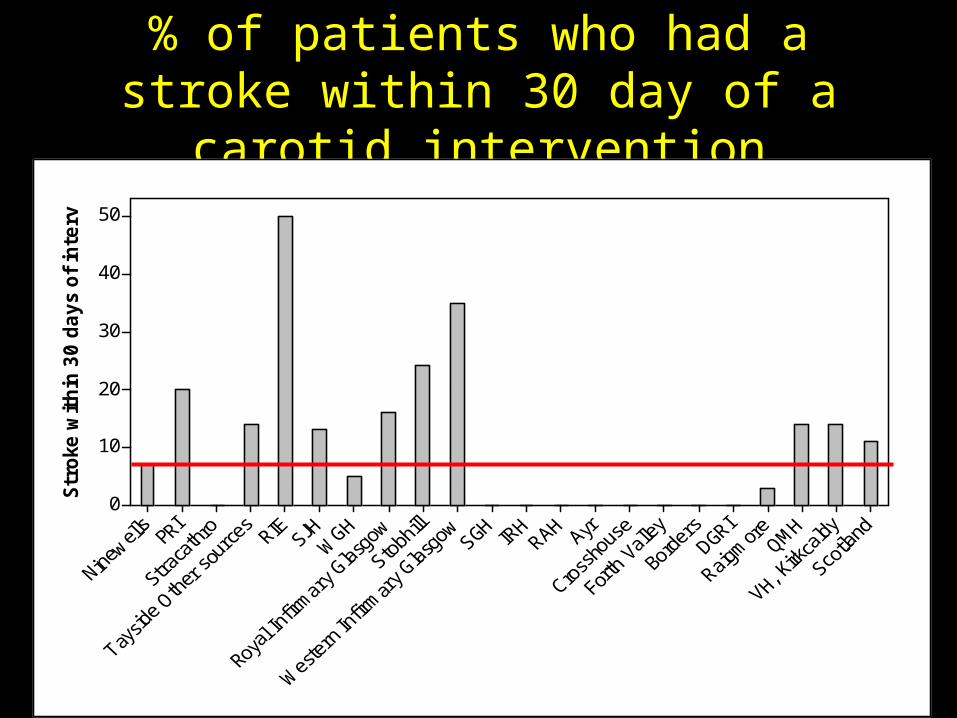
% of patients who had a stroke within 30 day of a carotid intervention
50
40
30
20
10
0
Str
oke
within
30 d
ays
of in
terv

Scottish Carotid Interventions Project (SCIP)
• Partnership between ISD and vascular surgeons
• Use of routine data to monitor survival after surgery
• Can link operations to subsequent events but accuracy unclear
• Aims to improve data quality over several cycles

Carotid endarterectomy
• Should we continue to monitor delays?
• Should we monitor outcomes?
• What is happening in rest of UK?– UK Carotid Endarterectomy Audit
• Should we set NHSQIS standard– 80% operated within 30 days of referral to
neurovascular services?– Median delay should be <20 days?

Other Issues
• Good to include audits of– all NV clinics– Thrombolysis– Carotid endarterectomy– Other aspects of care?
• Do we have the resources to do all of this?

Other Issues
• Should the final report contain a commentary on the results?

Learn more about stroke
Free on line e-learning resource
www.strokecorecompetencies.org


Percentage of Ischaemic patients discharged on a Statin or in a
relevant Trial
Hospital
100
80
60
40
20
0
Perc
enta
ge
20052007
Year


