Leapfrog Enterprises Inc. November 14, 2013 Yi Liu, Ye Liang, Charalampos Ntantanis, Caleb Pierson.
31
Leapfrog Enterprises Inc. November 14, 2013 Yi Liu, Ye Liang, Charalampos Ntantanis, Caleb Pierson
-
Upload
hortense-walsh -
Category
Documents
-
view
216 -
download
3
Transcript of Leapfrog Enterprises Inc. November 14, 2013 Yi Liu, Ye Liang, Charalampos Ntantanis, Caleb Pierson.
Leapfrog Enterprises Inc.
November 14, 2013
Yi Liu, Ye Liang, Charalampos Ntantanis, Caleb Pierson

Agenda• Company Background
• Current Position
• Macroeconomic Outlook
• Industry Overview
• Financial Analysis
• Valuation
• Recommendation
Current Position
• RCMP recommended for purchase 2000 shares @ market (8.20) which resulted in buying 2000 shares @ $8.19 on April 5, 2013
• Current Stock price is $8.13
• This is an unrealized loss of 0.73%

Macroeconomic Outlook• World (and U.S.) population is growing across the
toy consumer age range• Dollars spent on toys increased 7.68% from 2007
to 2012• Youth electronics decreased slightly from 2011 to
2012• Nostalgic/Retro toys are making a big push this
year
• The Consumer Sentiment Index is at the lowest point since 2011
Bloomberg News and Toy Industry Association Inc.

Industry Overview• The U.S. Toy market was worth $22 billion in 2012
• Industry products include dolls/action figures, models, construction kits, scooters, board games, game consoles
• Small companies are able to compete alongside larger businesses by focusing on niche products and by reacting more quickly to new trends
Source: Hoovers
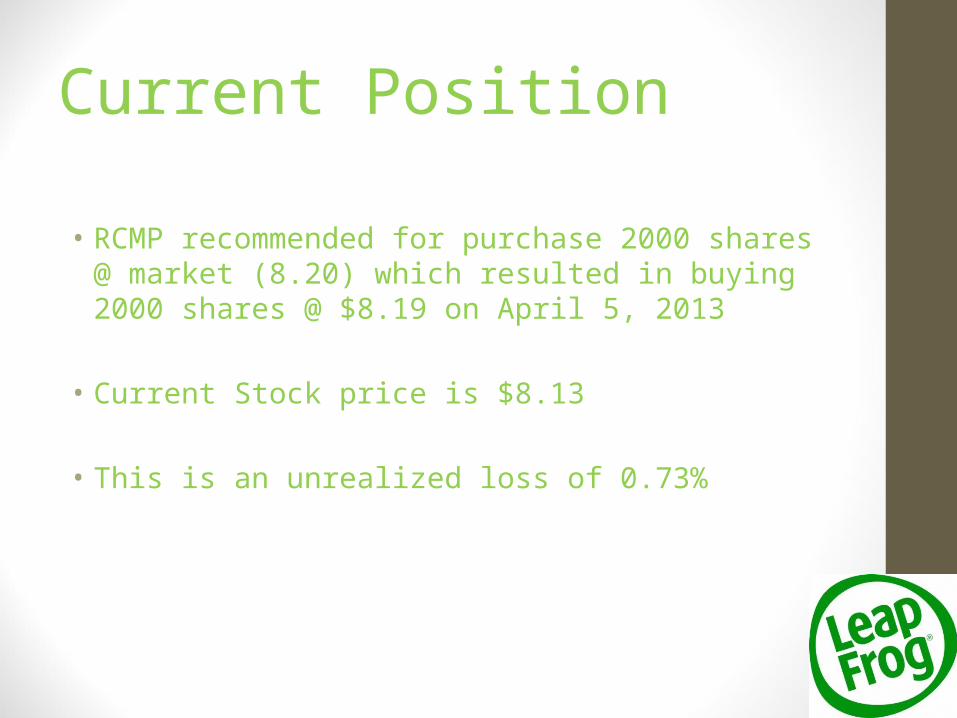
5 Forces for Toys and Games
Source: Marketline
Source: Marketline
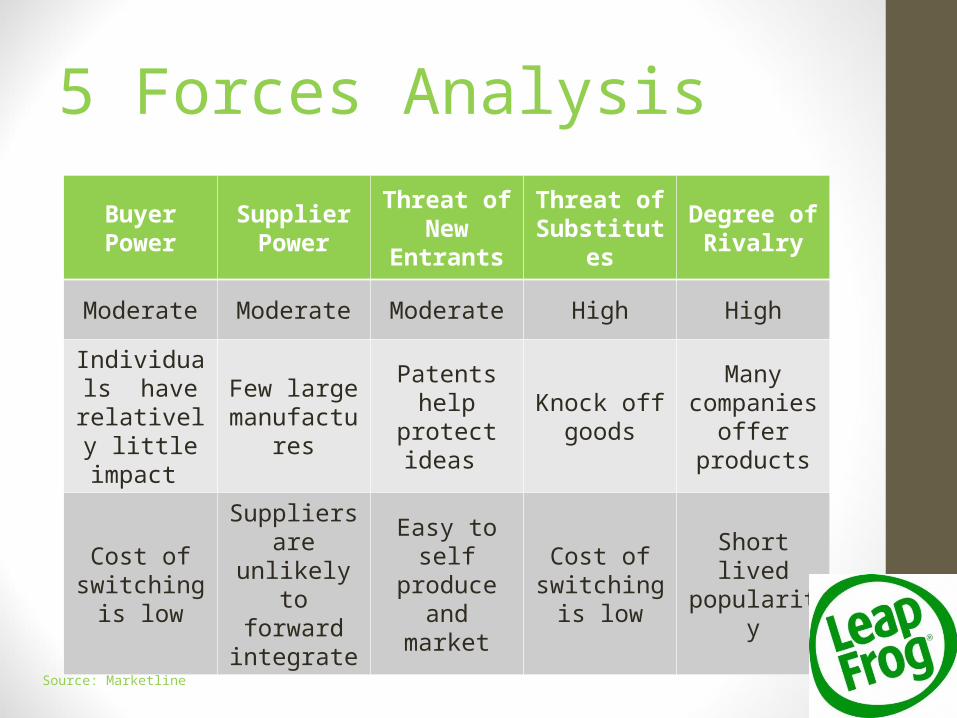
5 Forces Analysis
Buyer Power Supplier Power
Threat of New
Entrants
Threat of Substitutes
Degree of Rivalry
Moderate Moderate Moderate High High
Individuals have
relatively little impact
Few large manufacture
s
Patents help protect ideas
Knock off goods
Many companies
offer products
Cost of switching is
low
Suppliers are unlikely to
forward integrate
Easy to self produce and
market
Cost of switching is
low
Short lived popularity

Company Overview• Leapfrog trades on the NYSE with
ticker symbol LF
• Company was founded in 1995 by Michael Wood and Robert Lally and headquartered in Emeryville, California USA
• Focus: Educational Entertainment for Children
• Employees: 552 people on a full-time basis
Source: Company Website and 2012 10k
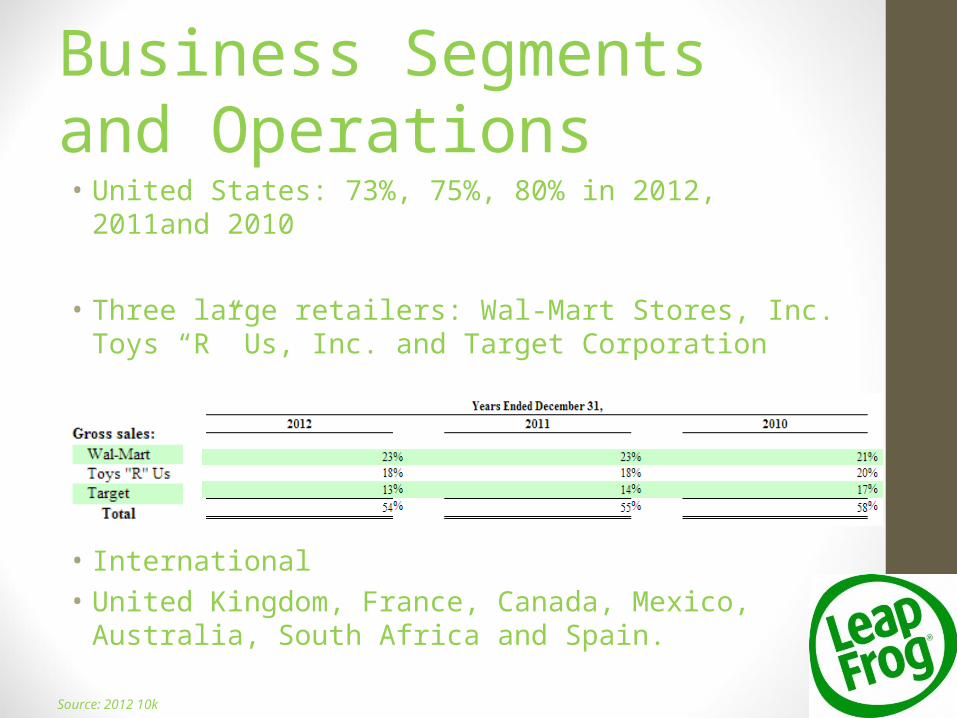
Business Segments and Operations• United States: 73%, 75%, 80% in 2012, 2011and
2010
• Three large retailers: Wal-Mart Stores, Inc. Toys “R” Us, Inc. and Target Corporation
• International• United Kingdom, France, Canada, Mexico,
Australia, South Africa and Spain.
Source: 2012 10k

Product Portfolio
Source: Company Website

Product Portfolio• Currently sell 2 versions of LeapPad, 2 hand held
computers (GS and the Explorer), 2 sets of eBooks (Tag and the Tag junior), learning toys, and iPhone and iPad apps
• LeapPads -- $120• GS and Explorer -- $70• eBooks -- $25 to $170 bundles• Toys -- $10 to $25• Apps -- $0.99
Source: Company Website
Risk Factors• Highly seasonal – Approximately 75% of total
sales to retailers to occur during the third and fourth quarters.
• Growing strategic focus on online products and services – Depends on consumer acceptance
• Rely on a limited number of manufactures
• Liquidity maybe insufficient to meet the long-term or periodic needs

Seasonality
Source: 2012 10k
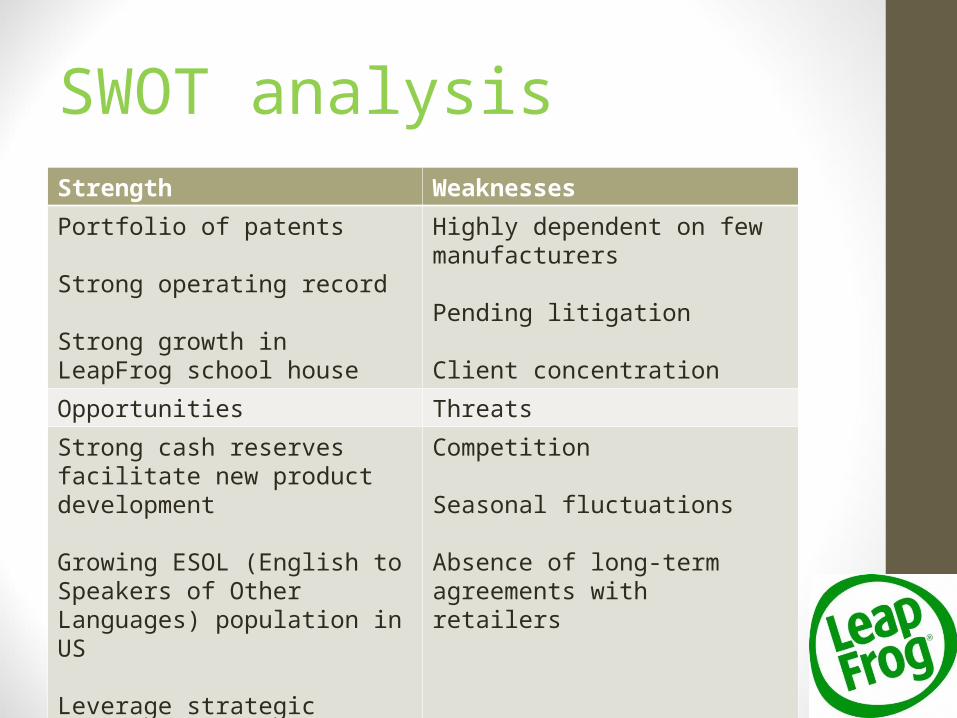
SWOT analysisStrength Weaknesses
Portfolio of patents
Strong operating record
Strong growth in LeapFrog school house
Highly dependent on few manufacturers
Pending litigation
Client concentration
Opportunities Threats
Strong cash reserves facilitate new product development
Growing ESOL (English to Speakers of Other Languages) population in US
Leverage strategic relationships
Competition
Seasonal fluctuations
Absence of long-term agreements with retailers
Management Outlook• A number of changes to executive management
team during 2012 and 2011
• Anticipate continued business growth at a pace ahead of the market with net sales expected to increase at high single –digit percentage growth rate
• Plan to make long-term investments in content, international expansion, online communities, systems and new platforms
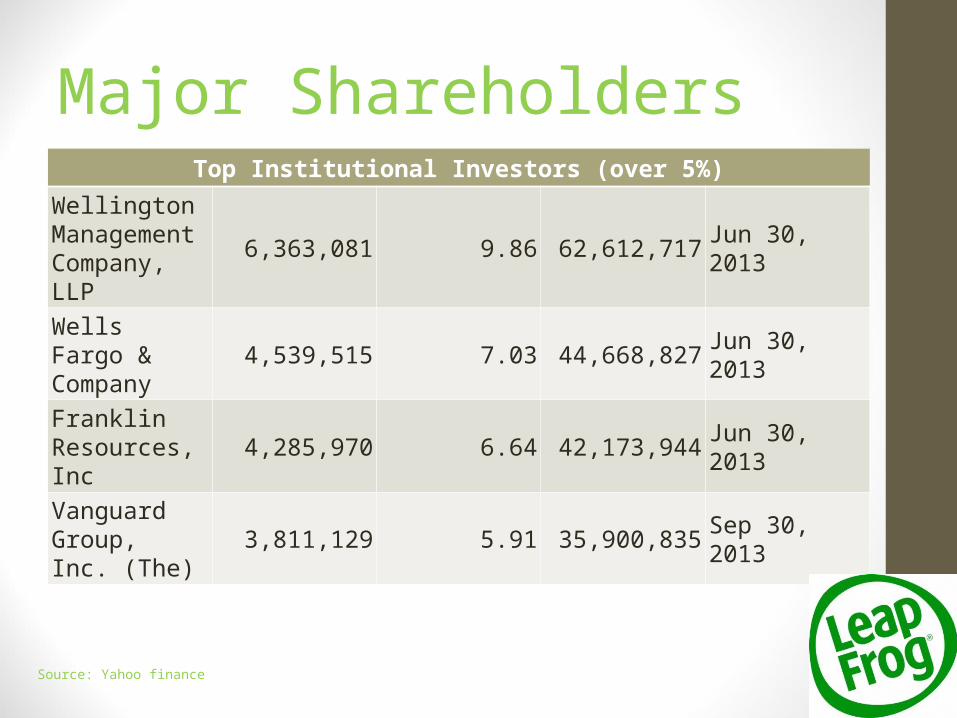
Major ShareholdersTop Institutional Investors (over 5%)
Wellington Management Company, LLP
6,363,081 9.86 62,612,717 Jun 30, 2013
Wells Fargo & Company 4,539,515 7.03 44,668,827 Jun 30, 2013
Franklin Resources, Inc 4,285,970 6.64 42,173,944 Jun 30, 2013
Vanguard Group, Inc. (The)
3,811,129 5.91 35,900,835 Sep 30, 2013
Source: Yahoo finance

Major ShareholdersTop Mutual Fund Holders
Franklin Templeton-Templeton Global Smaller Companies Fund
2,663,380 4.13 25,089,039 Sep 30, 2013
Templeton Global Smaller Companies Fund, Inc. (USA)
2,663,380 4.13 25,621,715 Aug 31, 2013
Oppenheimer Global Opportunities Fund
2,500,000 3.87 24,600,000 Jun 30, 2013
Wells Fargo Advantage Discovery Fd
2,254,800 3.49 21,691,176 Aug 31, 20
• Well known financial institutions
Source: Yahoo finance

Key People
• Mr. John Barbour, Chief Executive Officer, Director and Member of Non-executive Officer Stock Award Committee
• Raymond L. Arthur, Chief Financial Officer
• Gregory B. Ahearn, Chief Marketing Officer and Executive Vice President
Source: Businessweek
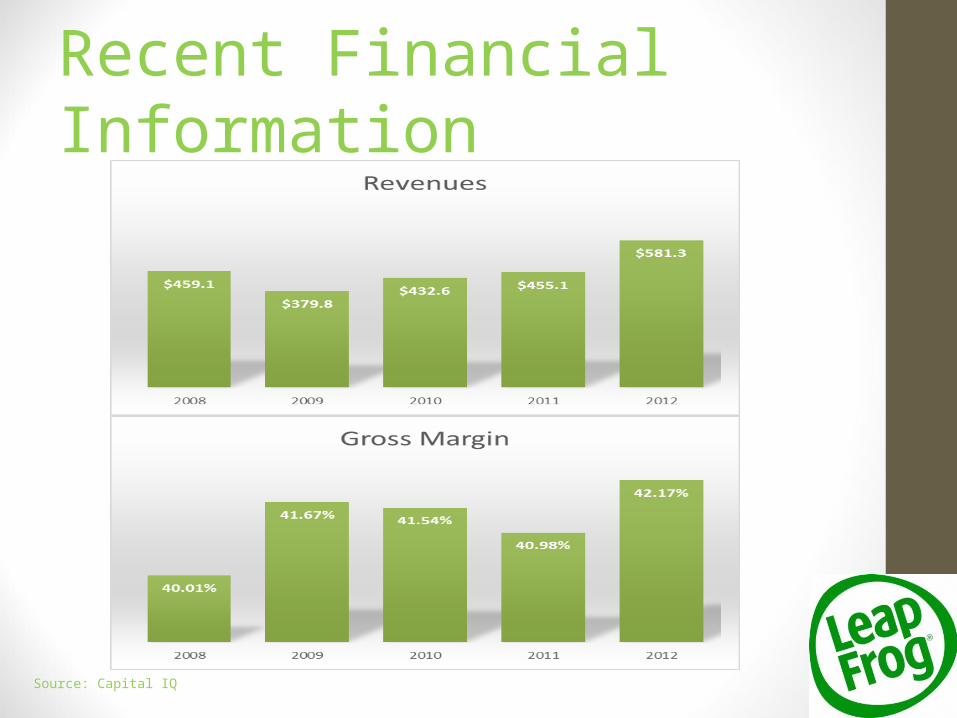
Recent Financial Information
Source: Capital IQ

Recent Financial Information
Source: Capital IQ

Financial Analysis2008 2009 2010 2011 2012
Current Ratio 240.2% 250.8% 321.4% 319.3% 389.2%
Quick Ratio 183.2% 222.2% 256.4% 279.1% 345.4%
Cash Ratio 79.2% 62.7% 26.7% 84.2% 130.5%
Inventory Turnover Ratio 483.7% 786.2% 532.9% 783.5% 834.0%
Days Supply of Inventory 75.47 46.43 68.50 46.59 43.77
A/R Turnover 510.5% 257.7% 274.4% 289.1% 322.9%
Days Sales Outstanding 71.49 141.62 133.02 126.24 113.05
Liquidity Ratios

Financial Analysis
2008 2009 2010 2011 2012
Total Asset Turnover 150.0% 124.1% 147.4% 137.5% 135.5%
Fixed Asset Turnover 2340.8% 2662.1% 2872.5% 2545.4% 2450.3%
Asset Management Efficiency Ratios
Financial Analysis
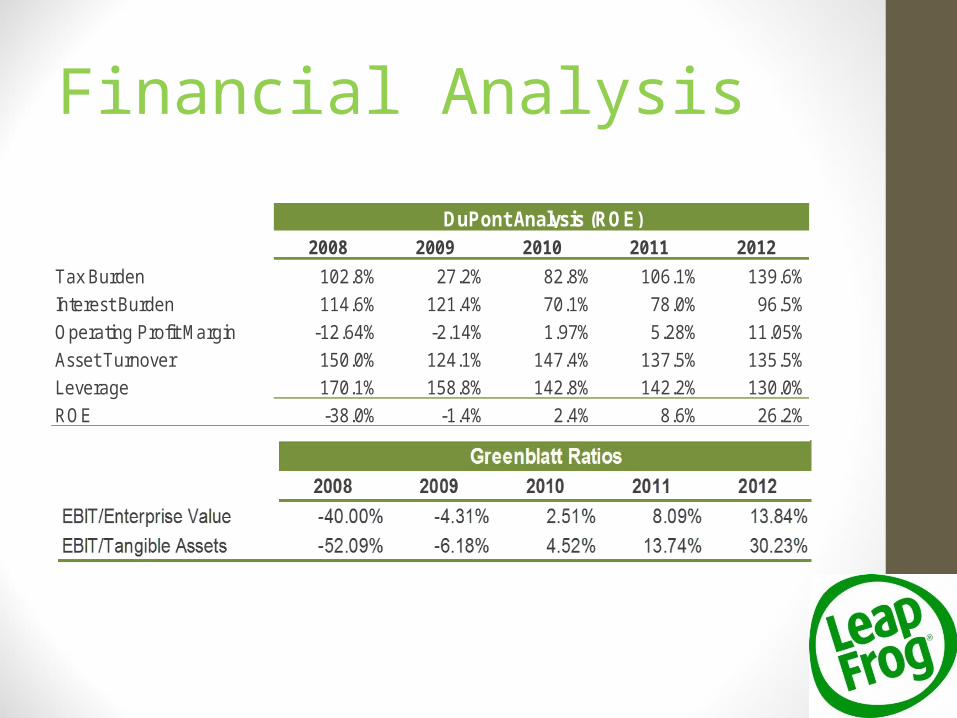
2008 2009 2010 2011 2012
Tax Burden 102.8% 27.2% 82.8% 106.1% 139.6%
Interest Burden 114.6% 121.4% 70.1% 78.0% 96.5%
Operating Profit Margin -12.64% -2.14% 1.97% 5.28% 11.05%
Asset Turnover 150.0% 124.1% 147.4% 137.5% 135.5%
Leverage 170.1% 158.8% 142.8% 142.2% 130.0%
ROE -38.0% -1.4% 2.4% 8.6% 26.2%
DuPont Analysis (ROE)

Recent Stock Performance
Source: Capital IQ, Yahoo Finance
Metric ValueCurrent Price $8.13
Trailing P/E 7.03
Forward P/E 20.64
Market Cap ($mil) $560.32
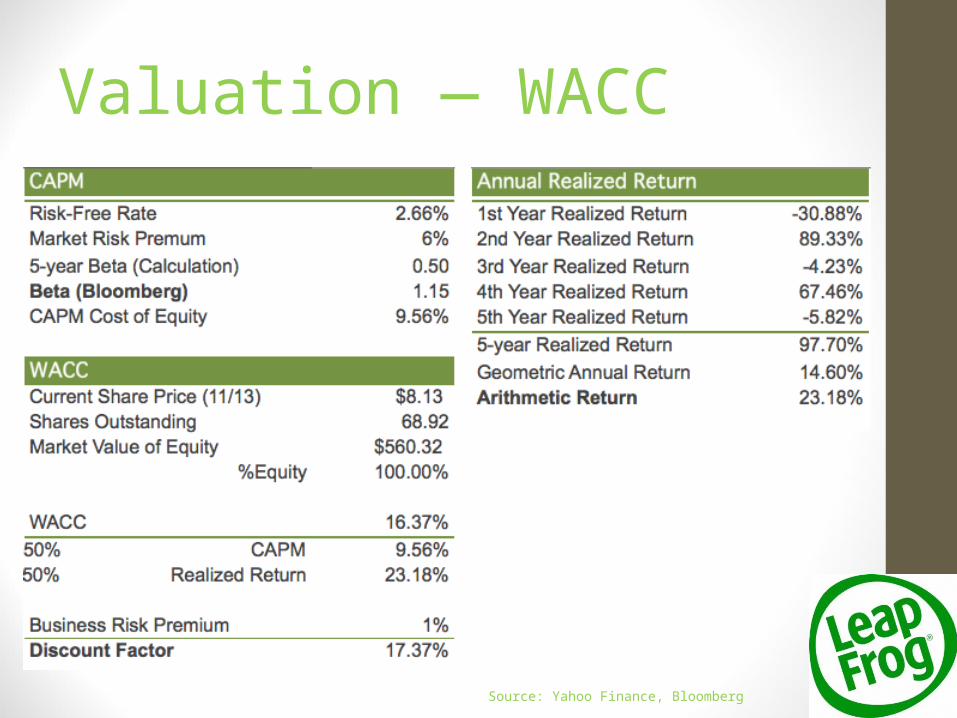
Valuation — WACC
Source: Yahoo Finance, Bloomberg

Valuation — DCF
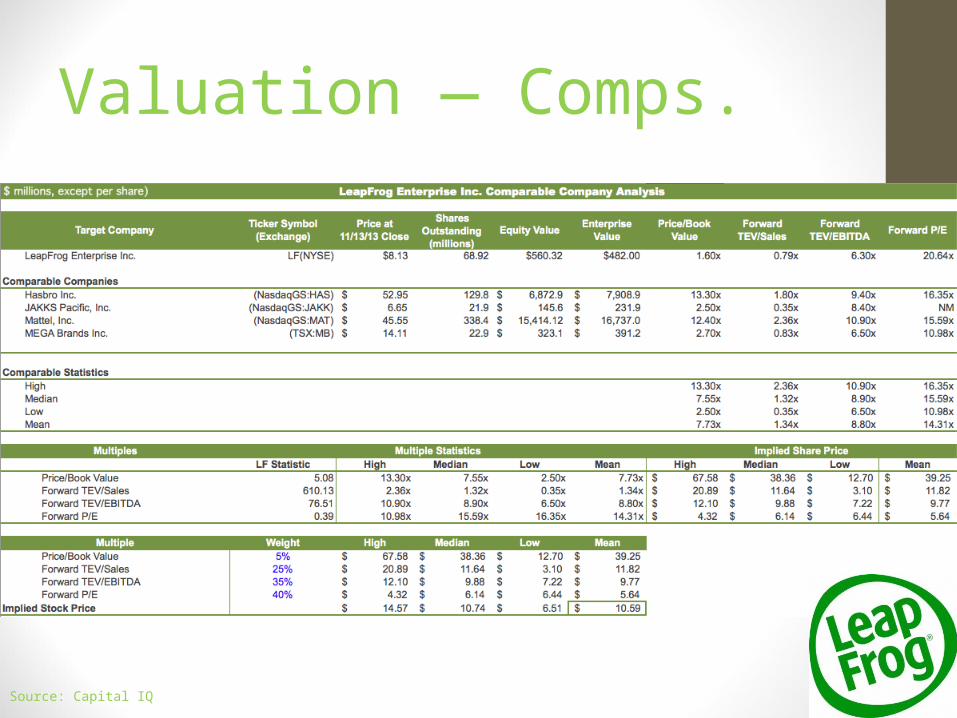
Valuation — Comps.
Source: Capital IQ
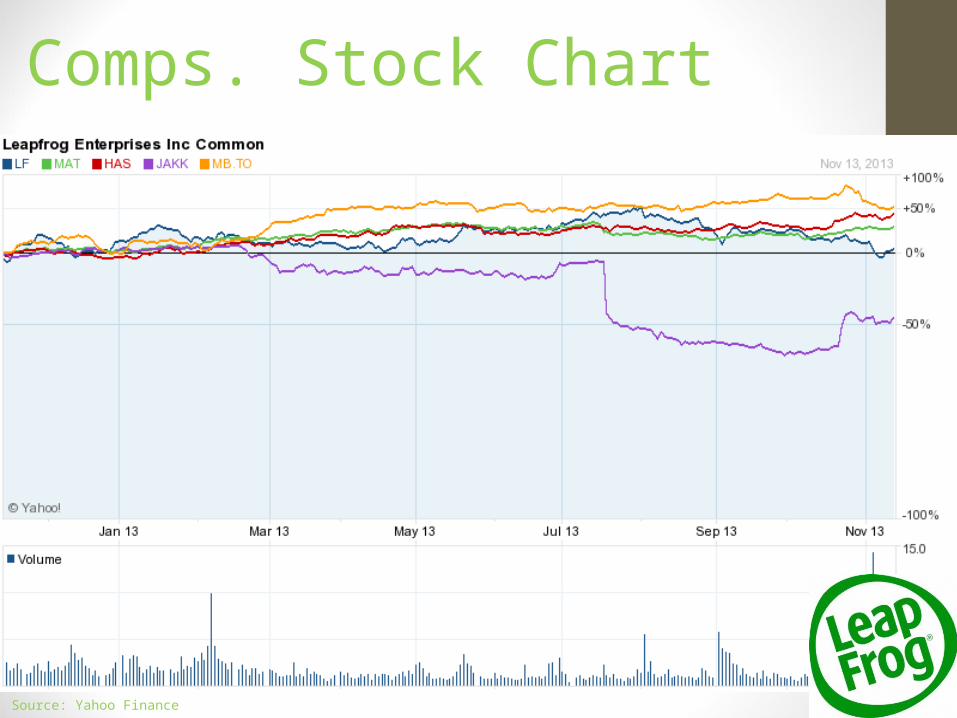
Comps. Stock Chart
Source: Yahoo Finance
Decision Drivers
• Strengths• Climbing Revenues • Strong Cash Position• Highly specialized• DCF ($8.57)
• Concerns• Raising competition from big players• Seasonal fluctuations

Recommendation
Hold

Questions?