Lean Six Sigma Projects & Value Stream Mapping in Action!
42
Lean Six Sigma Lean Six Sigma Projects & Value Projects & Value Stream Mapping in Stream Mapping in Action! Action! CPT Sylvia Beady CPT Sylvia Beady Chief, Ancillary Services Chief, Ancillary Services R.W. Bliss Army Health Center R.W. Bliss Army Health Center Ft. Huachuca, AZ Ft. Huachuca, AZ
-
Upload
hope-munoz -
Category
Documents
-
view
38 -
download
0
description
Lean Six Sigma Projects & Value Stream Mapping in Action!. CPT Sylvia Beady Chief, Ancillary Services R.W. Bliss Army Health Center Ft. Huachuca, AZ. Objectives. An introduction to the basic definition and steps of Lean Six Sigma (LSS) - PowerPoint PPT Presentation
Transcript of Lean Six Sigma Projects & Value Stream Mapping in Action!

Lean Six Sigma Projects & Lean Six Sigma Projects & Value Stream Mapping in Value Stream Mapping in
Action!Action!
CPT Sylvia BeadyCPT Sylvia BeadyChief, Ancillary ServicesChief, Ancillary Services
R.W. Bliss Army Health CenterR.W. Bliss Army Health CenterFt. Huachuca, AZFt. Huachuca, AZ

ObjectivesObjectives
An introduction to the basic definition and An introduction to the basic definition and steps of Lean Six Sigma (LSS)steps of Lean Six Sigma (LSS)
An overview of how the LSS tools works in An overview of how the LSS tools works in other part of the healthcare services other part of the healthcare services besides the laboratory (i.e. radiology & besides the laboratory (i.e. radiology & pharmacypharmacy
A live demonstration of value stream A live demonstration of value stream mapping (VSM) simulationmapping (VSM) simulation

Basic Definitions: The Keys to LSSBasic Definitions: The Keys to LSS

Example 1Example 15S Overview: Taking Action!5S Overview: Taking Action!
SortSort Set in Order Set in Order
(simplified)(simplified) Shine (sweep)Shine (sweep) StandardizeStandardize SustainSustain Anchoring Success in the Lab

Anchoring Success
Shipping Lean Six Sigma Shipping Lean Six Sigma – Improving Efficiencies– Improving Efficiencies

To create and maintain an organized, To create and maintain an organized, clean, safe, and high-performance clean, safe, and high-performance workplaceworkplace
PURPOSE:PURPOSE:

Why Implement 5S?Why Implement 5S? Enables anyone to distinguish between Enables anyone to distinguish between
normal & abnormalnormal & abnormal It’s the foundation for continuous It’s the foundation for continuous
improvement, zero defects, cost improvement, zero defects, cost reduction & safe work areareduction & safe work area
It’s a systematic way to improve the It’s a systematic way to improve the workplace, processes, & products workplace, processes, & products through employee involvementthrough employee involvement
Minimize Minimize Non-Value AddedNon-Value Added:: eliminate eliminate waste that does not add value to the waste that does not add value to the process or productprocess or product

What is ”Value What is ”Value Added”Added”
Value Added:Value Added: any activity that any activity that increasesincreases the the form or function of the product. (These are form or function of the product. (These are things the customer is willing to pay for)things the customer is willing to pay for)
Non-Value Added:Non-Value Added: any activity that does not any activity that does not add value to the form or function or is not add value to the form or function or is not necessary. necessary. Customer is not willing to pay for non-value added.Customer is not willing to pay for non-value added. Non-value added activities should be eliminated Non-value added activities should be eliminated
simplified, reduced or integrated into other activitiessimplified, reduced or integrated into other activities

1S: SORT1S: SORTGoal:Goal: Remove all items from the Remove all items from the workplace that are not needed for workplace that are not needed for current production or taskscurrent production or tasks
It does It does notnot mean that you remove mean that you remove only the items that you know you will only the items that you know you will never neednever need
It does It does notnot mean that you simply mean that you simply arrange things in a neater fashionarrange things in a neater fashion
When you sort, you leave only the When you sort, you leave only the bare essentials – “When in doubt, bare essentials – “When in doubt, move it out”move it out”

The goal is to Set in Order:The goal is to Set in Order:
Ensures what is needed for a Ensures what is needed for a job is in place and easy to job is in place and easy to find, use, and put back!find, use, and put back!
• Find ways to prevent Find ways to prevent the need for future the need for future cleaning!cleaning!
2S: SET IN ORDER:2S: SET IN ORDER:

Cleanliness: get the area looking clean and new
Make it a habit:Make it a habit:
Assign responsibilities
Make cleaning and organizing part of regular work duties
Perform regular 5S audits and post results
Prevention (take it to the next level): Prevention (take it to the next level): Make it difficult to Make it difficult to NOTNOT put things away put things away
3S: SHINE3S: SHINE

Goal: Creating a consistent way of implementing the tasks performed daily, including Sort, Set in order, & Shine.
It should be obvious at a glance when an item is not in its designated place
Doing “the right things the right way, every time”
4S: STANDARDIZE4S: STANDARDIZE

This takes discipline on everyone’s part. Sustain, make it a habit to follow the procedures
Practice, practice, practice!Practice, practice, practice!
Teamwork! Personal Teamwork! Personal accountability!accountability!
““Sustain” ties Sort, Set in Sustain” ties Sort, Set in order and Shine together.order and Shine together.
5S: SUSTAIN5S: SUSTAIN

With 5S, ANYONE should be able to tell With 5S, ANYONE should be able to tell the difference between normal & abnormalthe difference between normal & abnormal
Celebrate accomplishment & continue Celebrate accomplishment & continue improvingimproving
Make time each week to brainstorm & Make time each week to brainstorm & implement improvement suggestionsimplement improvement suggestions
SUMMARYSUMMARY

Example 2:Example 2: DMAIC DMAIC
Define – Measure – Analyze – Improve Define – Measure – Analyze – Improve – Control (DMAIC)– Control (DMAIC)
A structured, data-based problem-A structured, data-based problem-solving process. That meanssolving process. That means
Doing specific activities in a specific Doing specific activities in a specific sequence (that’s the “structured” & sequence (that’s the “structured” & “process” parts“process” parts
Gathering data in nearly every phase to Gathering data in nearly every phase to help you make decisions (the “data-help you make decisions (the “data-based” part)based” part)
Making sure that the solutions your Making sure that the solutions your team decides to use will eliminate the team decides to use will eliminate the cause of the problem you’re trying to fix cause of the problem you’re trying to fix (the “problem-solving” part)(the “problem-solving” part)
Tracking TAT in Radiology

Radiology Unverified ReportsRadiology Unverified Reports Turn-around Time (TAT) Turn-around Time (TAT)

Unverified Reports TATUnverified Reports TAT
Objective:Objective:
Benefits:Benefits:
Project Project Team:Team:
Schedule:Schedule:
The purpose of this project is to improve the unverified reports TAT within SOP guidelines of 3 working days. Providers and Patients will receive timely reports and minimize delays in patient care.
Chief, Ancillary ServicesAssistant Chief, Ancillary ServicesNCOIC RadiologyRadiologistsRadiology Technician
Measurement: In progress Measurement: In progress Analyze: TBDAnalyze: TBD
Improvement: TBDImprovement: TBD Control: TBD Control: TBD
D M A I C

Baseline Data Baseline Data D M A I C
Base line information
1434 – unverified studies
140 – unread
12 dictated status
Data period: 11/1/02 – 9/30/06
FY07 unverified status are tracked separately

High Level Map Project OutputHigh Level Map Project OutputD M A I C

Low Level Process MapLow Level Process Map (1 of 2)(1 of 2)
D M A I C

Radiology Study Process(With Severity Scores)
HCP orders a study
HCP send Pt to Rad
Pt shows up @ Rad
Rad staff check-in
Pt
Rad staff checks
validity of order
Return to HCP via
telephone
Rad staff determines if exam is done T or
sched
Pt rec’d prep info & scheduled
Pt examined
No
Yes
NoYes
BB: CPT Beady
Tech or Clerk takes Pt to exam
Rm
Images Taken
Process Images
QC Check
Not O.k.
O.k.
Retake
Images sent to Radiologist
Radiologist checks validity
Start
Not O.k.
O.k.Radiologist Evaluate Film
Return to step 1
Priors Needed (this is standard)
No
Yes Tech request prior images from
originating facility
Proceed to Radiologist read films
Prior images received
Yes
No
Sub Process for later
A
A
Radiologist reads & dictate films/
reviews priors
Fwd to transcription for editing of texts
(dictation)
Radiologist receives, reviews, corrects, & electronically signs
Power-scribe sends completed rpt to CHCS & AHLTA
Power-scribe sends alert to ordering HCP
HCP reviews report
Stop
•Pt may not show (1)
• Pt may show w/o order (2)
• non-valid order (3)
•What % problem? 1-2%
• ~30/month on average (4)
• 98-99%
• ~10% found invalid by Radiologist
• only 2 cassette readers (5)
• 1 down- slows down process
• TAT (7)
• non-responsive facilities
• delay in treatment/diagnosis
• occasional problem w/ upload (5)
• HCP notification
• DINPACS, CHCS, AHLTA
• checks & balance in place (7)
• outside script

Low Level Process MapLow Level Process Map (2 of 2)(2 of 2)D M A I C

Measure Phase – Data CollectionMeasure Phase – Data Collection (1 of 2) (1 of 2)
D M A I C

Measure Phase – Data CollectionMeasure Phase – Data CollectionD M A I C
Note: FY07 Tracking data; no decrease in baseline data report between Nov 2002 – Sep 2006

Analyze Phase - StatusAnalyze Phase - StatusD M A I C

Example 3:Example 3: Lean + Six Sigma Lean + Six Sigma
• Process Flow Process Flow
• DMAIC DMAIC
Fishing for Success in Pharmacy

Baseline GOAL units
Wait Time 25 90 %
Satisfaction Survey Report 36 90 %
Project Y’s
Purpose:
Improve efficiency in pharmacy, wait time and patient satisfaction report card
Project Goal: 90% improvement in wait time within 30
minutes90% patient satisfaction survey report card

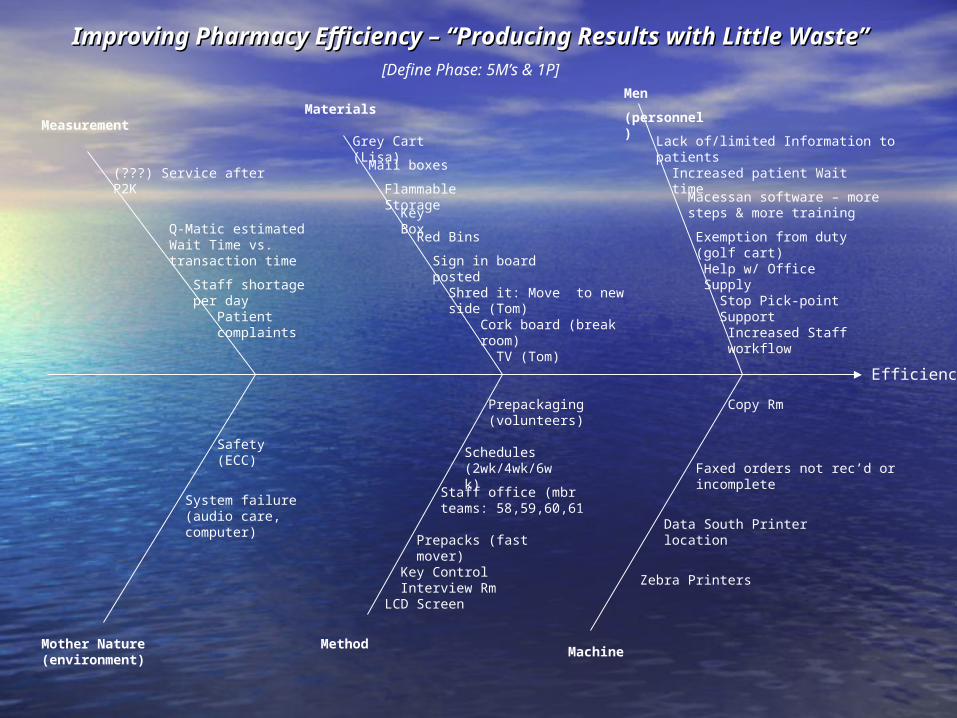
FishboneFishbone
Define Phase: Define Phase:
Efficiency
Method
Lack of/limited Information to patients
TV (Tom)
Increased patient Wait time
Improving Pharmacy Efficiency – “Producing Results with Little Waste”Improving Pharmacy Efficiency – “Producing Results with Little Waste”[Define Phase: 5M’s & 1P]
Grey Cart (Lisa)
Key Box
Flammable Storage
Red Bins
Shred it: Move to new side (Tom)
Key Control Interview Rm
Mother Nature (environment)
Copy Rm
Q-Matic estimated Wait Time vs. transaction time
Data South Printer location
Zebra Printers
Machine
Help w/ Office Supply
Stop Pick-point Support
Exemption from duty (golf cart)
Prepackaging (volunteers)
Materials
(???) Service after P2K
Safety (ECC)
Prepacks (fast mover)
Men
(personnel)
LCD Screen
Mail boxes
Schedules (2wk/4wk/6wk)
Sign in board posted
Staff office (mbr teams: 58,59,60,61
Cork board (break room)
Measurement
Faxed orders not rec’d or incomplete
Macessan software – more steps & more training
Staff shortage per day
Patient complaintsIncreased Staff workflow
System failure (audio care, computer)

Current Current Process Process FlowFlow
Lean Tool Box:Lean Tool Box:

Process Observation:

Process Flow chart:

Window #3Window #1 Window #2 Window #4 Window #5 Window #6
Ba
ker
Ce
llDoor
Admin Area
Supply Office
Sterile Room
Staff Work Stations
Rx
Sh
elf
Fill
Sta
tion
Rx
Sh
elf
Fa
x
Rx
Sh
elf
Rx
Sh
elf
Rx Shelf Rx Shelf
Rx
Sh
elf
Rx
Sh
elf
Rx
Sh
elf
Fill S
tation
1
3
2
4
5
6
7
8
Refill Refill
2
13
Refill B
ins
Refill Bins
2
1
3
4
5
6
Box Plot Box Plot Chart & Chart & FMEA FMEA
Analyze Phase: Analyze Phase: Note: Measure Note: Measure
Phase used C&E Matrix – similar to RadiologyPhase used C&E Matrix – similar to Radiology

Week
Day
Wait Time
Fri
Thur
Wed
Tues
Mon
1:30:001:00:000:30:000:00:00 1:30:001:00:000:30:000:00:00
Fri
Thur
Wed
Tues
Mon
Fri
Thur
Wed
Tues
Mon
1:30:001:00:000:30:000:00:00 1:30:001:00:000:30:000:00:00
7:00 8:00 9:00 10:00
11:00 12:00 13:00 14:00
15:00 16:00 17:00
Panel variable: Hour
Sept 2006 Wait Time vs Week Day
Analyze: Wait Time vs. Week Day Analyze: Wait Time vs. Week Day

CHCS-Volume Summary Report
Mon Mon
Tue
Tue
Wed
Wed
ThurThurFri
Fri
0500
100015002000250030003500
Jul Aug
Main
To
tal # R
x
Wait Time
Fre
qu
en
cy
120100806040200
35
30
25
20
15
10
5
0120100806040200
Morning Afternoon
Pharmacy Wait Time by Time of Day
Q-Matic Daily Category
August 2006
Wait Time
Fre
qu
en
cy
120100806040200
50
40
30
20
10
0
Pharmacy Wait TimeAugust 2006
Q-Matic Daily Category
Area to improveLongest wait time

Failure Mode & Effects Analysis

Key Key Points Points
Improve Phase: Improve Phase:

Processes Under Improvement:
CommunicationOrganizationStaff involvement/awarenessOverall wait times

Example 4Example 4VSM SimulationVSM Simulation

QUESTIONS….QUESTIONS….

References:References:
George, M., Rowlands, D., Kastle B. What George, M., Rowlands, D., Kastle B. What is Lean Six Sigma? 2004 George Groupis Lean Six Sigma? 2004 George Group
Phillips Corporation presentationPhillips Corporation presentation