Lean Logistics & Supply Chain Optimization - CITT - Lean - Feb 11.pdfLean Logistics & Supply Chain...
35
1 Lean Logistics & Supply Chain Optimization Webinar Presented by eZsigma Group, Toronto, Ontario February 11, 2015
Transcript of Lean Logistics & Supply Chain Optimization - CITT - Lean - Feb 11.pdfLean Logistics & Supply Chain...

1
Lean Logistics & Supply Chain Optimization
Webinar Presented by eZsigma Group, Toronto, Ontario February 11, 2015

2
• Review: Introduction to Lean principles
• Defining value • The five key principles of Lean • The “eight wastes”
• Mapping the value stream
• Identifying constraints to flow and value creation
• Introduction to Lean improvement tools and methods to eliminate identified constraints
Key Learning Objectives
©2015 Salescorp Inc. Reproduction in whole or in part without the expressed written consent of Salescorp Inc. is strictly prohibited.

3
“With slow revenue growth in mature markets, the supply chain must create sustainable cost savings to support margins and to help pay for growth elsewhere.”
“The supply chain must enhance its core competency to become a strategic business enablement vehicle to drive top-line growth.”
• Reconfiguring the supply chain to create cost competitiveness
• Optimizing global spend
• Improving operational agility and responsiveness
• Managing environmental and sustainability expectations
• Establishing an effective supply chain model and infrastructure
• Enabling new revenue sources
• Managing operational, tax and regulatory risk
The Opportunity… The Challenge
“Source: “Driving improved supply chain results”, Ernst & Young 2011
Revenue growth next 3 years
©2015 Salescorp Inc. Reproduction in whole or in part without the expressed written consent of Salescorp Inc. is strictly prohibited.

4
“Lean is an enabler to identify optimal value for the customer and the value stream for each product. Lean focuses on eliminating wasteful activities and creating smooth product and process flow, allowing for an effective pull system. As a mindset, culture, and toolkit, lean is applicable to all organizational areas such as product development, production, purchasing, and customer support. A lean environment requires dedication from all team members and understands that the path to perfection is a never-ending journey.”
• A systematic method of identifying and eliminating wasteful activities in the supply chain in order to increase product flow and speed and reduce overall costs.
Lean Logistics
Source: http://www.transfreight.com/Lean_Logistics_Overview.aspx
©2015 Salescorp Inc. Reproduction in whole or in part without the expressed written consent of Salescorp Inc. is strictly prohibited.
5
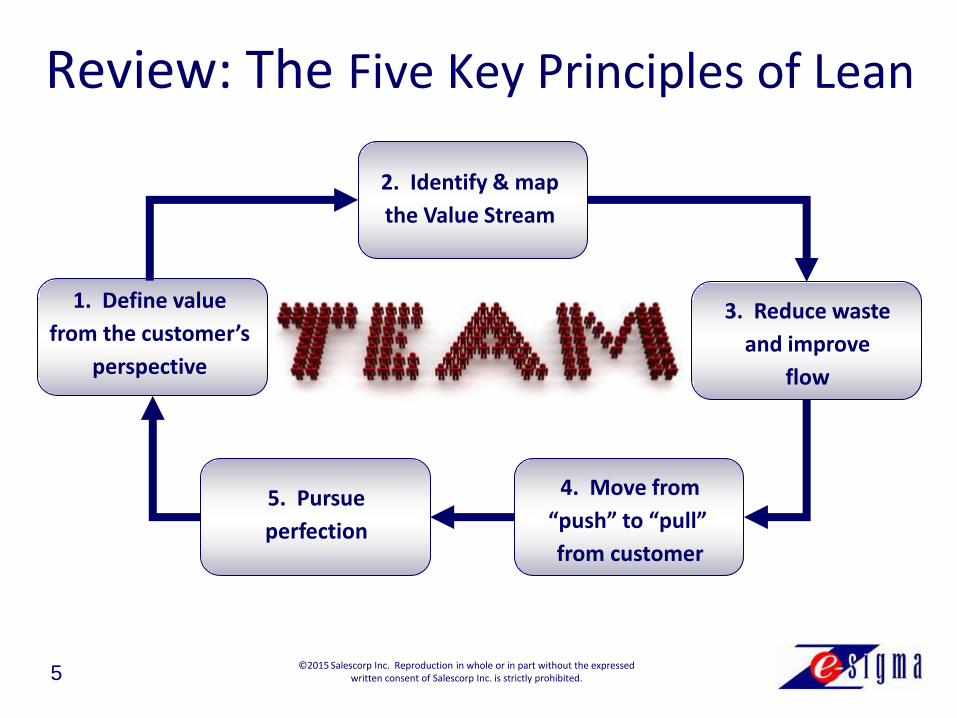
Review: The Five Key Principles of Lean
1. Define value
from the customer’s
perspective
2. Identify & map
the Value Stream
3. Reduce waste
and improve
flow
4. Move from
“push” to “pull”
from customer
5. Pursue
perfection
©2015 Salescorp Inc. Reproduction in whole or in part without the expressed written consent of Salescorp Inc. is strictly prohibited.

6
Any process step, activity or task that transforms the deliverables of a process such that the customer is aware of it AND is willing to pay for it is considered value added. Value is always stated in the eyes of the customer.
© 1996 “Lean Thinking”, Womack & Jones
Value: A “Lean” Definition
©2015 Salescorp Inc. Reproduction in whole or in part without the expressed written consent of Salescorp Inc. is strictly prohibited.

7
Non-Value Added: Waste
Waste is defined as anything that does not add value for the customer.
“Lean Thinking” requires an organizational culture that is intolerant of all forms of waste.
The goal of Lean is to banish waste.
©2015 Salescorp Inc. Reproduction in whole or in part without the expressed written consent of Salescorp Inc. is strictly prohibited.
8
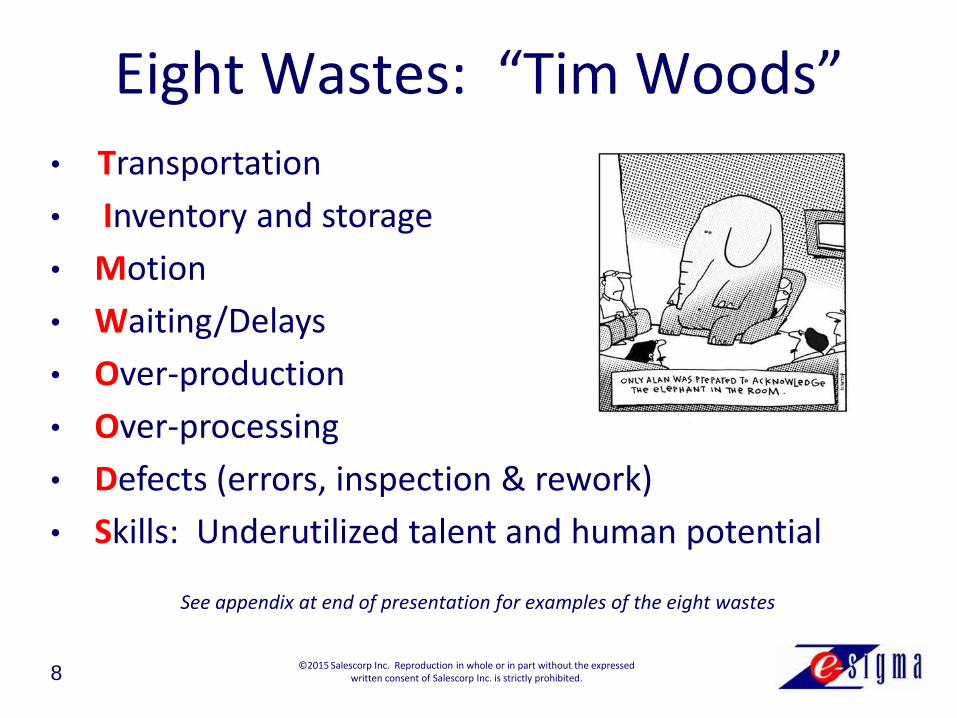
Eight Wastes: “Tim Woods”
• Transportation
• Inventory and storage
• Motion
• Waiting/Delays
• Over-production
• Over-processing
• Defects (errors, inspection & rework)
• Skills: Underutilized talent and human potential
©2015 Salescorp Inc. Reproduction in whole or in part without the expressed written consent of Salescorp Inc. is strictly prohibited.
See appendix at end of presentation for examples of the eight wastes

9
Problem statements (5W2H)
A3 reports and charters/plans
Process metrics/statistics
Capability and control?
Value stream map Current and future state
Process flow map
Spaghetti diagram
Cause and effect diagrams
Five why approach
Pareto chart
Failure Mode & Effects Analysis
A Basic Lean “Tool Box”
5S/6S (workplace organization)
Visual workplace
Standardized work
Kanban & material management
Single piece flow (JIT)
Touch once principle
Work leveling/balancing
Work cell/layout & “point of use”
Error proofing
Quick/rapid change over
Batch elimination/reduction
Total productive maintenance
©2015 Salescorp Inc. Reproduction in whole or in part without the expressed written consent of Salescorp Inc. is strictly prohibited.
10
The Purpose of Value Stream Mapping
• Helps visualize and understand the flow of materials and information information as a product or service makes its way through the value stream
• A high level map that visually presents the flow of a product or service from supplier to customer and can be used to present both current state as well as future state vision
• Captures critical data regarding the flow of the products or service that help to identify value and waste
• Highlights waste and other problems specific to the process that impede flow (i.e. “constraints”)
©2015 Salescorp Inc. Reproduction in whole or in part without the expressed written consent of Salescorp Inc. is strictly prohibited.

11
Mapping the “Value Stream”
©2015 Salescorp Inc. Reproduction in whole or in part without the expressed written consent of Salescorp Inc. is strictly prohibited.
12
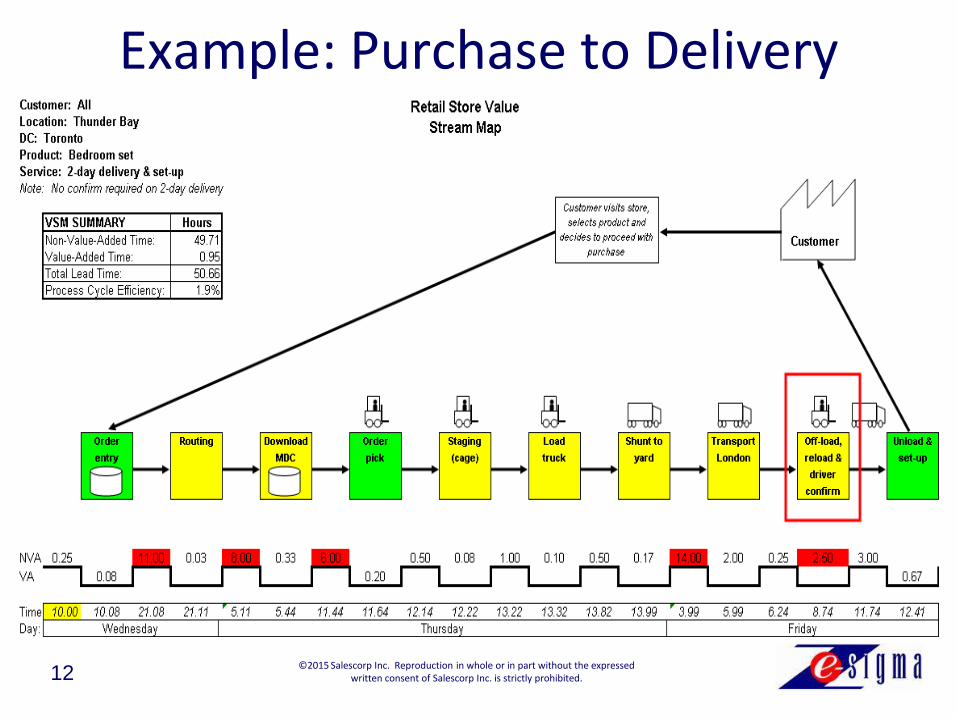
Example: Purchase to Delivery
©2015 Salescorp Inc. Reproduction in whole or in part without the expressed written consent of Salescorp Inc. is strictly prohibited.
13
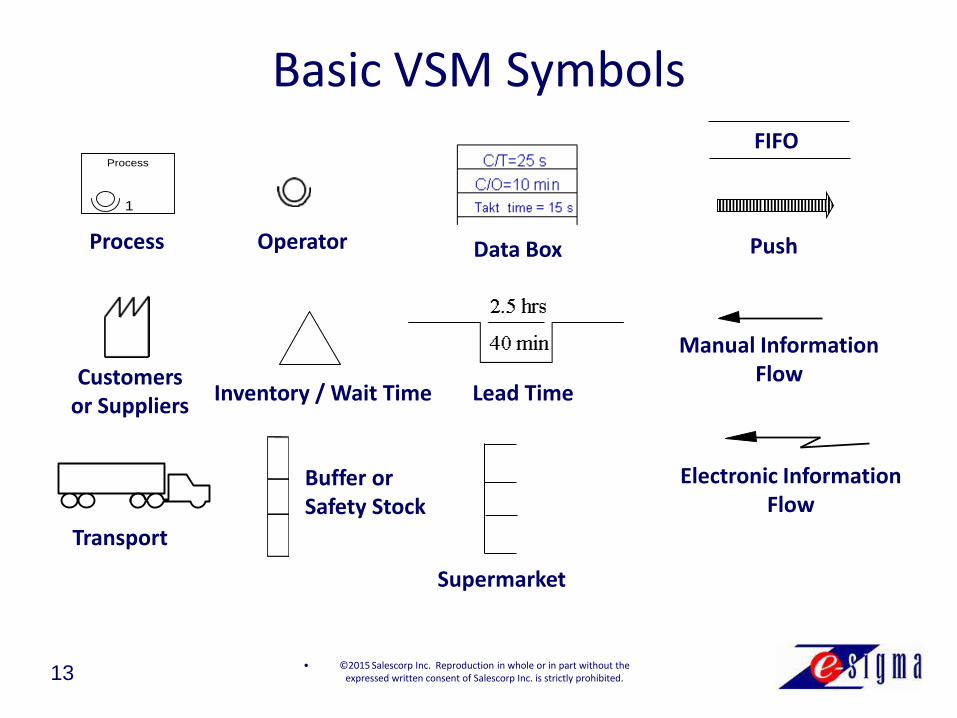
Basic VSM Symbols
1
Process
Process
Transport
Push Data Box
Customers or Suppliers
Inventory / Wait Time
Manual Information Flow
Electronic Information Flow
Operator
Lead Time
Buffer or Safety Stock
FIFO
Supermarket
• ©2015 Salescorp Inc. Reproduction in whole or in part without the expressed written consent of Salescorp Inc. is strictly prohibited.

14
Typical VSM Data Elements
• Lead Times (Process/Overall)
• Value-added time
• Cycle Times
• Takt time
• Uptime
• Changeover time
• Shipping Frequencies
• Sales/demand forecasts
• Errors and damages
• Yields (% first time good)
• Value added (VA) activities
• Non-value added (NVA) activities
• Raw material orders
• Information flow
• Material flow
©2015 Salescorp Inc. Reproduction in whole or in part without the expressed written consent of Salescorp Inc. is strictly prohibited.
15
The “Gemba1” Walk – See the Work
• Review entire value stream (flow) with project team – establish consensus and familiarity with “flow” and steps
• Gather information starting from furthest downstream point such as shipping, working your way upstream. Use a pencil and paper, sketch as you walk. This is a rough sketch, clean it up later.
• Collect data! Do not rely on standard times or information that you do not personally obtain (exceptions may be reliable data collected by automated systems).
• Map (brown paper, Post-It™ Notes) the value stream yourself with the input of your team.
• Rationalize the map… does it accurately depict the reality? Strive for consensus. Now… Identify the waste and constraints!
1. Gemba: “Place where value is created”. For more on Gemba, see http://www.industryweek.com/blog/gemba-walk
©2015 Salescorp Inc. Reproduction in whole or in part without the expressed written consent of Salescorp Inc. is strictly prohibited.

16
Beware! Partial Maps • Value stream maps should represent the “journey” of the
service or product from customer demand to order fulfillment
• “Staple yourself to the order”
• Mapping a “portion” or segment of a value stream map can be effective but poses a real risk;
• Is there a chance that changes to the “visible” portion of a value stream may result in waste being “transferred” to another (invisible, yet to be mapped) segment of the larger value stream? • Example: Focus in a hospital emergency department to “speed up”
the flow of patients through the process only to have them waiting in hallways due to bottlenecks created downstream.
©2015 Salescorp Inc. Reproduction in whole or in part without the expressed written consent of Salescorp Inc. is strictly prohibited.

17
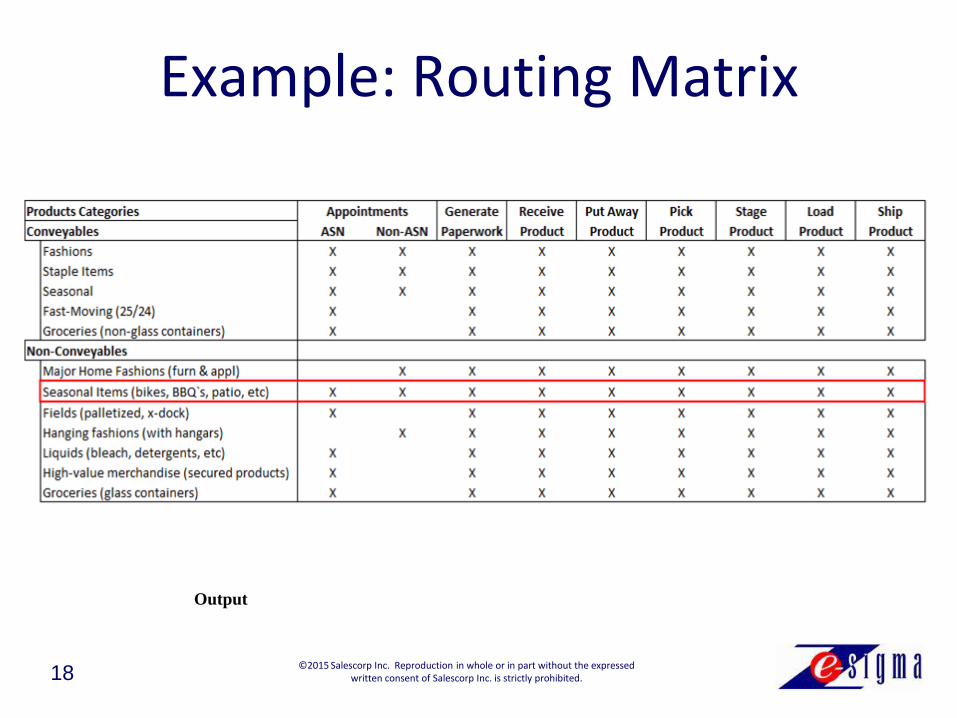
Product/Service Families • Identifying Product Families is vital for effective value stream
mapping
• The important concept of “homogeneity”
• A product “family” shares similar “flow” characteristics
• The purpose of identifying Product Families is to group products, transactions and other types of deliverables that share and compete for the same resources so we can better understand the dynamics that exist in the process.
• Developing a “Routing Matrix” can be a difficult exercise for many individuals because it challenges the way we normally view our operations.
©2015 Salescorp Inc. Reproduction in whole or in part without the expressed written consent of Salescorp Inc. is strictly prohibited.
18
Example: Routing Matrix
©2015 Salescorp Inc. Reproduction in whole or in part without the expressed written consent of Salescorp Inc. is strictly prohibited.
Output

19
Building the Value Stream Map
1. “Walk” the process!
2. Build map with team
3. Validate the map
4. Identify constraints
4. Identify the “future state”
5. Determine plan to achieve future state
6. Execute plan & sustain
©2015 Salescorp Inc. Reproduction in whole or in part without the expressed written consent of Salescorp Inc. is strictly prohibited.

20
“Digging Deeper” into the Process
After completing a value stream map, you will need to “dig deeper” into the process step/activity and capture the detail…
That is where the process map comes in!
Step 1 Step 2 Step 3 Step 4
Step 5Step 6Decision 1Step 7
Step 8
©2015 Salescorp Inc. Reproduction in whole or in part without the expressed written consent of Salescorp Inc. is strictly prohibited.

21
Uncovering The “Hidden Factory”
• Searching for tools/information that should have been available or complete when needed
– Motion, searching, delays, rework, underutilized staff
• The wrong trailer shunted to the wrong cross-dock door
– Transportation, delays, underutilized staff
• Picking errors…
©2015 Salescorp Inc. Reproduction in whole or in part without the expressed
written consent of Salescorp Inc. is strictly prohibited.

22
Spaghetti Diagrams
Motion!
©2015 Salescorp Inc. Reproduction in whole or in part without the expressed written consent of Salescorp Inc. is strictly prohibited.
23
The “Future State” Map
• The target or future state value stream should be aligned with your organization’s improvement strategy and objectives
• Requires significant knowledge of quality tools and principles – Identify waste, constraints, risks and improvement opportunities
– Systematically eliminate waste, improve flow and implement “pull” (“just in time”)
• Much more difficult to do than “current state” mapping – Respectfully challenge existing paradigms
– Requires “vision” and “breakthrough” thinking – innovation?
• Not an “ideal” state since what is ideal in the future can change very quickly (market, “voice of the customer”) – It is a “to be” model based which allows you identify and implement
improvements to close gaps between current and desired future state
©2015 Salescorp Inc. Reproduction in whole or in part without the expressed written consent of Salescorp Inc. is strictly prohibited.

24
Current versus Future
Customer Order
Waste Demand Fulfillment
Time (Longer)
Current State
Customer Order
Demand Fulfillment
Time (Shorter)
Future State
It’s all about the waste! ©2015 Salescorp Inc. Reproduction in whole or in part without the expressed
written consent of Salescorp Inc. is strictly prohibited.

25
From “Current” to “Future” State
Leveraging what we now know about the current state value stream, what can we do to eliminate waste and improve process flow?
©2015 Salescorp Inc. Reproduction in whole or in part without the expressed written consent of Salescorp Inc. is strictly prohibited.

26
Implementing Flow • Eliminate/Reduce Work in Process (WIP)
• Load/Work and/or Demand “Balancing”
• “Just in time” access to resources required for task completion
• Eliminate Waste (Tim Woods) 1. Inventory
2. Waiting & Delays
3. Overproduction
4. Transportation
5. Motion
6. Defects & Rework
7. Over-processing
8. Underutilized human capability ©2015 Salescorp Inc. Reproduction in whole or in part without the expressed
written consent of Salescorp Inc. is strictly prohibited.

27
Our Lean Supply Chain Challenge
Is competition between companies or is it really competition between supply chains?
• How do we build a chain of suppliers that focus on maximizing value for the customer… a supply chain of “Lean Thinkers”? • Members are connected by upstream and down value streams that
flow information, services, materials, products, and financial transactions
• ALL members are working collaboratively to relentlessly eliminate waste, improve efficiency and flow, implement “pull” systems, reduce cost and find better and faster ways to satisfy customer demand.
• What customers want is simple… they want it now, they want it perfect and they want it free! (Robert Rodin, CEO Marshall Industries)
©2015 Salescorp Inc. Reproduction in whole or in part without the expressed written consent of Salescorp Inc. is strictly prohibited.

28
Areas of Focus for Collaboration and Lean Thinking
• Transportation / Logistics vendors
• Credit and cash transfers
• Distributors
• Accounts payable and receivable
• Warehousing and inventory
• Order fulfillment
• Sharing customer information;
• Forecasting
• Production
©2015 Salescorp Inc. Reproduction in whole or in part without the expressed written consent of Salescorp Inc. is strictly prohibited.

29
Thank You!
©2015 Salescorp Inc. Reproduction in whole or in part without the expressed written consent of Salescorp Inc. is strictly prohibited.
30
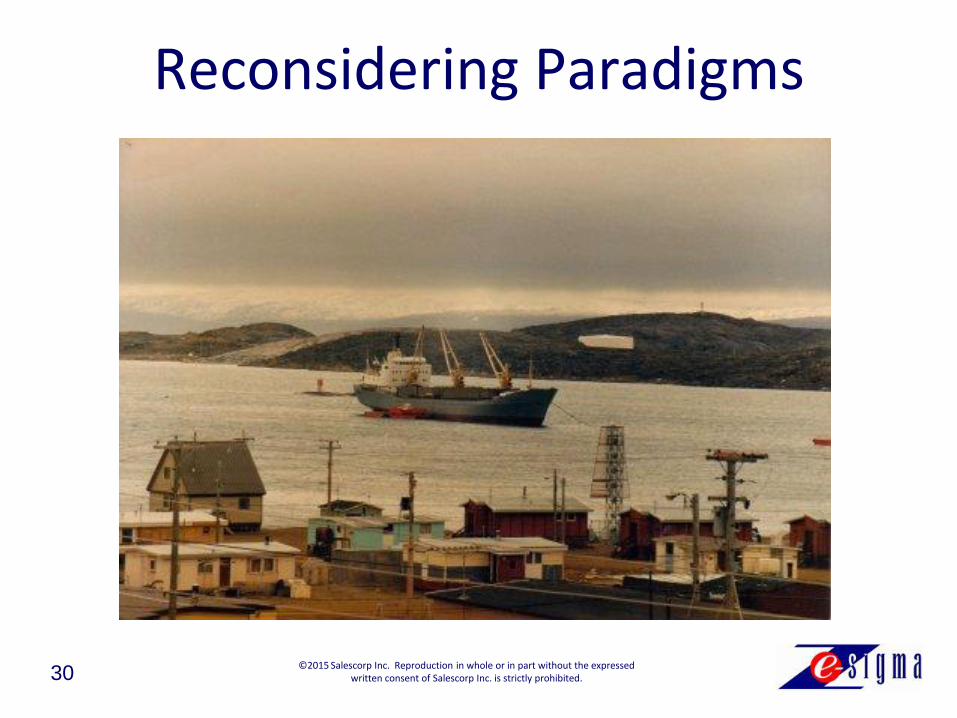
Reconsidering Paradigms
©2015 Salescorp Inc. Reproduction in whole or in part without the expressed written consent of Salescorp Inc. is strictly prohibited.
31
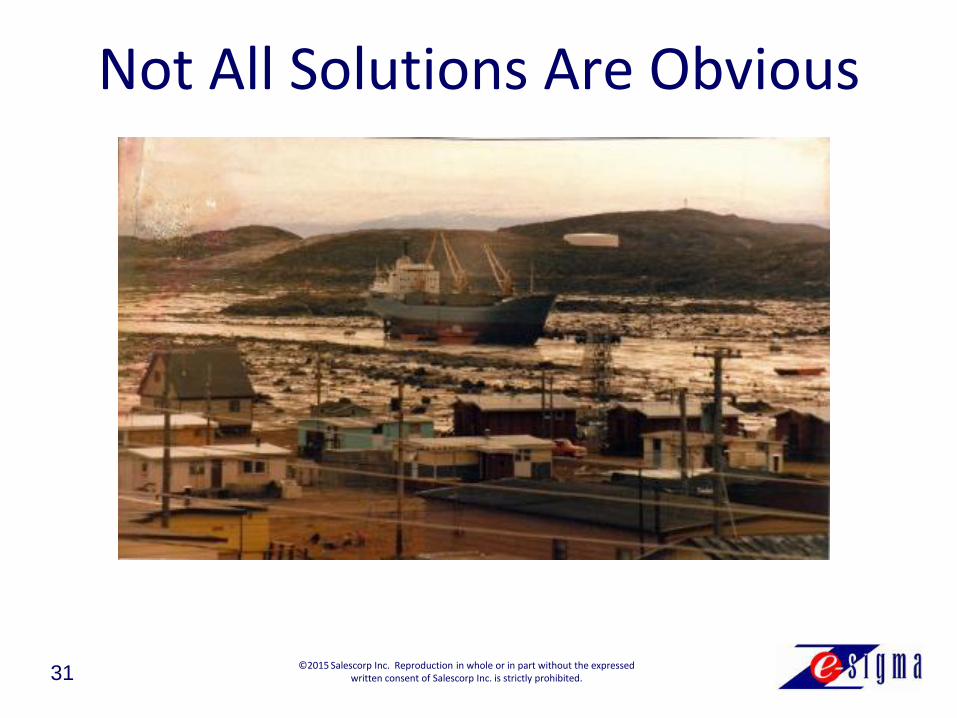
Not All Solutions Are Obvious
©2015 Salescorp Inc. Reproduction in whole or in part without the expressed written consent of Salescorp Inc. is strictly prohibited.

32
1. Overproduction
Producing more than is required for a subsequent process step or customer/consumer.
Potential cause: Poor information flow across supply chain
Your example:__________________________________________
2. Transportation
Moving product does not create value. The goal of lean is to “minimize” transportation waste.
Potential cause: Insufficiently optimized supply chain
Your example:__________________________________________
Eight Primary Sources of Waste
©2015 Salescorp Inc. Reproduction in whole or in part without the expressed written consent of Salescorp Inc. is strictly prohibited.
33
3. Inventory (excess, unnecessary…)
Excess inventory results in higher costs, risk of damage, increased handling, and risk of obsolescence and margin erosion.
Potential cause: Inadequate forecasting, long lead times…
Your example:__________________________________________
4. Processing (inappropriate)
Additional, non-value added steps in a process, or a process that is not well-suited for a given task (ex. right-sized equipment).
Potential cause: Insufficiently robust or poorly designed processes
Your example:__________________________________________
Eight Primary Sources of Waste
©2015 Salescorp Inc. Reproduction in whole or in part without the expressed written consent of Salescorp Inc. is strictly prohibited.

34
5. Waiting and Delays
Anywhere in the process where the “flow of value” is impeded or stopped: people, materials and equipment.
Potential cause: Errors requiring containment, inspection and rework. Lack of demand leveling and standardization in work flow.
Your example:__________________________________________
6. Excess Motion (personnel, equipment…)
Personnel moving (excessively, in and out of their work location) to get the job done.
Potential cause: Lack of cellular design; departmental layouts versus layout based on work flow.
Your example:__________________________________________
Eight Primary Sources of Waste
©2015 Salescorp Inc. Reproduction in whole or in part without the expressed written consent of Salescorp Inc. is strictly prohibited.

35
7. Errors, Mistakes, Defects
Damaged goods as well as mistakes made across the value stream causing rework, additional consumption of resources and delays.
Potential cause: People-dependent processes, lack of sufficient risk management at process level, inadequate visibility of cost of errors...
Your example:__________________________________________
8. Underutilized Human Capability
Lack of leveraging knowledge, experience and creativity of workforce, partners as well as customers across the value stream to drive greater productivity and profitability. Staff not utilized for value-added work.
Potential cause: Cultural and organizational barriers, leadership.
Your example:__________________________________________
Eight Primary Sources of Waste
©2015 Salescorp Inc. Reproduction in whole or in part without the expressed written consent of Salescorp Inc. is strictly prohibited.