
Leadership and culture in New Zealand - United...
60
Commerce Division Discussion Paper No. 88 LEADERSHIP AND CULTURE IN NEW ZEALAND J.C. Kennedy June 2000 Commerce Division PO Box 84 Lincoln University CANTERBURY Telephone No: (64) (3) 325 2811 Fax No: (64) (3) 325 3847 E-mail: [email protected] ISSN 1174-5045 ISBN 1-877176-65-6
-
Upload
phamnguyet -
Category
Documents
-
view
224 -
download
1
Transcript of Leadership and culture in New Zealand - United...

Commerce Division Discussion Paper No. 88
LEADERSHIP AND CULTURE IN NEW ZEALAND
J.C. Kennedy
June 2000
Commerce Division PO Box 84
Lincoln University CANTERBURY
Telephone No: (64) (3) 325 2811 Fax No: (64) (3) 325 3847
E-mail: [email protected]
ISSN 1174-5045 ISBN 1-877176-65-6

Acknowledgement
Peter Cosgriff, Mark Fearing and Dan Sauers contributed to the early planning and data-gathering stages of GLOBE in New Zealand, and their contribution is gratefully acknowledged.
Contents List of Tables i
1. Introduction 1 2. New Zealand Culture 1 3. The GLOBE Study - Societal Culture 8 3.1 Performance Orientation 10 3.2 Uncertainty Avoidance 11 3.3 Assertiveness 12 3.4 Collectivism II: Family Collectivism 13 3.5 Power Distance 14 3.6 Future Orientation 14 3.7 Humane Orientation 15 3.8 Themes 16 4. Food Processing, Finance and Telecommunications Industries 17 4.1 Food Processing Industry 17 4.2 Financial Services Industry 18 4.3 Telecommunications Industry 20 5. Organisational Culture Results 22 6. Previous Research on Leadership 27 7. The GLOBE Study 32 7.1 Focus Groups and Interviews 32 7.2 Media Analysis 34 7.3 The Leadership Scales 36 7.4 Factor Analysis of Leadership Scales 40 8. Conclusions 44 Appendix One 48 References 53

List of Tables 1. Results for New Zealand on the Nine GLOBE Cultural Dimensions, Society Level 8 2. Organisational Culture Dimensions for the Finance Industry 23 3. Organisational Culture Dimensions for the Food Industry 24 4. Organisational Culture Dimensions for the Telecommunications Industry 25 5. Manager and Leader Characteristics Identified by Focus Group 34 6. Categories Emerging from Media Analysis 35 7. New Zealand Leadership Styles 37 8. Leadership Factor Loadings 41 1.1 Leadership Prototype Scales: First Order Factors and Leader Attribute ITEMS 51 1.2 Global Culturally Endorsed Implicit Leadership (CLT) Dimensions 52
1
“Everything that was good from that small, remote country had gone into them - sunshine and strength, good
sense, patience, the versatility of practical men” (Mulgan, 1984, p.15)
1. Introduction
The Global Leadership and Organisational Behaviour Effectiveness Research Program
(GLOBE) was initiated by Professor Bob House (Wharton School, University of
Pennsylvania) in 1991 as a means by which links between culture and leadership could be
comprehensively researched. Approval of a research grant in 1993 enabled the project to
expand, with the recruitment of Country Co-Investigators (CCIs) from around the world. The
GLOBE community now comprises around 170 researchers in over 60 countries.
This discussion paper comprises a draft chapter completed for inclusion in an anthology of
GLOBE country reports to be published late in 2001. As the anthology will include a chapter
covering the GLOBE methodology and the meanings of the various scales, this material has
not been included in the body of this report. Appendix One provides an overview of the
project, while more detail can be obtained from published sources (den Hartog et al., 1999;
House, Wright, & Aditya, 1997; House et al., 1999).
This chapter begins with an overview of New Zealand’s historical development, and the
cultural themes that have emerged since European settlement in the 1800s. This provides the
context for subsequent discussion of the GLOBE cultural scales in New Zealand, and their
links with the style of leadership preferred in our business organisations.
2. New Zealand Culture
The core hypotheses of the GLOBE project revolve around the influence of culture on
leadership. It is therefore appropriate to begin each chapter in this anthology with an
overview of important aspects of culture within each of the sample countries. This is a
difficult task. It must be daunting to encapsulate in a page or two the culture of a country as
old as India, as geographically dispersed as China, or as attractive to immigrants as the
United States has been over the last two centuries.

2
At the other extreme, New Zealand is a country consisting of two main islands, two-thirds the
size of California, on the hindquarters of the earth’s largest ocean. With a population of
almost four million, we have fewer people than cities such as Bangkok, London, New York,
Moscow or Sydney. We were the last islands of any size to be reached by human beings. It
almost seems pretentious to suggest that we have a unique culture.
The original inhabitants, the Maori, came from Polynesia around one thousand years ago.
Just over two hundred years ago, Britain colonised New Zealand, and waves of immigrants
from Britain subsequently established settlements. Discovery of gold in 1861 led to an influx
of miners from the declining gold fields in Australia and China, followed in 1870 by another
wave of assisted immigration from Germany, Scandinavia and France, as well as the British
isles. The period between the two World Wars saw an increase in immigration from Central
Europe, while the period after the Second World War was characterised by a significant
inflow from the Netherlands and from Poland. More recently, immigration from Pacific
nations (such as Samoa, Tonga and Fiji) has increased, and our Asian population has been
boosted by new arrivals from Indo-China, Hong Kong, Singapore, Taiwan, Korea and other
neighbours to the north. At present, 71.7% of the population identify themselves as being
European or of European descent with 14.5% in the New Zealand Maori ethnic group. Pacific
Islanders and Asian ethnic groups comprise 4.8% and 4.4% respectively of the overall
population (Statistics New Zealand, 1999).
While these figures suggest that it makes little sense to talk of one culture for New Zealand,
New Zealanders (self-styled ‘Kiwis’) will argue strongly for the existence of a unique
identity, for the existence of something that sets them apart from others, a ‘Kiwi culture’.
While the components making up this identity may be found in other cultures and nations, the
particular combination and emphasis, the shared experiences and history illuminating and
illustrating our beliefs and values, creates a distinctive pattern. The components of this
pattern will vary according to who is describing it, and the purpose for which it is put forward
(Novitz, 1989). This chapter describes leadership in New Zealand business organisations, and
we will therefore select elements of culture most relevant to this purpose. By necessity, other
(important) elements will be left out, and in order to put this selective view in context, the
following paragraphs provide an overview of the historical setting for our description.

3
The earliest inhabitants of New Zealand migrated here from Polynesia around 1000AD. The
Maori retained aspects of their Polynesian culture, while adapting to the challenges of a less
tropical and more rugged physical environment. Maori social organisation is largely
communal, with social groupings being based on extended families, hapu (subtribes) and iwi
(tribes), usually based on descent from a common ancestor. Communities were ruled by
chiefs (rangatira) who generally held their position subject to the community remaining
satisfied with their continued good performance. The literal meaning of rangatira is ‘to
weave people together’ - a definition of leadership that neatly encapsulates the
interdependent and communal nature of Maori society.
In 1642 a Dutch East India Company expedition under Abel Tasman became the first
European voyagers to discover New Zealand. Detailed European exploration took place
during the 1770s, with several expeditions by the British explorer James Cook. In 1788 a
prison colony was established in Australia, facilitating greater access to New Zealand.
American and British whalers and sealers began to establish bases on the New Zealand coast,
and several of these expanded into larger settlements involved in farming and trade.
A British governor was appointed in 1840, and in February he began gaining Maori
signatories to the ‘Treaty of Waitangi’. This document provided for Maori to cede aspects of
sovereignty to Queen Victoria, gaining the rights and privileges of British subjects, while
retaining ownership of their land, forests and fisheries. Originally an extension of the
Australian colony in New South Wales, New Zealand became a British colony in its own
right in 1841.
Increasing numbers of settlers arrived, principally from Britain, and a number of planned
settlements began to take shape. In a structure akin to the American federal system, six
provincial governments were established in 1852, but these were abolished in favour of a
central government in 1876. A centralised approach was needed in order to fund and
coordinate the expensive business of developing the new nation’s transport and
communications infrastructure.
During the last decades of the nineteenth century, the central government began to take a
much broader and socially progressive role in running the country. In 1877 it provided for a
system of free, compulsory education. In 1879 it introduced universal male suffrage, and in
1893 became the first country in the world to extend the vote to women. The Industrial
Conciliation and Arbitration Act of 1894 has been described as “one of the most dramatic
4
contributions New Zealand has made to conceptions of humanitarian democracy” (Hansen,
1968, p. 58). It provided a compulsory system of state arbitration “aimed at preventing class
conflict by ensuring the workers an adequate share of the national wealth even as it assured
adequate incentive to the employer” (Ibid).
The passing of this Act provides a number of insights into aspects of New Zealand societal
values that are still relevant today. The changes introduced by this Act (and by earlier
widening of the electoral franchise) reflect a degree of willingness by the well-off to give up
some privilege, wealth and power. Hansen (1968) argues that this illustrates a gap between
the values of the settlers and those dominant in their countries of origin. In particular, the
settlers placed greater emphasis on equality, freedom and individual dignity: “…in
comparison with England and the United States, and even Australia, New Zealand has most
actively and consistently emphasised equalitarianism” (p. 58).
The New Zealand concept of egalitarianism is not restricted to the sense of equal opportunity;
it extends to the idea that people should be considered as equal in all aspects of life: “Not
only should one person not inherit greater life chances than another; none should be allowed
to accumulate a great deal more than another through his own efforts or luck. Exceptional
performances or capacities are deprecated by both individuals in a relationship” (Hansen,
1968, p. 60). The phrase “tall poppy syndrome” refers to a tendency in New Zealand to find
fault with high achievers, to “cut them down to size” if they pretend they are better than
anyone else.
Hansen noted an undesirable side-effect of this in the educational system, where “academic
excellence is suspect, and children seem to aim for “a high standard of mediocrity”. Today
some commentators are concerned that government educational agencies, in their drive to
replace competitive examinations with standards-based assessment, are institutionalising this
attitude. This move has been described as clipping “the wings of academic high fliers … in
order to ensure fail-free education for everyone” (Chamberlain, 2000, p. 88).
There was a feeling among many working people that they could work their way out of
wage-dependency and into property ownership on the basis of their individual effort
(Fairburn, 1989). Class barriers to upward mobility did not exist to the same extent as in
Victorian Britain, and there was little requirement for social or family connections, patronage
of the wealthy, intellectual accomplishments, or attendance at the ‘right’ schools. Deeks et al

5
(1994) comment on the structures imported into New Zealand from English common law (eg
the master-servant relationship), but note their comparative weakness. Few households had
servants, and there was not the same expectation of deference and servility in such
relationships.
Egalitarianism is also apparent in New Zealand labour law which, until 1991, enforced a
strict system of Awards that acted to ensure uniform minimum pay rates and conditions for
the same jobs across all employers. Differentials between skill levels were based on
negotiation rather than market considerations, and pay for seniority was far more prevalent
than pay for performance.
Economically, New Zealand was dependent almost entirely on agricultural exports. Early
trade in flax and seafood (primarily with Australia) gave way to exports of meat, wool and
dairy products to Britain. Throughout the period from 1875 until World War II, around 80%
of our exports were sold to the United Kingdom, and we obtained over half our imports from
that country (Department of Statistics, 1990). Coupled with this economic dependence, many
of our political and social institutions and customs had English origins, and settlers continued
to refer to Britain as Home with a capital ‘H’.
New Zealand participation in the South African War (1899-1902) and World War I (where
103,000 served abroad, from a total population of around one million) led to a greater sense
of national identity. New Zealanders compared themselves favourably with their British
regular force counterparts. In particular, heroic actions of the Australian and New Zealand
Army Corps (ANZACs) at Gallipoli in 1915 are still recalled in annual ceremonies marked
by a glorification of Australasian exploits, and a diminution of British (and other Allied)
contributions. The dominant and enduring cultural theme portrays New Zealanders as self-
reliant pioneers, brave and heroic, demonstrating initiative under pressure. These
characteristics were said to engender leadership based on example rather than insistence on
‘red tape’, by officers who were “‘democratic’ and modest - one of the boys” (Phillips, 1989,
p. 96).
The pioneering settler history, combined with the dependence on farming, gave rise to a
strong self-image of New Zealand as a country of rugged individualists in a dramatic rural
landscape. The literary incarnation of this theme has a dark side, with an underlying sense of
alienation and of distance. This imagery has been used metaphorically in describing

6
interpersonal relationships, and conveys “uncertainties about the influence of the past as well
as a lack of confidence in the future” (Lealand, 1988, pp. 29-30). At a more popular level the
rural theme is the setting for much New Zealand humour, is used in locally made television
dramas, and is portrayed in many different ways in commercial advertisements (Carter &
Perry, 1987).
Another important element of this cultural archetype is a practical, problem-solving approach
to life. It involves the willingness to tackle problems and take on responsibilities outside
one’s normal role. Innovative solutions using tools or material at hand are valued. Kiwis take
pride in being able to fix anything with “a piece of No. 8 fencing wire”. We celebrate Richard
Pearse, a farmer who took to the air nine months before the Wright brothers, in an aeroplane
and engine he constructed with home-made tools from scrap metal and other oddments
(Ogilvie, 1973). Edmund Hillary was the first person to drive a motorised vehicle overland to
the South Pole, and he used converted farm tractors for the expedition (Booth, 1993). As
Holm has noted (1994), this celebrated trait of “Kiwi ingenuity”, of devising innovative,
practical, cost-effective solutions, is now no longer confined to the use of such prosaic
materials as fencing wire.
The lasting strength of this rural image, of the practical man in tune with the elements, belies
the level of urbanisation in New Zealand. A peak of 75% of the population lived in rural
areas in 1871, but this figure has steadily declined. At the most recent census, 85% of New
Zealanders lived in urban areas (Statistics New Zealand, 1999).
Following World War II, New Zealand’s identification with Britain as the ‘Mother Country’
declined further. The United States protected New Zealand in the Pacific, while most of our
troops were fighting in the Mediterranean theatre. Over 100,000 Americans were stationed in
New Zealand during latter stages of the War, and in the following decades our foreign policy
became more aligned with that of America. We signed the ANZUS security treaty with
Australia and the United States in 1952, and fought with both countries in Korea and Viet
Nam.
Following a period of prosperity during the 1950s and 1960s, New Zealand entered a period
of uncertainty during the 1970s. External factors, such as the oil price shocks, negatively
affected our terms of trade. Britain, who had hitherto been the main market for our exports,
entered the European Economic Community, and by 1975 was only taking one-fifth of our
total exports. In subsequent decades New Zealand has actively diversified its markets

7
(looking particularly to Asia) and has sought to expand beyond the role of commodity
agricultural exporter into a range of service and technological industries.
On the foreign policy front, New Zealand has been more prepared to take an individual stand
on issues rather than uncritically adopt the views of Britain or America. A high-profile
example was our nuclear-free policy, which led to banning nuclear warships from our ports.
We have increasingly seen our sphere of influence as lying in the South West Pacific, and
this has led to new themes for our cultural identity.
The European linkage is weaker, and a renaissance in Maori culture and traditions coupled
with an increasing acceptance of our geographic location, has led to greater acceptance of
New Zealand as a “self-confident, multicultural Pacific nation” (Lealand, 1988). Kevin
Roberts, New Zealand born CEO Worldwide of Saatchi & Saatchi plc, uses the image of ‘the
edge’ - New Zealand on the edge of the world, one of “the most physically remote countries
on the planet with few economies of scale, nothing except our land, our brains and our innate
competitiveness… one of the great experimental cultures. We try things first. Whether it’s
votes for women, the welfare state or the market economy, powered flight, nuclear physics,
anti-nuclearism, biculturalism” (Roberts, 1999). The importance of people, rather than
cultural artifacts, is being emphasised, with New Zealanders being seen as having qualities of
“openness, honesty, informality, a sense of adventure, an ability to improvise, and a
youthfulness born of the new world” (Laidlaw, 1999, p. 237).
It is clear from this brief overview that dramatic shifts have taken place in our self-concept.
We have moved from dependence to independence, from a Euro-focused world view towards
one centred more on the Pacific. It should also be apparent that our dominant cultural themes
are not truly representative. Many of the themes are masculine in origin, with pioneering,
rural and military provenances. The perspectives of women and Maori are underrepresented.
Similarly, women and Maori are underrepresented in management within New Zealand
organisations. In common with the cultural themes presented in this section, the GLOBE
research discussed below reflects a primarily male (and New Zealand European) perspective.
This does not make the perspective any less important, but it serves to delimit it.

8
3. The GLOBE Study - Societal Culture
The GLOBE study included a quantitative assessment of societal cultural values, seeking
information on the current emphasis given to values (“As Is”) and the emphasis that
respondents felt should be given to each value (“Should Be”). Brief descriptions of these
scales can be found in Appendix One. Table 1 presents the results for New Zealand in terms
of absolute scores (on a seven-point Likert-type scale) and comparative ranking with other
countries on the GLOBE cultural dimensions.
Table 1 Results for New Zealand on the Nine GLOBE Cultural Dimensions, Society Level
Cultural Dimension "Is Now" Ratings "Should Be" Ratings Difference
Scoreb Rankc Scoreb Rankc
Power Distance 4.89 Be (50) 3.53 Be (4) -1.36 Uncertainty Avoidance 4.75 Af (8) 4.10 Ce (48) -0.65 Humane Orientation 4.32 Be (15) 4.49 Cd (61) 0.17 Collectivism I - Societal Emphasis
4.81 Be (15) 4.20 Cd (51) -0.61
Collectivism II - Family Collectivism
3.67 Ce (59) 6.21 Ae (3) 2.54
Assertiveness 3.42 Cd (61) 3.54 Bd (41) 0.12 Gender Egalitarianisma 3.22 Be (23) 4.23 Bd (47) 1.01 Future Orientation 3.47 Ce (43) 5.54 Ad (31) 2.07 Performance Orientation 4.72 Ad (1) 5.90 Bd (34) 1.18 Notes: a Low = male oriented, medium equal, high = female oriented b Country mean on a seven point Likert scale c Represents band of countries New Zealand falls into (from a high of A to a low of C, D or E); bands identify meaningful differences between groups of countries. The number in parentheses is New Zealand’s rank order out of the 62 countries. d Group span ranges from A-C e Group span ranges from A-D f Group span ranges from A-E

9
In considering the current situation (“Is Now”), New Zealand ranks highly on the dimensions
of Performance Orientation (1/62) and Uncertainty Avoidance (8/62). In contrast, we ranked
at the low end of the sample in regard to Power Distance (50/62), Family Collectivism
(59/62) and Assertiveness (61/62).
In comparing "As Is" with "Should Be" responses, there are some significant shifts apparent.
In part this appears to result from the New Zealand managers not seeking to change their
ratings for a number of the scales. Accordingly, changes in the ratings of other countries’
managers led to large shifts in the relative position of New Zealand.
The managers in the sample expressed a strong desire to place much more emphasis on
values consistent with Family Collectivism, increasing the rating given to this dimension by
2.54 (on a seven-point scale), producing the third-highest "Should Be" ranking of all
countries. They also wanted to see a much greater emphasis on Future Orientation, lifting the
rating given to this dimension by 2.07, and changing the "Is Now" ranking of 43/62 to a
"Should Be" ranking of 31/62. Although there was a desire for further emphasis on
Performance Orientation, other countries sought to increase more, and New Zealand’s
"Should Be" ranking comes back to 34/62.
Although one of the countries with lowest emphasis on Power Distance, the New Zealand
managers wanted to further reduce this dimension. It appears that this reduction was not as
large as that desired by most other countries, and the resulting "Should Be" score placed New
Zealand 4/62 on the "Should Be" ranking.
The discussion of the dominant cultural themes in New Zealand indicates the emphasis
placed on male views of society. The respondents in this sample were predominantly male;
they acknowledged that New Zealand society is male oriented, and expressed a desire to see a
greater shift towards female orientation.
In regard to the Humane scale, the managers saw New Zealand as being around the midpoint
of the scale, and expressed little desire to shift from this position. Most other countries felt
they needed to emphasise this dimension more, and as a result the New Zealand ranking
shifted from 15/62 ("As Is") to 61/62 ("Should Be").
The following paragraphs discuss these dimensions further.

10
3.1 Performance Orientation
In comparison with other countries, New Zealand managers reported a high level of
Performance Orientation. The average rating of 4.72, while not much above the scale
midpoint, is the highest out of the 62 countries in the sample.
New Zealanders have always taken pride in the world-beating achievements of people from
such a small (in population terms) country. New Zealanders have been the first to split the
atom, to climb Mt Everest, to fly direct from England to New Zealand. Twenty years ago,
V.S. Naipaul wrote of the contribution New Zealand has made to the world, proclaiming that
“more gifted men and women have come from its population of three million than from the
twenty-three millions of Argentines” (Naipaul, 1980, p.153).
Expectations and encouragement for high performance are evident particularly in the sporting
arena. Despite the small size of our country, we have performed creditably on the
international stage in athletics, yachting, rugby, rowing, swimming, and other events. Our
athletes have very high expectations placed on them by the public, and are severely criticised
when their performance drops.
In the business arena, rapid deregulation of the economy from the mid-1980s has opened our
firms to international competition, and removed almost all governmental subsidies and
protection. New Zealand was recently ranked first out of 47 countries on the criteria of lack
of protectionism, lack of price controls, and accessibility to foreign financial institutions
(IMD International, 2000). These factors, together with geographical isolation from most of
our trading partners, have put pressure on companies to lift their performance to (or above)
international standards.
A comprehensive survey of New Zealanders’ values (Gold & Webster, 1990) suggests an age
split in the attitudes towards performance. Younger people were less likely to agree that
success was a function of hard work, or that "competition brings out the best in people". In
the absence of longitudinal studies, however, it is not possible to ascertain whether this
represents the beginning of a shift in societal attitudes.
3.2 Uncertainty Avoidance

11
New Zealand respondents also rated our society as comparatively high on Uncertainty
Avoidance (ranking 8th highest in the sample). The scale includes items such as the extent to
which laws or rules exist to cover most situations, the tendency for people to lead structured
lives, and the relative emphasis on orderliness and consistency.
Many commentators have argued that government has been far too involved in the detailed
regulation of business activities (Easton, 2000). Employers need to deal with a wide range of
legislation covering issues such as safety and health, minimum requirements in employment
contracts, compensation for workplace accidents, and discrimination. A comprehensive state-
funded accident insurance and rehabilitation scheme largely removes the right to sue for
personal injury, in return for providing universal coverage for injuries.
Hofstede’s earlier work (1980) indicated that New Zealanders were more tolerant of
uncertainty than suggested by the GLOBE findings, and common cultural stereotype themes
of independence support this. However, the New Zealand Survey of Values found that of a
list of six important life qualities (comfort and prosperity, excitement, security and stability,
accomplishing things, being respected, salvation) security was ranked first, accomplishing
things second, and comfort/prosperity third. In regard to important job characteristics, job-
security and good pay were ranked at the top of the list. (Gold et al., 1990).
Writers have often attacked the pressure for conformity in New Zealand. Charles Brasch
(quoted in Geraets (1984, p. 81)) writes of New Zealanders trying to “seek escape from a life
which the pressure of conformity has helped to make intolerably drab and empty”. Author
Dan Davin vividly captures elements of the emphasis on structured lives and consistency
(1984, p.105):

12
"In New Zealand everyone knows everyone more or less: those you don’t know personally you might just as well because they’re bound to be very like the people you know already; or think you know, because of course everyone’s different deep down but in New Zealand the stereotype that controls what you can say or be seen to do is very strong".
The dramatic changes in the economy over the past fifteen years have left few households
unaffected. People’s confidence in the prospects for employment security, access to
affordable housing, health care and education, and provision of social security benefits has
been undermined (Ansley, 2000). Weariness with change is setting in, and this may be
reflected in a desire for greater stability, certainty, and predictability. However, the existence
of a ‘nanny state’ creating security for its people ‘from cradle to grave’ appears to be
congruent with underlying values in New Zealand, and with the comparatively high ranking
on Uncertainty Avoidance.
3.3 Assertiveness
At the other end of the scale, New Zealand scored lowest of all countries on the
Assertiveness dimension. Respondents clearly believe that assertion, dominance and
aggression are not normal aspects of social relationships in New Zealand. The Survey of
Values, in looking at the values emphasised in child-training, found a high level of national
consensus regarding the importance of pleasantness, politeness and good manners. Qualities
such as independence were rated as less important (Gold et al., 1990).
New Zealanders often use pejorative adjectives such as ‘pushy’ or ‘aggressive’ to describe
assertive behaviours by others (such as sales people, Americans and Australians), and the
idea of standing up for one’s own rights can go against the social norm of conformity.
Psychiatrist Fraser McDonald has argued that the vaunted tolerance and good nature of
(particularly male) New Zealanders is actually a withdrawal from confrontation, something
which is seen as unpleasant and threatening - they "just avoid aggressive confrontation like
the plague" (quoted in McLauchlan & Morgan, 1976, pp. 38-39).
Values of aggressiveness, competitiveness and domination are commonly portrayed and
encouraged by ‘male’ sports in New Zealand (Gidlow, Perkins, Cushman, & Simpson, 1994).
The dominant sporting code in New Zealand (in terms of media coverage, international
reputation and money) is rugby, a physically aggressive variety of football played by teams
of fifteen, without the benefit of helmets or padding. The aggression and confrontation is real,
13
but is structured within the rules of the game. Perhaps its popularity is partly due to the outlet
it provides for socially acceptable aggression, whether by participants or (vicariously) by
spectators.
3.4 Collectivism II: Family Collectivism
The middle manager sample also considered New Zealand to be comparatively low on
Family Collectivism. While the average score of 3.67 is only just below the scale mid-point,
it is the third-lowest rating of all countries in the sample.
There is a theme of independence running through some of the dominant New Zealand
European cultural archetypes, and this can carry over into attitudes towards the family.
Young New Zealanders are keen to leave the family, to make their own way, often starting
with a period of ‘OE’ (overseas experience). It is uncommon for adults (whether single or
married) to share their home with older generations. Around 70% of households consist of
‘one family’, defined as “a husband and/or wife with or without unmarried children of any
age who are living at home” (Department of Statistics, 1990, p. 163). One-person households
are the next largest group, comprising almost 20% of households.
State support (in the form of universal superannuation, unemployment benefits, payments to
single mothers, study allowances, sickness benefits and the like) reduces the financial
obligation on other family members to support relatives. There may also be a historical
pattern, with those immigrants willing to come to New Zealand being the ones who were
more prepared to sever family ties with relatives left behind.
In a critical commentary on the insular nature of many New Zealand families, Gordon
McLauchlan commented: "The family is a fragment, and ephemeral. There are few secure
traditional extensions to the nuclear group, either sideways to brothers, sisters, cousins or
through marriage to in-laws; and there are no extensions vertically to those who have gone
before and who will come after; so that we have no identity in place or time" (1976, p.40).
The marked increase in emphasis on Family Collectivism reflected in the "Should Be" scores
seems to reflect a strong desire to gain a sense of family connectedness. This desire may also
be underlying the trend towards greater acceptance and introduction of ‘family friendly’
workplace policies (Rotherham, 1998).
14
3.5 Power Distance
New Zealand is a low Power Distance country. Hofstede’s original work placed us in the
lower group of countries, and the GLOBE results rank us 50th out of participating countries.
The small size of most work organisations in New Zealand – over 80% employ fewer than
ten staff - makes senior managers visible and accessible to most staff. Use of first names is
common between all levels, and in Universities it is not unusual for students to call lecturers
by their first name.
The low Power Distance finding is also highly consistent with the key theme of
egalitarianism emerging from the discussion of New Zealand culture in the introduction to
this chapter. It would be wrong to categorise New Zealand as classless, but there is an
inherent dislike of elitism. Historian Keith Sinclair talks of the ‘common colonist’s’ “distaste
for privilege” and how this “distinguished the New Zealanders even among the peoples of
America and Australia”. While acknowledging that New Zealand is not a classless society, he
claims that it “must be more nearly classless…than any advanced society in the world. Some
people are richer than others, but wealth carries no great prestige and no prerogative of
leadership” (Sinclair, 1969, p. 285).
In the years since those words were written, the gap between rich and poor has increased
significantly (Ansley, 2000). As we would expect in a country with low tolerance for power
distance, 80% of New Zealanders consider the increasing differences in wealth to be
‘unacceptable’ (Gold et al., 1990), and a majority would like to see the gaps reduced (Calcott,
2000).
3.6 Future Orientation
New Zealand’s rating on this dimension ranks 43rd among the surveyed countries. The
average of 3.47 suggests that we place a comparatively low emphasis on future-oriented
behaviours such as planning, investing in the future, and delaying gratification.
At the time of the GLOBE data gathering, New Zealand was debating proposals for a
compulsory superannuation savings scheme. Savings can act as a safety net, a form of
insurance in times of ill health, unemployment or old age. They require a person or household

15
to forego the pleasure of current expenditure in order to provide for some possible event in
the future, and savings decisions are therefore partly a reflection of future orientation. New
Zealand household saving is low by OECD standards, and has been falling in recent years
(Savage, 1999).
Historically New Zealand has had a comprehensive social welfare scheme. Unlike most other
countries, the New Zealand scheme is non-contributory; benefits are financed from general
taxation, and wage and salary earners are not required to pay regular contributions to a social
security fund. This reduces the risks associated with non-saving, and may encourage a ‘live
for the day’ mentality.
In an organisational context, recent surveys suggest that New Zealand companies are not
paying sufficient attention to long-term planning. A study of manufacturing companies found
evidence of a short-term orientation among many of the sampled firms (Knuckey, Leung-
Wai, & Meskill, 1999). A more comprehensive survey of all sectors concluded that managers
were excessively focused on short-term goals and need to take a longer-term strategic view in
order to achieve sustainable adaptation (Wevers International Ltd/Centre for Corporate
Strategy, 1996).
These examples are consistent with the relatively low rating given to Future Orientation by
the managers in our sample. They also suggest the reasons for such a high emphasis being
given to the “Should Be” rating. Over recent years, increasing public attention has been paid
to the inadequacy of most households’ preparations for the future. Demographic trends and
government reductions in social security provision have highlighted the need for individuals
to adopt a longer time horizon for their planning, while economic deregulation and removal
of subsidies have created similar pressures on businesses.
3.7 Humane Orientation
New Zealand’s low “Should Be” ranking on the Humane Orientation scale may be a
reflection of complacency with its past reputation as a welfare state. The country introduced
its first state-funded welfare assistance (an old age pension) in 1898, extending into
additional programs that culminated in the 1938 Social Security Act, “a bold and daring
experiment that deeply influenced the course of legislation in other countries” (Briggs, 1965,

16
p. 67). Such initiatives gave New Zealand a deserved reputation as one of the leading welfare
states in the immediate post-war period.
Contrasting with this early emphasis on social security is the cultural theme of independence.
This stems from a pioneering background, and the history of people coming to a strange land
and achieving success through their own efforts. This perspective has resulted in people on
welfare payments being criticised as lazy, and labelled as ‘dole bludgers’. Gold and Perry’s
survey (1990) asked for perceptions of who or what is responsible for poverty and
deprivation in New Zealand. While most respondents attributed it to external causes
(unfairness, injustice, bad luck), the single most popular explanation was laziness. The
authors concluded that “sympathy for the poor and deprived in New Zealand is not as deeply
rooted as it might be” (p. 19).
New Zealand’s position as a leading welfare state has declined since the 1960s. In the mid-
1980s the Government reformed the welfare system, shifting from one of universal assistance
to one which provided a ‘safety net’ for those in greatest need, and which encouraged self-
sufficiency (Statistics New Zealand, 1995). In the period since completion of the GLOBE
data gathering, New Zealanders have become increasingly concerned about the evidence of
increasing social disadvantage, and there is increased support for more government spending
on core welfare state activities. However, this humane attitude is kept in check by concern
regarding possible negative effects of welfare on self-reliance, and on the willingness of
people to help each other (Calcott, 2000).
3.8 Themes
These results on the GLOBE societal culture scales reveal similarities with some of the
underlying cultural themes in New Zealand. The importance of egalitarianism is reflected in
our aversion to Power Distance. When coupled with Performance Orientation, it appears that
people are likely to be judged more by their accomplishments than by their background. The
cultural emphasis on performance also makes it clear that we like winners, but we like our
winners to be humble. Assertiveness, especially if it shades into aggressiveness in pursuit of
personal goals, is unwelcome. There is a sense of dislocation, of being unhappy at a
perceived lack of family collectiveness, which echoes some of the literary cultural themes of
‘man alone’. Finally, the independence of the pioneer, the expectation of having to make your
own way, lives on in the responses to the Humane Orientation scale.
17
Several of these themes will be seen to underpin the culturally implicit theory of leadership
held by New Zealanders. Before discussing leadership, however, the following section will
provide background on the industries from which the GLOBE sample was drawn.
4. Food Processing, Finance and Telecommunications Industries
In order to improve comparability among the various countries of the GLOBE study, the
research was carried out in three selected industries - food processing, financial services, and
telecommunications. This section provides brief background material on each sector in New
Zealand, in order to provide a context for later discussion of survey results.
4.1 Food Processing Industry
New Zealand, as a temperate country with low population density, has a long history as an
agricultural producer and exporter. Our ability to attain comparatively high levels of self-
sufficiency in food products (Lattimore, 1994) led to an early emphasis on exporting. As a
British colony in the late nineteenth century, our export activities were oriented largely
towards supplying the British market, and many of our food processing companies
(especially in the meat sector) were established with British capital (Lattimore, 1997). Today,
New Zealand exports of sheepmeat account for 54% of the world export trade, and we are
one of the top five dairy exporters in the world (Statistics New Zealand, 1999). Our export
industries are dominated by companies in the food and beverage sector (Crocombe, Enright,
& Porter, 1991) and, in 1996, food products made up 38.5% of the total value of New
Zealand’s exports (Statistics New Zealand, 1997).
Acting in the role of “Britain’s Farm”, we supplied bulk commodities (such as sheepmeat and
butter), with little in the way of added-value processing. The guaranteed market (and good
returns) meant there was little pressure to develop greater sophistication in our food
processing, or to enter more competitive markets. At the same time, domestically oriented
food processing industries (such as wheat, bakery and cereal products) were given protection
from competition with imports by a system of state import monopolies, consumer restrictions
and phytosanitary restrictions (Lattimore, 1997).
18
During the late 1960s it became increasingly clear that Britain would join the European
Union (EU), and this led to a search for more diverse products and markets. EU agricultural
policy meant the loss of Britain as our largest market for agricultural products, and there has
been a consequent increase in export activity to non-traditional trading partners. Exports to
Asia (including Japan) now account for over 39% of all New Zealand’s exports (Statistics
New Zealand, 1997). Managers of firms in the sector have had to rapidly broaden their
horizons. They have been required to develop greater awareness of diverse customer
requirements, and the technological innovations necessary in order to serve them effectively,
while meeting increasing levels of international competition.
During the decade following Britain’s entry to the EU, government policies continued to
provide a degree of protection for parts of the agricultural sector. Moves to remove this
protection accelerated from 1984, as the new Labour government began a large-scale process
of economic liberalisation and deregulation. New Zealand is now unique among developed
countries in that our farmers receive no subsidies from government and have to compete with
subsidised production from other producing countries (Statistics New Zealand, 1999).
In most of the agricultural and horticultural sectors, producer boards have been established in
order to provide a level of coordination in the processing, marketing and distribution of
products. Some of these boards are able to compulsorily purchase product from farmers, and
have the sole right to export them; in other industries they have less power. This cooperative
approach acts to reduce the variability in returns to producers.
4.2 Financial Services Industry
The banking and financial services sector in New Zealand today is highly competitive but it
hasn’t always been that way. Until the mid-1980s, only four commercial banks operated in
the country, and these were subject to governmental controls over their interest rates,
investments, and lending portfolios. Other organisations (such as savings banks, building
societies and finance companies) offered a more limited range of banking service, and were
also subject to tight government control.
Strong restrictions on foreign exchange transactions effectively protected New Zealand banks
from overseas competition, and the lack of any effective competition in the sector meant that
19
little innovation occurred. Ledingham (1995 p. 163) has characterised the sector at this time
as being “boringly stable”.
The large commercial banks developed multi-levelled hierarchies and mechanistic cultures
appropriate for the stable and predictable environment. They were also dominated by male
managers at higher levels in the hierarchy, despite having a majority of female employees
(see, for example, Bank of New Zealand, 1984). Large overseas banks or the government
owned the commercial banks and their savings bank subsidiaries, and other savings banks
were either owned by government or had explicit government guarantees. Probably in
common with many other countries, commercial banks were considered to be cautious and
conservative, with cultures ill-suited to rapid or radical change (Harris, 1996).
During the 1970s and 1980s, competition developed outside the banking sector, with finance
companies, building societies and other organisations beginning to capture an increasing
share of the deposits and lending markets. These institutions exerted pressure to be allowed
entry to other activities (such as foreign exchange dealing) which government regulations
excluded them from. The distinction between banks and non-banks began to diminish and, in
1984-85, government carried out major reform of the financial sector.
These reforms included the removal of foreign exchange and interest rate controls, and had
the effect of drastically increasing the level of competition in the sector. Domestic banks also
became exposed to international competition. In 1986, new banks were allowed to set up in
New Zealand, and a total of 21 new banks were approved. Some of these were building
societies or finance companies already operating in New Zealand, but 10 were effectively
new participants. In further moves, the government sold the banks which it controlled (1989-
1992) and withdrew its explicit guarantee of deposits at trustee savings banks (1988).
At the same time these regulatory changes were occurring, banks had to cope with major
changes in technology. The extensive introduction of electronic payments systems,
development of new products, and exposure to international innovations placed pressure on
managers whose past experience was in a more stable and predictable world.
During the 1990s, the financial sector has continued to evolve as a result of pressures to
increase cost efficiencies and improve customer service. Large mergers have resulted in
closure of branches, and staff redundancies, while accelerating uptake of telephone banking,
ATMs and other technology increases the pressure to reduce staffing. More than one third of

20
New Zealand’s bank branches were closed between 1993 and 1998, with staffing being
reduced by 11%. The number of ATMs increased by over 30% in the same period (1999;
Harris, 1996; Love, 1996).
4.3 Telecommunications Industry
Prior to 1 April 1987, all telecommunications services, both domestic and international, were
provided by the state-controlled New Zealand Post Office. The Post Office’s statutory
monopoly also extended to the provision of telecommunications equipment, such as domestic
telephones and commercial switchboards.
In the mid-1980s New Zealand experienced rapid growth in the demand for
telecommunication services. An explosion in the use of computers by both the private and
public sectors increased the use of communication networks. The increasing use of
information technology was creating a demand for new services, and the national network
was severely overloaded. At times it was impossible to get a call through from New
Zealand’s largest city, Auckland, to the capital, Wellington. Long delays in the provision of
telephone services were common, with customers having to wait 6-8 weeks for a telephone to
be installed (Telecom Corporation of New Zealand, 1993).
Over the years, the government had been influenced by social and political objectives when
setting prices for telecommunications services. Significant cross subsidisation meant that
prices bore little relation to the cost of supplying services. In addition, all prices had to be
approved by the Postmaster General.
In 1986, the Fourth Labour Government, as part of a programme to free the New Zealand
economy from rising public debt and to make State Service delivery organisations more
efficient and accountable, passed the State Owned Enterprise Act. New corporate state
trading companies were formed to operate as commercially accountable enterprises. Telecom
Corporation of New Zealand Limited, one of those companies, began operating on 1 April
1987 (Wagner, 1994).
When Telecom was corporatised, its first priority was to restructure the company in
preparation for deregulation and eventual competition. The old centralised bureaucracy was
dismantled and a new decentralised organisation structure was put in place. In addition,

21
Telecom embarked upon a number of programmes to increase service quality, network
reliability, personnel productivity, and profitability. Vigorous cost-cutting programmes were
put into place, a substantial number of jobs were made redundant, and outdated systems were
replaced with computerised alternatives. The whole telecommunication network was
substantially upgraded, and a progressive programme to remove cross-subsidies through
tariff re-balancing was begun. (Telecom Corporation of New Zealand, 1993).
In 1990 Telecom Corporation was privatised through sale to a consortium headed by two
American telecommunications companies, Ameritech and Bell Atlantic for $NZ 4.35 billion.
This was the sixth biggest deal in the world in 1990 and, until recently, the biggest deal in
New Zealand history (Hyde, 1991).
As part of the deregulation process, new competitors entered the market. Clear
Communications introduced competition in the tolls and local call market, and is now
competing as an internet service provider. BellSouth (now owned by Vodafone) is catching
Telecom in the mobile phone market, and Australian firm Telstra is targeting the
international toll call business of commercial organisations. International companies
(including Motorola, Nokia and Ericsson) are selling telecommunications equipment, and
New Zealand companies (such as Ben Rumble) have entered the retail equipment sales and
servicing sector.
Despite the huge increase in competition over the past fifteen years, Telecom still has a
natural monopoly in regard to the ‘local loop’, the wires connecting individual households to
the exchange. Several competitors have taken Telecom to court claiming anticompetitive
practices, and the present government has promised an enquiry to review the current ‘light
handed’ regulatory regime. The Telecommunications Users Association of New Zealand
believes there is insufficient competition in some value-added services (eg ISDN lines), and
the Ministry of Commerce has estimated “deadweight losses arising from monopoly rents in
telecommunications” to be between $50 million and $250 million each year (Gordon, 1997).
In summary, all three of the industries surveyed in this part of the GLOBE project have
experienced significant pressures to increase effectiveness and efficiency as they operate in
an environment characterised by increasing competition, greater demands for technology
investment, and reduced governmental support and protection.

22
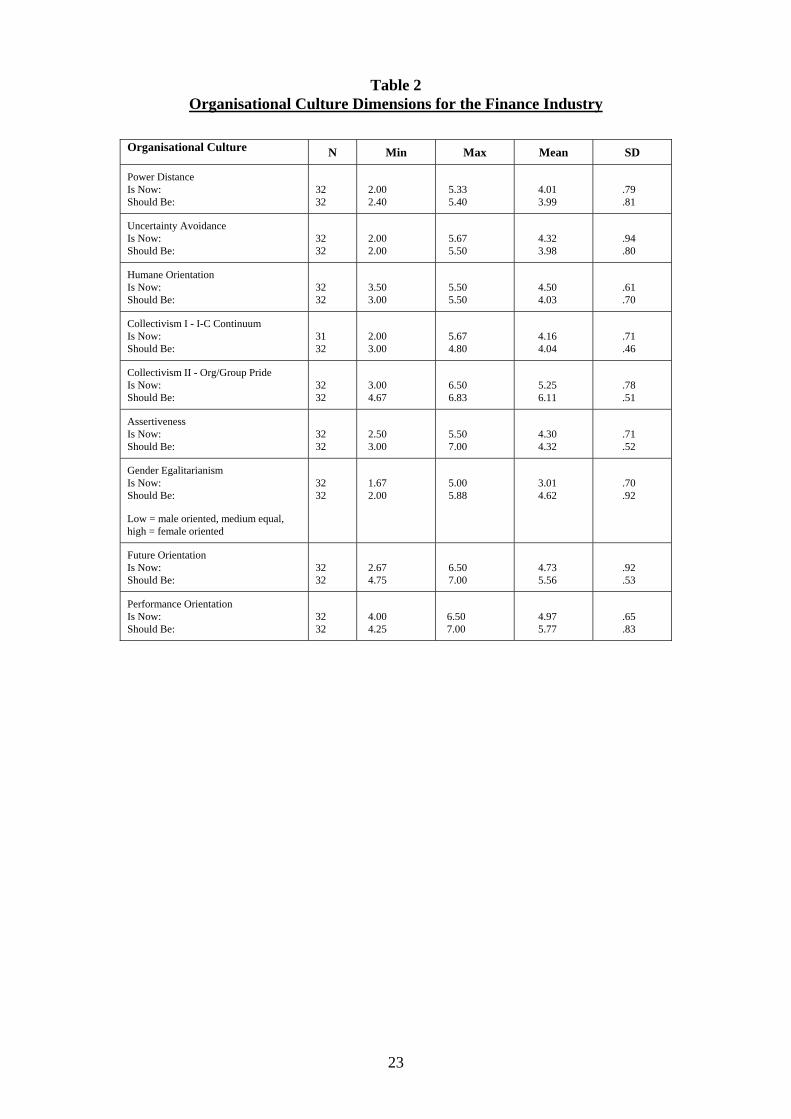
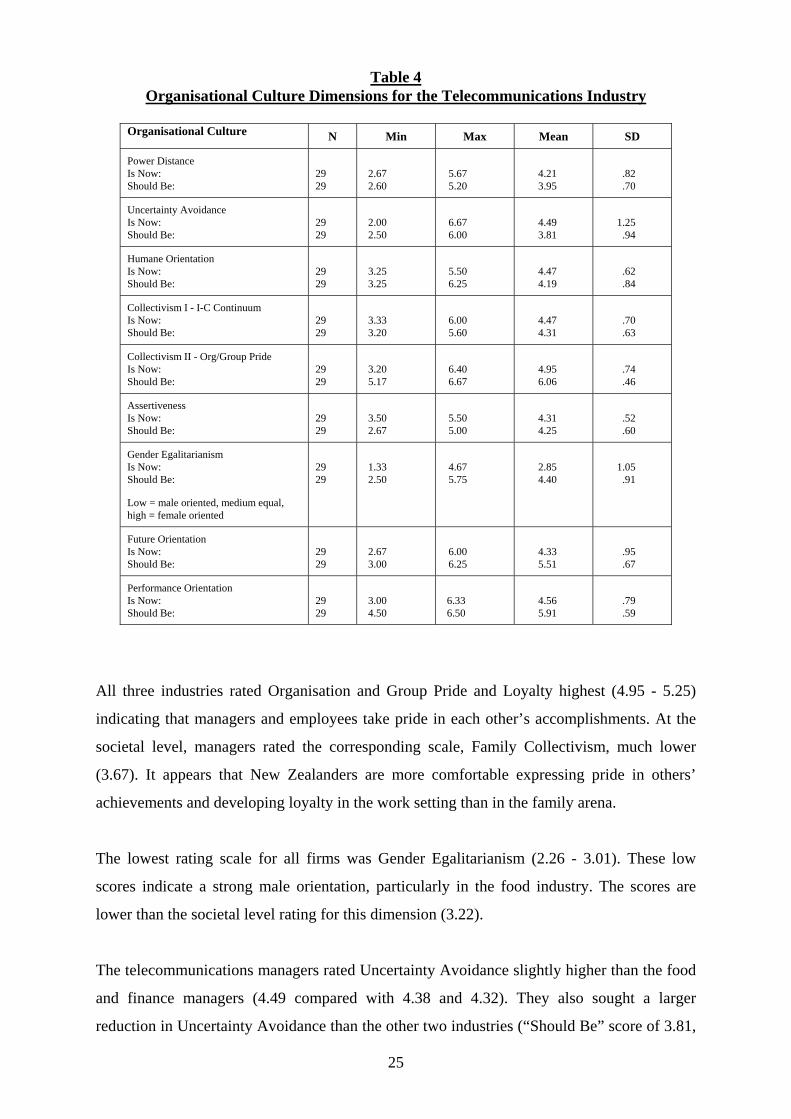
5. Organisational Culture Results
The GLOBE survey incorporated a measure of dimensions of organisational culture that
parallel the societal culture scales. Approximately half of the survey sample completed the
societal items, with the remaining managers completing the organisational items. The results
for the three industries are summarised in Table 2, Table 3, and Table 4.
23
Table 2 Organisational Culture Dimensions for the Finance Industry
Organisational Culture N Min Max Mean SD
Power Distance Is Now: Should Be:
32 32
2.00 2.40
5.33 5.40
4.01 3.99
.79 .81
Uncertainty Avoidance Is Now: Should Be:
32 32
2.00 2.00
5.67 5.50
4.32 3.98
.94 .80
Humane Orientation Is Now: Should Be:
32 32
3.50 3.00
5.50 5.50
4.50 4.03
.61 .70
Collectivism I - I-C Continuum Is Now: Should Be:
31 32
2.00 3.00
5.67 4.80
4.16 4.04
.71 .46
Collectivism II - Org/Group Pride Is Now: Should Be:
32 32
3.00 4.67
6.50 6.83
5.25 6.11
.78 .51
Assertiveness Is Now: Should Be:
32 32
2.50 3.00
5.50 7.00
4.30 4.32
.71 .52
Gender Egalitarianism Is Now: Should Be:
Low = male oriented, medium equal, high = female oriented
32 32
1.67 2.00
5.00 5.88
3.01 4.62
.70 .92
Future Orientation Is Now: Should Be:
32 32
2.67 4.75
6.50 7.00
4.73 5.56
.92 .53
Performance Orientation Is Now: Should Be:
32 32
4.00 4.25
6.50 7.00
4.97 5.77
.65 .83

24
Table 3 Organisational Culture Dimensions for the Food Industry
Organisational Culture N Min Max Mean SD
Power Distance Is Now: Should Be:
30 30
1.33 2.00
5.00 5.20
3.76 4.01
.97 .88
Uncertainty Avoidance Is Now: Should Be:
30 30
1.67 2.25
6.00 5.50
4.38 4.38
1.32
.88
Humane Orientation Is Now: Should Be:
30 30
3.25 3.25
5.25 5.25
4.50 4.00
.57 .63
Collectivism I - I-C Continuum Is Now: Should Be:
30 30
3.33 3.20
5.67 6.00
4.81 4.41
.68 .63
Collectivism II - Org/Group Pride Is Now: Should Be:
30 30
4.00 3.83
6.40 6.83
5.03 5.96
.71 .64
Assertiveness Is Now: Should Be:
30 30
2.00 2.00
5.25 5.33
4.08 4.03
.78 .86
Gender Egalitarianism Is Now: Should Be:
Low = male oriented, medium equal, high = female oriented
30 30
1.00 2.00
4.33 6.00
2.26 4.37
.73
1.09
Future Orientation Is Now: Should Be:
30 30
3.00 3.75
6.33 6.50
4.90 5.35
.83 .67
Performance Orientation Is Now: Should Be:
30 30
3.25 4.25
6.00 7.00
4.59 5.80
.74 .67
25
Table 4 Organisational Culture Dimensions for the Telecommunications Industry
Organisational Culture N Min Max Mean SD
Power Distance Is Now: Should Be:
29 29
2.67 2.60
5.67 5.20
4.21 3.95
.82 .70
Uncertainty Avoidance Is Now: Should Be:
29 29
2.00 2.50
6.67 6.00
4.49 3.81
1.25
.94
Humane Orientation Is Now: Should Be:
29 29
3.25 3.25
5.50 6.25
4.47 4.19
.62 .84
Collectivism I - I-C Continuum Is Now: Should Be:
29 29
3.33 3.20
6.00 5.60
4.47 4.31
.70 .63
Collectivism II - Org/Group Pride Is Now: Should Be:
29 29
3.20 5.17
6.40 6.67
4.95 6.06
.74 .46
Assertiveness Is Now: Should Be:
29 29
3.50 2.67
5.50 5.00
4.31 4.25
.52 .60
Gender Egalitarianism Is Now: Should Be:
Low = male oriented, medium equal, high = female oriented
29 29
1.33 2.50
4.67 5.75
2.85 4.40
1.05
.91
Future Orientation Is Now: Should Be:
29 29
2.67 3.00
6.00 6.25
4.33 5.51
.95 .67
Performance Orientation Is Now: Should Be:
29 29
3.00 4.50
6.33 6.50
4.56 5.91
.79 .59
All three industries rated Organisation and Group Pride and Loyalty highest (4.95 - 5.25)
indicating that managers and employees take pride in each other’s accomplishments. At the
societal level, managers rated the corresponding scale, Family Collectivism, much lower
(3.67). It appears that New Zealanders are more comfortable expressing pride in others’
achievements and developing loyalty in the work setting than in the family arena.
The lowest rating scale for all firms was Gender Egalitarianism (2.26 - 3.01). These low
scores indicate a strong male orientation, particularly in the food industry. The scores are
lower than the societal level rating for this dimension (3.22).
The telecommunications managers rated Uncertainty Avoidance slightly higher than the food
and finance managers (4.49 compared with 4.38 and 4.32). They also sought a larger
reduction in Uncertainty Avoidance than the other two industries (“Should Be” score of 3.81,

26
compared with 4.38 and 3.98 for Food and Finance). The telecommunications sample
included managers from Telecom New Zealand, the largest listed company in New Zealand
and the privatised descendant of the old New Zealand Post Office. This firm is actively
seeking to become more responsive and less bureaucratic. The sample also included a
number of smaller entrepreneurial companies, new to the New Zealand market. The standard
deviation for this scale (1.25) was the highest of all the organisational culture scales, and this
may be a function of this spread of companies. Some managers (perhaps from the smaller
companies) saw themselves as operating in a relatively unstructured context, tolerating very
high levels of uncertainty, while others considered the degree of structure, control and rules
to be quite high.
All three industries sought significant increases (in excess of one standard deviation) in
Performance Orientation, with telecommunications managers wanting the biggest shift (from
4.56 to 5.91). Similarly, all three industries wanted to increase their level of Future
Orientation, with telecommunications managers again wanting the biggest change (from 4.33
to 5.51). These desired changes are coupled with a desire to reduce Humane Orientation. In
terms of cultural shift, all three industries are looking to extend their planning horizon, and
seek greater performance improvements while reducing the level of friendliness, sensitivity
to others, and tolerance for mistakes.
All three industries want to markedly increase the level of Organisational/Group Pride and
Loyalty (by more than one standard deviation). For all three industries, this “Should Be”
scale was rated highest out of all the cultural scales (with means ranging from 5.96 to 6.11).
The low standard deviations suggest a high level of agreement among the respondents. In
light of the desired reduction in Humane Orientation, this suggests a shift towards
recognising and valuing people more on the basis of their ability to contribute to the group,
than for their essential humanity.
The ratings of organisational Assertiveness are somewhat higher than for societal
Assertiveness, although food industry managers gave it a slightly lower rating than the other
two industries. There is almost no difference between the “As Is” and the “Should Be”
scores. In contrast, the male orientation evident in all industries was seen as unacceptable,
and all three expressed a desire to shift this towards a more balanced position. The “Should
Be” scores on Gender Egalitarianism are 1.5 - 2.8 standard deviations higher than the “As Is”
scores.

27
6. Previous Research on Leadership
Leadership is a popular topic in magazines aimed at practising managers, and some of this
material will be described later in this chapter. Academic research into leadership behaviours
is more difficult to find. The leadership chapters in two recent New Zealand management and
organisational behaviour textbooks (Inkson & Kolb, 1997; McLennan, 1995) include only
five citations to indigenous leadership research, of which three are unpublished discussion
papers.
Some recent studies are beginning to consider the cultural influences of increasing ethnic
diversity on New Zealand leadership. Ah Chong and Thomas (1995) discuss research into
aspects of cross-cultural leadership in New Zealand, referring to a number of studies (see, for
example, Love, 1993; Nedd & Marsh, 1983; Pringle & Henry, 1993) illustrating differences
in style between New Zealand European, Maori and Polynesian leaders. With Treaty of
Waitangi settlements leading to greater Maori investment in property, tourism and fishing
industries, there is an increased interest in Maori management styles (Tapsell, 1997). As
noted in the introduction to the culture section, however, the focus of the GLOBE study was
on the dominant (New Zealand European) pattern of leadership. The following review of
leadership research in New Zealand will therefore leave aside material on Maori and Pacific
Island leadership styles.
Just over twenty-five years ago, George Hines, a psychologist at Victoria University of
Wellington, wrote a book called The New Zealand Manager (Hines, 1973). The work is
based on survey research into the background, attitudes, business practices, motivation and
psychological characteristics of over 2,400 New Zealand managers. This work, and others by
the same author, has been viewed by some as marking the beginning of organisation
behaviour as a research-based discipline in New Zealand (Inkson, 1987)
Hines identified a number of characteristics of the business environment that he considered
vital to an understanding of the nature of New Zealand management. Two in particular are
the relative classlessness of New Zealand society, and the small size of New Zealand firms.
He argued that management style in New Zealand was influenced by the lack of a formal
class structure. Individuality and independence were valued, together with an emphasis on

28
performance rather than social status. New Zealand (at that time) also lacked the large salary
differentials that, in some countries, create a divide between labour and management.
In a similar vein, he pointed to the small size of the average New Zealand company.
Managers can’t hide from their employees. Personal relationships develop, decisions are
generally conveyed face-to-face, and there is nowhere to hide when problems arise. Sir James
Wattie, founder of Wattie’s Foods (now part of the Heinz group) is a good example of these
attributes. As Chief Executive, he used to eat in the staff cafeteria, and placed a high value on
the information he gained from informal interaction with staff at all levels in his factory
(Irving & Inkson, 1998).
In evaluating the role of Herzberg’s ‘hygiene’ and ‘motivator’ factors, Hines reported that
New Zealand managers placed a significantly greater weight on interpersonal relationships
than did North American and European managers. He suggested that this finding related to
the small size of New Zealand companies, the opportunities for frequent interactions between
people at all levels, and the lack of arbitrary class differences.
Hines’ survey was consistent with other research that had found New Zealand managers to be
conservative in outlook (Wilson & Patterson, 1968). He commented on the association
between conservatism and other factors, including adherence to rules and regulations,
resistance to change, compliance with existing norms, and a preference for stability,
predictability and security. This links closely with the GLOBE dimension of Uncertainty
Avoidance, and is consistent with the high ‘Is Now’ rating given to this dimension in the
GLOBE study.
Hines’ respondents felt they needed to expend considerable effort to meet the demands of
their jobs, and most of them felt that they usually accomplished more than they set out to
achieve. There was a desire, particularly among those who liked their work the most, to work
hard in order to achieve success and exceed the minimum requirements of the job. Inkson
(1974) found managers disliked having their concerns to improve work performance being
frustrated or obstructed by others in the organisation. Over half of his sample felt they were
contributing less to their organisation than they were capable of as a result of insufficient
delegation from their manager, and a tendency for top management to spend too much time
on “trivial office routine and decision-making” (p. 25). Inkson concluded that New Zealand
managers were not meeting their basic responsibilities towards staff – they were not
29
involving them, delegating effectively, stretching them, or giving appropriate feedback and
recognition.
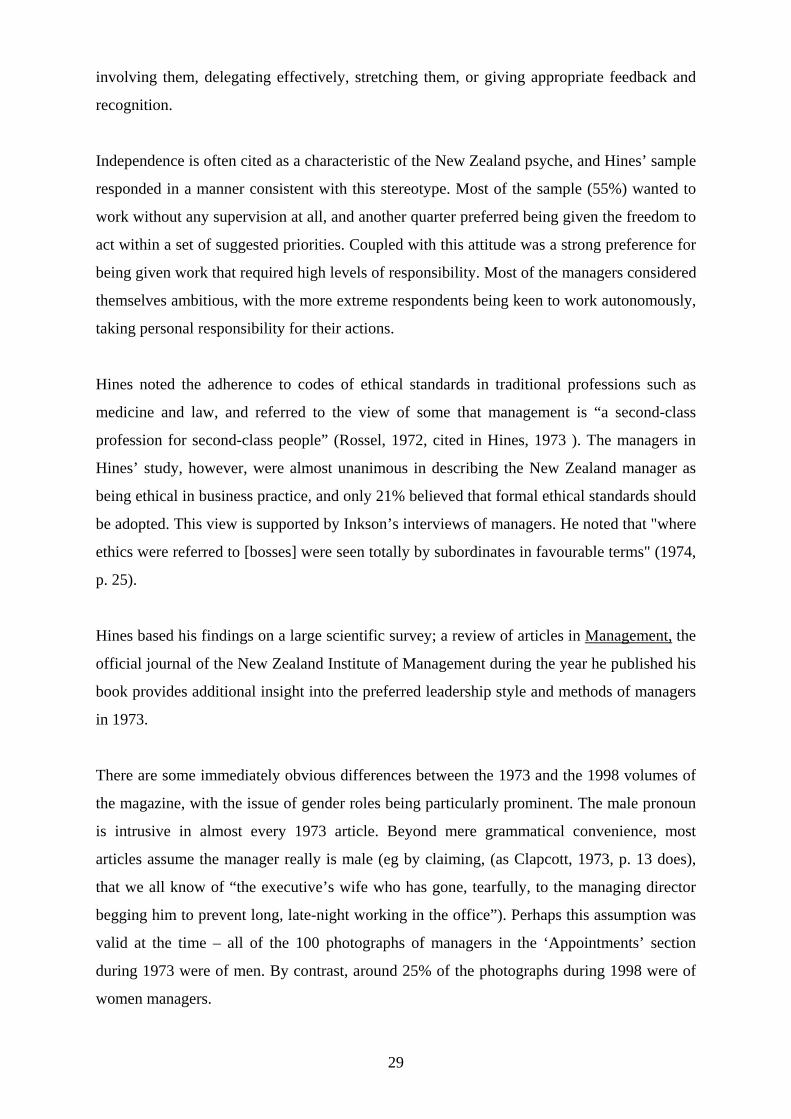
Independence is often cited as a characteristic of the New Zealand psyche, and Hines’ sample
responded in a manner consistent with this stereotype. Most of the sample (55%) wanted to
work without any supervision at all, and another quarter preferred being given the freedom to
act within a set of suggested priorities. Coupled with this attitude was a strong preference for
being given work that required high levels of responsibility. Most of the managers considered
themselves ambitious, with the more extreme respondents being keen to work autonomously,
taking personal responsibility for their actions.
Hines noted the adherence to codes of ethical standards in traditional professions such as
medicine and law, and referred to the view of some that management is “a second-class
profession for second-class people” (Rossel, 1972, cited in Hines, 1973 ). The managers in
Hines’ study, however, were almost unanimous in describing the New Zealand manager as
being ethical in business practice, and only 21% believed that formal ethical standards should
be adopted. This view is supported by Inkson’s interviews of managers. He noted that "where
ethics were referred to [bosses] were seen totally by subordinates in favourable terms" (1974,
p. 25).
Hines based his findings on a large scientific survey; a review of articles in Management, the
official journal of the New Zealand Institute of Management during the year he published his
book provides additional insight into the preferred leadership style and methods of managers
in 1973.
There are some immediately obvious differences between the 1973 and the 1998 volumes of
the magazine, with the issue of gender roles being particularly prominent. The male pronoun
is intrusive in almost every 1973 article. Beyond mere grammatical convenience, most
articles assume the manager really is male (eg by claiming, (as Clapcott, 1973, p. 13 does),
that we all know of “the executive’s wife who has gone, tearfully, to the managing director
begging him to prevent long, late-night working in the office”). Perhaps this assumption was
valid at the time – all of the 100 photographs of managers in the ‘Appointments’ section
during 1973 were of men. By contrast, around 25% of the photographs during 1998 were of
women managers.

30
In reviewing the 1973 volume for insights into leadership, one of the most revealing findings
is the paucity of information. Not one of the feature articles included the word ‘leadership’ in
its title. The articles coming closest to addressing leadership were a series on Management by
Objectives by an American consultant, recently settled in New Zealand (Mordka, 1973a, b),
and an article on delegation principles (Harris, 1973). Articles on productivity improvement,
safety, marketing and other functional topics were most prevalent, perhaps reflecting the
comparative strength of the manufacturing sector at the time. This is consistent with the
finding of Place (1971) cited by Hines (1973) that New Zealand business magazines in the
early 1970s gave very little emphasis to ‘industrial psychology’ topics.
Ransom (1973) decried the “abysmal lack of knowledge about management of New Zealand
companies”. Hume, (1973) studied the recruitment and selection practices of Auckland
employers. The interviewees in her sample appeared unable to articulate the set of personal
qualities (over and above more objective requirements of experience and qualifications)
necessary for success in management roles. During 1973 the University of Auckland
appointed a new staff member tasked with creating courses in organisational behaviour
(1973, p. 37).
Kaiser (1973) commented on the part played by authoritarian management styles in creating
or prolonging industrial disputes. He noted the frequent use of hierarchical, authoritarian
styles of management, and suggested that the “consultative way of communicating is
receiving a lot more attention” (p.19). The state of industrial relations at the time forms an
undercurrent to many articles, with reference to the ‘us versus them’ mentality and the
confrontational nature of labour/management relationships.
In an editorial, Niblock (1973) refers to a speech by a young (37 year old) general manager,
who, proclaiming the 1970s to be the ‘age of youth’, welcomes the trend towards “young
people taking over the traditional bastion of conservatism itself; the world of industry,
commerce and finance.” (p. 3). Ten years later, the fourth Labour government initiated a
dramatic and significant restructuring of the New Zealand economy. The scale of this change
can be gauged by the description in the previous section of its effects on the food, financial
services and telecommunications industries.

31
Conservatism was no longer an option for managers. The qualities reflected by leadership
research and practice during the 1970s would not suffice for the 1990s or beyond. The sense
of sharp transition, of a watershed in the demands on leaders, is clear:
"If our past existence had created an environment where the basic parameters for leadership were set, where the solid virtues, sound administration, transactional leadership, and strong control were sufficient for success, then the new environment has changed things irrevocably. Qualities previously unnecessary in New Zealand management suddenly became critical not for spectacular success, but for mere survival: innovation, lateral thinking, vision, entrepreneurship (and its organisation corollary, ‘intrapreneurship’), networking ability, international orientation." (Inkson & Henshall, 1990, p.164).
Transformational leaders became more visible at the helm of many New Zealand companies
(Inkson, Henshall, Marsh, & Ellis, 1986), the prevalence of ‘high commitment’ management
practices increased (Hamilton, Dakin, & Loney, 1992) and research began to indicate the
increased value subordinates placed on transformational behaviours (Singer, 1985).
In 1993 and 1996 the New Zealand Institute for Economic Research published studies that
examined the ways in which New Zealand private sector management had adjusted to the
structural changes and deregulation of the preceding decade (Campbell-Hunt & Corbett,
1996; Campbell-Hunt, Harper, & Hamilton, 1993). These reports found evidence of
increasing emphasis on teamwork, training and performance rewards (with a dramatic
increase in the use of performance-linked pay systems since introduction of the Employment
Contracts Act in 1991). On the other hand, longer-term issues such as career development,
labour planning, and the link between training policy and strategic planning received
insufficient attention. This pattern is consistent with the high Performance Orientation and
low Future Orientation scores reported in the culture section above.
The studies report that leaders showed increasing awareness of the need to create more
flexible organisation structures, improve the communication of their vision to staff, and
involve people more effectively in the development of strategy. Evidence suggested,
however, that many managers did not know how to transform this awareness into action
(Frater, Stuart, Rose, & Andrews, 1995; Wevers & Company, 1994). Campbell-Hunt and
Corbett concluded that, in 1996, New Zealand managers were “only part-way through a
change in style from a hierarchical, ‘command and control’ mentality to an empowering,
‘delegate and coach’ style” (Campbell-Hunt et al., 1996, p.98).
32
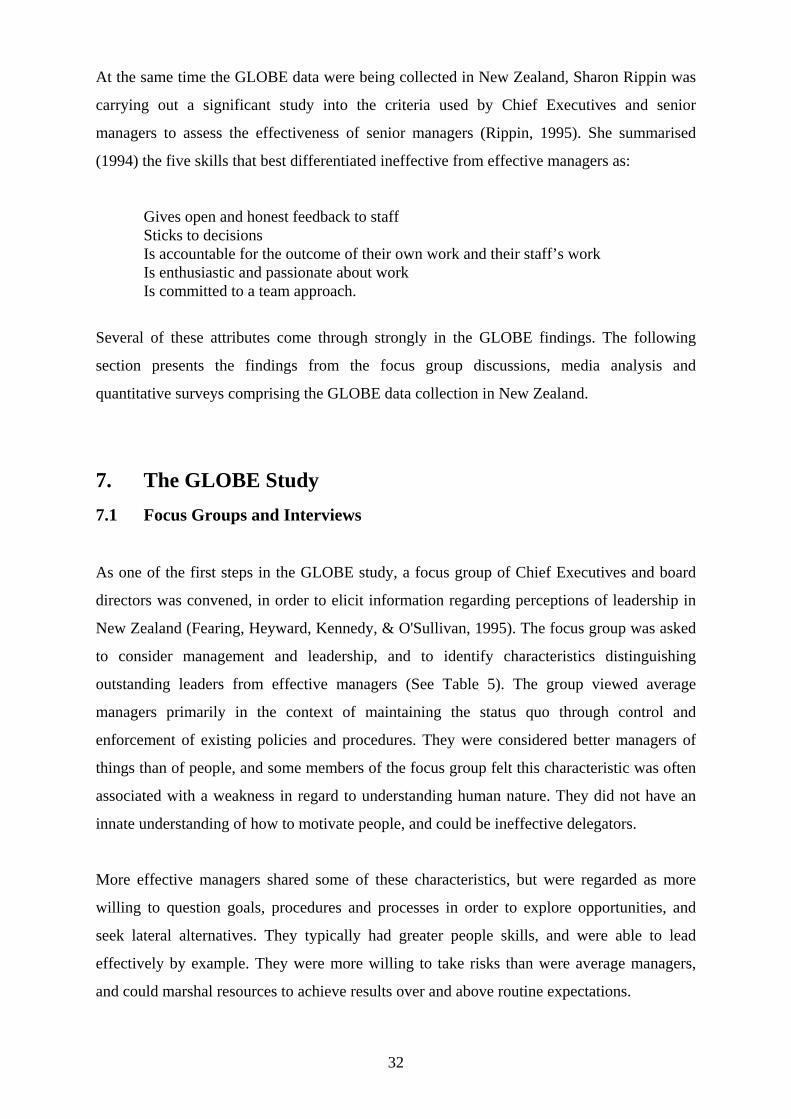
At the same time the GLOBE data were being collected in New Zealand, Sharon Rippin was
carrying out a significant study into the criteria used by Chief Executives and senior
managers to assess the effectiveness of senior managers (Rippin, 1995). She summarised
(1994) the five skills that best differentiated ineffective from effective managers as:
Gives open and honest feedback to staff Sticks to decisions Is accountable for the outcome of their own work and their staff’s work Is enthusiastic and passionate about work Is committed to a team approach.
Several of these attributes come through strongly in the GLOBE findings. The following
section presents the findings from the focus group discussions, media analysis and
quantitative surveys comprising the GLOBE data collection in New Zealand.
7. The GLOBE Study 7.1 Focus Groups and Interviews
As one of the first steps in the GLOBE study, a focus group of Chief Executives and board
directors was convened, in order to elicit information regarding perceptions of leadership in
New Zealand (Fearing, Heyward, Kennedy, & O'Sullivan, 1995). The focus group was asked
to consider management and leadership, and to identify characteristics distinguishing
outstanding leaders from effective managers (See Table 5). The group viewed average
managers primarily in the context of maintaining the status quo through control and
enforcement of existing policies and procedures. They were considered better managers of
things than of people, and some members of the focus group felt this characteristic was often
associated with a weakness in regard to understanding human nature. They did not have an
innate understanding of how to motivate people, and could be ineffective delegators.
More effective managers shared some of these characteristics, but were regarded as more
willing to question goals, procedures and processes in order to explore opportunities, and
seek lateral alternatives. They typically had greater people skills, and were able to lead
effectively by example. They were more willing to take risks than were average managers,
and could marshal resources to achieve results over and above routine expectations.

33
Average managers were viewed as controllers, whereas leaders were more democratic and
team-oriented. The focus group was convened shortly after the death of one of New
Zealand’s celebrated war heroes, double-Victoria Cross winner Charles Upham. One of the
group participants noted that Upham always claimed his team was “very hard to control, but
a lot easier to lead”. This nicely captures the ambivalent feeling many New Zealanders have
in regard to formal restraint and control
In distinguishing leadership from management, the group also emphasised the importance of
developing a clear vision, and a set of beliefs that are passed on to peers and subordinates.
Leaders were seen as high achievers, with their success leavened by humility. New
Zealanders like ‘humble winners’.
A cluster of traits emerging from the discussion concerned the personal characteristics of
modesty, humility, and recognition of one’s own weaknesses, balanced with a healthy respect
for self and others. Outstanding leaders in New Zealand are not self-absorbed, “cocky”, or
bent on Machiavellian control of others. They see their leadership role as being based in the
team, not outside it. They evidence a strong commitment to the value of teamwork, a
willingness to be a “team player” themselves, and to actively contribute their own efforts and
ideas, rather than try to lead from a distance. As one participant noted:
They get around their troops a lot, they make sure they talk to everybody; they make people really feel part of a team, as though they’re important. It’s their people skills; they understand the strengths and weaknesses of the team.

34
Table 5 Manager and Leader Characteristics Identified by Focus Group
Characteristics Reported by Focus Group Participants
Average Manager Above-Average Manager Outstanding Leader Concerned with maintenance Better at managing things Policies and procedures Controller, not expander Maintains status quo Regular (eg works 9.00 – 5.00) Not completely focused Compromises Doesn’t fully understand human nature Problems with delegation Patterned Controlled outcome, standard requirement
Has flair for growth and opportunity Uses lateral thinking Good with people and involves them as a team Communicates well Growth-oriented: Sets some goals Uncertain about projecting visions and beliefs throughout the organisation Not visionary: Works on a day-to-day or yearly basis More focused than average manager Prepared to take risks to some extent Leads by example Not afraid of making important decisions Has better understanding of people and the business than average manager Aims to achieve a result beyond given expectations Uses resources effectively
Total commitment (“love”) for people Articulate and persuasive Possess high degree of integrity High achiever, both in and outside of work Charismatic – has the “X” factor Consistent Democratic Trusting of others Team player Have strong communication and people skills Customer-oriented Humble Imperfect, but know own weaknesses Have respect for self Experienced and well-rounded Pragmatic
7.2 Media Analysis
An additional qualitative insight into New Zealand leaders was gained from completion of a
survey of leadership references in print media during a one-week period at the end of 1997
(Godfrey & Kennedy, 1998). The sample media comprised two business magazines
(Management and New Zealand Business), two business weekly newspapers (The
Independent and National Business Review) and three daily newspapers (Auckland’s New
Zealand Herald, Wellington’s Dominion, and Christchurch’s Press). All references to New
Zealand leaders (in political, commercial and community spheres) were identified and coded.
A total of 557 data elements (from 320 separate text extracts) were categorised iteratively,

35
starting with fine-grained categories containing only a few items. These were combined
progressively into broader categories in successive rounds.
The final number of categories was 26, clustered into five main facets of leadership; these
consisted of two behavioural categories (organisation management and people management),
personality, ability and image. The categories are listed in Table 6, with the most frequently
represented categories listed first in each column. Categories containing less than six data
elements (equivalent to 1% of the total set) are printed in italics; categories including
elements referring only to political leaders are labelled (P).
Table 6 Categories Emerging from Media Analysis
Organisation Management
People Management
Personality Ability Image
Taking action Strategic management Development Change management Setting ethical standards
Motivator Communicator Relationship builder Team player Director Information provider (P)
Traits Leader style Realism (P)
Abilities Knowledge and understanding Worthiness Information management Cultural awareness Conceptual thinking
Impression management Conduct Public image Consistency Political expediency (P)
The largest category, representing 30% of the data elements, was that of personality traits.
Within this cluster, the largest subcategory referred to determination, resolve, ‘stickability’
and perseverance towards accomplishment of goals. Confidence was the second-largest
subcategory, encompassing belief in oneself, and an optimistic outlook. Passion, energy and
commitment comprised the next cluster of attributes. Attributes that were consistently
presented as being undesirable included arrogance, emotionality, panic and weakness.
The second largest category referred to aspects of taking action. Being active, responsive and
proactive were viewed positively, while negative connotations applied to behaviours such as
delaying, reneging on commitments, and becoming complacent.
The next most common category was that of strategic management. This included data
elements relating to vision, planning, policy, strategy and purpose.

36
The importance of personality traits in describing leaders is consistent with some of Rippin’s
work. In her study of the effectiveness of New Zealand senior managers she found that “the
effectiveness of managers is largely assessed on personality dimensions” (1995, p.190).
7.3 The Leadership Scales
The GLOBE leadership questionnaire asked respondents to rate various leadership
behaviours and traits on a seven-point scale according to the extent they contributed to
‘outstanding leadership’ in New Zealand. Table 7 presents the mean score for each of the 21
first-order leadership factors and the six second-order factors (in bold). The numbers in
parentheses are New Zealand’s rankings in comparison with the other 61 countries. As with
the cultural scales, countries have been grouped into a number of bands according to their
scale score, and the standard error of difference. The table represents this graphically, with
the number of cells in each row representing the number of distinct bands for that scale.

37
Table 7 New Zealand Leadership Styles
Average Scores, Relative to Other Countries in
Sample Leadership Dimension
High End Above Average
Below Average
Low End
Charismatic/Value Based
5.87 (35) Band C (A-I)
Charismatic I: Visionary 6.23 (16)
Charismatic II: Inspirational
6.50 (3)
Charismatic III: Self Sacrificiala
4.88 (41)
Integrityb 5.49 (58)
Decisivec 5.69 (45) Performance Orientation 6.31 (13) Team Oriented 5.44 (56) Band D (A-G) Team I: Collaborative Team Orientationa
5.21 (51)
Team II: Team Integratora 5.71 (43) Diplomatic 5.22 (54) Malevolent (Reverse scored)
1.83 (21)
Administratively Competent
4.79 (60)
Self-Protective 3.19 (45) Band F (A-I) Self-Centreda 2.23 (22) Status Consciousnessa 3.56 (56) Conflict Inducer 3.74 (43) Face-saver 2.39 (53) Procedural 3.86 (33) Participative 5.50 (24) Band B (A-F) Autocratic (Reverse) 2.63 (31) Non-participative (Reverse)
2.38 (47)
Humane 4.78 (36) Band B (A-E) Modest 4.57 (52) Humane Orientationa 5.09 (18) Autonomous 3.77 (35) Band B (A-D) Autonomousd 3.77 (37)
a Only one country was categorised in Band D. b Only one country was categorised in Band E. c 60 of the 62 countries fell into the two top bands, with one each in Bands C and D. d Only one country was categorised in Band C.

38
In terms of absolute scale values, New Zealand managers gave three scales average ratings in
excess of 6.0 on the seven point scale: Charismatic II Inspirational, Performance Orientation,
and Charismatic I Visionary. A further two scales (Team Integrator and Decisive) were rated
5.5 or higher.
At the low end Malevolent, Self-Centred, Non-Participative, and Face-Saver all had average
ratings lower than 2.4 and were thus seen as seriously inhibiting effective leadership.
At a simple level then, an outstanding leader in New Zealand is seen as a positive, optimistic
person who is able to generate confidence, enthusiasm and excitement among followers,
challenging them to exceed expectations in pursuit of future goals. He or she is a good
communicator, sharing information to ensure common understanding among followers, and
encouraging them to work as an integrated team. The leader must be prepared to make
decisions firmly and resolutely, whether based on logic or intuition. This decisiveness needs
to be balanced, however, by recognition of the individual abilities of team members (without
regard to their status); the leader must not be a micro-manager, and must be willing to share
the decision-making with capable team members. Personal qualities such as irritability,
cynicism, conceitedness or lack of sincerity undermine leadership effectiveness.
While the Team Integrator dimension was ranked fourth highest, the other team scale
(Collaborative Team Orientation) was ranked eighth. This second team scale places more
emphasis on behaviours such as mediation (solving conflicts between team members), group
welfare, friendliness with subordinates, and support for people experiencing problems.
The overall pattern emerging from this summary of extreme ratings in the New Zealand data
closely matches the set of universally endorsed positive and negative leadership
characteristics reported by Den Hartog et al (1999).
The leadership qualities valued by New Zealanders will now be compared with other
countries in the sample. At the high end, New Zealanders placed more emphasis on the
Inspirational dimension than almost every other country. This scale picks up items relevant to
the leader’s optimism, energy, confidence and motivation, and his or her ability to inspire
these characteristics in followers.

39
New Zealand is also in the highest band for the Visionary, Decisive, Performance Orientation
and Humane Orientation scales. The first three of these scales have already been discussed.
The importance of Humane Orientation is consistent with the finding by Toulson (1990) that
New Zealanders in work organisations strongly endorse humanistic work beliefs.
In contrast, New Zealand managers’ ratings on six of the leadership scales were among the
lowest ten countries. The rating of 4.79 given to Administratively Competent ranks 60th
among all the countries, and falls into the lowest band. The scale reflects an organised,
methodical approach to work, underpinned by skills in coordinating and managing complex
administrative systems. The mean is just above the midpoint, suggesting that most managers
view this scale positively, but we value it much less as a contributor to effective leadership
than do other countries. This may be a function of the comparatively small size of many of
our companies, but it also echoes the comments made by the focus group. Administrative
competence is considered to be something required by an average manager, and is not a
distinguishing characteristic of an outstanding leader.
The New Zealand sample also gave lower ratings to Integrity than most other countries – an
average of 5.49 giving a country ranking of 58th. This scale had the highest standard
deviation for the New Zealand leadership scales, suggesting a wide spread of opinion about
its relevance to leadership. It may be the case that New Zealand managers see honesty and
trustworthiness as being the norm in New Zealand, rather than a special quality useful for
distinguishing effective leaders. The Inkson research cited earlier (1974, p. 25) lends support
to this view. New Zealand also ranks very highly as a corruption-free country in the annual
surveys carried out by Transparency International (1999).
Status-Consciousness is the next lowest dimension in the inter-country comparisons, with a
rating of 3.56 and a ranking of 56th. This is below the mid-point of the scale, indicating that
most managers take a somewhat negative view of leaders who are conscious of class or status
boundaries, and who allow these to influence their actions.
The final three scales on which New Zealand ranks low compared with other countries are
Diplomatic (54th), Face-Saver (53rd) and Modest (52nd). The Face-Saver characteristics (eg
being indirect in communication to avoid giving offence) are seen as inhibiting effective
leadership more by New Zealanders than by respondents in other countries. The other two

40
dimensions are rated as contributing to effective leadership, but are seen as less important
contributors than in other countries.
7.4 Factor Analysis of Leadership Scales
The GLOBE factors assist us in identifying the dimensions that are useful for distinguishing
the various countries in the study. Within each country, however, a separate factor analysis is
useful in identifying the clusters of leadership scales used to distinguish leader characteristics
within that country. This section summarises the results of a principal components factor
analysis of the New Zealand questionnaire responses. Five factors emerged (eigenvalue > 1,
varimax rotation) and the scale loadings are summarised in Table 8.

41
Table 8 Leadership Factor Loadings
Scale Factor 1 Factor 2 Factor 3 Factor 4 Factor 5
Decisive .81 Team II Team Integrator .75 Charismatic I: Visionary .73 Malevolent -.65 Integrity .64 Performance Oriented .62 Admin Competent .62 Team I: Collaborative Team Orientation
.55
Diplomatic .52 Conflict Inducer .79 Autocratic .66 Modesty -.61 Self-Centred .59 Autonomous .51 Non-Participative .47 Charismatic II: Inspirational
-.71
Face Saver .68 Status Conscious .53 Humane -.49 Procedural .87 Charismatic III: Self-Sacrificial
.82
Factor One includes most of the scales loading on the first factor emerging from the GLOBE
second-order factor analysis, captured by the Charismatic/Value Based and Team Oriented
CLT dimensions. In New Zealand, however, the Inspirational and Self-Sacrificial subscales
do not load on this factor. The Self-Sacrificial scale forms a factor of its own, and the
Inspirational scale loads on Factor Three (see below). Factor One is very much a ‘team-
leader’ factor, capturing a style of leading which encompasses personal managerial skills
focused on creating and maintaining a working group. The Team I, Team II and Diplomatic
scale items emphasise the importance of working together, resolving individual and intra-
group conflict, giving time and energy to help others, being skilled and tactful in
interpersonal relations, and being loyal to the group even in times of trouble.
The high negative loading of Malevolent indicates the undesirability of attributes such as
irritability, dishonesty, egotistical behaviours, cynicism, slowness to learn, and
uncooperativeness.

42
While Autocratic and Self-Centred have their highest loadings on Factor Two, they also have
sizable negative loadings on Factor One, and this ties in nicely — the factor captures the
importance of the group, rather than the individual. The Autocratic scale includes items such
as the tendency to make decisions in a dictatorial way, the belief that some people are entitled
to special privileges, and the inclination to dominate others. These are all inimical to the
creation of good teams. Similarly, the Self-Centred scale consists of items reflecting a
person’s disinterest in being part of a group at all.
In addition to these team-oriented scales, the Factor has loadings from the Decisive and
Performance Oriented subscales. These capture elements of effective behaviours - the ability
to make decisions firmly and logically, to be determined and persistent, and to strive for
increasingly high levels of performance. The team has to be an efficient and effective one, a
winning team, not an unstructured or directionless group.
Factor Two includes elements of both the Self-Protective and Participative (negatively
loaded) CLT dimensions. It captures a self-centred, directive leadership style. A strong
loading from Autocratic captures both leadership style (bossy, domineering, dictatorial,
intolerant of questioning) and belief in elitism. The other four scales loading positively on
this factor are Conflict Inducer, Non-Participative, Self-Centred and Autonomous. These
reflect attributes such as an emphasis on one’s own interests rather than the group’s, an
insistence on making decisions personally, a tendency to conceal information from the group
and a preference for independence.
Finally, the high negative loading on Modesty clearly links into New Zealanders’ abhorrence
of the ‘self-promoter’, indicating the importance of modesty (does not boast, presents self in
a modest way) and a self-effacing manner.
The highest loading (negative) scale on Factor Three is the Charismatic II: Inspirational
scale, which received the highest average rating of all scales, and is thus seen as contributing
most strongly to effective leadership. Scale content addresses the extent to which leaders
display (or generate in their followers) positivity, encouragement, enthusiasm, high morale,
confidence and energy. The Humane subscale reflects a sense of compassion and generosity
in assisting others.

43
As evidenced by the strong loading of the Face-Saving and Status-Conscious subscales, an
egalitarian approach coupled with clear and direct communication is an important part of the
leadership perspective captured by this factor.
Only one scale has its highest loading on Factor 4 - Procedural - although Status-Conscious
also has a loading >0.4. The Procedural subscale taps items relating to formality, caution,
maintaining a habitual routine, and a preference for following established rules. The Status
subscale indicates a leader who is aware of class and status boundaries and acts accordingly.
The only scale to load significantly on the fifth factor is Charismatic III: Self Sacrificial. This
illustrates a leader who is willing to invest major resources in endeavours that do not have a
high probability of success, someone who is willing to forego self-interest and make personal
sacrifices in the interest of a goal or vision, and who is unusually able to persuade others of
his/her viewpoint. Many of the people honoured by being featured on New Zealand
banknotes epitomise these qualities. Sir Edmund Hillary (first person to climb Mt Everest,
and first to drive overland to the South Pole); Kate Sheppard, the most prominent leader of
the campaign for universal suffrage in New Zealand at the end of the nineteenth century; Sir
Apirana Ngata, who led the revival of Maori people and culture in the early twentieth
century; and Ernest Rutherford, internationally recognised as ‘father of the atom’.
The contribution of these factors to effective leadership can be assessed. The leadership
scales are based on variables rated from 1 (‘greatly inhibits a person from being an
outstanding leader’) to 7 (‘contributes greatly to a person being an outstanding leader’). By
taking the average score of each of the leadership scales loading on each factor, we can
assess the extent to which a high factor score is positively or negatively associated with
leadership. The arithmetic mean of scale averages is calculated; where a scale loads
negatively on a factor, the corresponding mean is transformed by subtracting it from 8.
On this basis, the cluster of leadership scales represented by Factor One are the ones most
highly valued in New Zealand leaders, with an average rating of 5.65. The presence of
characteristics captured by Factor Three is seen as seriously inhibiting effective leadership
(average = 2.59). Factors Two (especially the autocratic, self-centred and non-participative
components) and Four are also seen as undesirable leadership styles with average ratings of
3.03 and 3.86 respectively. Finally, Factor Five (self-sacrificial) is seen as a style
contributing to effective leadership (average = 4.88).

44
A recent sporting example illustrates aspects of the team and self-sacrifical qualities forming
this pattern of leadership. In February 2000, New Zealand became the first country outside
America to successfully defend the America’s Cup yachting trophy in its 149-year history. At
the press conference after the first race in the seven-race final series, the world’s sporting
media expected to talk to the captain, Russell Coutts. Three Team New Zealand sailors
appeared, but Coutts was accused of arrogance and lack of consideration for staying away.
He later explained that he was only part of the team, and any other team member knew
enough to discuss the race with the media. It was not a deliberate snub, but true teamwork in
action.
This belief in teamwork combined with a willingness to forego self-interest was illustrated
even more dramatically in the final race of the series. Coutts chose to step aside from the
helm of Team New Zealand’s boat in the deciding race of the series. He allowed his
understudy the glory of sailing to victory in this prestigious international trophy.
8. Conclusions
Over the last fifteen years, New Zealand has been navigating the transition from a centralised
and highly regulated economy to one characterised by open markets, rapid change and
minimal government intervention. By contrasting the GLOBE study findings with earlier
research into New Zealand management behaviours we find that the culturally implicit theory
of leadership in New Zealand has followed a similar pattern. We have shifted from a
hierarchical “command and control” mentality, to one characterised by a preference for
teamwork, empowerment and inspirational leadership.
New Zealand is not alone in making this shift, and we share many attributes of preferred
leadership styles with other countries. Beneath this surface similarity, however, can be
detected important variations related to deeply ingrained and enduring cultural themes.
The emphasis placed on group/team loyalty in organisations contrasts markedly with the lack
of a similar sense of pride and loyalty within families. Managers report a desire to increase
the emphasis on both, but their view of workgroup pride is strongly based on utilitarian

45
considerations rather than on an innate need for affiliation. Performance is paramount.
According to the pioneering cultural strand, we make our own fortune. We stand or fall on
our ability to achieve, whether as individuals or as contributors to a wider group enterprise.
We are a small country, we hardly feature in anyone else’s worldview, and it’s important for
our self-esteem to show that we can match or beat the best the world can present, even if
hardly anyone else notices. There is a sense of insecurity that needs to be assuaged by regular
doses of international success.
We don’t like rules, administrative procedures, being controlled by micro-managing
bureaucrats. On the other hand, we seem to have a high need to reduce uncertainty, to
increase the level of stability and predictability in our lives. The cultural themes indicate this
comes about through conformity, through a desire to avoid being different, rather than by any
desire to subordinate ourselves to a set of externally imposed or class-based ‘rules’. The most
effective leaders will adopt a ‘clan control’ rather than ‘bureaucratic control’ approach to
controlling people and channelling their efforts (Bartol & Martin, 1998).
We don’t like leaders who are autocratic, but we also spurn leaders who pull their punches,
who aren’t prepared to ‘call a spade a spade’. There is a potential dissonance between our
avoidance of the autocrat, and our desire for a leader who can reduce our uncertainty, give us
a sense of security and confidence regarding our place in the world. We value performance
highly and give accolades to those who achieve at the highest level (as long as they don’t
suggest that their achievements make them any different from the rest of us). We want to
follow a leader who can succeed, who can perform at an exceptional level, and who gives us
hope that we can share in this success. We want to be told what to do by a successful leader,
not by a bureaucrat with a policy manual.
A strong leader can reduce our uncertainty - make us feel we are on the winning team.
Perhaps this accounts for what Pearson has called our “lurking respect for the dictator”
(Pearson, 1974), our willingness to allow a leader to be dictatorial if he or she achieves
results, and if those results benefit the dominant group. Dictators usually have a passion, they
are driven to control people to an end, they are enthusiastic about their goals. At various
times in the past New Zealand has willingly endorsed authoritarian Prime Ministers (such as
Seddon, Massey, Fraser and Muldoon). The media study identified emotionality, panic and
weakness as negative characteristics – our pioneering background makes a strong autocrat
preferable to a sensitive facilitator.

46
Traditional attributes are still valued, such as strength of character, resolve, determination,
and commitment. Increasing importance is being placed on the ability to inspire and enthuse
staff, on future orientation, and on development and communication of a compelling vision.
The high importance placed on having a leader with vision reflects the overall concern at the
low level of future orientation in society. We want a leader who is able to demonstrate
foresight, to plan ahead, and to take actions in consideration of future goals, because as a
society we don’t do this well.
There is an important aspect of our cultural identity that is not adequately captured by the
GLOBE findings. The rural archetype encompasses a practical, down-to-earth approach to
problem solving, coloured by ‘Kiwi ingenuity’. The GLOBE items, by focusing on generic
leadership behaviours, do not address technical skills, yet this seems to be an area that may
further distinguish New Zealand leaders from their international counterparts. Rippin (1995)
found that technical skills were an important contributor to judgements about senior
managers’ perceived levels of overall effectiveness. Her finding contrasts with similar
overseas studies, and she speculates that the value placed on technical skills may be a
function of the New Zealand ‘colonial spirit’ (p.133), requiring managers to demonstrate
greater versatility than is the case in other countries.
This chapter began with a quotation from John Mulgan, a New Zealand writer and diplomat
who studied and worked in England during the 1930s. He described the qualities that
characterised New Zealand soldiers he met during the desert campaign of World War II. We
have seen how some of these attributes closely fit the culturally endorsed model of
outstanding leadership in New Zealand. This implicit model combines inspirational
enthusiasm (‘sunshine’), low assertiveness, pragmatism and perseverance. Low power
distance and the strength of egalitarian beliefs mandate a style of leadership that is
participative, grounded in the team, and which provides the opportunity for shared success.
To the extent that leadership is “the process of being perceived by others as a leader” (Lord
& Maher, 1991, p.11) then New Zealand leaders must conform to the cultural expectations of
their followers. New Zealand’s cultural identity, however, has been determined in part by the
actions of leaders (in military, sporting, political and commercial spheres). Culture can
therefore be viewed as both a constraint on what is acceptable, and as a supporting structure
47
amenable to further development as we build and extend our concept of effective leadership.
Another New Zealand writer, Katherine Mansfield (1960, p. 127), described New Zealand as
a little land with no history (Making its own history, slowly and clumsily Piecing together this and that, finding the pattern, solving the problem Like a child with a box of bricks).
New Zealand leaders have found patterns and solved problems in ways that both reflect and
help to define ‘Kiwi culture’. While many of the ‘building blocks’ for New Zealand’s
leadership style can be found in other countries, the overall pattern is unique. The problems
to be solved will continue to change, and leaders will need to continue finding new bricks to
extend the pattern. The GLOBE study provides a snapshot of existing cultural themes and
leadership styles, and a basis from which to explore future evolution of Kiwi leadership as
New Zealand continues to develop and refine its sense of identity and place in the world.

48
Appendix One
PROJECT GLOBE
The Global Leadership and Organisational Behaviour Effectiveness Research Program
(GLOBE) was initiated by Professor Bob House (Wharton School, University of
Pennsylvania) in 1991 as a means by which links between culture and leadership could be
comprehensively researched. Approval of a research grant in 1993 enabled the project to
expand, with the recruitment of Country Co-Investigators (CCIs) from around the world. The
GLOBE community now comprises around 170 researchers in over 60 countries.
Following a comprehensive review of leadership and cross-cultural research literature,
questionnaires to measure cultural values and leadership practices were developed and
refined. The items included in these survey instruments were based on input from scholars in
Asian as well as western countries, in order to provide instruments that could be used in all
cultures. CCIs in each country managed the process of translating questionnaires, and
obtaining qualitative material with which to supplement the questionnaire-based measures of
societal and organisational culture and leader attributes.
During the initial phase of the project, the questionnaires were psychometrically analysed to
identify the underlying factor structure, and to determine the properties (eg reliabilities) of
the scales. On the basis of this work, it was possible to establish eight dimensions of societal
culture (matched with corresponding measures of organisational culture dimensions).
Similarly, the analysis identified six global dimensions of leader behaviour, based on 22
underlying specific leader attributes or behaviours.
The GLOBE project is a major study, extending over many years. It aims to develop an
empirically-based theory to describe, understand and predict the influence of cultural
variables on leadership and organisational processes. The study hopes to be able to answer
questions such as the following (House et al., 1999):

49
1. Are there leader behaviours, attributes, and organisational practices that are universally accepted and effective across cultures?
2. Are there leader behaviours, attributes, and organisational practices that are accepted and effective in only some cultures?
3. How do attributes of societal and organisational cultures affect the kinds of leader behaviours and organisational practices that are accepted and effective?
4. What is the effect of violating cultural norms relevant to leadership and organisational practices?
5. What is the relative standing of each of the nations studied on each of eight core dimensions of culture?
6. Can the universal and culturally-specific aspects of leader behaviours, attributes, and organisational practices be explained in terms of an underlying theory that accounts for systematic differences across cultures?
Conceptual Model
The GLOBE study uses implicit leadership theory (Lord et al., 1991) as a conceptual basis
for its analysis of leadership. This approach argues that individuals make assumptions or
develop beliefs (ie hold implicit theories) about the attributes consistent with effective
leadership. When others act in ways that are consistent with these implicit theories, then
individuals are more likely to accept them as leaders. With greater acceptance, such leaders
will gain greater stature, and increased ability to get the organisational resources needed in
order to accomplish goals. Considerable research supports the notion that implicit leadership
theories constrain the exercise of leadership, the acceptance of leaders, and the extent to
which they are viewed as effective.
The GLOBE study defines culture as the "shared motives, values, beliefs, identities, and
interpretations or meanings of significant events that result from common experiences of
members of collectives and are transmitted across age generations" (House et al., 1999). It is
likely that the attributes, norms and practices that distinguish one culture from another will
also influence the implicit leadership theories held by members of that culture. Leaders are
therefore likely to enact the behaviours expected and valued in the particular culture.
Variations in implicit leadership theories across different cultures will be reflected in the
different value placed on various leader behaviours and attributes.
Societal culture is not the only variable that will influence leadership style. For example, the
size and nature of the company, its competitive environment, ownership structure and

50
organisational culture will all moderate or compete with the effect of societal culture in
determining leader attributes. A more complete model of such relationships can be found in
House, Wright and Aditya (House et al., 1997).
Cultural Dimensions
The eight cultural dimensions used in the GLOBE study are based on extensive previous
research. The first five dimensions stem from Hofstede's work (1980), with his original
Masculinity-Femininity dimension divided (on the basis of factor analysis) into two
dimensions (Gender Egalitarianism and Assertiveness). The Collectivism scale was also
supplemented by items based on the work of Triandis (1995). Performance orientation is
derived from McClelland's (1985) work on need for achievement, and is similar to Hofstede
and Bond's (1988) Confucian Dynamism dimension. Future Orientation and Humane
Orientation stem mainly from work by Kluckhohn and Strodtbeck (1961).
Brief definitions of each of the eight cultural dimensions follow:
Uncertainty avoidance is the extent to which a society strives to avoid uncertainty by reliance on social norms, rituals, and bureaucratic practices to alleviate the unpredictability of future events.
Power distance is defined as the degree to which members of a society expect and agree that power should be unequally shared.
Collectivism reflects the degree to which individuals are integrated into groups within a society.
Gender egalitarianism is the extent to which a society minimises gender role differences.
Assertiveness is the degree to which individuals in a society are assertive, dominant, and aggressive in social relationships.
Future orientation is the degree to which a society encourages and rewards future-oriented behaviours such as planning, investing in the future, and delaying gratification.
Performance orientation refers to the extent to which a society encourages and rewards group members for performance improvement and excellence.
Humane orientation is the degree to which a society encourages and rewards individuals for being fair, altruistic, friendly, generous, caring and kind to others.
Leadership Dimensions
The final set of leadership dimensions used in the GLOBE study were derived from factor
analysis of responses to approximately 16,000 questionnaires from middle managers of
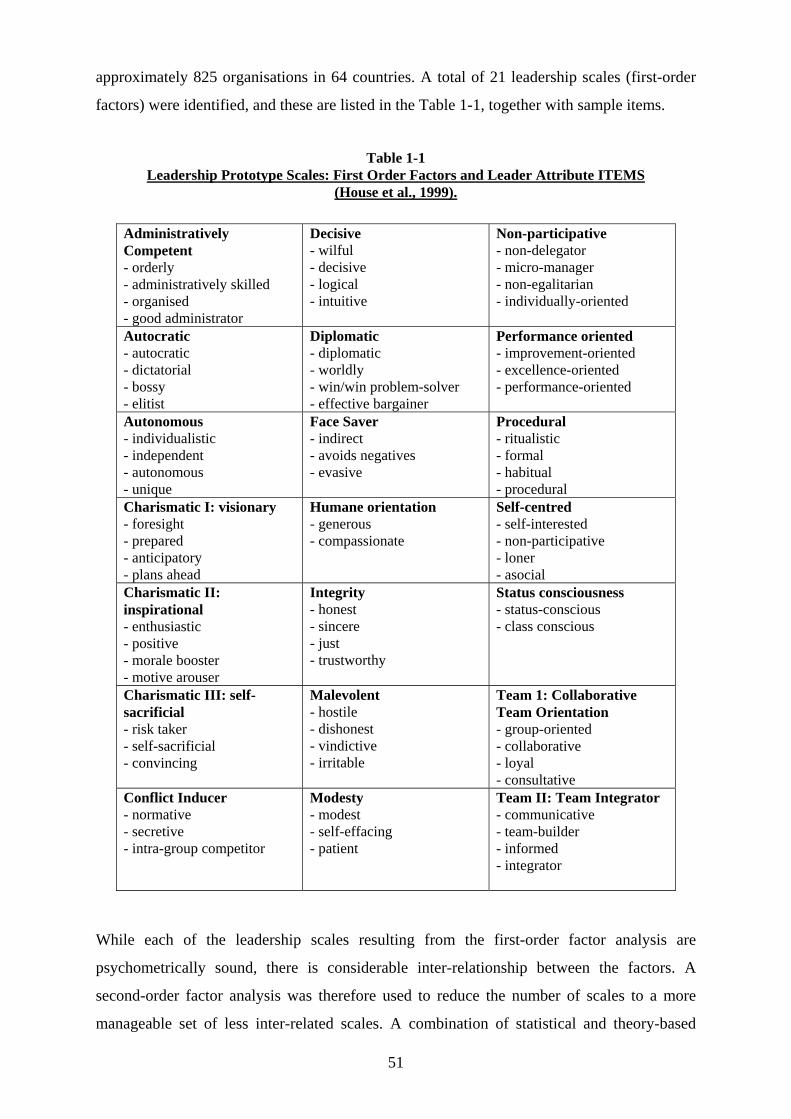
51
approximately 825 organisations in 64 countries. A total of 21 leadership scales (first-order
factors) were identified, and these are listed in the Table 1-1, together with sample items.
Table 1-1 Leadership Prototype Scales: First Order Factors and Leader Attribute ITEMS
(House et al., 1999).
Administratively Competent - orderly - administratively skilled - organised - good administrator
Decisive - wilful - decisive - logical - intuitive
Non-participative - non-delegator - micro-manager - non-egalitarian - individually-oriented
Autocratic - autocratic - dictatorial - bossy - elitist
Diplomatic - diplomatic - worldly - win/win problem-solver - effective bargainer
Performance oriented - improvement-oriented - excellence-oriented - performance-oriented
Autonomous - individualistic - independent - autonomous - unique
Face Saver - indirect - avoids negatives - evasive
Procedural - ritualistic - formal - habitual - procedural
Charismatic I: visionary - foresight - prepared - anticipatory - plans ahead
Humane orientation - generous - compassionate
Self-centred - self-interested - non-participative - loner - asocial
Charismatic II: inspirational - enthusiastic - positive - morale booster - motive arouser
Integrity - honest - sincere - just - trustworthy
Status consciousness - status-conscious - class conscious
Charismatic III: self-sacrificial - risk taker - self-sacrificial - convincing
Malevolent - hostile - dishonest - vindictive - irritable
Team 1: Collaborative Team Orientation - group-oriented - collaborative - loyal - consultative
Conflict Inducer - normative - secretive - intra-group competitor
Modesty - modest - self-effacing - patient
Team II: Team Integrator - communicative - team-builder - informed - integrator
While each of the leadership scales resulting from the first-order factor analysis are
psychometrically sound, there is considerable inter-relationship between the factors. A
second-order factor analysis was therefore used to reduce the number of scales to a more
manageable set of less inter-related scales. A combination of statistical and theory-based

52
considerations led to the development of six higher order leadership scales. These scales
represent relatively broad leadership styles, encompassing the 21 more detailed leadership
subscales. The second-order factors (marked in bold) are summarised in Table 1-2. The
Autonomous factor is based on individual questionnaire items, while the rest comprise the
subscales listed under each factor heading.
Table 1-2 Global Culturally Endorsed Implicit Leadership (CLT) Dimensions (House et al., 1999)
1. Charismatic/Value Based, 4.5 - 6.4
• Charismatic 1: Visionary • Charismatic 2: Inspirational • Charismatic 3: Self-sacrifice • Integrity • Decisive • Performance oriented
2. Team Oriented, 4.8 - 6.3 • Team 1: Collaborative Team
Orientation • Team 2: Team Integrator • Diplomatic • Malevolent (reverse scored) • Administratively competent
3. Narcissistic, 2.1 - 4.5 • Self-centred • Status conscious • Conflict inducer • Face saver • Procedural
4. Participative, 2.0 - 4.6 • Autocratic (reverse scored) • Non-participative (reverse
scored)
5. Humane, 3.6 - 5.5 • Modesty • Humane orientation
6. Autonomous, 2.3 - 4.7 • Individualistic • Independent • Autonomous • Unique
Samples of managers in each culture rated individual leader behaviours on a scale from 1
(greatly inhibits a person from being an outstanding leader) to 7 (greatly contributes to a
person being an outstanding leader). The average score for each culture, for each of the
second-order scales, was calculated and the range of scores is shown beside each of the six
second-order factors in Table 2. Thus, for example, the Charismatic/Value-Based leadership
style (with a range of culture scores between 4.5 and 6.4) is positively endorsed by all
cultures. In contrast, the Humane style (3.6 to 5.5) is endorsed by some cultures, and seen as
an ineffective leadership style by others.

53
References 1973. People & companies, Management, Vol. 19(12):: 37. 1999. One-third of bank branches closed, The Press: 5 May 1999: 29. Christchurch. Ah Chong, L. M., & Thomas, D. 1995. Cross-cultural research in New Zealand organisations.
Journal of the Australian and New Zealand Academy of Management, 1(2): 14-32. Ansley, B. 2000. Human Values, Listener: March 25: 16-19. Bank of New Zealand. 1984. Equal Employment Opportunity Management Plan. Wellington:
Bank of New Zealand. Bartol, K. M., & Martin, D. C. 1998. Management (3rd ed.): Irwin/McGraw-Hill. Booth, P. 1993. Edmund Hillary: The Life of a Legend. Auckland, NZ: Hodder Moa
Beckett. Briggs, A. 1965. The welfare state in historical perspective. In M. Zald (Ed.), Social Welfare
Institutions. New York: John Wiley & Sons. Calcott, D. 2000. Kiwis want income gap reduced, The Press: May 12: 9. Christchurch, NZ. Campbell-Hunt, C., & Corbett, L. 1996. A Season of Excellence? An Overview of New
Zealand Enterprise in the Nineties. Wellington: New Zealand Institute of Economic Research.
Campbell-Hunt, C., Harper, D., & Hamilton, R. 1993. Islands of Excellence? A study of Management in New Zealand. Wellington: New Zealand Institute of Economic Research.
Carter, I., & Perry, N. 1987. Rembrandt in gumboots: Rural imagery in New Zealand television advertisements. In J. Phillips (Ed.), Te Whenua Te Iwi - The Land and the People. Wellington: Allen & Unwin/Port Nicholson Press.
Chamberlain, J. 2000. Standard debasement, North & South(167): February: 86-94. Clapcott, B. H. 1973. Controlling executive stress and tension. Management, 19(12): 13. Crocombe, G., Enright, M., & Porter, M. 1991. Upgrading New Zealand's Competitive
Advantage. Auckland: Oxford University Press. Davin, D. 1984. Cassino Casualty, Islands, Vol. 1 New Series(2): November. Deeks, J., Parker, J., & Ryan, R. 1994. Labour and Employment Relations in New Zealand
(2nd ed.). Auckland: Longman Paul. den Hartog, D. N., House, R. J., Hanges, P. J., Dorfman, P. W., Ruiz-Quintanella, A.,
Kennedy, J. C., & et al. 1999. Culture-specific and cross-culturally generalizable implicit leadership theories: Are attributes of charismatic/transformational leadership universally endorsed? In J. A. Conger, & J. G. Hunt (Eds.), Leadership Quarterly Special Issue - Charismatic and Transformational Leadership: Taking Stock of the Present and Future (Part I): 219-256.
Department of Statistics. 1990. New Zealand Official Yearbook (94th ed.). Wellington: Department of Statistics.
Easton, B. 2000. Value added, Listener: March 25: 20-21. Fairburn, M. 1989. The Ideal Society and its Enemies: the Foundations of Modern New
Zealand Society 1850-1900. Auckland: Auckland University Press. Fearing, M., Heyward, J., Kennedy, J. C., & O'Sullivan, D. 1995. The GLOBE Study of
Management and Leadership in New Zealand. Christchurch: Commerce Division, Lincoln University.
Frater, P., Stuart, G., Rose, D., & Andrews, G. 1995. The New Zealand Innovation Environment. Wellington, NZ: Business and Economic Research Ltd.
Geraets, J. 1984. An interior landscape: Charles Brasch's 'Indirections' and 'The Universal Dance'. Islands, 1 New Series(1): 71-84.
54
Gidlow, R., Perkins, H., Cushman, G., & Simpson, C. 1994. Leisure and recreation. In P. Spoonley, D. Pearson, & I. Shirley (Eds.), New Zealand Society: A Sociological Introduction, 2nd ed. Palmerston North, NZ: Dunmore Press.
Godfrey, K., & Kennedy, J. C. 1998. Media Portrayal of Leadership in New Zealand: A GLOBE Study. Christchurch, NZ: Commerce Division, Lincoln University.
Gold, H., & Webster, A. 1990. New Zealand Values Today. Palmerston North: Alpha Publications.
Gordon, R. 1997. Tuanz worried competition too far off as bureaucrats procrastinate, National Business Review: 11 July: 47. Auckland.
Hamilton, R. T., Dakin, S. R., & Loney, R. P. 1992. Economic deregulation and general managers: New Zealand's experience. Personnel Review, 21(7): 14-23.
Hansen, D. 1968. Social Institutions. In A. McLeod (Ed.), The Pattern of New Zealand Culture: 49-67. Ithaca, New York: Cornell University Press.
Harris, P. 1996. The Changes Banks Face. Wellington: The Finance Sector Union (FinSec). Harris, T. E. 1973. Principles of delegation. Management, 19(12): 15. Hines, G. 1973. The New Zealand Manager. Wellington: Hicks, Smith & Sons Ltd. Hofstede, G. 1980. Culture's Consequences: International Differences in Work-Related
Values. London: Sage Publications. Hofstede, G., & Bond, M. 1988. The confucius connection: From cultural roots to economic
growth. Organzational Dynamics, 16: 4-21. Holm, M. 1994. Secrets for success, Listener: November 5: 16-24. House, R., Wright, N., & Aditya, R. 1997. Cross-cultural research on organizational
leadership: A critical analysis and a proposed theory. In P. C. Earley, & M. Erez (Eds.), New Perspectives on International Industrial/Organizational Psychology, 1st ed.: 535-639. San Francisco: The New Lexington Press.
House, R. J., Hanges, P. J., Ruiz-Quintanilla, S. A., Dorfman, P. W., Javidan, M., Dickson, M. W., Gupta, V., Kennedy, J. C., & et al. 1999. Cultural Influences on Leadership and Organizations: Project GLOBE. In W. H. Mobley, M. J. Gessner, & V. Arnold (Eds.), Advances In Global Leadership: 171-233. Stamford, CN: JAI Press.
Hume, A. L. 1973. How Auckland managers select their staff. Management, 20(2): 15, 17, 22.
Hyde, T. 1991. How They Sold Telecom, Why they Sold Telecom, Metro(123): September: 54-69.
IMD International. 2000. The World Competitiveness Yearbook. Lausanne: International Institute for Management Development.
Inkson, J. H. K. 1974. New Zealand managers - their problems and their needs, Management, Vol. 21(7): October: 23-25, 43.
Inkson, J. H. K., Henshall, B., Marsh, N., & Ellis, G. 1986. Theory K: The Key to Excellence in New Zealand Management. Auckland: David Bateman Ltd.
Inkson, K. 1987. Organisational behaviour: A review of New Zealand research. New Zealand Journal of Psychology, 16: 9-27.
Inkson, K., & Henshall, B. 1990. Transformational leadership and management development. In P. Boxall (Ed.), Function in Search of a Future: Perspectives on Contemporary Human Resource Management in New Zealand: 157-171. Auckland: Longman Paul.
Inkson, K., & Kolb, D. 1997. Management Perspectives for New Zealand (2nd ed.). Auckland: Addison Wesley Longman.
Irving, D., & Inkson, K. 1998. It Must be Wattie's: From Kiwi Icon to Global Player. Auckland: David Bateman.
Kaiser, B. 1973. Increasing national productivity Part 5: Communications, Human and industrial relations. Management, 20(7): 19-21.
55
Kluckhohn, F. R., & Strodtbeck, F. L. 1961. Variations in Value Orientations. New York: Harper Collins.
Knuckey, S., Leung-Wai, J., & Meskill, M. 1999. Gearing Up: A Study of Best Manufacturing Practice in New Zealand. Wellington: Ministry of Commerce.
Laidlaw, C. 1999. Rights of Passage: Beyond the New Zealand Identity Crisis. Auckland: Hodder Moa Beckett.
Lattimore, R. 1994. Assessing the international competitiveness of the New Zealand food sector. In M. Bredahl, P. Abbott, & M. Reed (Eds.), Competitiveness in International Food Markets. Boulder: Westview.
Lattimore, R. 1997. Deregulation: The New Zealand food industry. In T. Wallace, & W. Schroder (Eds.), Government and the Food Industry: Economic and Political Effects of Conflict and Cooperation. Boston: Kluwer Publishers.
Lealand, G. 1988. A Foreign Egg in our Nest? American Popular Culture in New Zealand. Wellington: Victoria University Press.
Ledingham, P. 1995. The review of bank supervision arrangements in New Zealand: The main elements of the debate. Reserve Bank Bulletin (RBNZ), 58(3): 163-171.
Lord, R. G., & Maher, K. J. 1991. Leadership and Information Processing: Linking Perceptions and Performance. Boston: Unwin Hyman.
Love, M. 1993. Maori management: The way of the future? Paper presented at the ANZAME Conference, Deakin University, Melbourne.
Love, P. 1996. Changing times bring upheaval for financiers, The Evening Post: 14 September 1996: 15. Wellington.
Mansfield, K. 1960. To Stanslaw Wyspianski. In A. Curnow (Ed.), The Penguin Book of New Zealand Verse: 127-128. Harmondsworth: Penguin Books.
McClelland, D. 1985. Human Motivation. Chicago: Scott, Foresman. McLauchlan, G., & Morgan, J. 1976. The Passionless People. Auckland: Cassell New
Zealand. McLennan, R. (Ed.). 1995. People and Enterprises (2nd ed.). Sydney: Harcourt Brace. Mordka, I. 1973a. The concepts underlying management-by-objectives. Management, 20(1):
21, 23, 47. Mordka, I. 1973b. A review of the concepts underlying management-by-objectives.
Management, 19(12): 20-21, 23. Mulgan, J. 1984. Report on Experience. Auckland, NZ: Oxford University Press. Naipaul, V. 1980. The Return of Eva Peron with The Killings in Trinidad. London: Andre
Deutsch. Nedd, A. N. B., & Marsh, N. R. 1983. Social-traditionalism and supervisory style: An
empirical investigation of the relationships between social values and the compliance-gaining strategies of supervisors. In N. R. Marsh, & W. F. McDonald (Eds.), The Multicultural Workforce in New Zealand and Australia, Vol. Occasional Paper. Auckland: Department of Management Studies, University of Auckland.
Niblock, S. C. 1973. Publisher's Letter, Management, Vol. 20(3): June: 3. Novitz, D. 1989. On culture and cultural identity. In D. Novitz, & B. Willmott (Eds.),
Culture and Identity in New Zealand: 277-291. Wellington, NZ: GP Books. Ogilvie, G. 1973. The Riddle of Richard Pearse. Wellington, NZ: AH & AW Reed. Pearson, B. 1974. Fretful Sleepers and Other Essays. London: Heinemann Educational
Books. Phillips, J. 1989. War and national identity. In D. Novitz, & B. Willmott (Eds.), Culture and
Identity in New Zealand. Wellington: GP Books. Place, H. I. 1971. The status and scope of industrial psychology in New Zealand. Hamilton:
Department of Psychology, Waikato University.
56
Pringle, J. K., & Henry, E. Y. 1993. Diversity in women's organisations: Maori and Pakeha. Paper presented at the Fifth International Interdisciplinary Congress on Women, Costa Rica.
Ransom, S. W. 1973. Research - Lip service or action? Management, 19(10): 19. Rippin, S. 1994. New Zealand managerial effectiveness study. Paper presented at the
Australia and New Zealand Academy of Management, Wellington, NZ. Rippin, S. 1995. The Competencies Used to Assess the Effectiveness of New Zealand
Managers. Unpublished PhD, Victoria University of Wellington, Wellington:NZ. Roberts, K. 1999. The New Zealand Edge, http://www.nzedge.com/speeches/edge2.html,
Accessed 29 April 2000. Rossel, P. E. 1972. Need to upgrade profession, Dominion: 3 March. Wellington. Rotherham, F. 1998. Is the Kiwi corporate culture wrecking our family life?, The
Independent: 2 September. Savage, J. 1999. Savings in New Zealand. Wellington, New Zealand: Office of the
Retirement Commissioner. Sinclair, K. 1969. A History of New Zealand (2nd ed.). Harmondsworth, England: Penguin
Books. Singer, M. 1985. Transformational vs transactional leadership: A study of New Zealand
company managers. Psychological Reports, 56: 816-818. Statistics New Zealand. 1995. Facts NZ (2nd ed.). Wellington, NZ: Statistics New Zealand. Statistics New Zealand. 1997. New Zealand Official Year Book 1997. Wellington: GP Print. Statistics New Zealand. 1999. New Zealand Official Yearbook on the Web 1999,
http://www.stats.govt.nz, Accessed 26 April, 2000. Tapsell, S. 1997. Is Maori management different?, Management, Vol. 44(9): October: 46-50. Telecom Corporation of New Zealand. 1993. The Telecom Turnaround: The Deregulation
of the Telecommunications Industry. Wellington: Telecom Corporation of New Zealand.
Toulson, P. K. 1990. Perceptions, Practices, and Productivity: An Assessment of Personnel Management in New Zealand. Unpublished Ph D, Massey University, Palmerston North.
Transparency International. 1999. 1999 Corruptions Perceptions Index, http://www.transparency.de/documents/cpi/index.html, Accessed 30 March 2000.
Triandis, H. 1995. Individualism and Collectivism. Boulder, CO: Westview Press. Wagner, G. 1994. The Deregulation and Privatisation of New Zealand
Telecommunications: An Economic, Political and Ideological Analysis. Unpublished Doctor of Philosophy, University of Oregon.
Wevers & Company. 1994. The Index of Human Resource Management Performance. Wellington, NZ.
Wevers International Ltd/Centre for Corporate Strategy. 1996. New Zealand Index of Human Resource Management & Organisational Effectiveness. Wellingon, NZ: New Zealand Institute of Management.
Wilson, G. D., & Patterson, J. R. 1968. A new measure of conservatism. British Journal of Social and Clinical Psychology, 7: 264-269.