
Lead Poisoning: CDC s New Target for Prevention · PDF fileLead Poisoning: CDC ’ s New...
35
Public Health Grand Rounds August 15, 2012 Lead Poisoning: CDC’s New Target for Prevention Pat McLaine, DrPH, MPH, RN Ana Navas-Acien, MD, PhD
Transcript of Lead Poisoning: CDC s New Target for Prevention · PDF fileLead Poisoning: CDC ’ s New...

Public Health Grand Rounds August 15, 2012
Lead Poisoning:
CDC’s New Target for Prevention Pat McLaine, DrPH, MPH, RN
Ana Navas-Acien, MD, PhD

Presenter’s Name
Date
Outline
1. Framing the question - Lead exposure: trends and current
sources - Health effects: children and adults - Prevention strategies 2. CDC’s new target for prevention - Recommendations - Implications - Barriers and challenges - Next steps

Presenter’s Name
Date
Acknowledgements
Eliseo Guallar Ellen Silbergeld Virginia Weaver Esther Garcia Andria Apostolou Jeffrey Fadrowsky Stephen Rothenberg Brian Schwartz

Presenter’s Name
Date
•Toxic metal – used since Ancient times •Ubiquitous in the environment – human activities
- Mining, smelting - Production of batteries, ammunition,
metal products, medical, research and military equipment, ceramic glazes, paint
- Gasoline additives – phased out in 1970s in US
•Lead is in air, food, drinking water, rivers, lakes, oceans, dust and soil
Lead

Presenter’s Name
Date
Lippman. Environ Reseach 1990;51:1-24

Presenter’s Name
Date

Presenter’s Name
Date
Dramatic changes in lead exposure in the last century
Lippman. Environ Reseach 1990;51:1-24
Blood lead levels in NHANES
1976 – 1980 13.1 μg/dL
1988 – 1994 2.8 μg/dL
1999 – 2002 1.6 μg/dL
8-fold decline in blood lead
Muntner P, et al. Arch Intern Med 2005;165:2155-61

Presenter’s Name
Date
(1976 to 1980)
(1988 to 1991)
78% drop

Presenter’s Name
Date
Children: reasons for increased susceptibility
• Disproportionately heavier exposures than adults: - Drink more water, eat more food and
breathe more air per weight unit
- Hand-to-mouth behavior
- Play close to the ground
• Metabolic pathways, especially in fetal life and first months after birth, are immature - Metabolic, detoxification and excretion processes
different from adults
- Blood-brain barrier not fully developed
Landrigan PJ. EHP 2004;112:257-265

Presenter’s Name
Date

Presenter’s Name
Date
Lead poisoning by age in US
http://www.cdc.gov/mmwr/preview/mmwrhtml/ss5210a1.htm

Presenter’s Name
Date
Median blood lead levels (µg/dL) in US population 1 year and older
Third National Report on Human Exposure to Environmental Chemicals

Presenter’s Name
Date
Lead biomarkers – Blood vs. bone lead
Bone (cortical, Whole blood trabecular) Half-life Decades ~35 days
Reflect Cumulative exposure Recent external and internal exposure
Analysis K X-ray fluorescence AAS / ICPMS
Monitoring No Yes
Criterion No 5 µg/dL children 40 µg/dL workers AAS: atomic absorption spectometry / ICPMS: inductively coupled plasma mass spectometry
Other lead biomarkers not usually used (hair, toenails, urine, plasma, serum)
Hu et al. EHP 2007;115:455-63 Barbosa et al. EHP 2005;113:1669-74

Presenter’s Name
Date
Lead related health effects Neurotoxic (children <5 µg/dL, 2 µg/dL adults) Nephrotoxic (<5 µg/dL) Immunotoxic (<10 µg/dL) Alters heme synthesis Alters bone and teeth metabolism Probable carcinogen (IARC, NTP) Cardiovascular outcomes:
- Increased blood pressure and incidence of hypertension - Potential association with cardiovascular mortality and morbidity
EPA 2006 – Air Quality Criteria for Lead
http://cfpub.epa.gov/ncea/cfm/recordisplay.cfm?deid=158823

Presenter’s Name
Date
Lanphear BP, et al. Environ Health Perspect 2005;113:894-899
Blood lead and IQ in children – International pooled analysis
Estimated IQ decrements estimated with increases in blood lead from:
- 2.4 to 10 g/dL: 3.9 - 10 to 20 g/dL: 1.9 - 20 to 30 g/dL: 1.1
Steepest declines were at blood lead levels <10 µg/dL

Presenter’s Name
Date
The weight of lead – Effects add up in adults
• Neurotoxic
• Nephrotoxic
• Immunotoxic
• Alters heme synthesis
• Alters bone and teeth metabolism
• Probable carcinogen (IARC, NTP)
• Cardiovascular outcomes
US EPA 2006 – Air Quality Criteria for Lead http://cfpub.epa.gov/ncea/cfm/recordisplay.cfm?deid=158823
Source: Environ Health Perspect 2007;115:A30-36

Presenter’s Name
Date
Achievements in Public Health, 1900-1999: Decline in Deaths from Heart Disease and Stroke -- United States, 1900-1999 (MMWR 1999;48:649-656)

Presenter’s Name
Date

Presenter’s Name
Date
Environ Health Perspect 2007;115:472-482
Conclusions
Sufficient epidemiologic and mechanistic evidence to infer a causal effect of lead on blood pressure – no evidence of a threshold
Suggestive but not sufficient epidemiologic evidence for clinical cardiovascular endpoints at blood lead < 5 µg/dL
Suggestive but not sufficient epidemiologic evidence for cardiac function abnormalities: left ventricular hypertrophy and cardiac rhythm

Presenter’s Name
Date
Lead and blood pressure endpoints –Reviews and meta-analyses
Combined data from >30 original studies and ~60,000 participants consistently concluded that there is positive association between blood lead levels and blood pressure endpoints
Navas-Acien et al. Environ Health Perspect 2007;115:472-482
Presenter’s Name
Date
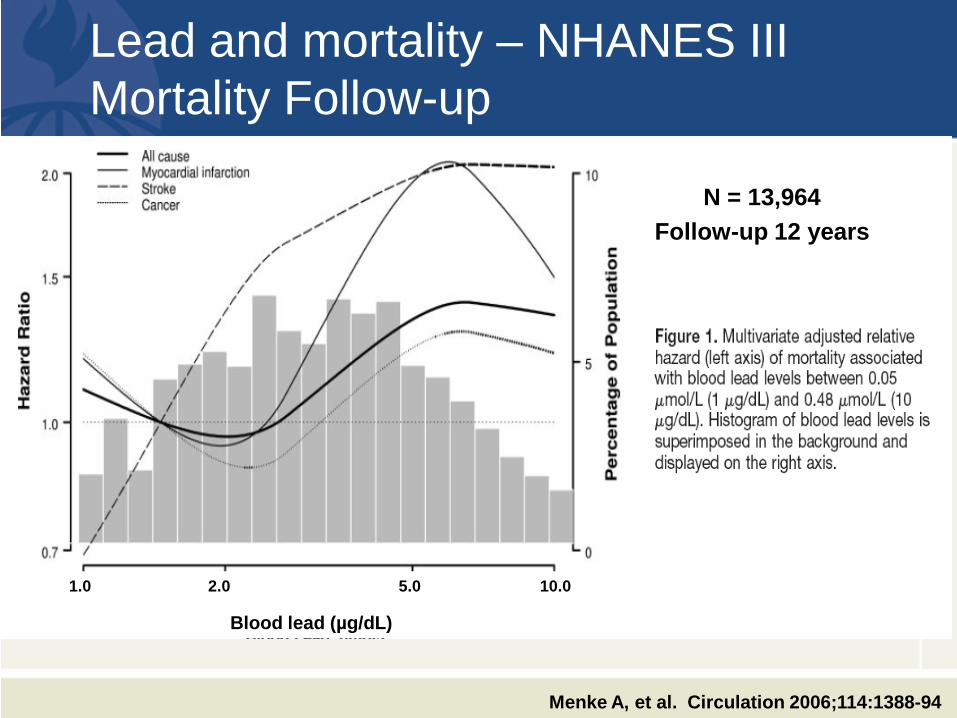
Lead and mortality – NHANES III Mortality Follow-up
Menke A, et al. Circulation 2006;114:1388-94
1.0 2.0 5.0 10.0
Blood lead (µg/dL)
N = 13,964 Follow-up 12 years

Presenter’s Name
Date
Bone vs. blood lead and myocardial infarction – VA Normative Aging Study
Baseline 1991 NCVD-free = 837
Men 21-80 y, Boston
Blood lead (AAS) Patella, tibia lead (KXRF)
Questionnaire Clinical exam
Laboratory
83 fatal and nonfatal CHD
events
Follow-up Dec 2001
Blood lead (per log µg/dL) Patella lead (per log µg/g) Tibia lead (per log µg/g)
HRcrude
1.40 3.27 2.76
95% CI 0.99 – 1.98 1.41 – 7.58 0.94 – 8.12
HRadj
1.45 2.64 1.84
95% CI 1.01 – 2.06 1.09 – 6.37 0.57 – 5.90
Adjusted for age, race, HDL-cholesterol No change in estimates when smoking, BMI, alcohol, blood pressure, family history of hypertension and total serum cholesterol were added to the model
Jain et al. Environ Health Perspect. Epub Feb 6 2007
AAS: atomic absorption spectrometry KXRF: K X-ray fluorescence
Clinical exams every 3 to 5 years
Presenter’s Name
Date
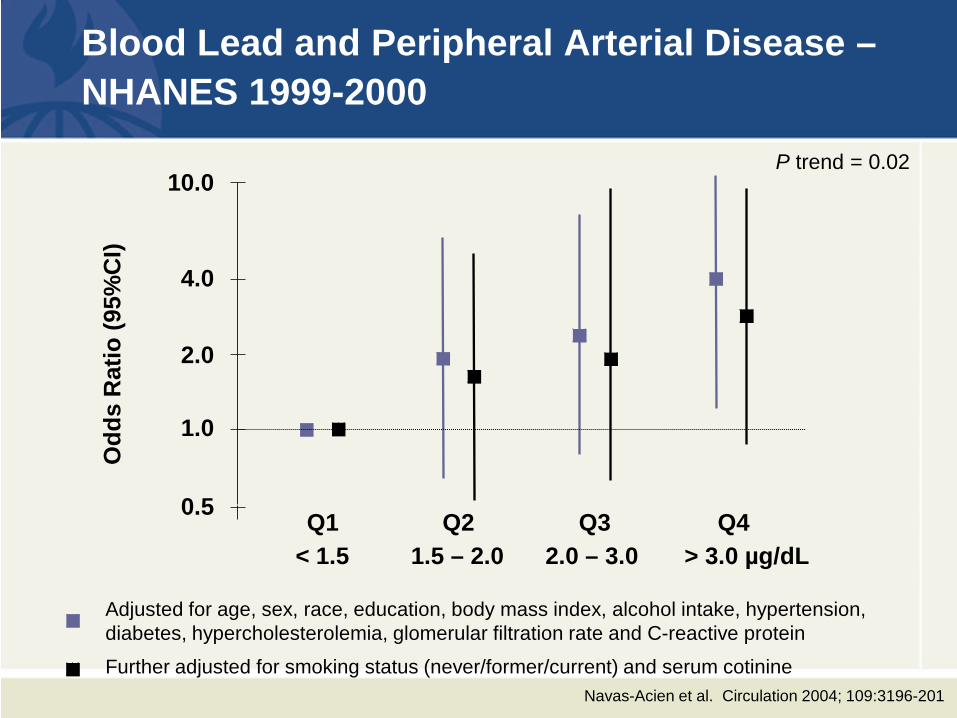
Blood Lead and Peripheral Arterial Disease –NHANES 1999-2000
Adjusted for age, sex, race, education, body mass index, alcohol intake, hypertension, diabetes, hypercholesterolemia, glomerular filtration rate and C-reactive protein
Further adjusted for smoking status (never/former/current) and serum cotinine
0.5
1.0
2.0
4.0
10.0
< 1.5 1.5 – 2.0 2.0 – 3.0 > 3.0 µg/dL Q1 Q2 Q3 Q4
P trend = 0.02
Odd
s R
atio
(95%
CI)
Navas-Acien et al. Circulation 2004; 109:3196-201

Presenter’s Name
Date
Public health implications of lead related cardiovascular disease
Sufficient evidence to infer a causal association with elevated blood pressure with no evidence of a threshold
Suggestive evidence for other cardiovascular endpoints at blood lead levels < 5 µg/dL
Lower the current OSHA / WHO safety standards for blood lead in workers (40 µg/dL)
Establishment of a criterion for elevated blood lead levels in adults
Include hypertensive and cardiovascular effects of lead in risk assessment and in economic analyses of the impact of lead exposure
Develop regulations and public health interventions to prevent and reduce lead exposure in adults needed

Presenter’s Name
Date
Blo
od le
ad le
vels
def
ined
as
lead
poi
soni
ng (m
g/dL
)
1965 1970 1975 1980 1985 1990 2000 2012
70
60
50
40
30
20
10
0
60 µg/dL
40 µg/dL
30 µg/dL
25 µg/dL
10 µg/dL ? 1976-1980 geo. mean = 15 µg/dL (children)
2002 geo. mean = 2.2 µg/dL (children)
40 µg/dL ?
CDC criteria for children
OSHA criteria for workers
5 µg/dL

Presenter’s Name
Date
Lead poisoning prevention programs
Surveillance Secondary prevention
- Case management children blood lead levels over a certain level - Identify most important sources related to this level of exposure:
Housing age, lead paint-hazards, drinking water sources, industrial sources, other
Primary prevention: - Identification of most common sources, plot distribution - Target prevention strategies to reduce exposure of at-risk
populations - Enact laws to require actions to protect children from exposure to
hazards (housing standards)
Secondhand smoke not considered by most programs

Presenter’s Name
Date
Secondhand Tobacco Smoke: a
A Source of Lead Exposure in US Children and Adolescents

Presenter’s Name
Date
SHS and Lead in NHANES III
Points: geometric mean; vertical bars: 95% CI
Mannino et al. Epidemiology 2003;14:719-727

Presenter’s Name
Date
N (%)
+Age, sex, race, country born, BMI, survey yr
+Household education,
income +Year home construction
Cotinine (µg/L) ≤ 0.03 1,538 (25%) 1.00 (ref) 1.00 (ref) 1.00 (ref)
0.03–0.07 1,876 (25%) 1.10 (1.04-1.16) 1.09 (1.031.15) 1.08 (1.02-1.15)
0.08–0.44 1,804 (25%) 1.26 (1.21-1.32) 1.19 (1.14-1.24) 1.17 (1.12-1.23)
≥ 0.44 1,612 (25%) 1.47 (1.40-1.55) 1.30 (1.23-1.37) 1.28 (1.21-1.35)
p-value for trend <0.001 <0.001 <0.001
Smokers at home
0 5,484 (78%) 1.00 (ref) 1.00 (ref) 1.00 (ref)
1 929 (14%) 1.26 (1.18-1.33) 1.16 (1.08-1.23) 1.14 (1.07-1.22)
≥ 2 417 (8%) 1.39 (1.32-1.47) 1.25 (1.17-1.33) 1.24 (1.16-1.33)
p-value for trend <0.001 <0.001 <0.001
Ratio (95% CI) of geometric mean of blood lead by SHS exposure in NHANES 1999-2004

Presenter’s Name
Date
Ratio of blood lead levels: Smokers at home vs. no smokers
Male Female 3-5 6-11 12-14 15-19 White Black Mex/Am Other <85 85-95 >95 <High School High School >High School <1.3 1.3-3.5 >3.5 Before 1950 1950-1978 After 1978 Unknown
Ratio (95%CI) 1.20 (1.25-1.45) 1.16 (1.07-1.24) 1.25 (1.12-1.37) 1.16 (1.07-1.24) 1.22 (1.12-1.31) 1.13 (1.02-1.24) 1.17 (1.08-1.26) 1.16 (1.07-1.24) 1.07 (0.96-1.18) 1.23 (1.06-1.40) 1.21 (1.14-1.29) 1.18 (1.08-1.29) 1.05 (0.95-1.15) 1.21 (1.11-1.32) 1.16 (1.05-1.27) 1.16 (1.16-1.09) 1.20 (1.11-1.23) 1.19 (1.08-1.30) 1.05 (0.95-1.15) 1.19 (1.02-1.37) 1.15 (1.06-1.25) 1.13 (1.05-1.21) 1.17 (1.04-1.30)
Overall 1.20 (1.11-1.25)
0.9 1 1.2
p = 0.85
p = 0.87
p = 0.49
p = 0.01
p = 0.46
p = 0.12
p = 0.60
Sex Age
Race
BMI
Educ
PIR
House

Presenter’s Name
Date
N
(%)
All adjustment variables
+ Window lead dust + Floor lead dust + Window and
floor lead dust
Cotinine (µg/dL) ≤ 0.03 133 (17) 1.00 (ref.) 1.00 (ref.) 1.00 (ref.) 1.00 (ref.) 0.03–0.07 189 (24) 1.01 (0.88-1.14) 1.00 (0.87-1.13) 1.00 (0.87-1.14) 1.00 (0.87-1.13) 0.08–0.44 236 (30) 1.14 (1.02-1.25) 1.13 (1.02-1.25) 1.13 (1.01-1.24) 1.12 (1.01-1.24) ≥ 0.44 233 (29) 1.31 (1.21-1.42) 1.31 (1.19-1.42) 1.31 (1.20-1.41) 1.30 (1.19-1.41) p-value for trend <0.001 <0.001 <0.001 <0.001
N⁰ smokers at home
0 623 (78) 1.00 (ref.) 1.00 (ref.) 1.00 (ref.) 1.00 (ref.) ≥1 168 (22) 1.17 (1.04-1.30) 1.17 (1.04-1.30) 1.17 (1.04-1.30) 1.17 (1.04-1.30)
Sub-analysis: Children 3-5 years of age with house dust data

Presenter’s Name
Date

Presenter’s Name
Date
Picture taken from El País (spanish newspaper) 2010-08-19
Presenter’s Name
Date
Implications for Public Health Eliminating SHS exposure in children could lower lead
exposure and reduce adverse lead-related health effects Lead poisoning prevention programs should
systematically evaluate smoking at home (no. smokers, smoking bans) Lead poisoning prevention programs can borrow
strategies from SHS prevention programs (explaining benefits of smoke-free homes and cessation counseling) Smoke-free programs can incorporate lead prevention
as an argument to implement tobacco control initiatives, particularly in disadvantaged communities at increased risk of both lead and SHS exposure

Presenter’s Name
Date
OSHA and CDC criteria for lead biomonitoring
Blo
od le
ad le
vels
def
ined
as
lead
poi
soni
ng (m
g/dL
)
1965 1970 1975 1980 1985 1990 2000 2012
70
60
50
40
30
20
10
0
60 µg/dL
40 µg/dL
30 µg/dL
25 µg/dL
10 µg/dL ? 1976-1980 geo. mean = 15 µg/dL (children)
2002 geo. mean = 2.2 µg/dL (children)
40 µg/dL ?
CDC criteria for children
OSHA criteria for workers
5 µg/dL


![Detecting Carbon Monoxide Poisoning Detecting Carbon ...2].pdf · Detecting Carbon Monoxide Poisoning Detecting Carbon Monoxide Poisoning. Detecting Carbon Monoxide Poisoning C arbon](https://static.fdocuments.net/doc/165x107/5f551747b859172cd56bb119/detecting-carbon-monoxide-poisoning-detecting-carbon-2pdf-detecting-carbon.jpg)

