Leaching performance of concrete based on studies of ... · PDF fileSummary Concrete will be...
80
Svensk Kärnbränslehantering AB Swedish Nuclear Fuel and Waste Management Co Box 5864 SE-102 40 Stockholm Sweden Tel 08-459 84 00 +46 8 459 84 00 Fax 08-661 57 19 +46 8 661 57 19 Technical Report TR-01-27 Leaching performance of concrete based on studies of samples from old concrete constructions Björn Lagerblad Swedish Cement and Concrete Research Institute September 2001
Transcript of Leaching performance of concrete based on studies of ... · PDF fileSummary Concrete will be...

Svensk Kärnbränslehantering ABSwedish Nuclear Fueland Waste Management CoBox 5864SE-102 40 Stockholm SwedenTel 08-459 84 00
+46 8 459 84 00Fax 08-661 57 19
+46 8 661 57 19
Technical Report
TR-01-27
Leaching performance of concretebased on studies of samples fromold concrete constructions
Björn Lagerblad
Swedish Cement and Concrete Research Institute
September 2001

This report concerns a study which was conducted for SKB. The conclusionsand viewpoints presented in the report are those of the author and do notnecessarily coincide with those of the client.
Leaching performance of concretebased on studies of samples fromold concrete constructions
Björn Lagerblad
Swedish Cement and Concrete Research Institute
September 2001

Summary Concrete will be used for different purposes in the underground repositories for radioactive waste according to the Swedish concept. Cementitious materials are unstable in groundwater. Thus it is important to be able to model and calculate the degradation and the effect of the degradation on the groundwater composition. Concrete is a porous material and consists of solid phases in contact and in equilibrium with a pore water solution. The progress of degradation can be expressed in terms of water exchange cycles or speed of diffusion of ions in the pore solution. In dense concrete, or submerged concrete, the water exchange will mainly be ruled by diffusion and controlled by concentration gradient. Diffusion controlled leaching is presumably the ruling mechanism that will effect the concrete when the repository is closed and saturated with groundwater. The mechanisms and parameters behind diffusion leaching are discussed in the report. Earlier work on leaching has mainly been based on acceler-ated experiments and theory. In this report we have linked it to natural analogues to get a better and more realistic value for the speed of degradation and the influence of natural water. We have investigated a sequence of old concrete water basins from the Norsborg water works outside Stockholm. The basins, which were of different quality, were cast in 1910, 1916, 1927, 1944 and 1960. Samples were taken and the concrete was investi-gated in detail in polarising microscope, SEM and NMR. This has given both the texture and the changes of chemistry in the different phases of the cement paste. The paste has developed a characteristic zonal pattern with a progressive decalcification of the cement paste, coupled to carbonation and absorption of Mg ions at the surface. This material is complemented with some analyses of submerged parts of bridges. The physical properties of the alteration zone and the local concentration of ions in the different alteration zones control the diffusion of ions. The depth of leaching varies from 4 to 9 mm depending on time and concrete composition. As the depleted shell becomes thicker with time the leaching rate will diminish according to square root of time. If the leached shell remains intact, normal concrete will leach to a depth of less than 1 cm in hundred and less than 2 cm in thousand years, in shallow meteoric groundwater. Increased quality of the concrete will decrease the rate of alteration even further.

4
Sammanfattning Betong kommer att användas i olika sammanhang i de underjordiska förvaren för radioaktivt avfall. Cementbaserade material är i grunden instabila och kommer att brytas ned i grundvatten. Det är därför är det viktigt att kunna modellera och beräkna hur snabbt nedbrytningen går och hur detta kommer att påverka förvarets säkerhet. Betong är ett poröst material bestående av fasta faster i kontakt och jämvikt med en vattenbaserad porlösning. Den pågående nedbrytningen kan uttryckas i termer av utbyten av porlösning eller utbyten av joner i denna. I tät eller dränkt betong kommer utbytet i huvudsak att kontrolleras av diffusion och koncentrationsgradienter. Diffusionskontrollerad lakning kommer antagligen att vara den dominerande mekanismen för degradering när förvaret förslutits och grundvattennivån återställts. Mekanismen för lakning och de styrande parametrarna diskuteras i rapporten. Detta har tidigare baserats på lakningsexperiment och teori. I denna rapport har vi utgått från naturliga analogier vilket ger en bättre och mera realistisk uppfattning om hastigheten samt betydelsen av naturligt vatten. Vi har undersökt en serie gamla vattenbassänger från Norsborgs vattenverk utanför Stockholm. Bassängerna som byggdes 1910, 1916, 1927, 1944 och 1960 hade betong av olika kvalité. Vattensammansättningen är känd (dricksvatten) och betongen har varit i kontakt med vatten under hela perioden. Betongen har undersöks i detalj i polarisations-mikroskop, SEM och med hjälp av NMR. Detta har både gett texturen och de kemiska förändringarna hos de olika komponenterna i betongen. Cementpastan har utvecklat en karakteristisk zonering med en progressiv dekalcifiering kopplad till en anrikning av Mg-joner och karbonatisering i ytan. Detta har kompletterats med en undersökning av gammal betong från brodelar under vatten. Jondiffusionen kontrolleras av omvandlingszonens fysikaliska egenskaper och den lokala jonkoncentrationen i de olika zonerna. Lakningsdjupet varierar mellan 4 och 9 mm beroende på tid och betongkvalité. Allteftersom omvandlingsskalet blir tjockare minskar lakningshastigheten med roten ur tiden. Förutsatt att skalet förblir intakt kommer normal betong i normalt meteoriskt grundvatten att lakas mindre än 1 cm på hundra år och 2 cm på tusen år. Förbättrad betongkvalité minskar angreppsdjupet ytterligare.

5
Contents
1 Orientation 7
2 Introduction 9 2.1 Conditions for leaching 9 2.2 Diffusion controlled leaching 10
3 Properties of concrete and cement paste 13 3.1 Hydration and structure of the cement paste 14 3.2 Stability and structure of calcium hydroxide and calcium-silicate-hydrate gel 16 3.3 Stability and structure of AFm and AFt phases 21
4 Leaching experiments and data from old concretes in water 23 4.1 Experiments 23 4.2 Natural analogues 25
4.2.1 The water tank 25 4.2.2 The Norsborg water basins 26 4.2.3 Submerged bridge columns 29
4.3 Long term leaching rate 30
5 Controls of leaching rate 31 5.1 Ion transport and diffusion in concrete 31 5.2 Porosity changes and diffusion coefficient 32 5.3 Chemical constraints on ion mobility 35 5.4 Effect of pozzolanas on leaching rate 36 5.5 Development of the alteration zone and its effect on leaching rate 37 5.6 Effect of aggregates on leaching rate 41 5.7 Effect of water/cement ratio and degree of hydration on leaching rate 41
6 Models for determining the rate of leaching 43 6.1 Basic formulas 44 6.2 Effect of type of cement, silica fume and w/c ratio on diffusion rate 47 6.3 Effect of the composition of the alteration shell 48
7 Discussion and conclusions 51 7.1 Chemical processes 51 7.2 Physical processes 53
8 References 55
Appendix 1 Norsborg water basins 59 Appendix 2 Submerged parts of bridges 83
7
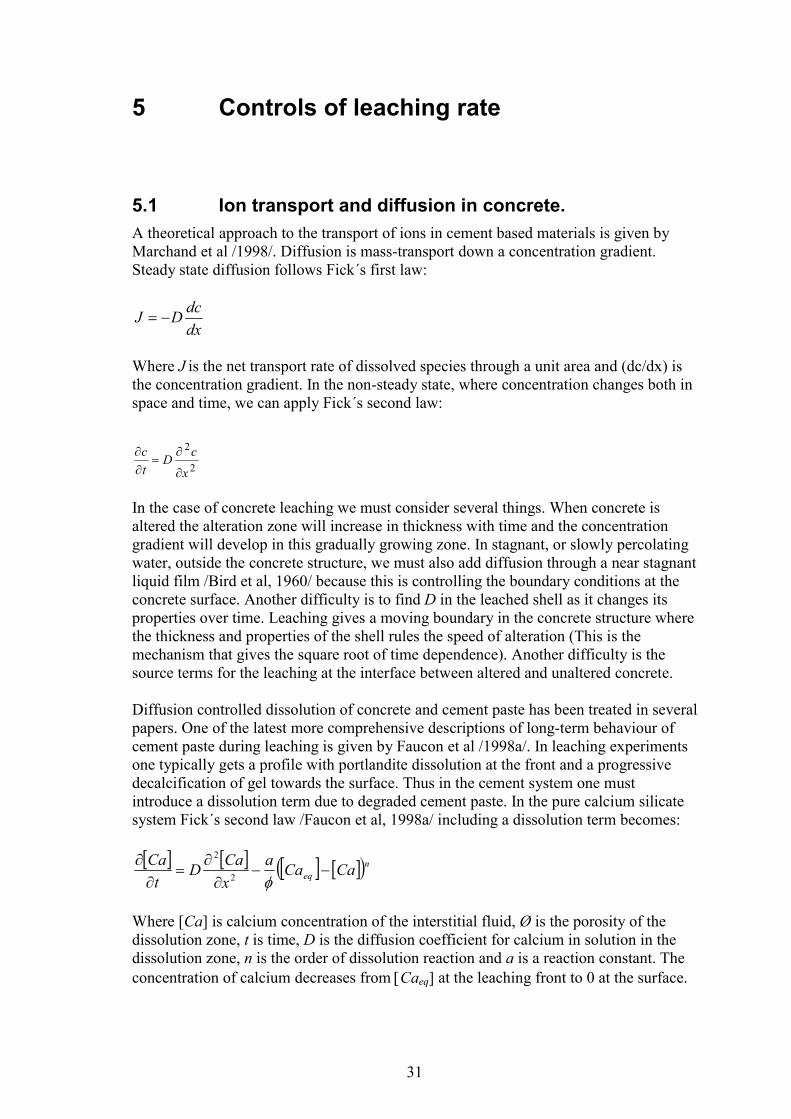
1 Orientation Nuclear waste must be isolated for a very long time in such a way that it does not harm the present or future generations of human beings. In Sweden, waste will be disposed of in underground repositories below the groundwater level. Concrete and other cementitious materials will be used for different purposes in these underground repositories. Cementitious materials are fundamentally unstable in water and will change properties with time. Moreover, the degradation reaction will contaminate the groundwater, which must be taken into account with respect to the safety systems as a whole. Thus we must know how concrete and other cementitious components behave in a water-saturated environment over a very long time period. We must know how the concrete changes both its chemical and physical properties over time and how it interacts with groundwater. The long-term behaviour of concrete has earlier been treated in several reports. A conceptual model for concrete long-term degradation is published in SKB TR 95-31 /Lagerblad and Trägårdh, 1995/. This is complemented by case studies in SKB AR 96-01 /Lagerblad, 1996/. In this study we investigated the effect of transmissivity and long-term changes of cement paste structures. We concluded that with time and full water saturation the concrete becomes very dense. This work was supplemented by a case study /SKB TR 98-11, Trägårdh and Lagerblad, 1998/ where we investigated leaching of a 90-year old mortar. The mortar was placed as a protective cover on the inside of a steel water tank. This work showed that leaching was a much slower process than previously assumed. The steel protection on the back is, however, different from that of massive concrete, in which water and gases can diffuse. This study has therefore been complemented by an investigation of concrete water basins at Norsborg outside Stockholm. The sequence of water basins in Norsborg, with different ages, shows the long-term leaching behaviour in more detail. The concretes have been subjected to leaching for different lengths of time and are of different quality. Thus they give more information on the mechanism and rate of leaching. The details of this work are presented in Appendix 1, but results will be discussed in the main text. To obtain an idea of the influence of wearing we also analysed a sequence of underwater parts of old bridges in Stockholm. The details of this work are given in Appendix 2, but results will also be discussed in the main text. The purpose of this report is to fill the gap between experimental data and reality by investigating existing historical analogues.

9
2 Introduction Concrete consists of aggregates and cement paste. Leaching can be regarded as an acid attack on the cement paste. The cement paste is formed and in equilibrium with a pore solution with a pH of between 13 and 14. Leaching is a process where the pore solution of concrete equilibrates with the surrounding water (pH around 6�8). This will result in a change of chemistry of the pore solution, which in turn results in chemical changes and dissolution of the cement paste. 2.1 Conditions for leaching There are different modes of leaching and alteration /Lagerblad, 1996/. The whole situation must be considered together with the material. Concrete is a porous and thus permeable material. The porosity and the resulting permeability are mainly a function of concrete /Trägårdh and Lagerblad, 1998/. If water can pass trough the concrete, the pore water will be continuously renewed and the leaching will be fast. Moreover, the passing water will dissolve components, which in turn will increase the porosity and the degree of penetration. This, however, requires a water pressure or some other force to drive the water through the concrete. As concrete is porous there is a relationship between porosity, thickness, pressure and transmissivity of concrete. Flow in capillary pores in saturated concrete follows Darcey´s law for laminar flow through a porous medium. Severe leaching has sometimes been observed in water dams and other water constructions with poor quality concrete. In normal cases concrete with a water/cement ratio of less than 0.5 is regarded to be sufficient to stop normal water penetration. One must, however, consider that the concrete may have cracks or other irregularities that will effect the permeability. When concrete is drowned, the pressure will be equalised and no water will penetrate the concrete. Dissolution will then be controlled by diffusion through the surface of the concrete. The driving force for diffusion controlled leaching will be the concentrations difference between the pore solution and the external water. The different leaching situations are summarised in Figure 1. When the repository is closed and the groundwater level restored the water pressure will be adjusted and the leaching will presumably be diffusion controlled. The only other case will be very porous concrete where water may percolate if there is a driving force like temperature difference etc. This may be the case close to the canister, where there is a temperature gradient. In the normal case, with dense high quality concrete, diffusion will be the main transport mechanism for leaching in a closed repository. Diffusion in concrete will also be influenced by the flow of water outside, on the surface of the concrete. Flow effects both erosion and chemical conditions for leaching.

10
C a s e 2 . S lo w w a te r p e n e t ra t io n
P o r t la n d ite c r y s ta ls
A ir w o id s w ith p o r t la n d ite a n d e t t r in g ite
L o w s o lu a b le c o m p o n e n ts
H o llo w s h e ll a f te r c lin k e r
C a s e 3 . O n e -s id e d w a te r p re s s u re
D is s o lu t io n o f c l in k e rg ra in s a n d C H
W a te r
D e n s if ic a t io n
C a s e 4 . N o m o is tu re t r a n s p o r t
In - s itu h y d ra t io nD e n s if ic a t io n b y p re c ip ita t io no f C H a n d C -S -H in th e c a p i l la r y p o re s
N e e d le l ik e C -S -H
C H d is s o lv e d a n d re m o v e d
H o llo w s h e ll a f te r c lin k e r
C a s e 1 . F a s t w a te r p e n e t ra t io n
Figure 1. Different cases of leaching. Case 2 is diffusion controlled. From Lagerblad /1996/. 2.2 Diffusion controlled leaching Data on diffusion controlled leaching together with mechanisms and rates of dissolution are today based on both theory and experiments. The basic mechanisms are well known. The driving force of diffusion controlled leaching is the concentration difference between the pore solution in the decomposing concrete and the external water at the surface. The concentration at the surface is not only controlled by the composition of the water but by how fast ions can be transported in away from the surface. Thus the flow of water is important. Different cement hydrate phases will dissolve or change composition according to pH and contents of Ca in the local pore water. The major component of cement paste is calcium and the main process of leaching is decalcifica-tion, leaving behind a shell of silica and metalhydroxides. In the concrete this will result

11
in a zonal pattern with progressively more Ca depleted paste towards the alteration front. In principal, the system is simple but in reality it is complicated as we have to consider both the cement paste alteration, ion transport and material alterations in the same context. Moreover, components from the water may precipitate and change the leaching conditions. To be able to model the leaching rate we must know the following parameters: 1. The solubility of the different components of the intact and degrading cement paste. 2. The concentration of dissolved substances in the pore solution through the alteration
shell and in the external water. 3. Concrete and cement paste is a porous material. The diffusion mainly occurs in
water saturated pores. Thus we must know the interconnectivity and geometry of the pore system.
4. The porosity and ion diffusivity of the different layers. 5. The erosive forces and the physical properties of the leached alteration product. 6. The flow of the water.

13
3 Properties of concrete and cement paste Concrete is built up of aggregate particles that are glued together with cement paste. Generally the aggregates consist of dense impermeable natural rocks, which do not influence the porosity directly. Therefore, the porosity properties of the concrete are related to the density, homogeneity and distribution of cement paste, which in turn may be due to aggregate properties and mixing procedures. The diffusion mainly occurs in the connected porosity of the cement paste. The connected porosity, in turn, depends both on the structure of the cement paste and the unevenness of the cement paste. A critical element for the diffusion is the interfacial zone between the aggregates and cement paste, which is more porous and contains more calcium hydroxide and ettringite than the rest of the cement paste. Different aspects of this and influences on the transport properties are treated in Alexander et al /1999/. However, the width and effect of the interfacial zone may depend on the properties of the concrete mix and the handling of the fresh concrete /Lagerblad and Kjellsen, 1999/. The migration of ions is controlled by the properties of the alteration zone and the concentration distribution in the different alteration zones. Therefore, to understand the mechanism of leaching we must understand both the micro-texture of the paste and the composition and the chemical stability of the different phases in both the unaltered and altered cement paste. One must also consider the maturity of the cement paste and long-term alterations that will change its properties. Cement paste is a hardened mixture of cement and water. The cement is made up of cement minerals, formed during high temperature burning of limestone and clay. The main components are dicalcium silicate (C2S), tricalcium silicate (C3S), tricalcium aluminate (C3A) and tetracalcium ferritealuminate (C4AF). Before use, the cement is mixed with gypsum to regulate the early hydration. The composition of the cement has been largely unchanged over the last hundred years /Trägårdh and Lagerblad, 1998/. It is, however, more fine-grained today than it was in the beginning of the century. The cement reacts exothermically in contact with water and forms cement paste hydrates. Cement paste consists of calcium-silicate-hydrates (C-S-H), calcium hydroxide (CH), monosulfate (AFm) and ettringite (AFt). The calculated volumes of different phases in a 14-month old cement paste are given in Table 1. Table 1. Calculated volume percentage and porosities of a well-hydrated paste with a w/c ratio of 0.5 /Taylor, 1997/. Hydrogarnet is a phase stabilised by available Mg and hydrogarnet is a hydrous phase containing Ca, Al and but no sulphate. RH Alite Belite C3A C4AF C-S-H CH AFm AFt Hydro
garnet Hydrotalcite
Pores
100% 1.0 0.6 0 1.0 48.7 13.9 11.1 3.6 2.2 1.8 16.0 11% 1.0 0.6 0 1.0 36.2 13.9 11.1 3.6 2.2 1.8 28.5 D-dry 1.0 0.6 0 1.0 27.6 13.9 8.3 2.4 2.2 1.4 41.5

14
The composition of the cement and the degree of hydration mainly control the amount of different solid components. The composition of the paste can, however, be altered by reactions with the aggregates or by incorporation of reactive silica in the mix (pozzolanas). The C-S-H, which is the dominant phase, is amorphous to crypto-crystalline while the other phases are crystalline. From Table 1 it can be seen that drying will effect the volume of the C-S-H. Calciumsilicate hydrates are the main silicate component. The AFm and AFt contain apart from calcium also aluminat/ferrite and sulphate ions. The type and amount of phase formed depends on the contents of aluminate/ferrite and sulphate. Thus the C-S-H and the other phases can be regarded as independent of each other and treated separately. The crystalline components have their defined stability fields while that of C-S-H is less well defined due to its less ordered cryptocrystalline structure. Concrete is a porous material. It contains both gel pores and capillary pores. The capillary pores mainly control the permeability of the cement paste. They consist of channels formed by the remaining interconnected free water spaces. Thus concrete with a high water/cement ratio in the mix has a high capillary porosity and permeability. The gel pores are in the C-S-H gel and depends on its structure as described below. The gel pores have dimensions of between 1 and 100 nm. The exact size is difficult to assess, as there is a range from crystal water, absorbed water to free water. Theoretically /Young and Hansen, 1987/, mature fully hydrated concrete and cement pastes with a w/c ratio of around 0.4 will contain no capillary pores, only smaller gel pores. This is not, however, the case in reality due to inhomogenities and the fact that clinker grains remain unhydrated. The old submerged mortars and concretes are very dense relative to younger concretes, as they are very well hydrated due to the long contact with water. 3.1 Hydration and structure of the cement paste The structure of concrete and the chemical conditions of cement paste will change over time. In the young concrete, the paste is not in chemical equilibrium. Thus, to understand the chemical conditions of leaching, we must understand how and under what conditions the concrete and cement paste is formed and how it changes over time. The young cement paste has a complex structure as it forms in a rapidly changing environment. The exothermic dissolution reactions will give a supersaturated solution in which different components precipitate. This is a rather complex process where some components like C-S-H precipitate and grow on the surface of the clinker grain, while others like calcium hydroxide and ettringite can precipitate in the water phase. The first step of reaction is the dissolution of sulphate and alkali constituents, together with protonolysis of the very reactive C3A. This will form ettringites (AFt). Later, when the sulphates are consumed, the ettringites will transform into monosulphates (AFm) that contain relatively less sulphate. This is due to the fact that the cement is unbalanced in sulphate. Almost simultaneously the major calcium silicate minerals of the cement starts to react. The main reaction starts with protonolysis of silicone oxygen bonds at the C3S/C2S surface. Hydroxyl and silicate ions are generated, and the simultaneously

15
liberated Ca-ions will precipitate the silicate ions as C-S-H at the surface. This first stage product will act as a barrier, which slows down the migration of water to the clinker surface and the release of calcium and hydroxyl ions to the pore water. This will result in a dormant period with very little chemical activity. After a couple of hours this first product seems to undergo changes that makes it more permeable and the major phase of hydration can start. The growth of the different hydration phases is illustrated in Figure 2. The composition of the pore fluid follows a reverse picture with high Ca and sulphate contents to start with but low when portlandite and ettringite start to precipitate. The different types of early formed phases and compounds will re-equilibrate slowly and it will take some time before a proper equilibrium is reached.
Figure 2. Schematic diagram for the formation of the hydrate phases and development of structure during the hydration of cement /Odler, 1998/. (a) Consumption of cement clinker phases. (b) Formation of cement hydrate.

16
The later stages of hydration are also complex and there are several models to explain the phenomena observed in the in cement paste. For a long time there will remain cement clinker grains (mainly the C2S and C4AF) protected by a rim of hydration products. It seems like clinker dissolution can proceed in two modes. Either the cement grains will dissolve from inside the shell and form hollow grains /Kjellsen et al, 1996, 1997/ or the hydration will proceed through the early hydrated shell and form a dense inner product. When observed in microscope, the outer product and the infillings of hollow grains are less dense and have a fibre-like structure. The inner product, which is formed �in situ�, appears to be more homogeneous and denser without any distinct fabric. Moreover, the different components are fine-grained and many of the crystals will grow larger with time as this is energetically preferable. Cement paste structures can be observed in the photos in Appendix 1. As the hydration is a fast process the system is not in equilibrium. Therefore one can assume that it will change over time, to lower its energy and reach a more proper �equilibrium�. The system will thus change chemistry and texture, which in turn will change the porosity and leaching conditions. This must be taken into account when long-time performance is considered. During leaching the concrete will be constantly in contact with an excess of water. The hydration will slow down with time but, given the long-term perspective of the leaching, prolonged hydration and re-equilibration will become important. The hydration of concrete continues for a very long time. Even after 90 years in water unhydrated cement grains may remain. Theoretically, with a water/cement ratio of below around 0.4, all water will be consumed and no capillary space will remain. In this case the gel porosity will dominate and that will influence the leaching. That this indeed is the case was shown by the concrete samples from the Älvkarleby power station /Lagerblad, 1996/ and by the samples from Norsborg (Appendix 1). 3.2 Stability and structure of calcium hydroxide and calcium-silicate-hydrate gel Calcium hydroxide (CH) and the composition of the calcium-silicate-hydrate (C-S-H) are closely linked. In the normal case the C-S-H is in close contact with CH formed in a solution saturated or, in the early stages, oversaturated with CH. The calcium hydroxide is crystalline and its solubility in the unaltered concrete is controlled by temperature and contents of alkalis (Na+, K+). The solubility decreases with increasing temperature and content of alkali ions. The calcium-silicate-hydrate is the most important of the hydration phases. It is, however, difficult to model the alterations, as the C-S-H is non-crystalline and dissolves incongruently. Thus, one must understand its structure. The summary of relevant information below is mainly from Taylor /1997/ and Odler /1998/. Most of the references can be found in their publications.

17
The C-S-H phase is a nearly amorphous material and its structure can not be studied by X-ray diffraction. Therefore, its structure must be studied by other methods and/or by analogy with natural or synthesised minerals. Some information on the structure of the compound can be obtained by 29Si MAS-NMR (magic angle spinning nuclear magnetic resonance). This method makes it possible to distinguish and determine the fractions of SiO2 present in the form of SiO4-tetrahedra. It is also possible to see if the tetrahedra are separated from each other or linked to one, two, three or four neighbouring tetrahedra through Si-O-Si bonds. Such different structural forms of SiO4 are designated Q0, Q1, Q2, Q3 and Q4. The cement clinker give Q0 (separated tetrahedra) while the C-S-H formed within the first hours of hydration contains predominantly Q1 species indicating dimers. As hydration progresses, Q2 becomes more prominent indicating the growth of polymeric linear chains. MAS-NMR has been used to analyse the concrete from the water tank and the Norsborg dams from 1910, 1944 and 1960. The analyses are dominated by Q2, which shows an increasing polymerisation with time. The polymerisation is also controlled by the density and quality of the concrete. The lower quality (porous) bulk concrete in the sample from 1910 (see Appendix 1) is totally dominated by Q2, while the high-quality dense mortar contains both cement clinker and Q1 (Figure 3). This indicates that polymerisation is kinetically controlled and that it is easier to polymerise the gel in a porous water-rich cement paste. Longer chains mean a lower energy. Thus, the C-S-H presumably gets more difficult to dissolve with time. The existence of C-S-H compounds at the natural cement system at Maqarin /Milodowski et al, 1998/ indicates that it can remain amorphous to semicrystalline without crystallising for a very long time if pH and content-Ca ions are high enough.
Figure 3. 29Si NMR spectra of cover mortar and bulk concrete from the Norsborg basin casted in 1910. The mortar still contains cement clinker grains (Q0) and is very dense, while the concrete is porous (see Appendix 1). Analysis made by ESPCI-Laboratory de Physique Thermique in Paris. This analysis is made in co-operation with another project (Brite Euram, UNICORN) and the material will later be published in full context.
-160-150-140-130-120-110-100-90-80-70-60-50-40(ppm)
bulk concrete
Cover mortar
Q0 species
C-S-H
Q1 Q2
Spinningside band

18
On a nanometer scale the C-S-H phase seems to be structurally related to the crystalline phases 1.4 nm tobermorite (Ca4+xSi6O15+2x (OH)2-2x x 5H2O /Merlino et al, 1999/) and jennite (Ca9(Si6O18)(OH)8 x 6H2O /Taylor, 1997/) and to poorly crystalline materials called C-S-H (I) and C-S-H (2). Presumably the C-S-H contains short chains similar to these two minerals. Semicrystalline C-S-H (I), which has a structure similar to tobermorite, is produced by a reaction between calcium hydroxide and hydrous silica. It can be prepared with a Ca/Si ratio between ca 0.8�1.5. The C-S-H (II) phase is produced by hydration of C3S in an excess of water and repeated removal of the liquid to lower the Ca/Si of the liquid. The CaO/SiO2 ratio of a paste (ca 1.7) is higher than that of jennite and much higher than that of 1.4 nm tobermorite (0.9 and 1.5 respectively). The CaO/ SiO2 ratios of the prepared C-S-H (I and II) are higher than that of the crystalline phases of which they appear to be structurally imperfect forms (1.0 and 1.8 respectively). There are several proposed explanations and models for this and the composition of the real gel. It could be due to a combination of omission of tetrahedra from the chains and incorporation of additional calcium in the interlayer. In this model, proposed by Taylor /1997/, the C-S-H phase consists of highly distorted tobermorite- and jennite-type layers. The Ca/Si ratio of the gel is determined by the number of missing SiO4-tetrahedra and the mutual ratio of the two types of crystal structures. It could also be due to or accompanied with the incorporation of micro-crystals of portlandite during growth. Another complication is that the C-S-H gel can incorporate other ions. In the gels analysed, we could always find Al2O3 (2�5%), minor amounts of Fe2O3 and MgO and sometimes some K and SO4. Richardson and Groves /1993/ have investigated the incorporation of Al. They found that the Al was both tetrahedral and octahedral co-ordinated replacing Si and Ca respectively. At low Ca/Si ratio the Al mainly substitutes for Si while at high ratio it mainly substitutes for Ca. During leaching of Ca, the Al switches from octahedral to tetrahedral substitution. The Fe3+ presumably behaves like Al. The samples from Maqarin /Milodowski et al, 1998/ show that the C-S-H gel can contain a substantial amount of Al. Several researchers like Steinour /1952/, Jennings /1986/, Atkinson et al /1991/, Stronach and Glasser /1997/ have studied the relationship between composition of C-S-H and contents of SiO2 and Ca ions in the water. Jennings /1986/ made a diagram from existing experimental data that shows the relationship between silica and Ca contents (Figure 4). The relevant data for hydration is on line B (Figure 4) which requires hydration of cement clinker. Line A (Figure 4) shows the relationships without clinker grains and is therefore relevant during leaching. Here we can see that portlandite needs 20 mmol CaO to precipitate. Below this concentration the solubility of silica increases until a very low concentration of Ca where it decreases again. This decrease at low Ca can be more clearly seen in Figure 5.

19
A q u e o u s P h a s e+
S iO 2 (H 2 O ) 2
C -S -H+
A q u e o u s P h a s e
C -S -H+
C a (O H ) 2+
A q u e o u s P h a s e
A q u e o u s P h a s e+
C a (O H ) 2
A q u e o u s P h a s e
N o te : M e ta s ta b le e x te n s io n
A
B
0 2 4 6 8 1 0 1 4 1 8 2 2 2 6 3 0m M C a O
µM S
iO2
2 0 0 0
1 0 0 0
1 0 0
1 0
1
0 .1
Figure 4. Plot of concentrations of SiO2 vs. CaO in aqueous phase, simplified from Jennings /1986/. The diagram is based on the results from many investigations. It represents the solubilities of C-S-H. The data mainly falls on two lines A and B. The data on line B comes from solutions where the aqueous phase had reacted with the cement clinker mineral C3S for periods not exceeding a few days. Unreacted C3S was probably present. Some of the experiments using C3S and all experiments using other starting materials gave points on the lower curve, A.
Figure 5. Calculated solubility diagram of the CaO-SiO2-H2O system at 25°C /Stronach and Glasser, 1997/. The y-axis is logarithmic. The C-S-H single-phase regions are artificially fixed by the constraints of congruent dissolution /Stronach and Glasser, 1997/.

20
The CaO/SiO2 ratio of the C-S-H can, however, be altered by the addition of pozzolanas. The pozzolanas both alter the composition of the pore solution, when the C-S-H is formed, and react with the C-S-H at a later stage. The effect of the pozzolanas, commonly reactive silica or a silica compound is that they react with the calcium hydroxide, which lowers the content of Ca ions in the pore solution. The pozzolanic reaction also affects the porosity of the paste. The reason for the increase in density is that, with a constant amount of cement, the pozzolanas will produce more C-S-H. The volume of C-S-H is larger than that of SiO2 (S) and Ca(OH)2 (CH) because the C-S-H also contains water. This will diminish the porosity. As the pozzolanas also diminish the amount of easily soluble CH, they can be used to modify the concrete to get other chemical properties. The most effective pozzolanas is silica fume, which is amorphous silica in nanosize. Another effect of lower Ca/Si ratio and lower pH is that the C-S-H becomes more polymerised, Q2 and eventually Q3 is the dominant peak in the 29Si NMR spectra /Matsuyama and Young, 2000/. In a solubility model of C-S-H, Stronach and Glasser /1997/ proposed three C-S-H phases, which are each stable at different defined solution compositions (pore water composition). They have Ca/Si ratios of 0.8, 1.1 and 1.8 respectively (Figure 6). This will correspond to CaO/SiO2 ratios of 1.1, 1.5 and 2.4 respectively. The C-S-H (1.8) is unstable.
Figure 6. Measured and modelled relationship between Ca concentration and Calcium/silica ratio of C-S-H. From Steinour /1952/. Similar diagram in Rahman et al /1999/.

21
3.3 Stability and structure of AFm and AFt phases In normal cement there are, apart from the dominant C-S-H and CH, a partly independent group of minerals containing Ca, Fe, Al and sulphate. The two dominant types are named ettringite and monosulphate. They belong to two minerals groups commonly called Aluminium-Iron-tri (AFt) and Aluminium-Iron-mono (AFm) respectively. They are both dependent on Ca ion concentration and on a high pH, but they are also controlled by Al and/or Fe, and dependent on sulphate ion concentration. They can both interact with other ions normally found in groundwater. Thus when the normal paste is being leached one must consider the effect of these ions on the stability of AFm and AFt. AFm phases have the general formula (Ca2(Al, Fe)(OH)6) x X x yH2O, where X denotes one formula unit of a single charged anion, or half a formula unit of a double charged anion. The term �mono� relates to the single formula unit of CaX2. Many different anions or anion complexes can serve as X, of which the most important are OH
-, SO4
2-,
Cl- and CO3
2- /from Taylor, 1997/. The AFm phases are crystalline with often, due to small grain size and solid solutions, somewhat blurred X-ray peaks. AFt phases have the general constitutional formula (Ca3(Al,Fe)(OH)6x12 H2O)2 x X3 x yH2O, where y < 2 and X represents one formula unit of a double charged ion, or with reservations, two formula units of a single charged anion. In the normal case X is SO4
2-, but it may also be CO3
2- or Cl-. Ettringite can be found in nature. When X is CO3
2-, Si substitutes Al and/or Fe. The chlorine compound can only be found in extremely chlorine rich environments at low temperatures. The solid solution possibilities of ettringites are described in Pöllman et al /1989/. Analyses of secondary ettringite crystals in the Norsborg samples show that they are ettringites but with some thaumansite substitution and impurities of monosulphate. Larger, secondary ettringites are dominated by Al3+ ions, presumably because Fe3+ is immobile. Thaumansite is a coupled substitution where CO3
2- replaces SO42- while Si replaces Al and/or Fe.
Both ettringite and monosulphate are stabilised by high pH and high concentrations of Ca ions. Which one is formed depends on the concentration of SO4, as there is an excess of Al and Fe ions in Portland cement. Gabrilová et al /1991/ found that in non-equilibrium conditions the pH boundary for the disappearance of ettringite is around 10.7 and for monosulphate around 11.6 in solutions rich in sulphate. Thaumansite is only stable at low temperature (less than 20°C). Monosulphate decomposes into ettringite and a calcium aluminate hydrate (hydrogarnet). Ettringite decomposes to sulphates and metal hydroxides and/or hydrogarnet. Thus when ettringite decomposes the sulphate ions will move to a higher pH (inwards) where it reacts with the calcium aluminate hydrate and form a new ettringite. This will create an inward mowing sulphate boundary and the sulphates will not be released to the surrounding water until a very late stage of degradation. This can be observed in the Norsborg samples.

22
However, one must consider the environment as a whole. High temperature and high concentrations of alkali ions /Damidot et al, 1992/ will diminish the stability field of ettringite. High concentrations of chloride can cause the formation of Friedel´s salt (AFm phase). Carbonate in aggregates or filler can, at low temperature, cause the formation of thaumansite.

23
4 Leaching experiments and data from old concretes in water One of the problems with calculating leaching performance of concrete is the scarcity of long-time data. Most experiments run for less than a year. The bulk of knowledge of leaching comes from experiments and models based on theory and these short-term experiments. They will not give the full picture of phenomena like prolonged hydration, recrystallization and the later stages of the alteration shell development. 4.1 Experiments Leaching experiments have, in most cases, been accelerated by the use of pure demineralized water /Faucon et al, 1998a/ or water with ammonium nitrate /Carde et al, 1995, 1997/. This gives the general trends and shows the formation of alteration zones that controls the speed of leaching /Adenot and Buil, 1992; Faucon et al, 1998a/. From the zonal pattern chemo-physical models, based on dissolution precipitation of solid phases, have been developed. Adenot /1992/ made a numerical simulation, referred to in Gérard and Le Bellégo /1999/, of the long time leaching of a w/c 0.4 ordinary Portland cement paste. For a period of 300 years, the author estimates a maximum leaching depth of 4 cm. However, the time for the underlying leaching experiments was still short and it is not certain that a steady state was achieved. Rombén /1978, 1979/ conducted the only sufficiently long time leaching experiment that we have found so far at CBI. He subjected concrete of different quality (w/c ratio) to hydrochloric acid at different pH (2�6). The speed of alteration was measured as consumed acid and depth of leaching. During the combined acid attack and leaching an alteration shell of silica and different metal hydroxides developed. The development of this shell determined the speed of leaching and depth of alteration. The pH influences the leaching but the effect of pH was not prominent until the pH was below 4. This is presumably due to that the components of the shell, i.e. the aluminium hydroxides, become soluble at this low pH. At a pH of 5 and 6 the speed of alteration was fairly similar. Figure 7a and 7b show the results of leaching for 10 years at pH 5 and 6. From these data we can see that the leaching rate stabilises with time to a square root of time function. The data from pH 5 are both from a concrete and mortar that contain more cement. As predicted from theory (Chapter 5), the amount of leached material increases with the amount of cement but this is not the case with the depth of leaching (4 mm). The concrete at pH 6 leached 5 mm in ten years. The mortar was cast with a water/cement ratio of 0.32 while the concretes were cast with a ratio of 0.33. This is a low w/c and the concretes can be regarded as high-quality concretes. The lower pH and chloride ions will, however, accelerate the leaching somewhat.

24
Figure 7. Leaching of concrete in weak hydrochloric acid. Automatic pH-titration with acid gives the amount of Ca liberated during attack. In the diagrams the speed of attack is calculated as the amount of dissolved CaO versus time. Continuation of leaching experiments /Rombén, 1979/. Unpublished data from Rombén 1986. (a) Concrete with w/c = 0.33, pH = 5.0. Depth of leaching was 4 mm in 11 years. (b). Concrete with w/c = 0.33, pH = 6.0. Depth of leaching was 5 mm in 11 years.

25
4.2 Natural analogues Detailed data from the Norsborg concretes are given in Appendix 1. Detailed data from the water tank are given in Trägårdh and Lagerblad /1998/. 4.2.1 The water tank In 1906, a water tank was installed in one of the towers in the castle of Uppsala, Sweden. A 20 mm thick protective layer of concrete mortar was placed on the inner walls of a steel water tank. It was demolished in 1991 and pieces of the mortar were taken for analyses. The water tank had been refilled periodically with fresh water, which means that the concrete mortar has been leached by drinking water for nearly 85 years. As the steel hinders the penetration of water, diffusion and some percolation processes must have controlled the leaching. Percolation is possible as water has also mowed in the space between the steel and the concrete mortar. The concrete has been investigated by several methods including thin-section in a polarising microscope, SEM, SEM-EDS, image analysis and chemical analysis. The results show that the mortar is covered by a rim of manganese precipitates followed by a dense shell of calcite (around ½�1 mm thick). This is followed by a 5�8 mm thick distinct porous zone with decreasing calcium contents. Behind the porous zone the mortar is dense, with recrystallization of portlandite and ettringite in air voids. The porous zone, than can be divided into two zones: An outer zone dominated by fine (1�10 µm) and an inner zone with coarse (10�30 µm) porosity. The inner porous zone with coarse porosity also contains secondary ettringite and portlandite precipitations. Secondary ettringite and portlandite precipitation can also be found in air voids in the dense concrete. In the dense zone one can only notice a slight Ca-depletion. In a thin zone against the steel the concrete again gets more porous and one can again find calcite. This indicates that there has been a slit between the mortar and steel which allowed water percolation, leaching and calcite precipitation. The observations indicate that the leaching in the water tank is not purely diffusion controlled as there is water on both sides. This presumably lead to percolation and portlandite/ettringite precipitation in the outer porous zone, minerals that are missing in the other cases. Thus the mortar does not show the typical zonal leaching pattern but it stills give an indication of the phenomena. Leaching apart from removal of some ions leads to redistribution of elements. Calcium from the mortar moves towards the surface where it, at least partly, precipitates as a dense crust of calcite. The leaching has resulted in a porous zone in which portlandite and ettringite recrystallizes. The C-S-H in the dense paste has reorganised to a lower Ca/Si ratio, although CH crystals remain. This also shows that, even if percolation is involved, the leaching process is very slow and the interior is protected by an alteration shell.

26
4.2.2 The Norsborg water basins All the different concretes in Norsborg have been subjected to the same environment. Therefore, the differences regarding chemical and textural changes must be due to variations in material properties and exposure time. The concrete basins from 1910, 1916 and 1927 have been covered by a mortar concrete, within which the leaching has occurred, while the samples from 1944 and 1960 are normal concretes. The mortar concretes contain about twice as much cement as the ordinary concretes. The mortar concretes were much more dense, presumably due to the relatively lower water/cement ratio. An important observation was that the prolonged hydration has resulted in very dense paste especially in the mortar concretes. Moreover, NMR and chemical data show that the paste with time homogenises and that the C-S-H polymerises to greater chain length which will make the paste more difficult to dissolve. Secondary ettringite is common in all zones but is prominent in zone 4 and 5. A full description of the chemistry, different textural details and zonal pattern is given in Appendix 1. All the concretes have developed a similar zonal alteration pattern, presumably typical for the leaching and the type of water. An interpretation of the zonal pattern is shown in Table 2. The interpreted content of Ca and Si ions and the pH has been taken from the diagrams in Chapter 3 and the conditions for ettringite crystal breakdown. There are three major mechanisms, which have formed this zonal pattern. 1. Outward diffusion of calcium ions from the paste to the water causing a volume
decrease. 2. Inward diffusion of carbonate- and Mg-ions in the paste giving a carbonate surface
and Mg-enrichment in the silicate gel. 3. Mineral breakdown, formation and alteration of phases due to chemical changes of
the pore solution. The cement paste becomes successively depleted in Ca. Calcium ions diffuse in the pore solution along a concentration gradient towards the water in the basins. This can be linked to a successive depletion first in portlandite crystals and later in Ca ions from the C-S-H. Some of the Ca ions have been bound to calcite but most of it has been lost to the water. The release of Ca ions from the C-S-H is relatively sluggish compared to the dissolution of portlandite. The C-S-H remains physically intact until the CaO/SiO2 ratio has dropped to around 1.0. This shows that the C-S-H can lose a substantial amount of Ca ions before the silicate structure collapses, which in turn substantiates a model with calcium silicate sheets in non-ideal solid solution with CaO as suggested by Rahman et al /1999/.

27
Table 2. Schematic interpretation of the zonal pattern in the leached concretes from Norsborg. C-S-H(2) has shrunk to less volume than C-S-H(1). The silica gel is dominated by silica but it also contains Al2O3 and MgO. The MgO content and CaO/SiO2 ratio are approximate and relates to the gel. ( * in gel). The pore solution chemistry is approximated from diagrams produced by Stronach and Glasser /1997/ (Figure 5) and Steinour /1952/, Rahman et al /1999/ (Figure 6). Zone 1 Zone 2 Zone 3 Zone 4 Zone 5 Zone 6 Phases Calcite
Silica-gel Hydroxides
Silica-gel Calcite Hydroxides
Silica-gel /C-S-H Hydroxides
C-S-H (2) Ettringite
C-S-H (1) Ettringite (Cement)
C-S-H CH Ettringite (Cement)
Al2O3 High Medium low low low low *MgO High Medium Low None None None *CaO/SiO2 < 0.1 < 0.5 0.5�1.0 Around 1 1.0�1.6 1.6�1.7 [Ca] mmol/kg low < 2 < 4 < 10 10�20 >20 [Si] mmol/kg 1.5 4.2 1.5 1.5 <1 <1 pH 7 Around 10 10.0�10.5 > 10.5 10.5�12.4 > 12.4 Porosity Low Medium High Medium Low Very Low The decrease of CaO/SiO2 ratio towards 1 varies between the different concretes from zone 3 to 5. However, the ratio of 1 lies close to the ettringite dissolution zone presumably when the Ca has dropped to below 10 mmol/kg in the water and ettringite is close to its stability limit (pH< 10.5). The Ca/Si ratio, Ca concentration and pH are in accordance with the calculated solubility by Stronach and Glasser /1997/ shown in Figure 5. The stable phase is C-S-H(I), which indicates that tobermorite, is the basic structure of the gel. Later when ettringite disappears (below pH 10.5) the C-S-H gel collapses and the paste becomes very porous. At this stage the silica starts to become more soluble. Later at the surface, when the pH is close to that of the water, the silica becomes less soluble (Figure 4 and 5). This would lead to a migration of Si ions from zone 2 (pH 10) to zone 1 (pH 7) where they would precipitate and densify the crust of the concrete. The structural changes of the cement paste will affect the porosity, which in turn affects the diffusivity. In the first leached zone (nr 5) the diffusivity will increase with the amount of depleted portlandite, as there are no changes in the volume of the C-S-H. When the C-S-H collapses and shrink (zone 4) the porosity increases distinctly. In the next zone, where ettringite is destabilised due to low pH, the porosity is even larger (zone 3). Zone 3 can presumably be regarded as the transport zone in which the rate of diffusion is high. The carbonated two outer zones are less porous than zone 3 and will thus slow down the dissolution. It is presumably zone 5, part of 4 and 1 that controls the diffusion.

28
The AFm and AFt phases also follow a typical pattern ruled by pH and solubilities. In zone 3 ettringite dissolves due to low pH. This will release sulphate ions, which will move inwards and form new ettringite from monosulphate or form other aluminate phases. This will be similar to a sulphate attack on normal concrete. The volume of ettringite is larger than the original components, because ettringite contains such a large volume of water. It will therefore densify the paste of zone 4. Theoretically this mechanism may damage the concrete according to the sulphate attack mechanism. The cement paste is stabilised by carbonate and Mg-ions from the water. The inward diffusion of carbonate ions forms calcite that stabilises the paste and develops a carbonate-stabilised shell. If there were no carbonates forming a physically stable surface, the collapsed C-S-H would form another dense surface of silica gel. The Mg ions probably stabilise the silica gel by substituting Ca in the octahedral sites. Thus carbonate- and Mg-ions will prevent shrinkage and delay leaching. The depth of alteration shows that leaching is a slow process. The ordinary concrete in the samples from 1944 has been leached only to a depth of less than 9 mm during the 54 years that it has been in contact with water. The concrete from 1960 has leached less than 5 mm during the 38 years in contact with water. The difference in alteration depth shows that the rate of leaching is also controlled by the properties of the paste. We do not know the w/c-ratio at the time of casting but its value is indicated by the density of paste and remaining cement clinker grains. The thin-sections indicate that the concrete from 1960 is somewhat denser than that from 1944. The mortars from 1910, 1916 and 1927 are much denser and must have had a w/c-ratio of less than 0.4 as there are such a lot of remaining clinker grains in a very dense paste. There is nothing distinct in the texture that explains the difference in penetration depth between the three mortar samples. They are all totally dense without any capillary porosity behind the leaching front. There are, however, indications in SEM that the gel itself is somewhat denser in the samples from 1916 and 1927 than in the one from 1910. This indicates that a very low w/c ratio would be preferable, because that will diminish the gel porosity which increases the leaching resistance. The amount of cement in the mortar of the samples from 1910, 1916 and 1927 is much larger than in the concretes from 1944 and 1960 (see Appendix 1). The concrete from 1910, however, has the same depth of alteration, considering the square root dependence, as the younger concretes. This indicates that the smaller depth of alteration in the samples from 1916 and 1927 is due to differences in concrete quality. The remaining clinkers also affect the leaching. When the leaching front moves inwards they will start to hydrate. This will release calcium hydroxide that buffers the pore solution. At the same time C-S-H will precipitate. The clinker and the gel produced from the clinker have a similar volume /Lagerblad, 1999/. Thus Ca from the paste can be leached without any change in volume/porosity. The texture indicates that when some of the cement clinker grains hydrate they leave a hollow space. If this is the case the immobile silica must have densified the surroundings.

29
The data show that there is a difference in leaching depth that must be linked to the material properties. It is not linked to the amount of cement as the sample from 1910 contains as much cement as those from 1916 and 1927. Neither can it be due to remaining cement clinker as all three samples contain a lot of clinker. The type of cement and its fineness is the same. We know that the paste is slightly less dense. Thus the difference can be due to higher w/c in the concrete from 1910, which has not been compensated for by the prolonged hydration. 4.2.3 Submerged bridge columns To get further examples of old concrete in water we have examined submerged columns from old bridges in the fresh water lake Mälaren. The material was kindly put to our disposal by AB Stockholm Konsult avdelning för Brounderhåll-Materialprovning. From them we got thin-sections of concrete that was sampled 50�100 cm below the water level. It is the same water as in the Norsborg basins. The water in the Norsborg basins, however, comes from deep parts and thus presumably contains less oxygen and carbon dioxide. All the bridges were cast with pure Portland cement. Details of the analysis are in Appendix 2. The leaching pattern in these bridge columns is similar to the basins at Norsborg but there are some significant differences. In most of the samples erosion has removed part of the altered crust. The carbonation depth is deeper and covers the porous zone. In most cases the carbonation front coincides with that of the ettringite disappearance. Moreover the carbonation front is not as distinct but has a more patchy and speckled appearance. It seems like the carbonation has altered some remaining CH crystals in situ. This would mean that the carbonation front at some time was ahead of the leaching front. The difference may be that the water at Norsborg comes from cold deep water, while the columns stand in running surface water with higher bicarbonate and carbon dioxide content. Moreover, some of the concrete samples show signs of percolation; it is possible to observe deeper zones of speckled carbonation and leaching. This could be due to capillary suction due to drying above the splash zone and /or thermal convection, as there is a thermal gradient between air and water. This shows that the environment and concrete quality must both be considered when evaluating leaching depth. In most of the samples the outermost surface is lost. This is presumably due to the erosion force of the running water and gravitational forces on the vertical surfaces. The disappearance of the protective skin will enhance the leaching rate and thus the leaching depth will be somewhat larger than with a preserved skin. The leaching depth and development of the zonal leaching pattern scatters, presumably due to different concrete quality and environmental conditions. The leaching depth varies from 5 too more than 20 mm. If we disregard the samples with high w/c ratio and those of bad quality, the leaching depth is less than 10 mm. If we also disregard those with distinctly eroded surface, the leaching depth will be between 5 and 8 mm. Therefore we can assume that a good quality concrete without erosion in this water will leach to a depth of around 5�6 mm by diffusion controlled leaching over a period of 30�40 years. This is fairly similar to that of the Norsborg basins considering the accelerating effect of erosion.

30
4.3 Long term leaching rate The data from Rombén combined with that from Norsborg gives a rough estimate of what can be expected from long-term leaching of a normal good quality concrete. This is shown in Figure 8 where the time scale is logarithmic, as leaching speed normally diminishes with the square root of time. This gives a depth of leaching from 4 to 10 mm over a period of 100 years. The depth of leaching is based on normal concrete made of pure ordinary Portland cement, where the C-S-H is in equilibrium with CH. The mortar concrete in the water tank, which has been leached for 90-years /Trägårdh and Lagerblad, 1998/, gives a similar value (5�8 mm in 85 years) although the leaching is not purely diffusion controlled. This leaching rate presumes a protective stable alteration shell and shallow meteoric groundwater. In a thousand years this would give a leaching depth of 8 to 20 mm. This is considerably less than the calculations of Adenot /1992/ gives (see page 17, 27, 46).
0
1
2
3
4
5
6
7
8
9
10
1 10 100
Period of leaching in years (log scale)
Dep
th o
f alte
ratio
n in
mm
1944
19601927
1916
1910
Rombén
W-tank
Figure 8. Depth of leaching versus time for the different Norsborg concretes. The 10-year data from Rombén and the water tank /Trägårdh and Lagerblad, 1998/ is also included.
31
5 Controls of leaching rate 5.1 Ion transport and diffusion in concrete. A theoretical approach to the transport of ions in cement based materials is given by Marchand et al /1998/. Diffusion is mass-transport down a concentration gradient. Steady state diffusion follows Fick´s first law:
dxdcDJ −=
Where J is the net transport rate of dissolved species through a unit area and (dc/dx) is the concentration gradient. In the non-steady state, where concentration changes both in space and time, we can apply Fick´s second law:
In the case of concrete leaching we must consider several things. When concrete is altered the alteration zone will increase in thickness with time and the concentration gradient will develop in this gradually growing zone. In stagnant, or slowly percolating water, outside the concrete structure, we must also add diffusion through a near stagnant liquid film /Bird et al, 1960/ because this is controlling the boundary conditions at the concrete surface. Another difficulty is to find D in the leached shell as it changes its properties over time. Leaching gives a moving boundary in the concrete structure where the thickness and properties of the shell rules the speed of alteration (This is the mechanism that gives the square root of time dependence). Another difficulty is the source terms for the leaching at the interface between altered and unaltered concrete. Diffusion controlled dissolution of concrete and cement paste has been treated in several papers. One of the latest more comprehensive descriptions of long-term behaviour of cement paste during leaching is given by Faucon et al /1998a/. In leaching experiments one typically gets a profile with portlandite dissolution at the front and a progressive decalcification of gel towards the surface. Thus in the cement system one must introduce a dissolution term due to degraded cement paste. In the pure calcium silicate system Fick´s second law /Faucon et al, 1998a/ including a dissolution term becomes:
Where [Ca] is calcium concentration of the interstitial fluid, Ø is the porosity of the dissolution zone, t is time, D is the diffusion coefficient for calcium in solution in the dissolution zone, n is the order of dissolution reaction and a is a reaction constant. The concentration of calcium decreases from [Caeq] at the leaching front to 0 at the surface.
2
2
x
cDtc
∂
∂=
∂∂
[ ] [ ] [ ] [ ]( )neq CaCaaxCaD
tCa
−−∂
∂=
∂∂
φ2
2

32
The difficulty is to estimate a and n. At the dissolution front it is easy as Ca2+ is formed by the dissolution of CH but it becomes more difficult with the C-S-H as this phase dissolves incongruently and is kinetically controlled by its complex structure. One must also consider the congruent dissolution of ettringite and reformation of monosulphate. This equation can be used to describe the concentration gradient in the different parts of the shell. The Ca concentration in the leached shell will vary according to the degree of dissolution of the C-S-H. This was the case in the Norsborg samples (Table 2). The diffusion coefficient will, however, also change according to which zone you are in. A model to calculate the dissolution is described in Adenot and Buil /1992/ where they divide it into different zones. The model is based on thermodynamical equilibrium and models the dissolution-precipitation of solid phases. The mathematical calculation, however, does not take into account the effect of the composition of the external water and cement clinker grains the cement paste. It is from such a calculation that Adenot /1992/ calculated a maximum alteration depth of 4 cm in 300 years, which is more than the Norsborg samples give. Thus, to find the speed of alteration in a natural situation, we have to take into account all the reactions including those with the external water and the change of porosity, which depends on the type of concrete. The numerical calculations will be further discussed in Chapter 6.1. 5.2 Porosity changes and diffusion coefficient Diffusion mainly occurs in the open connected capillary pores. The gel pores are much smaller and less important. The porosity of the concrete depends mainly on the water/cement ratio and the degree of hydration. At a water/cement ratio of 0.40 or less and a fully hydrated paste, there will be no capillary pores � only gel pores. With a submerged paste and a w/c ratio of < 0.40 one can expect that, with time, it will be fully hydrated. This is obviously the case with some of the concretes from Norsborg. With a dense paste the dissolution will occur mainly at the leaching front where portlandite is dissolved. With less dense paste there might be some percolation. At Norsborg temperature differences and/or local drying on other sides of the concrete could drive percolation or other water movements. This could in part explain the differences. The consequence would be a faster alteration rate than pure concentration controlled diffusion. The first effect of leaching is that the portlandite is dissolved. The C-S-H gel is physically intact but the chemical analysis indicates that the Ca/Si ratio starts to drop. This means that there must be some loosely bound Ca ions that can be lost without changing the structure of the gel. Presumably the gel porosity increases somewhat but it will be of minor importance compared to the more important capillary porosity. The removal of the portlandite will, however, form a new type of coarse porosity with the dimension of former portlandite crystals. Bentz and Garboczi /1992/ have modelled the effect of portlandite dissolution and the model is used in van Eijk and Brouwers /1997, 1998/.

33
The porosity can be divided into three parts, the gel porosity, the original porosity and the porosity formed by removing portlandite. The total porosity in leached concrete consists of both initial (inherited) porosity and a porosity fraction originating from the CH fraction that was present before leaching. The initial porosity, which depends on the concrete quality and degree of hydration, must thus be considered. High quality concrete will therefore have a lower porosity after leaching of CH. Bentz and Garboczi /1992/ estimated the capillary space to become continuous at a critical porosity of around 18 vol.%. The C-S-H gel becomes continuous at a critical porosity of around 17�20 vol.% and depleted CH porosity becomes continuous above about 12�15%. Based on these assumptions Bentz and Garboczi /1992/ calculated the effect of the porosity on the ion diffusivity in cement paste and formulated a relative diffusion coefficient. D/Do = 0.001 + 0.07 ϕ2 � H(ϕ-ϕc). 1.8 (ϕ -ϕc)2 Where H(ϕ-ϕc) = 0 for ϕ < ϕc and H(ϕ-ϕc) = 1 for ϕ > ϕc, and ϕc = 0.18 D/Do = relative diffusivity (Do diffusivity in pure water = 0.8 x 10⁻⁹ m2/s) ϕ = water porosity in paste ϕc = percolation threshold Below a certain porosity value, the percolation threshold, the pores are not connected and there will be no diffusion. This is the case with good quality well-hydrated concrete as those in Norsborg. Above this value, which is ruled by the water/cement ratio and the degree of hydration, the ions can move in a connected capillary pore system and the diffusivity can be described by the formula above. Leaching of portlandite will add to the original porosity. Unfortunately the equation does not hold during leaching because the diffusivity increases much more rapidly during leaching compared to decrease due to hydration. The CH porosity is much coarser. Thus a new equation was considered by Snyder and Clifton /1995/ considering diffusion after leaching where ϕc = 0.16 instead of the original 0.18. If these two values for unleached and leached concrete are used a new relative diffusion can be calculated /van Eijk and Brouwers, 1998/. D/Do (relative diffusivity) = 2 D/Do (relative diffusivity due to leaching) � D/Do (initial diffusivity) If the different equations are put together /van Eijk and Brouwers, 1998/ we will get D/Do = 0.025-0.07 ϕ i
2 � H(ϕi -0.18) 1.8 (ϕi �0.18)2 + 0.14 ϕ l 2 � H(ϕl -0.16) 3.6 (ϕl �
0.16)2 Where ϕi is the initial porosity and ϕl is the porosity after leaching The leached shell is assumed to consist of pure C-S-H with no CH left. Thus a cut-off value of 0.0025 is used, which is the relative diffusion coefficient for the C-S-H phase.

34
The relationships described above only hold for a normal paste where the amount of portlandite is known. It must also be corrected for the inward diffusion of sulphate ions and the formation of new ettringite, which appears in the portlandite depletion zone. In this reaction one mole of monosulphate will give one moll of ettringite. The calcium ion will be from CH and thus reduce the amount of depleted CH. C3A x CaSO4 x
12H2O + 2CaSO4 + 20H2O ⇒ C3A x 3CaSO4 x 32H2O
Monosulphate Ettringite Mole wt. 1282 g 2311 Density 2.01 g/cm3 1.78 Mole vol. 637 cm3 1298 The ingress of sulphate ions and water will generate an ettringite that is double in size compared to that of monosulphate. If we assume that most Al in the unaltered concrete is bound to monosulphate (Table 1), the ettringite formation will partly compensate for the dissolution of portlandite and result in a smaller increase of porosity. This effect, noticed in the analysed samples, is not considered in the calculations above but will lower the effective diffusion. The calculations of porosity and diffusion above only hold for the innermost alteration zone before the C-S-H collapses. The effect of the C-S-H alteration is more difficult to calculate because it is a gel and we do not know the exact volume decrease as in the case of crystalline portlandite. In SEM or thin-section the samples are dried and we do not know volume of the fully saturated phases. We can, however, assume that the volume is greater in the saturated than in the dry stage. Thus in the first part of zone 5 we can assume the same or only a slightly larger porosity than in zone 6. Later in zone 4 and 3 the porosity is significantly higher but on the other hand the concentration gradient is less. Presumably zone 5, before the C-S-H collapses, and zone 1 are rate limiting for the speed of diffusion. Carbonate ions will bind Ca ions in the surface layer. The formation of calcite will presumably reduce the increase of porosity and thus reduce the leaching rate. The porosity of the leached concrete from the water tank /Trägårdh and Lagerblad, 1998/ was measured by image analysis in SEM on polished surfaces in order to find out the change in capillary porosity. Only pores with a size smaller than 30 microns were measured. Empty hollows with diameters in the range of 1�30 microns gave around 9% of the porosity in the altered zone and around 3% in the unaltered zone. This is a fairly low value for the extra porosity in the leached zone. With a pure Portland cement the depletion of portlandite should give an extra porosity of around 14% as this is the relative volume of portlandite in the paste (Table 1), but we must consider that much of the porosity of the leached zone consists of large patches or that leaching occurs in zones that are not considered. The porosity of the samples from Norsborg, where the leaching pattern is more regular, is still not measured.

35
5.3 Chemical constraints on ion mobility Ions can move in solids but very slow. Therefore, diffusion in concrete occurs mainly in the water phase. The leaching is basically an acid/base reaction where the basic pore solution is neutralised by the more acid water. The hydroxide ions and especially the protons can move easily relative to all other ions. Leaching mainly leads to decalcification. The diffusion, however, requires electroneutrality. As calcium ions move slower than protons the calcium ions will govern the dissolution rate and rate of alteration. A consequence of this is that the pH of the ground water is of minor importance as long as it does not dissolve silica or other restite products. Another consequence of electroneutrality is that pH and Ca-content of the pore solution are linked to each other. At a pH below 4 aluminiumhydroxides becomes soluble and the result will be a pronounced increase in dissolution rate and penetration depth. However, this is not leaching but an acid attack. The outward movement of hydroxide ions will be counter-balanced by an inward movement of anions from the external water. These anions may be chloride, carbonate or sulphate. The carbonate or bicarbonate ions will precipitate as calcite while the sulphate ions (when pH the is above 10.5) will react with aluminates and form ettringite. The chloride ions can sorb on the surfaces or form Friedel´s salt but most of it will remain in the pore solution and penetrate deeper into the concrete. It has been demonstrated in batch leaching experiments /Engqvist et al, 1996/ and other experiments /Gegout et al, 1992/ that a high content of chloride increases the speed of dissolution of cement paste. This must also, to some extent, have accelerated Rombén´s /1978/ experiments because weak hydrochloric acid was used as leachant. Ions will also be subjected to electrical forces and viscous drag force exerted by their environment. The electrical forces will both come from ion-ion interaction, ion-solvent interaction and from interaction with the internal surfaces in the capillary system. The cement hydrates (C-S-H) and the walls of the capillary system are normally negatively charged and covered by a layer of loosely bound but oriented water molecules. The amount of free water is therefore less than the capillary space and the concentration of positively charged Ca ions is higher at the (negatively charged) pore walls than in the free water. Dense concrete has very narrow capillary pores which makes this effect very pronounced. Moreover, in dense concrete one can assume that most of the ionic transport will occur in loosely bound surface water. Therefore, the diffusivity of Ca-ions in degraded concrete will not be the same as in pure water. In a young paste the pore solution is dominated by alkali ions. The alkalis suppress the solubility of the calcium hydroxide /Brown, 1990/. The content of alkali ions in the pore solution of young unleached concrete is several hundred times higher than that of calcium. During the first period of leaching the cement paste will mainly lose alkalis while the proton ingress will result in a lower pH. This will not cause any material changes. The bulk content of alkalis in the cement paste is, however, fairly low and they will only be of importance during the first period of leaching. On the other hand it will have implications on dissolution rates taken from short-term experiments. Later, when pH has decreased, the Ca contents of the pore solution will rise and the main paste decomposition will start. The pore solution will also contain some sulphate. These ions will take part in aluminate/ferrite reaction and must be considered in this context.

36
Intact paste Alteration zone Natural water Figure 9. Ion movement through and precipitation in cement paste. The diffusion requires electroneutrality at all points. Thus the diagram is split into two parts. Sulphate and carbonate ions in normal amounts precipitate as minerals before they can reach intact concrete. Magnesium in high concentration precipitates as brucite, except for a small amount that gets absorbed by silica gel and C-S-H gel. Diffusion of Al ions only occurs at low pH. 5.4 Effect of pozzolanas on leaching rate Other rate regulating parameters are solubility and kinetics of dissolution of the different compounds. The most soluble compound is calcium hydroxide (portlandite), which controls the solubility of the C-S-H. The C-S-H will remain stable as long as the pore solution is controlled by the buffering effect of calcium hydroxide. In the diffusion controlled leaching the pore water turnover is so slow that one can assume that the pore water is saturated and buffered by calcium hydroxide as long as this mineral remains. This indicates that there was percolation in the water tank mortar. In concretes with pozzolanas the amount of calcium hydroxide is diminished and the Ca/Si ratio of the C-S-H lower. This will alter the leaching rate in two ways. The lower amount of easily soluble CH reduces the buffer capacity and will thus lead to a deeper penetration depth. The alteration product will, however, be denser as the Ca loss is less. Moreover, the porosity increase due to dissolved CH will be less /van Eijk and Brouwers, 1997; Carde and François, 1999/. With enough pozzolanas the Ca/Si ratio of the C-S-H will be lower, which makes it less leachable and the volume decrease will be less. The increase in strength was shown by Carde and François /1999/. Delagrave et al /1995, 1997/ made calculations of alteration depth and diffusion experiments with two qualities of concrete, with and without silica fume. The leaching depth after three and six months in deionized water was distinctly less if either the w/c ratio was low or the sample contained silica fume. The increased depth of alteration and improved stability of the alteration shell was shown in acid tests of different concretes by Lagerblad /2000/.
CH, AFm, AFt,C-S-H
Na+ K+
Ca2+
OH-
C-S-H SHAFm AFt Al Brucite AFt Calcite
H+ Mg2+ Al3+ (when pH < 4) SO4
2- Cl-
HCO3-, CO32-

37
The lost amount of Ca ions will, however, presumably be less. These experiments lasted only a few years and we don�t know if a steady state was achieved. In the long run one would expect a slower rate due to less porosity increase and a more physically stable alteration zone. 5.5 Development of the alteration zone and its effect on leaching rate The leaching rate is highly dependent on the stability of restite product and precipitates at the surface. The growing thickness of the alteration zone gives leaching a square root dependence on time. Removal of the altered shell will considerably increase the dissolution rate. Components in natural water will react with the surface. In contact with concrete the pH will rise at the surface which may cause precipitation. A well-known phenomenon is precipitation of carbonates. Calcite has a lower solubility at high pH and will therefore precipitate at the surface, at least during the first stages when the pH at the surface will be close to that given by dissolving portlandite (12.4). Later when the alteration shell develops the pH at the surface will drop and so will the precipitation of calcite. In the alteration shell the pH will decline towards the surface. The changes in pH will result in material transport, and control the solubility at the surface. Within the shell silica has its highest solubility at a high pH but is stabilised by Ca in C-S-H. It will however, be more soluble at pH 11 and low Ca concentrations than at pH 7. Thus the dissolved silica will move towards the surface of the concrete where it will precipitate and densify the crust. Like silica, aluminium hydroxide is more soluble at higher pH. Thus, the Al released from breakdown of ettringite (at pH < 10.5) will move towards the surface while the sulphates will move inwards and form new ettringite at the expense of monosulphate. The mobility of silica and aluminium is presumably the cause of the formation of the high-porosity zone (3) in the Norsborg and the other analysed samples. At the surface the main components are restite products in the form of silica gel and hydroxides from Fe and Al. These products have very low solubility in neutral water. Some of the aluminium is bound to the silica gel, which it presumably stabilises by bridging silicon units. However, we must also consider all the other ions that can be found in natural water. Natural water will contain ions of alkalis, calcium, iron, magnesium, manganese, bicarbonate, chlorine, sulphate and dissolved gases of carbon dioxide and oxygen. It also often contains small colloidal particles and organic matter. Which component and in what concentration depends on the situation and type of water. To be able to calculate the alteration rate we must know how these ions can diffuse or react with components in the different parts of the alteration shell. Magnesium can either be incorporated in the silica gel or precipitate as magnesium hydroxide. In the Norsborg samples Mg has been incorporated in the silica gel where it presumably (like aluminium) bridges silicon units. Iron and manganese may precipitate at the surface or become incorporated in the calcite.

38
The solubility of different important pure hydroxides is shown in Figure 10. From this diagram we can see that the all the relevant components have a low solubility at pH 7 but that the solubility of Al- and Fe-hydroxides increases rapidly with decreasing pH. Thus a lower pH will destroy the protective layer. Reducing conditions may remove the iron in the form of relatively soluble Fe(II) ions. Silica remains fairly insoluble at all pH-values below 10. In this diagram (Figure 10) we can also see that Mg precipitates in the concrete surface layer because the solubility is very low at high pH. Aluminate, silicate and Fe(III) ions will move from the paste towards the surface as their solubility decreases with pH (in the region high pH to neutral). In this context the bicarbonate content of the water is important, as it will precipitate calcite. It is also important to know if the water contains Mg-ions because they will precipitate at a high pH even if the Mg-content of the water is low (4 mg/l in Norsborg). In the diagram we only have pure hydroxides. However if, like in Norsborg, Mg is incorporated in silica gel this may change the solubility. With a higher content of Mg in the water pure brucite probably precipitates. Common anions like chloride and sulphate may also change the conditions. High contents of chloride may increase the solubility of some of the phases and sulphate ions in high concentrations may precipitate as gypsum, which can give an expansion that destroys the concrete. Also, inside the concrete in the alteration zone some of the ions from the water may influence the leach rate. As mentioned earlier chloride increases the solubility of the CH and probably also the C-S-H. Sulphate may destroy the concrete by reacting with the aluminates of the paste. This, however, demands cement with high C3A content and a fairly large concentration of sulphate ions.
2 3 4 5 6 7 8 9 10 11 12 13 pH
log
mol
e / l
itre
BruciteMg(OH)2 C-S-HGibbsite
Al(OH)3
KaolinAl2Si2O5(OH)4
IronhydroxideFe(OH)3 AFt
AFmCH
MgSi
Al
Fe
Soluble
Insoluble
Surfacelayer
Degradedpaste
Intactpaste
-10
-2
-4
-6
-8
Figure 10. Solubility of pure hydroxides.

39
The solubility of C-S-H and its breakdown reactions are important. In normal water it dissolves, but to understand the dissolution mechanism and speed, one must consider the structure of it and the kinetics. The C-S-H is stabilised by CH and does not break down until CH is removed. We also know that with a small amount of CH (concrete with pozzolanas) the alteration depth initially becomes deeper and that, in this case, the leaching will be controlled by the kinetics and stability of C-S-H. With large amounts of pozzolanas the leaching will only be controlled by the stability of C-S-H. The dissolution of C-S-H follows the equilibrium reactions outlined in Chapter 3.2. Rahman et al /1999/ has made a model for the C-S-H dissolution. The available information indicates that C-S-H has a short-range structure of calcium silicate sheets in solid solution with CaO. In the Norsborg samples we can observe that the C-S-H keeps its volume until the CaO/SiO2 ratio has dropped to around 1. This indicates that there is a certain amount of fairly loosely bound CaO that can be removed without destroying the basic structure. To find out the effect of the different ions and the alteration of the C-S-H and the silica gel a NMR analysis of leached concrete from the Norsborg basin cast 1944 was performed by ESPCI in Paris. Figure 11 a and b show both 29Si and 27Al NMR spectra from bulk concrete, altered concrete at the surface and leached concrete at the surface. The spectra show that there is no major difference between the bulk concrete and the altered concrete of mainly zone 4, 5 and 6. Neither of them contains any significant amount of remaining cement clinker grains. This is also found in the microscopical analysis. The leached concrete from zone 1�4, however, has no Q1 peak but only Q2 and a diffuse Q3. This shows that the leaching is linked to a significant polymerisation presumably in the outermost layer of �silica gel�. The Al spectrum shows that there is a lack of ettringite as shown by the microscopical analysis. There is, however, an indication of an increased amount of tetrahedral bound Al. This is presumably tetrahedrally coordinated Al in the leached zone with low Ca/Si ratio of the gel as suggested by Faucon et al /1999/. The phenomena are presumably due to the fact that when the large Ca ions are removed it becomes easier to form silicon chains. The aluminates probably bind tetrahedrally while the Mg-ions bind octahedrally. Therefore, larger amounts of Al and Mg are favourable for the alteration shell, as they both stabilise the silica gel and prevent some of the shrinkage that otherwise would have occurred. In fact the outermost shell in the Norsborg samples, which contains relatively large amounts of both silica and aluminium, is within the stability field of some clays like pyrophyllite (Al2(Si4O10)(OH)2) or talk (Mg3(Si4O10)(OH)2) or, in a Si/Al/Mg mix like in the smectite clay, saponite. In the clay minerals the Mg is sited in octahedral sites in brucite structure layer between silica/aluminium sheets or chains. One can assume that the replacement of Ca by Mg over time will facilitate clay formation and stabilise the alteration product. With high contents of Mg ions, pure brucite will replace portlandite.

40
Figure 11a. 29Si NMR spectra of 1944 concrete. Degraded and bulk samples. Analyses by ESPCI-Lab. de Physique Thermique in Paris.
Figure 11b. 29Si NMR and 27Al NMR spectra of 1944 concrete. Degraded and bulk samples. Analyses by ESPCI-Lab. de Physique Thermique in Paris.
-160-150-140-130-120-110-100-90-80-70-60-50-40(ppm)
Bulk zone
Altered zone
Leached zone
Q0 species
C-S-H
Q1 Q
2
Spinning
side band
Q3
-140-120-100-80-60-40-20020406080100120140(ppm)
Bulk
Altered
Leached
Octahedral Al :hydrogarnet,
Afm, ettringite
Tetrahedral Al
incorporated in
aggregates
Tetrahedral Al
incorporated in
C-S-H Spinning
side bands

41
5.6 Effect of aggregates on leaching rate Mass concrete is dominated by aggregates. Porous aggregates will increase the diffusivity but normally the aggregates are made up of solid rocks or minerals. If we assume that the paste is homogeneous and that all diffusion occurs in this homogeneous paste, the ratio of cement paste to aggregate will be irrelevant for the depth of alteration. More paste will only increase the amount of leached material not the depth of alteration. This is because, as described by Fick´s law, the transport of matter depends on the flux crossing an area. Thus the depth of alteration will be the same but the amount of released Ca ions will be larger with a higher content of cement in the concrete. We could also observe in the Norsborg samples that the amount of cement did not influence the depth of alteration. The aggregates will, at least in theory diminish the alteration depth, as the tortuosity will increase. However, in reality, the paste is inhomogeneous. There will always be an interfacial zone between the aggregates and paste that is more porous than the bulk of the paste. Thus the aggregates will increase the coarse porosity, and the interfacial zone can act as a transport zone. The interfacial transition zone (ITZ) is, however, thinner in concrete with a low w/c and in concrete containing silica fume /Lagerblad and Kjellsen, 1999/. In young concrete one can also assume irregularities in the paste. This will, however, mostly disappear with time due to prolonged hydration. Marchand and Delagrave /1999/ have treated the effect of ITZ on ion diffusion and leaching. They came to the conclusion that although the diffusivity would increase, this is compensated for by the increased tortuosity. Moreover, the prolonged hydration linked to leaching will diminish the ITZ. In the Norsborg samples the IT around the aggregates is filled with compact portlandite, presumably precipitated in a formerly more porous zone. The Norsborg samples show that leaching in the interfacial zones is somewhat but not significantly deeper. Thus, in reality, the influence of ITZ is probably negligible when leaching is diffusion controlled. The physical effects of the aggregates must, however, also be considered. The aggregate grains will build up a framework, which physically stabilises the alteration shell and hinders shrinkage. This in turn will affect the erosion and thus the speed of leaching. 5.7 Effect of water/cement ratio and degree of hydration
on leaching rate The structure of a concrete and cement paste is time dependent and related to the degree of hydration. The hydration of cement occurs rapidly in the beginning but it will take a long time before hydration is complete. This is due to the fact that the cement grain is protected from hydration by its own hydration products. With a cement/water ratio of below 0.4 there is not enough water to hydrate all of the cement and, therefore, some cement will always remain. This is well demonstrated by the samples from Norsborg. A dense paste of C-S-H protects the remaining cement. Due to the prolonged hydration some cement pastes are almost totally dense.
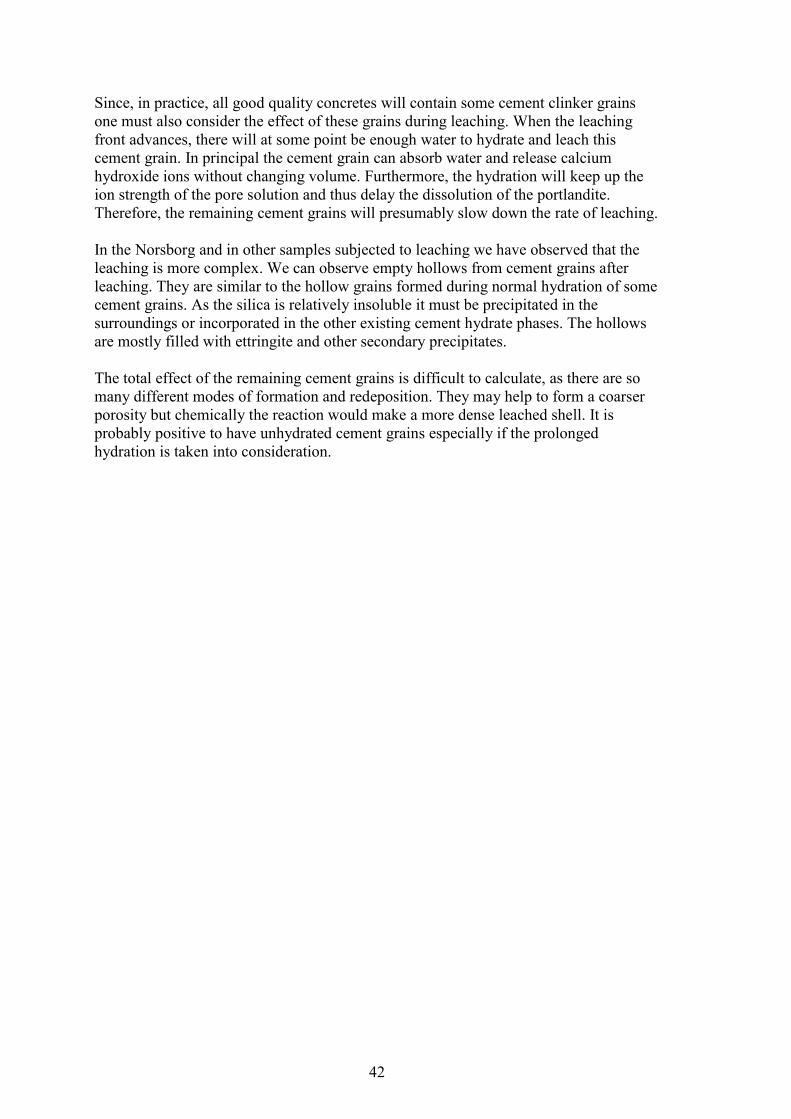
42
Since, in practice, all good quality concretes will contain some cement clinker grains one must also consider the effect of these grains during leaching. When the leaching front advances, there will at some point be enough water to hydrate and leach this cement grain. In principal the cement grain can absorb water and release calcium hydroxide ions without changing volume. Furthermore, the hydration will keep up the ion strength of the pore solution and thus delay the dissolution of the portlandite. Therefore, the remaining cement grains will presumably slow down the rate of leaching. In the Norsborg and in other samples subjected to leaching we have observed that the leaching is more complex. We can observe empty hollows from cement grains after leaching. They are similar to the hollow grains formed during normal hydration of some cement grains. As the silica is relatively insoluble it must be precipitated in the surroundings or incorporated in the other existing cement hydrate phases. The hollows are mostly filled with ettringite and other secondary precipitates. The total effect of the remaining cement grains is difficult to calculate, as there are so many different modes of formation and redeposition. They may help to form a coarser porosity but chemically the reaction would make a more dense leached shell. It is probably positive to have unhydrated cement grains especially if the prolonged hydration is taken into consideration.

43
6 Models for determining the rate of leaching In the simple case a stable alteration shell and moving boundaries we assume diffusion controlled leaching. If surface dissolution is neglected the thickness of the leached zone (e) can be calculated as /Faucon et al, 1997, 1998b/ follows:
tappDe = (1)
where Dapp is a constant with the same unit as a coefficient of diffusion. If we assume a unidirectional diffusion process Dapp can be replaced with a constant a.
tae ×= (2) This gives a square root of time dependence. With the Norsborg samples a will be between 0.4 and 0.9 (mm/year½) and gives a basic idea about the rate of alteration of concrete in water. The speed of progression (v) of the diffusion front will be:
t
Ddtdev app
2/ == (3)
The speed of progression will change over time. Initially, at the start, the mechanism will be dissolution of paste in contact with water. However, the importance of the pure dissolution term will diminish with time and diffusion will control the long-term rate. This rate of degradation is normally ruled by the Ca-ion diffusion but in some cases we must also consider the dissolution and solubility of other elements. To be able to fully understand and also consider variations and other factors we must split it up in ruling factors such as: A. Pore solution concentration gradient in the different parts of the alteration zone. B. Composition of the water. C. Component stability in the leached shell. D. Porosity of the leached shell. The type of concrete and the concrete composition controls many of these factors.

44
6.1 Basic formulas Basically, leaching of concrete is a decalcification process driven by concentration gradients between the intact concrete and the water. In the simple case with ordinary concrete, leaching is mainly controlled by the calcium content of the pore solution which itself is controlled by portlandite dissolution and the chemistry of the external water. Leaching of a component in cement paste can be calculated according to the shrinking core model. In the normal case the shrinking core model is used to calculate leaching of a contaminant but it can also be used to calculate the amount of leached Ca. If we assume only the dissolution of portlandite and the instantaneous release of leachate from the inner surface of concrete to fresh water, the following equation can be used according to Höglund and Bengtsson /1991/:
0
2q
tcDX se= (4)
X is penetration depth (according to shrinking core model), De is the effective diffusivity in leached concrete, cs the solubility of portlandite, t the time, qo the initial amount of portlandite in the cement paste (volume cement paste). This is a very simplified model and does not consider all of the other components (like C-S-H) of the cement paste and material alterations that give the zonal pattern of the leached shell. Following the shrinking core model the cumulative amount leached per unit area can be calculated as follows according to van Eijk and Brouwers /1997/ and references in the article:
tCfCDtM Hmoe ×=β
2202
)( (5)
Where M(t) is the cumulative amount of leached contaminant per unit exposed area (mol/m2), De the effective diffusion coefficient (m2/s), C0 the initial metal concentration in sample (mol/m3), Fmo the mobile fraction of metal (mol/m3), CH the proton concentration in leachant (mol/m3), β the acid neutralisation potential (mol/m3), t the time (s). As can be seen the release rate depends both on the effective diffusion coefficient (in this case for Ca) in the leached shell and the acid buffering capacity of the cement paste. In their calculation they also consider the effect of the solubility of C-S-H and the increase in porosity caused by its disappearance.
45
C0 will be the sum of all the components containing Ca which is the same as the amount of Ca in the cement. Fmo will be 100%. β will be 2 x the Ca content if all of the calcium is leached out which is not true. CH will depend on the water composition. Calculations of alteration rate made from equation (5) will give more accurate values than equation (4) but we still have the problem of the different solubility of C-S-H and CH and the effect of the increasing porosity when these two phases are leached. The sluggish solubility of C-S-H and its effect on porosity is especially difficult to calculate. As can be seen from the equation the release rate depends both on the effective diffusion coefficient of the contaminant ion and the acid buffering capacity of the cement. The buffering capacity is directly related to the amount of free calcium in the cement. The problem of the shrinking core model is that it is formulated for a contaminant and does not consider the time dependant material alteration. Dissolution in the degraded zone occurs when the concentration of calcium in the interstitial solution is less than the calcium solubility in each zone in the alteration shell. At the dissolution front it will be controlled by the portlandite dissolution while it will be subsequently controlled by the incongruent dissolution of C-S-H. This will give a concentration profile with decreasing contents of Ca ions outwards from the front. Taking this into account diffusion according to Fick´s second law / Faucon et al, 1998b/ in each zone becomes:
[ ] [ ] [ ] [ ]( )neq CaCaaxCaD
tCa
−Φ
−∂
∂=
∂∂
2
2 (6)
[Ca] is the concentration of calcium in the interstitial fluid, Ф the porosity of the dissolution zone, n the order of dissolution reactions, a the reaction constant. Adenot /1992/ and Adenot and Buil /1992/ divided the leached shell in different zones limited by the disappearance of a phase. Each solid phase is associated with a local chemical equilibrium. Within a zone (j) the equations of mass conservation of a component (i) (if we only consider transport by diffusion) can be written:
ts
x
CDij
tC i
j
ii∂∂
−∂
∂=
∂∂
Φ
12
2 (7)
where Ci is the concentration in the aqueous phase of Ai species, Dij its diffusion coefficient in zone j, Si its concentration in the solid state expressed in moles per unit of total volume (solid + liquid) and Φj the porosity in zone j.

46
Zone k Undamaged Concrete (n solid phases)
Zone k-1 Zone j Zone 2 Zone 1 Aggressive water
lk-1 lk-2 lj lj-1 l2 l1 l0 Figure 12. The zoning of the altered part of cement consisting of an assemblage of multi-mineral domains separated by boundaries. From Adenot and Buil /1992/. The conservation of mass of n components at interface j is expressed as
dtdl
lSlSlx
CDl
xC
D jjijjj
iijjj
iijj ))()(()()( ,11,
+−+
++
−−=
∂∂
Φ−∂
∂Φ (8)
where ++−−iiii SCSC ,,, are the concentrations right and left of the j boundary.
The equations with partial derivatives are converted into ordinary differential equations by a change of variable x,t
txtx =→ η),( to
ηη
ηηη
ddS
d
CdD
ddC i
j
iji
iΦ
+=−22 2
2
The boundary equations are expressed as a function of η
ili CC =)0(
0)(limii CC =
∞→η
η
The solution of the problem amounts to the solution of the system of equations consisting of • transport and chemical equilibrium equations between the solid phases and the
solution at each front, • chemical equilibrium equations between the solid phases and the solution at each
boundary. Delagrave et al /1997/ and Gérard and Le Bellégo /1999/ have done numerical simulations of cement paste in pure water based on this method. Compared to the natural analogues their calculations give a somewhat too high value. Presumably, the effects of natural water and carbonation must be considered in the calculations which makes it much more complex.

47
The alteration shell must be treated as a continuum where material and pore fluid composition varies continuously through space. A model can be based on a finite volume of fluid, which characterises an alteration point. Numerical models for the calculation of reactive transport in porous media is used in geochemistry /Lichtner et al, 1996/. Similar numerical finite element analysis can presumably also be used as regard leaching of concrete if the governing parameters are found. 6.2 Effect of type of cement, silica fume and w/c ratio
on diffusion rate In the different models the amount of portlandite is important as it buffers the pore solution. Furthermore, the removal of portlandite controls the porosity/diffusivity. The amount of portlandite depends on the type of cement, more strictly the relative amount of C2S/C3S, where larger amounts of C2S give less CH and more C-S-H. This can be further adjusted by the addition of pozzolanas, which increase the amount of C-S-H at the expense of CH. If there are no portlandites the porosity will not increase until the C-S-H collapses. Moreover the Ca/Si ratio of the C-S-H and the contents of Ca in the pore solution will be lower. Thus the concentration gradient and the leaching rate will be less. The effect of the silica fume on the dissolution rate was calculated by Eijk and Brouwers /1998/ and shown by Matte and Moranville /1999/. Examples of the effect of the w/c ratio and silica fume were shown in Gérard and Le Bellégo /1999/. Here we can see the positive effect of the low w/c ratio and silica fume. In all of these experiments the leaching rate (equation 2) is higher than in the Norsborg samples where a is between 0.4 and 1.0, which shows that the short term experiments in pure water give a too pessimistic value. Table 3. Examples of calcium leaching kinetics for cement pastes. SF = silica fume. a = alteration rate. From Gérard and Le Bellégo /1999/. Reference w/c ).(/ 5.05.0 −= ymmtXa f Adenot /1992/ 0.4 2.3 Delagrave et al /1997/ 0.25
0.25 + 6% SF 0.45 0.45 + 6% SF
1.6 1.0 5.5 3.6
Norsborg (this report) 0.4�0.5 0.4�1.0

48
The amount of leached Ca in the puzzolana concrete is less but the depth of leaching may be higher. In a series of experiments with weak acids we could observe that the alteration front was deeper with pozzolanas and/or granulated blast furnace slag than without /Lagerblad, 2000/. This observation could be due to a faster dissolution of portlandite compared to C-S-H. The amount of portlandite will be less and may therefore disappear to a greater depth. However, this will be a short-term phenomenon. When diffusion becomes more prominent the lower amount of removed portlandite will give a smaller increase in porosity and the alteration rate will slow down. With a lower water cement ratio more unreacted cement grains will remain. These cement grains will hydrate when they are reached by the leaching front. This can be observed in the Norsborg samples. The hydration of these cement grains at the dissolution front will increase the Ca content of the pore solution to above that of the portlandite dissolution. This will increase the Ca diffusivity and the amount of leached Ca ions. In the extreme case this may generate fast leaching if the diffusion is faster than the precipitation of portlandite or binding to other phases. In the normal case, however, the increased content of Ca ions in the pore solution will not significantly affect the leaching depth, as the increased Ca contents will stabilise the other phases. Neither will there be any increase in porosity, as the precipitated C-S-H will fill the same volume as the original cement grain. In the Norsborg samples we can observe that a dense paste, presumably formed by a low w/c ratio, diminishes the dissolution rate but we do not know if this is due to the lower initial porosity or to the remaining cement grains. Presumably both a low w/c ratio and remaining cement grains have a positive effect against leaching. In the w/c 0.25 paste of Delagrave et al /1997/, shown in Table 3, much of the cement must have remained and this probably explains part of the very large difference in leaching rate. The difference is too large to be explained only by the opening of the pore structure by portlandite removal. Presumably remaining clinker grains have to be added to the numerical model as a factor. 6.3 Effect of the composition of the alteration shell The most important parameter seems to be the quality of the concrete but one has also to consider the diffusivity in all other alteration layers. To fully understand the leaching we must consider all the zones and calculate the effect of them individually. This can be done according to the formula originally proposed by Adenot /1992/. The problem is that the porosity changes in the alteration zones. There must, however, be some zones that are rate limiting. We must also consider the water chemistry and the early calcite precipitation. The diffusion in the first zones is mainly related to the initial porosity and that generated by the dissolved portlandite. The diffusivity in this zone can therefore be calculated according the equations outlined in Chapter 5.2. The formation of new ettringite in these zones will, however, diminish the porosity. Further out, towards the water, there will be a collapse of the C-S-H, which will increase the porosity. The diffusion in the collapsed gel will be fast due to the large porosity and, therefore, the thickness of this zone will probably not be rate limiting and only play a secondary role.

49
The outer more dense shell will again slow down the diffusion rate. This layer will grow and become denser with time. It will, like the innermost leached zones, be diffusion limiting. In the Norsborg sample the stability of the altered shell is presumably due to the stabilising effect of the carbonate layers and the aggregates. Without carbonate ions an outer shell of redeposit silica, stabilised by Al, would probably form. The composition and stability of this outermost shell will be influenced by the ground water composition. Mg-ions will, if available, precipitate and stabilise this shell. This will also be the case with bicarbonate ions, which will precipitate the outwards diffusing Ca-ions as calcite. Magnesium and carbonate ions in the water will thus diminish the leaching rate. The large amount of silica and aluminate/ferrite phases in the cement paste will, presumably, stabilise the shell too. The porous layer makes a weak bond and the outermost shell can fall off. In this case the leaching rate will increase. In real concrete one must also consider the aggregates. They will form a skeleton that prevents shrinkage. In this case it depends on where the silica gel accumulates. If it is on the surface of the aggregates they will eventually fall off. If the silica accumulates at the leaching front the aggregates will fall of but the silica gel will be thicker and thus diminish the leaching rate.

51
7 Discussion and conclusions If we want to calculate the leaching of concrete we have to consider both chemical and physical variables. The earlier reasoning in the paper is mainly based on chemical phenomena and presume that all solid materials remain in place. If the leached shell erodes or falls of, the protective layer will successively disappear and the leaching will be ruled by direct dissolution which is a much faster process than diffusion combined with dissolution. 7.1 Chemical processes There are several parameters including water composition, concrete composition and properties of alteration products which rule the leaching rate. The ruling parameters that decide the properties of the unleached cement paste are: • amount and type of binder (cement, pozzolanas, etc), • amount of free water in the pores, • degree of hydration, • homogeneity of the material. The type of binder will give the buffering capacity. Basically the buffering capacity is the amount of Ca in the cement. The relative amount of cement and aggregate in the concrete is principally unimportant as the surface area of cement paste in contact with water controls the leaching rate. The amount of water in the cement paste (w/c) is, however, important as it is related to the porosity of the paste, which in turn controls diffusivity. The porosity will diminish with time as the paste re-equilibrates and remaining cement grains hydrate. Binders with a lower amount of calcium like in pozzolanas cement or cement with blast furnace slag will give a larger leaching rate as regard depth (but not leached Ca) initially but the rate will slow down as there is a less increase in porosity. After initial dissolution and precipitation the leaching will be diffusion controlled. The diffusion rate basically depends on the Ca concentration gradient but chloride, bicarbonate and other ions in the water will influence it. The speed of diffusion is controlled by the properties of the alteration product, mainly the porosity. The porosity is the sum of the original and new porosity, created by the leaching itself.

52
After some time a zonal leaching shell will develop. The composition of this shell is ruled by local equilibrium between the pore solution and the local cement phases. The rate of leaching is, apart from diffusion, also controlled by solubility and kinetics. An important factor is the sluggish and complex C-S-H gel that dissolves incongruently. The increase in porosity is linked to these reactions. Most of them are linked to Ca-depletion, which leads to a stepwise increase in porosity, but there are some processes like inward diffusion of sulphate and ettringite formation, which decrease the porosity in some of the inner zones. Moreover, the C-S-H does not, like crystalline compounds, shrink linear to the amount of lost material. One must consider the structural transformation of C-S-H during leaching and the effect of this on porosity increases. At low w/c the leaching front will also affect remaining cement clinker grains, which presumably slows down the leaching as they can be leached/hydrated without increasing the connective porosity. The chemical reactions between the water and outer shell must be considered, as they are not linked to Ca depletion but to the precipitation of solid phases. High contents of magnesium and/or bicarbonate in the water lead to a more dense outer shell, which will diminish diffusion. Calcium ions in the water will diminish the concentration gradient while chloride ions will increase diffusion as they will increase the solubility of at least the portlandite. Thus the effect of all the ions in the water must be considered. Based on a chemical physical approach considering the chemical reactions and solving different equations governing the transport of ions it is possible to make a numerical model based on finite differences or finite elements. To do this we must, however, know the porosity changes and the kinetics of the dissolution-precipitation of solid phases. The basis of such a calculation is outlined in this paper. A difficulty in the model is how to treat remaining cement clinker grains that react exothermically. Basically, to make a calculation we need 1. Composition of binder. 2. Remaining cement clinker grains. 3. Water/cement or water/binder ratio. 4. Composition of water. Earlier calculations based on experiments have given a too large leaching depth. The old historical concretes show that with ordinary good quality concrete the leaching depth in a hundred years will be less than 10 mm. The observed leaching rate can presumably be used as a basis for numerical calculations over longer time periods. If we assume an intact shell and a unidirectional diffusion (see equation 2) this will give less than 20 mm in a thousand years. With a better concrete quality or with pozzolanas or blast furnace slag cement the leaching rate can probably be diminished. In the repository we presumably have to take the open period in consideration. During this period the concrete surface will carbonate. The carbonated shell will not leach and will thus form a protective layer through which leaching will occur. This will probably slow down the leaching, as the diffusion ions will have a longer path.
53
7.2 Physical processes The leached shell is physically weak. In the Norsborg samples most of it remained but the bridge columns were mostly eroded. This shows that erosion is a factor that must be considered. We can assume that the leached shell becomes thicker with time, which in turn implies that the risk of erosion becomes greater. Calcite precipitation may help to stabilise the surface. In the bridge columns, which are affected by running water, the break is in the porous zone. It is possible that this zone has been lost several times. Every time the outer carbonated shell is lost a new carbonation/silica gel front will be established and a new porous zone will develop. The effect on the leaching rate will depend on how much this zone outer zone diminishes diffusion, as the innermost zones still will remain. With stronger erosion the inner zones will also disappear and the leaching will be dissolution controlled. The amount of erosion will depend on the physical and the material conditions at the surface. It will, among things, depend on whether the surface is on the top, the side or bottom of the concrete detail. At sides and bottom (free) we must assume and consider gravitational forces. The strength of the leached concrete depends on several material factors and it is possible to improve the strength of the altered shell. The aggregates will build up a skeleton that stabilises the leached shell. Thus, the amount of cement is unimportant. The most important is that the cement paste is homogeneous and as dense as possible. Angular or elongated aggregates are probably best, as they will give a better and more stable skeleton. Fibres would reinforce the restite and keep it in place. Pozzolanas or granulated blast furnace slag cement will be better as there will be less calcium to leach out. The restite will be denser and will thus presumably resist erosion better.
55
8 References Adenot F, Buil M, 1992. Modelling of the corrosion of cement paste by deionized water. Cement and Concrete Research, Vol. 22, pp 489-496. Adenot F, 1992. Concrete durability characterisation and modelling of the chemo-physical processes inducing cement degradation. Ph.D. thesis (in French), Université dÓrléans, France, 239 pp. Alexander M G, Arliguie G, Ballivy G, Bentur A, Marchand J, (eds), 1999. Engineering and transport properties of the interfacial transition zone in cementitious materials. RILEM, Report 20, RILEM Publications S.A.R.L. Atkinson A, Hearne J A, Knights C F, 1991. Thermodynamic modelling and aqueous chemistry in the CaO-Al2O3-H2O system, Mat. Res. Soc. Symp. Proc. Vol. 212. Bentz D P, Garboczi E J, 1992. Modelling the leaching of calcium hydroxide from cement paste: effects on the pore space and diffusivity, Materials and Structures, 1992, 523-533. Bird R B, Steward W E, Lightfoot E N, 1960. Transport phenomena. John Wiley & Sons, Inc., 780 pp. Brown P W, 1990. The system Na2O-CaO-H2O, J. Am. Ceram. Soc., Nr. 73, p 3457-3461. Carde C, Escadeillas G, François R, 1995. Use of ammonium nitrate solution to simulate and accelerate the leaching of cement pastes due to deionized water. Mag. of Concr. Res. Vol. 49, Nr 181, 295-301. Carde C, François R, Ollivier J-P, 1997. Microstructural changes and mechanical effects due to the leaching of calcium hydroxide from cement paste. In Mechanism of chemical degradation of cement based systems (ed. Scrivener, K. L., Young, J. F.) E & FN Spon. Carde C, François R, 1999. Modelling the loss of strength and porosity increase due to leaching of cement pastes. Cem. & Concr. Comp., 21, 181-188. Damidot D, Glasser F P, 1992. Thermodynamic investigation on the CaO-Al2O3-CaSO4-H2O system at 50 and 85°C, Cement and Concrete Research. Vol. 22, pp 1179-1191. Damidot D, Atkins M, Kindness A, Glasser F P, 1992. Sulphate attack on concrete, limits of AFt stability domain, Cement and Concrete Research, Vol. 22, pp 229-234. Delagrave A, Gérard B, Marchand J, 1995. Modelling the calcium leaching mechanism. In hydrated cement pastes. In mechanisms of chemical degradation of cement-based systems, Ed Scrivener & Young, E&F Spon, London.

56
Delagrave A, Marchand J, Pigeon M, 1997. Influence of microstructure on the tritiated water diffusivity of mortars, Adv. Cement based materials, 7, 60-65. van Eijk R J, Brouwers H J H, 1997. Study of hydrated Portland cement composition in regard to leaching resistance. Heron, Vol. 22, No 4, 215-229. van Eijk R J, Brouwers H J H, 1998. Study of the relation between hydrated Portland cement and leaching resistance. Cem & Conc Res, vol 28, Nr 6, 815-828. Engkvist I, Albinsson Y, Johansson W, 1996. The long-term stability of cement � Leaching tests. SKB TR 96-09. Faucon P, Adenot F, Jorda M, Cabrillac R, 1997. Behaviour of crystallised phases of Portland cement upon water attack. Materials and Structures, Vol 30, 480-485. Faucon P, Adenot F, Jaquinot J F, Petit J C, Cabrillac R, Jorda M, 1998a. Long-term behaviour of cement pastes used for nuclear waste disposal: Review of physico-chemical mechanisms of water degradation., Cem & Conc Res, vol 28, Nr 6, 847-857. Faucon P, Adenot F, Jaquinot J F, Petit J C, Cabrillac R, Jorda M, 1998b. Deterioration mechanism of cement paste under water attack, in (ed. Gjörv et al) Concrete under severe Conditions 2, environment and loading. Proceedings of the second international conference on concrete under severe conditions. E&FN Spon, London, New York. Faucon P, Petit C, Charpentier T, Jacquinot F, Adenot F, 1999. Silicon substitution for aluminium in calcium silicate hydrates. J. Am. Ceram. Soc., 82 (5) 1307-13012. Gabrilová A, Havlica J, Sahu S, 1991. Stability of calcium sulphoaluminate hydrates in water solutions with different pH. Cem. Concr. Res., 21, 1023-1027. Gegout P, Revertegat E, Moine G, 1992. Action of chloride ions on hydrated cement pastes: influence of the cement type and long time effect of the concentration of chlorides. Cem. Concr. Res., 22, 451-457. Gérard B, Le Bellégo C, 1999. Modelling of the influence of IT on water leaching, In part 4 � Influence of microcracks in ITZ on durability. In Alexander et al. Höglund L O, Bengtsson A, 1991. Some chemical and physical processes related to the long-term performance of the SFR repository, SFR, Prog. Rep., 91-06, Stockholm, Sweden. Jennings H M, 1986. Aqueous solubility relationships for two calcium silicate hydrates. Journ. Of the American Ceramic Soc. Vol 69, Nr 8, 614-618. Kjellsen K-O, Jennings H, Lagerblad B, 1996. Evidence of hollow shells in the microstructure of cement paste. Cement and Concrete Research, Vol 26, No 4, pp. 593-599.

57
Kjellsen K O, Lagerblad B, Jennings H M, 1997. Hollow-shell formation � An important mode in the hydration of Portland cement. Journ. of Matr. Sci., 32, 2921-2927. Lagerblad B, Trägårdh J, 1995. Conceptual model for concrete long time degradation in a deep nuclear waste repository. SKB-TR 95-21. Lagerblad B, 1996. Conceptual model for deterioration of Portland cement concrete in water. SKB-AR 96-01. Lagerblad B, 1999. Texture and chemistry of historic concrete subjected to prolonged hydration, in Proceedings �Workshop on Water in cement paste and concrete-hydration and pore structure, Skagen Denmark October 1999�, Nordic Concrete Research, pp 148-154. Lagerblad B, Kjellsen K O, 1999. Normal and high strength concretes with conventional aggregates, in part 2 Interfacial zone and mechanical properties, in Alexander et al, pp 53-70. Lagerblad B, 2000. Kemiskt angrepp Kap.15 in Betonghandbok, Högpresterande betong-material & utförande (in Swedish), Svensk Byggtjänst. Locher F W, Richartz W, Sprung S, 1976. Erstarren von Zement, Teil 1 Reaction und Gefügeeentwicklung. Zement-Kalk-Gips, Heft 10, pp 435-442. Lichtner P C, Steefel C I, Oelker E H, (eds), 1996. Reactive transport in porous media. Reviews in mineralogy. Vol. 34, Mineralogical Society of America. Maingay M, Tognazzi C, Torrenti J-M, Adenot F, 2000. Modelling of leaching in pure cement paste and mortar. Cem. Concr. Res. 30, 83-90. Marchand J, Gerard B, Delagrave A, 1998. Ion transport in cement based materials. In Materials Science of Concrete V (ed Skalny, J & Mindness, S), The American Ceramic Society, pp 307-401. Marchand J, Delagrave A, 1999. Influence of IT on ionic diffusion. In part 3, Interfacial zone and mechanical properties. In Alexander et al, 157-171. Matsuyama H, Young J F, 2000. Effects of pH on precipitation of quasi-crystalline calcium silicate hydrate in aqueous solutions. Advances in Cement research, 12, No 1. Matte V, Moranville M, 1999. Durability of reactive powder composites: influence of silica fume on leaching properties of very low water/binder pastes. Cement & Concrete Composites, 21, 1-9. Merlino S, Bonaccorsi E, Armbruster T, 1999. Tobermorites, Their real structure and order-disorder (OD) character. American Mineralogist, Vol. 84, 1613-1621.

58
Milodowski A E, Hyslop E K, Pearce J M, Wetton P D, Kemo S J, Longworth E, Hodginson E, Hughes C R, 1998. Mineralogy, petrology and geochemistry, in Ed. Smellie, Maqarin, analogue study, Phase III. pp 135-175, SKB TR 98-04, Vol 1. Odler I, 1998. Hydration, setting and hardening of Portland cement. In Lea´s Chemistry of Cement and Concrete, Ed Hewlett, P. C., 4th ed., Arnolds, London. Pöllman H, Kuzel H-J, Wenda R, 1989. Compounds with ettringite structure, Neues Jahrbuch Miner. Abh, 160, 2, 133-158. Rahman M, Nagasaki S, Tanaka S, 1999. A model for dissolution of CaO-SiO2-H2O gel at Ca/Si > 1. Cement and Concrete Res. 29, 1091-1097. Richardson I G, Groves G W, 1993. The incorporation of minor and trace elements into calcium silicate hydrate (C-S-H) gel in hardening cement pastes. Cement & Concrete Res. Vol 23, 131-138. Richardson I G, 2000. The nature of the hydration products in hardened cement pastes. Cement. and Concrete Composites., 22, 97-113. Rombén L, 1978. Aspects on testing methods for acid attack on concrete. CBI report 1:78. Rombén L, 1979. Aspects on testing methods for acid attack on concrete-further experiments. CBI report 9:79. Stade H, Müller D, 1987. On the coordination of Al in ill-crystallized C-S-H phases formed by hydration of tricalcium silicate and precipitation reactions at ambient temperature. Cement And Concrete Res. Vol 17, pp. 553-561. Stronach S A, Glasser F P, 1997. Modelling the impact of abundant geochemical components on the phase stability and solubility of the CaO-Si=2-H2O system at 25 C. Adv. in Cem. Res. Vol. 9, No 36, 167-181. Snyder K A, Clifton J R, 1995. 4sight manual: A computer program for modelling degradation of underground low level waste concrete vaults. NISTIR 5612, U.S. Dept. Of Commerce. Steinour H H, 1952. The reactions and thermochemistry of cement hydration at ordinary temperatures. Proc. 3d Int. Symp. On the Chem of Cem, Cem & Conc. Ass., London. Taylor H F W, 1997. Cement Chemistry, 2 ed, Thomas Telford, London. Trägårdh J, Lagerblad B, 1998. Leaching of 90-year old concrete in contact with stagnant water. SKB TR 98-11. Young J F, Hansen W, 1987. Volume relationships for C-S-H formation based on hydration stochiometries. Mat. Res. Soc. Proc. Vol. 85.

59
Appendix 1 Norsborgs water basins 1 General In Norsborg water works outside Stockholm there is a sequence of basins. The first were build 1910 and the last ones 1974. There are several basins of each age. They are about 100 meters long and 25 meters broad and are shown in Figure 1. At the bottom they are filled with filter sand. The concrete is between 30 to 50 cm thick and the outside is in contact with clay. The water in the basins does not freeze. Visually the concrete is in a good state except the ones from 1974, which shows signs of damage. This is due to that the concrete is of less quality, which has given rise to alkali-silica reactions and frost damage at the upper parts of the basins. No peeling, except from the outermost skin, can be noticed. No distinct level difference can be noticed between concrete above and below the water level. Thus one can presume that the amount of lost eroded material is small, only a few mm. There are no available data concerning the concrete quality. The books only go back to the 1950´s. No major repairs are recorded from this period.
Figure 1. Basin at Norsborg when emptied for exchange of filter sand. One drill core was taken above and one from below sand layer.

60
Table 1. Composition of fresh raw water from the Norsborg waterworks. From routine analysis 1997-06-11. The data are in mg/l. Temperature of water was 10.1°C Ca 15 mg/l Al 0.02 mg/l Cl 12 mg/l Mg 4.0 Cu 0.002 F 0.27 Na 9.1 Si 0.03 NH4-N 0.02 K 2.3 HCO3 43 NO3-N 0.06 Mn 0.011 SO4 21 PO4-N 0.001 Fe 0.04 O2 (g) 10.9 pH 7.7 Once a year the basins are emptied and some of the sand is replaced. The sampling was performed during this operation (Figure 1). Drill cores with a diameter of 10 cm were taken from the walls of the basins. Except for the basin from 1910 two drill cores were taken, one from above and one from below the filter sand level. In the basin from 1910 only one drill core from above the filter sand was taken. The basins are filled with slowly percolating water. The water comes from deep parts of the fresh-water lake Mälaren, a fairly large lake east of Stockholm. The composition of the water is in Table 1. One can presume that the composition of the water has been similar during the last 100 years. 2 Analytical methods The different concretes are investigated visually, in thin-sections and in Scanning electron microscope (SEM). Most of the analyses in SEM were made in backscatter mode on flat polished section. The chemistry of the pastes is analysed by energy dispersive analysis. The elements are presented in the form of wt % oxide normalised to 100%. The instrument was calibrated against reference materials, a cement mortar with known composition and a pure wollastonite. The detection limit (wt % oxide) for some elements is as follows: CaO (0.09), SiO2 (0.08) Al2O3 (0.07), MgO (0.1), Na2O (0.3) and K2O (0.1). The accuracy for the calcium analysis is about +/� 2.5-wt % oxide. In the water tank work /Trägårdh and Lagerblad, 1998/ the SEM/EDS was also controlled against calcium determined by EDTA-titration. The analyses have been performed both on points that cover a field of 5 microns or less and on small scanned surfaces to get an average or bulk analysis The thin-sections are impregnated with epoxy containing fluorescent dye. The thin-sections were analysed with a polarising microscope equipped with an UV light source. Thus as an additional option the porosity can be measured and compared. Moreover, the porosity can be compared with reference concretes with different w/c ratios. This will give a w/c-eqv. porosity value.

61
3 Results 3.1 Details of the different samples From each basin two drill cores (100-mm diameter) were taken one from above and one from below the filter sand. One of the drill cores from each basin was cut in two halves. The surface was ground and vacuum impregnated with epoxy containing fluorescent dye. Thereafter it was polished and analysed. From each drill core thin-sections both from the surface and from the interior of the concrete were made. The thin-sections covered 25x55mm. There was also made epoxi-stabilized flat polished specimen for analysis in SEM. They covered the concrete to a depth of around 50-mm The basins from 1910, 1916 and 1927 were made of concrete covered by mortar concrete, i.e. concrete with only sand. Between the mortar and concrete there is a porous layer. In the samples from 1927 a layer of grout washing can be observed. In the other two the concrete was probably watered before plaster, which will give a more porous zone. This layer is partly carbonated but not leached. The thickness of the patchy carbonated layer varies from less than ½ mm to 3 mm. As no leaching can be observed it is probably not a repair of a used water basin. The carbonation may indicate that there has been a period between the concrete casting and mortar. It may, however, also be due to that air or carbonated water penetrates the porous zone. This means that there is a slight uncertainty regarding the age of the mortar. The cement in the mortar is coarse grained and of the same type as in the cement. Thus the uncertainty is presumably only a couple of years. The most of the data from thin-section analysis through the leached surfaces is summarised in Table 3. Norsborg 1910 Observations; • The cross-section shows around 25 mm of mortar concrete on top of a normal
concrete. The mortar concrete is probably plastered on casted concrete. • The mortar concrete layer is rich in paste and has an aggregate D-max of 2 mm. • The mortar concrete could not absorb fluorescent dye. This is normally found in our
reference thin-sections when the w/c ratio is less than 0.35. • The cement is coarse grained with a D-max of 200 µm. • The air voids in the mortar concrete are filled with portlandite and ettringite, which
indicates water saturation. • The aggregates in both the mortar and concrete have a glaciofluvial origin and
consist mainly of local gneissose granitic rock types.

62
• The concrete has a D-max of 18 mm. It is well mixed but has a fairly large amount of entrapped air. It is probably compacted by tamping.
• The ordinary concrete below the mortar has in thin-section a porosity similar to a w/c ratio of 0.60 in our reference thin-sections.
• The cement is coarse grained with a D-max of 200 µm and the paste is well hydrated.
• The paste is inhomogeneous in thin-section scale presumably due to that it has been compacted by tamping
• The air voids are partly filled with mainly portlandite, which indicates water saturation.
Observations from drill core. Thin section data in Table 3. 1. Dark dense layer to a depth of < 1 mm 2. Porous layer with voids 1�2 mm 3. Porous mortar 2�4 mm 4. Dark dense mortar 15�20 mm 5. Porous layer in mortar 5�10 mm 6. Concrete 230 mm 7. Mortar 5�10 mm Norsborg 1916 • The cross-section shows around 20 mm of mortar concrete on top of a normal
concrete. The mortar concrete is probably plastered on casted concrete. • The mortar concrete is rich in paste and has an aggregate D-max of 2 mm. • The mortar concrete could not absorb fluoresces dye. This is normally found in our
reference thin-sections when the w/c ratio is less than 0.35. The cement is coarse grained with a D-max of 200 µm.
• The air voids in the mortar concrete are filled with portlandite and ettringite, which indicates water saturation.
• The aggregates in both the mortar and concrete have a glaciofluvial origin and consist mainly of gneissose granitic rock types.
• The concrete has a D-max of 20 mm. It is well mixed but has a fairly large amount of entrapped air.
• The concrete has in thin-section a porosity similar to a w/c ratio of 0.6 in our reference thin-sections.
• The cement is coarse grained with a D-max of 200 µm and the paste is very well hydrated.
• The cement paste is fairly inhomogeneous in thin-section scale, but better than the paste from 1910.
• The air void are partly filled with mainly portlandite, which indicates water saturation.

63
Observations from drill core (1916-2). Thin section data in Table 3. 1 Dark dense layer to a depth of 1 mm 2 Porous mortar 2�4 mm 3 Dark dense mortar 13�15 mm 4 Porous transition zone 1�2 mm 5 Concrete 230 mm Norsborg 1927 • The cross-section shows around 10�15 mm of mortar concrete on top of a normal
concrete. The mortar concrete is probably plastered on casted concrete. • The mortar is rich in paste and has an aggregate D-max of 2 mm. • The cement is coarse-grained with a D-max of 150µm. • The air voids are filled with portlandite and ettringite, which indicates water
saturation. • The concrete has a D-max of 8 mm. It is well mixed but has a fairly large amount of
entrapped air. • The aggregates in both the mortar and concrete have a glaciofluvial origin and
consist mainly of gneissose granitic rock types. • The ordinary concrete below the mortar has in thin-section a porosity similar to a
w/c ratio of 0.55�0.60 in our reference thin-sections. • The cement was rich in coarse cement with a D-max of 150 µm and the paste is very
well hydrated. • The air voids contain secondary precipitates of portlandite, which indicates water
saturation. Observations from drill core (1927-2). Thin section data in Table 3. 1 Dark dense layer to a depth of 1 mm 2 Porous layer 2�3 mm 3 Very dense mortar 3�4 mm 4 Dense mortar 2�3 mm 5 Porous concrete 5�8 mm 6 Concrete 175 mm Norsborg 1944 • The concrete is massive and it is of the same type the same in the whole drill core. • The concrete has a D-max of 18 mm. • Small stones can be observed at the surface and indicate that some of the cement
skin has been lost. It may be 1�2 mm. • The cement has a D-max of 100 µm and the paste is well hydrated. • The paste structure is somewhat uneven, which indicates fairly bad mixing. • The aggregates mainly consist of local glaciofluvial gneissic granitoid rocks.

64
• The concrete contains some limestone filler (typical of war time). • When compared with our reference concrete the ordinary concrete below the
concrete in sample 1944-1 has in thin-section a porosity similar to a w/c ratio of 0.4 and the concrete in 1944-2 similar to 0.5
Observations from drill core (1944-1). Thin section data in Table 3. 1. Dense surface layer 1 mm 2. Porous concrete 5�8 mm 3. Slightly denser concrete 40�60 mm 4. Slightly densified at clay contact 20 mm 5. Total length 25 mm Norsborg 1960 • The concrete is massive and it is of the same type in the whole drill core. • The concrete has a D-max of 25 mm. • The cement has a D-max < 100 µm. • The cement paste is fairly evenly hydrated. • The aggregates consist of local gneissic granitoid rocks. • A section of the unleached drill core was tested on strength and gave 70 MPa (when
recalculated to cube strength). • When compared with our reference concrete the ordinary concrete below the
concrete in sample 1960-1 has in thin-section a porosity similar to a w/c ratio of 0.45 and the concrete in 1960-2 similar to 0.4. The dense zone behind the leached porous zone is somewhat denser in the concrete with lower w/c.
Observations from drill core (1960-1). Thin section data in Table 3. 1. Dense concrete 1 mm 2. Porous concrete 4�5 mm 3. Slightly densified concrete 20�35 mm 4. Slightly densified at clay contact 20 mm 5. Total length 250 mm Norsborg 1974 The concrete is cracked and partly damaged. Drill core. • The concrete is massive and it is of the same type in the whole drill core. • The aggregates have a D-max of 30 mm. • The air void are throughout the concrete partly filled with ettringite and portlandite
crystals which indicate water saturation. • In the drill core a more porous texture can be found to a depth of around 15 mm.

65
In thin section. • The concrete has a porosity similar to a w/c ratio of 0.6 in our reference concrete. • The paste structure is patchy and streaky. • There are lots of microcracks. The cracks are in most cases filled with secondary
portlandite and ettringite. • Some minor ASR-gel can be found. The concrete is damaged presumably due to internal frost damage and ASR. This is probably due to low concrete quality. This is indicated both by the w/c equivalent and the low contents of cement (Table 2) in the concrete. This is a typical concrete quality for indoor constructions. The porosity allows water absorption and movements. Thus this concrete is omitted from further examination. 3.2 Comments The drill cores from 1944 and 1960 are with the same concrete all the way through. Thus it is possible to compare ordinary concrete from the interior with altered and densified concrete from the surface. By analysing the interior it is possible to find out the original composition and to compare leaching of concrete with different quality. Moreover, the investigations showed that regarding the samples from 1944 and 1960, the different cores from different parts of the basins are cast with different w/c ratio. With an assumption of a water/cement ratio (w/c) of 0.4�0.5 the concrete from 1960 contained around 390 kg cement per cubic meter concrete which is similar to what is used today in a good quality concrete. The concrete from 1974 had a too bad quality to be used in this type of construction. The concrete from 1944 contains some limestone filler, which is typical for this time. The mortar, which presumably was put on the concrete to protect it, is much richer in cement than the concrete (Table 2). Compared to the normal concrete the mortar concrete contains the double amount of cement. Larger amount cement allows a lower w/c and thus one can presume that mortar concretes had a substantially lower w/c ratio when plastered. The cement was coarse-grained and this has with time given the low porosity. Table 2. Cement/aggregate ratio for the different concretes. Average of two analyses. It is calculated on the amount of soluble CaO with the assumption that the amount of CaO is 63% of the total weight of cement. Sample 1944 contains some limestone filler for which the data has been adjusted. Sample 1910 1916 1927 1944 1960 1974 Cement/Aggregate 0.57 0.52 0.45 0.16 0.21 0.11
66
4 Common trends In both SEM and in thin-sections one can observe a similar zonal pattern. The observations from thin-sections are given in Table 3 and in the descriptions below. The main difference is the thickness of the different zones and some details. Thus one can define a typical zonal pattern from leaching with this type of water, although the leaching depth and the thickness of the individual zones varies. Figure 2 and 3 shows the zonal pattern as observed in thin-section from sample 1927-2 and 1944-2. The top photo shows the profile in fluorescent light. Here we can se a fairly dense layer at the top followed by a more porous zone. From this zone and inward the concrete becomes less porous and eventually becomes almost dense. The unleached mortar concrete has hardly absorbed any epoxy and fluoresces dye. From experience we know that this only occurs in modern concrete with a water/cement ratio of less than 0.35. Further inside the concrete it again becomes more porous. Thus this phenomena is probably due to the contact with water and prolonged hydration that slowly hydrates the remaining cement grains. In normal transmitted light we can also observe a porous layer marked by a more yellow colour from the epoxy. The next layer is darker. This dark layer coincides with paste that lack portlandite crystals. This is even more obvious with crossed polarizers. The phenomenon is due to that portlandite in contrast to the poorly crystalline calcium-silicate-hydrate is crystalline and birefringent and thus lets light through the specimen in the microscope. The denser layer at the surface is due to carbonate precipitation and carbonation of cement paste. Figure 4 to 9 shows chemical profiles through the surface of the different samples. Zon 1 Dense carbonated layer On the surface all the drill cores have a dense layer of coarse-grained carbonates. The thickness varies and sometimes it seems like the outermost shell has fallen off as sand grains can be seen at the surface. No stones (only small pebbles and sand grains) can be seen at the surface, which indicates that it is only part of the skin that has been lost. The dense carbonate crust is presumably due to calcium carbonate precipitation from water at high pH (in the beginning of the leaching). In some samples and at the level immediately below the calcite there is a dense silica gel (rich in Mg). In some samples, presumably where calcite layer is lost, compact gel dominates at the surface. Zon 2 Porous carbonated layer Below the dense carbonated layer there is a more porous carbonated zone. The matrix consists of irregular small calcite crystals in a matrix of gel. The carbonates are generally �dirty� and contain some minor amounts of Mg, Al, Si and Fe. Some of these components is presumably intermixed metalhydroxides. In contrast to the precipitated carbonates at the surface this is carbonated cement paste. The paste is often crossed with

67
veins of pure well-crystallised calcite (Figure 13). Downward this zone becomes more porous. The gel decreases in Mg while that of Ca increases. The air voids contain calcite crystals. Zon 3 Very porous zone The calcite zone often stops at a distinct front below which it can not be found except in some occasional veins. The porosity increases dramatically. In some cases like 1910 there is an open space. This is probably due to that the degraded cement paste was so fragile that it was destroyed during sample preparation. The matrix mainly consists of silica gel rich in Mg and Ca. There are also particles rich in Ca, Fe and Al. Relict ferrite (C4AF) can sometimes be observed in the core of these grains. Pseudoforms after cement clinker grains can often be observed. The C-S-H gel in these pseudoforms are enriched in Mg. Sometimes the pseudoforms are hollows with a framework of partly altered ferrite. Zone 4 Porous zone with ettringite At the lower part of the porous zone ettringite starts to appear. The ettringites are coarse-grained and fill voids and hollows. The gel is dominated by C-S-H with low Ca/Si ratios. It still contains some MgO. Pseudoforms/hollows after cement clinker grains can often be recognised. Except for the appearance of ettringite it looks like in zone 3. Relict ferrite cement grains are common. Zone 5 Porous optically dark zone The gel becomes denser in zone 5. In situ hydrated cement clinker grains and sometimes remaining clinker cores become common. The Ca/Si ratio in the the C-S-H gel gets higher. Ettringites in cavities are very common. Typically there are holes after old portlandite grains in an otherwise fairly dense paste. The optically dark colour (Crossed nicolls) comes from the lack of portlandite. Occasionally, however, clusters of portlandite can be observed in this zone, indicating variations in the chemical system. Hollow grains after cement and cement grains embedded in dense gel can be observed in some of the samples. Zone 6 Dense paste In this zone the cement paste contains portlandite. The border towards zone 5 is often sharp where portlandite grains can be observed on one side and hollows after portlandite with the same shape on the other side (Figure 10). Ettringite and portlandite crystals can be found in old air and other voids. Small voids are normally totally filled, while larger still can have some empty space. Ettringite is more common at the leached side while portlandite is more common towards the interior. The paste is often very dense. In most cases one can observe a boundary to more normal (more porous) concrete/cement paste at greater depth.

68
Zone 7 Normal Concrete/cement paste The concrete below the densified zone is more porous but it shows signs if prolonged hydration. Portlandite crystals can be found in some voids but it is not as common as in the densified zone. This indicates that external water effectively only can penetrate to a certain depth. The thickness of zone 6 is related to the density of the normal paste. Coarse-grained monosulphate crystals have been identified locally in zone 7 but not in zone 6. Table 3. Depth of alteration in the different analysed samples. The depth of the zonal pattern comes from thin-sections. The Ca/Si = 1 front is the depth where the CaO/SiO2 ratio is 1. The C-S-H alteration is the depth before the Ca/Si ratio reaches a normal ratio. Paste alterations is the depth before the whole matrix reaches a normal value. This is not analysed on the samples from 1944 and 1960. The w/c-eqv .ratio comes from porosity measurements below the densified zone of thin-sections compared with standards. The unaltered cement paste on mortar concrete from 1910, 1916, and 1927 could not absorb fluorescein epoxy , which is typical for a w/c ratio of less than 0.35. All measurement is in mm. Sample 1910-1 1916-1 1916-2 1927-1 1927-2 1944-1 1944-2 1960-1 1960-2 1 Dense carb. 1 0.5 0.5 0.5 0.5 0.5 0.5 0.5 0.5 2 Porous carb. 1 0.5 0.5 0.5 0.5 1 1 0.5 0.5 3 Very porous 2 1 1 1 0.5 1 1 0.5 1 4 Porous ettr. 2 0.5 0.5 1 0.5 1 2 1 1 5 Por. opt. dark 2 1 1 2 1.5 5 3 2.5 2 6 Dense paste 16 8 8 5 7.5 22 15 22 15 ∑ Zone 1�5 8 4.5 3.5 5 3.5 8.5 7.5 5 5 C/S = 1 front 4 3.5 1 4 5 2.5 2 C-S-H alteration
7 4 3 6.5 10 5 4
Paste alterations
10 6 4
w/c-eqv. <0.35 <0.35 <0.35 <0.35 <0.35 0.40 0.50 0.45 0.40

69
Fluorescent light.
Normal light. Without CH With CH
Crossed polarizers Figure 2. Thin-section photos of a cross-section through the leached surface of sample 1927-2. In fluorescent light lighter colour indicate larger porosity. In normal light and with crossed polarizers the zone without portlandite becomes darker, as the amorphous paste do not contain any birefringent portlandite crystals.
8 mm
Aggr
Unaltered concrete
CCCaaarrrbbbooonnnaaattteeeddd
1 2 3 4 5 6 (Zone category)

70
Fluorescens light
Normal light Without CH With CH
Crossed polarizers Figure 3. Thin-section photos of a cross-section through the leached surface of sample 1944-2. In fluoresces light lighter yellow indicate more porosity. In normal light and with crossed polarizers the zone without portlandite becomes darker, as the amorphous paste do not contain any birefringent portlandite crystals.
Unaltered concrete
1122 mmmm
1 2 3 4 5 6 (Zone Category)
EEEttt tttrrr iiinnngggiii ttteee
Carbonated.
PPoorroouuss
Aggr

71
Norsborg 1910 Gel composition
0
10
20
30
40
50
60
70
0 2 4 6 8 10 12 14 16 18 20
Depth in mm
Oxi
de in
wt.
%
CaO
SiO2
MgO
Al2O3
Fe2O3
Norsborg 1910, bulk analysis of paste areas
0
5
10
15
20
25
30
35
40
0 2 4 6 8 10 12 14 16 18 20
Depth in mm
Oxi
de in
wt.%
SiO2
CaO
Al2O3
Fe2O3
MgO
SO3
Figure 4. Chemical profile from the surface of drill core from 1910. Representative analysis from points in dense and homogenous C-S-H gel (upper) and areas of paste (lower). The total sum of oxides is normalised to 100%. In the bulk analysis we can also observe sulphates.

72
Norsborg 1916 gel composition
0,0
10,0
20,0
30,0
40,0
50,0
60,0
70,0
0 2 4 6 8 10 12
Depth in micrometer
Oxi
de in
wt%
CaO
SiO2
MgO
Al2O3
SO3
Fe2O3
Figure 5. Chemical profile from the surface of drill core from 1916. Representative analysis from points in dense and homogenous C-S-H gel. The total sum of oxides is normalised to 100%. The amounts of alkali is low and thus omitted from diagram.
Norsborg 1944-2 gel composition
0
10
20
30
40
50
60
70
0 5 10 15 20 25 30
Depth in mm
Oxi
de i
wt.
%
CaO
SiO2
MgO
Al2O3
Fe2O3
Figure 6. Chemical profile from the surface of drill core from 1944. Representative analysis from points in dense and homogenous C-S-H gel. The total sum of oxides is normalised to 100%. The amounts of alkali and sulphate are low and thus omitted from diagram.

73
5 Textural details and chemistry of
the paste Figure 7 shows cross-section trough alteration zones of sample from 1916. Here we can see the carbonated surface, a porous alteration zone and dense unaltered concrete. Zone 6 The unleached concrete in all the samples from Norsborg show features typical of prolonged hydration. It has a similar texture as the old concrete from the Älvkarleby power station described in SKB AR 96-01. But in the Norsborg samples we can differentiate between one that is related to the water from the basins and one that has to do with normal maturity development. In the photos in Figure 8 we can compare the texture of new concrete with the samples from 1944. The modern concrete had a water/cement ratio of 0.45 and it was presumably not possible to make concrete with much lower ratio in 1944. The texture shows that the new concrete contains more pores and remaining cement grains. The prolonged hydration in water hydrates the remaining cement grains, which fills the pores. Moreover, the capillary porosity is much finer. This feature can also be observed as a more homogeneous structure on small scale in thin-sections.
Figure 7. SEM-back scatter photo. Cross-section through the leached zone in sample from 1916. Pebble sticking up in surface indicates some loss of material. The darker zone shows the more porous layer beneath the denser carbonated layer. The lower part shows very dense paste where the white spots are cement clinker grains.
1 mm
1916 aggr
Carbonated
Poreous
Dense paste

74
Ref 1944
Figure 8. SEM-backscatter image of one year old concrete from a bridge and from the concrete in the basin from 1944. The same enlargement. The light grey particles are portlandite crystals and the grey matrix is cement paste (C-S-H). The black space is voids/pores. The water/cement ratio of the reference concrete was 0.45. The difference between the reference concrete and the old concrete shows the effect of prolonged hydration. The mortar concrete in the basins from 1910, 1916 and 1927 contains more cement and presumably had a lower w/c ratio. This results in a more dense paste. Moreover, the prolonged hydration makes the paste even denser. In the texture one can differentiate between more porous so-called outer hydrates and in situ hydrated cement clinker socalled inner product. In the photos in Figure 8 we can see a pseudoform of an in situ hydrated cement clinker grain surrounded by fine portlandite crystals. The CaO/SiO2 ratio of the inner and outer product is the same (around 1.6). This is independent of the type of clinker (C2S or C3S). This indicates that during the in situ hydration Ca ions diffuse outwards and precipitate in the surrounding porosity. This will densify the paste as can be seen in the photos in Figure 9. Here the portlandite is fairly coarse grained, which is typical of recrystallisation and slow growth in water filled space. The details of the mechanism of prolonged hydration can be found in Lagerblad /1999/. In most of the samples one can still recognise a capillary system in the outer products but it varies from concrete to concrete. The concrete mortar of sample 1910 and especially 1916 and 1927 is however almost totally dense presumably without any connected pores. This means that in these old mortar concretes the diffusivity will be mainly controlled by the gel porosity. Theoretically all cement will be consumed at a w/c ratio of around 0.4. Thus, based on the density of the paste and the large amount of remaining cement grains the w/c ratio of the old mortars must have been well below 0.4.
100 µm

75
10µm
1910 1927
Figure 9. SEM-backscatter photos of dense mortar from water basins cast 1910 and 1927. The bright colour marks cement grain (C2S). The slight grey portlandite (CH). The massive formed grey marks in situ hydrated cement with bright relicts of unhydrated ferrite (C4AF). Zone 5 The texture of the paste in zone 5 is similar to that of zone 6 except from the lack of portlandite. The left photo in Figure 10 shows the transition from zone 6 to zone 5. Here we can see holes after portlandite in the upper half and portlandite grains in the lower part. The texture shows that the portlandite crystals are selectively dissolved and removed while the other phases remain intact. The paste still often contains calcium silicate clinker minerals embedded in dense C-S-H (right photo in Figure 10). This indicates that the dissolution of portlandite is relatively fast. The amount of remaining clinker grains is, however, less and some of it must have been lost. The CaO/SiO2 ratio drops from 1.7 to around 1.0 in this zone. This drop is mainly due to loss of Ca ions. The increase of SiO2 is due to that the analysis are normalised to 100%, which will give an apparent increase. Similarly the contents of Fe and Al apparently increases. The decrease in Ca/Si ratio will lead to a decrease of pH and Ca ions in the pore solution. No shrinkage of the C-S-H gel can be observed. In SEM-backscatter one can notice a lower atomic density but no volume changes other than cracking due to drying shrinkage in the vacuum chamber in the SEM. This indicates that loosely bound calcium hydroxide can diffuse out of the gel without destroying the basic C-S-H structure. The depth of this zone varies considerably also within the same sample. In sample 1960-2 the thin-section indicated a depth of the transition zone to zone 6 at 5 mm while the SEM showed that the depth was at 20 mm. The leaching normally follows a wavy front. There is no indications of that the front follows porous zones or the interfacial zone between paste and aggregate. Presumably the variation in sample 1960-2 depends on local convection that increases the diffusion considerably. An interesting fact is that although zone 5 is deep in sample 1960-2 no change can be found in the Ca/Si ratio of the C-S-H. This indicates that it is very much easier to leach CH than to alter the C-S-H gel.

76
100µm 50 µm
Figure 10. SEM-backscatter photos from sample 1960. The left picture shows the transition from zone 6 (bottom) to 5 (top). The dissolved portlandite can be observed as holes. In zone 5 we can observe remaining cement clinker grains in a matrix that have holes after dissolved portlandite. The cement grains are protected by a layer of dense cement gel. The cracks are due to drying in SEM. Zone 4 In zone 4 no portlandite can be found and the C-S-H gel also show clear signs of being leached. This is presumably due to that the C-S-H gel starts to collapse which results in an increasing porosity. Deposition of ettringite crystals is typical of this zone (Figure 11). The ettringite often fills old voids after dissolved cement grains. The deposition of ettringite is also indicated as an increase of sulphates in the chemical analysis (Figures 4 and 5). The increase in the sulphate content is even higher than the analysis show as the analysed areas do not include the coarse-grained ettringite in the larger air voids. The composition of the ettringite (analysis 13) indicates some solid solution or intermixture of monosulphate and thaumasite. The CaO/SiO2 ratio is now down to around or below 1 and the Ca is partially leached out. As the ettringite still exists the pH is presumably above 10.5. The texture shows pseudoforms or ghostlike forms after a typical paste of zone 5 and 6. A slight increase in the contents of Mg can be observed in some analysis

77
Figure 11. SEM-backscatter photo of zone 4 in sample from 1944. Portlandite is dissolved and the paste shows signs of being destroyed. The porosity has increased but altered ferrite still remains in pseudoforms after old cement grains. The voids are often filled with secondary ettringite. Zone 3 Zone 3 resembles zone 4 but there are no ettringite and the texture is even more porous. The definition of zone 3 is that there is no ettringite indicative of a drop of pH below 10.5. Often a clear border between zone 3 and 4 can be observed (Figure 12). Relicts of in situ hydrated gel nodules can be observed. Analysis 7 and 8 show typical compositions of the gel. Analysis 9 shows the chemical composition of an almost destroyed gel. Typically the contents of the insoluble Fe and Al is high. The matrix is mainly build up of dirty masses of calcium/iron/aluminium hydrates. There are no sulphates. This indicates that the pH is around 10 or even lower. The ettringite is unstable and has released its content of sulphate to zone 4 and 5. Analysis 12 shows a chemical composition that would generate an ettringite if pH was high enough and sulphates available. Analysis 13 gives a typical composition of ettringite in zone 4.
100µm
1944

78
50µm 100µm
Zone 4
Zone 3
Ettringite
Figure 12. SEM-backscatter photos of transition from zone 4 to zone 3. In zone 3 the paste gets more porous and there are no more ettringite. The bright colours are from aggregates. Zone 2 The typical feature of zone 2 is that it contains calcium carbonate. The photo in Figure 13 shows the transition zone between zone 2 and 3. The calcite is normally found in clusters together with ferrite and aluminate phases. Presumably calcium ions mowing outwards meet carbonate ions from the external water and precipitate calcite. The texture is still porous but much less than in zone 3. Relicts of C-S-H nodules can be observed but they contain very little Ca, instead they are distinctly enriched in Mg (analysis 5 and 6). There is an apparent increase in Si and Al. The ratio between Si and Al is similar to that in the other zones, which indicates that it is mainly due to lack of Ca ions.
Figure 13. SEM-backscatter photo of sample 1944-2. Zone 2 is carbonated which gives a more dense texture. One can also observe calcite filled veins penetrating into zone 3.
1960
100µm Zone 3
Zone 2

79
Zone 1 In zone 1 calcite appear as pure crystals. A typical feature apart from the calcite is nodules of magnesium rich silica gel (analysis 2 and 3). Presumably the Mg stabilises the silica gel. Often these nodules have the form of cement grains. Pure calcite can also be found in distinct veins penetrating into zone 2 and occasionally zone 3.
50µm
Figure 14. SEM-backscatter photo of surface of sample from 1910. The left photo is an enlargement of the other. The matrix mainly consists of a dense gel rich in Mg. It has a pseudoform structure of old cement grains. The bright colours comes from calcium-carbonates and metal hydroxides. The veins are filled with calcite. Analysis 2 in Table 4 comes from the gel nodules in the SEM photo.

80
Table 4. Energy dispersive analysis of cement paste in SEM. The results are in wt % as oxides and normalised to 100%. Core 1910 1910 1960 1910 1910 1960 1910 1910 1910 1960 1944 Analysis 1 2 3 4 5 6 7 8 9 10 11 Zone 1 1 1 2 2 2 3 3 3 3 3 Detail area point point area point point area point point point area CaO 21.4 2.1 2.9 18.4 7.0 15.0 18.4 7.0 49.7 12.3 22.8 SiO2 38.8 57.2 59.1 45.1 55.7 56.4 45.1 55.7 1.2 55.3 45.9 Al2O3 9.5 10.7 5.5 11.2 11.9 11.5 11.2 11.9 23.7 7.3 9.5 Fe2O3 3.7 1.6 4.4 3.1 3.1 6.2 3.1 3.1 22.2 5.6 4.2 MgO 25.1 27.1 27.5 20.7 20.6 9.0 20.7 20.6 1.2 18.8 15.0 Na2O --- 0.3 ---- --- ---- --- --- --- ---- --- --- K2O 1.5 1.0 0.3 1.5 1.8 2.0 1.5 1.8 0.4 0.9 2.5 SO3 --- ----- 0.3 --- ---- ---- ---- ---- --- ---- --- Core 1910 1910 1910 1910 1910 1910 1944 1944 1944 1960 1960 Anal. 12 13 14 15 16 17 18 19 20 21 22 Zone 3 4 5 4/5 5 6 4/5 5/6 7 4/5 5/6 Detail area point point point point point point point point point point CaO 54.3 48.5 52.0 46.4 58.6 57.0 45.9 57.0 56.4 44.4 57.7 SiO2 5.6 5.8 0.2 42.9 35.2 36.9 46.1 36.7 36.7 47.7 36.9 Al2O3 30.6 16.7 18.4 7.1 3.0 3.1 4.7 2.6 2.3 3.8 2.7 Fe2O3 5.9 ---- ----- 0.4 0.7 0.6 1.3 2.1 2.5 2.0 0.9 MgO 1.4 ----- ----- 2.9 2.2 2.1 4.7 2.6 2.3 1.7 1.4 Na2O ----- ----- ----- ----- ---- ----- --- 0.3 0.2 ------ ----- K2O 2.2 ----- ------ ------ ------ ----- 0.8 0.4 0.3 0.3 0.5 SO3 nd 29.0 29.2 0.6 0.2 0.4 ----- ------

81
6 Conclusions The mechanism of leaching will be discussed in greater detail in the main text. Thus the discussion is here limited to the typical features of the Norsborg Dams. All the different concretes in Norsborg have been subjected to the same environment. The differences regarding chemical and textural changes must thus be due to variations in material properties and exposure time. 1 All the basins have all developed a similar zonal alteration pattern. 2 The concrete has absorbed magnesium at the surface. 3 The concrete gets denser, less porous with time. 4 The carbonation is fairly shallow. 5 Carbonate precipitates can be found on some surfaces. The results show that the penetration depth increases with time but diminishes with concrete quality. There is a relationship where a lower w/c-ratio gives less depth of leaching/alteration. We do not know the w/c-ratio at the time of casting but the density of paste and the amount of remaining cement clinker grains indicate it. The mortars from 1910, 1916 and 1927 must have had a w/c-ratio of less than 0.4 as there are such a lot of remaining clinker grains in a very dense paste. There is noting distinct in the texture that explains the difference in penetration depth between the three samples. They are all totally dense without any capillary porosity behind the leaching front. There are, however, indications of that the gel itself is somewhat denser in the samples from 1916 and 1927 than in the one from 1910. This indicates that a very low w/c ratio would be preferable, as also the gel porosity will diminish and that this has a good affect on the leaching resistance. The larger leaching resistance could also be linked not only to the larger density but also to the effect of remaining clinker grains.

83
Appendix 2 Submerged parts of bridges 1 General To get further examples of old concrete in water we have examined submerged parts of old bridges in the sweet water lake Mälaren. The material in form of data was kindly put to our disposal by AB Stockholm Konsult avdelning för Brounderhåll-Materialprovning. From them we got thin-sections of concrete that was sampled 50�100 cm below the sea level. It is basically the same water as in the Norsborg basins. The water in the Norsborg basins, however, comes from deep parts and thus presumably contains less oxygen and carbon dioxide. All the bridges were cast with pure Portland cement. The concrete is in contrast to the basins subjected to flowing water. 2 Results The zonal pattern is similar to that of the Norsborg basins. There are, however, some significant differences. In the Norsborg samples zone 1 and 2 are defined on the carbonation. In the bridge columns the carbonation goes deeper and reaches zone 3 and sometimes zone 4 of the Norsborg samples. This is probably due to higher bicarbonate and carbondioxide content in the surface water. Thus zone 2�4 is regarded as a group defined by its high porosity. Zone 4 and 5 can not be differentiated in thin-section and are thus often put together. The carbonation is marked as how much of the zone (mostly 2�4) that is carbonated. The surface is often missing. In this case the missing concrete is estimated from the relief and the larger aggregate grains sticking out. 2.1 Bridge 1 build 1966 located in Mälaren W/c �eqv. Zone 1 Zone 2�4 Zone 4�5 Leach depth 0.40 Missing
4�5 mm lost 2.4 mm Carb. 2 mm
2�4 mm 8�12 mm
Observations: Gravel pebbles are sticking out and indicate erosion of around 4 mm. Locally CH is missing at greater depth and indicate local percolation. 2.2 Bridge 2 build 1966 and located in Mälaren W/c �eqv. Zone 1 Zone 2�4 Zone 4�5 Leach depth 0.40 0.3 mm
1�2 mm lost locally 1 mm Carb 1 mm
4 mm 6�7 mm
Observations: Undulatory dense carbonated surface. Small pebbles at surface indicate shrinkage of around 1�2 mm.

84
2.3 Bridge 3 build 1967 and located in Mälaren Two samples W/c �eqv. Zone 1 Zone 2�4 Zone 4�5 Leach depth 0.45 Uneven
Missing 1�2 mm lost.
2�3 mm Carb. 2�3 mm
2�3 mm 7�9 mm
Observations: Undulatory dense carbonated surface and small pebbles at surface indicate moderate erosion and that 2�3 mm is missing. 2.4 Bridge 4 build 1966 and located in Mälaren W/c �eqv. Zone 1 Zone 2�3 Zone 3�4 Zone 5 Leach depth 0.55 < 1 mm
4 mm
8 mm Carb. 1 mm
5 mm 15�18 mm
Observations: A thin layer of carbonated and siliceous surface can be noticed. Below this there is an empty space of 4 mm presumably very weak material that got lost during sample preparation. Following this gap there is a thin carbonated surface followed by a thick layer before zone 5 is reached. The sample shows indications of percolation zones. There is also small filled cracks parallel to the surface which indicates some frost damage. 2.5 Bridge 5 build 1966 and located in Mälaren W/c �eqv. Zone 1 Zone 2�4 Zone 4�5 Leach depth 0.40 Uneven
Missing 2�3 mm lost.
2�3 mm Carb 3 mm
2�3 mm 7�9 mm
Observations: Small pebbles sticking out and indicate erosion and that around 2�3 mm is missing. Distinct zonation. Ettringite can be noticed at carbonation front. 2.6 Bridge 6 build 1946 and located in Mälaren W/c �eqv. Zone 1 Zone 2�4 Zone 4�5 Leach depth 0.50 Uneven
2�3 mm 2�3 mm Carb 3 mm
5�7 mm 10�12 mm
Observations: Undulatory surface but locally a silica gel can be found on dense carbonate.

85
2.7 Bridge 7 build 1968. Located in brackish water in the Baltic sea
W/c �eqv. Zone 1 Zone 2�4 Zone 4�5 Leach depth 0.40�0.50 Uneven
1 mm 2�4mm Carb 4 mm
20�40 mm 25�45mm
Observations: Badly homogenised concrete with varying porosty. Intact silica rich crust above dense carbonated layer. Distinct porous layer. Below this leaching and carbonation do not have a distinct front but follow zones. The large leaching depth is presumably due to perculation in cracks and originally porous zones. In a second thin-section the dense crust was missing (3�4 mm missing) but the alteration front was as deep. In both samples alkali silica gel can be found. The concrete is damaged and in a bad stage. 2.8 Bridge 8 build 1956 and located in Mälaren W/c �eqv. Zone 1 Zone 2�4 Zone 4 Zone 5 Leach depth 0.50�0.55 Uneven
0.2 mm 2�3 mm
1 mm Carb. 1 mm
1.5 mm 5�6 mm
Observations: Intact surface with the whole spectrum of zones. The surface layer is very thin and fragile. The CH depletion zone (5) is distinct and its front coincides with the carbonation front 3 Conclusions The bridge columns have in contrast to the basins been subjected to flowing water and erosion due to this. Thus the concrete have lost more surface. The flowing water will also give other conditions for the leaching as the surface water always will be renewed. The flowing water has also given some erosion. In some samples with low quality there are indications of alteration channels indicative of percolation. Basically, however, we can observe a similar zonal alteration pattern as in the Norsborg basins.

ISSN 1404-0344CM Digitaltryck AB, Bromma, 2001