Ldc2010 en unctad
298
UNITED NATIONS CONFERENCE ON TRADE AND DEVELOPMENT THE LEAST DEVELOPED COUNTRIES REPORT 2010 Towards a New International Development Architecture for LDCs UNITED NATIONS EMBARGO The contents of this Report must not be quoted summarized in the print, broadcast or electronic media before 25 November 2010, 17:00 hours GMT
-
Upload
zoely-mamizaka -
Category
Documents
-
view
3.277 -
download
20
Transcript of Ldc2010 en unctad
UNITED NATIONS CONFERENCE ON TRADE AND DEVELOPMENT
THE LEAST DEVELOPED COUNTRIES REPORT 2010
Towards a New International Development Architecture for LDCs
UNITED NATIONS
EMBARGO
The contents of this Report
must not be quoted
summarized in the print, broadcast
or electronic media before
25 November 2010, 17:00 hours GMT

UNITED NATIONS CONFERENCE ON TRADE AND DEVELOPMENTGeneva
THE LEAST DEVELOPED COUNTRIES
REPORT 2010
UNITED NATIONSNew York and Geneva, 2010
Towards a New Interna�onal Development Architecture for LDCs

Note
Symbols of United Nations documents are composed of capital letters with figures. Mention of such a symbol indicates a reference to a United Nations document.
The designations employed and the presentation of the material in this publication do not imply the expression of any opinion whatsoever on the part of the Secretariat of the United Nations concerning the legal status of any country, territory, city or area, or of its authorities, or concerning the delimitation of its frontiers or boundaries.
Material in this publication may be freely quoted or reprinted, but full acknowledgement is requested. A copy of the publication containing the quotation or reprint should be sent to the UNCTAD secretariat at: Palais des Nations, CH-1211 Geneva 10, Switzerland.
The overview of this report can also be found on the Internet, in all six official languages of the United Nations, at www.unctad.org.
UNITED NATIONS PUBLICATION
Sales No. E.10.II.D.5
ISBN 978-92-1-112813-0
ISSN 0257-7550
UNCTAD/LDC/2010
What are the least developed countries?
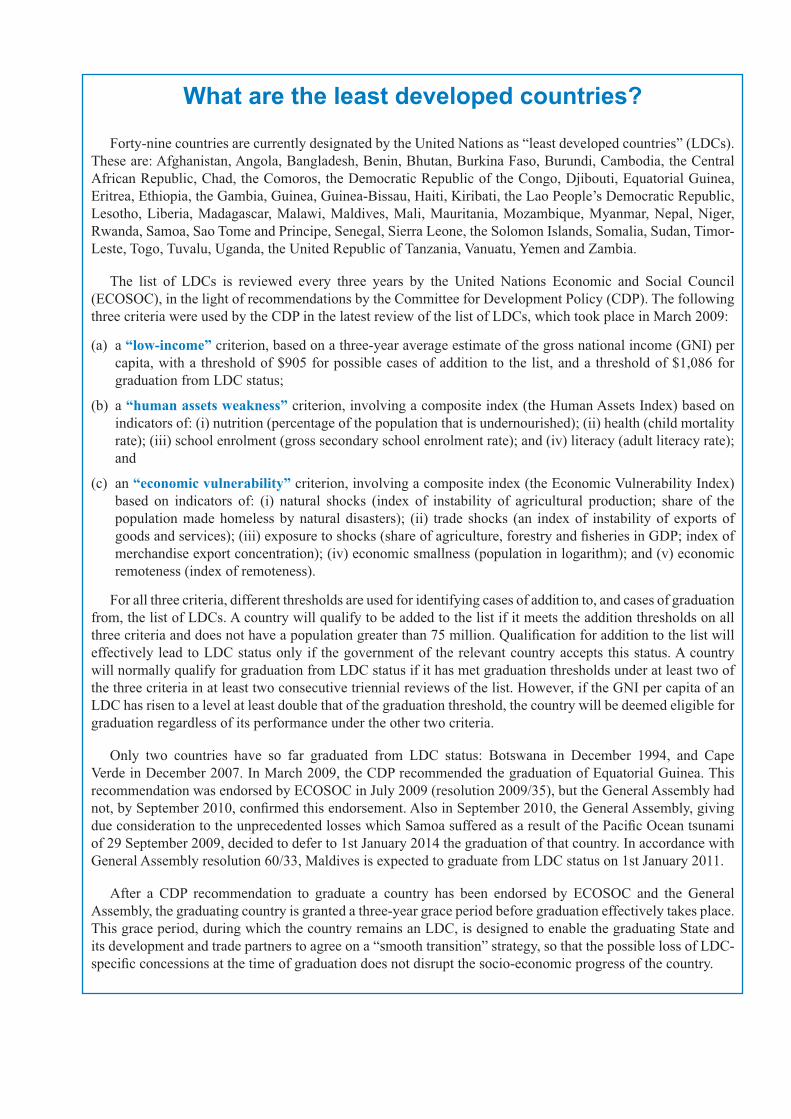
Forty-nine countries are currently designated by the United Nations as “least developed countries” (LDCs). These are: Afghanistan, Angola, Bangladesh, Benin, Bhutan, Burkina Faso, Burundi, Cambodia, the Central African Republic, Chad, the Comoros, the Democratic Republic of the Congo, Djibouti, Equatorial Guinea, Eritrea, Ethiopia, the Gambia, Guinea, Guinea-Bissau, Haiti, Kiribati, the Lao People’s Democratic Republic, Lesotho, Liberia, Madagascar, Malawi, Maldives, Mali, Mauritania, Mozambique, Myanmar, Nepal, Niger, Rwanda, Samoa, Sao Tome and Principe, Senegal, Sierra Leone, the Solomon Islands, Somalia, Sudan, Timor-Leste, Togo, Tuvalu, Uganda, the United Republic of Tanzania, Vanuatu, Yemen and Zambia.
The list of LDCs is reviewed every three years by the United Nations Economic and Social Council (ECOSOC), in the light of recommendations by the Committee for Development Policy (CDP). The following three criteria were used by the CDP in the latest review of the list of LDCs, which took place in March 2009:
(a) a “low-income” criterion, based on a three-year average estimate of the gross national income (GNI) per capita, with a threshold of $905 for possible cases of addition to the list, and a threshold of $1,086 for graduation from LDC status;
(b) a “human assets weakness” criterion, involving a composite index (the Human Assets Index) based on indicators of: (i) nutrition (percentage of the population that is undernourished); (ii) health (child mortality rate); (iii) school enrolment (gross secondary school enrolment rate); and (iv) literacy (adult literacy rate); and
(c) an “economic vulnerability” criterion, involving a composite index (the Economic Vulnerability Index) based on indicators of: (i) natural shocks (index of instability of agricultural production; share of the population made homeless by natural disasters); (ii) trade shocks (an index of instability of exports of goods and services); (iii) exposure to shocks (share of agriculture, forestry and fisheries in GDP; index of merchandise export concentration); (iv) economic smallness (population in logarithm); and (v) economic remoteness (index of remoteness).
For all three criteria, different thresholds are used for identifying cases of addition to, and cases of graduation from, the list of LDCs. A country will qualify to be added to the list if it meets the addition thresholds on all three criteria and does not have a population greater than 75 million. Qualification for addition to the list will effectively lead to LDC status only if the government of the relevant country accepts this status. A country will normally qualify for graduation from LDC status if it has met graduation thresholds under at least two of the three criteria in at least two consecutive triennial reviews of the list. However, if the GNI per capita of an LDC has risen to a level at least double that of the graduation threshold, the country will be deemed eligible for graduation regardless of its performance under the other two criteria.
Only two countries have so far graduated from LDC status: Botswana in December 1994, and Cape Verde in December 2007. In March 2009, the CDP recommended the graduation of Equatorial Guinea. This recommendation was endorsed by ECOSOC in July 2009 (resolution 2009/35), but the General Assembly had not, by September 2010, confirmed this endorsement. Also in September 2010, the General Assembly, giving due consideration to the unprecedented losses which Samoa suffered as a result of the Pacific Ocean tsunami of 29 September 2009, decided to defer to 1st January 2014 the graduation of that country. In accordance with General Assembly resolution 60/33, Maldives is expected to graduate from LDC status on 1st January 2011.
After a CDP recommendation to graduate a country has been endorsed by ECOSOC and the General Assembly, the graduating country is granted a three-year grace period before graduation effectively takes place. This grace period, during which the country remains an LDC, is designed to enable the graduating State and its development and trade partners to agree on a “smooth transition” strategy, so that the possible loss of LDC-specific concessions at the time of graduation does not disrupt the socio-economic progress of the country.
Acknowledgements
The Least Developed Countries Report 2010 was prepared by a team consisting of Željka Kožul-Wright (team leader), Agnès Collardeau-Angleys, Junior Davis, Padmashree Gehl Sampath, Massimiliano La Marca (until 31 July 2010), Igor Paunović, Madasamyraja Rajalingam, Rolf Traeger and Giovanni Valensisi. Cécile Couharde, Stefano Inama, Mathias Rau-Göhring, Claudia Röthlisberger and Wei Zhuang also made specific inputs to the Report. The work was carried out under the overall guidance and supervision of Charles Gore, Head, Research and Policy Analysis Branch, Division for Africa, Least Developed Countries and Special Programmes, who also made significant inputs to the structure and content of the Report.
An ad hoc expert group meeting on “Meeting the challenges of the crisis in the least developed countries through international support mechanisms” was held in Geneva on 3 and 4 December 2009 to plan the Report and review specific inputs. It brought together specialists in the fields of international financial architecture, international economic governance, climate change, commodities, South-South cooperation, macroeconomic policies, poverty, aid effectiveness, and vulnerability. The participants in the meeting were: Cécile Couharde, Roy Culpeper, Jayati Ghosh, Adrian Hewitt, Nora Honkaniemi, Massoud Karshenas, Machiko Nissanke, Celine Tan, Vivianne Ventura-Dias, John Weeks and David Woodward. Along with the LDC team, Nancy Biersteker helped organize the meeting.
The Report draws on background papers prepared by Francis Cripps, Roy Culpeper, Massoud Karshenas, Machiko Nissanke, Celine Tan, Vivianne Ventura-Dias, John Weeks and David Woodward. Comments on specific parts of the Report were received from Alex Izurieta, Jomo Kwame Sundaram and Rob Vos (UN-DESA), Stephany Griffith-Jones (Columbia University), and also from the following colleagues from UNCTAD: Taffere Tesfachew (Office of the Secretary General), Richard Kožul-Wright (Unit on Economic Cooperation and Integration among Developing Countries), and Taisuke Ito, Mina Mashayekhi and Bonapas Onguglo (Division on Trade in Goods and Services, and Commodities).
Secretarial support was provided by Maria Victoria Barnes. Sophie Combette designed the cover. The text was copy-edited by Praveen Bhalla.
The overall layout, graphics and desktop publishing were done by Madasamyraja Rajalingam.
The financial support of donors to the UNCTAD LDC Trust Fund, particularly the Governments of Norway and Finland, is gratefully acknowledged.

ContentsWhat are the least developed countries? ............................................................................................................. iiiExplanatory notes ................................................................................................................................................ xiAbbreviations ...................................................................................................................................................... xiiClassifications used in this Report .......................................................................................................................xv Overview ........................................................................................................................................................I–XXI
Chapter 1
THE GLOBAL FINANCIAL CRISIS AND RECENT BOOM-BUST CYCLE IN THE LDCS ...................................................1
A. Introduction ..................................................................................................................................................1
B. The anatomy of the boom-bust cycle ..........................................................................................................31. The economic boom of 2002–2007..........................................................................................................................32. Weak development of productive capacities during the boom period ...................................................................103. The scale and pattern of the bust ............................................................................................................................16
C. How the financial crisis and global recession affected LDCs .................................................................191. Negative spillover effects .......................................................................................................................................192. Policy responses ....................................................................................................................................................243. Overall impact and risks to the medium-term economic outlook ..........................................................................29
D. Poverty trends and progress towards achieving the MDGs ....................................................................301. Long-term trends in income poverty ......................................................................................................................312. Progress towards the MDGs before the crisis ........................................................................................................353. Social impact of the global economic crisis and outlook for poverty reduction to 2015 .......................................39
Notes ..................................................................................................................................................................41
References .........................................................................................................................................................42
Chapter 2
HOW EFFECTIVE ARE LDC-SPECIFIC INTERNATIONAL SUPPORT MEASURES? .......................................................45
A. Introduction .................................................................................................................................................45
B. The increasing but incomplete recognition of the special needs of LDCs ..............................................461. Increasing recognition ............................................................................................................................................462. Incomplete recognition...........................................................................................................................................49
C. Effectiveness of special international support measures for LDCs ........................................................521. Aid .........................................................................................................................................................................522. International trade ..................................................................................................................................................573. Technology transfer – TRIPS Article 66.2 .............................................................................................................704. Climate change – the LDC Fund ...........................................................................................................................71
D. A comparative assessment .........................................................................................................................75
Notes ..................................................................................................................................................................79
References .........................................................................................................................................................79
The Least Developed Countries Report 2010vi
Chapter 3
THE CONTOURS OF A NEW INTERNATIONAL DEVELOPMENT ARCHITECTURE FOR LDCS ........................................83
A. Introduction .................................................................................................................................................83
B. Weaknesses of the global economic regimes from an LDC perspective .................................................851. Missing elements ....................................................................................................................................................852. Inappropriate models of finance, trade and technology .........................................................................................873. Weak country ownership and lack of policy space ................................................................................................974. Lack of policy coherence .......................................................................................................................................98
C. A new international development architecture for LDCs: Pillars, principles and processes ...............991. The overall architecture ..........................................................................................................................................992. The pillars of a NIDA ...........................................................................................................................................1003. Principles of the NIDA for LDCs.........................................................................................................................1024. Processes for the design of the NIDA ..................................................................................................................102
D. A paradigm shift towards new development paths ................................................................................1031. Development of productive capacities .................................................................................................................1032. The importance of a developmental State ............................................................................................................105
E. The role of special international support mechanisms for LDCs .........................................................1071. The original role ..................................................................................................................................................1072. Reaffirming the role of international support mechanisms ..................................................................................1083. Avoiding the substitution of ISMs for global economic reforms ......................................................................... 111
F. Conclusions ................................................................................................................................................. 112
Notes ................................................................................................................................................................ 113
References ....................................................................................................................................................... 113
Chapter 4
THE COMING DECADE AND AN AGENDA FOR ACTION TO CREATE A NIDA FOR LDCS ....................................... 115
A. Introduction ............................................................................................................................................... 115
B. Global scenarios for 2011–2020 and policy simulations for LDCs ....................................................... 1151. Baseline projections .............................................................................................................................................1182. Policy scenarios ....................................................................................................................................................1203. Impact of delayed recovery on the baseline and policy scenarios ......................................................................124
C. New international factors ........................................................................................................................1251. Climate change .....................................................................................................................................................1252. New economic relationships between LDCs and other developing countries ..................................................132
D. An agenda for action to create a NIDA for LDCs ..................................................................................1441. Finance .................................................................................................................................................................1442. Trade .....................................................................................................................................................................1453. Commodities .......................................................................................................................................................1474. Technology ...........................................................................................................................................................1485. Climate change adaptation and mitigation ..........................................................................................................1496. South-South development cooperation ................................................................................................................149

viiContents
Notes ................................................................................................................................................................151
References .......................................................................................................................................................152
Chapter 5
AN AGENDA FOR ACTION: (I) FINANCE AND (II) TRADE .....................................................................................155
A. Finance .......................................................................................................................................................1551. Promoting domestic financial resource mobilization ..........................................................................................1562. Innovative sources of finance ...............................................................................................................................1593. Enhancing country ownership of national development strategies .....................................................................1624. Innovative uses of aid to promote the development of productive capacities .....................................................1665. The continuing need for debt relief in LDCs .....................................................................................................1696. The need for compensatory financing for shocks .............................................................................................171
B. Trade ..........................................................................................................................................................1741. The “early harvest” for LDCs emerging from the Doha negotiations .................................................................1752. Empowering LDCs to use flexibilities provided under WTO rules ....................................................................1813. Accelerating the provision of aid for trade ..........................................................................................................187
Notes ................................................................................................................................................................188
References .......................................................................................................................................................188
Chapter 6
AN AGENDA FOR ACTION: (III) COMMODITIES AND (IV) TECHNOLOGY ..............................................................191
A. Commodities ..............................................................................................................................................1911. International support mechanisms for commodity price stabilization .................................................................1932. Domestic resource generation and revenue management ....................................................................................199
B. Technology ................................................................................................................................................2031. Introduction ..........................................................................................................................................................2032. How article 66.2 of the TRIPS agreement can work for LDCs ...........................................................................2093. LDC-specific international support mechanisms for technology and knowledge sharing ...................................211
Notes ................................................................................................................................................................222
References .......................................................................................................................................................222
Chapter 7
AN AGENDA FOR ACTION: (V) CLIMATE CHANGE AND (VI) SOUTH-SOUTH DEVELOPMENT COOPERATION ............................................................................................225
A. Financing climate change adaptation and mitigation in LDCs ............................................................2251. Enhancing the sustainability and predictability of climate-change-related financing .........................................2272. Developing accountable, transparent and representative Climate Fund governance ...........................................2323. Developing renewable energy opportunities ........................................................................................................2354. A constructive approach to REDD .......................................................................................................................237

The Least Developed Countries Report 2010viii
B. South-south economic relations involving LDCs....................................................................................2401. Finance .................................................................................................................................................................2412. Trade ....................................................................................................................................................................2463. Commodities ........................................................................................................................................................2494. Knowledge-sharing and technology transfer .......................................................................................................2505. Climate change ....................................................................................................................................................253
Notes ................................................................................................................................................................254
References .......................................................................................................................................................255
List of Boxes
1. The economic boom of 2002–2007 in a long-term perspective .....................................................................................9 2. A tale of two slowdowns: Cambodia and Mozambique ................................................................................................26 3. Fiscal policy responses in sub-Saharan African LDCs ..................................................................................................27 4. The new poverty estimates .............................................................................................................................................33 5. Special and differential treatment provisions in WTO agreements ...............................................................................64 6. Technological capabilities and physical infrastructure in LDCs ...................................................................................94 7. Recent developments in IMF and World Bank contingency financing facilities open to LDCs .................................172 8. The Dar es Salaam Declaration of Trade Ministers of LDCs ......................................................................................176 9. Selected issues in DFQF market access .......................................................................................................................178 10. Rules of origin ..............................................................................................................................................................179 11. Trade policy and the optimal degree of openness of LDCs .........................................................................................185 12. Progress under the WIPO Development Agenda .........................................................................................................204 13. Principles for IP-related technical assistance to LDCs ................................................................................................210 14. Institutional limitations to technological learning in LDCs .........................................................................................212 15. Differences among developing-country partners of LDCs ..........................................................................................240 16. Increasing the development impact of FDI in agriculture ...........................................................................................245 17. Quality Chemicals-Cipla Collaboration in Uganda: An example of South-South cooperation ...................................253
List of Charts
1 Merchandise trade indices, 2000–2008 ............................................................................................................................6 2 Capital inflows and remittances to LDCs, 1990–2008 ....................................................................................................7 3 Investment and savings in LDCs, 1995–2008 ............................................................................................................... 11 4 Savings and depletion of natural resources in LDCs, 1990–2008 ...........................................................................12 5 Per capita imports of machinery and transport equipment ............................................................................................14 6 GDP per person employed, 1991–2008 .........................................................................................................................14 7 Agricultural productivity in LDCs, 1990–2008 .............................................................................................................15 8 Concentration indices of exports of country groups, 2009 ............................................................................................17 9 LDCs’ output growth, 2005–2010 .................................................................................................................................18 10 Percentage change in LDCs non-oil merchandise exports to main trade partners, 2008–2009 ....................................22

ixContents
11 Change in remittances to LDCs, 2008–2009 .................................................................................................................25 12 Poverty trends in African and Asian LDCs, 1980–2007 ................................................................................................33 13 Selected MDG indicators and projections for LDCs and developing countries, 1990–2015 ........................................37 14 DAC countries’ aid to LDCs, 1990–2008 ......................................................................................................................54 15 Net ODA from individual DAC member countries to LDCs, 1990, 2000 and 2008 .....................................................55 16 Aid for trade commitments to LDCs and ODCs, 1995–2008 ........................................................................................69 17 Priority climate change adaptation projects identified in NAPAs through the LDCF by sector,
as of November 2009 .....................................................................................................................................................73 18 FDI inflows and prifit remittances on FDI in LDCs, 1988–2008 ..................................................................................88 19 Aid commitments and disbursements to LDCs, 1995–2008 .........................................................................................89 20 Average MFN tariffs for country groups .......................................................................................................................91 21 Frequency distribution of MFN tariffs, by country groups ............................................................................................92 22 Patent applications in LDCs by residents and non-residents, 1990–2007 .....................................................................94 23 The New International Development Architecture for LDCs and the global economic regimes ..................................99 24 The New International Development Architecture for LDCs ......................................................................................101 25 Carbon dioxide emissions per capita, 1980–2008 .......................................................................................................126 26 Top 10 per capita GHG emitters among LDCs, 2008 ..................................................................................................127 27 LDC GHG emissions by sector, 2005 ..........................................................................................................................127 28 World temperature and natural disasters in LDCs, 1960–2009 ...................................................................................128 29 Percentage of people in LDCs affected by floods, droughts and storms, 1970–2010 .................................................132 30 LDC trade with major partner groups, 1980–2008 ......................................................................................................133 31 Composition of LDC exports, by major trade partner groups, 2007–2008 .................................................................136 32 Index of diversification of LDC exports in bilateral trade with major partner groups, 2007–2008 ............................137 33 Inward FDI in LDCs, by groups of country of origin of investor, 1999–2001 and 2006–2008 ..................................138 34 Debt burden in LDCs ...................................................................................................................................................170 35 Bound and applied MFN tariffs of LDC WTO members ............................................................................................183 36 Price volatility for selected commodity groups, 2000–2010 .......................................................................................191 37 Access of enterprises to finance in Africa ....................................................................................................................216 38 The mosaic of private sector development (PSD) instruments ....................................................................................216 39 Different domains of donor practice in financing enterprise development ..................................................................217 40 UNFCCC and non-UNFCCC channels of climate-related financing ..........................................................................231 41 Electricity consumption in LDCs and ODCs, 1990–2007 ..........................................................................................235 42 LDC CDM projects, by sector .....................................................................................................................................236
Box Charts
1 GDP per capita growth in LDCs and other groups of countries ......................................................................................92 Changes in fiscal policy variables in selected LDCs, 2008–2009 .................................................................................273 Selected knowledge indicators for LDCs, ODCs and developed countries, 2005–2009 ...............................................954 LDC net enrolment rates in primary, secondary and tertiary education, 2000–2008 ....................................................955 Selected physical infrastructure indicators in LDCs, ODCs and developed countries ..................................................96

The Least Developed Countries Report 2010x
List of Tables
1. Comparison of GDP growth rates in LDCs before and during the boom period, 1991–2008 .........................................4 2. Real GDP and real GDP per capita growth rates of LDCs, 2002–2008 ..........................................................................5 3 Structural change in the composition of output in LDCs, 2000–2008 ..........................................................................12 4 Impact of the crisis on country growth ..........................................................................................................................18 5 Peak and trough world commodity price indices, 2008–2009 ......................................................................................20 6 Rates of change of FDI inflows to LDCs between 2008 and 2009 ................................................................................23 7 Overall shock to LDCs current account, 2005–2009 .....................................................................................................29 8 Extent of debt vulnerability in LDCs .............................................................................................................................31 9 Country programmable aid to LDCs, 2008–2011 ..........................................................................................................32 10 Poverty trends in individual LDCs, 1990–2007 ............................................................................................................34 11 Millenium Development Goal progress by country .......................................................................................................38 12 Status of LDCs’ ongoing WTO accession negotiations .................................................................................................58 13 Preferential market access measures in favour of LDCs ...............................................................................................60 14 Proportion of total developed country imports from developing countries and LDCs admitted free of duty
(excluding arms and oil) ................................................................................................................................................61 15 Average tariffs imposed by developed countries on agricultural products and textiles and clothing
from developing countries and the LDCs ......................................................................................................................62 16 Aid for Trade disbursements and IF/EIF expenditures, 2002–2008 ..............................................................................67 17 Status of IF and EIF activities and funding, as of June 2010 ........................................................................................68 18 IMF programmes in LDCs, 2000–2010 .........................................................................................................................98 19 Per capita income for high-, middle- and low-income blocs, 1970 and 2008 ............................................................. 117 20 Sources of foreign exchange, 2008 .............................................................................................................................. 118 21 Baseline projections for LDCs: population, income and exports per capita, 2010–2020 ............................................ 119 22 Accelerated growth targets for LDCs, 2015 and 2020.................................................................................................121 23 Projected income per capita of LDC blocs according to alternative types of policy, 2010, 2015 and 2020 ...............123 24 Impact of delayed recovery from global recession on simulated scenarios .................................................................125 25 LDC climate change vulnerabilities and regional impacts ..........................................................................................130 26 Incidence and total number of people affected by extreme weather events in LDCs, 1970–2010 ..............................131 27 Top 10 LDCs in terms of incidence of extreme weather events 1980–2010 ...............................................................132 28 LDCs’ trade with major partner groups, 1995–1996 and 2007–2008..........................................................................134 29 LDCs’ total trade with major developing trade partners, 2007–2008 ..........................................................................135 30 Trade of LDCs by region with major partner groups, 2007–2008 ...............................................................................135 31 Main features of Southern development cooperation with LDCs ...............................................................................139 32 Impacts on LDCs’ development of their economic relations with major developing country partners ......................141 33 An agenda for action towards a New International Development Architecture for the least developed countries .....146 34 New SDR allocation to LDCs in 2009 .........................................................................................................................161 35 IMF conditionalities in LDCs during the 2008–2009 crisis ........................................................................................164 36 Greenhouse development rights: Results for LDCs and other groups ........................................................................226 37 Options for financing climate change adaptation and mitigation for developing countries ........................................229
Box Tables
1 Growth accelerations and decelerations in different groups of countries ........................................................................92 Differences between LDCs and their main developing country partner groups, 2007–2008 ......................................240

xiContents
Explanatory Notes
The term “dollars” ($) refers to United States dollars unless otherwise stated. The term “billion” signifies 1,000 million.Annual rates of growth and changes refer to compound rates. Exports are valued f.o.b. (free on board) and imports c.i.f.
(cost, insurance, freight) unless otherwise specified.Use of a dash (–) between dates representing years, e.g. 1981–1990, signifies the full period involved, including the initial
and final years. An oblique stroke (/) between two years, e.g. 1991/92, signifies a fiscal or crop year.The term “least developed country” (LDC) refers, throughout this report, to a country included in the United Nations list of
least developed countries.
In the tables:
Two dots (..) indicate that the data are not available, or are not separately reported.One dot (.) indicates that the data are not applicable.A hyphen (-) indicates that the amount is nil or negligible.Details and percentages do not necessarily add up to totals, because of rounding.

The Least Developed Countries Report 2010xii
AbbreviationsACP African Caribbean and Pacific (group of countries)AfT Aid for TradeAFTA ASEAN Free Trade AreaAGOA African Growth and Opportunity Act (United States)AOSIS Alliance of Small Island StatesAPRM African Peer Review MechanismARV antiretroviral (drug)ASEAN Association of Southeast Asian NationsBPOA Brussels Programme of Action for the Least Developed Countries for the Decade 2001–2010CARICOM Caribbean CommunityCCFF Compensatory and Contingent Financing FacilityCCL countrercyclical loanCDM Clean Development MechanismCDP Committee for Development PolicyCER certified emission reductionCFC Common Fund for CommoditiesCFF Compensatory Financing FacilityCLACC Capacity Strengthening of LDCs for Adaptation to Climate ChangeCO2 carbon dioxideCOMESA Common Market for Eastern and Southern AfricaCOP Conference of the Parties CPA country programmable aidCPIA Country Policy and Institutional AssessmentCRED Centre for Research on the Epidemiology of DisastersCRW crisis response windowDAC Development Assistance CommitteeDANIDA Danish International Development AgencyDFQF duty-free and quota-freeDSF debt sustainability frameworkDTIS Diagnostic Trade Integration StudyEAC East African CommunityEAEC Eurasian Economic CommunityEBA Everything But Arms EC European CommissionECCAS Economic Community of Central African States ECF Extended Credit FacilityECOWAS Economic Community of West African StatesEIF Enhanced Integrated Framework for Trade-Related Technical Assistance EITI Extractive Industries Transparency InitiativeEM-DAT Emergency Events DatabaseEPA Economic Partnership AgreementESAF Enhanced Structural Adjustment FacilityESF Exogenous Shock FacilityEU European UnionEVI Economic Vulnerability IndexFAO Food and Agriculture Organization of the United NationsFCPF Fores Carbon Partnership FacilityFDI foreign direct investmentFOCAC Forum on China-Africa CooperationFOEI Friends of Earth InternationalFRIS Forest Retention Incentive SchemeFTA free trade agreement

xiiiContents xiii
GATS General Agreement on Trade in ServicesGCC Gulf Cooperation CouncilGCFM Global Climate Financing MechanismGDP gross domestic productGDRFC Greenhouse Development Rights Framework and the Responsibility-Capacity (Index)GEF Global Environment FacilityGERD gross expenditure on research and developmentGFCF gross fixed capital formationGHG greenhouse gasGISS Goddard Institute for Space StudiesGNI gross national incomeGPM Global Policy ModelGSP Generalized System of PreferencesGSTP Global System of Trade PreferencesGTZ German Society for Technical CooperationHIPC heavily indebted poor country (also HIPC initiative)HS Harmonized SystemIBRD International Bank for Reconstruction and DevelopmentIBSA India-Brazil-South Africa PartnershipICA international commodity agreementICT information and communication technologyIDA International Development AssociationIF Integrated Framework for Trade-Related Technical Assistance to Least Developed CountriesIFAD International Fund for Agricultural DevelopmentIFI international financial institutionIFPRI International Food Policy Research InstituteIIED International Institute for Environment and DevelopmentILO International Labour OrganizationIMF International Monetary FundIPCC Intergovernmental Panel on Climate ChangeIPR intellectual property rightIsDB Islamic Developmetn BankISM international support mechanismITC International Trade Centre UNCTAD/WTOLDC least developed countryLDCF Least Developed Countries FundLEG LDC Expert GroupMDB multilateral development bankMDG Millennium Development GoalMDRI Multilateral Debt Relief InitiativeMDTP major developing trade partnerMercosur Southern Common MarketMIGA Multilateral Investment Guarantee AgencyMRV Measurement, reporting and verificationMt megatonn.e.s. not elsewhere specifiedNAPA national adaptation programme of actionNBER National Bureau of Economic ResearchNEPAD New Partnership for Africa’s DevelopmentNGO non-governmental organizationNIDA New International Development ArchitectureNTB non-tariff barrierODA official development assistanceODC other developing country

The Least Developed Countries Report 2010xiv
ODI Overseas Development InstituteOECD Organisation for Economic Co-operation and DevelopmentOFDA Office of Foreign Disaster Assistance of the US Agency for International Development (USAID) OHRLLS Office of the High Representative for the Least Developed Countries, Landlocked Developing Countries
and Small Island Developing StatesPICTA Pacific Island Countries Trade AgreementPPP purchasing power parityPRGF Poverty Reduction and Growth FacilityPRSP Poverty Reduction Strategy PaperPSI Policy Support InstrumentR&D research and developmentRCI Responsibility and Capacity IndexREC regional economic communityREDD reduce emissions from deforestation and forest degradationRING International Networking GroupRoO rule(s) of originRTA regional trade agreement/arrangementS&T science and technologySAARC South Asian Association for Regional CooperationSACU Southern African Customs UnionSADC Southern African Development CommunitySAF Structural Adjustment FacilitySAP structural adjustment programmeSAPTA SAARC Preferential Trade ArrangementSBA Stand-By ArrangementSCF Standby Credit FacilitySCM Subsidies and Countervailing Measures (WTO Agreement)SDI Spatial Development InitiativeSDR special drawing rightSDT special and differential treatmentSIDS small island developing State(s)SMART System of Market Access and Restrictions on TradeSME small and medium-sized enterpriseSPS sanitary and phytosanitary (WTO Agreement on the Application of Sanitary and Phytosanitary
Measures)SSA sub-Saharan AfricaSSM special safeguard mechanismSTI science, technology and innovationTBT technical barrier to tradeTNC transnational corporationTRIPS Trade-Related Aspects of Intellectual Property Rights (also WTO TRIPS Agreement)UEMOA West African Economic and Monetary UnionUMA Arab Maghreb UnionUNCTAD United Nations Conference on Trade and DevelopmentUN-DESA United Nations Department of Economic and Social AffairsUNDP United Nations Development ProgrammeUNESCO United Nations Educational, Scientific and Cultural OrganizationUNFCCC United Nations Framework Convention on Climate Change WB World BankWFP World Food ProgrammeWIPO World Intellectual Property OrganizationWITS World Integrated Trade SolutionWRI World Resources InstituteWTO World Trade OrganizationZCCM Zambia Consolidated Copper Mines
xvContents
Classifications used in this Report
Least developed countries
Geographical/structural classification
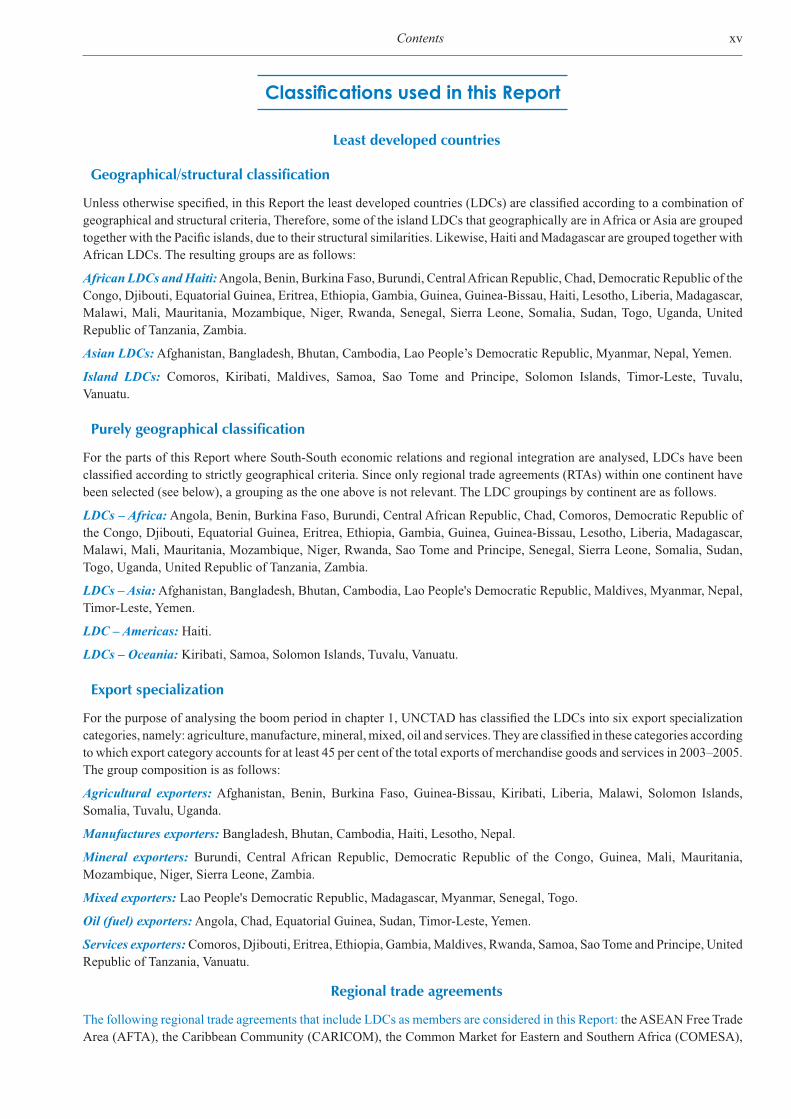
Unless otherwise specified, in this Report the least developed countries (LDCs) are classified according to a combination of geographical and structural criteria, Therefore, some of the island LDCs that geographically are in Africa or Asia are grouped together with the Pacific islands, due to their structural similarities. Likewise, Haiti and Madagascar are grouped together with African LDCs. The resulting groups are as follows:
African LDCs and Haiti: Angola, Benin, Burkina Faso, Burundi, Central African Republic, Chad, Democratic Republic of the Congo, Djibouti, Equatorial Guinea, Eritrea, Ethiopia, Gambia, Guinea, Guinea-Bissau, Haiti, Lesotho, Liberia, Madagascar, Malawi, Mali, Mauritania, Mozambique, Niger, Rwanda, Senegal, Sierra Leone, Somalia, Sudan, Togo, Uganda, United Republic of Tanzania, Zambia.
Asian LDCs: Afghanistan, Bangladesh, Bhutan, Cambodia, Lao People’s Democratic Republic, Myanmar, Nepal, Yemen.
Island LDCs: Comoros, Kiribati, Maldives, Samoa, Sao Tome and Principe, Solomon Islands, Timor-Leste, Tuvalu, Vanuatu.
Purely geographical classification
For the parts of this Report where South-South economic relations and regional integration are analysed, LDCs have been classified according to strictly geographical criteria. Since only regional trade agreements (RTAs) within one continent have been selected (see below), a grouping as the one above is not relevant. The LDC groupings by continent are as follows.
LDCs – Africa: Angola, Benin, Burkina Faso, Burundi, Central African Republic, Chad, Comoros, Democratic Republic of the Congo, Djibouti, Equatorial Guinea, Eritrea, Ethiopia, Gambia, Guinea, Guinea-Bissau, Lesotho, Liberia, Madagascar, Malawi, Mali, Mauritania, Mozambique, Niger, Rwanda, Sao Tome and Principe, Senegal, Sierra Leone, Somalia, Sudan, Togo, Uganda, United Republic of Tanzania, Zambia.
LDCs – Asia: Afghanistan, Bangladesh, Bhutan, Cambodia, Lao People's Democratic Republic, Maldives, Myanmar, Nepal, Timor-Leste, Yemen.
LDC – Americas: Haiti.
LDCs – Oceania: Kiribati, Samoa, Solomon Islands, Tuvalu, Vanuatu.
Export specialization
For the purpose of analysing the boom period in chapter 1, UNCTAD has classified the LDCs into six export specialization categories, namely: agriculture, manufacture, mineral, mixed, oil and services. They are classified in these categories according to which export category accounts for at least 45 per cent of the total exports of merchandise goods and services in 2003–2005. The group composition is as follows:
Agricultural exporters: Afghanistan, Benin, Burkina Faso, Guinea-Bissau, Kiribati, Liberia, Malawi, Solomon Islands, Somalia, Tuvalu, Uganda.
Manufactures exporters: Bangladesh, Bhutan, Cambodia, Haiti, Lesotho, Nepal.
Mineral exporters: Burundi, Central African Republic, Democratic Republic of the Congo, Guinea, Mali, Mauritania, Mozambique, Niger, Sierra Leone, Zambia.
Mixed exporters: Lao People's Democratic Republic, Madagascar, Myanmar, Senegal, Togo.
Oil (fuel) exporters: Angola, Chad, Equatorial Guinea, Sudan, Timor-Leste, Yemen.
Services exporters: Comoros, Djibouti, Eritrea, Ethiopia, Gambia, Maldives, Rwanda, Samoa, Sao Tome and Principe, United Republic of Tanzania, Vanuatu.
Regional trade agreements
The following regional trade agreements that include LDCs as members are considered in this Report: the ASEAN Free Trade Area (AFTA), the Caribbean Community (CARICOM), the Common Market for Eastern and Southern Africa (COMESA),

The Least Developed Countries Report 2010xvi
the Economic Community of Central African States (ECCAS), the Economic Community of West African States (ECOWAS), the Pacific Island Countries Trade Agreement (PICTA), the Southern African Development Community (SADC), the SAARC Preferential Trading Arrangement (SAPTA) and the Arab Maghreb Union (UMA). For the purpose of this Report, countries (both LDCs and non-LDCs) have been considered uniquely as members of the one RTA with which they had the highest trade flows during the period 1995–2008, although they may be members of more than one RTA. Their membership as considered here is listed below (LDC members in italics):
AFTA: Brunei Darussalam, Cambodia, Indonesia, Lao People's Democratic Republic, Malaysia, Myanmar, Philippines, Singapore, Thailand, Viet Nam.
CARICOM: Antigua and Barbuda, Bahamas, Barbados, Belize, Dominica, Grenada, Guyana, Haiti, Jamaica, Montserrat, Saint Kitts and Nevis, Saint Lucia, Saint Vincent and the Grenadines, Suriname, Trinidad and Tobago.
COMESA: Burundi, Comoros, Djibouti, Egypt, Eritrea, Ethiopia, Kenya, Rwanda, Sudan, Uganda.
ECCAS: Cameroon, Central African Republic, Chad, Congo, Equatorial Guinea, Gabon, Sao Tome and Principe.
ECOWAS: Benin, Burkina Faso, Cape Verde, Côte d'Ivoire, Gambia, Ghana, Guinea, Guinea-Bissau, Liberia, Mali, Niger, Nigeria, Senegal, Sierra Leone, Togo.
PICTA: Cook Islands, Federated States of Micronesia, Fiji, Kiribati, Nauru, Niue, Papua New Guinea, Samoa, Solomon Islands, Tonga, Tuvalu, Vanuatu.
SADC: Angola, Botswana, Democratic Republic of the Congo, Lesotho, Madagascar, Malawi, Mauritius, Mozambique, Namibia, Seychelles, South Africa, Swaziland, United Republic of Tanzania, Zambia, Zimbabwe.
SAPTA: Afghanistan, Bangladesh, Bhutan, India, Maldives, Nepal, Pakistan, Sri Lanka.
UMA: Algeria, Libyan Arab Jamahiriya, Mauritania, Morocco, Tunisia.
The following LDCs are not members of any of the selected RTAs: Somalia, Timor-Leste and Yemen.
Country classification – Other country groups
Other developing countries: All developing countries (as classified by the United Nations) that are not LDCs.
Major developing trade partners of the LDCs (MDTPs): Brazil, China, India, Republic of Korea, Saudi Arabia, Singapore, South Africa, Taiwan Province of China, Thailand, United Arab Emirates.
The following MDTPs are also members of some of the RTAs selected for analysis: Singapore and Thailand (AFTA), South Africa (SADC) and India (SAPTA). Their bilateral trade and investment flows with LDC members of the same RTA have been aggregated as RTA partner flows, while their bilateral trade flows with other LDCs have been aggregated as MDTP flows.
Developing countries not elsewhere specified (n.e.s.): All developing countries that are neither MDTPs nor RTA partners (see below).
Other economies: transition economies and countries not elsewhere specified.
Middle-income countries and high-income countries: The classification used is that of the World Bank, available at: http://data.worldbank.org/about/country-classifications/country-and-lending-groups.
Advanced economies and emerging and developing economies: The classification used is that of the International Monetary Fund in the Statistical Appendix of the World Economic Outlook 2010, available at: http://www.imf.org/external/pubs/ft/weo/2010/01/pdf/statapp.pdf.
Product classification
The figures provided below are the codes used in the Standard International Trade Classification (SITC), revision 3.
Commodities:
1. Fuels: 32. Non-fuel commodities: 0 +1 +2 +4 +667 +68 +97
Manufactures:
1. Labour- and resource-intensive manufactures: 61 +63 +64 +65 +66 -667 +82 +83 +84 +852. Low, medium and high skill- and technology-intensive manufactures: 5 +6 -61 -63 -64 -65 -66 -68 +7 +8 -82 -83 -84 -85

OVERVIEW
INTRODUCTION
Over the past three decades, the LDCs have been following a development strategy designed to release the creative potential of market forces by reducing the role of the State in the development process. For the first two of those decades, there was little indication that this strategy was working. But after the turn of the millennium, with the emergence of new Asian growth drivers and favourable movements in the terms of trade, economic growth began to accelerate. Some observers attributed this to the market-oriented policy reforms undertaken by a number of LDCs, though others raised doubts about their pattern of growth. Surging commodity prices, in some cases driven by speculative investment, debt forgiveness, increased aid flows, remittances and foreign direct investment (FDI) seemed vulnerable to a global economic downturn. There were also concerns that growth was not translating into substantial improvement in human well-being. When commodity prices suddenly fell at the end of 2008, heralding a bust in the global economic cycle, many LDCs experienced a sharp slowdown, with major adverse social consequences. It was clear from this that markets are not only creative but also can be destructive.
As discussed in previous LDC Reports, the LDCs have remained marginal in the world economy owing to their structural weaknesses and the form of their integration into the global economy. Unless both these aspects are directly addressed, they will remain marginal and their vulnerability to external shocks and pressures will persist. Unfortunately, existing special international support measures for LDCs do not effectively address the structural weaknesses of these countries or how the LDCs interact with the global economic system. Therefore it is hardly surprising that during the past three decades only two countries were able to graduate from the LDC status and in fact the number of countries falling in the LDC category has doubled.
The basic message of this Report is that for achieving accelerated development and poverty reduction in LDCs, there is need not only for improved international support mechanisms (ISMs) which are specifically targeted at the LDCs but also for a new international development architecture (NIDA) for the LDCs. The NIDA for LDCs is defined as a new set of formal and informal institutions, rules and norms, including incentives, standards and processes, which would shape international economic relations in a way that is conducive to sustained and inclusive development in LDCs. This includes reforms of the global economic regimes which directly affect development and poverty reduction in LDCs, as well as the design of a new generation of special international support mechanisms for the LDCs that would address their specific structural constraints and vulnerabilities. In addition, given the increasing importance of South-South flows of trade, FDI, official finance and knowledge, South-South development cooperation, both within regions and between LDCs and large, fast-growing developing countries, should play an important role in the proposed NIDA for LDCs. Such cooperation should also include some ISMs for LDCs.
The Report proposes five major pillars for the NIDA: finance, trade, commodities, technology, and climate change adaptation and mitigation. At present, the focus of support for LDCs is mainly in the area of trade. The Report argues that there is need for more and new forms of financial assistance to support domestic resource mobilization and the emergence of a profit-investment nexus in the LDCs involving the domestic private sector. Technology and commodities, which at present are neglected issues, should be among the core pillars of the new architecture for LDCs. Climate change adaptation and mitigation should also be made a new priority. Development partners need to enhance coherence between the different domains of the international architecture, particularly between trade and finance, and they also need to honour their commitments to ensure that the interests of the LDCs themselves are taken into account in these areas.
The term “international support mechanism” (ISM) is used in this Report, rather than “international support measure”, to convey the idea that providing special international support for LDCs is not simply a matter of designing new policy measures but also ensuring the financial and institutional means through which these measures are implemented. The Report shows that existing international support measures have had largely symbolic, rather than practical, development effects. They do not address the structural weaknesses of the LDCs.
The Least Developed Countries Report 2010II
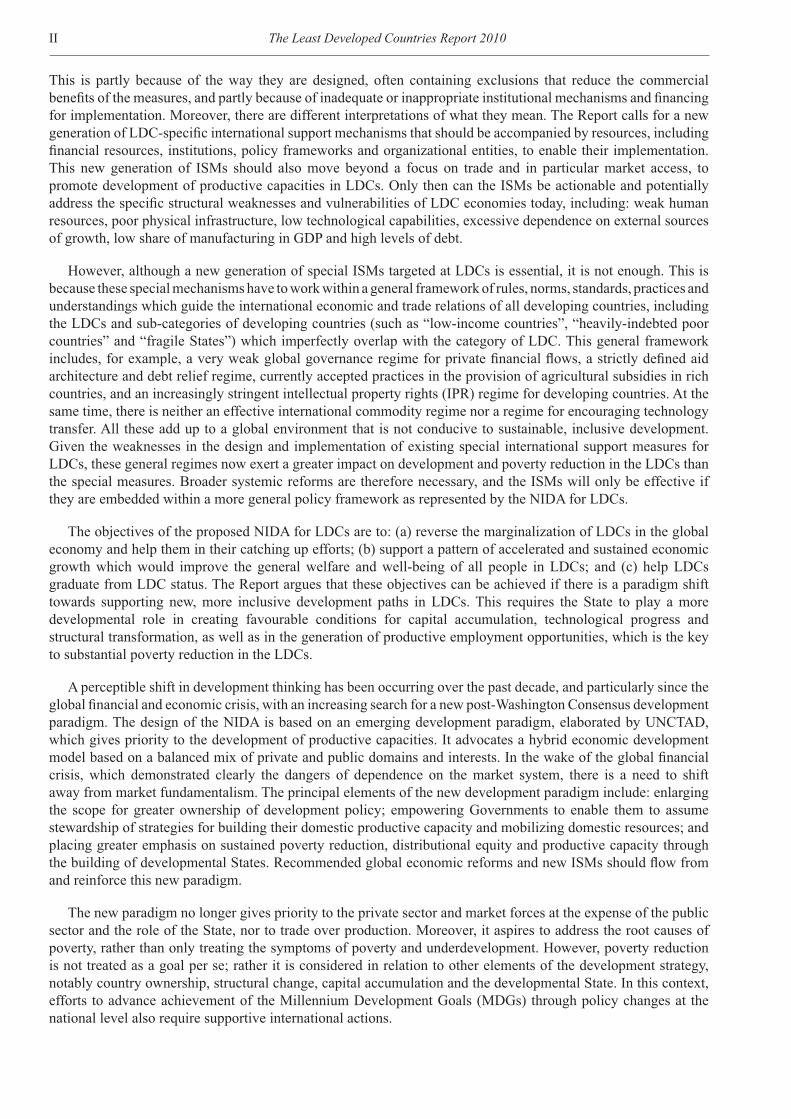
This is partly because of the way they are designed, often containing exclusions that reduce the commercial benefits of the measures, and partly because of inadequate or inappropriate institutional mechanisms and financing for implementation. Moreover, there are different interpretations of what they mean. The Report calls for a new generation of LDC-specific international support mechanisms that should be accompanied by resources, including financial resources, institutions, policy frameworks and organizational entities, to enable their implementation. This new generation of ISMs should also move beyond a focus on trade and in particular market access, to promote development of productive capacities in LDCs. Only then can the ISMs be actionable and potentially address the specific structural weaknesses and vulnerabilities of LDC economies today, including: weak human resources, poor physical infrastructure, low technological capabilities, excessive dependence on external sources of growth, low share of manufacturing in GDP and high levels of debt.
However, although a new generation of special ISMs targeted at LDCs is essential, it is not enough. This is because these special mechanisms have to work within a general framework of rules, norms, standards, practices and understandings which guide the international economic and trade relations of all developing countries, including the LDCs and sub-categories of developing countries (such as “low-income countries”, “heavily-indebted poor countries” and “fragile States”) which imperfectly overlap with the category of LDC. This general framework includes, for example, a very weak global governance regime for private financial flows, a strictly defined aid architecture and debt relief regime, currently accepted practices in the provision of agricultural subsidies in rich countries, and an increasingly stringent intellectual property rights (IPR) regime for developing countries. At the same time, there is neither an effective international commodity regime nor a regime for encouraging technology transfer. All these add up to a global environment that is not conducive to sustainable, inclusive development. Given the weaknesses in the design and implementation of existing special international support measures for LDCs, these general regimes now exert a greater impact on development and poverty reduction in the LDCs than the special measures. Broader systemic reforms are therefore necessary, and the ISMs will only be effective if they are embedded within a more general policy framework as represented by the NIDA for LDCs.
The objectives of the proposed NIDA for LDCs are to: (a) reverse the marginalization of LDCs in the global economy and help them in their catching up efforts; (b) support a pattern of accelerated and sustained economic growth which would improve the general welfare and well-being of all people in LDCs; and (c) help LDCs graduate from LDC status. The Report argues that these objectives can be achieved if there is a paradigm shift towards supporting new, more inclusive development paths in LDCs. This requires the State to play a more developmental role in creating favourable conditions for capital accumulation, technological progress and structural transformation, as well as in the generation of productive employment opportunities, which is the key to substantial poverty reduction in the LDCs.
A perceptible shift in development thinking has been occurring over the past decade, and particularly since the global financial and economic crisis, with an increasing search for a new post-Washington Consensus development paradigm. The design of the NIDA is based on an emerging development paradigm, elaborated by UNCTAD, which gives priority to the development of productive capacities. It advocates a hybrid economic development model based on a balanced mix of private and public domains and interests. In the wake of the global financial crisis, which demonstrated clearly the dangers of dependence on the market system, there is a need to shift away from market fundamentalism. The principal elements of the new development paradigm include: enlarging the scope for greater ownership of development policy; empowering Governments to enable them to assume stewardship of strategies for building their domestic productive capacity and mobilizing domestic resources; and placing greater emphasis on sustained poverty reduction, distributional equity and productive capacity through the building of developmental States. Recommended global economic reforms and new ISMs should flow from and reinforce this new paradigm.
The new paradigm no longer gives priority to the private sector and market forces at the expense of the public sector and the role of the State, nor to trade over production. Moreover, it aspires to address the root causes of poverty, rather than only treating the symptoms of poverty and underdevelopment. However, poverty reduction is not treated as a goal per se; rather it is considered in relation to other elements of the development strategy, notably country ownership, structural change, capital accumulation and the developmental State. In this context, efforts to advance achievement of the Millennium Development Goals (MDGs) through policy changes at the national level also require supportive international actions.

IIIOverview
A major lesson emerging from the global financial and economic crisis and the subsequent policy response is that global economic reforms are necessary for achieving more stable and sustained global prosperity. Global income inequality is closely related to the global imbalances that have been directly implicated in the crisis. These imbalances need to be addressed in the systemic reforms designed to reduce overall economic volatility and to ensure that finance is directed more to the real economy than to the speculative leveraging of financial assets. The NIDA for LDCs should be a part of this broader set of systemic reforms that need to be taken in the wake of the financial crisis and global recession, which would be beneficial for all countries, both developed and developing.
Thus the new generation of special ISMs for LDCs should be located and contextualized as part of a larger agenda that includes reforming global governance and enhancing the effectiveness of the international development architecture for all developing countries. Marrying international support mechanisms for LDCs with a new international policy and cooperation framework that can deliver a more stable, equitable and inclusive global governance regime for all countries is one of the most urgent challenges facing the international community today. Doing so will not only help make special international support for LDCs more effective, it will also contribute to mainstreaming LDC issues into a wider development agenda.
THE BOOM-BUST EXPERIENCE OF LDCS OVER THE PAST DECADE
The fragility of the economic boom of 2000–2007
During the period 2002–2007, the real gross domestic product (GDP) of the LDCs as a group grew by more than 7 per cent per annum. This was the strongest and longest growth acceleration achieved by this group of countries since 1970, and a much better overall macroeconomic performance than in the 1990s. However, not all LDCs experienced a boom: a little over a quarter of the LDCs (14 countries) saw GDP per capita decline or grow sluggishly. Moreover, because of the high rate of population growth in the LDCs, the per capita GDP growth rate, which matters more for human well-being, remained slightly lower than that of other developing countries. Nevertheless, over this boom period the target growth rate of the Brussels Programme of Action for the Least Developed Countries for the Decade 2001–2010 (BPOA) was achieved in the LDCs as a group and also in 16 LDCs.
The economic boom was driven by record levels of exports, FDI inflows and migrants’ remittances, although these were unevenly distributed amongst the LDCs. Rising commodity prices, particularly for oil and minerals, were particularly important as a driver of GDP growth. But the economic boom in the LDCs was systemically unsustainable because it was founded on a pattern of global expansion that was leading to increasing global imbalances, widening income inequality and rising levels of private debt without a concomitant development of real assets. The pattern of economic growth in LDCs was increasingly exposing them to economic shocks, and it was not associated with substantial poverty reduction and strong progress towards realizing the MDGs. Using new poverty estimates specially prepared for this Report, it is apparent that over 50 per cent of the population of the LDCs still lived in extreme poverty at the end of the boom period. Moreover, these estimates also suggest that the number of extremely poor people living in LDCs actually increased by over 3 million per year during the 2002–2007 period of high GDP growth rates.
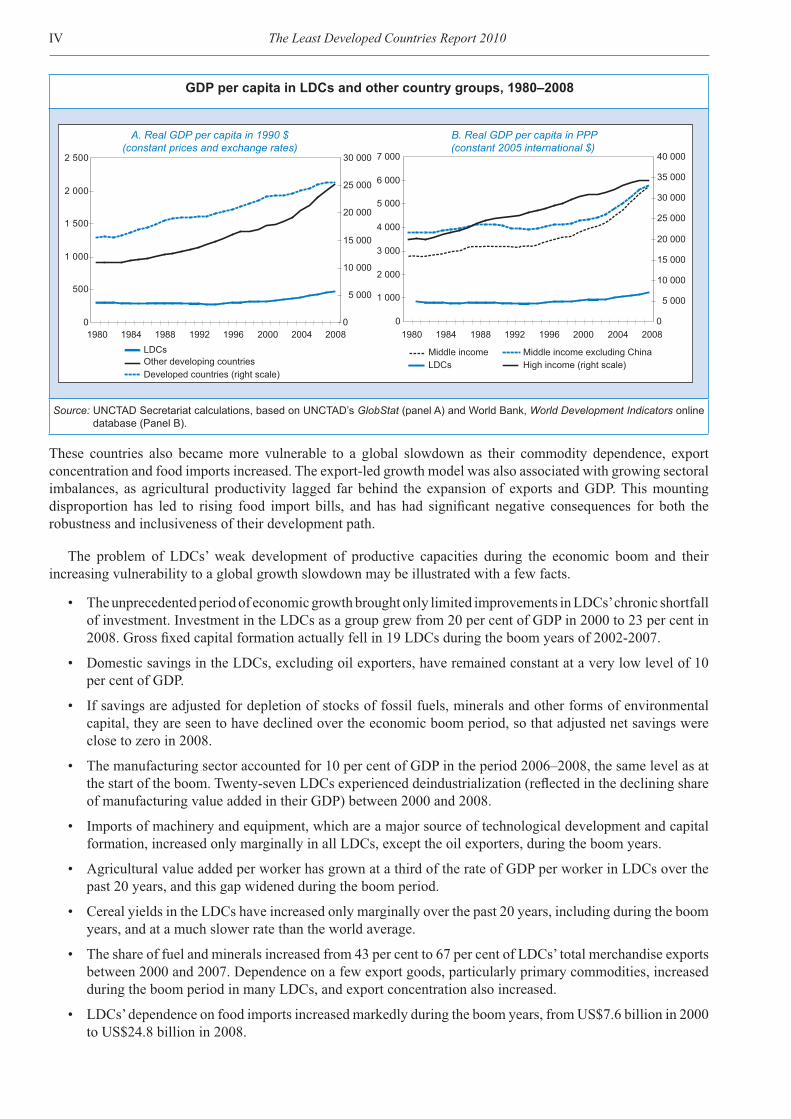
With the kinds of national policies pursued in the 2000s, the LDCs were unable to make the most of the opportunities presented by the boom. In particular, they were unable to promote a pattern of catch-up growth based on the development of productive capacities which would increase the resilience of their economies and set them on a more inclusive growth path. From a long-term perspective, the LDCs have historically experienced high growth volatility. After the prolonged decline of the 1980s and early 1990s, the LDCs started the new millennium with approximately the same level of real per capita income that they had in 1970. Since then, although their per capita GDP has increased significantly in real terms, the gap with other developing countries has continued to widen (charts A and B).
The export-led growth model, which implicitly or explicitly underpinned most LDCs’ development strategies during this period, did not result in much of an increase in investment and capital formation in many of them.
The Least Developed Countries Report 2010IV
These countries also became more vulnerable to a global slowdown as their commodity dependence, export concentration and food imports increased. The export-led growth model was also associated with growing sectoral imbalances, as agricultural productivity lagged far behind the expansion of exports and GDP. This mounting disproportion has led to rising food import bills, and has had significant negative consequences for both the robustness and inclusiveness of their development path.
The problem of LDCs’ weak development of productive capacities during the economic boom and their increasing vulnerability to a global growth slowdown may be illustrated with a few facts.
• The unprecedented period of economic growth brought only limited improvements in LDCs’ chronic shortfall of investment. Investment in the LDCs as a group grew from 20 per cent of GDP in 2000 to 23 per cent in 2008. Gross fixed capital formation actually fell in 19 LDCs during the boom years of 2002-2007.
• Domestic savings in the LDCs, excluding oil exporters, have remained constant at a very low level of 10 per cent of GDP.
• If savings are adjusted for depletion of stocks of fossil fuels, minerals and other forms of environmental capital, they are seen to have declined over the economic boom period, so that adjusted net savings were close to zero in 2008.
• The manufacturing sector accounted for 10 per cent of GDP in the period 2006–2008, the same level as at the start of the boom. Twenty-seven LDCs experienced deindustrialization (reflected in the declining share of manufacturing value added in their GDP) between 2000 and 2008.
• Imports of machinery and equipment, which are a major source of technological development and capital formation, increased only marginally in all LDCs, except the oil exporters, during the boom years.
• Agricultural value added per worker has grown at a third of the rate of GDP per worker in LDCs over the past 20 years, and this gap widened during the boom period.
• Cereal yields in the LDCs have increased only marginally over the past 20 years, including during the boom years, and at a much slower rate than the world average.
• The share of fuel and minerals increased from 43 per cent to 67 per cent of LDCs’ total merchandise exports between 2000 and 2007. Dependence on a few export goods, particularly primary commodities, increased during the boom period in many LDCs, and export concentration also increased.
• LDCs’ dependence on food imports increased markedly during the boom years, from US$7.6 billion in 2000 to US$24.8 billion in 2008.
GDP per capita in LDCs and other country groups, 1980–2008
A. Real GDP per capita in 1990 $(constant prices and exchange rates)
0
500
1 000
1 500
2 000
2 500
0
5 000
10 000
15 000
20 000
25 000
30 000
Other developing countriesLDCs
Developed countries (right scale)
B. Real GDP per capita in PPP(constant 2005 international $)
0
1 000
2 000
3 000
4 000
5 000
6 000
7 000
1980 1984 1988 1992 1996 2000 2004 2008 1980 1984 1988 1992 1996 2000 2004 20080
5 000
10 000
15 000
20 000
25 000
30 000
35 000
40 000
Middle income Middle income excluding ChinaLDCs High income (right scale)
Source: UNCTAD Secretariat calculations, based on UNCTAD’s GlobStat (panel A) and World Bank, World Development Indicators online database (Panel B).

VOverview
In short, economic growth during the boom period in the LDCs was not underpinned by the development of productive capacities. Rather, the LDCs became even more vulnerable to external shocks, as their export concentration, dependence on commodities and external resources increased. UNCTAD’s LDC Report 2008 warned that the growth process in these countries was very fragile and unlikely to be sustainable — a judgment that is supported by recent events.
The pattern of the bust during 2008–2009
When the global economy fell into the deepest recession since the Great Depression of the 1930s, the LDCs as a group also experienced a sharp economic slowdown. The immediate impact of the crisis was transmitted through financial markets, although this was relatively muted in most, but not all, LDCs. The contagion effects of the global crisis on LDCs were transmitted mainly through trade-related channels: the sharp and synchronized fall of commodity prices, combined with the decline in global demand, led to a rapid deterioration in export revenues, particularly for oil and mineral exporters. The services sector (mainly tourism and maritime transport) was also hit particularly hard by the crisis, with severe consequences for island LDCs. Generally, while LDCs’ exports rebounded in mid-2009, sustained by an upturn in commodity prices, they are still well below their pre-crisis levels. In addition, FDI inflows to LDCs declined sharply in the wake of the global crisis. Angola, Democratic Republic of the Congo, Central African Republic, Guinea and Madagascar, which had previously attracted considerable inflows of natural-resource-seeking FDI, were particularly hard hit.
Despite the slowdown, the LDCs as a group actually achieved a higher average GDP growth rate than either the group of other developing countries (ODCs) or developed countries in 2009. But this LDC Report argues that the apparent economic resilience of the LDCs during the crisis can be largely attributed to a number of external factors. Notably, in 2009 there was a substantial increase in assistance from the International Monetary Fund (IMF), the World Bank and regional development banks, which partly offset the decline in private capital flows. In addition, international commodity prices recovered during the year, associated mainly with growing demand from large emerging economies. LDC exporters of low-end manufactures have benefited from the growing demand for these products during the recession. Finally, workers’ remittances to the LDCs that are the most dependent on them continued unabated.
The analysis in this Report suggests that the medium-term outlook for LDCs is fraught with major risks. Generally, the recent increase in official lending by multilateral development banks has tended to rely on bringing forward the funding which had been programmed for delivery over a longer period. In addition, as donors have been striving to adopt adequate countercyclical responses to the crisis, the increase in development assistance has strained their financial resources. Current projections by the Organisation for Economic Co-operation and Development (OECD) of donors’ forward spending plans indicate only a marginal increase in country programmable aid for LDCs in 2010 and 2011. Thus, as the joint World Bank/IMF Global Monitoring Report 2010 states, “[a]bsent increased resources, these essential steps to provide desperately needed resources at the height of the crisis will imply a substantial shortfall in concessional financing over the next couple of years”. In addition, 20 LDCs remain in a situation of debt distress, or at high risk of debt distress, while debt vulnerabilities are likely to worsen in the wake of the global crisis. Against this background, it is not surprising that existing economic forecasts estimate that, while the slowdown in LDCs in 2009 was less acute than in other developing countries, the recovery in 2010 will be slower. Indeed their economic recovery is expected to be the weakest of all country groups. It will depend particularly on whether the global recovery is sustained, and whether official development assistance (ODA) continues to be provided in a way that boost investment and maintain consumption per capita.
Poverty trends and progress towards the MDGs
Economic growth in the LDCs has been very fragile; moreover, it has not been inclusive. This is basically because the LDCs have not been able to generate sufficient productive jobs and livelihoods for the growing number of people entering the labour force each year — even during the boom years. The employment challenge is closely related to the pattern of structural change. The LDCs generally have very high population growth rates, and consequently the number of young people entering the labour market is increasing each year. Agriculture typically employs a large proportion of the labour force in LDCs, but agricultural productivity remains very low,

The Least Developed Countries Report 2010VI
and farms are small, with the result that living standards for most peasants tend to be at or near subsistence levels. The ability of the sector to absorb labour is decreasing owing to smaller farm sizes and lack of investment and many people are forced to cultivate more ecologically fragile land. As a result, more and more people are seeking work outside agriculture, but the manufacturing and services sectors in most LDCs have not been able to generate sufficient productive employment opportunities for the young population. The non-manufacturing industries whose contribution to GDP has grown the most tend to be capital-intensive rather than labour-intensive. Thus the majority of young people are finding work in informal activities, most of which are characterized by low capital accumulation and limited productivity, and hence offer little scope for economic growth.
This Report presents a new set of poverty estimates for 33 LDCs in order to analyse poverty trends. The main feature that becomes apparent from the analysis is the all-pervasive and persistent nature of mass poverty in LDCs. In 2007, 53 per cent of the population of LDCs was living in extreme poverty (i.e. on less than $1.25 a day), and 78 per cent was living on less than $2 a day. Extrapolating this to all the LDCs shows that there were 421 million people living in extreme poverty in these countries that year. Moreover, the incidence of extreme poverty — the percentage of the total population living below the poverty line of $1.25 per day — was significantly higher in African LDCs, at 59 per cent, than in Asian LDCs, at 41 per cent. For the $2/day poverty line, however, the difference is less marked: 80 per cent in African LDCs and 72 per cent in Asian LDCs.
Overall, the poverty trends in the LDCs fall into three major periods between 1980 and 2007. From the 1980s to the mid-1990s, the incidence of poverty was on the rise in both African and Asian LDCs. Between 1994 and 2000, headcount rates began to decline, with the reduction accelerating after 2000. But with rapidly rising populations, the number of people living in extreme poverty in LDCs has continued to increase throughout the past 30 years, including during the boom years, and by 2007 it was twice as high as in 1980. Indeed, the number of extremely poor people living in the LDCs actually continued to grow during the period of economic boom. There is, nonetheless, a significant difference between African LDCs, where the number of people living in extreme poverty continued to rise, and Asian LDCs, where the trend reached a plateau after 2000.
Progress towards MDG achievement has also been slow. For MDG 1, this is evident in both World Bank estimates and UNCTAD estimates presented here. According to the World Bank, the incidence of extreme poverty in LDCs fell from 63 per cent in 1990 to 53 per cent in 2005, with two thirds of the improvement occurring since 2000. The new poverty estimates suggest that the incidence of poverty in1990 was slightly lower (58 per cent), but progress since 2000 has been slower, with a decline from 59 to 53 per cent over a seven-year period. These latter data imply that the poverty reduction deficit in LDCs in relation to the MDG target is not only due to the increasing incidence of poverty in the early 1990s and the slow rate of poverty reduction in the late 1990s, but also to the slow rate of poverty reduction over the past decade.
Turning to the other six human development indicators for which progress towards specific time-bound MDG targets can be monitored, the following trends are clear:
• Regarding the target for universal primary education, both LDCs and developing countries are only slightly off track owing to a significant acceleration of enrolments since 2000. However, only 59 per cent of children in LDCs who start grade 1 reach the last grade of primary school, compared with 87 per cent in all developing countries.
• Concerning access to safe water, developing countries are on track to achieve the goal, but LDCs as a group are off track. There has been no significant change in the trend of increasing access to improved water sources in LDCs since 2000.
• Both developing countries and LDCs are off track in the rate of progress towards the target of reducing infant mortality and child mortality by two thirds between 1990 and 2015, though the rate is actually faster in LDCs than in developing countries. However, because the former started from a very high level of mortality rates, overall they will fall far shorter of the target by 2015. There is no sign that there has been an acceleration of progress since 2000.
• Regarding access to improved sanitation facilities, both developing countries and LDCs are off track, but the rate of progress in LDCs is slower, with no significant acceleration since 2000.
• Regarding the maternal mortality rate, both LDCs and developing countries have made very slow progress.
VIIOverview
The acceleration of growth in the LDCs during the economic boom period has led to some progress towards the MDGs and poverty reduction since 2000. However, in general the level of human development indicators remains appallingly low: for most indicators LDCs are where other developing countries were 20 years ago. A more disaggregated picture for LDCs shows that only a handful of countries are on track to achieve the MDGs on a broad front. There has been significant progress in net primary enrolment rates and gender parity in primary education, reflecting strong Government and donor commitment. Poverty reduction has also advanced to some extent. However these achievements are rather modest in relation to policy targets. Most notably, the acceleration of growth in LDCs in the early and mid-2000s appears to have had little impact on employment creation and overcoming food insecurity. Finally, in the crucial areas of quality and outreach of health services (MDGs 4 and 5) progress has been sluggish, as also for major infrastructural investments, including improving sanitation.
These data do not include the social impact of the crisis because only a few country studies on this issue have been conducted so far. From the limited data available, the crisis appears to have had significant negative social impacts in some LDCs. For example, it is estimated that there are an additional 2 million people living in extreme poverty in Bangladesh due to the crisis, even though this country was not too badly affected in terms of its macroeconomic performance. If the global economic crisis has more lasting effects in LDCs and the rather bleak medium-term outlook turns out to be accurate, even the modest achievements in poverty reduction between 2000 and 2007 will be jeopardized and the number of people living in extreme poverty in LDCs will certainly rise. Indeed, if poverty reduction rates over the next five years fall to those of the 1990s, there could be 77 million more people living in extreme poverty in the LDCs by 2015 than if the poverty reduction rates of the period 2000–2007 were to be maintained.
CHALLENGES AND OPPORTUNITIES IN THE COMING DECADE
Policy scenarios for 2011–2020
The main policy objective for LDCs remains substantially higher and sustainable growth rates that will allow them to catch up at least with middle-income countries in coming decades and substantially reduce poverty. With this in mind, the Report presents several economic scenarios for LDCs in the decade 2011–2020, using the Global Policy Model developed by the United Nations Department for Economic and Social Affairs (UN-DESA) and adapted by UNCTAD to provide more detailed information on the LDCs.
In the model simulations, an ambitious objective is set for accelerated growth of income in each of four groups of LDCs (African energy exporters, Bangladesh, other Asian and Pacific LDCs and other African LDCs plus Haiti), thereby allowing LDC-specific scenarios and policy simulations. The stated policy objective is a 2 per cent improvement in growth of income per capita during the period 2011–2015 relative to the past decade (2000–2010) and a further 2 per cent acceleration over the period 2016–2020. This would bring the long-term per capita income growth rate to 9 per cent per annum for African energy exporters, 8.5 per cent for Bangladesh, 10 per cent for other Asian LDCs and 7 per cent for other African LDCs. These objectives for LDCs compare with an expected average per capita income growth rate of about 4 per cent in the world as a whole and 2–3 per cent in high-income countries.
The achievement of these targets would be in line with the Spirit of Monterrey Declaration made by the Heads of State at a retreat during the United Nations International Conference on Financing for Development in Monterrey on 18–23 March 2002, which stated: “We undertake to assist the world’s poorest countries to double the size of their economies within a decade, in order to achieve the MDGs.” Although this would represent a breakthrough compared with the period 1971–2000, income per capita in 2020 would still remain below $3,000 in most LDCs and below $1,500 in non-energy-exporting African LDCs.
Four simulations were calculated for four different types of policies which could be chosen by the LDCs as a means of improving living standards and accelerating economic growth. These four scenarios are:
Scenario 1: Accelerated growth of government spending on goods and services

The Least Developed Countries Report 2010VIII
Scenario 2: Accelerated infrastructure investment, both public and private
Scenario 3: Export expansion and diversification
Scenario 4: A dynamic export-investment nexus
The baseline projection presents a rather optimistic view of global developments in the coming decade which implies a quick and sustained recovery. This should provide an opportunity for substantial improvements in LDCs. According to the baseline projections for LDCs, which assume this favourable global context and development policies similar to those followed in the past, African energy exporters and Bangladesh are projected to grow as fast, or faster, than other parts of the world, permitting their per capita income to grow at an average annual rate of about 5 per cent, which is significantly faster than the rate of growth expected in high-income countries. Even so, and despite some overall improvements in macroeconomic performance, average national income per capita in 2020, measured at around $3,400 (in 2000 purchasing power parity (PPP)) for African energy exporters and $2,300 for Bangladesh, will still be a small fraction of the average for the world as a whole ($12,800), and less than one tenth of the average for high-income countries ($35,700).
The baseline projections are less optimistic for other LDC groups. Exports of primary commodities and services are projected to grow more slowly in LDCs than in other parts of the world, implying that their average income levels will lag further behind. Other African LDCs are expected to perform particularly poorly owing to weak exports, high population growth rates and rising costs of oil imports. In these countries the average per capita income would increase very little, if at all, remaining at around $850, while government debt would remain at around 70 per cent of GDP. Net external positions are expected to become increasingly negative, reaching nearly 90 per cent of GDP for the Other Asian LDCs and no less than 150 per cent of GDP for the Other African LDCs.
Not surprisingly, scenario 4 offers the most effective approach to accelerated growth of production and income through a combination of demand expansion (government spending, infrastructure investment and export promotion), which should provide a broad range of development opportunities for public and private institutions in different regions of each country. The impact is projected to be somewhat weaker for African energy-exporting LDCs and Bangladesh, which have better baseline development prospects, and stronger for other Asian and African LDCs, for which baseline prospects are not so good. Policies of demand expansion and infrastructure investment should boost the average annual income growth rate by 0.4–0.8 per cent for Bangladesh and over 2 per cent for the other LDC groups, as compared with export promotion alone. Looking at the scenario the other way round, export promotion policies should boost the average annual GDP growth rate by 0.3–0.6 per cent in Bangladesh and by 0.5–1.5 per cent in the other LDC groups, as compared with policies focusing only on demand expansion and infrastructure investment. Although such policies entail significant domestic and external costs, the cumulative benefits for production, trade and government revenues generated by a consistent application of domestic policies over the medium term means that the policies will eventually finance themselves as government debt and external debt fall relative to GDP.
The findings indicate that it is feasible to accelerate growth in LDCs under alternative policy scenarios that include a much greater role for public investment and expenditure internally, buttressed by international policies. In all four scenarios, external constraints are significant. From a macroeconomic perspective, the most important functions of international policies to support the LDCs would be financial assistance aimed at increasing investment and developing export industries and export promotion, and grants to cover government budget deficits. From these scenarios, it is clear that a significant improvement in per capita income in LDCs over the coming decade will require substantial external assistance of this kind. Thus, making this external assistance effective will be a clear priority. On the other hand, austerity measures in developed countries in response to their own accumulated imbalances would almost certainly have a negative impact on most LDCs.
New international factors
The policy scenarios are based on historical trends, but the outcomes over the coming decade will also be affected by new developments in the international economy. The Report examines two new international factors which are likely to significantly influence the potential for development and poverty reduction in the LDCs over the coming decade: (i) climate change and (ii) increasing South-South economic relations.

IXOverview
Climate change
Although the LDCs as a group contribute relatively little to global warming — accounting for less than 1 per cent of the world’s total greenhouse gas (GHG) emissions — they will be disproportionately affected by changing climatic conditions. The majority of LDCs are located in regions already experiencing environmental stress. In addition, their economic weaknesses, including low levels of economic and human development, strong dependence on natural resources and climate-sensitive sectors as a source of local livelihoods and national income, render them particularly vulnerable to climate change and its catastrophic effects. It has been estimated, for example, that for every 1˚Celsius rise in average global temperatures, average annual growth in poor countries could drop by 2–3 percentage points, with no change in the growth performance of the developed countries.
The frequency and intensity of extreme weather events in LDCs (e.g. droughts, extreme temperature and floods) have been increasing, with five times as many such incidents occurring during the period 2000–2010 as during the period 1970–1979. The number of people in LDCs affected by these extreme events has almost doubled, rising from 100 million during the period 1970–1979 to 193 million over the period 2000–2010. During the latter period, economic losses in LDCs resulting from natural disasters amounted to an estimated $14.1 billion.
As a result of climate change, many African LDCs may experience greater rainfall, modifications in rainy season food crop production characteristics, shorter growing seasons and increased flooding. For other African LDCs, reduced rainfall may result in longer dry seasons, drought and unviable agricultural production in areas where subsistence farming might previously have been practiced. Both scenarios will adversely affect their economies and food security in the absence of significant adaptation efforts.
Responding to the challenges of climate change in LDCs, including reorienting their economies towards more climate-resilient and ecologically sustainable growth paths, will require a significant injection of financial resources. These resources would have to be additional to those required to meet existing social and economic development needs to ensure that past, present and future gains in these areas are not compromised. It is unlikely that LDCs will be able to meet the financial costs of climate change adaptation and mitigation without substantial external contributions from the international community.
New economic relationships with other developing countries
Other developing countries (ODCs) that are not LDCs have increasingly become very important economic partners of LDCs in trade, investment, capital, and technology and development cooperation, especially since the 1990s. In some cases, South-South flows in these fields have begun to exceed North-South flows. This is particularly striking in the area of international trade. Traditionally, LDCs sourced one third of their imports from developing countries. This share started to increase sharply from 1991, and since 1996 more than half of LDCs’ imports have originated in the South, reaching 62 per cent in 2007–2008. Between 1990–1991 and 2007–2008, developing countries accounted for 66 per cent of the expansion of LDCs’ foreign trade. Regarding exports, traditionally developing countries absorbed between one fifth and one fourth of LDCs’ total exports. This share started to increase in 1993, and by 2007–2008 developing countries as a group became the largest market for LDC exports, accounting for half of their total exports. The quicker growth of South-South trade of LDCs has meant the decline in the relative importance of trade with developed countries (especially members of the European Union).
The new South-South economic relationships are likely to strengthen further over the coming decade. This offers a major development opportunity for the LDCs, but realizing its potential will not be automatic.
A current shortcoming in LDCs’ economic linkages with their major developing-country trading partners is that these trade and investment flows resemble those with developed countries, contributing to lock in LDCs as exporters of commodities and labour-intensive manufactures and importers of a large array of manufactures. A major opportunity arising from South-South linkages and regional trade agreements (RTAs) is that they offer domestic firms in LDCs possibilities to learn how to operate internationally and achieve economies of scale. They also enable diversification of exports and entail lower adjustment costs than integration with developed countries. In addition, South-South regional integration enables the geographical diversification of trade, investment and official finance. Moreover, regional synergies can be created through joint investments in infrastructure projects and/or through the regional division of labour.
The Least Developed Countries Report 2010X
WEAKNESSES IN THE CURRENT INTERNATIONAL ECONOMIC ARCHITECTURE FOR LDCS
The design of a new international development architecture (NIDA) for the LDCs should build on a proper diagnosis of the current international economic architecture. The Report argues that the current architecture is not working effectively to promote development and poverty reduction in the LDCs and to reduce their marginalization and vulnerability in the world economy. It identifies two major weaknesses. First, although there has been an increasing recognition of the need for special international support mechanisms for LDCs over the past 15 years, and particularly in the area of international trade, the international support has thus far focused largely on measures that have symbolic significance rather than practical developmental impacts. Second, the development dimension in current global economic regimes is weak. The adoption of a one-size-fits-all approach has had particularly adverse consequences for the LDCs, given their very low level of development and structural weaknesses. There is also a lack of harmony between the existing global systemic regimes and the special international support measures for LDCs which can completely undermine both the intent and outcomes of the latter.
It is important to address both these sources of weakness when designing a NIDA for the LDCs. The Report points out that an exclusive focus on LDC-specific international support measures would be insufficient, as these measures work within a more general framework of rules, norms, practices and understandings which guide the international economic relations of all developing countries, including the LDCs and sub-categories of developing countries, such as low-income countries.
Weaknesses of the current international support measures
The Brussels Programme of Action (BPOA) for the LDCs for the Decade 2001–2010 contains commitments to 156 actions to be taken by the LDCs and 178 actions to be taken by their development partners. However, the precise status of those actions is unclear. This Report focuses on eight international support measures which can be considered current best-case examples of special international support measures in favour of LDCs. They are not only included as actions in the BPOA, but also are being implemented or monitored in some form or other by various international organizations, such as OECD Development Assistance Committee, the World Trade Organizations (WTO), the United Nations Framework Convention on Climate Change (UNFCCC) or the World Intellectual Property Organization (WIPO), or they form part of the MDG targets which have been the focus of efforts of the donor community over the past decade. Thus, if the effects of these measures have been limited, it cannot be explained by the simple fact that nothing has been done after everyone has gone home following a verbal agreement at a global conference.
The eight specific measures are:
• ODA targets of 0.15 or 0.20 per cent of donor’s gross national income (GNI) to be allocated to LDCs;
• 2001 DAC Recommendation to untie aid to LDCs;
• Special consideration given to LDCs in their accession to the WTO;
• Special and differential treatment (SDT) for LDCs in WTO agreements on goods and services;
• Preferential market access for LDCs;
• Article 66.2 of the WTO Agreement on Trade-Related Aspects of Intellectual Property Rights (TRIPS Agreement);
• The Integrated Framework for Trade-related Technical Cooperation (IF), which has now been succeeded by the Enhanced Integrated Framework (EIF); and
• The Least Developed Countries Fund (LDCF), established to implement the UNFCCC work programme.
Assessments of the effectiveness of these measures are based on existing published evaluations of how they have worked, but where the Report adds value to these evaluations is by juxtaposing them and comparing their findings. For example, there has been no comparison of the overall outcome of the IF and LDCF as they operate in different domains. However, a comparative assessment enables the identification of some common weaknesses.

XIOverview
The Report’s comparative analysis shows that very little action has yet been taken on two of the eight measures listed above, namely SDT within WTO agreements, and the decision to facilitate WTO accession for LDCs while exercising restraint in seeking concessions in the accession process. With regard to the former, the failure to implement is due to LDCs choosing not to utilize the few opportunities of SDT which exist within the agreements. As for facilitating LDCs’ accession to the WTO, on the contrary developed countries have sought concessions above and beyond those that were demanded of existing least developed country WTO members at the time of their accession negotiations.
Concerning the ODA target, it is unclear whether this is being implemented directly by donors or as a by-product of other aid allocation priorities. The econometric evidence shows that LDC status does not influence the geographical allocation of aid for the LDCs as a whole. There was progress towards the achievement of the aid target for LDCs during the period 2000–2008, as the aggregate ratio of aid to gross national income (GNI) of DAC member countries rose from 0.05 per cent of GNI in 2000 to 0.09 in 2008, reversing the downward trend in the 1990s. However, critically, if the lower ODA target of 0.15 per cent of GNI had been achieved, LDCs would have received $60.7 billion in aid rather than the $37 billion they actually did receive (i.e. a shortfall of $23.6 billion). The cumulative shortfall of aid inflows during the period 2000–2008 — a period when this goal was inscribed as one of the targets in MDG 8 — was actually higher than that in the 1990s, and the cumulative shortfall in aid during 2000–2008 in relation to the lower 0.15 target was equivalent to 51 per cent of the GNI of LDCs as a group in 2008.
With regard to trade preferences, this approach is based on four critical assumptions: that the markets in LDCs work (i.e. producers and consumers respond to market signals); that preferential market access will help LDCs attract more foreing investment; that LDCs produce almost competitive exports; and that restricted market access poses major challenges for LDCs. These assumptions are highly questionable, since, as pointed out in previous LDC Reports, a major weakness in LDCs is their limited supply capacities that constrain their ability to respond to market opportunities. This means that market creation and market entry is as important as market access, if not more so. It highlights the need to build domestic productive capacity and enable domestic resource mobilization — a long-term effort which requires macroeconomic policies that encourage investment in productive sectors. Unfortunately, as empirical evidence indicates, countries that cannot export competitively cannot benefit from preferential market access.
There are various features of the design of some of these special measures which limit their development effectiveness from the outset. Of the seven measures, the scope of SDT for LDCs in WTO agreements is for the most part not oriented to provide development benefits, but rather to provide transitional arrangements for facilitating implementation of those agreements by the LDCs. The other measures aim at bringing some concrete trade and development benefits, but their effectiveness is limited by: (i) important exclusions, which are explicitly included in the design of the measures to protect commercial interests in the LDCs’ development partners; and (ii) a failure to take account of the economic constraints within LDCs, which prevents these countries from grasping the opportunities created by the special measures.
An example of the exclusions is the initial aspiration to accord duty-free and quota-free (DFQF) market access preferences to only 97 per cent of product lines (rather than 100 per cent). This makes these preferences commercially meaningless, given that the remaining 3 per cent of products not covered may be precisely those that the LDCs are able to export. Another example is the exclusion of food aid and technical cooperation from the 2001 DAC Recommendation to untie aid. Moreover, economic weaknesses in LDCs limit their ability to utilize trade preferences and also the ability of domestic enterprises in LDCs to benefit from the untying of aid. In each of these cases, these constraints could be overcome by a better design of the support measures. For example, rules of origin, which enable more sourcing from other developing countries, or special efforts to reduce the contract size in aid provision and thus facilitate more local procurement, could considerably enhance the trade and development effects of these support measures.
Implementation in ways which could bring greater development benefits to LDCs has also been adversely affected by different interpretations of what a “special measure” actually means. There is a recurrent pattern of LDCs and their development partners having different expectations about what special measures should deliver. This is starkly illustrated by the interpretation of developed-country WTO members to Article 66.2, an interpretation which downplays that article’s provision concerning incentives for enterprises and institutions

The Least Developed Countries Report 2010XII
in their territories to encourage technology transfer. In addition, there have been different understandings and expectations of what the whole IF process and the 2001 DAC Recommendation can deliver.
The development effects of the special measures for LDCs are also sometimes stymied by inertia in their implementation. This is evident, for example, in the way untying of aid actually works. Furthermore, increased technical assistance for the LDCs is often necessary to enable them to derive benefits from these measures, but it is either not provided, or not provided in a way which allows them to utilize the measures (for example, in relation to SDT in the international trade regime).
However, perhaps the most important area of breakdown in implementation relates to financing. For example, the financial flows which have followed from the Diagnostic Trade Integration Study (DTIS) and the national adaptation programmes of action (NAPAs) have fallen far short of needs. The total amount allocated to LDCs through the IF process between 2000 and 2010 was, on average, little more than $1 million per LDC, and the LDCF disbursed $4 million per LDC (in 32 countries) to support climate change adaptation projects between 2001 and June 2010. Similarly, TRIPS Article 66.2 has been implemented in such a way that rather than offering financial incentives for technology transfer, existing activities have simply been reclassified which could — at a stretch of the imagination — be said to fall within the ambit of that Article. The lack of funding for the LDC-specific international support measures contrasts markedly with the United Nations system’s expenditure on operational activities which has been increaslingly focused on LDCs.
Instead of the needed financial assistance, what the LDCs often get out of these international support measures is studies and monitoring mechanisms. All five measures — Article 66.2, preferential market access (within the MDGs), the 2001 DAC Recommendation, the LDCF within the UNFCC and its associated expert group, and the EIF — have monitoring mechanisms. This has led to better data, for example with regard to reporting of the percentage of tied aid or the percentage of imports that enter duty free into developed countries. Developed countries now also regularly report on what they are doing in relation to TRIPS Article 66.2. One of the most important outputs of the special mechanisms has been studies which could lead to projects and programmes. This has been the major outcome of both the IF, which has produced 38 Diagnostic Trade Integration Studies (DTIS), and the LDC Fund under which 43 NAPAs have been prepared and 48 LDCs have received funding for their preparation. But without the funds and institutions to follow through beyond monitoring, the value of all this work is either lost or becoming obsolete.
A positive feature arising from the comparison of the effectiveness of the various international support measures for LDCs is that there is clearly a learning process occurring. This is perhaps most apparent in relation to the Integrated Framework, which, since 1997, has been first improved and then enhanced. It is also apparent in the design of market access preferences. However, from an LDC point of view, this learning process has been painfully slow. It has taken 13 years to get the IF initiative in shape. Moreover, the major difficulties affecting the utilization of market access preferences by LDCs were known 40 years ago, and indeed it was precisely these difficulties which provided the rationale for designing special forms of preferences for the least developed amongst the developing countries.
Overall, existing special international support measures do not work in a way that is developmentally effective, either because of their inappropriate design or the manner in which they are implemented. The nature of these measures reflects the weak bargaining power of LDCs, so that they are forced to accept what they are offered. The commercial interests of rich countries and wide differences in interpretation between LDCs and their development partners also continue to stymie their effective implementation. It is clear that there is a learning process in the design and implementation of the special measures, and during the last decade there has been important progress in ensuring that those measures are multilaterally agreed and monitored. But the learning process has been painfully slow and there is need now to accelerate their improvement and orientation in order for them to yield genuine development results.
The Report does nevertheless show that the LDCs are benefiting from affirmative action throughout the United Nations system. According to the most recent estimates, the United Nations system’s expenditures on operational activities for LDCs increased from $2.4 billion in 2000 to $7 billion in 2008. This represents an increase from 28 per cent of total expenditures to 38 per cent, both for developmental and humanitarian operational activities. It is also estimated that more than 50 per cent of country-level expenditure in 2008 went to LDCs, up from 39 per cent

XIIIOverview
in 2003. But it is necessary now for wider recognition of the LDC status in the overall international development architecture.
Weaknesses in the current global economic regimes
The Report identifies four major weaknesses in the current global economic regimes from an LDC perspective.
First, the structural weaknesses of the LDCs imply that the global economic regimes which constrain or enable development and poverty reduction in developing countries in general (including the LDCs) do not work as expected in an LDC context. The evidence used to justify the national and international policies and practices associated with these regimes is usually drawn from the more advanced developing countries, where data are more readily available. These frameworks are, by definition, not designed in a way that specifically addresses the structural weaknesses of LDCs. Policies and practices that could work in one context are therefore often inappropriate in the LDC context. They do not produce the expected outcomes, and indeed they can often hinder the achievement of desired development and poverty reduction objectives. In short, failures have arisen from the application of models for finance, trade and technology that are not appropriate to address the structural weaknesses and structural vulnerabilities of the LDCs. Such a one-size-fits-all approach has been particularly damaging for the LDCs.
Second, there are certain aspects of the global economic regimes which are very important to LDCs because of their stage of development and their form of integration into the global economy, but which are missing from the overall international development architecture. From an LDC perspective, a major element missing from the global economic regimes is the lack of an international commodity policy. Such a policy is particularly important for many commodity-dependent LDCs, because the way in which commodity markets behave and the increasing interdependence between these markets and financial markets is integrally associated with the boom-bust nature of the growth experience of the LDCs and their structural constraints. It also has a bearing on the interrelationship between the food, financial and climate crises and their effects on the LDCs.
Third, inappropriate models have been propagated through conditionalities and micro-incentives that encourage compliance. These have undermined country ownership of national development strategies and limited policy space. The inadequacy of the one-size-fits-all approach to development is being increasingly recognized, resulting in the advocacy of a more context-specific approach to development based on country ownership. Theoretically, this should allow greater recognition of the specific structural weaknesses and vulnerabilities of the LDCs. There have already been major changes in the practice of policy conditionality, and countries have assumed a greater role in the design and implementation of their Poverty Reduction Strategy Papers (PRSPs). But the evidence shows that the way in which PRSPs are designed and implemented is still strongly influenced by donors’ policy conditionality, monitoring benchmarks and financing choices. It is also proving very difficult to realize the potential of national leadership in the design and implementation of national development strategies in most LDCs because of their weak technical capabilities and a certain reluctance on the part of the LDC Governments themselves to experiment. They fear that the adoption of policies deemed inappropriate by donors could adversely affect their access to external finance. Thus, learning and experimentation in policymaking and greater domestic ownership of policies is proving to be a very slow evolutionary process.
Fourth, there is a lack of policy coherence between the different components of the global regimes, and in particular between the global regimes and special international support measures for the LDCs.
Lack of policy coherence
The way in which the international economic architecture affects the LDCs is the product of the interaction of systemic regimes, special international support measures for the LDCs and measures designed for other sets of countries which overlap imperfectly with the LDC category. In general, the global economic regimes have had much stronger effects on LDCs than the special international support measures. Moreover, the systemic regimes and special international support measures work at cross purposes.This is best illustrated by the following three examples.
The Least Developed Countries Report 2010XIV
The first example is the relationship between the LDC-specific development goals inscribed in the Brussels Programme of Action, on the one hand, and the MDGs on the other. The BPOA was drafted, negotiated and agreed after the Millennium Declaration but before the inter-agency agreement on the precise statistical targets which would be monitored to measure progress towards the MDGs. The BPOA was inspired by the Millennium Declaration and it also represented an attempt to renew emphasis on the partnership principle as a cornerstone of international development cooperation which had emerged at the end of the 1990s. One of the main aims of the BPOA, in contrast to earlier programmes of action, was to include quantitative, measurable goals and targets. To this end, the BPOA drew upon the agreed outcomes of the major international conferences of the 1990s in much the same way as the statistical specifications for the MDGs. But because the latter process occurred after the former, and because the former was a political negotiation, there is an overall mismatch and imperfect fit between the goals and targets of the BPOA and the MDGs. In some ways, the BPOA goals are more advanced than the MDGs as they include a mix of human development goals, particularly focusing on building health and education to build human capacities, and goals related to the development of productive capacities. Notably they contain growth targets, investment ratios and infrastructure development targets. However, in practice, it is the general development goals embodied in the MDGs rather than specific LDC development goals which have been the focus of attention. Certain BPOA goals have thus become important by default, that is to say, to the extent to which they conform to the MDGs, while other BPOA goals have been set aside by the international community.
A second example concerns mainstreaming trade in development strategies. This is an important goal of the IF process, but, as argued in earlier LDC Reports, the problem of trade mainstreaming is an issue of ownership. Yet there is limited country ownership of the macroeconomic framework in the poverty reduction strategies of the PRSP process. This macroeconomic framework contains forecasts of export and import growth, and the basic problem of integrating trade into national development strategies is that the trade objectives in the macroeconomic framework float freely, having no connection with the detailed trade objectives and policy measures contained in the main text of the PRSP. This disconnect arises because of the weak linkage of the macroeconomic framework with the rest of the PRSP process, a state of affairs which sometimes is due to the framework being formulated by a narrow circle of officials, and other times, worse still, due to the fact that the trade forecasts are not locally generated. Whatever the cause, any special measure to integrate trade into poverty reduction strategies will not work so long as the general processes in the design and implementation of PRSPs undermine country ownership, and in particular if the processes which limit the ability of a county to exercise leadership in the design of the macroeconomic framework are not also addressed. In effect, the special measures and the systemic regime are working at cross-purposes.
The third example of the way special international support measures are embedded in a wider field of collective international action that is not LDC-specific is the Everything But Arms initiative of the European Union. This initiative played a very important symbolic role in catalysing action to give preferential market access to the LDCs. But its initial practical benefits were small. This was partly because, in terms of tariffs and quotas, the EU already had a relatively open trade regime for most LDC producers and many African LDCs already enjoyed market access preferences under the Cotonou Agreement.
What this implies is that if it were possible to design, agree and implement a new generation of more effective ISMs for LDCs, this in itself would not be enough to promote the goals of more sustained and inclusive development in these countries. For this to occur, the global economic regimes which are enabling or constraining development and poverty reduction in all developing countries, including the LDCs, would also have to support the same outcomes. To the extent that the general development architecture works against, or at least not in line with, the special needs and interests of the LDCs, the overall results would be neutral or even negative. In effect, the right hand (the general framework) would take away what was being given by the left hand (the special international support mechanisms). A necessary condition for making the special ISMs for LDCs effective is therefore not simply to improve them, but also to ensure that the global regimes affecting developing countries in general, including LDCs and the sub-categories within them which overlap with the LDCs, are also reformed so that they support development and poverty reduction in the LDCs.
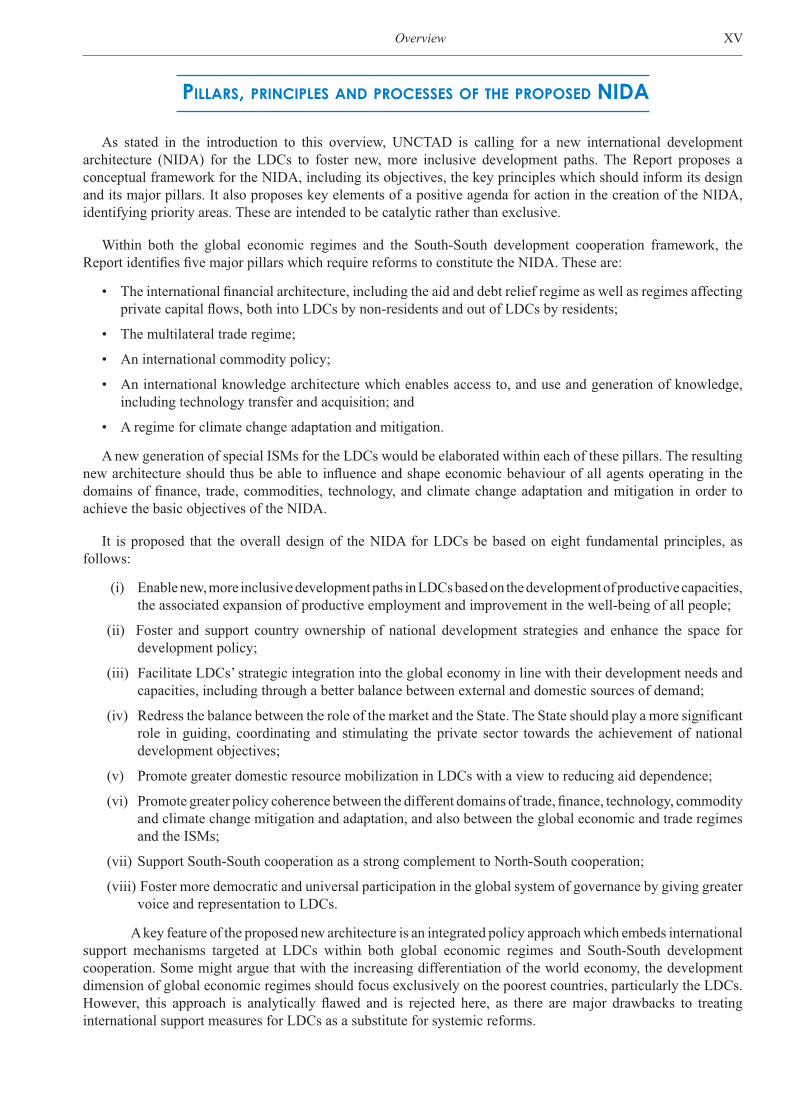
XVOverview
PILLARS, PRINCIPLES AND PROCESSES OF THE PROPOSED NIDA
As stated in the introduction to this overview, UNCTAD is calling for a new international development architecture (NIDA) for the LDCs to foster new, more inclusive development paths. The Report proposes a conceptual framework for the NIDA, including its objectives, the key principles which should inform its design and its major pillars. It also proposes key elements of a positive agenda for action in the creation of the NIDA, identifying priority areas. These are intended to be catalytic rather than exclusive.
Within both the global economic regimes and the South-South development cooperation framework, the Report identifies five major pillars which require reforms to constitute the NIDA. These are:
• The international financial architecture, including the aid and debt relief regime as well as regimes affecting private capital flows, both into LDCs by non-residents and out of LDCs by residents;
• The multilateral trade regime;
• An international commodity policy;
• An international knowledge architecture which enables access to, and use and generation of knowledge, including technology transfer and acquisition; and
• A regime for climate change adaptation and mitigation.
A new generation of special ISMs for the LDCs would be elaborated within each of these pillars. The resulting new architecture should thus be able to influence and shape economic behaviour of all agents operating in the domains of finance, trade, commodities, technology, and climate change adaptation and mitigation in order to achieve the basic objectives of the NIDA.
It is proposed that the overall design of the NIDA for LDCs be based on eight fundamental principles, as follows:
(i) Enable new, more inclusive development paths in LDCs based on the development of productive capacities, the associated expansion of productive employment and improvement in the well-being of all people;
(ii) Foster and support country ownership of national development strategies and enhance the space for development policy;
(iii) Facilitate LDCs’ strategic integration into the global economy in line with their development needs and capacities, including through a better balance between external and domestic sources of demand;
(iv) Redress the balance between the role of the market and the State. The State should play a more significant role in guiding, coordinating and stimulating the private sector towards the achievement of national development objectives;
(v) Promote greater domestic resource mobilization in LDCs with a view to reducing aid dependence;
(vi) Promote greater policy coherence between the different domains of trade, finance, technology, commodity and climate change mitigation and adaptation, and also between the global economic and trade regimes and the ISMs;
(vii) Support South-South cooperation as a strong complement to North-South cooperation;
(viii) Foster more democratic and universal participation in the global system of governance by giving greater voice and representation to LDCs.
A key feature of the proposed new architecture is an integrated policy approach which embeds international support mechanisms targeted at LDCs within both global economic regimes and South-South development cooperation. Some might argue that with the increasing differentiation of the world economy, the development dimension of global economic regimes should focus exclusively on the poorest countries, particularly the LDCs. However, this approach is analytically flawed and is rejected here, as there are major drawbacks to treating international support measures for LDCs as a substitute for systemic reforms.

The Least Developed Countries Report 2010XVI
Such a narrow approach would have unintended effects. Firstly, it is clear from the experience of the past 30 years that the problem is not just the weak growth performance of the poorest countries, but also the fact that some developing countries which are a slightly more advanced than the LDCs have experienced growth failures which have pushed them down into the LDC group. Secondly, it is necessary to view the global development process in dynamic terms: if the more advanced developing countries are not able to deepen their industrialization and move up the technological ladder and out of the simple products being exported by the poorer countries, it will be difficult for the poorest countries to develop. As noted in the LDC Report 2002: “To the extent that the more advanced developing countries meet a glass ceiling which blocks their development, there will be increasing competition between the LDCs and other developing countries.” In this situation, special ISMs for the LDCs could accelerate the graduation of some of these countries from the LDC category. However, at the same time, some other developing countries that are just above the LDC threshold might experience such weak economic performance as to risk entering the LDC category. Thus, although the special measures might provide benefits for some LDCs, their effect globally would be counterproductive.
The Report therefore advocates a mix of more developmental and coherent global economic regimes for all developing countries, including LDCs, along with special measures targeted to address the specific handicaps and vulnerabilities of the LDCs. As the more advanced developing countries move up the development ladder, LDCs could move into the production of goods and services that were formerly but can no longer be competitively produced in those more advanced developing countries. This process should be facilitated by South-South development cooperation aimed at reinforcing the mutually supportive economic relationships between the more advanced and the least developed developing countries.
Finally it is important for the LDCs to have a greater voice and representation in global governance. Although the Report does not deal with this issue, it is critical to the process of creating a NIDA for LDCs.
AN AGENDA FOR ACTION TO CREATE A NIDA FOR LDCS
The creation of a new international development architecture for the LDCs requires comprehensive reforms in the areas of finance, trade, commodities, technology and climate change. These should include: (i) systemic reforms of the global regimes governing these areas; (ii) the design of a new generation of ISMs for the LDCs, building on the lessons of the past; and (iii) enhanced South-South development cooperation in favour of LDCs. The main elements of an agenda for action, discussed in detail in the last three chapters of this Report, are presented below and summarized in the following table.
Finance
Given LDCs’ limited domestic financial resources, financing their development in a sustained and stable way is sometimes reduced to the question of the quantity and quality of aid. However, although the aid architecture remains important, the Report seeks to place the financing challenge within a broader framework. It focuses on two major areas for action which would contribute to the creation of the proposed NIDA: (i) the provision of resources for productive investment, particularly through the promotion of domestic financial resource mobilization, the creation of innovative sources of long-term development finance and innovative uses of aid to develop productive capacities, in addition to debt relief; and (ii) the promotion of country ownership and creation of policy space to help recipient countries mobilize and direct those resources in line with local conditions.
In this framework, aid certainly has an important role to play. Indeed, in the short and medium term there are major financing needs which can only be met through official financial flows. However, the major role of aid should not be humanitarian only, to alleviate the immediate suffering of people living in abject poverty; but it should also be developmental and should play a catalytic role in leveraging other forms of development finance. Thus aid should aim to promote greater domestic resource mobilization and the creation of an expanding investment-profits nexus which is embedded within LDCs based on the domestic private sector. This would also help LDCs to reduce their dependence on aid.
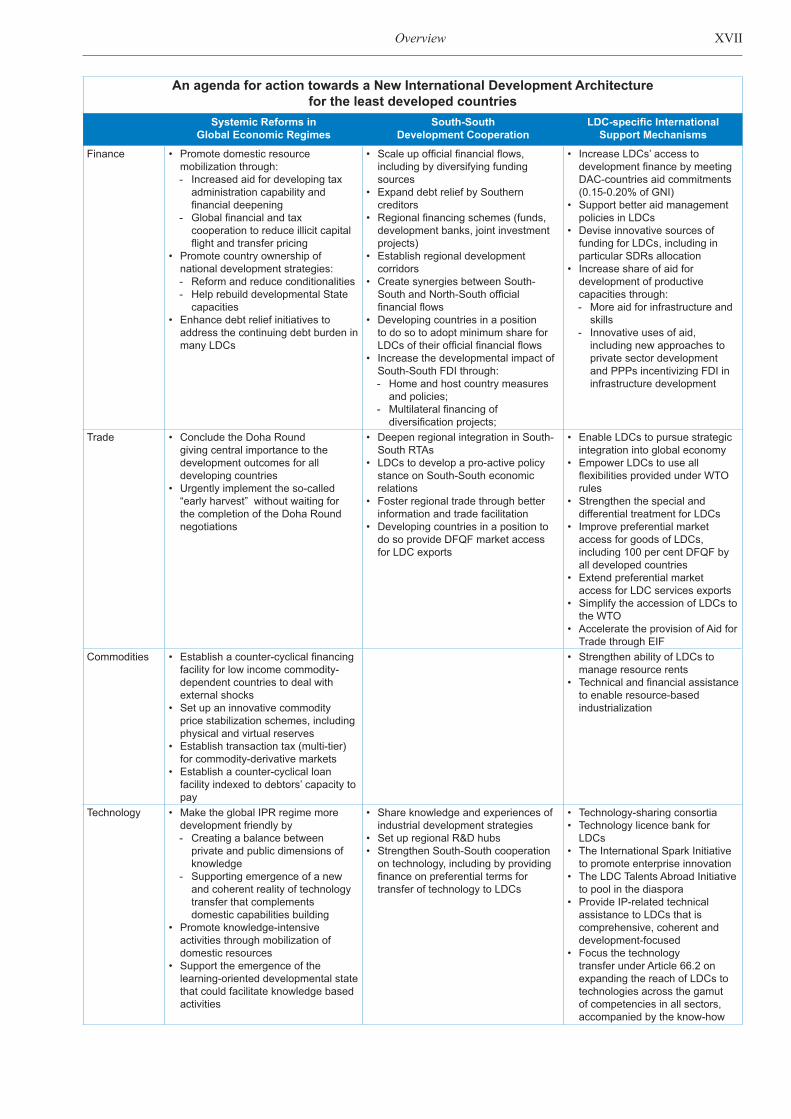
XVIIOverview
An agenda for action towards a New International Development Architecture for the least developed countries
Systemic Reforms in Global Economic Regimes
South-South Development Cooperation
LDC-specific International Support Mechanisms
Finance • Promote domestic resource mobilization through: - Increased aid for developing tax
administration capability and financial deepening
- Global financial and tax cooperation to reduce illicit capital flight and transfer pricing
• Promote country ownership of national development strategies:- Reform and reduce conditionalities- Help rebuild developmental State
capacities• Enhance debt relief initiatives to
address the continuing debt burden in many LDCs
• Scale up official financial flows, including by diversifying funding sources
• Expand debt relief by Southern creditors
• Regional financing schemes (funds, development banks, joint investment projects)
• Establish regional development corridors
• Create synergies between South-South and North-South official financial flows
• Developing countries in a position to do so to adopt minimum share for LDCs of their official financial flows
• Increase the developmental impact of South-South FDI through:- Home and host country measures
and policies;- Multilateral financing of
diversification projects;
• Increase LDCs’ access to development finance by meeting DAC-countries aid commitments (0.15-0.20% of GNI)
• Support better aid management policies in LDCs
• Devise innovative sources of funding for LDCs, including in particular SDRs allocation
• Increase share of aid for development of productive capacities through:- More aid for infrastructure and
skills- Innovative uses of aid,
including new approaches to private sector development and PPPs incentivizing FDI in infrastructure development
Trade • Conclude the Doha Round giving central importance to the development outcomes for all developing countries
• Urgently implement the so-called “early harvest” without waiting for the completion of the Doha Round negotiations
• Deepen regional integration in South-South RTAs
• LDCs to develop a pro-active policy stance on South-South economic relations
• Foster regional trade through better information and trade facilitation
• Developing countries in a position to do so provide DFQF market access for LDC exports
• Enable LDCs to pursue strategic integration into global economy
• Empower LDCs to use all flexibilities provided under WTO rules
• Strengthen the special and differential treatment for LDCs
• Improve preferential market access for goods of LDCs, including 100 per cent DFQF by all developed countries
• Extend preferential market access for LDC services exports
• Simplify the accession of LDCs to the WTO
• Accelerate the provision of Aid for Trade through EIF
Commodities • Establish a counter-cyclical financing facility for low income commodity-dependent countries to deal with external shocks
• Set up an innovative commodity price stabilization schemes, including physical and virtual reserves
• Establish transaction tax (multi-tier) for commodity-derivative markets
• Establish a counter-cyclical loan facility indexed to debtors’ capacity to pay
• Strengthen ability of LDCs to manage resource rents
• Technical and financial assistance to enable resource-based industrialization
Technology • Make the global IPR regime more development friendly by- Creating a balance between
private and public dimensions of knowledge
- Supporting emergence of a new and coherent reality of technology transfer that complements domestic capabilities building
• Promote knowledge-intensive activities through mobilization of domestic resources
• Support the emergence of the learning-oriented developmental state that could facilitate knowledge based activities
• Share knowledge and experiences of industrial development strategies
• Set up regional R&D hubs• Strengthen South-South cooperation
on technology, including by providing finance on preferential terms for transfer of technology to LDCs
• Technology-sharing consortia• Technology licence bank for
LDCs• The International Spark Initiative
to promote enterprise innovation• The LDC Talents Abroad Initiative
to pool in the diaspora• Provide IP-related technical
assistance to LDCs that is comprehensive, coherent and development-focused
• Focus the technology transfer under Article 66.2 on expanding the reach of LDCs to technologies across the gamut of competencies in all sectors, accompanied by the know-how

The Least Developed Countries Report 2010XVIII
Priorities for systemic reforms in the global economic regime should include: (i) promoting domestic resource mobilization through increased aid for developing tax administration capability and financial deepening and with global financial and tax cooperation to reduce illicit capital flight and transfer pricing; (ii) promoting country ownership of national development strategies through reform and reduction of conditionalities and helping to rebuild developmental State capacities; and (iii) the enhancement of current debt relief initiatives so that the debt overhang in 20 LDCs which are current in debt distress, or at risk of debt distress, is addressed.
In addition, a new generation of ISMs should include: (i) increasing LDCs’ access to development finance by meeting DAC-countries aid commitments (0.15-0.20% of GNI); (ii) increasing share of aid for development of productive capacities through more aid for infrastructure and skills, innovative uses of aid, including new approaches to private sector development and PPPs incentivizing FDI in infrastructure development; (iii) supporting better aid management policies in LDCs, in particular through sharing experiences; and (iv) devising innovative sources of funding for LDCs, including in particular SDRs allocation. The design of contingency financing and anti-shock facilities is an important issue for LDCs which is also discussed and taken up further under the commodities pillar.
Trade
In the area of trade, it is clear that the successful conclusion of the Doha Round of multilateral trade negotiations under the aegis of the WTO which gives central importance to development outcomes for all developing countries would also benefit LDCs. In addition, the Report makes three major proposals. First, it supports the “early harvest” notion for LDCs, which was presented by LDC Trade Ministers in the context of the Doha Round negotiations. This includes, in particular, full implementation of DFQF market access for all products originating from all LDCs, in line with Decision 36 of Annex F of the Hong Kong WTO Ministerial Declaration, and a waiver decision on preferential and more favourable treatment for services and service suppliers in LDCs. The Report proposes that implementing these measures should not be made contingent on the completion of the Doha Round. Providing full DFQF market access for LDCs on all product lines is also part of Goal 8 of the MDGs, and its accelerated improvement would be an important aspect of strengthening the Global Partnership for Development between 2010 and 2015, even though it has been negotiated in the context of the WTO Doha Round. Secondly, LDCs should be empowered to use all the flexibilities already available under WTO rules to foster the development of their productive capacities and pursue their own form of strategic integration into the global economy. This will
Systemic Reforms in Global Economic Regimes
South-South Development Cooperation
LDC-specific International Support Mechanisms
Climate change • Enhance the sustainability and predictability of climate change financing
• Develop accountable, transparent and representative climate finance governance
• Share knowledge and experience in mitigation and adaptation to climate change
• Strengthen South-South collaboration on renewable energy through technical cooperation, technology transfer, trade and investment.
• Make UNFCCC a key pillar of predictable and equitable climate change finance framework for LDCs
• Replenish and reform LDC Fund• Incorporate climate adaptation
project preparation facility in LDC fund.
• LDC-specific exceptions in mobilization of resources for climate change financing (e.g. Tuvalu proposal for differentiated taxation on international transport)
• Provide technical assistance to support implementation of REDD+ in LDCs
• Reform CDM to promote LDC access to renewable energy sector technology and finance
• Provide technical assistance to support LDC integration of climate adaptation and mitigation needs into national development plans
Source: UNCTAD secretariat.
Table (contd.)

XIXOverview
allow them to develop a new strategic trade policy to support their development and poverty reduction efforts in a manner compatible with the new post-crisis global macroeconomic environment. It would also enable them to take advantage of the new opportunities associated with South-South trade. However, to achieve all this they would need appropriate support. Thirdly, the EIF offers an important operational mechanism for ensuring that aid for trade development in the LDCs focuses on priority activities, and is integrated within national development and poverty reduction strategies. However, during the last decade, the flow of aid for trade, using the OECD statistical definition of this category, was increasing more slowly in LDCs than in other developing countries. A priority ISM for LDCs should be to accelerate that flow to LDCs, and ensure that it is directed at enhancing their productive capacities and international competitiveness in line with the principle of country ownership. Trade-related capacity-building should be seen as part of the wider objective of developing LDCs’ productive sectors and promoting the development of their private sectors. Thus, in addition to trade facilitation, it should include support for technological development and diversification out of commodity dependence.
Commodities
In the area of commodities, the long-term goal should be structural transformation leading to more diversified economies. However, in the short and medium term, some new forms of international commodity policy are required.
Priority actions in the global economic regime could include the introduction of new measures for reducing the volatility of commodity markets and the adverse impacts of that volatility, such as:
(i) The establishment of a global countercyclical financing facility that ensures fast disbursement of aid at times of commodity price shocks, with low policy conditionality and high concessionary elements;
(ii) Setting up of innovative commodity price stabilization schemes, consisting of both physical and virtual reserve facilities;
(iii) Introduction of taxation measures to reduce speculation in global commodity markets; and
(iv) A counter-cyclical loan facility indexing repayment to debtors’ capacity to pay.
The new generation of ISMs in the area of commodities should focus on various kinds of financial and technical assistance to enable greater local value added and linkages from resource-based diversification. These should include support to LDCs for improving the use of resource rents and avoiding Dutch disease effects, investment in improving knowledge of their natural resource potential, and the provision of technical assistance for LDC negotiations with transnational corporations (TNCs) to ensure that a greater proportion of the rents from natural resource exploitation accrue to the LDCs, and that those rents support resource-based industrialization.
Technology
In the area of technology, the NIDA should focus on achieving a new balance between the private and public dimensions of knowledge. Knowledge is both a public good and a proprietary good (or quasi-private good), and includes features of both appropriability and exclusivity. The present global framework for technology issues is fragmented and incomplete, with a strong emphasis on proprietary knowledge in the form of intellectual property rights (IPRs). Within this framework, issues of technology transfer and knowledge accumulation – which are fundamental to improving productive capacities in LDCs – have been accorded secondary importance. The new knowledge architecture should focus on enabling a more development-friendly technology and IPR regime. It can do this by creating a balance between the public and private dimensions of knowledge and supporting the emergence of a new, coherent system of technology transfer that facilitates LDCs’ domestic efforts to build innovative capacity. It should also strengthen LDCs’ efforts to mobilize domestic resources to promote knowledge-intensive activities and encourage the emergence of a learning-oriented developmental State.
New forms of international public goods are required to counter the continued marginalization of LDCs in the acquisition and use of technologies, and also to achieve a gradual realignment of incentives provided under the

The Least Developed Countries Report 2010XX
global IPR regime. The Report makes specific proposals to make TRIPS Article 66.2 work for the LDCs. The Report also offers specific proposals for new ISMs for LDCs in the area of technology, as follows:
(i) Incentives for regional and national technology sharing consortia in LDCs;
(ii) A technology licence bank;
(iii) A multi-donor trust fund for financing enterprise innovation in LDCs; and
(iv) Diaspora networks to pool LDC talents from abroad.
These knowledge-based global public goods would help overcome some major limitations of the innovation environment in LDCs.
Financing climate change adaptation and mitigation
The proposals concerning technology also apply to some of the international policies for climate change mitigation and adaptation. In addition, a critical priority at present is the establishment of an overall architecture for financing such mitigation and adaptation to increase the volume, predictability and sustainability of such financing. It is important for climate-change-related financing to be consistent with the United Nations Framework Convention on Climate Change (UNFCCC) and the Bali Action Plan which targets finance for the promotion of sustainable economic development. Specific ISMs for LDCs include: adequate financing of the LDC Fund (LDCF), increasing technical assistance to LDC for incorporating climate adaptation needs into their national development strategies, constructive engagement in helping LDCs to reduce emissions from deforestation and forest degradation (REDD), and improved access for LDCs to the Clean Development Mechanism (CDM) as a means of overcoming the financial barriers that prevent LDCs’ access to renewable energy technology. The implementation and adoption of LDC proposals on transportation levies and carbon taxes, which call for various exceptions for LDCs, should also be supported.
South-South development cooperation
South-South cooperation is a cross-cutting issue relating to all the pillars of the proposed NIDA. In general, the increasing integration of LDCs with some large and fast-growing economies (such as Brazil, China, India and South Africa — the so-called emerging economies), and to a lesser extent with ODC partners in regional trade agreements (RTAs) through trade, FDI, official development finance and knowledge-sharing can help LDCs develop their productive capacities. To this end, South-South economic relations need to foster domestic economic linkages, employment creation, technological learning, diversification and upgrading of output and exports, and the strengthening of State capacities. At present, this potential is being realized only to a limited extent — far below its possibilities. In order to fulfil the development potential of the evolving South-South economic relations, the Report proposes, firstly, the strengthening South-South development cooperation, by intensifying development cooperation activities and projects, sharing knowledge of successful alternative development strategies adopted by ODCs, improving the transparency of South-South development cooperation, and increasing the synergy between North-South and South-South development cooperation; and secondly, deepening regional integration through RTAs in which LDCs participate, through measures taken by RTA partners and supported by large developing countries, developed-country donors and multilateral institutions.
The Report has also identified the following specific ISMs for consideration within South-South cooperation:
• Developing countries in a position to do so should set aside a minimum share of their official development finance for LDCs;
• Special mechanisms dedicated to LDCs should be established in South-South political forums (e.g. FOCAC);
• RTAs should adopt SDT measures fo LDCs;
• Large and dynamic developing countries in a position to do so should offer DFQF market access to LDC exports;

XXIOverview
• Large and dynamic developing countries should finance the transfer of their technologies to LDCs on preferential terms;
• South-South collaboration on renewable energy should be strengthened through technical cooperation, trade and investment.
In order to improve the development impact of these actions, LDC Governments need to formulate proactive strategies for their deeper economic integration with the other countries of the South. This should include enacting policies and adjusting rules and regulations to help steer this process to maximize its contribution to the development of their productive capacities.
* * * * *
This Report proposes a conceptual framework and a forward-looking agenda for action to create a much more supportive international environment for the LDCs. The international community is meeting in Istanbul, from 29 May to 3 June 2011, for the Fourth United Nations Conference on LDCs. It needs to recognize the urgent need to move beyond business as usual, and enable and empower LDCs to adopt new development paths which will reduce their marginalization in the global economy and substantially reduce poverty. This Report presents an ambitious agenda of systemic reforms relevant for LDCs, and a new generation of international support mechanisms for the coming decade. We must do better than in the past. One billion people will be living in the LDCs by 2017 and we cannot afford, for their sake and ours, to repeat the mistakes of the past.
Dr. Supachai PanitchpakdiSecretary-General of UNCTAD


Chapter
1The Global Financial
Crisis and Recent Boom-Bust Cycle
in the LDCs
A. Introduction
During the past three years, the world economy has been rocked by the bursting of a financial “super-bubble” which had formed in the aftermath of the 2001 dotcom crisis, as housing and other asset prices, all interlinked on a global scale, had become over-inflated owing to speculation, excessive leverage, loose macroeconomic policy and weak regulation. After the bankruptcy of the United States investment bank, Lehman Brothers, in September 2008, stock markets collapsed throughout the world and global financial markets froze as banks stopped lending to each other because of mutual distrust about their level of assets and liabilities. For about five months, global industrial production and trade then plummeted at rates similar to those following the Great Depression of 1929. Although since March 2009 financial markets, industrial production and trade started to recover, global output still was down by 2.2 per cent in 2009, with most countries in the world, including LDCs, experiencing an economic downturn. The United Nations, the International Monetary Fund (IMF) and the World Bank believe that global economic recovery is now under way. But the recovery is fragile and uneven, and serious downside risks remain. Moreover, analysts caution that the global financial and economic crisis is likely to have long-lasting adverse effects on actual and potential output in both developed and developing countries.
This chapter examines the impact of the global financial and economic crisis on the least developed countries (LDCs) with a view to identifying its policy implications. The chapter argues that the effects of the crisis in the LDCs are best understood in terms of a boom-bust cycle which has been typical of their development experience over the long term. The major policy implication is that LDCs need to promote new development paths and that a new international development architecture is required to facilitate this.
The chapter shows that during the period 2002–2007, the LDCs experienced a strong economic boom, but their high rates of GDP growth were largely driven by external factors associated with a pattern of global expansion that was economically unsustainable and a pattern of national expansion which was not inclusive. The pattern of global expansion was unsustainable because it was founded on increasing global imbalances, widening income inequality, rising levels of private debt (household and corporate) and the growing financialization of economic activity.1 Such financialization is a process in which “corporate profits [are] increasingly made through the provision (or transfer) of liquid capital in expectation of future interest, dividends or capital gains rather than through investments to expand capital stock to increase future production or facilitate commodity exchange” (Kripner, 2005: 174). In LDCs, economic growth translated only weakly into poverty reduction and was not underpinned by the development of productive capacities. Indeed, the
During the past three years, the world economy has
been rocked by the bursting of a financial “super-
bubble”, which resulted in a contraction of global output
by 2.2 per cent in 2009.
The effects of the crisis in the LDCs are best understood in terms of a boom-bust cycle
which has been typical of their development experience.

The Least Developed Countries Report 20102
LDCs actually became even more vulnerable to external shocks during the boom period, as their export concentration and dependence on commodities and external resources increased. In this respect, UNCTAD’s LDC Report 2008 warned that the growth process in these countries was very fragile and unlikely to be sustainable — a judgment that is supported by recent events.
When the global economy fell into the deepest recession since the Great Depression, the LDCs as a group also experienced a sharp economic slowdown. Although these countries’ contribution to global production and global trade is marginal, international trade and external finance, particularly foreign direct investment (FDI) and ODA, account for significant shares of their economies. The fallout of the global economic crisis was thus transmitted to LDCs mainly through the collapse of international trade, falling FDI inflows, and in some cases also declining remittances. However, given that different LDCs are integrated into the global economy in dissimilar ways, the impacts of the crisis have varied considerably among them according to their structural characteristics. The slowdown in 2009 was particularly sharp in the oil- and mineral-exporting LDCs, in a few (but not all) LDC exporters of manufactures and in some tourism-dependent island LDCs.
Despite the slowdown, in 2009 the LDCs as a group actually achieved a higher GDP growth rate than either the group of other developing countries (ODCs) or developed countries. But the chapter argues that the apparent macroeconomic resilience of the LDCs during the crisis can be largely attributed to a number of external factors. Notably, 2009 saw a substantial increase in assistance from the IMF, the World Bank and regional development banks, which partly offset the decline in private capital flows. In addition, there was a recovery of international commodity prices during the year, associated mainly with growing demand from large emerging economies, and the focus of LDC exporters of manufactures on low-end products benefited from the growing demand for these products through the recession. Finally, workers’ remittances to the LDCs that are the most dependent on them continued unabated.
The analysis in this chapter suggests that there are major risks to the medium-term outlook for LDCs. Generally, the recent increase in official lending by multilateral development banks has tended to take the form of bringing forward the funding which had been programmed for delivery over a longer period. On top of that, as donors strived to adopt adequate countercyclical responses, the increase in development assistance has also strained their financial resources. Current projections by the Organisation for Economic Co-operation and Development of donors’ forward spending plans indicate only a marginal increase in country programmable aid for LDCs in 2010 and 2011 (OECD, 2009). Thus, as the joint World Bank/IMF Global Monitoring Report 2010 states, “[a]bsent increased resources, these essential steps to provide desperately needed resources at the height of the crisis will imply a substantial shortfall in concessional financing over the next couple of years” (World Bank 2010c: 142). In addition, 20 LDCs remain in a situation of debt distress, or at high risk of debt distress, while debt vulnerabilities are likely to worsen in the wake of the global economic crisis in some others (IMF; 2010b). Against this background, it is not surprising that existing economic forecasts estimate that, while the slowdown in LDCs in 2009 was smaller than in other developing countries, the recovery in 2010 will also be slower. Indeed their economic recovery is expected to be the most anaemic of all country groups. It will depend particularly on whether the global recovery is sustained, and whether ODA continues to be provided in forms which boost investment and maintain consumption per capita.
The fallout of the global economic crisis was
transmitted to LDCs mainly through the collapse of
international trade, falling FDI inflows, and in some
cases also declining remittances.
The impacts of the crisis have varied considerably among
LDCs according to their structural characteristics.

3The Global Financial Crisis and Recent Boom-Bust Cycle in the LDCs
It is difficult to gauge the overall social impact of the global economic crisis on the LDCs because only a few country studies on this issue have been conducted so far. However, this chapter argues that while protecting poor people in the face of the global recession is important, the basic problem in the LDCs is long-standing and persistent mass poverty, which is associated with their very low per capita income. According to one estimate, the economic crisis may have resulted in an additional 9.5 million people living in extreme poverty in the LDCs than would have been the case in the absence of a crisis (Karshenas, 2009). But whilst this is important, it is equally important that the number of people living in extreme poverty in LDCs continued to increase by over 3 million people per year, even during the period of high GDP growth rates of 2002–2007, reaching an estimated 421 million in 2007.
It is clear from the data that during the 2000s there was some improvement in poverty reduction rates and progress in compliance with the MDGs. However, the basic problem for policymakers is that poverty reduction has been slow despite the rapid rates of economic growth. As section D of this chapter shows, the majority of LDCs are not on track to achieve most of the Millennium Development Goals (MDGs), testifying the limited inclusiveness of economic growth during the years of the boom. If the global economic crisis has more lasting effects in LDCs and the rather bleak medium-term outlook materializes, even the modest achievements in poverty reduction between 2000 and 2007 will be jeopardized and the number of people living in extreme poverty in LDCs will rise. Indeed if poverty reduction rates over the next five years fall to those of the 1990s, there could be an additional 77 million people living in extreme poverty by 2015 than if the poverty reduction rates of the period 2000–2007 were to be maintained.
The evidence of the chapter, which underpins these findings is organized in three main sections. Section B discusses growth trends in LDCs during the boom-bust cycle. It assesses the extent to which the pattern of economic growth during the boom period was associated with the development of productive capacities, which are fundamental to resilience, and it shows how different LDCs fared after the bust, during the global recession of 2009. Section C identifies the major channels through which the negative spillover effects of the crisis affected the real economies of the LDCs and it examines the national and international policy responses, which together have attenuated the negative impacts of the crisis. It also considers some factors affecting the medium-term economic outlook for these countries. Section D considers poverty and human development trends during the boom-bust cycle. It examines long-term trends in income poverty in LDCs using a new set of poverty estimates prepared for this Report. It also describes progress towards the MDGs, and considers possible future poverty reduction and human development scenarios if the global financial and economic crisis has long-lasting effects on the LDCs and slows down rates of progress in terms of key social indicators.
B. The anatomy of the boom-bust cycle
1. THE ECONOMIC BOOM OF 2002–2007
During the period 2002–2007, the real gross domestic product (GDP) of the LDCs as a group grew by more than 7 per cent per annum. This was the strongest and longest growth acceleration achieved by this group of countries
Existing economic forecasts estimate that, while the
slowdown in LDCs in 2009 was smaller than in other developing countries, the
recovery will also be slower.
The economic crisis may have resulted in an additional
9.5 million people living in extreme poverty in the LDCs
than would have been the case in the absence of a crisis.

The Least Developed Countries Report 20104
since 1970, and a much better macroeconomic performance than in the 1990s (table 1). Not all LDCs experienced the boom. Indeed, in just over a quarter of the LDCs (14 countries), GDP per capita declined or grew sluggishly. Moreover, because of the high rate of population growth in the LDCs, per capita GDP growth rates, which matter more for human well-being, remained slightly lower than in other developing countries. Nevertheless, the target growth rate of the Brussels Programme of Action for the LDCs for the decade 2001–2010 was achieved in the LDCs as a group and also in 16 LDCs over this boom period (table 2).
The economic boom of 2002–2007 in LDCs was underpinned by a significant increase in external resources available to LDCs compared with those available in the 1990s. World demand and world trade were booming, commodity prices were rising and transnational corporations (TNCs) were increasingly seeking raw materials during this period. The total volume of exports from the LDCs almost doubled between 2000 and 2008, with African LDCs leading the expansion as new oil and mineral resources came on-stream (chart 1A and 1B). Though the growth in LDCs’ export volume was slower than that of other developing countries during this period, the LDCs experienced much-improved terms of trade, owing essentially to the surge in primary commodity prices. This benefited resource-rich African LDCs in particular (chart 1E and 1F). As a result, the purchasing power of LDCs’ exports almost tripled between 2000 and 2008, rising even faster than the corresponding index for other developing countries (chart 1G). While LDCs in all regions benefited from some improvements, African LDCs benefited the most, the purchasing power of their exports growing almost fourfold between 2000 and 2008 (chart 1H).
Given their level of underdevelopment, LDCs’ economies tend to be import-sensitive, in the sense that both the full utilization and the development of their productive capacities depend on imported inputs and capital goods. With the alleviation of their foreign exchange constraint as a result of the increase in the purchasing power of their exports, there was an increase in their import volumes, particularly in African and island LDCs where imports doubled in eight years (chart 1C and 1D).
The economic boom in the LDCs was also underpinned by a significant, though unevenly distributed, surge in external financing in its various forms (chart 2):
• After the disappointing decade of the 1990s, when net ODA disbursements to LDCs (excluding debt relief) declined by roughly 30 per cent in real terms, those disbursements doubled in real terms from 2000 to 2008, reaching $37 billion in 2008.
Table 1Comparison of GDP growth rates in LDCs before and during the boom period, 1991–2008
(Percentage growth rates in constant 2000 dollars)
Real GDP growth Real GDP per capita growth
1991–2001 2002–2007 2008 1991–2001 2002–2007 2008
LDCs 3.9 7.4 6.9 3.1 4.9 4.4African LDCs and Haiti 3.0 7.5 7.9 1.3 4.6 5.1Asian LDCs 5.1 7.3 5.5 0.2 5.4 3.8Island LDCs 3.8 8.2 4.5 2.8 -1.4 2.1Other developing countries 4.8 6.5 5.3 1.9 5.1 4.0Source: UNCTAD secretariat calculations, based on UNCTAD’s GlobStat database.Note: Real GDP data has been rebased using an implicit GDP deflator.
The total volume of LDCs exports and imports increased
rapidly during the boom: they benefited from improved terms of trade, and there was a significant, though unevenly distributed, surge in external financing in the form of ODA,
FDI and remittances.
During the period 2002–2007, the real gross domestic
product of the LDCs as a group grew by more than
7 per cent per annum.

5The Global Financial Crisis and Recent Boom-Bust Cycle in the LDCs
Table 2Real GDP and real GDP per capita growth rates of LDCs, 2002–2008
Export specialization
Real GDP growth (constant 2000 dollars)
Real GDP per capita (constant 2000 dollars)
Fragile States according to WB
CPIA score for 2004
Average 2002–2007 2008 Average
2002–2007 2008
Countries with real GDP growth > 6% in 2002–2007Afghanistan Agricultural 18.6 3.4 14.4 -0.1 “2004-fragile”Equatorial Guinea Oil 16.7 15.2 13.5 12.2Angola Oil 14.3 14.8 10.9 11.8 “2004-fragile”Myanmar Mixed 13.2 4.5 12.4 3.6 “2004-fragile”Chad Oil 11.8 0.3 8.1 -2.3 “2004-fragile”Cambodia Manufactures 10.3 6.0 8.5 4.3 “2004-fragile”Sudan Oil 10.2 7.6 7.9 5.2 “2004-fragile”Sierra Leone Minerals 9.5 5.5 5.6 2.9 “2004-fragile”Mauritania Minerals 8.8 2.2 5.9 -0.2 “2004-fragile”Bhutan Manufactures 8.7 6.6 5.8 4.9Ethiopia Services 8.2 11.3 5.4 8.5Mozambique Minerals 8.0 7.0 5.2 4.5Maldives Services 8.0 5.8 6.5 4.3United Rep. of Tanzania Services 7.2 7.5 4.3 4.4Uganda Agricultural 7.2 9.5 3.7 6.0Lao People's Dem. Rep. Mixed 7.0 7.5 5.2 5.5 “2004-fragile”Sao Tome and Principe Services 6.7 5.8 4.9 4.1 “2004-fragile”Malawi Agricultural 6.3 7.4 3.4 4.5Dem. Rep. of the Congo Minerals 6.2 6.2 3.0 3.3 “2004-fragile”
Countries with real GDP growth between 3% and 6% in 2002–2007Bangladesh Manufactures 5.9 6.2 4.2 4.7Rwanda Services 5.8 11.2 3.7 8.2Burkina Faso Agricultural 5.8 4.5 2.3 1.0Solomon Islands Agricultural 5.3 6.0 2.7 3.4 “2004-fragile”Zambia Minerals 5.3 6.3 2.9 3.7Mali Minerals 5.0 4.7 2.5 2.3Niger Minerals 4.9 5.9 1.2 1.8Senegal Mixed 4.7 2.5 2.0 -0.2Vanuatu Services 4.3 5.7 1.6 3.1 “2004-fragile”Samoa Services 4.2 -3.4 4.1 -3.4Yemen Oil 4.1 3.9 1.2 1.0Lesotho Manufactures 4.0 3.5 2.9 2.6Madagascar Mixed 3.9 5.0 1.0 2.3Nepal Manufactures 3.8 5.6 1.7 3.7Benin Agricultural 3.6 5.0 0.2 1.8Djibouti Services 3.5 5.8 1.7 3.9 “2004-fragile”
Countries with real GDP growth < 3% in 2002–2007Tuvalu Agricultural 3.0 2.0 2.5 1.6Timor-Leste Oil 2.8 6.8 -1.2 3.5 “2004-fragile”Burundi Minerals 2.7 4.5 -0.2 1.5 “2004-fragile”Somalia Agricultural 2.6 2.6 0.2 0.4 “2004-fragile”Gambia Services 2.6 4.9 -0.5 2.1 “2004-fragile”Togo Mixed 2.5 1.1 -0.1 -1.4 “2004-fragile”Guinea Minerals 2.4 4.0 0.4 1.7 “2004-fragile”Comoros Services 1.8 1.0 -0.4 -1.3 “2004-fragile”Kiribati Agricultural 1.6 6.3 -0.1 4.7 “2004-fragile”Guinea-Bissau Agricultural 1.0 3.1 -1.4 0.8 “2004-fragile”Eritrea Services 0.7 1.0 -3.1 -2.0Haiti Manufactures 0.4 1.3 -1.2 -0.3 “2004-fragile”Central African Rep. Minerals 0.4 2.2 -1.4 0.3 “2004-fragile”Liberia Agricultural -2.3 7.1 -5.5 2.4 “2004-fragile”Source: UNCTAD secretariat calculations, based on UNCTAD’s GlobStat database, and World Bank (WB), Country Policy and Institutional
Assessment (CPIA) score, online .Note: Real GDP data has been rebased using an implicit GDP deflator.

The Least Developed Countries Report 20106
Chart 1Merchandise trade indices, 2000–2008
(Indices, 2000=100)
Volume index of exportsA B
C D
E F
G H
0
50
100
150
200
250
0
50
100
150
200
250
0
50
100
150
200
250
0
50
100
150
200
250
2000 2001 2002 2003 2004 2005 2006 2007 2008 2000 2001 2002 2003 2004 2005 2006 2007 2008
2000 2001 2002 2003 2004 2005 2006 2007 2008 2000 2001 2002 2003 2004 2005 2006 2007 2008
2000 2001 2002 2003 2004 2005 2006 2007 20082000 2001 2002 2003 2004 2005 2006 2007 2008
2000 2001 2002 2003 2004 2005 2006 2007 2008 2000 2001 2002 2003 2004 2005 2006 2007 2008
Volume index of imports
Terms-of-trade index
0
20
40
60
80
100
120
140
160
180
0
20
40
60
80
100
120
140
160
180
Purchasing power of exports
0
50
100
150
200
250
300
350
400
0
50
100
150
200
250
300
350
400
Developed countriesOther developing countries
LDCs African LDCs and HaitiAsian LDCsIsland LDCs
Source: UNCTAD secretariat calculations, based on UNCTAD’s GlobStat database.
• The improvement in LDCs’ external accounts has also been bolstered by debt relief, which increased considerably as a result of two initiatives: the Heavily Indebted Poor Countries (HIPC) and the Multilateral Debt Relief Initiative (MDRI). These initiatives have substantially reduced the debt-to-GDP and debt-to-export ratios of a significant subset of countries

7The Global Financial Crisis and Recent Boom-Bust Cycle in the LDCs
in the LDC group, improving the overall sustainability of their debt and freeing considerable amounts of resources that were previously earmarked for debt servicing (UNCTAD, 2010a).
• FDI flows to LDCs, although still lower than net ODA disbursements, also grew spectacularly during the 2000s. Between 2000 and 2008 they increased sixfold, exceeding $32 billion in 2008. Over 80 per cent of these flows went to natural-resource-rich African LDCs, though a number of island LDCs have also received growing inflows relating to investments in tourism and transport services.
• Finally, workers’ remittances, which increased fourfold between 2000 and 2008, also contributed to the rise in LDCs’ foreign exchange. However, these inflows were also unevenly distributed across countries, with the three largest recipients (Bangladesh, followed by Sudan and Nepal) accounting for almost two thirds of total remittances to LDCs.
Most LDC Governments also made a major policy effort during this period to sustain and deepen the economic reforms undertaken in the 1990s. They also sought to add a more explicit social and poverty reduction dimension through the formulation and implementation of Poverty Reduction Strategy Papers. In conjunction with the rapid increase of export earnings and external finance, these policies brought some improvements to LDCs’ macroeconomic
Chart 2Capital inflows and remittances to LDCs, 1990–2008
($ billion)
A. Net ODA disbursements, excluding debt relief
0
5
10
15
20
25
30
35
40
1990 1992 1994 1996 1998 2000 2002 2004 2006 2008 1990 1992 1994 1996 1998 2000 2002 2004 2006 2008
1990 1992 1994 1996 1998 2000 2002 2004 2006 2008 1990 1992 1994 1996 1998 2000 2002 2004 2006 2008
B. Debt forgiveness
0
5
10
15
20
25
30
35
0
5
10
15
20
25
30
35C. FDI inflows D. Remittances inflows
0
5
10
15
20
25
Source: OECD, International Development Statistics database (online); World Bank 2010b, and Global Development Finance 2010 (online); UNCTAD FDI/TNC database.
The improvement in LDCs’ external accounts has also
been bolstered by debt relief, which increased as a result the Heavily Indebted Poor Countries (HIPC) and the Multilateral Debt Relief
Initiative (MDRI).
The Least Developed Countries Report 20108
fundamentals, though these were unevenly distributed across countries according to their structural conditions. In the median LDC, inflation rates during the first half of the 2000s (until late 2007) were about half their level of the 1990s. Compared to the previous decade, current-account deficits shrunk in a number of LDCs, debt burdens fell and foreign reserves grew. Some improvements in the mobilization of government revenues were also achieved by several LDCs, including some in Africa (e.g. Benin, Lesotho, Madagascar and Mali).2
Some observers contend that good national economic policies and improved national governance embodied in economic reforms were the key factors contributing to the economic boom in the LDCs. But it is difficult to isolate the respective roles of national policies and the international environment. One indication of the primacy of external factors is the very weak association between countries that were designated as “fragile States” during the boom and their growth performance. The notion of a “fragile State” is very controversial and has not been endorsed in UNCTAD’s analyses of LDCs. But using the World Bank Country Policy and Institutional Assessment scores, based on their definition of weakness of policies and institutions, and focusing on those countries that were classified by the World Bank as “fragile States” in 2004, an interesting pattern emerges. Almost all the LDCs that displayed weak economic performance during the boom period of 2002–2007 were “fragile States” in 2004, but at the same time, more than half the LDCs that performed the best, including half of those which reached the 7 per cent growth target of the Brussels Programme of Action, were also classified as “fragile States”. Thus, although weak economic performance is associated with weak economic policies and institutions according to these criteria, having such policies and institutions in place is not a necessary condition to achieve good economic performance over the short-to-medium run. LDCs identified as “fragile States” in 2004 were as likely to display very good economic performance as weak performance during the boom.
With the kinds of national policies pursued in the 2000s, the LDCs were unable to make the most of the opportunities presented by the boom. In particular, they were unable to promote a pattern of catch-up growth based on the development of productive capacities which would increase the resilience of their economies and set them on a more inclusive growth path. From a long-term perspective, after the prolonged decline of the 1980s and early 1990s, the LDCs started the new millennium with approximately the same level of real per capita income that they had in 1970 (see Box 1). Since then, although their per capita GDP was increased significantly in real terms, their productivity gap with other developing countries continues to widen (see also below).
The export-led growth model, which implicitly or explicitly underpinned most LDCs’ development strategies during this period, did not result in much of an increase in investment and capital formation in many of them. These countries also became more vulnerable to a global slowdown as international trade became increasingly important to them and their commodity dependence, export concentration and food imports increased. The export-led growth model was also associated with growing sectoral imbalances, as agricultural productivity lagged far behind the expansion of exports and GDP. This mounting disproportion has led to rising food import bills, and has had significant negative consequences for both the robustness and inclusiveness of the LDC development path. The problems of the weak development of productive capacities and increasing vulnerability to a global
However, with the kinds of national policies pursued in the 2000s, the LDCs were
unable to make the most of the opportunities presented by the boom. In particular, they were unable to promote a pattern of catch-up growth based on
the development of productive capacities
The export-led growth model did not result in much of an increase in investment and capital formation in many
LDCs.
Compared to the previous decade, current-account
deficits shrunk in a number of LDCs, debt burdens fell and
foreign reserves grew.

9The Global Financial Crisis and Recent Boom-Bust Cycle in the LDCs
Box 1. The economic boom of 2002–2007 in a long-term perspective
It is instructive to put the economic boom which occurred in the LDCs in the period 2002–2007 in a longer-term perspective. Box Chart 1a shows trends in real GDP per capita over the last forty years. The real GDP per capita of the LDCs was actually declining from 1970 up to 1994. It has been growing since then at a rate faster than in developed countries, but even during the five years of the boom, per capita growth in LDCs did not outpace the average of other developing countries.
In a long-term perspective, the gap in income per capita between LDCs and other developing countries was still larger in 2008 than it had been in the early 1970s. The real GDP per capita in the LDCs was 2.5 per cent of that in developed countries in the early 1970s, declined to 1.4 per cent of their GDP per capita in 1994, and at the end of the boom in 2008 it had reached a mere 1.9 per cent of their GDP per capita. The comparison with other developing countries is even starker, though in absolute term the gap in real income is of course lower. Real GDP per capita in the LDCs fell from 45 per cent of that in other developing countries in the early 1970s to 22 per cent in 2006-2008 (roughly the same level touched in 1994). These gaps are smaller if they are estimated in purchasing power parity terms but the trends remain the same.
Box Chart 1b shows that not only have LDCs grown the least in per capita terms over the long term, but their economic growth has been far more volatile from one year to the other. Taking the period as a whole, the overall coefficient of variation for the LDCs as group was 4.4, compared to 0.6 in other developing countries and 0.7 in developed ones. During the boom period, volatility was much lower and comparable to other developing countries — though there was then a major growth slowdown in the LDCs after the global financial crisis.
Focusing on the frequency of growth accelerations and decelerations using methodology developed by Arbache and Page (2007), it is apparent that growth accelerations are less frequent in the LDCs than in other groups of countries, while growth decelerations are more frequent. LDCs’ tendency to growth reversal can be inferred quite clearly also on a short-term perspective, from the frequency with which they experienced negative growth in real GDP per capita. The inspection of historical data at country level reveals that the median LDC has experienced 11 years of negative real growth between 1980 and 2008. In other words, in 39 % of the 1384 country/year observations available, LDCs have experienced a real decline in GDP per capita. Similar figures are even more worrying since negative shocks appear on average to permanently reduce the level of output, as documented by Cerra and Saxena (2005). As a consequence, LDCs proneness to growth collapses could be closely associated with their long-term income divergence from other country-groups.
Box chart 1GDP per capita growth in LDCs and other groups of countries
A. Real GDP per capita in 1990 dollars (constant prices and exchange rates)
500
0
1 000
1 500
2 000
2 500
3 000
1970 1974 1978 1982 1986 1990 1994 1998 2002 2008
5 000
10 000
15 000
20 000
25 000
30 000
Developing economies excluding LDCsLDC weighted averageDeveloped economies (right scale)
B. Per capita real GDP growth(based on constant 1990 prices and exchange rate)
2.0
0.7
1.8
2.8
0.6
5.2
0.60.4 0.3
4.4
0.3
5.2
0 0
1
2
3
4
5
6
Averagegrowth rate
Averagegrowth rate
Coefficientof variation
Coefficientof variation
1971–2008 2002–2007Developed economies Developing excl. LDCs LDCs
Source: UNCTAD secretariat calculations, based on UNCTAD’s GlobStat database.
Box table 1Growth accelerations and decelerations in different groups of countries
Growth acceleration Growth deceleration
Frequency(country years)
GDP per capitagrowth rate (%)
Frequency(country years)
GDP per capitagrowth rate (%)
High-income OECD countries 0.54 3.31 0.03 -2.32High-income non OECD countries 0.42 5.90 0.02 -4.62Developing countries 0.46 4.33 0.14 -3.87LDCs 0.36 4.36 0.26 -2.99Source: UNCTAD secretariat calculations, based on World Bank, World Development Indicators database; and World Bank,
2010c.
The Least Developed Countries Report 201010
growth slowdown are taken up in the next section, while the failure of this growth pattern to achieve substantial poverty reduction and progress towards the MDGs is discussed later in the chapter.
2. WEAK DEVELOPMENT OF PRODUCTIVE CAPACITIES DURING THE BOOM PERIOD
National productive capacities develop through the interrelated processes of capital accumulation, structural change and technological progress. As argued in LDCR 2006, these processes have been historically weak in the LDCs. But the evidence shows that they have continued to be generally weak even during the boom years, despite the rapid rates of economic growth achieved by the LDCs.
(a) Capital accumulation
During the 2000s, investment in the LDCs as a group increased from 19.5 per cent of GDP at the beginning of the decade to 23.2 per cent in 2008. However, more than a third of this increment was due to changes in inventories, and did not involve a genuine expansion of productive capital. Gross fixed capital formation (GFCF) rose at a slower pace, but still remains significantly lower than the corresponding share for other developing countries. Even more worryingly, GFCF has actually fallen since the early 2000s in 19 LDC, mostly African and island LDCs where investment in fixed capital was already rather low. The unprecedented period of economic growth thus brought only limited improvements in LDCs’ chronic shortfalls of investment, while they continued to suffer from a significant infrastructural gap and the widespread presence of supply-side bottlenecks. This is particularly the case for African LDCs, which lack infrastructure and social overhead capital, and where investment ratios remain far lower than in Asian and island LDCs.
As shown in the first two panels of chart 3, both oil and non-oil exporters have witnessed a moderate rise in investments, and the latter have invested a slightly higher share of their GDP. But what clearly distinguishes oil- from non-oil exporters throughout the 2000s is the dynamic of domestic savings. Excluding oil exporters, domestic savings in LDCs have remained constant at a very low level of around 10 per cent of GDP. The windfall in export revenues, which dramatically increased domestic savings in the 6 oil-exporting LDCs is what has driven an apparent increase in domestic savings in the LDCs as a group.
The combination of trends in investment and savings implies that the external resource gap for the LDCs as a group has shrunk markedly in the recent past. However, this is mainly due to the higher savings in the oil-exporting LDCs. If these countries are excluded, the external resource gap, reflecting a reliance on foreign savings, increased from 9 per cent of GDP in 2001 to 14 per cent in 2008 (chart 3).3
Moreover, the centrality of natural-resource-intensive sectors within the economic boom of the LDCs raises issues of sustainability owing to the irreversible depletion of natural resources. Once domestic savings are adjusted for the cost of depleting stocks of fossil fuels, minerals and other forms of environmental capital, it is clear that the unprecedented growth rate of the LDCs has been accompanied by a steady decline, rather than any increase, in net adjusted savings. The net adjusted savings of the LDCs as group have always been very low as a percentage of GDP, but they reached close to zero in 2008 (chart 4).4
Excluding oil exporters, domestic savings in LDCs
have remained constant at a very low level of around 10
per cent of GDP.
Once domestic savings are adjusted for the cost of
depleting stocks of fossil fuels, minerals and other forms of environmental capital, it is
clear that the unprecedented growth rate of the LDCs
has been accompanied by a steady decline in net adjusted
savings.
During the 2000s, investment in the LDCs as a group
increased from 19.5 per cent of GDP at the beginning of the decade to 23.2 per cent
in 2008.

11The Global Financial Crisis and Recent Boom-Bust Cycle in the LDCs
(b) Structural change and technological progress
Since the economic boom in LDCs was not accompanied by any significant structural change in the composition of output, productivity growth and technological progress were also sluggish. Indeed, the productivity gap between LDCs and other developing countries further widened, while the gap vis-à-vis developed economies, at the technological frontier, remained abysmal.
For LDCs as a group, the major feature of the pattern of structural change during the boom has been the relative decline in the contribution of agriculture to GDP and the relative increase in the contribution of non-manufacturing industries such as mining, utilities and construction (table 3). Even though the share of agriculture in GDP fell to 26 per cent during the period 2006–2008, this sector continues to be the main source of employment, absorbing two thirds of the labour force during that span. The manufacturing sector contributed 10 per cent of GDP in 2006–2008, the same level as at the start of the boom and in 2000–2002. Within the overall pattern, there is considerable variation among the LDCs. The expansion of mining and utilities is more visible in African LDCs, reflecting their relatively richer endowments of mineral resources, while the share of manufacturing in GDP has increased modestly in some Asian LDCs. But at the other end of the spectrum, 27 LDCs experienced some degree of deindustrialization (reflected in the declining
Chart 3Investment and savings in LDCs, 1995–2008
(Percentage of GDP)
All LDCs
0
5
10
15
20
25
0
5
10
15
20
25
1995 1996 1997 1998 1999 2000 2001 2002 2003 2004 2005 2006 2007 2008 1995 1996 1997 1998 1999 2000 2001 2002 2003 2004 2005 2006 2007 2008
Gross domestic savings Gross f ixed capital formation
LDCs excluding oil exporters
Gross domestic savings Gross f ixed capital formation
1995 1996 1997 1998 1999 2000 2001 2002 2003 2004 2005 2006 2007 2008
Resource gapa
0
2
4
6
8
10
12
14
16
All LDCs LDCs, excluding oil exporters
Source: UNCTAD secretariat calculations, based on UNCTAD’s GlobStat database. a Resource gap = Gross fixed capital formation – gross domestic savings.
Since the economic boom in LDCs was not accompanied by any significant structural change in the composition of output, productivity growth and technological progress
were also sluggish.

The Least Developed Countries Report 201012
share of manufactures in their GDP). Finally, the smallest decline in the share of agriculture was in the slowest growing LDCs; indeed, in some of these countries, a number of which were affected by conflict, the share of agriculture in GDP actually increased.
The employment challenge, which is the key to substantial poverty reduction, is closely related to the pattern of structural change. The LDCs generally have very high population growth rates, and consequently the number of young people entering the labour market is increasing each year. Agriculture typically employs a large share of the labor force in LDCs, but agricultural productivity remains very low and the majority of farms are small, with the result that living standards for most peasants tend to be at or near subsistence levels. The sector is also less able now to absorb labour owing to decreasing farm sizes and lack of investment, including poor soil management. People are often being forced to cultivate more ecologically fragile land. As a consequence, more and more people are seeking work outside agriculture, but most LDCs have simply been unable to generate sufficient productive employment opportunities for the young population in the manufacturing and services sectors. The non-manufacturing industries whose contribution to GDP has grown the most tend to be capital-intensive rather than labour-intensive. Thus the majority of young people are finding work in informal
Chart 4Savings and depletion of natural resources in LDCs, 1990–2008
(Percentage of GNI)
-5
0
5
10
15
20
25
1990 1991 1992 1993 1994 1995 1996 1997 1998 1999 2000 2001 2002 2003 2004 2005 2006 2007 2008
Gross savings Energy depletion Adjusted net savings
Source: UNCTAD secretariat calculations, based on World Bank, World Development Indicators, online.
Table 3Structural change in the composition of output in LDCs, 2000–2008
Agriculture Manufacturing Industry, excl. Manufacturing
Services
2000–2002 2006–2008 2000–2002 2006–2008 2000–2002 2006–2008 2000–2002 2006–2008
LDCs total 30.7 26.8 10.0 10.0 15.2 20.6 44.2 42.6LDCs: Africa and Haiti 32.0 28.0 7.8 7.8 17.4 24.4 42.8 39.9LDCs: Asia 29.1 25.0 12.9 14.0 12.6 14.3 45.5 46.8LDCs: Islands 21.4 21.5 7.4 6.0 7.0 8.5 64.2 64.0Source: UNCTAD Secretariat calculations, based on UNCTAD’s GlobStat database.
27 LDCs experienced some degree of deindustrialization
between 2000 and 2008.
The employment challenge, which is the key to substantial poverty reduction, is closely
related to the pattern of structural change.

13The Global Financial Crisis and Recent Boom-Bust Cycle in the LDCs
activities, most of which are characterized by low capital accumulation and limited productivity, and hence offer a narrow scope for economic growth.
The overall and ongoing pattern of structural change in the LDCs can be described as a “blocked structural transition”. More and more people are seeking work outside agriculture, but the pattern of structural change in output means that they cannot find productive and decent work. In 2008, own account and contributing family workers, mainly engaged in informal economic activities, represented about 80 per cent of the workforce in the LDCs (UNDP, 2010). Precisely because the boom reinforced the existing specialization in (mostly non-agricultural) primary commodities, instead of spurring the expansion of labour-intensive manufactures and services, economic growth failed to translate into broad-based employment creation. In turn, the slackness of job creation outside an agricultural sector with low productivity has been a major reason for the relatively weak effects of growth on poverty reduction and on progress in meeting the MDGs. The employment challenge is particularly severe in sub-Saharan Africa, where demographic pressure on the labour market is combined with sluggish, if any growth in manufacturing and services (UNECA, 2010).
In the long-term, this pattern of structural change and jobless growth also diminishes the effective return to human capital accumulation, as people who invested in skill-acquisition are increasingly unable to find adequate employment opportunities. From this perspective, LDCs’ growth trajectory in the 2000s represented a lost opportunity to foster a stronger demand for “human capital deepening”, which would have helped trigger a shift towards more knowledge-intensive activities.
In addition to structural change, productive capacities are acquired and expanded by means of technical progress. Here it is worth noting that investment in new capital equipment, which is generally imported, is a major channel for technological upgrading and innovation in LDCs. The trend in imports of machinery and equipment indicates that the bulk of technological development through such investment occurred in oil-exporting LDCs, whereas access to imported and presumably more efficient technologies by other LDCs increased only marginally (chart 5). This suggests that not only was structural change slow during the economic boom, but also that technological progress was minimal.
Owing to the limited availability of capital and the slow absorption of new technologies, labour productivity has been growing very slowly in LDCs, and it remains very low. A slight acceleration occurred in the 2000s in the LDCs as a group, but their GDP per worker has actually fallen further behind that of middle-income countries (chart 6).
A similar stagnation of productivity is apparent in the agricultural sector. As discussed in the LDC Report 2009, LDCs have experienced decades of prolonged underinvestment in key infrastructure, lack of appropriate research and development (R&D) and the dismantling of the few institutions capable of conducting agricultural policies. As a result of the low availability of capital, and the limited use of fertilizers and high-yielding crop varieties, stagnating labour productivity in the primary sector stands out clearly in the first panel of chart 7, as does the marked divergence of LDCs from middle- and high-income countries. Similarly, cereal yield per hectare in LDCs has increased only marginally over the last 20 years, and at a much slower rate than the world average (second panel of chart 7).
Most LDCs have simply been unable to generate sufficient
productive employment opportunities in the manufacturing and
services sectors.
LDCs’ growth trajectory in the 2000s represented a lost opportunity to foster a
stronger demand for “human capital deepening”.
Productivity in the agricultural sector continued to stagnate even during the
boom.

The Least Developed Countries Report 201014
Chart 5Per capita imports of machinery and transport equipment
($ per person)$
per p
erso
n
0
50
100
150
200
250
300
350
400
450
1995 1996 1997 1998 1999 2000 2001 2002 2003 2004 2005 2006 2007 2008
LDCs oil exporters LDCs excluding oil exporters ODCs
Source: UNCTAD secretariat calculations, based on UNCTAD’s GlobStat database.
Chart 6GDP per person employed, 1991–2008
(Thousand constant 1990 PPP dollars)
0
2
4
6
8
10
12
1991 1992 1993 1994 1995 1996 1997 1998 1999 2000 2001 2002 2003 2004 2005 2006 2007 20080
10
20
30
40
50
60
LDCs (left scale) Middle-income countries (left scale) High-income countries (right scale)
Source: UNCTAD secretariat calculations, based on World Bank, World Development Indicators, online.
A comparison between labour productivity indices for the primary sector and for the economy as a whole reveals the extent to which agriculture has been bypassed by technological progress and capital accumulation in LDCs. Over the past 20 years, agricultural value added per worker has grown at a third of the speed of GDP per worker, with the gap widening precisely in the boom
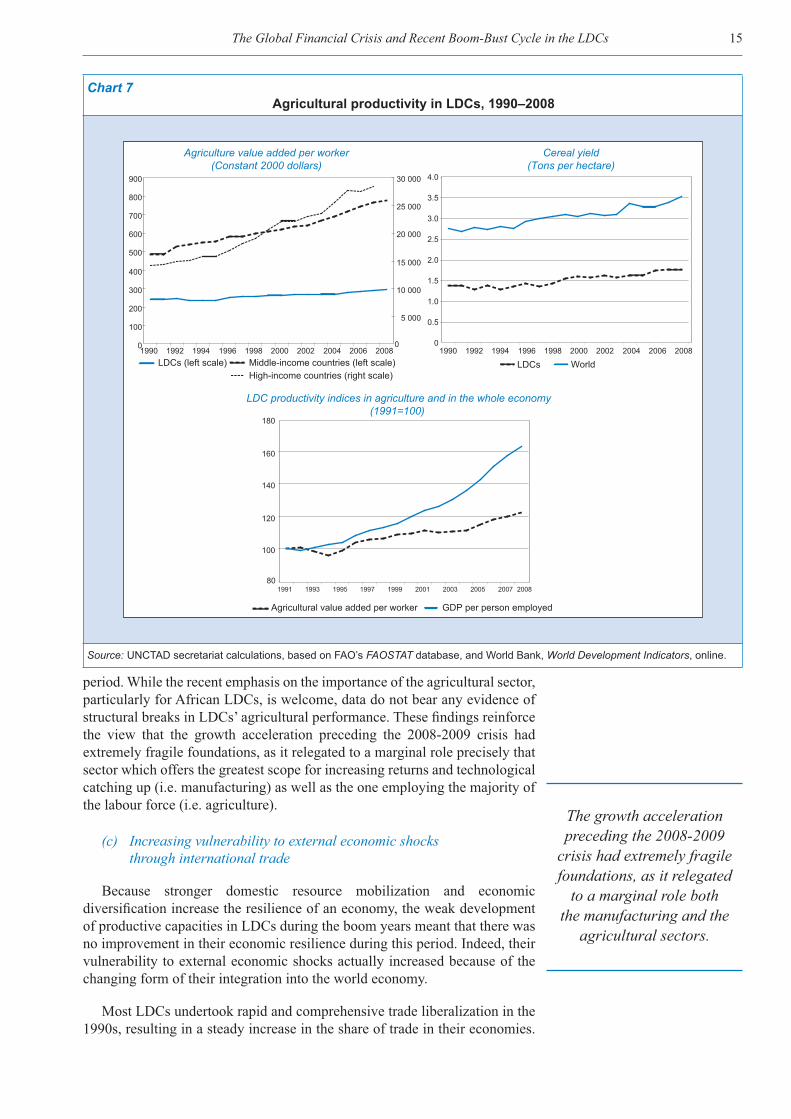
15The Global Financial Crisis and Recent Boom-Bust Cycle in the LDCs
Chart 7Agricultural productivity in LDCs, 1990–2008
Agriculture value added per worker(Constant 2000 dollars)
0
100
200
300
400
500
600
700
800
900
1990 1992 1994 1996 1998 2000 2002 2004 2006 2008 1990 1992 1994 1996 1998 2000 2002 2004 2006 20080
5 000
10 000
15 000
20 000
25 000
30 000
LDCs (left scale) Middle-income countries (left scale)High-income countries (right scale)
Cereal yield(Tons per hectare)
0
0.5
1.0
1.5
2.0
2.5
3.0
3.5
4.0
LDCs World
LDC productivity indices in agriculture and in the whole economy(1991=100)
80
100
120
140
160
180
1991 1993 1995 1997 1999 2001 2003 2005 2007 2008
Agricultural value added per worker GDP per person employed
Source: UNCTAD secretariat calculations, based on FAO’s FAOSTAT database, and World Bank, World Development Indicators, online.
period. While the recent emphasis on the importance of the agricultural sector, particularly for African LDCs, is welcome, data do not bear any evidence of structural breaks in LDCs’ agricultural performance. These findings reinforce the view that the growth acceleration preceding the 2008-2009 crisis had extremely fragile foundations, as it relegated to a marginal role precisely that sector which offers the greatest scope for increasing returns and technological catching up (i.e. manufacturing) as well as the one employing the majority of the labour force (i.e. agriculture).
(c) Increasing vulnerability to external economic shocks through international trade
Because stronger domestic resource mobilization and economic diversification increase the resilience of an economy, the weak development of productive capacities in LDCs during the boom years meant that there was no improvement in their economic resilience during this period. Indeed, their vulnerability to external economic shocks actually increased because of the changing form of their integration into the world economy.
Most LDCs undertook rapid and comprehensive trade liberalization in the 1990s, resulting in a steady increase in the share of trade in their economies.
The growth acceleration preceding the 2008-2009
crisis had extremely fragile foundations, as it relegated
to a marginal role both the manufacturing and the
agricultural sectors.
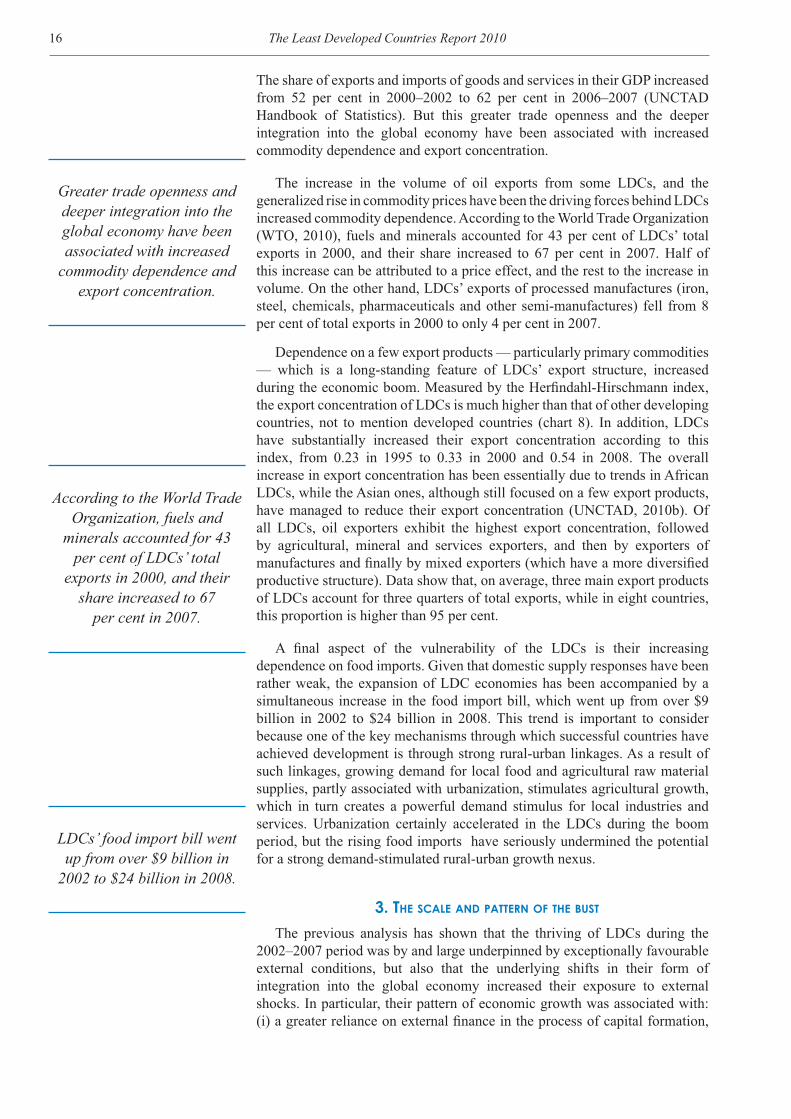
The Least Developed Countries Report 201016
The share of exports and imports of goods and services in their GDP increased from 52 per cent in 2000–2002 to 62 per cent in 2006–2007 (UNCTAD Handbook of Statistics). But this greater trade openness and the deeper integration into the global economy have been associated with increased commodity dependence and export concentration.
The increase in the volume of oil exports from some LDCs, and the generalized rise in commodity prices have been the driving forces behind LDCs increased commodity dependence. According to the World Trade Organization (WTO, 2010), fuels and minerals accounted for 43 per cent of LDCs’ total exports in 2000, and their share increased to 67 per cent in 2007. Half of this increase can be attributed to a price effect, and the rest to the increase in volume. On the other hand, LDCs’ exports of processed manufactures (iron, steel, chemicals, pharmaceuticals and other semi-manufactures) fell from 8 per cent of total exports in 2000 to only 4 per cent in 2007.
Dependence on a few export products — particularly primary commodities — which is a long-standing feature of LDCs’ export structure, increased during the economic boom. Measured by the Herfindahl-Hirschmann index, the export concentration of LDCs is much higher than that of other developing countries, not to mention developed countries (chart 8). In addition, LDCs have substantially increased their export concentration according to this index, from 0.23 in 1995 to 0.33 in 2000 and 0.54 in 2008. The overall increase in export concentration has been essentially due to trends in African LDCs, while the Asian ones, although still focused on a few export products, have managed to reduce their export concentration (UNCTAD, 2010b). Of all LDCs, oil exporters exhibit the highest export concentration, followed by agricultural, mineral and services exporters, and then by exporters of manufactures and finally by mixed exporters (which have a more diversified productive structure). Data show that, on average, three main export products of LDCs account for three quarters of total exports, while in eight countries, this proportion is higher than 95 per cent.
A final aspect of the vulnerability of the LDCs is their increasing dependence on food imports. Given that domestic supply responses have been rather weak, the expansion of LDC economies has been accompanied by a simultaneous increase in the food import bill, which went up from over $9 billion in 2002 to $24 billion in 2008. This trend is important to consider because one of the key mechanisms through which successful countries have achieved development is through strong rural-urban linkages. As a result of such linkages, growing demand for local food and agricultural raw material supplies, partly associated with urbanization, stimulates agricultural growth, which in turn creates a powerful demand stimulus for local industries and services. Urbanization certainly accelerated in the LDCs during the boom period, but the rising food imports have seriously undermined the potential for a strong demand-stimulated rural-urban growth nexus.
3. THE SCALE AND PATTERN OF THE BUST
The previous analysis has shown that the thriving of LDCs during the 2002–2007 period was by and large underpinned by exceptionally favourable external conditions, but also that the underlying shifts in their form of integration into the global economy increased their exposure to external shocks. In particular, their pattern of economic growth was associated with: (i) a greater reliance on external finance in the process of capital formation,
Greater trade openness and deeper integration into the global economy have been associated with increased
commodity dependence and export concentration.
According to the World Trade Organization, fuels and
minerals accounted for 43 per cent of LDCs’ total
exports in 2000, and their share increased to 67
per cent in 2007.
LDCs’ food import bill went up from over $9 billion in
2002 to $24 billion in 2008.
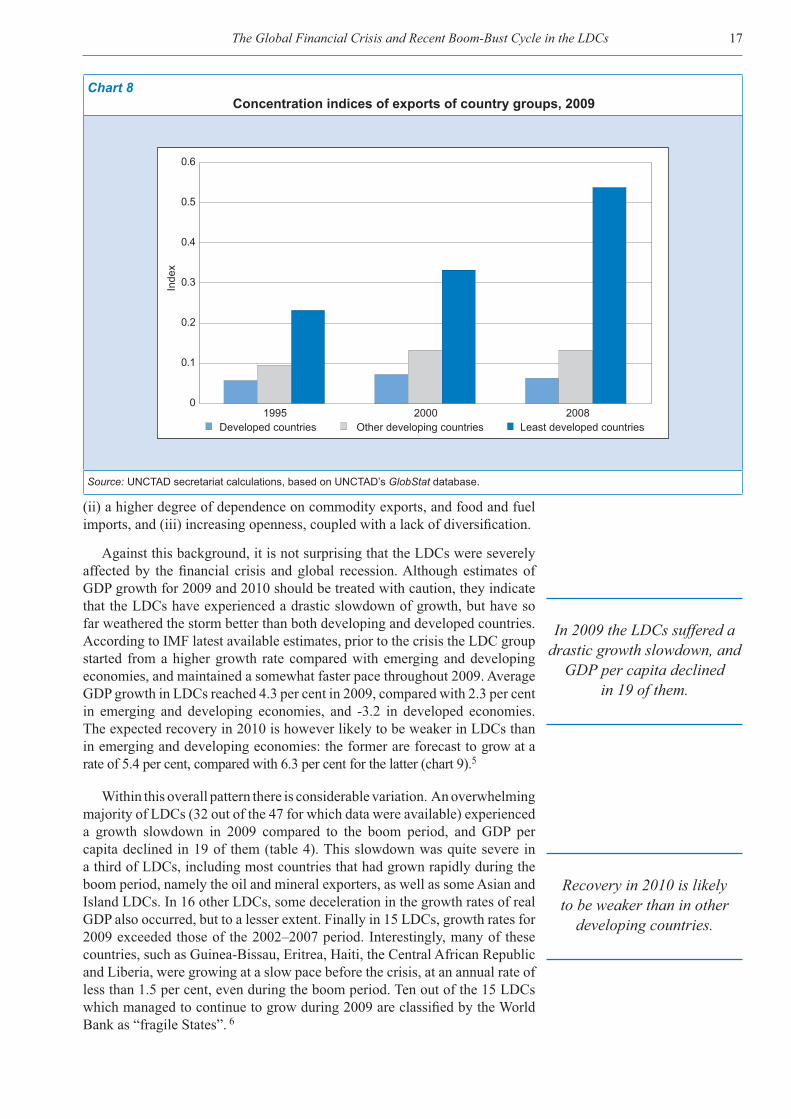
17The Global Financial Crisis and Recent Boom-Bust Cycle in the LDCs
(ii) a higher degree of dependence on commodity exports, and food and fuel imports, and (iii) increasing openness, coupled with a lack of diversification.
Against this background, it is not surprising that the LDCs were severely affected by the financial crisis and global recession. Although estimates of GDP growth for 2009 and 2010 should be treated with caution, they indicate that the LDCs have experienced a drastic slowdown of growth, but have so far weathered the storm better than both developing and developed countries. According to IMF latest available estimates, prior to the crisis the LDC group started from a higher growth rate compared with emerging and developing economies, and maintained a somewhat faster pace throughout 2009. Average GDP growth in LDCs reached 4.3 per cent in 2009, compared with 2.3 per cent in emerging and developing economies, and -3.2 in developed economies. The expected recovery in 2010 is however likely to be weaker in LDCs than in emerging and developing economies: the former are forecast to grow at a rate of 5.4 per cent, compared with 6.3 per cent for the latter (chart 9).5
Within this overall pattern there is considerable variation. An overwhelming majority of LDCs (32 out of the 47 for which data were available) experienced a growth slowdown in 2009 compared to the boom period, and GDP per capita declined in 19 of them (table 4). This slowdown was quite severe in a third of LDCs, including most countries that had grown rapidly during the boom period, namely the oil and mineral exporters, as well as some Asian and Island LDCs. In 16 other LDCs, some deceleration in the growth rates of real GDP also occurred, but to a lesser extent. Finally in 15 LDCs, growth rates for 2009 exceeded those of the 2002–2007 period. Interestingly, many of these countries, such as Guinea-Bissau, Eritrea, Haiti, the Central African Republic and Liberia, were growing at a slow pace before the crisis, at an annual rate of less than 1.5 per cent, even during the boom period. Ten out of the 15 LDCs which managed to continue to grow during 2009 are classified by the World Bank as “fragile States”. 6
Chart 8Concentration indices of exports of country groups, 2009
Inde
x
0
0.1
0.2
0.3
0.4
0.5
0.6
1995 2000 2008Developed countries Other developing countries Least developed countries
Source: UNCTAD secretariat calculations, based on UNCTAD’s GlobStat database.
In 2009 the LDCs suffered a drastic growth slowdown, and
GDP per capita declined in 19 of them.
Recovery in 2010 is likely to be weaker than in other
developing countries.

The Least Developed Countries Report 201018
Chart 9LDCs’ output growth, 2005–2010
(Annual percentage change)
-4
-2
0
2
4
6
8
10
2005 2006 2007 2008 2009 2010a
World Advanced economies Emerging and developing economies LDCsb
Source: UNCTAD secretariat calculations, based on IMF, World Economic Outlook (April 2010). a Forecast. b For the LDC group output growth is calculated as the weighted average of each country’s real growth.
Table 4Impact of the crisis on country growth
Countries with slowdown in real GDP >3%
Countries with slowdown in real GDP between 0% and 3%
Countries with no slowdown in real GDP
Countries with positive growth in real GDP per capita in 2009
Equatorial Guinea (5.3; -12.0 ) Bangladesh (5.4; -0.6 ) Afghanistan (22.5; +10.1 )Myanmar (4.8; -8.2 ) Bhutan (6.3; -2.9 ) Burundi (3.5; +0.5 )Rwanda (4.1; -3.4 ) Burkina Faso (3.2; -2.5 ) Djibouti (5.0; +1.3 )Sierra Leone (4.0; -6.9 ) Gambia (4.6; -0.2 ) Eritrea (3.6; +2.8 )Sudan (4.5; -3.1 ) Mali (4.5; -0.4 ) Ethiopia (9.9; +2.7 )
Mozambique (6.3; -1.5 ) Guinea-Bissau (3.0; +1.5 )Sao Tome and Príncipe (4.0; -2.9 ) Haiti (2.9; +2.2 )Uganda (7.0; -0.9 ) Lao People's Dem. Rep. (7.6; +0.4 )United Rep. of Tanzania (5.5; -1.7 ) Malawi (8.0; +2.8 )Vanuatu (3.3; -0.5 ) Nepal (4.7; +1.5 )Yemen (3.9; -0.1 ) Timor-Leste (7.4; +4.8 )
Zambia (6.3; +1.0 )
Countries with negative growth in real GDP per capita in 2009
Angola (-0.4; -15.2 ) Benin (2.7; -1.1 ) Central African Rep. (1.7; +1.2 )Cambodia (-2.5; -12.4 ) Comoros (1.1; -0.9 ) Liberia (4.6; +5.0 )Chad (-1.6; -12.4 ) Guinea (-0.3; -2.8 ) Togo (2.5; +0.1 )Dem. Rep. of Congo (2.8; -3.1 ) Lesotho (1.4; -1.5 )Kiribati (-0.7; -3.5 ) Senegal (1.5; -2.8 )Madagascar (-5.0; -8.1 )Maldives (-3.0; -10.6 )Mauritania (-1.1; -6.0 )Niger (-0.9; -5.7 )Samoa (-4.9; -9.2 )Solomon Islands (-2.2; -7.5 )
Source: Based on IMF, World Economic Outlook (April 2010).Note: Numbers in brackets indicate the rate of real GDP growth in 2009, and the difference in percentage points between real GDP growth
in 2009 and in the 2002-2007 boom period. Notice that IMF growth estimates differ slightly from those drawn from UNCTAD’s GlobStat, reported in Table 2.

19The Global Financial Crisis and Recent Boom-Bust Cycle in the LDCs
C. How the financial crisis and global recession affected LDCs
The strong but heterogeneous growth slowdown experienced by LDCs in the wake of the global financial and economic crisis is the result of various countervailing forces. On the one hand, LDCs were adversely affected through direct financial contagion effects, but also, and more seriously, through the collapse of international trade, the sharp decline in FDI inflows and with few exceptions also of workers’ remittances. On the other hand, the increased assistance from multilateral donors — particularly in the wake of the food and fuel crisis - enabled several LDCs to partly offset the negative impact of falling exports and private capital inflows. The net effect of these two countervailing forces was that the growth slowdown for the LDC group was slightly less severe than for other developing countries as a group, but it also implies a weaker recovery in 2010, as forecast by the United Nations Department of Economic and Social Affairs (UNDESA, 2010a). In addition, the medium-term outlook for LDCs is fraught with challenges as the fallout from the financial crisis and the global recession could adversely affect future ODA flows and debt sustainability.
1. NEGATIVE SPILLOVER EFFECTS
(a) Direct financial contagion
Although the LDCs economies are quite open to international trade, their integration into the global financial market is rather weak. As a result, the direct financial contagion from the global crisis was acute, but had a more limited impact on them than on other developing countries. As a result of the slowdown in economic activity, there have been some severe deteriorations in the quality of loan portfolios (IMF, 2009b). In Zambia, for example, the proportion of non-performing loans in total assets increased from 7 per cent to 13 per cent over the first three quarters of 2009; similar trends have also been reported in Sudan and to a lesser extent in Cambodia (ODI, 2010).
In general, the financial systems in LDCs are both underdeveloped and risk-averse. Thus, even before the global financial crisis most private enterprises faced a permanent credit crunch. For instance, between 2006 and 2008, credit extended to the private sector amounted to only 15 per cent of GDP in the median LDC, and it was higher than 30 per cent only in Bangladesh, Maldives, Nepal, Samoa and Vanuatu. Evidence suggests that bank credit to the private sector had started to grow slowly before the crisis, but this positive development came to a halt in 2009 owing to supply constraints and lower demand for credit. Indeed, the IMF (2009b) documents a tightening of credit conditions in all 12 LDCs for which data were available, particularly in Cambodia and Liberia. A major reason for this outcome is that the banking systems of LDCs are generally dominated by foreign-owned banks, many of which withdrew their funds in the wake of the turmoil in order to restructure their balance sheets or simply acquire safer assets (UNCTAD, 2010a).
The few portfolio investment flows to LDCs plummeted between the last quarter of 2008 and the beginning of 2009, especially in countries where there is significant participation of foreign institutional investors. For example, the All Share Index of the Uganda Stock Exchange fell by 29.4 per cent from
Bank credit to the private sector had started to grow slowly before the crisis, but this positive development came to a halt in 2009.
The direct financial contagion from the global crisis was
acute, but had a more limited impact on LDCs than on other
developing countries.
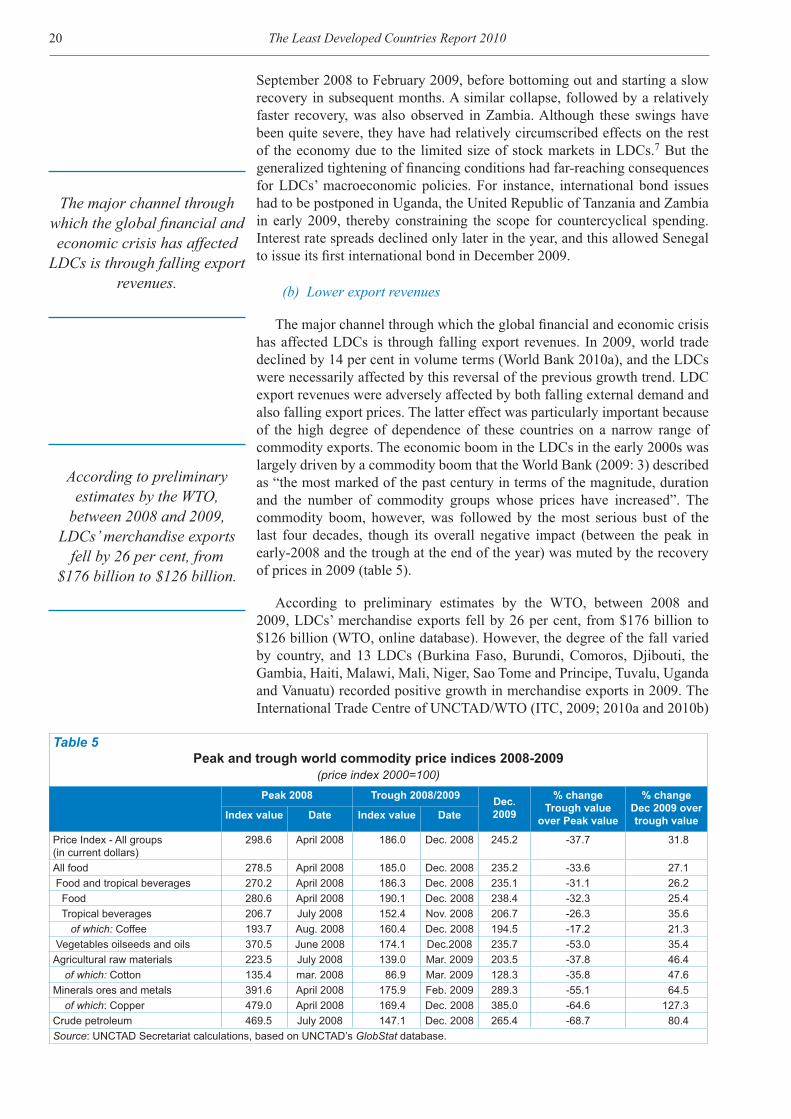
The Least Developed Countries Report 201020
September 2008 to February 2009, before bottoming out and starting a slow recovery in subsequent months. A similar collapse, followed by a relatively faster recovery, was also observed in Zambia. Although these swings have been quite severe, they have had relatively circumscribed effects on the rest of the economy due to the limited size of stock markets in LDCs.7 But the generalized tightening of financing conditions had far-reaching consequences for LDCs’ macroeconomic policies. For instance, international bond issues had to be postponed in Uganda, the United Republic of Tanzania and Zambia in early 2009, thereby constraining the scope for countercyclical spending. Interest rate spreads declined only later in the year, and this allowed Senegal to issue its first international bond in December 2009.
(b) Lower export revenues
The major channel through which the global financial and economic crisis has affected LDCs is through falling export revenues. In 2009, world trade declined by 14 per cent in volume terms (World Bank 2010a), and the LDCs were necessarily affected by this reversal of the previous growth trend. LDC export revenues were adversely affected by both falling external demand and also falling export prices. The latter effect was particularly important because of the high degree of dependence of these countries on a narrow range of commodity exports. The economic boom in the LDCs in the early 2000s was largely driven by a commodity boom that the World Bank (2009: 3) described as “the most marked of the past century in terms of the magnitude, duration and the number of commodity groups whose prices have increased”. The commodity boom, however, was followed by the most serious bust of the last four decades, though its overall negative impact (between the peak in early-2008 and the trough at the end of the year) was muted by the recovery of prices in 2009 (table 5).
According to preliminary estimates by the WTO, between 2008 and 2009, LDCs’ merchandise exports fell by 26 per cent, from $176 billion to $126 billion (WTO, online database). However, the degree of the fall varied by country, and 13 LDCs (Burkina Faso, Burundi, Comoros, Djibouti, the Gambia, Haiti, Malawi, Mali, Niger, Sao Tome and Principe, Tuvalu, Uganda and Vanuatu) recorded positive growth in merchandise exports in 2009. The International Trade Centre of UNCTAD/WTO (ITC, 2009; 2010a and 2010b)
Table 5Peak and trough world commodity price indices 2008-2009
(price index 2000=100)
Peak 2008 Trough 2008/2009 Dec. 2009
% change Trough value
over Peak value
% change Dec 2009 over trough valueIndex value Date Index value Date
Price Index - All groups(in current dollars)
298.6 April 2008 186.0 Dec. 2008 245.2 -37.7 31.8
All food 278.5 April 2008 185.0 Dec. 2008 235.2 -33.6 27.1 Food and tropical beverages 270.2 April 2008 186.3 Dec. 2008 235.1 -31.1 26.2 Food 280.6 April 2008 190.1 Dec. 2008 238.4 -32.3 25.4 Tropical beverages 206.7 July 2008 152.4 Nov. 2008 206.7 -26.3 35.6 of which: Coffee 193.7 Aug. 2008 160.4 Dec. 2008 194.5 -17.2 21.3 Vegetables oilseeds and oils 370.5 June 2008 174.1 Dec.2008 235.7 -53.0 35.4Agricultural raw materials 223.5 July 2008 139.0 Mar. 2009 203.5 -37.8 46.4 of which: Cotton 135.4 mar. 2008 86.9 Mar. 2009 128.3 -35.8 47.6Minerals ores and metals 391.6 April 2008 175.9 Feb. 2009 289.3 -55.1 64.5 of which: Copper 479.0 April 2008 169.4 Dec. 2008 385.0 -64.6 127.3Crude petroleum 469.5 July 2008 147.1 Dec. 2008 265.4 -68.7 80.4Source: UNCTAD Secretariat calculations, based on UNCTAD’s GlobStat database.
According to preliminary estimates by the WTO,
between 2008 and 2009, LDCs’ merchandise exports
fell by 26 per cent, from $176 billion to $126 billion.
The major channel through which the global financial and economic crisis has affected
LDCs is through falling export revenues.

21The Global Financial Crisis and Recent Boom-Bust Cycle in the LDCs
reports similar findings, on the basis of mirror data from LDCs’ major trade partners. According to ITC (2010), LDC exports to major partners plummeted by 34 per cent in 2009, representing a greater slump than world and developing-country exports, which fell by 24 and 25 per cent, respectively, on a year-on-year basis.8 These figures are however dominated by the sharp swings in oil prices; if oil is excluded, LDC exports to major partners fell by 9 per cent below their 2008 levels. ITC (2010) data also underscore the variations in the scale of export declines among different LDCs: whereas non-oil exports to major partner countries fell by more than a quarter in 14 LDCs, they actually rose in 17 others (chart 10).9
Since price and demand shocks have varied largely by product, the structural composition of exports has been a major determinant of differences in the impact of the crisis on LDC exports (Meyn and Kennan, 2009, Cali’ and Kennan, 2009; World Bank, 2009 and ITC, 2010). In particular:
• Exporters of oil and minerals (excluding gold) were the worst hit due to the combined effect of large adverse price movements, as well as declining demand;
• Exporters of manufactures also faced deteriorating world demand, but in general did not experience a large fall in prices;
• Conversely, food and agricultural exporters witnessed a slump in prices (albeit less severe than for other commodities), but weathered the storm relatively well owing to the inelastic demand they face;
• Finally, exporters of gold and other precious metals benefited modestly from the growing appetite for safe assets, which boosted prices throughout 2009.
The direction of trade has also been an important determinant of the extent of the trade shock. LDCs whose exports were predominantly directed to developed and transition economies typically were more adversely affected than those more deeply engaged in South-South trade. For example, the crisis had less of an effect on Uganda because it depends more on regional trade.10 Country case studies also indicate the importance of market positioning, at least for manufactures, in explaining the size of the trade shock. In this respect, the comparison between United States garment imports from Bangladesh and Cambodia is quite insightful: Bangladeshi garment exports to the United States – which are concentrated in low-end products — benefited from the so-called “Wal-Mart effect” and expanded even during the trough of the crisis; conversely, Cambodian exports, which aim at higher value niche markets, plunged over the same period, as those markets contracted disproportionately more (Chhibber, Ghosh and Palanivel, 2009; ODI, 2009).
Although there are fewer data available on services trade than on merchandise trade, it is clear that this is also a sector that has been adversely affected, particularly island LDCs. Tourism and maritime transport — two of the key drivers of LDCs services exports — stand out among the sectors most visibly affected by the downturn. According to World Bank estimates, for instance, over the first quarter of 2009 tourist arrivals in the Gambia declined by almost one third, in Senegal by 6 per cent and in the United Republic of Tanzania by more than 10 per cent compared with the same quarter of 2008. A comparable fall is reported by the Overseas Development Institute (ODI, 2009) for Cambodia. Similarly, the Rwanda Development Board has reported that revenues from the tourism sector fell by 6 per cent in 2009.
The structural composition of exports has been a major determinant of differences in the impact of the crisis
on LDC exports.
LDCs whose exports were directed to developed and transition economies were
more adversely affected than those engaged in
South-South trade.
Tourism and maritime transport — two of the drivers of LDCs services exports — stand out among the sectors most visibly affected by the
downturn.

The Least Developed Countries Report 201022
Chart 10Percentage change in LDCs non-oil merchandise exports to main trade partners, 2008–2009
Per cent
169
200343
-50 -25 0 25 50 75 100-75
VanuatuTimor-Leste
Equatorial GuineaCentral African Rep.
BeninSomaliaBhutanYemen
MaldivesDem. Rep. of the Congo
MaliSudanSamoaGuinea
NepalAngola
Solomon IslandsMozambique
MauritaniaLesothoSenegal
MadagascarChad
AfghanistanRwandaUganda
EritreaCambodiaComoros
Burkina FasoMyanmar
Sierra LeoneUnited Rep. of Tanzania
BangladeshLao PDREthiopia
TogoZambia
HaitiMalawi
Guinea-BissauGambiaKiribatiDjiboutiLiberia
BurundiTuvalu
Sao Tome and PrincipeNiger
LDCs - totalLDCs - median
Source: UNCTAD secretariat calculations, based on ITC, 2010.
(c) Falling FDI inflows
FDI inflows into developing countries suffered a serious slump in 2009, declining by 24 per cent after six years of uninterrupted growth (UNCTAD, 2010c). Available data indicate that although LDCs receive a negligible share

23The Global Financial Crisis and Recent Boom-Bust Cycle in the LDCs
of total world FDI inflows, these inflows fell less steeply, by 13 per cent: from their peak of $32 billion in 2008 to less than $28 billion in 2009. As with the trade shock, the decline in inflows varied considerably among LDCs: the most severely affected were Asian LDCs, where inflows contracted by half, African LDCs experienced a much smaller shortfall of around 8 per cent, and island LDCs even witnessed an increase compared with the previous year.
Oil and mineral exporters were particularly affected by the decline in FDI inflows, as plummeting commodity prices led to a temporary freeze or downsizing of investment projects. For instance, in 2009 FDI inflows declined by more than 35 per cent compared with 2008 in the Central African Republic, the Democratic Republic of the Congo, Guinea, Timor-Leste, Mali, Mauritania, Sierra Leone and Yemen. Even in Angola, which receives approximately half of the FDI directed to LDCs, inflows fell by 21 per cent. The crisis also led to a sharp fall in FDI inflows to several exporters of manufactures, such as Bangladesh, Cambodia (box 2) and Lesotho, and to some mixed exporters such as Madagascar, the Lao People’s Democratic Republic and Senegal, as well as on some services exporters such as Djibouti and Eritrea (table 6).
Notable exceptions to the declining pattern of inflows are Chad, Equatorial Guinea, Mozambique, Niger and the Sudan. As argued later in this Report, this is because of the growing involvement of China and other developing countries in natural resource exploitation in these LDCs. Besides these few resource-rich countries, some small FDI recipients such as Guinea-Bissau, Sao Tome and Principe, Solomon Island, Togo and Tuvalu also recorded larger inflows in 2009, despite the global recession.
FDI flows into LDCs fell from their peak of $32 billion
in 2008 to less than $28 billion in 2009.
Table 6Rates of change of FDI inflows to LDCs between 2008 and 2009
Countries with increasing FDI Change(Per cent) Countries with declining FDI Change
(Per cent)
Countries with FDI inflows of < 4% of GDP in 2008
Bhutan 22 Afghanistan -38Burkina Faso 25 Bangladesh -34Comoros 21 Benin -47Eritrea 115 Burundi -27Guinea-Bissau 134 Ethiopia -14Haiti 27 Malawi -64Kiribati 13 Maldives -20Myanmar 14 Mali -39Nepal 3 716 Mauritania -111Niger 31 Samoa -90Rwanda 15 Sierra Leone -37Sudan 17 Timor-Leste -52Togo 110 Yemen -92
Countries with FDI inflows of> 4% of GDP in 2008
Chad 98 Angola -21Equatorial Guinea 306 Cambodia -35Liberia 89 Central African Republic -64Mozambique 49 Dem. Rep. of the Congo -45Sao Tome and Principe 10 Djibouti -57Solomon Islands 129 Gambia -32Uganda 1 Guinea -63Zambia 2 Lao People's Dem. Republic -31
Lesotho -14Madagascar -54Senegal -24United Republic of Tanzania -5Vanuatu -17
Source: UNCTAD secretariat calculations based on UNCTAD, 2010b.
The Least Developed Countries Report 201024
(d) Declining workers’ remittances
Worker’s remittances, which have recently become an important and stable source of external financing for a number of LDCs, with significant economic implications for both small and medium-sized enterprises (SMEs) and poor households (IFAD, 2009; Karshenas, 2009; Anyanwu and Erhijakpor, 2010), were also affected by the crisis. The World Bank (2010b) estimates suggest that, whereas remittance inflows to developing countries declined by 6 per cent in 2009, LDCs only experienced a slowdown in their growth. As indicated earlier, remittance inflows to LDCs grew significantly during the boom years, but the growth rate is estimated to have fallen to 8 per cent between 2008 and 2009.
However, the aggregate picture masks a more nuanced reality: only 8 LDCs, including 2 of the largest recipients (Bangladesh and Nepal), saw an increase in remittance inflows during 2009, whereas such inflows declined in all the other LDCs. If these two countries are excluded, remittances to LDCs fell by more than 2 per cent in 2009. Taking into account both the annual percentage change and the dependence of individual countries on remittances, chart 11 shows LDCs exposure to decline in such inflows during 2009. Considering these two dimensions, Haiti and Samoa seem to have been the worst hit by the fallout from the crisis, while, the Gambia, Kiribati, Liberia, Sierra Leone and Uganda appear to have been less dramatically affected.11
2. POLICY RESPONSES
(a) National policies
One of the key mechanisms through which the global financial crisis could have major negative consequences for the LDCs is through reduced government spending following the recession-induced loss of public revenues. The fall in revenues resulted from lower import tariffs and ad valorem taxes on commodity exports, and lower indirect tax proceeds owing to the slowdown of growth. Country case studies show that the contraction has been particularly severe in countries where a substantial proportion of government revenues are derived from the oil and mineral sectors (ODI, 2009 and 2010). IMF data for 29 LDCs in sub-Saharan Africa broadly confirm this picture, but also reveal a very mixed picture in the region (IMF, 2010). In 2009, the ratio of government revenues (excluding grants) to GDP declined in 14 countries compared to the previous year, but it actually increased in 14 other, mostly small, economies (box 3)
Although full evidence is not yet available, it appears that many LDC Governments managed to sustain public spending in 2009, a number of them with substantial support from multilateral donors (see below). But with limited fiscal space, only some LDCs have implemented discretionary countercyclical interventions, and even when adopted, they have been relatively small. Generally speaking, Asian LDCs have tended to be more proactive than other LDCs, taking advantage of the larger financial resources at their disposal, and preferring spending over tax measures. Bangladesh, for instance, enacted three distinct stimulus packages in the wake of the crisis, devoting resources mainly to the agricultural sector, to the extension of safety-net programmes and to the support of SMEs and the apparel industry (ODI, 2010). Similarly, Cambodia allowed its target budget deficit for 2009 to increase to over 4 per cent of GDP, combining both spending measures — including for social protection — and tax breaks for the garment industry and the agricultural sector.
Remittance inflows to LDCs grew significantly during the boom years, but the growth
rate is estimated to have fallen to 8 per cent
between 2008 and 2009.
One of the key channels of transmission of the crisis to LDC economies was the loss
of public revenues.
With limited fiscal space, only some LDCs have implemented discretionary countercyclical interventions, and even when
adopted, they have been relatively small.

25The Global Financial Crisis and Recent Boom-Bust Cycle in the LDCs
Chart 11Change in remittances to LDCs, 2008–2009
(Per cent)
Bangladesh
Ethiopia
Gambia
Haiti
Lesotho
Liberia
Nepal
Samoa
Senegal
Sierra Leone
Togo
Uganda5
10
15
20
25
30
-30 -20 -10 0 10 20 30 Expected percentage change in remittances 2008–2009
Rem
ittan
ces
as
shar
e of
GD
P in
200
8 (p
er c
ent)
Source: UNCTAD secretariat calculations, based on World Bank, 2010b.
In African LDCs, discretionary fiscal responses to the global economic crisis have been rather modest, with typically small ad hoc stimulus packages where adopted, (African Development Bank and World Bank, 2009). In 2009, the ratio of government expenditure to GDP increased by approximately 2 percentage points in the median LDC in sub-Saharan Africa (IMF, 2010b). However, the expenditure-to-GDP ratio declined in a third of the LDCs in this subregion, suggesting that their fiscal policy has been procyclical (box 3).
The United Republic of Tanzania approved a stimulus package worth $1.3 billion, primarily directed to farming and the manufacturing sector, and simultaneously reduced the value added tax (VAT) rate. It also provided limited and time-bound support to banking institutions whose loan portfolios had deteriorated (ODI, 2010). Other African countries, such as Angola, Lesotho, Mozambique and Sierra Leone, expanded their public works programmes on an ad hoc basis, mainly to improve infrastructure and sustain aggregate demand through cash-for-work or food-for-work initiatives largely funded by multilateral donors (UNFPA, 2010). At the other end of the spectrum, countries like Ethiopia and several island LDCs maintained a fairly conservative macroeconomic policy in spite of the global recession, refraining from discretionary fiscal measures and in some cases even cutting public services (ODI, 2010; Green, King and Miller-Dawkins, 2010).
In terms of monetary policy, several LDCs where inflation had declined in the wake of the global downturn adopted moderately accommodating monetary policies to foster a faster recovery.12 While monetary expansion, where adopted, has certainly been helpful (UNECA, 2010; IMF, 2010b), it may be argued that it can have only a limited effect in LDCs, given their relatively low degree of financial development (hence the little effect of credit easing on investment) and the small size of their secondary bond markets. In
In terms of monetary policy, several LDCs adopted
moderately accommodating policies to foster a faster
recovery.

The Least Developed Countries Report 201026
Box 2. A tale of two slowdowns: Cambodia and Mozambique
A close comparison of country case studies offers a wealth of information to assess the impact of the crisis on LDCs, and disentangle the channels through which external shocks were transmitted to the domestic economies. In this respect, Cambodia and Mozambique provide two representative examples of the differences and commonalities between an Asian exporter of manufactures, and an African exporter of minerals.
Cambodia
Cambodia experienced one of the most severe slowdowns among LDCs as a result of the global crisis. Its real GDP growth rate plunged from 10 per cent per annum in the period 2002–2007 to -2.5 per cent in 2009. Its domestic financial sector remained largely unaffected by the turmoil, but the impact from the global recession was particularly strong. Largely as a consequence of a fall in international demand, garment exports plummeted by almost 20 per cent in the first nine months of 2009, compared with the same period of 2008 (ODI, 2010). According to Chhibber, Ghosh and Palanivel (2009), this slump caused the net closure of at least 50 factories and the temporary closure of many more, resulting in the laying off of more than 62,000 full-time workers (18 per cent of the total workforce in the garment sector).
After a decade of double-digit growth, tourism has also recorded a sharp slowdown since the fourth quarter of 2008, owing to problems in the country’s key tourist markets: Japan and the Republic of Korea, bore the brunt of the crisis and Thailand experienced political tensions. Beyond direct effects on the tourism industry, the slowdown of arrivals and receipts has had far-reaching secondary effects on industries that provide tourism-related services, such as massage shops, beauty parlours, souvenir shops, local transport providers, mobile food stalls and laundries.
The severe impact of the crisis on Cambodia’s traditional growth sectors contributed to the sharp decline in FDI, which fell by 35 per cent in 2009 (UNCTAD, 2010c). In turn, the retreat of foreign investors, coupled with the general tightening of credit and the bursting of the domestic real estate bubble, caused a contraction of the construction sector. It is estimated that 30 per cent of construction jobs disappeared between January and November 2009 (Chhibber, Ghosh and Palanivel, 2009).
While there is evidence of some reduction of imports, the resilience of workers’ remittances and official flows moderated the deteriorating balance-of-payments situation resulting from the crisis. Nevertheless, the contraction of key labour-intensive sectors has resulted in massive layoffs, which exacerbate the social costs of the crisis in spite of the expansionary fiscal and monetary policies adopted by the Cambodian Government (ibidem).
Mozambique
Unlike Cambodia, Mozambique suffered smaller growth deceleration compared with the boom years, and its economy continued to grow in real terms throughout 2008 and 2009. As in Cambodia, the fall in export revenues was the key channel through which the global recession affected the domestic economy, but with one important difference. Consistent with Mozambique’s specialization in mineral commodities, the bulk of the export decline was attributable less to the fall in demand for its exports, and more to the adverse terms of trade caused by the plunge in aluminium prices since the end of 2008. In 2009, the exports-to-GDP ratio fell by approximately 10 percentage points, worsening the current account in spite of the growing remittance inflows and the modest fall in imports. With an expected 10 per cent decline in FDI inflows (Van Waeyenberge, Bargawi and McKinley, 2010) and the announced reduction of budget support, the response of multilateral donors has been crucial in helping Mozambique weather the storm. The IMF provided $176 million through its External Shock Facility (ODI, 2010), plus an allocation of 108 millions SDR to boost the country’s foreign exchange reserves.
Meanwhile, the Government of Mozambique relaxed its fiscal stance, and the deceleration in imported inflation opened up space for depreciating the currency without strong pressures on domestic prices, thereby favouring a gradual adjustment of the balance of payments. Moreover, at the domestic level, the substantial increase in agricultural output due to a good harvest season enabled that sector to sustain the economy, while manufacturing output contracted only marginally, by 0.1 per cent (ODI, 2010).
Although policy responses in Mozambique have been crucial in cushioning the downturn so that there have not been major adverse effects on growth or excessive balance-of-payments difficulties, it should be pointed out that they have increased the country’s external debt. According to the IMF (2010a), Mozambique’s external debt owed to official creditors increased from 21.4 per cent of GDP in 2008 to 27.8 per cent in 2009, and it is expected to rise further to 39.9 per cent in 2011.
2009 several LDCs with floating (or managed-floating) exchange rate regimes allowed their nominal exchange rates to depreciate (experienced substantial depreciations) against major currencies in order to facilitate an adjustment of their current accounts and sustain the tradable sector. This was notably the case in a few large commodity exporters such as the Democratic Republic of the Congo and Zambia, and to a lesser extent in countries such as Ethiopia, Mozambique, the Sudan and Uganda. On the other hand, other LDCs that could utilize their stock of reserves accumulated before the crisis, such as

27The Global Financial Crisis and Recent Boom-Bust Cycle in the LDCs
Box 3. Fiscal policy responses in Sub-Saharan African LDCs
The analysis of fiscal policies in sub-Saharan African LDCs shows a certain degree of proactive macroeconomic management in the wake of the global crisis, but in general a rather timid use of fiscal instruments. In some countries, this may be due to an explicit policy choice, and in others to erroneous growth forecasts (IMF, 2010a), but it also reveals the narrow policy space available to these countries due to both domestic factors and external conditions.
According to the IMF (2010a), in 2009 government revenues as a share of GDP fell in about half of the 29 countries for which data were available. Compared to 2008, oil and mineral exporters suffered the largest shortfalls, whereas countries like Burundi, the Gambia, and Lesotho managed to improve their revenue-to-GDP ratios, notwithstanding the international situation. Generally, in sub-Saharan African LDCs public expenditure increased by about 2 per cent of GDP compared with 2008. However, there are wide variations across countries: government expenditure as a proportion of GDP fell in 9 countries, while in Burundi it increased, but at a much slower rate than revenues. This implies that in one third of the countries in the sample, fiscal policy was contractionary, notwithstanding the global recession.
Besides, although LDCs’ fiscal responses adopted in 2009 seem quite modest, in most of them, debt exposure to official creditors, relative to GDP, rose. In the median LDC in the sample, the external debt owed to official creditors increased by approximately 3 percentage points of GDP. The most notable exceptions to this pattern were countries which benefited from large debt relief operations in 2009, either because they reached the HIPC completion (e.g. Burundi and the Central African Republic), or because of bilateral debt write-off (e.g. Sao Tome and Principe), or following debt buy-back operations (e.g. Liberia). A large number of countries are likely to see their debt exposure rise further in 2010. Interestingly, even some countries that adopted contractionary fiscal policies, such as Comoros, Ethiopia, Madagascar, Malawi and Uganda, incurred larger debts.
Similarly, between 2008 and 2009 debt owed to official creditors increased faster than public expenditure in half of the countries considered in the sample. While this outcome need not necessarily follow from external conditionalities, the above findings appear to corroborate the argument, based on the survey of lending agreements concluded with the IMF during the global recession, that there has been very little fundamental change in IMF practices (Weisbrot et al., 2009; Van Waeyenberge, Bargawi and McKinley, 2010).
Box Chart 2Changes in fiscal policy variables in selected LDCs, 2008–2009
(Percentage of GDP)
-99.6 -40.3 -233.2 -35.5-20
-15
-10
-5
0
5
10
15
20
25
30
Ang
ola
Ben
in
Bur
kina
Fas
o
Bur
undi
Cen
tral A
frica
n R
ep.
Cha
d
Com
oros
Con
go D
em. R
ep.
Equ
ator
ial G
uine
a
Erit
rea
Eth
iopi
a
Gam
bia
Gui
nea
Gui
nea-
Bis
sau
Leso
tho
Libe
ria
Mad
agas
car
Mal
awi
Mal
i
Moz
ambi
que
Nig
er
Rw
anda
São
Tom
e an
d P
rinci
pe
Sen
egal
Sie
rra
Leon
e
Uni
ted
Rep
. of T
anza
nia
Togo
Uga
nda
Zam
bia
Government revenues, excluding grants Government expenditure Debt with official creditors
Source: UNCTAD secretariat calculations, based on IMF, 2010b.

The Least Developed Countries Report 201028
Bangladesh, Cambodia and the United Republic of Tanzania, opted for maintaining a fairly stable exchange rate vis-à-vis the dollar (ODI, 2010).
(b) The response of the IMF, World Bank and regional development banks
The ability of LDCs to weather the storm created by the financial crisis and global recession has depended, and continues to depend, significantly on trends in official finance. In this regard, it is worth noting that net ODA disbursements to LDCs had increased rapidly in 2008, partly in response to the food and fuel crisis, reaching a record level of over 37 billions US dollars (excluding debt relief). Estimates of net ODA flows by Development Assistance Committee (DAC) donors to LDCs in 2009 are not yet available. However, what is clear is that in both 2008 and 2009, the World Bank, IMF and regional development banks increased their lending significantly to these countries, even though the overall international response to the global financial crisis was biased largely towards middle-income economies (Te Velde and Massa, 2009 and Ocampo et al., 2010).
With the G-20 boosting its lending capacities, the IMF has undoubtedly led the response of multilateral donors. In sub-Saharan Africa, for instance, the Fund committed over $3.6 billion of concessional financing and $1.4 billion of stand-by and extended arrangements during 2009. This represented a fivefold increase in IMF commitments over 2008, part of which were made through its new Exogenous Shocks Facility. In addition, allocations of special drawing rights (SDRs) in August and September 2009 provided nearly $12 billion of reserve assets to sub-Saharan African countries. It can be estimated that IMF financing to LDCs increased from SDR 1,089 million in 2005–2007 to SDR 2,691 million in the period 2008–2010 (IMF, Monitoring of Fund Arrangements-MONA database).
The World Bank and regional development banks have also set up specific crisis-related facilities and frontloaded expenditures which had previously been planned to cover a longer period. World Bank financing to sub-Saharan Africa started to rise in 2007-2008 in response to the food and fuel crisis, and expanded even further in 2009, with new commitments of $8.2 billion in 2009 (IMF, 2010a: 52).13
Available data from UNDESA, 2010b as well as national sources suggest that net official flows to the LDCs as a group were significantly higher in 2009 than in 2008. Furthermore, many LDCs experiencing a contraction in private financing flows during 2009, benefited from a simultaneous scale-up of official financing, which had — at least partly — an offsetting effect. As a consequence, in most cases the deterioration in LDCs’ external financing position was partly attenuated in 2009. Increased official external financing has also been important in helping to counter the potential negative fiscal effects of the external shock, as it provided the necessary financing to enable the pursuit of a countercyclical policy in some LDCs, although, as will be discussed in chapter 5, policy conditionalities were in several cases pro-cyclical. At the same time such financing has increased the levels of external debt owed to official creditors (Box 3), and could lead to reinstituting a pattern of aid-debt relationships with the multilateral creditors which proved very detrimental to LDCs in the 1990s.
In both 2008 and 2009, the World Bank, IMF and
regional development banks increased their lending
significantly to the LDCs.
IMF financing to LDCs increased from SDR 1,089
million in 2005–2007 to SDR 2,691 million in the period
2008–2010.
The impact of the crisis on LDC economies has been
significant, particularly for oil and mineral exporters.
However, most of the LDCs have so far avoided strong reductions of their imports.

29The Global Financial Crisis and Recent Boom-Bust Cycle in the LDCs
3. OVERALL IMPACT AND RISKS TO THE MEDIUM-TERM ECONOMIC OUTLOOK
The overall picture is that the impact of the financial crisis and global recession on LDC economies has been significant, particularly for oil and mineral exporters. However, most of the LDCs have so far avoided strong reductions of their imports, and only some of them witnessed major fiscal contractions. This reflects, firstly, the fact that the crisis was not rooted in LDC economic fundamentals, but rather, the result of exogenous shocks which essentially reversed, at least partially, the exceptional conditions that had underpinned the previous boom. In addition, the deterioration in the external environment in 2009 was attenuated, particularly by the recovery of commodity prices during that year and the increase in official financial flows from the IMF, World Bank and regional development banks. As shown in table 7, the external accounts of oil-importing and food-importing LDCs had also worsened considerably in 2008 with sharp spikes in international prices of fuel and food, and the easing of these prices in 2009 dampened the negative macroeconomic effect of falling export revenues. Both oil- and mineral-exporting LDCs faced severe deteriorations in their current account balances in 2009. But in most other LDCs, the current account deteriorated significantly in 2008 but actually improved in 2009. This is due to lower food and fuel import prices which helped to offset the negative effects of falling export revenue.
Behind the apparent macroeconomic resilience of the LDCs, there is of course a more complex sectoral and social reality. The impact of the crisis on capital accumulation in LDCs is still unclear, though past experience would suggest that a slowdown in investment growth is a serious risk (Shafaeddin, 2009). Some sectors in particular countries have been very hard hit (box 2). On top of that, the growth slowdown has also had important negative social impacts, which have come on top of the effects of the food and fuel price spikes of 2008 and are particularly serious given the prevalence of mass poverty in the LDCs and the vulnerability of their population.
Table 7Overall shock to LDCs current account
2005 2006 2007 2008 2009Current account balance in $ billions
Agricultural exporters -1.846 -1.852 -1.77 -3.027 -2.342Manufactures exporters -0.329 0.87 1.01 0.643 2.362Mineral exporters -3.968 -1.753 -3.815 -7.126 -6.403Mixed exporters -1.145 -0.791 -2.978 -5.703 -3.904Oil exporters 2.625 6.699 3.039 2.628 -14.75Service exporters -1.825 -3.29 -3.461 -5.076 -5.016Total LDCs -6.488 -0.117 -7.975 -17.661 -30.053
Current account balance as percentage of GDPAgricultural exporters -6.17% -5.54% -4.49% -6.37% -4.54%Manufactures exporters -0.40% 0.98% 0.99% 0.55% 1.85%Mineral exporters -10.43% -3.82% -7.28% -11.21% -10.54%Mixed exporters -3.74% -2.25% -6.54% -9.63% -6.81%Oil exporters 2.94% 5.73% 2.06% 1.33% -8.77%Service exporters -5.46% -8.78% -7.60% -8.71% -7.51%Total LDCs -2.14% -0.03% -1.85% -3.25% -5.65%Source: UNCTAD Secretariat calculations, based on on IMF, World Economic Outlook, April 2010.Note: For the classification of LDCs according to their export specialisation, see page xv.
The impact of the crisis on capital accumulation in
LDCs is still unclear, though a slowdown in investment growth is a serious risk.
The global crisis has come on top of the food and fuel price spikes of 2008; thus its social costs are particularly serious.
The Least Developed Countries Report 201030
The medium-term outlook for LDCs is also cause for major concern, as there are a number of downside risks which could dampen growth prospects. These include:
• A weakening or reversal of the global recovery;
• Declining official finance owing to continued recession and spending cuts in donor countries;
• Volatile commodity prices;
• Deterioration of domestic financial systems;
• Increased government indebtedness; and
• Civil unrest associated with the adverse social consequences of the crisis.
A major mechanism through which the financial crisis and global recession may exert long-lasting adverse impacts on LDC economies, is by forcing them to build up unsustainable external debt. The relationship between fiscal and external sustainability is particularly tight in the case of LDCs, since the bulk of external debt is publicly owned or publicly guaranteed. Moreover, since the overwhelming proportion of such debt is denominated in foreign currencies, exchange rate devaluations may well improve the current-account balance, but could prove more onerous for debt servicing.
Even before the global crisis, many of the poorest countries continued to be prone to high debt vulnerabilities in spite of favourable economic conditions and the HIPC and MDRI debt relief initiatives (IDA and IMF, 2009). With the crisis, the combined effect of the economic slowdown and rising interest rate spreads has partially reversed the substantial gains made in terms of debt sustainability, and this is expected to result in permanently higher debt burdens and debt service ratios (IMF, 2010b). New multilateral lending may have partly cushioned the downturn, but it certainly contributed to the build-up of external debt. While debt owed to official creditors remains far below its level of the early 2000s, in the median African LDCs it increased by 1.5 per cent of GDP between 2008 and 2009, to reach 25 per cent of GDP (IMF, 2010a). By April 2010, a total of 10 LDCs were in a situation of debt distress (4 HIPCs at pre-decision point, 5 interim HIPCs and 1 non-HIPC), and other 10 were at high risk of debt distress (table 8).14
Another critical issue is what happens to future trends in external assistance. In this regard, an OECD-DAC survey of disbursement plans for country programmable aid (CPA) shows an alarming trend.15 OECD estimates for programmable aid flows to the LDC group reveal that disbursements in 2010 and 2011 are expected to be only marginally higher than in 2008. In real terms 24 LDCs are likely to receive less programmable aid in 2010 than they did in 2008, and this is expected to remain largely unchanged in 2011 (table 9). Similarly, CPA per capita to the LDC group is estimated to decline from $37.7 in 2008 to $36.3 in 2011.
D. Poverty trends and progress towards achieving the MDGs
The analysis so far has focused on economic trends, but an important issue is the degree to which economic growth is translating into improvements in
The crisis has partially reversed the substantial gains made previously
in terms of debt sustainability.
By April 2010, a total of 10 LDCs were in a situation of debt distress and other 10
were at high risk of debt distress.
The medium-term outlook for LDCs is also cause for
major concern, as there are a number of downside risks which could dampen growth
prospects.

31The Global Financial Crisis and Recent Boom-Bust Cycle in the LDCs
Table 8Extent of debt vulnerability in LDCs
HIPCs pre-decision point Interim HIPCs HIPCs
post-completion point Non-HIPCs
In debt distress
Comoros Dem. Rep. of the Congo MyanmarEritrea GuineaSomalia Guinea-BissauSudan Liberia
Togo
At high risk of debt distress
Afghanistan DjiboutiBurkina Faso Lao People's Dem. Rep.Burundi MaldivesGambia YemenHaitiSao Tome and Principe
At moderate risk of debt distress
Benin BhutanCentral African Rep. CambodiaEthiopiaRwandaSierra Leone
At low risk of debt distress
Mali SamoaMozambiqueSenegalZambia
Source: UNCTAD secretariat compilation, based on IMF 2010b, covering LDCs with a post-crisis debt sustainability analysis, as of April 2010. The latest available debt sustainability analyses indicate that 7 other LDCs (Angola, Chad, Lesotho, Malawi, Mauritania, Nepal and Solomon Islands) are at moderate risk of debt distress, and 5 other LDCs (Bangladesh, Madagascar, Niger, Uganda and United Republic of Tanzania) are at low risk of debt distress.
human well-being. This section examines long-term trends in income poverty in African and Asian LDCs using a new set of poverty estimates prepared for this Report (box 4). It also analyses progress towards meeting the MDGs relating to poverty and human development. Finally, it considers the short-term impacts of the financial crisis and global recession on social trends, and possible future scenarios for MDG achievement. Overall, it shows that despite the economic boom during the period 2002–2007, poverty reduction has remained very slow in the LDCs, and, although efforts have improved since 2000, the majority of LDCs are not on track to meet most of the MDGs.
1. LONG-TERM TRENDS IN INCOME POVERTY
Although poverty reduction is at the heart of national and international development policies, internationally comparable data to identify and analyse poverty trends remain inadequate, particularly for the LDCs. Against this background, the LDC Report series have introduced innovations in the measurement of poverty, which have allowed it to present new insights into the depth and dynamics of poverty in the LDCs. The LDC Report 2002: Escaping the Poverty Trap used national accounts data to make the first internationally comparable estimates of $1-a-day and $2-a-day poverty in LDCs. These estimates were updated and refined in the LDC Report 2008, and the present Report further updates the estimates (Karshenas, 2010).
Trends in income poverty for 33 African and Asian LDCs for which data are available are shown in chart 12 and table 10. The main feature which is apparent is the all-pervasive and persistent nature of poverty in these LDCs. They are characterized by mass poverty. In 2007, 53 per cent of the population of LDCs was living in extreme poverty, on less than $1.25 a day, and 78 per cent was living on less than $2 a day. Extrapolating this to all the LDCs, it implies that there were 421 million people living in extreme poverty in LDCs that year. Moreover, the incidence of extreme poverty — the percentage of the total population living below the poverty line of $1.25 per day — was
In 2007, 53 per cent of the population of LDCs was living
on less than $1.25 a day, and 78 per cent was living
on less than $2 a day.
Despite the economic boom during the period 2002–
2007, poverty reduction has remained very slow
in the LDCs.

The Least Developed Countries Report 201032
Table 9Country programmable aid to LDCs, 2008–2011
(Millions of dollars)
CPA in constant 2008 $ Change
Actual Planned Index (2008=100)
2008 2010 2011 2010 2011
Afghanistan 3 527 3 497 3 393 99 96 Angola 381 646 772 170 203 Bangladesh 2 243 2 189 2 084 98 93 Benin 538 486 447 90 83 Bhutan 89 83 80 93 90 Burkina Faso 918 689 677 75 74 Burundi 386 343 343 89 89 Cambodia 687 851 895 124 130 Central African Republic 193 156 160 81 83 Chad 251 212 200 84 80 Comoros 31 27 24 87 77 Dem. Rep. of the Congo 1 021 1 324 1 380 130 135 Djibouti 99 98 99 99 100 Equatorial Guinea 37 55 65 149 176 Eritrea 106 124 115 117 108 Ethiopia 2 502 2 530 2 814 101 112 Gambia 91 104 104 114 114 Guinea 241 219 205 91 85 Guinea-Bissau 109 86 91 79 83 Haiti 625 692 703 111 112 Kiribati 39 35 37 90 95 Lao People's Dem. Republic 389 375 377 96 97 Lesotho 124 139 143 112 115 Liberia 586 313 333 53 57 Madagascar 881 650 651 74 74 Malawi 822 808 851 98 104 Maldives 20 24 26 120 130 Mali 917 925 918 101 100 Mauritania 276 275 295 100 107 Mozambique 1 750 1 739 1 775 99 101 Myanmar 169 173 177 102 105 Nepal 667 721 748 108 112 Niger 468 470 451 100 96 Rwanda 770 833 865 108 112 Samoa 54 52 55 96 102 Sao Tome and Principe 42 54 62 129 148 Senegal 963 787 798 82 83 Sierra Leone 293 324 307 111 105 Solomon Islands 237 177 171 75 72 Somalia 175 194 204 111 117 Sudan 909 1 015 1 077 112 118 Timor-Leste 216 253 236 117 109 Togo 308 154 162 50 53 Tuvalu 14 12 12 86 86 Uganda 1 432 1 569 1 602 110 112 United Republic of Tanzania 2 191 2 424 2 532 111 116 Vanuatu 93 101 101 109 109 Yemen 373 477 408 128 109 Zambia 1 029 1 097 1 162 107 113Total LDCs 30 282 30 581 31 187 101 103African LDCs and Haiti 21 392 21 480 22 301 100 104Asian LDCs 8 144 8 366 8 162 103 100Island LDCs 746 735 724 99 97All developing countries 80 941 88 481 90 809 109 112Source: OECD, 2009b.

33The Global Financial Crisis and Recent Boom-Bust Cycle in the LDCs
Box 4. The new poverty estimates
In the LDC Report 2002, poverty estimates were made on the basis of the close relationship between the level of private consumption per capita measured in constant PPP dollars and the incidence of $1-a-day and $2-a-day poverty. The closeness of this statistical relationship enabled the generation of poverty estimates using national accounts data for countries for which there existed estimates of private consumption in PPP dollars. The estimates in the LDC Report 2008 followed the same logic, but they refined the method by establishing the relationship between household survey estimates of private consumption per capita and national accounts estimates of private consumption per capita, thus seeking to base the poverty estimates on “calibrated survey means” (Karshenas, 2008). This Report adopts the same method but uses the new $1.25/day poverty line which has now been adopted as the standard for “extreme poverty” and also the new PPP exchange rate estimates generated in 2005.
This new method enables the estimation of income poverty in 33 LDCs, which account for about 86 per cent of the population of all LDCs in 2007. The poverty estimates in these countries are therefore representative of the trends in poverty for the LDC group as a whole, though a few significant countries are missing because there have been no household surveys or there are no PPP exchange rate estimates for them and no estimates are made for island LDCs.
It should be noted that because national accounts estimates of per capita private consumption deviate from household survey estimates of per capita private consumption, this method results in internationally comparable poverty estimates which differ from those of the World Bank. For example, World Bank estimates suggest that the incidence of extreme poverty in LDCs fell from 63 per cent in 1990 to 53 per cent in 2005, and that two thirds of the increase has occurred since 2000 (UNDP, 2010). However, according to the new poverty estimates, the 1990 poverty rate was slightly lower (58 per cent), but progress since 2000 has also been slower, with a decline from 59 per cent to 53 per cent over a seven-year period. In general, cross-country results suggest, as the LDC Report 2002 did, that current estimates of poverty based on household survey data, underestimate the incidence of poverty in the poorest countries.
Chart 12Poverty trends in African and Asian LDCs, 1980–2007
Percentage of population living below $1.25 a day
0
10
20
30
40
50
60
70
Per
cen
t
Percentage of population living below $2 a day
65
70
75
80
85
90
1980 1982 1984 1986 1988 1990 1992 1994 1996 1998 2000 2002 2004 20061980 1982 1984 1986 1988 1990 1992 1994 1996 1998 2000 2002 2004 2006
1980 1982 1984 1986 1988 1990 1992 1994 1996 1998 2000 2002 2004 2006 1980 1982 1984 1986 1988 1990 1992 1994 1996 1998 2000 2002 2004 2006
Per
cen
t
Number of people living below $1.25 a day
0
50
100
150
200
250
300
350
400
Mill
ion
Number of people living below $2 a day
0
100
200
300
400
500
600
Mill
ion
African LDCs and Haiti Asian LDCs African and Asian LDCs and Haiti
Source: Karshenas, 2010.

The Least Developed Countries Report 201034
Table 10Poverty trends in individual LDCs, 1990–2007
Country
Poverty headcount ratio at $1.25 a day Poverty headcount ratio at $2 a day
World Bank New estimates World Bank New estimates
1990–1995 2000–2007 1990 2007 1990–1995 2000–2007 1990 2007
Angola .. 54.3 .. 70.2Bangladesh 66.8 53.7 45.3 40.6 92.5 83.4 81.3 73.3Benin .. 47.3 42.8 45.2 .. 75.3 71.2 73.0Bhutan .. 26.2 .. 49.5Burkina Faso 71.2 56.5 65.6 49.8 85.8 81.2 83.2 75.6Burundi 84.2 81.3 67.8 77.6 95.2 93.5 90.3 93.8Cambodia 48.6 33.0 56.6 36.2 77.9 63.0 81.4 63.4Comoros .. 46.1 .. 65.0Dem. Rep. of the Congo .. 59.2 71.2 82.9 .. 79.6 88.7 90.5Chad .. 61.9 52.2 57.8 .. 83.3 77.2 81.0Central African Republic 82.8 62.4 64.5 63.4 90.8 81.9 81.1 83.2Djibouti .. 18.8 13.1 39.0 .. 41.2 37.9 68.2Ethiopia 60.5 47.3 69.0 53.6 84.6 82.0 90.2 84.9Gambia .. 34.3 59.3 56.5 .. 56.7 78.8 76.9Guinea 64.7 70.1 58.9 49.8 81.1 87.2 78.7 73.7Guinea-Bissau 46.7 48.8 78.4 75.6 67.1 77.9 90.6 92.7Haiti .. 54.9 40.7 50.6 .. 72.2 53.9 62.2Lao People's Dem. Rep. 55.7 44.0 49.2 27.1 84.8 76.9 81.9 60.0Lesotho 52.0 43.4 58.4 39.9 66.0 62.3 75.1 58.1Liberia .. 83.7 69.0 75.8 .. 94.8 86.4 90.1Madagascar 72.5 72.1 70.4 70.3 88.4 89.2 87.1 87.2Malawi .. 73.9 76.8 73.9 .. 90.5 90.8 91.3Mali 86.1 56.3 54.4 49.7 93.9 79.6 78.9 75.9Mauritania 42.8 21.2 32.3 24.2 68.6 44.1 59.3 51.4Mozambique .. 74.7 69.5 60.0 .. 90.0 86.8 79.6Nepal .. 55.1 62.3 57.4 .. 77.6 85.4 77.8Niger 75.5 65.9 60.9 68.8 91.3 85.6 84.9 86.5Rwanda .. 76.6 61.7 62.2 .. 90.3 85.7 81.4Sao Tome and Principe .. 28.4 .. 56.6Senegal 60.0 38.8 52.3 34.7 80.5 65.8 69.7 63.9Sierra Leone .. 53.4 67.0 68.5 .. 76.1 85.9 86.7Sudan .. .. 55.8 44.0 .. .. 75.3 65.0Timor-Leste .. 45.1 .. 75.2Togo .. 38.7 50.8 56.1 .. 69.3 79.6 83.0Uganda 70.0 54.5 69.9 55.4 88.6 77.7 87.8 78.0United Rep. of Tanzania 72.6 88.5 55.4 50.7 91.3 96.6 83.0 79.3Yemen 4.5 17.5 42.1 28.8 15.4 46.6 71.4 61.4Zambia 64.0 64.4 53.5 55.6 78.5 83.3 73.6 74.9Source: World Bank, World Development Indicators, online (June 2010); New estimates: Karshenas, 2010.
significantly higher in African LDCs, at 59 per cent, than in Asian LDCs, at 41 per cent. For the $2/day poverty line, however, the difference is less marked: 80 per cent in African LDCs and 72 per cent in Asian LDCs.
Overall, three major periods can be identified in poverty trends in the LDCs between 1980 and 2007 (chart 12). From the 1980s to the mid-1990s, the incidence of poverty was on the rise in both African and Asian LDCs. Between 1994 and 2000 headcount rates began to decline, with such reduction accelerating after 2000. It should be stressed that this finding differs from that of the LDC Report 2008, which found that there was no significant change in the rate of poverty reduction between the 1990s and the period 2000–2005. This difference reflects the different definition of poverty ($1.25/day in 2005 purchasing power parity (PPP) dollars versus $1.08 in 1990 PPP dollars) as well as different PPP exchange rates used in the poverty estimates.
The number of people living in extreme poverty in LDCs has continued to increase
throughout the last 30 years, even during the period of
economic boom.

35The Global Financial Crisis and Recent Boom-Bust Cycle in the LDCs
The LDC experience with poverty reduction is a major cause for concern: although the incidence of poverty has been falling since 1994, by 2005 it had only reached the level of 1980. Moreover, with rapidly rising populations, the number of people living in extreme poverty in LDCs has continued to increase throughout the last 30 years, and by 2007 it was twice as high as in 1980. Indeed, the number of extremely poor people living in the LDCs actually continued to increase during the period of economic boom. There is, nonetheless, a significant difference between African LDCs, where the number of people living in extreme poverty continued to rise, and Asian LDCs, where the trend reached a plateau after 2000.
Disaggregating the poverty trends by country (table 10), it is apparent that more than 50 per cent of the population live in extreme poverty in 20 out of 35 LDCs for which data were available using the new poverty estimates for 2007, and a slightly higher proportion — 22 out of 34 — using the World Bank estimates for 2005. The fact that a substantial majority of the population in the LDCs suffers from income poverty is of immense policy significance when compared to narrowly focused Poverty Reduction Strategies and restrictively targeted social policies (McKinley and Martins, 2010). As has been argued in earlier LDC Reports, reducing poverty in these conditions requires inclusive development strategies that are able to generate productive employment opportunities in particular, rather than adopting a narrow focus targeting “the poor”. Unfortunately, the current policy model has not been successful in translating the very favourable (though unsustainable) external conditions of the LDCs into substantial improvements in human well-being for the majority of the population, using income poverty as a measure of living standards.
2. PROGRESS TOWARDS THE MDGS BEFORE THE CRISIS
One major problem in assessing progress towards MDGs in LDCs is the dearth of data (LDC Report 2008, chart 16). This section focuses on those poverty and human development targets for which aggregate data were available for LDCs as well as for developing countries as a whole, and also on those targets for which data were available for at least two thirds of all LDCs. For LDCs as a whole, progress on poverty reduction is estimated on the basis of both World Bank estimates and the new poverty estimates, while progress for individual countries is estimated using only the new estimates.
The evidence shows that although some accelerated progress was made towards achieving the MDGs during the boom years, the LDCs as a group are unlikely to achieve most targets for which group estimates have been made, with the exception of universal primary education and gender equality in school enrolment (MDGs 2 and 3 respectively). Moreover, the level of human development remains appallingly low: for most MDG indicators LDCs are at a level where developing countries were on average 20 years ago. For example, the net primary enrolment rate in LDCs (76 per cent) in 2007 was below that in developing countries in 1990 (80 per cent); similarly, the rate of undernourishment in LDCs in 2007 was 70 per cent higher than in developing countries in 1990 (34 per cent and 20 per cent respectively).
Unlike the developing countries as a group, LDCs are off track to achieve the MDG 1 target of halving the incidence of extreme poverty, in spite of moderate improvements over the last decade. This is evident in both World Bank estimates and UNCTAD estimates presented here. According to the World Bank, the incidence of extreme poverty in LDCs decreased from 63
One major problem in assessing progress towards
MDGs in LDCs is the dearth of data.
Although some progress was made towards achieving
the MDGs during the boom years, the LDCs as a group are unlikely to achieve most targets with the exception of
MDGs 2 and 3.
The Least Developed Countries Report 201036
per cent in 1990 to 53 per cent in 2005, with two thirds of the improvement occurring since 2000 (chart 13). The new poverty estimates suggest that the 1990 poverty rate was slightly lower (58 per cent), but progress since 2000 has been slower, with a decline from 59 per cent in 2000 to 53 per cent in 2007 (see chart 12). These latter data imply that the MDG-related poverty reduction deficit in LDCs is not simply due to the increasing incidence of poverty in the early 1990s and the slow rate of poverty reduction in the late 1990s, but also to the slow rate of poverty reduction over the past decade.
This sluggish rate of progress towards MDG 1 is largely related to the inability to meet the challenge of creating productive jobs and livelihoods for the millions of young people entering the workforce each year. Outside agriculture, people find work mainly in informal economic activities. The share of own-account and contributing family workers in total employment, also monitored under MDG1, was 81 per cent in LDCs in 2008 compared with 59 per cent in developing countries. Moreover, progress in reducing vulnerable employment in the 1990s and since 2000 has been slower in LDCs than in developing countries.
The data on undernourishment also indicate that progress has been slow (chart 13). About 34 per cent of the LDC population is reported to have been undernourished in 2005–2007, compared with 16 per cent in developing countries. Since then, some reversals in the progress against hunger has inevitably taken place, as a consequence of the food price hikes in mid 2008, and the fallout of the global crisis in 2009.
Turning to the other six indicators for which progress towards specific time-bound MDG targets can be monitored, the following trends are clear:
• Regarding the target for universal primary education, both LDCs and developing countries are only slightly off track owing to a significant acceleration of enrolments since 2000. However, only 59 per cent of children in LDCs who start grade 1 reach the last grade of primary school, compared with 87 per cent in developing countries.
• Concerning access to safe water, developing countries are on track to achieve the goal, but LDCs as a group are off track. There has been no significant change in the trend of increasing access to improved water sources in LDCs since 2000.
• Both developing countries and LDCs are off track in the rate of progress towards the target of reducing infant mortality and child mortality by two thirds between 1990 and 2015, though the rate is actually faster in LDCs than in developing countries. However, because the former started from a very high level of mortality rates, overall they will fall far shorter of the target by 2015. There is no sign that there has been an acceleration of progress since 2000.
• Regarding access to improved sanitation facilities, both developing countries and LDCs are off track, but the rate of progress in LDCs is slower, with no significant acceleration since 2000.
• Regarding the maternal mortality rate, both LDCs and developing countries have shown painfully slow progress.
A more disaggregated picture (table 11) shows that only a handful of countries are on track to achieve the MDGs on a broad front. For seven targets, only seven LDCs are on track to achieve four or more of those targets. These countries are Ethiopia, the Lao People’s Democratic Republic, Malawi, Maldives, Mozambique, Nepal and Samoa.
Both developing countries and LDCs are off track to achieve the target of reducing infant
mortality, child mortality and maternal mortality rate.
For most MDG indicators LDCs are at a level where
developing countries were on average 20 years ago.
The sluggish rate of progress towards MDG 1 is largely
related to the inability to meet the challenge of
creating productive jobs and livelihoods for the millions
of young people entering the workforce each year.

37The Global Financial Crisis and Recent Boom-Bust Cycle in the LDCs
Chart 13Selected MDG indicators and projections for LDCs and developing countries, 1990–2015
Proportion of population living below $1.25 (2005 PPP) per day(World Bank estimates)
33
26.623
32
41.7
46.953.4
60.463.3
1415.9
45.5
0
10
20
30
40
50
60
70%
of p
opul
atio
n
Developingcountries Developing
countries
Developingcountries
Developingcountries
Developingcountries
Developingcountries Developing
countries
Developingcountries
LDCs LDCs
LDCs
LDCs LDCs
LDCsLDCs
LDCs
Proportion of population belowminimum level of dietary energy
36
32
1616
40
2724.8
20
1416
10
20
0
5
10
15
20
25
30
35
40
45
% o
f und
erno
uris
hed
in to
tal p
opul
atio
n
Net enrolment ratio in primary education
82.688.8
52.359.5
78.8
89.779.9
9294.295.7100
0
20
40
60
80
100
120
% o
f chi
ldre
n of
prim
ary
educ
atio
n en
rolm
ent a
ge
Under-five mortality rate
86
72
179.8
151128.9
109.1109.6
100
63.659.959.8
33.3
0
20
40
60
80
100
120
140
160
180
200
Dea
ths
per 1
000
live
birt
hs
Infant mortality rate
82.4
59
49
112.3
95.7
7068
424037
23
0
20
40
60
80
100
120
deat
hs b
efor
e ag
e of
one
per
1 0
00 li
ve b
irths
Maternal mortality rate
450
900 870850
480430
225
120
0
100
200
300
400
500
600
700
800
900
1000
1985 1990 1995 2000 2005 2010 2015 1985 1990 1995 2000 2005 2010 2015
1985 1990 1995 2000 2005 2010 20151985 1990 1995 2000 2005 2010 2015
1985 1990 1995 2000 2005 2010 2015 1985 1990 1995 2000 2005 2010 2015
1985 1990 1995 2000 2005 2010 2015 1985 1990 1995 2000 2005 2010 2015
deat
hs p
er 1
00 0
00 li
ve b
irths
Proportion of population withoutimproved drinking water sources (%)
2116
34
23
14.5
46
4238
29
9.5
0
5
10
15
20
25
30
35
40
45
50
% o
f pop
ulat
ion
Proportion of population withoutimproved sanitation facilities (%)
52
48
7671
645856
59
42.543
40
33
0
10
20
30
40
50
60
70
80
90
% o
f pop
ulat
ion
Based on 1991-2008Based on 2000-2008
Based on 1990-2008Based on 1990-2006Based on 2000-2006
Based on 1990-2005Based on 1999-2005 Based on 1991-2006
Based on 2001-2006
Based on 1990-2008Based on 2000-2008
Based on 1990-2008Based on 2000-2008
Based on 1990-2005
MDG-desired
Source: UNCTAD secretariat calculations, based on United Nations, The Millennium Developments Goals Report 2010, New York, 2010, statistical annex.
Note: The MDG-desired curve indicates how the selected indicators should evolve in order to meet the respective MDG. The dotted curves show projections based on the extrapolation of trends for one or two periods.

The Least Developed Countries Report 201038
Table 11Millennium Development Goal progress by country
MDG Indicator
Country
1.1Poverty
$1.25 per day (Karshenas,
2010 estimates)
1.9Proportion of
under-nourished population
2.1Net enrolment ratio in primary
education
4.1Under-five
mortality rate
4.2Infant mortality
rate
7.8Proportion of
population using improved drinking
water source
7.9Proportion
of population using improved
sanitation facilities
Afghanistan Reversal/Stagnation Reversal/Stagnation On track Low progress
Angola On track Low progress Low progress Medium progress On track
Bangladesh Low progress On track Reversal/Stagnation On track On track Low progress Medium progress
Benin Reversal/Stagnation On track On track Medium progress Medium progress On track Low progress
Bhutan On track On track Medium progress On track Low progress
Burkina Faso Medium progress On track Medium progress Low progress Low progress On track Low progress
Burundi Reversal/Stagnation Reversal/Stagnation On track Low progress Low progress Low progress Low progress
Cambodia On track On track Medium progress Low progress Low progress On track Medium progress
Central African Rep. Reversal/Stagnation Low progress Low progress Reversal/Stagnation Reversal/Stagnation Medium progress Medium progress
Chad Reversal/Stagnation On track Medium progress Reversal/Stagnation Reversal/Stagnation Medium progress Low progress
Comoros Reversal/Stagnation On track Low progress Low progress On track Medium progress
Dem. Rep. of the Congo Reversal/Stagnation Reversal/Stagnation Reversal/Stagnation Reversal/Stagnation Reversal/Stagnation Low progress Low progress
Djibouti Reversal/Stagnation On track Low progress Low progress Low progress On track Reversal/Stagnation
Equatorial Guinea Reversal/Stagnation Medium progress Medium progress Reversal/Stagnation Reversal/Stagnation
Eritrea Reversal/Stagnation Low progress On track On track Medium progress Low progress
Ethiopia Medium progress On track On track On track On track Medium progress Low progress
Gambia Low progress Reversal/Stagnation Medium progress Medium progress Low progress On track Low progress
Guinea Low progress Medium progress Medium progress Medium progress On track Low progress
Guinea-Bissau Low progress Reversal/Stagnation Medium progress Low progress Low progress Medium progress Low progress
Haiti Reversal/Stagnation Low progress On track On track Medium progress Reversal/Stagnation
Kiribati On track On track On track Medium progress Medium progress Low progress
Lao People's Dem. Rep. On track On track Medium progress On track On track Medium progress On track
Lesotho On track Reversal/Stagnation Reversal/Stagnation Low progress Low progress On track Reversal/Stagnation
Liberia Reversal/Stagnation Reversal/Stagnation On track Medium progress Medium progress Medium progress Low progress
Madagascar Reversal/Stagnation Reversal/Stagnation On track Medium progress Medium progress Low progress Low progress
Malawi Low progress On track On track On track On track On track Medium progress
Maldives On track On track On track On track Low progress On track
Mali Low progress On track On track Low progress Medium progress On track Low progress
Mauritania Medium progress On track Medium progress Low progress Low progress Medium progress Low progress
Mozambique Low progress On track On track On track On track Medium progress Low progress
Myanmar On track Low progress Low progress On track On track
Nepal Low progress Medium progress On track On track On track On track Medium progress
Niger Reversal/Stagnation On track Medium progress On track On track Medium progress Low progress
Rwanda Reversal/Stagnation Low progress On track Medium progress Medium progress Reversal/Stagnation On track
Samoa On track On track On track On track Reversal/Stagnation On track
Sao Tome and Principe On track On track Reversal/Stagnation Reversal/Stagnation On track Low progress
Senegal Low progress Low progress Medium progress Medium progress Low progress Medium Progress Medium progress
Sierra Leone Reversal/Stagnation Reversal/Stagnation Medium progress Medium progress Reversal/ Stagnation Low progress
Solomon Islands On track Low progress Low progress Low progress Low progress Low progress
Somalia Reversal/Stagnation Reversal/Stagnation Low progress Low progress
Sudan Medium progress On track Reversal/Stagnation Low progress Low progress Reversal/ Stagnation Reversal/Stagnation
Timor-Leste Reversal/Stagnation Low progress On track On track Medium progress On track
Togo Reversal/Stagnation Medium progress On track Medium progress Medium progress Medium progress Reversal/Stagnation
Tuvalu Medium progress Medium progress On track Medium progress
Uganda Medium progress Medium progress On track Medium progress Medium progress On track Low progress
United Rep. of Tanzania Low progress Reversal/Stagnation On track Medium progress Medium progress Reversal/ Stagnation Reversal/Stagnation
Vanuatu On track On track Reversal/Stagnation Reversal/Stagnation On track Medium progress
Yemen On track Reversal/Stagnation Medium progress On track Medium progress Reversal/Stagnation On track
Zambia Reversal/Stagnation Reversal/Stagnation On track Low progress Low progress Medium progress Low progress
Source: United Nations Statistics Division, MDG indicators database 30 june 2010 http://mdgs.un.org/unsd/mdg/Data.aspx Notes: A: On track (MDG-compatible target achieved at 90% or above in the latest year available) M: Medium progress (50% to 89% of the MDG-compatible target achieved in the latest year available) L: Low progress (6% to 49% of the MDG-compatible target achieved in the latest year available) S: Reversal/ Stagnation (less than 6% of the MDG-compatible target achieved in the latest year available)
39The Global Financial Crisis and Recent Boom-Bust Cycle in the LDCs
Regarding the MDGs for which there are specific targets, it is apparent that:
• The most significant progress has been made towards the net primary school enrolment target, where half of the LDCs are on track.
• About one third of LDCs are on track to meet the goal of halving the proportion of people without access to safe drinking water.
• Only one quarter of the LDCs are on track to reach the target of reducing infant mortality by two thirds between 1990 and 2015, and a similar proportion are on track to achieve the child mortality target.
• The slowest progress is in relation to the poverty reduction target, where the new estimates indicate that only 4 out of 33 LDCs for which data were available are on track to halve the incidence of extreme poverty between 1990 and 2015.16
• The data also suggest that significant progress has been made in reducing the incidence of undernourishment by half. However, the pattern varies among LDCs: half of them appear to be on track to achieve the target while in more than a third progress has either stagnated or been reversed. The slow progress in reducing malnutrition in LDCs as a group compared with the comparatively good disaggregated performance because many small countries, particularly island LDCs, have made good progress on this indicator.
Overall, these data indicate that the acceleration of growth during the period of economic boom in the LDCs led to some advances in the progress towards MDGs and poverty reduction since 2000. However, only a handful of countries are on track to achieve the MDGs on a broad front. There has been significant progress in net primary enrolment and gender parity in primary education, reflecting strong Government and donor commitment. Poverty reduction has also advanced to some extent. However these achievements are rather modest in relation to policy targets. Most notably, LDCs’ growth acceleration in the early and mid-2000s appears to have had little impact on employment creation and overcoming food insecurity. Finally, in the crucial areas of quality and outreach of health services (MDGs 4 and 5) progress has been sluggish, as also for major infrastructural investments, such as in improving sanitation.
3. SOCIAL IMPACT OF THE GLOBAL ECONOMIC CRISIS AND OUTLOOK FOR POVERTY REDUCTION TO 2015
Given the lack of systematic and up-to-date data, it is extremely difficult to estimate the social impact of the crisis. The social costs of the downturn are likely to have been serious, as this came on top of the food and fuel crises of the previous year. Moreover, regardless of any rebound in macroeconomic variables, many of the survival strategies of vulnerable households at the peak of the crisis, such as incurring debts, selling key productive assets or taking children out of school, are likely to adversely affect their long-term well-being. Similar hysteresis effects have long-lasting implications not only for life-time income, but also for achieving the MDGs, as widely shown in various recent studies (e.g. Chhibber, Ghosh and Palanivel, 2009; UNDP, 2010; World Bank, 2010c).
Estimates by the International Labour Organization (ILO, 2010), as well as anecdotal evidence, suggest sharp setbacks in terms of employment levels, while informalization and the number of working poor have also been on
There has been significant progress in net primary enrolment and gender
parity in primary education, reflecting strong Government
and donor commitment.
The social impact of the crisis can be expected to be
long-lasting regardless of any rebound in macroeconomic
variables, since many of the survival strategies of
vulnerable households at the peak of the crisis are likely to adversely affect their long-
term well-being.
Most notably, LDCs’ growth acceleration in the early
and mid-2000s appears to have had little impact on employment creation and
overcoming food insecurity.

The Least Developed Countries Report 201040
the rise in many LDCs. Because of the intrinsic nature of the crisis, these deteriorating trends have hit the export sectors particularly hard, but they have also affected construction and other non-tradable sectors. In Cambodia, for instance, the slowdown in the garment sector resulted in the loss of 63,000 jobs between the last quarter of 2008 and the first quarter of 2009, and it is estimated that 30 per cent of construction jobs disappeared in the first three quarters of 2009 (Box 2). Similarly, in the Democratic Republic of the Congo declining activity in the mining sector caused over 100,000 job losses (Kamara, Ndikumana and Kandiero, 2009). Given the rapid demographic growth in most LDCs, the crisis-induced slumps in employment creation may entail more prolonged distress, as labour markets have already been under pressure to absorb the numerous cohorts of young entrants.
The setback in employment levels is particularly worrying for its effects on the incidence of poverty, especially in view of the virtual absence of broad-based safety net mechanisms in LDCs. Prospects for poverty reduction are exacerbated by the persistence of high food prices in a number of LDCs (FAO, 2010; World Bank, 2010a). While the continued rise in cereal prices is in some instances driven by unfavourable weather conditions — as in some East African countries, Bangladesh and Myanmar (FAO, 2010) — it can also be due to the asymmetric functioning of the food market.17 The ODI (2010) estimates that in Cambodia the poverty headcount ratio could increase by 1 to 4 percentage points in the wake of the crisis. Similarly, in Ethiopia the increase in the number of poor people attributable to the global downturn may exceed 630,000. ODI (2010) also estimated that the financial crisis led to an additional 2 million people living in extreme poverty in Bangladesh. In the same vein, Karshenas (2009) estimates that the crisis may have resulted in 7.3 million additional people living in extreme poverty in African and Asian LDCs.
In the medium term, the impact of the crisis on poverty reduction will depend crucially on the speed and pattern of recovery of LDCs. Using the new poverty estimates, for example, 3 indicative scenarios can be constructed. If the rates of poverty reduction achieved during the period 2000–2007 are once again attained, and maintained until 2015, the incidence of extreme poverty in LDCs would then be 46 per cent. If, instead, recovery does not take off, and poverty reduction rates remain at their 1990–2007 average, 51 per cent of the population in LDCs will be living in extreme poverty by 2015. Finally, if the effect of the crisis is so deep and persistent that the poverty reduction rate returns to that of the 1990s, it is possible that the incidence of poverty will rise to 54 per cent by 2015. In such a scenario, this crisis would have resulted in an extra 77 million people living in extreme poverty in the LDCs by 2015. This is obviously only an indicative scenario based on simple assumptions, but it shows that the impact of the crisis could be very large and long-lasting. It will ultimately depend on the ability of LDCs to adopt a new development path of sustained and inclusive development and the ability of the international community to reduce the overall volatility of global growth and enable the development of productive capacities in the LDCs.
Both the economic and social outcomes in LDCs during the recent boom-bust cycle show that there is need for new development thinking and new policy approaches. The global financial crisis and the deep recession of 2009 should be seized as an opportunity to move beyond “business as usual” by both the LDCs and their development partners. The rest of this Report focuses on the international dimension of such new thinking, and in particular the case for, and design of, a new international development architecture for the LDCs.
In Cambodia the slowdown in the garment sector resulted in the loss of 63,000 jobs. In the Democratic Republic of the Congo declining activity in the mining sector caused
over 100,000 job losses.
Both the economic and social outcomes in LDCs during the recent boom-bust cycle show
that there is need for new development thinking and
new policy approaches. The global financial and economic
crisis should be seized as an opportunity to move
beyond “business as usual” by both the LDCs and their
development partners.
If poverty reduction rates over the next five years fall to those of the 1990s, there could be an additional 77 million people living in
extreme poverty by 2015 than if the poverty reduction rates
of the period 2000–2007 were to be maintained.

41The Global Financial Crisis and Recent Boom-Bust Cycle in the LDCs
Notes1 For a more detailed discussion of the roots of the global financial and economic crisis, see
UNCTAD, 2009a and UNCTAD, 2009b.2 See also UNCTAD, 2009c.3 The external resource gap, which is defined as the difference between gross capital formation
and gross domestic investment, measures the reliance on external capital to finance domestic investment.
4 Net adjusted savings are obtained by deducting from gross national savings (plus educational expenditure) the imputed costs for fixed capital consumption, energy depletion, mineral depletion, net forest depletion and damage from carbon dioxide and particulate emissions. Typically, the cost of natural resource depletion is computed by multiplying the unit resource rent by the physical quantity extracted.
5 See also UNDESA, 2010.6 Unlike in previous tables, the definition of “fragile States” used here refers to the World
Bank’s harmonized list of fragile States for the year 2010 (see: http://siteresources.worldbank.org/EXTLICUS/Resources/511777-1269623894864/Fragile_Situations_List_FY10_Mar_26_2010_EXT.pdf ).
7 Between 2006 and 2008, stock market capitalization in the six LDCs for which data were available ranged from 1.5 per cent to 35 per cent of GDP, while the total value of stocks traded in the year did not exceed 7 per cent of GDP (World Bank, World Development Indicators database for Bangladesh, Malawi, Nepal, Uganda, the United Republic of Tanzania, and Zambia).
8 LDCs’ trading partners considered by ITC (2010) comprise: Australia, Brazil, China, Taiwan Province of China, Colombia, El Salvador, EU-27 (excl. Belgium), Iceland, Japan, Mauritius, Mexico, Singapore, Switzerland, Thailand, Turkey and the United States. In 2008, these countries accounted for 78 per cent of LDCs’ merchandise exports; correspondingly, the analysis of mirror data captures a partial but very significant picture.
9 WTO preliminary estimates are not exactly comparable with ITC data, given that the latter only consider data for LDCs’ major trading partners, while the former refer to total exports; nevertheless, the picture they offer in terms of differential impacts of the crisis on LDCs’ export is fairly consistent.
10 During the recent downturn, the greater resilience of intraregional exports is attributable not only to the uneven depth of the crisis in developed and developing countries, but also to the fact that the composition of intraregional exports is typically more diversified than that of exports to the North (UNCTAD, 2009d).
11 Anecdotal reports suggest that remittances to Haiti increased in the wake of the devastating earthquake of 12 January 2010. This is in line with historical experiences after crises or natural disasters. In this particular instance, such a quick rebound also reflects the decision of the United States Government to grant temporary protected status for 18 months to Haitians already living in the United States, thereby allowing over 200,000 Haitians currently residing there without proper documents to live and work legally (World Bank, 2010b).
12 UNECA 2010, for instance, observes that during 2009 accommodating monetary policies have been adopted by the central banks of the CFA zone and in Lesotho.
13 See chapter 5 for a more detailed discussion on the potential of further SDR allocations to LDCs, in order to provide them with a critical source of development financing.
14 Eritrea is the only LDC whose debt sustainability rating has been downgraded since September 2009 (from “high risk” to “in debt distress”), reflecting the accumulation of arrears since 2007. On the other hand, the rating of the Central African Republic has been upgraded (from “high risk” to “moderate risk”), as a result of the delivery of HIPC/MDRI debt relief at completion point.
15 OECD-DAC forward-looking data do not represent firm ODA commitments; rather, they offer a conservative estimate of the evolution of aid disbursements based on donors’ currently agreed financial planning. Statistically, CPA is defined in terms of exclusion, by netting out from total gross ODA those flows which: (i) are intrinsically unpredictable, such as humanitarian aid and debt relief; (ii) do not entail cross-border transactions (e.g. administrative costs); and (iii) do not form part of cooperation agreements between Governments (e.g. food aid, decentralized cooperation and/or core funding by NGOs). IMF disbursements are not included.
16 These countries are Cambodia, Laos, Lesotho and Yemen.17 Along this line of reasoning, Ghosh (2009: 9) argues that, “while the pass-through of global
prices was extremely high in developing countries in the phase of rising prices, the reverse tendency has not been evident in the subsequent phase as global trade prices have fallen.” According to Van Waeyenberge, Bargawi and McKinley (2010), the IMF advocated cuts in consumer subsidies for Benin, Ethiopia, Malawi and Sierra Leone, which led to a higher pass-through of international price hikes, causing domestic prices of food and fuel to rise.

The Least Developed Countries Report 201042
ReferencesAfrican Development Bank and World Bank (2009). Africa and the global economic crisis:
impacts, policy responses, and political economy. Offices of the Chief Economists, Africa Development Bank and the World Bank Africa Region. Paper presented at the AERC conference on Rethinking African Economic Policy in Light of the Global Economic and Financial Crisis, Nairobi, 6-8 December 2009.
Anyanwu J and Erhijakpor A (2010). Do international remittances affect poverty in Africa? African Development Review, 22 (1): 51–91.
Arbache J and Page J (2007). More growth or fewer collapses? A new look at long-run growth in sub-Saharan Africa. Policy Research Working Paper No. 4384. Washington DC, World Bank.
Cali’ M and Kennan J (2009). The effects of the global financial crisis on exports in least developed countries. Paper presented at the AERC conference on Rethinking African Economic Policy in Light of the Global Economic and Financial Crisis, Nairobi, 6–8 December 2009.
Cerra V and Saxena S (2005). Growth dynamics: the myth of economic recovery. IMF Working Paper No. 05/147, Washington DC, International Monetary Fund.
Chhibber A, Ghosh J and Palanivel T (2009). The global financial crisis and the Asia-Pacific region. Colombo, UNDP Regional Centre for Asia and the Pacific.
FAO (2010). Crop prospects and food situation, No. 1, February. Rome, FAO. Ghosh J (2009). The unnatural coupling: Food and global finance. G-24 Discussion Paper Series.
United Nations Conference on Trade and Development, New York and Geneva.Green D, King R and Miller-Dawkins M (2010). The global economic crisis and developing
countries: impact and response. OXFAM International Research Report. Oxford, Oxfam International.
IDA and IMF (2009). Heavily Indebted Poor Countries (HIPC) Initiative and Multilateral Debt Relief Initiative (MDRI) – Status of Implementation. Washington, DC, IMF.
IFAD (2009). Sending Money Home to Africa: remittance markets, enabling environment and prospects. IFAD. Rome.
ILO (2010). Global Employment Trends 2010. Geneva, ILO.IMF (2009a). The implications of the global financial crisis for low-income countries. Washington,
DC, MF. IMF (2009b). The implications of the global financial crisis for low-income countries: an update.
Washington, DC, IMF. IMF (2010a). Sub-Saharan Africa regional economic outlook: Back to high growth? Washington,
DC, IMF. IMF (2010b). Preserving debt sustainability in low-income countries in the wake of the global
crisis. Washington, DC, IMF. ITC (2009). ITC Trademap factsheet: Developing country exports decline in 2009. Geneva,
International Trade Centre of UNCTAD/WTO. ITC (2010a). ITC Trademap factsheet: LDC trade recovery in 2009. Geneva, International Trade
Centre of UNCTAD/WTO. ITC (2010b). ITC Trademap factsheet: LDC terms of trade during crisis and recovery. Geneva,
International Trade Centre of UNCTAD/WTO. Kamara A, Ndikumana L and Kandiero T (2009). Commodities, exports, subsidies and African trade
during the slump. African Development Bank Policy Briefs No. 5/2009, Addis Ababa.Karshenas M (2008). Poverty trends in Least Developed Countries. Study prepared for UNCTAD
as a background paper for The Least Developed Countries Report 2008, New York and Geneva.
Karshenas M (2009). The impact of the global financial and economic crisis on LDC economies. Report prepared for the United Nations Office of the High Representative for the Least Developed Countries, Landlocked Developed Countries and Small Island Developing States (UN-HORLLS).
Karshenas M (2010). Global Poverty: New National Accounts Consistent Estimates based on 2005 Purchasing Power Parity Exchange Rates, with extension to the Least Developed Countries poverty trends. Study prepared for UNCTAD as a background paper for The Least Developed Countries Report 2010, New York and Geneva.
Kripner GR (2005). The financialization of the American economy. Socio-Economic Review 3: 173-208.
Meyn M and Kennan J (2009). The implications of the global financial crisis for developing countries’ export volumes and values. ODI Working paper 305. London.
Ocampo JA, Griffith-Jones S, Noman A, Ortiz A, Vallejo J and Tyson J (2010); The great recession and the developing world; Paper prepared for the Conference on Development Cooperation in times of crisis and on achieving the MDGs.
ODI (2009). The global financial crisis and developing countries: synthesis of the findings of 10 country case studies. ODI Working paper 306, London. (Country case studies covered,
43The Global Financial Crisis and Recent Boom-Bust Cycle in the LDCs
in addition to other developing countries, the following LDCs: Bangladesh, Cambodia, Uganda, the United Republic of Tanzania and Zambia).
ODI (2010). The global financial crisis and developing countries: phase 2 synthesis. ODI Working paper 316, London. (Country case studies covered the following LDCs: Bangladesh, Cambodia, the Democratic Republic of the Congo, Ethiopia, Mozambique, Sudan, Uganda, the United Republic of Tanzania and Zambia).
OECD (2009). 2009 DAC Report on Aid Predictability. Paris, OECD.Shafaeddin M (2010) The Impact of the Global Economic Crisis on Industrial Development of
Least Developed Countries. Research paper prepared for the South Centre. GenevaTe Velde D and Massa I (2009). Donor responses to the global financial crisis - a stock take.
Global Financial Crisis Discussion Series Paper 11. ODI. London.UNCTAD (2009a). The global economic crisis: Systemic failures and multilateral remedies.
Report by the UNCTAD Secretariat task Force on systemic Issues and Economic Cooperation, New York and Geneva, UNCTAD.
UNCTAD (2009b). Trade and Developed Report 2009. New York and Geneva, UNCTAD. UNCTAD (2009c). Enhancing the Role of Domestic Resources in Africa’s Development: a Policy
Handbook. UNCTAD. New York and Geneva.UNCTAD (2009d). Economic Development in Africa Report 2009: Strengthening Regional
Economic Integration for Africa’s Development. New York and Geneva, UNCTAD. UNCTAD (2010a). Responding to the challenges posed by the global economic crisis to debt
and development finance. New York and Geneva, UNCTAD. UNCTAD (2010b). In Quest of Structural Progress: Revisiting the Performance of the
Least Developed Countries. Note by the UNCTAD secretariat TD/B/EX(49)/2.Geneva, UNCTAD.
UNCTAD (2010c). World Investment Report 2010: Investing in a Low-Carbon Economy. New York and Geneva, UNCTAD.
UNCTAD (2010d). Empowering MDG strategies through inclusive economic development. Note by the UNCTAD secretariat TD/B/EX(49)/CRP.2.Geneva, UNCTAD
UNCTAD (various issues). Least Developed Countries Report. New York and Geneva, UNCTAD.
UNDESA (2010a). World Economic Situation and Prospects 2010: Update as of mid-2010. New York, United Nations.
UNDESA (2010b). World Economic Situation and Prospects 2010. New York, United Nations.
UNDP (2010). The Millennium Development Goals Report 2010. New York, United Nations. UNECA (2010). Economic Report on Africa 2010: Promoting High-Level Sustainable Growth
to Reduce Unemployment in Africa. Addis Ababa, UNECA.UNFPA (2010). Recovering from economic and financial crisis: Food security and safety nets.
Background document prepared jointly by UNDP, UNFPA, UNICEF and the World Food Programme.
Van Waeyenberge E, Bargawi H and McKinley T (2010). Standing in the way of development? A critical survey of the IMF’s crisis response in low income countries. Eurodad and Third World Network.
Weisbrot M, Ray R, Johnston J, Cordero J.A, and Montecino JA (2009). IMF-supported macroeconomic policies and the world recession: a look at forty-one borrowing countries. Centre for Economic Policy Research.
World Bank (2009). Global development finance: charting a global recovery. Washington, DC, World Bank.
World Bank (2010a). Global Economic Prospects 2010: Crisis, Finance and Growth. Washington, DC, World Bank.
World Bank (2010b). Migration and Development Brief No. 12, 23 April; available at: http://siteresources.worldbank.org/INTPROSPECTS/Resources/334934-1110315015165/MigrationAndDevelopmentBrief12.pdf
World Bank (2010c). Global Monitoring Report 2010: the MDGs After the Crisis. Washington, DC, World Bank.
World Trade Organization (2010). Market Access for Products and Services of Export Interest to Least-Developed Countries. Sub-Committee on Least-Developed Countries - Note by the Secretariat, 10-1135, WT/COMTD/LDC/W/46/Rev.1, Geneva.

Chapter
2How Effective are LDC-specific International Support Measures?
A. Introduction
This chapter examines whether international support measures, which have been specifically designed to help LDCs promote development and poverty reduction and reduce their marginalization and vulnerability in today’s global economy, are working effectively. It shows that there has been increasing recognition of the need for special support measures and actions designed specifically for LDCs, particularly in the last 15 years. But the chapter argues that so far such measures have had largely symbolic, rather than practical, developmental effects.
This conclusion is based on a comparative analysis of how the following eight specific measures are working:
1. Aid targets of 0.15 or 0.20 per cent of donors’ GNI to be allocated to LDCs;
2. The OECD-DAC Recommendation of 2001 to untie aid to LDCs;
3. Special consideration given to LDCs in their accession to the World Trade Organization (WTO);
4. Special and differential treatment for LDCs in WTO agreements;
5. Preferential market access for LDCs;
6. Article 66.2 of the TRIPS Agreement on transfer of technology to LDCs;
7. The Integrated Framework for Trade-related Technical Assistance (IF) which has now been succeeded by the Enhanced Integrated Framework (EIF); and
8. The Least Developed Countries Fund (LDCF) established to implement the work programme of the United Nations Framework Convention on Climate Change (UNFCCC).
The assessment of these measures is based on information derived from existing published evaluations of these measures, but adds value to those evaluations by juxtaposing them and comparing their findings. For example, there has been no comparison of the relative success of the IF and LDCF as they operate in different domains. But a comparative assessment enables the identification of some common weaknesses.
The eight measures listed above have been chosen as representing the most concrete cases of actions in favour of the LDCs. In three major conferences focusing on LDCs organized by the United Nations in 1981, 1991 and 2001, the international community agreed decadal programmes of action for these countries. Each of these conferences called for commitments to multiple actions by both the LDCs and their development partners. The Brussels Programme of Action (BPOA) of 2001, for example, listed commitments to
A comparative assessment of LDC-specific international support measures enables the identification of some
common weaknesses.
The eight measures have been chosen because they represent
the most concrete cases of actions in favour of the LDCs.
The Least Developed Countries Report 201046
156 actions by the LDCs themselves and 178 actions by their development partners.1 But the progress in meeting those commitments is unclear, as there are no accountability mechanisms to enable monitoring of implementation nor detailed assessments of progress2. The eight specific measures examined in this chapter are inscribed in the three programmes of action, but they are also being implemented or monitored by specific international organizations, such as OECD-DAC, WTO, UNFCCC and the World Intellectual Property Organization (WIPO), or they form part of the targets of the Millennium Development Goals (MDGs) which have been the focus of efforts by the international community over the past decade. Therefore, the fact that these measures have had only limited development impacts is not for lack of action following agreements at global conferences. Indeed, some resources are being committed, institutions are being established, and information is being collected. But it is not leading to major practical development effects.
The conclusion of the chapter echoes that of the Committee for Development Policy (CDP) of the United Nations Economic and Social Council, which, in evaluating the benefits that derive from LDC status, and in particular the effects of existing international support measures (United Nations, 2010a, 2010b, 2010c and 2010d), found that they “generated limited results” (United Nations, 2010a: 10). This is due to a number of common shortcomings in the design and implementation of those measures as shown in this chapter’s comparative analysis.
The chapter is organized in three sections. Section B briefly describes the increasing but incomplete recognition by the international community of the special problems of the LDCs. Section C summarizes the evaluations of the eight special international support measures, and section D undertakes a comparative analysis and identifies common shortcomings in their policy design and implementation.
B. The increasing but incomplete recognition of the special needs of LDCs
1. INCREASING RECOGNITION3
The need for special international support measures to address the special structural handicaps of the “least developed countries amongst the developing countries” was first articulated in 1964 by Raul Prebisch, the then Secretary-General of UNCTAD. It was further recognized in a resolution of the United Nations General Assembly in December 1969. Subsequently, a section of the international development strategy which was agreed at the start of the Second International Development Decade in 1970 was devoted to special measures for the LDCs (Resolution 2626/XXV). This was followed in 1971, by the adoption by the United Nations General Assembly of recommendations which formally established a special LDC category. It agreed on a list of 25 countries, which, owing to their very low levels of industrialization and human resources, were considered particularly handicapped amongst low-income countries, and thus deserving of particular advantages in international cooperation.4 In 1981, a Substantial New Programme of Action for the 1980s for the Least Developed Countries was agreed by the international community at the first United Nations Conference for LDCs held in Paris in 1981. Subsequently, new decadal frameworks for international cooperation for the LDCs were
The need for special international support
measures to address the special structural handicaps
of the “least developed countries amongst the developing countries” was first articulated in
1964 by Raul Prebisch,the then Secretary-General of
UNCTAD.
The progress in meeting the commitments of development
partners is unclear, as there are no accountability
mechanisms to enable monitoring of implementation.
47How Effective are LDC-specific International Support Measures?
discussed and agreed at the second and third United Nations conferences for the LDCs held in Paris in 1991 and in Brussels in 2001. Preparations are now under way for a Fourth United Nations Conference on LDCs to be held in Istanbul from 29 May to 3 June 2011.
A quick comparison of the contents of the programmes of action emerging from the three United Nations conferences for LDCs reveals that the problems of these countries have been taken increasingly seriously. The first programme of action for the 1980s had a chapter on international support measures, including specific recommendations on official development assistance (ODA), preferential market access and commodity agreements. But the national actions which LDCs were meant to take as a complement to these measures were founded on a State-centric approach to development planning. This programme of action was thus effectively obsolete at its birth, given the pivotal role which Structural Adjustment Programmes (SAP) played in policy formulation throughout the 1980s and 1990s. The second programme of action for the 1990s was founded on a new compact whereby the LDCs undertook to implement economic reform programmes that required downsizing State intervention and freeing market forces. Their development partners once again undertook to provide special support measures, including specific targets for ODA provision amounting to a given percentage of their GDP. This programme of action was not ideologically sidelined, but its implementation was asymmetrical: in practice, the LDCs undertook deep economic liberalization as required, but aid flows fell by 45 per cent in real per capita terms from 1990 to 2000 (UNCTAD, 2002). This second programme of action also drew attention to the debt problems of LDCs. However, measures to deal with official debt throughout the 1990s were too few and too late, leading to an increase in the debt overhang. In short, there was no effective partnership between the LDCs and their development partners
The third programme of action for the 2000s was centred on the partnership principle. It reiterated the targets for ODA as an international support measure for the LDCs, but placed much greater emphasis on the role of international trade in promoting development in these countries. This programme of action included quantitative targets both for growth and investment and for poverty reduction and human development, reflecting the spirit of the Millennium Declaration and agreements reached at major United Nations conferences in the 1990s. It also gave more attention to the provision of social services, good governance, institutional reform, the rule of law and the participation of civil society (United Nations, 2010d). In contrast to the second programme of action, this decade was characterized by more concerted action by the LDCs on the one hand, and their development partners on the other. But, as argued in the LDC Report 2008, the critical issue is how the development partnership works in practice when there are enormous differences in resources, capabilities and power.
Outside the United Nations conferences, further impetus to recognizing the need for special support measures for LDCs was provided at the conclusion of the Uruguay Round of trade negotiations. This included a decision for special and differential treatment in favour of the LDCs and for “expeditious implementation of the special differential measures in favour of least-developed countries”. In 1997, the WTO organized a High-Level Meeting on Integrated Initiatives for Least-Developed Countries’ Trade Development, which endorsed the creation of a special mechanism for delivering trade-related technical assistance. At the WTO Doha Ministerial Conference in November 2001, Ministers committed to addressing the marginalization of
A comparison of the contents of the programmes of action
emerging from the three United Nations conferences for LDCs reveals that the
problems of these countries have been taken increasingly
seriously.
Outside the United Nations conferences, further impetus to recognizing the need for
special support measures for LDCs was provided at the conclusion of the Uruguay
Round of trade negotiations.
The third programme of action for the 2000s was
centered on the partnership principle and included
quantitative targets both for growth and investment and for poverty reduction and human
development.
The Least Developed Countries Report 201048
the LDCs in international trade and to improving their effective participation in the multilateral trading system. A WTO Work Programme on LDCs was adopted in February 2002, to address seven issues: (i) market access for LDCs, (ii) trade-related technical assistance, (iii) providing, as appropriate, support to agencies assisting with the diversification of least-developed countries’ production and export base, (iv) mainstreaming into the WTO’s work in the implementation of the Brussels Programme of Action, (v) participation of the LDCs in the multilateral trading system, (vi) accession of LDCs to the WTO, and (vii) follow-up to WTO Ministerial Decision and Declarations. The Hong Kong Ministerial Declaration of 2005 adopted a number of other decisions in favour of the LDCs, in particular to facilitate preferential market access. The Declaration reaffirmed that “least developed country members will only be required to undertake commitments and concession to the extent consistent with their individual development, financial or trade needs, or their administrative and institutional capacities.” (WTO, 2005, p. 44).
The commitment of the international community to the United Nations MDGs gave further recognition to the LDC category. Goal 8 — Developing a Global Partnership for Development — is critical to the achievement of the poverty and human development goals. Specific targets for international support in favour of the LDCs, notably in the areas of aid provision and preferential market access, are among the targets within Goal 8, to be achieved by 2015, and progress towards which need to be monitored.
The LDCs are also now recognized within the UNFCCC. Article 4(9) of the UNFCCC commits all parties to the Convention to “take full account of the specific needs and special situations of the least developed countries in their actions with regard to funding and transfer of technology”. The special needs and circumstances of the LDCs were reiterated at the seventh session of the UNFCCC’s Conference of the Parties (COP),5 and an LDC work programme was established to implement the provisions of Article 4(9). This work programme includes:
• Supporting preparation and implementation of national adaptation programmes of action (NAPAs),
• Strengthening existing and, where needed, establishing national climate change secretariats and/or focal points to enable effective implementation of the Convention and of the Kyoto Protocol,
• Providing training in negotiation skills and language,
• Promoting public awareness programmes,
• Development and transfer of technologies, particularly adaptation technologies, and
• Strengthening meteorological and hydrological services to collect, analyse, interpret and disseminate weather and climate information to support implementation of the NAPAs (UNFCCC, 2002).
A special fund, the Least Developed Countries Fund (LDCF), was also established to support the LDC work programme, notably for the preparation of NAPAs, and a Least Developed Countries Expert Group (LEG) was created to support LDCs in the preparation and implementation of their NAPAs (UNFCCC, 2009b).
A final important area of international support for LDCs is through the orientation of the work of the United Nations system relating to the LDCs.
The commitment of the international community to the United Nations MDGs gave further recognition
to the LDC category
A final important area of international support for LDCs is through the
orientation of the work of the United Nations system
relating to the LDCs.
The LDCs are also now recognized within the
UNFCCC, and a special fund, the Least Developed Countries
Fund was established for the preparation and
implementation of national adaptation programmes
of action.
49How Effective are LDC-specific International Support Measures?
This includes, apart from the organization of the decennial conferences, the provision of financial support for the participation of LDCs in annual sessions of the United Nations General Assembly, as well as caps on their contribution to the regular budget of the United Nations. The Committee for Development Policy (CDP), working with UN-DESA and supported by inputs from UNCTAD, has advised the Economic and Social Council of the UN regarding countries which should be added to or those that could be graduated from the list of LDCs. In addition, a special Office of the High Representative for Least Developed Countries, Landlocked Developing Countries and Small Island Developing States (OHRLLS) was set up after UN-LDC III. Its purpose was to advocate support for all these countries, which were regarded as having specific geographical handicaps, and to monitor progress towards achieving goals and targets set at various international conferences relating to their special needs.
Several United Nations agencies have also established special programmes that provide financial or technical assistance to the LDCs (United Nations, 2010a). For example, the United Nations Capital Development Fund focuses on support to decentralize public investment and foster private investment through microfinancing. It currently operates in 37 out of the 49 LDCs; the World Meteorological Organization (WMO) has a special programme to strengthen the capacities of LDCs’ national meteorological and hydrological services (NMHSs); and UNCTAD has a Division for Africa, Least Developed Countries and Special Programmes, which produces the Least Developed Countries Report annually that contains analyses of development issues specific to LDCs and proposes national and international policies to address them.
There is no systematic overview of all the activities of the United Nations system in favour of the LDCs. However, according to the most recent estimates, the United Nations system’s expenditures on operational activities related to LDCs increased from $2.4 billion in 2000 to $7.0 billion in 2008 (United Nations, 2010e). This represents an increase from 28 per cent of total expenditures to 38 per cent for operational activities, both developmental and humanitarian. It is also estimated that more than 50 per cent of country-level expenditure in 2008 went to LDCs, up from 39 per cent in 2003 (United Nations, 2010f, p 31). It is therefore clear that a major way in which LDCs derive financial benefit from the LDC status is through the operational activities of the UN system.
2. INCOMPLETE RECOGNITION
Whereas the LDC category is well accepted within the United Nations system, as reflected in the design of the international trade regime and within the emerging regime of climate change mitigation and adaptation, it is virtually absent from the international financial architecture, and in particular from the aid architecture and debt relief regime. An exception is the 2001 DAC Recommendation on untying aid to the LDCs, discussed below.
Significantly, neither the World Bank nor the International Monetary Fund (IMF) recognize the LDC category in their operational work; instead, they use the concepts of “low-income countries” (LICs), “low-income countries under stress” and “heavily-indebted poor countries”. In addition, both the international financial institutions and bilateral donors are increasingly using the concept of “fragile States”, or some related concept. All these concepts
Several United Nations agencies have established special programmes that
provide financial or technical assistance to the LDCs.
The United Nations system’s expenditures on operational activities related to LDCs
increased from $2.4 billion in 2000
to $7.0 billion in 2008.
Whereas the LDC category is well accepted within the United Nations system, it is virtually absent from
the international financial architecture, and in particular from the aid architecture and
debt relief regime.
Significantly, neither the World Bank nor the
International Monetary Fund (IMF) recognize the LDC
category in their operational work.

The Least Developed Countries Report 201050
overlap with that of LDCs, but imperfectly. In 2003, the CDP decided to align the threshold for gross national income (GNI) used in identifying LDCs with that used by the World Bank to identify LICs. But there is still a difference between LDCs and LICs. The LDCs are identified as “low-income countries that suffer severe structural handicaps to growth, particularly low human resources and high economic vulnerability” (United Nations, 2010c: 3). There is also a maximum population size criterion, which excludes some low-income countries that meet the other criteria. Finally, there are specific criteria for graduation from LDC status, including a low-income threshold which is set at a level 20 per cent above the inclusion threshold. Thus the LDCs include some countries which are not low-income countries (in 2006, for example, 41 of the LDCs were low-income countries), and some low-income countries do not qualify to be LDCs (in 2006 this included 15 low-income developing countries and 4 low-income transition economies).
The concept of the “fragile State” has gained in importance over the past decade as donors have become increasingly selective in their aid allocations. The donors are tending to focus more on countries with policy and institutional environments where aid should work according to their expectations. There are also growing concerns about the fate of the countries which are perceived to have operationally difficult environment, and which therefore are in danger of being ignored. The notion of the fragile State has gained greater importance in this context. But it is very different from that of an LDC. While the former category is defined by weak governance (according to specified criteria and, in particular, the inability to manage aid effectively), the latter is defined by structural weaknesses. The notion of the fragile State is as contentious as its sister concept, the failed State. “Weak governance” is very difficult to measure, and in practice what has become important is a minimum threshold of achievement based on the World Bank’s country policy and institutional assessment (CPIA). But countries can jump in or out of this governance categorization much more quickly than in or out of the structural weakness categorization which is at the heart of the LDC definition. Moreover, there are no agreed or even public listings of “fragile States”.
Most LDCs are heavily dependent on aid, and the World Bank and IMF play a major role in both their access to, and use of, all official financial resources. The non-recognition of the LDC category by these two institutions and the increasing interest of bilateral donors in the category of “fragile States” thus affect the way in which special international support measures for the LDCs actually work. In essence, the international support measures do not work alone; rather, they work alongside and interact with systemic regimes which guide the international economic relations of all developing countries, including the LDCs and sub-categories of developing countries — such as “low-income countries”, “heavily-indebted poor countries” and “fragile States” — which imperfectly overlap with the category of LDC.
In general, the global economic regimes which enable or constrain development in LDCs are much more powerful than the special international support measures for LDCs. For example, economic development in the LDCs in the 2000s was much more affected by the Poverty Reduction Strategy Papers (PRSP) process — and its appropriateness in the LDC context — than by any aspects of the Brussels Programme of Action. Similarly, the design and implementation of the Enhanced Heavily Indebted Poor Countries (HIPC) Initiative and Multilateral Debt Relief Initiative (MDRI) have also deeply influenced development outcomes in many LDCs, though neither programme is LDC-specific.
The non-recognition of the LDC category by these two
institutions and the increasing interest of bilateral donors in the category of “fragile States” affect the way in
which special international support measures for the
LDCs actually work.
The international support measures do not work alone; rather, they work alongside and interact with systemic regimes which guide the international economic
relations.
The global economic regimes which enable or constrain development in LDCs are
much more powerful than the special international support
measures for LDCs.
51How Effective are LDC-specific International Support Measures?
It is argued in the next chapter that the major systemic regimes have not been working effectively for development and poverty reduction in the LDCs. The weak development dimensions of the global economic regimes and the adoption of a one-size-fits-all approach have had particularly adverse consequences for the LDCs, given their very low levels of development and structural weaknesses. In addition, there is a disarticulation between the systemic regimes and the special international support measures for LDCs which can completely undermine both the intent and the outcomes of the latter.
Three examples serve to illustrate this point. The first example is the relationship between the LDC-specific development goals embodied in the BPOA and the MDGs. The BPOA was drafted, negotiated and agreed after the Millennium Declaration but before the inter-agency agreement on the precise statistical targets which would be monitored to measure progress towards achieving the MDGs. The BPOA was inspired by the Millennium Declaration and it represented a pioneering attempt to give a renewed emphasis to the principle of partnership as a cornerstone of international development cooperation which emerged in the late 1990s. One of the main aims of the BPOA, in contrast to earlier programmes of action, was to set quantitatively measurable goals and targets. To this end, the drafting of the BPOA drew upon the agreed outcomes of the major international conferences of the 1990s in much the same way as those that specify the MDGs with measurable indicators. But because the latter process occurred after the former, and because the former involved political negotiations, there is a mismatch and imperfect fit, overall, between the goals and targets of the two. In some ways, the BPOA’s goals are more advanced than the MDGs as they include a mix of human development goals, particularly focusing on health and education to build human capacities, as well as goals related to the development of productive capacities, notably growth targets, investment ratios and infrastructure development targets. But in practice, the general development goals embodied in the MDGs, rather than specific LDC development goals, have been the focus of attention. Certain BPOA goals thus become important by default, to the extent that they conform with the MDGs. Other BPOA goals have been neglected by the international community.
A second example relates to mainstreaming trade in development strategies. As noted below, this is an important goal of the EIF which is one of the major LDC-specific support measures. But, as argued in earlier LDC Reports (UNCTAD, 2004 and 2008), the problem of trade mainstreaming is an issue of ownership, and in particular the limited country ownership of the macroeconomic framework of the poverty reduction strategies. This macroeconomic framework contains forecasts of export and import growth that have no connection with the detailed trade objectives and policy measures contained in the main text of the PRSPs. This disconnect arises because of the weak relationship between the macroeconomic framework and the rest of the document, because the framework is owned only by a narrow circle of officials, or, worse still, because the trade forecasts are not made by the appropriate authorities within the country concerned. Whatever the cause, any special measure to integrate trade into poverty reduction strategies will simply be swimming against the tide so long as the general processes in the design and implementation of PRSPs undermine country ownership, and in particular if the processes which limit the ability of a country to exercise leadership in the design of the macroeconomic framework are not also addressed. In effect, the special measures and the systemic regime are working at cross-purposes.
The weak development dimensions of the global
economic regimes and the adoption of a one-size-fits-all approach have
had particularly adverse consequences for the LDCs, given their very low levels of development and structural
weaknesses.
Any special measure to integrate trade into poverty
reduction strategies will simply be swimming against
the tide so long as the general processes in the design and implementation of PRSPs
undermine country ownership.
Economic development in the LDCs in the 2000s was much more affected by the Poverty Reduction Strategy Papers
process than by any aspect of the Brussels Programme of
Action.

The Least Developed Countries Report 201052
The third example of the way special international support measures are embedded in a wider field of international action which is not LDC-specific is the Everything-But-Arms (EBA) Initiative of the EU. This initiative played a very important symbolic role in catalysing action to give preferential market access to the LDCs. But its initial practical benefits were small. This was partly because, in terms of tariffs and quotas, the EU already had a relatively open trade regime for LDC producers. For example, Stevens and Kennan (2001) estimated that in 1997 only 11 out of 502 items exported to the EU from the LDCs as a group with a value of more than $500,000 were not eligible for duty- and quota-free access. But beyond this, many African LDCs already enjoyed market access preferences under the Cotonou arrangement, which had more flexible rules of origin and were therefore preferred by African LDC exporters to the EU. As a consequence of the interaction of these different regimes, Brenton (2003: 6) found that only “three one hundredths of one per cent of total LDC exports to the EU” entered under the EBA in 2001.
The way in which the international economic architecture affects the LDCs is thus the product of the interaction of systemic regimes, special international support measures for the LDCs and measures designed for other sets of countries which overlap imperfectly with the LDC category. These different regimes are often working at cross-purposes — an observation that has very important implications for policies to improve the way in which the international environment works to support development and poverty reduction in the LDCs. This issue is taken up in the next chapter. The rest of this chapter focuses on assessing how effective the special international support measures for LDCs are in their own right.
C. Effectiveness of special international support measures for LDCs
This section summarizes the conclusions of evaluations of eight special international support measures in favour of the LDCs, and makes a comparative assessment of their results. The measures relate to the volume and effectiveness of aid flows to LDCs, enhancing LDCs’ participation in world trade and in the international trading system, encouraging technology transfer to the LDCs, and promoting climate change adaptation in these countries.
1. AID
(a) Targets for the volume of aid
The Report of the Secretary-General of UNCTAD to UNLDC I proposed establishing the following targets for ODA for LDCs: 0.15 per cent of donors’ gross national product (GNP) by the first half of the 1980s, rising to 0.20 per cent during the second half of the 1980s. These proposals were reflected in the Substantial New Programme of Action for LDCs adopted at the conference, and since then they have been reiterated in each Programme of Action in various forms. The Paris Programme of Action for LDCs for the 1990s modulated the commitments, enabling donor countries to adopt a more flexible approach. Thus:
• Donor countries providing ODA of more than 0.20 per cent of their GNP to LDCs would continue to do so and increase their efforts;
The way in which international economic
regimes affect the LDCs is the product of the interaction of systemic regimes, special
international support measures for the LDCs
and measures designed for other sets of countries which overlap imperfectly with the
LDC category. These different regimes are often working at
cross-purposes.
53How Effective are LDC-specific International Support Measures?
• Other donor countries which had met the 0.15 target would undertake to reach the 0.20 per cent target by 2000;
• Other donor countries which had committed themselves to the 0.15 target would reaffirm their commitment and undertake either to achieve the target within the next five years or to accelerate their efforts to reach the target; and
• Other donor countries would exercise individual best efforts to increase their ODA to LDCs with the effect that, collectively, their assistance to LDCs would significantly increase (UNCTAD, 1992: para 23).
In the Brussels Programme of Action agreed at UNLDC III in 2001, donor countries agreed to implement the above actions to which they had committed “as soon as possible”, as well as “to support LDCs’ efforts to develop information systems which record, at the recipient country level, indicators and other relevant information relating to aid effectiveness” (United Nations, 2002: para. 83).
These aid targets are so flexible that it is difficult to know which donors have committed to what. They therefore risk ending up like the many actions contained in the various programmes of action which appear to be agreed and then ignored. However, the targets are included here within the eight measures because they are also a target of Goal 8 of the MDGs, whereby donor countries should reach aid targets for ODA to LDCs, now measured as either 0.15 or 0.20 per cent of GNI. In addition, OECD-DAC has been monitoring progress towards achieving the targets in its annual Development Cooperation Reports. Thus the aid targets can not simply be seen as an empty commitment.
There has been some progress in the achievement of the targets by DAC donors (charts 14a and 15). The aggregate ratio of ODA to GNI for DAC members increased from 0.05 per cent in 2000 to 0.09 per cent in 2008, but this was still well below the lower 0.15 target. Moreover, the increase in the 2000s actually represented only a return to the same level of aid as in 1990. In 2008, only 9 out of 23 OECD-DAC donors met the 0.15 target — Luxembourg, followed by Norway, Denmark, Sweden, Ireland, Netherlands, Belgium, the United Kingdom and Finland. This was five more than met the lower target in 2000.
Net ODA flows to the LDCs amounted to $37 billion in 2008, as of data published in August 2010. However, if the ODA target of 0.15 per cent of GNI had been achieved, the total amount would have been $60.7 billion, and if the target of 0.20 per cent of GNI had been achieved, it would have been $80.9 billion. Thus the 2008 amount represented a shortfall of between $23.6 billion and $43.8 billion vis-à-vis the aid targets. Aid inflows would have to increase by between 64 per cent and 118 per cent to reach those targets.
It is also possible to estimate the scale of the shortfall over time (chart 14b). Even though the aid flows to LDCs increased during the 2000s, the quantitative shortfall in relation to the aid target was actually larger during this decade than in the 1990s when aid declined. The simple reason is that even though some progress towards the target was made, donor GNI was higher which made the shortfall higher. The cumulative shortfall in aid flows to LDCs from 2000 to 2008 in relation to the 0.15 aid target was equivalent to 51.3 per cent of the GNI of the LDCs as a group in 2008. Moreover, the cumulative shortfall in aid flows to the LDCs over the period 1990–2008 for the same target was equivalent to 100 per cent of the GNI of the LDCs as a group in 2008.
The aggregate ratio of ODA to GNI for DAC members
increased from 0.05 per cent in 2000 to 0.09 per cent in 2008, but this was still well below the lower 0.15 target. The increase in the 2000s
actually represented only a return to the same level
of aid as in 1990.
The actual aid amount in 2008 represented a shortfall of between $23.6 billion and
$43.8 billion vis-à-vis the aid targets.
The cumulative shortfall in aid flows to the LDCs over the period 2000–2008 in relation
to the lower aid target was equivalent to 51 per cent of the GNI of the LDCs
as a group in 2008.

The Least Developed Countries Report 201054
There are no empirical studies of how the donors use the LDC category in their aid allocation decisions. It seems to be significant for some donors who are achieving the target, but they, like other donors, are quite selective about which countries they choose to aid. Thus the achievement of the target is associated with aid flows to a few selected LDCs with which the donors might have special relationships. For example, one fourth of total net ODA disbursement to LDCs in 2006 went to the Democratic Republic of the Congo, Afghanistan and Sudan (UNCTAD, 2008).
The analysis of the CDP (United Nations, 2010c) indicates that, although aid inflows to LDCs more than doubled in the 2000s, the increase in aid flows was proportional to the increase in aid flows to other developing countries. The share of LDCs in total aid has thus hovered at around 30 per
Chart 14DAC countries’ aid to LDCs, 1990–2008
$ bi
llion
Per
cen
t of d
onor
’s G
NI
0.00
0.05
0.10
0.15
0.20
1990 1991 1992 1993 1994 1995 1996 1997 1998 1999 2000 2001 2002 2003 2004 2005 2006 2007 2008
0
5
10
15
20
25
30
35
1990 1991 1992 1993 1994 1995 1996 1997 1998 1999 2000 2001 2002 2003 2004 2005 2006 2007 2008
A. DAC countries' ODA to LDCs, 1990–2008(Per cent of donor's GNI)
B. Annual delivey gap on DAC donors' aid to LDCs($ billion)
Target of 0.15-0.20 per cent of donors’ GNI
Source: UNCTAD secretariat calculations, based on OECD Stat database.Notes: ODA includes net bilateral and imputed multilateral disbursements. Data in constant 2008 dollars. Gap calculations are based on the lower (0.15 per cent of GNI) aid target.
Aid inflows to LDCs more than doubled in the 2000s, but the increase in aid flows was proportional to the increase
in aid flows to other developing countries.

55How Effective are LDC-specific International Support Measures?
Chart 15Net ODA from individual DAC member countries to LDCs, 1990, 2000 and 2008
(Per cent of donor country GNI)
0.00 0.05 0.10 0.15 0.20 0.25 0.30 0.35 0.40 0.45 0.50 0.55
Luxembourg
Norway
Denmark
Sweden
Ireland
Netherlands
Belgium
United Kingdom
Finland
Canada
Switzerland
France
Germany
Portugal
Spain
DAC Countries, Total
New Zealand
Australia
Italy
Austria
United States
Japan
Greece
Korea Aid
target
1990 2000 2008
Source: UNCTAD secretariat based on OECD, International Development Statistics database (online) (accessed July 2010).Notes: Net disbursments including imputed flows through multilateral channels. Donor countries in descending order of the ODA to GNI ratio in 2008.
cent. Econometric analyses of the variables affecting aid allocation indicate that LDCs receive more aid than other developing countries mainly because of their characteristics — such as low level of income, weak human assets and size. There is no evidence that LDC status per se affects aggregate aid allocation (United Nations, 2010c). Moreover, there is no relationship between aid allocation and structural vulnerability as measured by the Economic Vulnerability Index (EVI), which is one of the criteria for identifying the LDCs.
There is no evidence that LDC status per se affects aggregate
aid allocation.
The Least Developed Countries Report 201056
(b) DAC Recommendation of 2001 on untying aid
With regard to the tying of aid, in 2001 OECD-DAC members, after extended and difficult negotiations, adopted a Recommendation to untie much of the ODA to LDCs. Untied aid is defined in this context as loans and grants the proceeds of which are fully and freely available to finance procurement from all OECD countries and substantially all developing countries. Technical cooperation, food aid and donor administrative costs were excluded from the Recommendation, as well as small contracts (of less than SDR 700,000), and threshold levels for the application of the Recommendation were removed in 2006. A reporting system was established to monitor progress towards achievement of the 2001 Recommendation, along with numerical targets of tying status and effort-sharing. The 2005 Paris Declaration on Aid Effectiveness reiterated the Recommendation and envisaged that progress in untying be monitored (OECD 2005, Para 31).
The 2001 DAC Recommendation on Untying Aid is monitored by the OECD Development Cooperation secretariat each year on the basis of agreed indicators. It is difficult to obtain a sense of trends over time because the tying status of a high proportion of aid was not reported at the start of the decade. But the data indicate unequivocally that the DAC members have reached the targets they set themselves. The tying status of members’ bilateral aid in 2008 (excluding administrative costs) reported to the OECD Creditor Reporting System shows 81 per cent as untied and 15 per cent as tied aid, while the remaining 4 per cent was not reported (OECD, 2010: 4). In addition, in line with Accra Agenda for Action commitments, most, but not all, members have action-oriented strategies (including targets and timelines) to significantly increase the share of their untied aid. But at the same time “… only slightly more than $1 billion or 25% of the total value was procured from companies located in developing countries” (OECD, 2010: 5). This implies that although aid is de jure untied, de facto aid flows remain substantially tied.
An in-depth evaluation of implementation of the Recommendation throws more light on this (Clay, Geddes and Natali, 2009). It shows that although donors have made rapid progress in the formal untying of their aid by removing legal and administrative impediments to the procurement of goods and services outside the donors’ own markets, the de facto tying of aid continues to be widespread. Thus “many formally untied projects were found to be de facto tied or have only some untied components” and “even where procurement is being handed over to partners, most donors try to influence project implementation, through long term technical assistance or management consultant from their home country” (p.ix). The evaluation shows that despite formal untying, the aggregated aid flows from a donor have a significant impact on that donor’s exports. As the evaluation points out, the gap between de jure and de facto untying “calls into question to a certain extent the genuineness of untying efforts” (p.ix).
The reasons for the de facto tying include: (i) donor regulations; (ii) lack of local capacity; (iii) local and regional contractors being unable to compete internationally — a factor that is influenced by the design of the contracts, particularly in terms of their size; (iv) unequal access to information; (v) potential risk aversion at donors’ headquarters; and (vi) pressure for speedy implementation. Underlying these factors is a major difference in perception between donor and recipient countries about what untying means. For the donors, it is matter of meeting legal and administrative requirements. For the recipients, untying is understood to be the transferring of responsibility for
Although donors have made rapid progress in
the formal untying of their aid by removing legal and
administrative impediments to the procurement of goods and services outside the donors’ own markets, the de facto
tying of aid continues to be widespread.
The reasons for the de facto tying include: (i) donor regulations; (ii) lack of
local capacity; (iii) local and regional contractors being unable to compete
internationally; (iv) unequal access to information; (v) potential risk aversion at
donors’ headquarters; and (vi) pressure for speedy
implementation.

57How Effective are LDC-specific International Support Measures?
planning and managing funds from donors to recipients and it should offer local businesses an opportunity to compete successfully for contracts.
2. INTERNATIONAL TRADE
Measures to help LDCs develop their international trade cover four major areas: (i) support for LDCs’ accession to the WTO, (ii) preferential market access, (ii) special and differential treatment with regard to obligations within multilateral agreements on trade, and (iv) support for trade-related capacity-building through the Enhanced Integrated Framework for Trade-related Technical Assistance.
(a) WTO accession
Of the 49 LDCs, 32 are members of the WTO.6 As such, their trade policies are bound by the commitments and obligations of their terms of accession. Another 12 LDCs are at present negotiating their accession to the WTO. Recognizing the challenges faced by these countries, because of their weak human and institutional capacities, limited technical knowledge and scarce financial resources, the WTO General Council adopted a Decision on the Accession of LDCs in December of 2002 (WTO, 2003). In so doing, it sought to mainstream the BPOA into WTO work. The Decision’s aim was to facilitate and accelerate LDCs’ negotiations for accession through simplified and streamlined accession procedures with a view to concluding these negotiations as quickly as possible.
Specifically, the member States of the WTO were called upon to: exercise restraint in seeking concessions and commitments on trade in goods and services from acceding LDCs; provide them with full benefits of special and differential treatment (SDT); grant transitional periods foreseen under specific WTO agreements to enable the acceding LDCs to effectively implement their commitments and obligations; and not use commitments to accede to any of the plurilateral trade agreements or participate in any other optional sectoral market access initiatives as a precondition for accession to the WTO.
However, an analysis of the accession process and the commitments of LDCs suggests that, in general, these objectives have not been met. The accession process for LDCs has proved to be as cumbersome and protracted as it has been for other countries. Several of them have been negotiating for more than a decade so far, and still have not completed the process (table 12). For example, the Sudan started the process in 1994, Vanuatu in 1995, the Lao People’s Democratic Republic in 1997, Samoa in 1998, Bhutan in 1999 and Yemen in 2000. Only two countries — Cambodia and Nepal — have acceded to the WTO since 2000.
An assessment of the terms of accession of these two countries shows that both were given flexibilities, particularly in technically complex areas such as TRIPS, customs valuation, TBT [technical barriers to trade] and SPS [application of sanitary and phytosanitary measures]. However, substantial questions remain about whether WTO members did in fact exercise restraint in seeking concessions and commitments on trade in goods and services from Cambodia and Nepal. The commitments undertaken by them go well above and beyond the levels of concessions and commitments undertaken by the existing 30 WTO LDC members (UNCTAD, 2004). In effect, “while weaker States de jure have the right to benefit from special and differential treatment”,
For the recipients, untying is understood to be the
transferring of responsibility for planning and managing
funds from donors to recipients and it should offer local businesses an opportunity to compete
successfully for contracts.
The accession process for LDCs has proved to be as
cumbersome and protracted as it has been for other
countries. Several of them have been negotiating for more than a decade so far,
and still have not completed the process.
While weaker States de jure have the right to benefit from special and differential treatment, they are de facto stripped of this right in the
accession process.

The Least Developed Countries Report 201058
they are “de facto stripped of this right in the accession process” (Ibid, p. 62).
(b) Preferential market access
Preferential market access entitles exporters to pay lower tariffs or even to enter the market quota-free and/or duty-free. These are granted under the following general preferential schemes: (i) the Generalized System of Preferences (GSP), which is non-reciprocal; and (ii) the Global System of Trade Preferences Among Developing Countries (GSTP) — a reciprocal scheme available to signatories.
LDCs receive greater preferences in view of their special circumstances. Such special treatment takes the form of: (i) extending the range of products of particular interest to LDCs within the framework of preferences granted to all developing countries, and (ii) granting LDCs special concessions not available to other preference-receiving developing countries (e.g. greater tariff reductions or more liberal treatment with respect to rules of origin). This was first proposed by UNCTAD expert groups in 1969 and 1972, and later within the Substantial New Programme of Action for LDCs in 1981 (see UNCTAD, 1969, paras 24–32; 1972, paras 40–46; and 1983, paras 430–464). In 1994, the UNCTAD Special Committee on Preferences, at its twenty-first session, concluded that a priority task of the international community should be to assist LDCs in maximizing their utilization of the GSP scheme; improving the scheme by extending its product coverage, duty- and quota-free treatment; and offering more flexible rules of origin in favour of LDCs. It further called for these improvements to be complemented by greater liberalization of non-tariff barriers affecting products of particular export interest to LDCs, and by international support measures to increase the capacity of LDCs to design, produce and market products.
Table 12Status of LDCs' ongoing WTO accession negotiations
Country ApplicationWorking
PartyEstablished
Memo-randum
First/Latest* Working
Party Meeting
Number of Working
Party Meetings
Goods offer Services offer Draft Working
Party ReportbInitial Latest* Initial Latesta
Afghanistan Nov. 2004 Dec. 2004 Mar. 2009
Bhutan Sep. 1999 Oct. 1999 Feb. 2003
Nov. 2004/Jan. 2008
4 Aug. 2005
Nov. 2007
Aug. 2005
Nov. 2007
Dec. 2007
Comoros Feb. 2007 Oct. 2007Equatorial Guinea Feb. 2007 Feb. 2008Ethiopia Jan. 2003 Feb. 2003 Jan.
2007May 2008 1
Lao People's Dem.Rep. Jul. 1997 Feb. 1998 Mar. 2001
Oct. 2004/Jul. 2009
5 Nov. 2006
Jun. 2009
Oct. 2007
Jun. 2009
Jun.2009 (FS)
Liberia Jun. 2007 Dec. 2007Samoa Apr. 1998 Jul. 1998 Feb.
2000Mar. 2002 1 Aug.
2001Aug. 2001
Feb. 2006
May 2009
Sao Tome and Principe Jan. 2005 May 2005Sudan Oct. 1994 Oct. 1994 Jan.
1999Jul. 2003/Mar. 2004
2 Jul. 2004
Oct. 2006
Jun. 2004
Oct. 2006
Sep. 2004 (FS)
Vanuatu Jul. 1995 Jul. 1995 Nov. 1995
Jul. 1996/Oct. 1999
2 Accession Package: Oct. 2001
Yemen Apr. 2000 Jul. 2000 Nov. 2002
Nov. 2004/Jul. 2009
6 Sep. 2005 Aug. 2008
Aug. 2005
Aug. 2008
Dec. 2009
Source: UNCTAD secretariat compilation, based on the WTO website (www.wto.org).Note: a As of December 2009; b Most recent Factual Summary (FS), draft Working Party Report or Elements of a Working Party Report.
LDCs receive greater preferences in view of their
special circumstances. Preferential market access
entitles exporters to pay lower tariffs or even to enter the
market quota-free and/or duty-free.

59How Effective are LDC-specific International Support Measures?
These proposals received further impetus from the WTO Ministerial Conference in Singapore in 1996, which adopted a Plan of Action for LDCs, including providing predictable and favourable preferential market access conditions, and by the adoption of the Everything-but-Arms Initiative by the EU in 2001, which provided a model for emulation by other countries. The BPOA also included commitments of developed countries that “development partners will aim, including through actions in relevant multilateral fora, at…improving preferential market access for LDCs by working towards the objective of duty-free and quota-free access for all LDC products.” (United Nations, 2002, para 68h). Furthermore, it called for consideration to be given to a proposal for developing countries to contribute to improved market access for LDCs’ exports. In addition, target 8b of the MDGs required developed countries to increase the proportion of their duty-free and quota-free (DFQF) imports (by value) from LDCs. Finally, a decision on DFQF market access was reached at the Sixth Ministerial Conference in Hong Kong, China, which states that “developed-country Members shall, and developing-country Members declaring themselves in a position to do so should: (i) Provide DFQF market access on a lasting basis, for all products originating from all LDCs by 2008 or no later than the start of the implementation period in a manner that ensures stability, security and predictability.” It further states that “(ii) Members facing difficulties at this time to provide market access as set out above shall provide duty-free and quota-free access for at least 97 per cent of products originating from LDCs, defined at the tariff line level, by 2008 or no later than the start of the implementation period.” (WTO, 2005).
A non-inclusive list of initiatives taken by developed and developing countries indicates that over the period 2000 to 2010, 23 countries took 36 initiatives to improve market access for LDCs (WTO, 2010a; see also table 13). This may seem to be an impressive record of implementation. Trade preferences are an area where there is perhaps the greatest international momentum to provide special treatment for LDCs. But the critical question is whether this has made a difference to LDCs’ trade development.
A large proportion of LDCs’ exports to developed countries have benefited from duty-free access, increasing from 68 per cent of total developed-country imports in 1996 to 92 per cent in 2008 (table 14). However, if arms and oil are excluded, this share has remained more or less stable at around 80 per cent since 1998. What is of particular concern is that these trends suggest that preferences accorded to LDCs have been eroded. Since the more advanced developing countries are benefiting from increased duty-free access to developed-country markets, LDCs’ preferential market access is becoming less of an advantage. Excluding arms and oil, the preferential market access of other developing countries increased from 54 per cent of the total in 1996 to 80 per cent in 2008. This is largely due to the proliferation of trade agreements between developed and developing countries, which give the latter preferential access to the markets of the former.
In addition, as many countries have reduced their tariff rates on certain products to zero per cent, exports from LDCs that are entitled to duty-free access have to compete on an equal footing with exports from other countries. The analysis by UNCTAD (2007) suggests that certain LDCs and certain sectors have suffered considerably from the erosion of preferences.
Data reveal that developed countries’ (average) import tariffs have been on the decline for agricultural products, textiles and clothing from both other developing countries and LDCs (table 15), although they still remain relatively
Trade preferences are an area where there is perhaps the greatest international
momentum to provide special treatment for LDCs. But the critical question is whether
this has made a difference to LDCs’ trade development.
Excluding arms and oil, the proportion of LDCs’ exports
to developed countries with duty-free access has remained constant at 80
per cent from 1998, while that of other developing
countries has increased from 54 per cent to 80 per cent. Thus, certain LDCs and
certain sectors have suffered considerably from the erosion
of preferences.

The Least Developed Countries Report 201060
Table 13Preferential market access measures in favour of LDCs
Preference-granting countries
DescriptionEntry into
forceBenefiaries Coverage / margin of preference References
Australia Duty-free and quota-free (DFQF) entry 1 Jul 2003 LDCs All products WT/COMTD/N/18
Belarus Harmonized System of preference by the Eurasian Economic Community (EAEC)
May 2001 47 LDCs Duty-free access for all products WT/TPR/S/170
Canada GSP - Least-developed Countries' Tariff prorgramme (LDCT)
1 Jan 2003, extended until 30 Jun 2014
LDCs Duty-free access under all tariff items for imports from LDCs, with exception of over-quota tariff items for dairy, poultry and egg products
WT/COMTD/N/15/Add.1 and Add.2 WT/COMTD/W/159
China Asia-Pacific Trade Agreement (APTA) - amandment to the Bangkok Agreement
1 Sept 2006
Bangladesh Lao PDR
Tariff concessions granted exclusively to LDC members on 161 products with average margin of preference of 77.9%
WT/COMTD/N/22
Bangladesh On top of APTA, unilateral special preferential tariffs (zero rated) offered on additioanl 87 tariff lines
Information Gov. China
Framework Agreement on Comprehensive Economic Co-operation between ASEAN and China
1 Jan 2006 Cambodia Duty-free treatment on 418 tariff lines Information Gov. China
Cambodia On top of this Framework Agreement, unilateral special preferential tariffs (zero rated) offered on additioanl 420 tariff lines
Information Gov. China
Lao PDR Duty-free treatment on 330 tariff-lines Information Gov. China
Lao PDR On top of this Framework Agreement, unilateral special preferential tariffs (zero rated) offered on additioanl 399 tariff lines
Information Gov. China
Myanmar Duty-free treatment on 220 tariff lines Information Gov. China
Myanmar On top of this Framework Agreement, unilateral special preferential tariffs (zero rated) offered on additioanl 226 tariff lines
Information Gov. China
Forum on China-Africa Cooperation LDCs in Africa having diplomatic relations with China
By 1 Jan 2008, 30 LDCs in Africa came under the cover of DFQF market access. Zero tariff treatment will be phased-in for 95% of products, starting with 60% of products in 2010.
WT/COMTD/W/164 WT/COMTD/M/77
Special preference tariff Afghanistan, Maldives, Samoa, Vanuatu, Yemen
Unilateral special preferential tariffs (zero rated) offfered on 286 categories of products
Information Gov. China
European Union
GSP - Everything But Arms (EBA) initiative
5 Mar 2001 LDCs EBA granting DFQF access for all products from all LDCs (except arms and ammunitions). Transitioanl provisions for imports of rice and sugar fully liberalized by Oct 2009.
WT/COMTD/N/4/Add.2 and Add.4 WT/TPR/S/177/Rev.1
Contonou Agreement expired on 31 Dec 2007; EPAs being negotiated with the African, Caribbean and Pacific (ACP) countries will replace the unilateral preferences granted under the Contonou Agreement
79 ACP countries, 40 of which LDCs
Dutry-free treatment on industrial, certain agricultural and fishery products, subject to a safeguard clause. Certain products (bananas, beef and veal, sugar) governed by commodity protocols.
WT/TPR/S/177/Rev.1 WT/TPR/S/214/Rev.1
Iceland GSP - Tariff Preferences in Regard to the Importation of Products Originating in the World's Poorest Developing Countries
29 Jan 2002
LDCs All products except some agricultural products (HS chapters: 04, 15, 18, 19, 21, 22) and non-agricultural products (HS sub-headings: 3502, 3823 and all of HS 16 except sub-headings 1603 to 1605)
WT/COMTD/N/17 and Corr.1 WT/TPR/S/164
India Asia-Pacific Trade Agreement (APTA) - amandment to the Bangkok Agreement
1 Sept 2006
Bangladesh Lao PDR
Tariff concessions granted exclusively to LDC members on 48 products with average margin of preference of 39.7%
WT/COMTD/N/22
Duty-Free Tariff Preference Scheme (DFTP)
LDCs Duty-free access on 85% tariff lines at HS 6-digit level within a five-year time frame
WT/COMTD/M/69
South Asian Free Trade Area (SAFTA) 1 Jan 2006 Bangladesh, Bhutan, Maldives, Nepal
Special concessions exclusively granted to LDC members. In 2006/2007, preferential rates granted on 84.4% of all tariff lines at average rate of 10.6% (while 15% for non-LDC members)
WT/COMTD/10 WT/TPR/S/182/Rev.1 WT/COMTD/N/26
Bilateral agreement 13 May 2003
Afghanistan Tariff reductions on 38 HS 6-digit lines (margins of preferences of 50% or 100% of MFN tariff)
WT/TPR/S/182/Rev.1
Bilateral agreement (extended on 29 Jul 2006 for 10 years)
Bhutan All products WT/TPR/S/182/Rev.1 WT/COMTD/N/28
Bilateral agreement Nepal Tariff exemptions for all goods subject to rules of origin. Imports of certain goods subject to annual quota
WT/TPR/S/182/Rev.1
Japan GSP - Enhanced DFQF market access 1 Apr 2007 LDCs Duty-free on 8859 tariff lines (or 98% of tariff line level)
WT/COMTD/N/2/Add.14

61How Effective are LDC-specific International Support Measures?
Preference granting countries
DescriptionEntry into
forceBenefiaries Coverage / margin of preference References
Kazakhstan Harmonized System of preference by EAEC
May 2001 47 LDCs Duty-free for all products WT/TPS/S/170
Korea, Rep. of
Presidential Decree on Preferential Tariff for LDCs
1 Jan 2000 LDCs Duty-free access granted on 87 tariff items (HS 6-digit)
WT/COMTD/N/12/Rev.1 WT/TPR/S/137
Asia-Pacific Trade Agreement (APTA) - amandment to the Bangkok Agreement
1 Sept 2006
Bangladesh Lao PDR
Tariff concessions granted exclusively to LDC members on 306 products with average margin of preference of 64.6%
WT/COMTD/N/22
Kyrgyz Republic
Harmonized System of preference by EAEC
May 2001 47 LDCs Duty-free for all products WT/TPR/S/170
Moldova GSP LDCs Duty-free for all products WT/ACC/MOL/37
Morocco Preferential tariff treatment for LDCs 1 Jan 2001 LDCs HS 4 to 10-digit level WT/LDC/SWG/IF/18 G/C/6
New Zealand GSP - Tariff Treatment for LDCs 1 Jul 2001 LDCs All products WT/COMTD/27 WT/TPR/S/115
Norway GSP - DFQF market access 1 Jul 2002 LDCs All products WT/TPR/S/138 WT/COMTR/N/6/Add.4
Pakistan South Asian Free Trade Area (SAFTA) 1 Jan 2006 Bangladesh, Bhutan, Maldives, Nepal
Special concessions for least-developed contracting states; tariffs to be reduced to a 5% ceiling on imports from LDC members by 2009
www.saarc-sec.org WT/TPR/S/193
Russia Harmonized System of preference by EAEC
May 2001 47 LDCs Duty-free for all products WT/TPR/S/170
Sri Lanka South Asian Free Trade Area (SAFTA) 1 Jan 2006 Bangladesh, Bhutan, Maldives, Nepal
Special concessions for least-developed contracting states
www.saarc-sec.org
Asia-Pacific Trade Agreement (APTA) - amandment to the Bangkok Agreement
1 Sept 2006
Bangladesh Lao PDR
Tariff concessions granted exclusively to LDC members on 72 products with average margin of preference of 12%
WT/COMTD/N/22
Switzerland GSP - Revised Preferential Tariffs Ordinance
1 Apr 2007 LDCs Duty-free access for all prodcuts originating from all LDCs as of Sept 2009. Phase-in periods for some products completed by Sept 2009
TN/CTD/M/28 WT/COMTD/N/7/Add.2 and Add.3
Tajikistan Harmonized System of preference by EAEC
May 2001 47 LDCs Duty-free for all products WT/TPR/S/170
Turkey GSP 31 Dec 2005
LDCs Duties eliminated for LDCs on the basis of EU's EBA initiative
WT/TPR/S/192
United States GSP for least-developed beneficiary developing countries (LDBDC)
1 Jan 1976, extended until 31 Dec 2010
44 LDCs 1420 articles exclusively available for LDC beneficiaries for duty-free treatment
WT/COMTD/N/1/Add.4 and Add.5 TW/TPR/S/160 WT/TPS/S/200/Rev.1. www.ustr.gov
African Growth and Opportunity Act (AGOA)
May 2000, extented until 30 Sept 2015
38 Sub-Saharan countries (incl. 24 LDCs)
1800 products, including textiles and apparel, available for duty-free treamtent
WT/COMTD/N/1/Add.3 WT/TPR/S/160 WT/TPR/S/200/Rev.1 WT/L/754
Caribbean Basin Trade Partnership Act (CBTPA)
1 Oct 2000, extended until 31 Dec 2014
19 Central American/Carib-bean countries (incl. 1 LDC)
Duty-free for most products, including textiles sand apparels. The Haitian Hemispheric Opportunity through Partnership Encouragement Act enhances Haiti's benefits under CBERA.
WT/TPR/S/160 WT/TPR/S/200/Rev.1 WT/L/753
Uzbekistan Harmonized System of preference by EAEC
May 2001 47 LDCs Duty-free for all products WT/TPS/S/170
Source: UNCTAD secretariat compilation, based on WTO (2010a).
Table 13 (contd.)
Table 14Proportion of total developed country imports from developing countries and LDCs
admitted free of duty (excluding arms and oil)(Percentage of total developed country imports)
1996 1998 2000 2004 2006 2008
(a) Excluding armsDeveloping 53 54 63 76 81 84LDCs 68 81 75 82 89 92
(b) Excluding arms and oilDeveloping 54 54 65 76 77 80LDCs 78 78 70 80 79 81
Source: The Millennium Development Goals Report 2010: Statistical Annex, www.mdg-trade.org (accessed September, 2010).

The Least Developed Countries Report 201062
high for clothing. In addition, there are regional and sectoral variations in terms of market access conditions, between other developing countries and LDCs as well as among LDCs. Generally, other developing-countries continue to face somewhat higher average tariffs than LDCs for their exports, including exports of agriculture, textiles and clothing. However, that difference is now less than two percentage points for textiles and clothing, which means that preferential market access has ceased to offer any meaningful advantage to LDCs. Within the LDCs as a group, small island and African LDCs have gained, or at least maintained, some preferences in major markets for their exports, while Asian LDCs, which tend to be more competitive, continue to face higher tariffs and are granted lower duty-free access, especially on their clothing and textile exports.
Moreover, there are important variations among developed countries. For example, LDCs’ agricultural products still face most-favoured-nation (MFN) tariffs of more than 8 per cent in the United States and preferential tariffs which are 6 per cent higher than the average of developing countries. Preferential rates for LDCs’ garments entering the United States market average more than 11 per cent and the rates for textiles are about 6 per cent. Hence, some developed countries impose their highest tariffs on imports of garments and agriculture from developing countries, and especially from LDCs.
Market access under existing preferential schemes does not offer LDCs much possibility to change the composition of their exports, because tariffs on goods that are of export interest to LDCs (e.g. textiles, clothing, leather, footwear and rubber) are generally higher than tariffs on other goods, and, furthermore, these escalate as the level of processing increases (UNCTAD, 2003; Elliot, 2009). Most tariff peaks are in agriculture, including processed products, which has a very discouraging effect on upgrading by LDCs. Thus, since the special trade support measures are skewed towards existing, not new, activities, they offer limited possibilities for LDCs to diversify their production structure and move up the technological ladder (Farfan, 2005).
Many empirical studies of how preferences work in practice7 show that while market access preferences for LDCs play an important symbolic role in expressing solidarity with LDCs, their practical value for trade expansion has generally been very limited, owing to lack of full product coverage. As noted by Elliot (2010:8), “…because both rich-country tariff peaks and LDC exports tend to be relatively concentrated in similar sectors, even a small number of product exclusions can rob the initiative of any meaning.” LDCs thus get “essentially no gain from 97 per cent [product] coverage” in DFQF access to OECD markets.
Table 15Average tariffs imposed by developed countries on agricultural products and textiles and clothing from
developing countries and the LDCs(percentage)
1996 2000 2004 2008
(a) Agricultural goodsDeveloping 10.5 9.3 9.1 8.0 LDCs 3.9 3.6 3.0 1.6
(b) TextilesDeveloping 7.3 6.6 5.2 5.1LDCs 4.6 4.1 3.2 3.2
(c) ClothingDeveloping 11.5 10.8 8.6 8.2LDCs 8.2 7.8 6.4 6.4
Source: The Millennium Development Goals Report 2010: Statistical Annex, www.mdg-trade.org (accessed September, 2010).
Market access under existing preferential schemes does not offer LDCs much possibility to change the composition
of their exports.
While market access preferences for LDCs play an important symbolic role in expressing solidarity with LDCs, their practical value
for trade expansion has generally been very limited, owing to lack of full product
coverage ...
63How Effective are LDC-specific International Support Measures?
Even if there were to be better coverage of products, it has been found that the utilization rate of preferences, the proportion of imports eligible for special treatment which actually receive it, is often low. This is attributed, in particular, to restrictive rules of origin which require that eligible imports be substantially transformed in the beneficiary country. There has been some progress with regard to those rules during this past decade, most notably through the African Growth and Opportunity Act (AGOA) of the United States and Canada’s preferential access programme, but much more could be done. Furthermore, it has been found that the proliferation of various non-tariff barriers, such as SPS provisions, mean that products which could potentially benefit from DFQF access are unable to do so in practice. Investors are less willing to take advantage of preferential market access if programmes have to be renewed frequently, and if eligibility conditions (such as respect for human rights) are numerous, non-transparent or applied arbitrarily. Also the preference margins given to LDCs in comparison with other countries are very low and have eroded over time. In this regard, Carrere and de Melo (2009) find that the preference margins enjoyed by LDCs in the EU and United States markets are very small when compared with the effective tariff paid by competing sellers. In the EU, the current adjusted preference margin is only around 3 per cent, and in the United States it is negative. The latter finding means that the LDCs are actually discriminated against in the United States for the main products they sell there because the United States has free trade agreements (FTAs) with other trade partners (United Nations, 2010c).
Finally, due to limited supply capacities, exporters in LDCs are unable to take full advantage of preferential market access. Such access is only a hypothetical opportunity unless the commercial conditions for market entry can be achieved. As UNCTAD (2004: 250) has stated: “Improved market access for LDCs is commercially meaningless if the LDCs cannot produce in the sectors in which they have preferential treatment and if they lack the marketing skills, information and connections to convert market access to market entry. Moreover, unless the new production stimulated by the preferences strengthens the development of national technological and entrepreneurial capabilities through learning by doing, the sustainability of the development process may be questionable.”
(c) Special and differential treatment
There are currently 148 special and differential treatment (SDT) provisions in the various WTO agreements, 14 of which are explicitly targeted at LDC members of the WTO (WTO, 2010b).8 These provisions provide LDCs with more flexibility than is given to other WTO members (see box 5).
One feature of these provisions is that they give LDCs more time to implement WTO agreements, enabling them to prepare institutionally (i.e. with laws, regulations and procedures) for multilateral disciplines. However, it does not help in terms of developing their productive capacities. For this, the transition period is simply arbitrary. Specifically, a 7- or 10-year transition period in most cases is not sufficient to develop viable domestic production in a particular sector. In addition, conditions in each country vary, so that they would need different transition periods for the development of their productive capacities.
An assessment of SDT provisions in UNCTAD (2004) concluded that it was doubtful that current provisions were sufficient to enable the LDCs to actively promote their economic development and reduce their international economic marginalization. It showed that:
There are currently 148 special and differential
treatment (SDT) provisions in the various WTO agreements,
14 of which are explicitly targeted at LDC members
of the WTO.
... the utilization of preferences is also often
low due to restrictive rules of origin which require that eligible imports be
substantially transformed in the beneficiary country.
One study has found that the preference margin enjoyed
by LDCs in the EU is around 3 per cent, and in the United
States is negative.

The Least Developed Countries Report 201064
Box 5. Special and Differential Treatment provisions in WTO agreementsa
LDC members of the WTO, as well as developing-country members can benefit from a number of special and differential treatment provisions contained in WTO agreements. The total number of such provisions amounts to 148, 14 of which are applicable only to the LDCs, and they fall into six categories:b
(i) Provisions aimed at increasing the trade opportunities of developing-country members (i.e. market access);
(ii) Provisions requiring WTO members to safeguard the interests of developing-country members;
(iii) Flexibility, commitments to action and use of policy instruments;
(iv) Transitional time periods;
(v) Technical assistance; and
(vi) Provisions relating to LDC members.
The provisions can also be classified according to the WTO agreements in which they are contained. The following are the special considerations granted specifically to the LDCs:
Agreements relating to trade in goods (5 provisions)
The Agreement on Agriculture exempts LDCs from undertaking reduction commitments in the areas of market access, export competition and domestic support, whereas developing-country WTO members must implement the reduction commitments within a period of up to 10 years (Article 15.2).
Article 16.1 of this Agreement stipulates that developed-country members shall take action as provided for within the framework of the Decision on Measures Concerning the Possible Negative Effects of the Reform Programme on Least-Developed and Net Food-Importing Developing Countries (paragraphs 3 (i), (ii) and (iii), 4, 5). That is, they will:
(i) Review periodically the level of food aid and initiate negotiations for food aid commitments sufficient to meet the legitimate needs of developing countries during the reform programme.
(ii) Adopt guidelines to ensure that an increasing proportion of basic foodstuffs is provided to least-developed and net-food-importing developing countries in fully grant form and/or on appropriate concessional terms.
(iii) Ensure that any agreement relating to agricultural export credits makes appropriate provisions for differential treatment in favour of least-developed and net- food-importing developing countries.
(iv) Enable developing countries to draw on resources of international financial institutions in order to address short-term difficulties in financing normal levels of commercial imports.
(v) Consider the requests for the provision of technical and financial assistance to least-developed and net-food-importing developing countries to improve their agricultural productivity and infrastructure.
Article 16.2 requests the Committee on Agriculture to monitor the follow-up to this Decision.
The Agreement on Technical Barriers to Trade recognizes that developing countries, and LDCs in particular, may face institutional and infrastructural difficulties in the preparation and application of technical regulations and standards. Therefore, it calls on WTO members to give priority to the needs of the LDCs in providing advice and technical assistance (Article 11.8)
The Agreement on Trade-Related Investment Measures (TRIMs) allows LDCs more flexible implementation of the elimination of certain investment measures that have a distorting effect on trade in goods. At the Sixth Ministerial Conference of the WTO in Hong Kong, China, in 2005, members agreed to grant LDCs an additional seven years to maintain existing measures that deviate from their obligations under TRIMs, with the possibility of additional extensions. All measures, however, should be phased out by 2020 (Article 5.2)
Agreement on trade in services (2 provisions)
The Agreement on Trade in Services (GATS) requests that ‘’ […] Negotiating guidelines shall establish modalities for the treatment of liberalization undertaken autonomously by Members since previous negotiations, as well as for the special treatment for least-developed country Members […]’’ (Article XIX: 3). Moreover, it calls for increased participation of developing countries in world trade and that ‘’Particular account shall be taken of the serious difficulty of the least-developed countries in accepting negotiated specific commitments in view of their special economic situation and their development, trade and financial needs’’ (Article IV:3).
Agreements relating to trade-related intellectual property rights (3 provisions)
Under the Preamble of the Agreement on Trade-Related Aspects of Intellectual Property Rights (TRIPS) the special needs of the LDCs are recognized, and flexibility is granted for the implementation of laws and regulations in order to enable them to create a sound and viable technological base. Article 66.1 specifies that LDCs are not required to apply the provisions of this Agreement, other than Articles 3, 4 and 5, for a period of 10 years. In 2005, the transition period was extended to July 2013, while for certain obligations relating to pharmaceutical products the period was extended to January 2016. Given their lack

65How Effective are LDC-specific International Support Measures?
of domestic pharmaceutical manufacturing capacity, LDCs are not required to submit a notification about importing cheaper generic versions of patented medicines. Moreover, developed-country members of the WTO are required to provide incentives to enterprises and institutions in their territories to encourage technology transfers to LDCs (Article 66.2).
Understanding on rules and procedures governing the settlement of disputes (2 provisions)
Pursuant to the Understanding on Rules and Procedures Governing the Settlement of Disputes, WTO members “shall exercise due restraint in raising matters under these procedures involving a least-developed country Member” and “exercise due restraint in asking for compensation or seeking authorization to suspend the application of concessions or other obligations pursuant to these procedures” (Article 24.1). Moreover, it offers the LDCs conciliation and mediation mechanisms and, upon request, the good offices of the Director-General or the Chairperson of the Dispute Settlement Board to find acceptable solutions prior to a request for a panel (Article 24.2).
Agreement on government procurement (2 provisions)
The Agreement on Government Procurement grants suppliers in LDCs special treatment with respect to products or services originating in their countries (Article V.12). Developed-country parties are also required to provide assistance to potential tenderers in LDCs in submitting their tenders and assisting them to comply with technical regulations and standards relating to the products or services of the intended procurement (Article V.13).
a Based on the WTO, 2010b, and United Nations, 2008.b Classified according to the typology outlined in WT/COMTD/W/77/Rev.1.
Box 5 (contd.)
The majority of the provisions that are granted exclusively to the group of least developed countries are provisions that encourage advanced WTO members to consider the interest of the least developed WTO members, rather than provisions that provide the least developed WTO members with exemptions from WTO rules and regulations in line with their level of development. Many of the provision are best endeavor clauses rather than obligations. They are also by their nature transitory. Rather than being concerned with the development of productive capacities they are (a) intended to facilitate the implementation of the WTO Agreements by the LDCs and other developing countries and (b) to encourage these countries to design and implement trade policies in conformity with WTO Agreements (UNCTAD 2004: 245).
There is need for research on how effective SDT provisions are, and to what extent they are implemented in practice. However, anecdotal evidence suggests that some aspects of SDT, such as the ability to provide export subsidies or the granting of temporary exemptions with regard to IPRs, could be meaningful for the development of productive capacities, but such measures are not used by LDCs. There are a number of reasons for this, including their lack of financial resources, or because they are advised not to use them, or their unease or even fear that implementing them would go against the prevailing development orthodoxy. The end result is that de jure SDT provisions are de facto meaningless for development.
(d) Building trade capacity
With regard to trade capacity building there is a special initiative to support LDCs — the Integrated Framework for Trade-Related Technical Assistance to Least Developed Countries (IF). This was first introduced in 1997 as a response to the Uruguay Round Decision on Measures in Favour of Least Developed Countries, which called for “substantial increased technical assistance in the development, strengthening and diversification of their production and export bases, including those of services, as well as trade promotion to enable them to maximize the benefits from liberalized access to markets (GATT, 1994: 441). In October 1997, six multilateral agencies — the United Nations Development
Rather than being concerned with the development of
productive capacities, SDT provisions are: (a) intended to facilitate the implementation
of the WTO Agreements by the LDCs and other
developing countries; and (b) to encourage these countries
to design and implement trade policies in conformity with
WTO Agreements.
The end result is that de jure SDT provisions are de facto
meaningless for development.

The Least Developed Countries Report 201066
Programme (UNDP), UNCTAD, World Bank, IMF, WTO and the International Trade Centre of UNCTAD/WTO (ITC) — were mandated to cooperate and combine their efforts to assist LDCs develop their trade capacities. But this did not work as initially intended, and an evaluation completed in June 2000 identified several weaknesses of the approach at that time, notably: poor links of the process of trade capacity building with overall development strategies, weak country ownership, and inadequate coordination and funding. In 2001, a number of changes were made to improve the IF’s effectiveness, including a focus on increasing the capacity to mainstream trade into poverty reduction strategies, the introduction of the Diagnostic Trade Integration Study (DTIS) and an Action Matrix as key tools for identifying priority trade development projects. In addition, a trust fund was created with two windows: Window 1 would fund the DTIS and ancillary activities and Window 2 would serve as an interim bridging mechanism for funding priority capacity-building activities identified in the Action Matrix.
A long series of steps with high transaction costs for the LDC Governments were involved before any concrete projects stemming from the IF could be implemented. Moreover, despite the revamping of the IF, LDCs continued to express concerns about what it delivered, alleging that it placed more emphasis on diagnostic activities than on concrete outcomes. For their part, the donors have always insisted that the aim of the IF process was not to deliver aid for trade but to increase the capacity of LDC Governments to obtain and effectively use aid for trade. An evaluation of the World Bank (2004) concluded that the programme had been raising awareness about the role of trade in development at the national level, for donors and also international agencies, including the World Bank. But it also identified a number of problematic issues, notably: (i) IF processes did not lead to a prioritization of Technical Assistance (TA) needs; (ii) IF was not sufficiently demand-driven or related to LDC development strategies; and (iii) governance was weak and division of responsibilities between agencies unclear. It also noted that LDCs and donors had different perceptions of IF objectives. Donors believed the objective of the IF was to improve the efficiency of the TA that had already been provided, but the LDCs envisioned it as an additional source of funding for TA and other activities (World Bank, 2004). Another evaluation concluded that IF’s operational approach was “a sound approach capable of achieving positive results” (CAPRA-TFOC Consortium, 2003), but it also noted the divergent expectations of the IF. LDCs continued to stress the lack of adequate resources to implement the findings of the DTIS and the low level of disbursements, particularly in relation to transaction costs of engagement in the process, as well as slow implementation.
In the 2005 Hong Kong Ministerial Declaration, high priority was given to the effective implementation of the Integrated Framework (paragraph 48). A task force was set up in 2006 to make proposals for an enhanced IF that could tackle the programme’s weaknesses and be guided by the aid effectiveness principles set out in the Paris Declaration. Accordingly, the resulting Enhanced Integrated Framework for Trade-Related Technical Assistance (EIF) focused more strongly on outcomes, and recognized the need for predictable and sustainable funding — in line with the DTIS findings — and greater donor coordination. The governance structure of the EIF was revised, with a strengthened and accountable EIF secretariat that reported to an EIF Board, and there was an independent Trust Fund Manager (United Nations Office for Project Services). To increase ownership, the programme stressed the need for buy-in across government departments, especially at senior level, and envisaged stronger support for the national focal points.
A long series of steps with high transaction costs for
the LDC Governments were involved before any concrete
projects stemming from the IF could be implemented.
In the 2005 Hong Kong Ministerial Declaration, high
priority was given to the effective implementation of the Integrated Framework...
With regard to trade capacity building there is a special
initiative to support LDCs — the Integrated Framework
for Trade-Related Technical Assistance to Least Developed
Countries (IF).
... the resulting Enhanced Integrated Framework for Trade-Related Technical Assistance (EIF) focused
more strongly on outcomes, and recognized the need for predictable and sustainable funding and greater donor
coordination.

67How Effective are LDC-specific International Support Measures?
Since the new EIF became operational only on 1 July 2009, it is still too early to evaluate the EIF processes and outcomes. The EIF Trust Fund received more funding pledges (increasing from $37 million in 2006 to more than $100 million in 2010 as at June 2010), but as at 31 March 2010, only 27 per cent of EIF funds had been allocated. Half of these were for DTIS, DTIS updates and related activities, and the other half for the executive secretariat, agency funding, the Trust Fund manager and fees. Since October 2008, 20 LDCs have been able to receive funding for so-called Tier-1 projects (DTIS and related activities) which is indicative of a faster project approval process. However, up to June 2010, no Tier-2 projects had been approved as the procedures are still in the process of being finalized. Large-scale projects cannot and are not intended to be funded through this mechanism.
All but two LDCs now participate in the programme and are at various stages of project formulation and implementation (table 16). However, the first 12 years of the IF show that this special international support mechanism for LDCs was ineffective in generating more resources for aid for trade in LDCs. The aid for trade commitments by OECD-DAC donors to LDCs and other developing countries have been on the rise and there has been an acceleration in this trend since 2002 (chart 16). But such commitments to LDCs have actually increased less than to other developing countries in spite of a dedicated mechanism for trade-related capacity-building, which should ideally provide the basis for securing more aid for trade. Turning to disbursements of aid for trade over the period 2002–2008, it is apparent that the LDCs’ share in total aid–for-trade disbursements to all developing countries fell slightly, from 32 per cent in 2002–2003 to 28 per cent in 2007–2008. Total IF and EIF expenditures over this period were equivalent to less than 0.1 per cent of total aid for trade disbursements to LDCs (table 17). In aggregate, $52 million has been allocated to LDCs through the IF process since 2000, on average amounting to a little more than $1 million per country.
There is a consensus that the EIF has the potential to become an effective tool for delivering trade-related technical assistance. But the learning process has been very slow. Moreover, broad political will and commitment will be required to engineer a change from the past.
Table 16Aid for Trade disbursements and IF/EIF expenditures, 2002–2008
(In millions of dollars and per cent)2002 2003 2004 2005 2006 2007 2008 Total
Developing countries 13 762 13 663 16 893 20 035 20 823 23 044 26 449 134 670Of which: ODCs 9 404 9 199 12 016 14 403 15 524 16 609 19 093 96 247 LDCs 4 359 4 464 4 878 5 631 5 300 6 435 7 356 38 422Share of aid to LDCs in aid toall developing countries (percentage)
31.7 32.7 28.9 28.1 25.4 27.9 27.8 28.5
IF and EIF expenditures Window 1 (IF) 2.71 2.09 1.86 1.48 2.91 0.77 0.99 12.81Window 2 (IF) 0.05 2.46 4.14 2.73 6.06 15.44Tier 1 (EIF), funds approved 1.20 1.20
Total IF and EIF expenditures 2.71 2.09 1.91 3.94 7.05 3.50 8.25 29.45IF and EIF expenditures as percentage of total disbursements to LDCs
0.06 0.05 0.04 0.07 0.13 0.05 0.11 0.08
Source: UNCTAD secretariat calculations, based on OECD, International Development Statistics database; UNDP, IF Trust Fund reports (several issues); and UNOPS, Trust Fund reports (several issues).
Note: : Values in constant 2008 dollars.
Since the EIF became operational only on 1 July 2009, it is still too early to evaluate its processes
and outcomes.
$52 million has been allocated to LDCs through the
IF/EIF process since 2000, on average amounting to a little more than $1 million
per country.

The Least Developed Countries Report 201068
Table 17Status of IF and EIF activities and funding, as of June 2010
Country Technical review
First DTIS (validated)
DTIS update
Window I projects (IF)
Window II projects (IF) Tier I projects (EIF)
Angola x WB DTIS 2007 DTISBenin x WB DTIS 2005 DTIS Projects
approvedBurkina Faso x WB DTIS 2007 DTISBurundi x WB DTIS 2003 Funding
approvedDTIS Projects
approvedNIU support and DTIS update
(Feb 2010)Cape Verde* x UNDP DTIS 2008 DTISCentral African Rep. x WB DTIS 2007 Funding
approvedDTIS Projects
approvedNIU support and DTIS update
(May 2010)Chad x WB DTIS, awaiting
validationDTIS Projects
approvedComoros x UNDP DTIS 2007 DTIS Projects
approvedDem. Rep. of the Congo x WB DTIS 2010 DTIS (Oct 2008);
pre-DTIS (Jan 2010)Djibouti x UNDP DTIS 2004 DTIS Projects
approved Equatorial Guinea PendingEritrea x Programme supportEthiopia x WB DTIS 2004 Diagnostic study Projects
approvedGambia x WB DTIS 2007 Funding
approvedDTIS, programme
supportNIU support and DTIS update
(Dec 2009)Guinea x WB DTIS 2003 DTIS Projects
approvedGuinea-Bissau x WB DTIS 2009 DTISLesotho x WB ~DTIS 2003 Funding
approvedDiagnostic study Projects
approvedNIU support and DTIS update
(Jan 2010)Liberia x WB DTIS, 2008 Funding
approvedDTIS NIU support and DTIS update
(Oct 2009)Madagascar x WB DTIS 2003 DTIS Projects
approved Malawi x WB DTIS 2004 Funding
approvedDTIS Projects
approvedNIU support and DTIS update
(Sept 2009)Mali x WB ~DTIS 2004 Diagnostic study Projects
approvedMauritania x WB ~DTIS 2001 Diagnostic study,
programme supportProjects
approvedMozambique x USAID/WB ~DTIS 2004 Diagnostic study
supportProjects
approvedNiger x WB DTIS 2008 DTISRwanda x WB DTIS 2005 Funding
approvedDTIS Projects
approvedNIU support and DTIS update
(Sept 2009)Sao Tome and Principe x WB DTIS 2006 DTIS Projects
approvedSenegal x WB DTIS 2003 DTIS, programme
supportProjects
approvedSierra Leone x WB DTIS 2006 Funding
approvedDTIS Projects
approvedNIU support and DTIS update
(July 2009)SomaliaSudan x WB DTIS 2007 DTISTogo x WB DTIS 2010 DTIS (Oct 2008), Pre-DTIS
(Jan 2010)Uganda x WB DTIS 2006 Funding
approvedDTIS, programme
support Projects
approvedNIU support and DTIS update
(Sept 2009)United Rep. of Tanzania x WB DTIS 2005 DTIS, programme
supportProjects
approved Zambia x WB DTIS 2005 DTIS Projects
approvedNIU support (Feb 2010)
Afghanistan x DTIS expected to be completed before end
of year
DTIS (Oct 2008)
Bangladesh x WB ~DTIS 2005 Programme support Pre-DTIS (xxx)Bhutan x Pre-DTIS (Jan 2010)Cambodia x WB ~DTIS 2001 Funding
approved DTIS, programme
supportProjects
approvedNIU support and DTIS update
(Sept 2009)Kiribati x UNDP DTIS in process DTISLao People's Dem. Rep. x WB ~DTIS 2006 Funding
approvedDiagnostic study Projects
approvedNIU support and DTIS update
(Jan 2010)
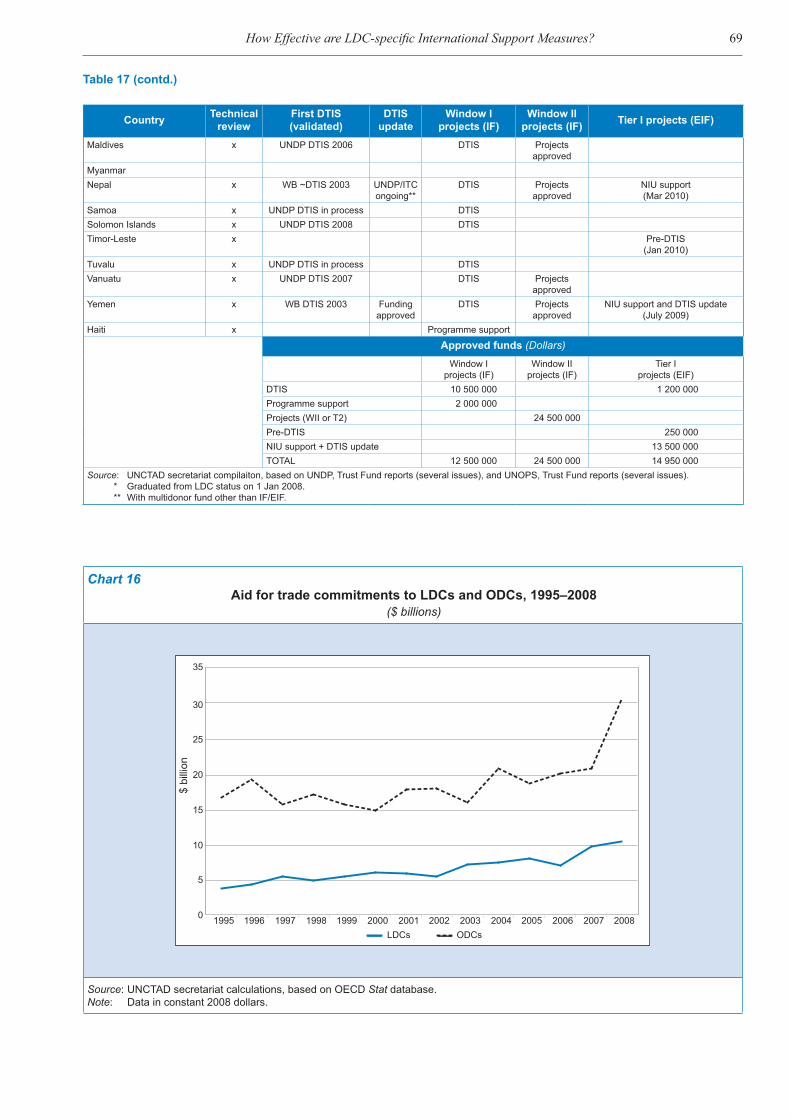
69How Effective are LDC-specific International Support Measures?
Chart 16Aid for trade commitments to LDCs and ODCs, 1995–2008
($ billions)
$ bi
llion
0
5
10
15
20
25
30
35
1995 1996 1997 1998 1999 2000 2001 2002 2003 2004 2005 2006 2007 2008LDCs ODCs
Source: UNCTAD secretariat calculations, based on OECD Stat database.Note: Data in constant 2008 dollars.
Country Technical review
First DTIS (validated)
DTIS update
Window I projects (IF)
Window II projects (IF) Tier I projects (EIF)
Maldives x UNDP DTIS 2006 DTIS Projects approved
MyanmarNepal x WB ~DTIS 2003 UNDP/ITC
ongoing**DTIS Projects
approvedNIU support(Mar 2010)
Samoa x UNDP DTIS in process DTISSolomon Islands x UNDP DTIS 2008 DTISTimor-Leste x Pre-DTIS
(Jan 2010)Tuvalu x UNDP DTIS in process DTISVanuatu x UNDP DTIS 2007 DTIS Projects
approvedYemen x WB DTIS 2003 Funding
approvedDTIS Projects
approvedNIU support and DTIS update
(July 2009)Haiti x Programme support
Approved funds (Dollars)
Window Iprojects (IF)
Window II projects (IF)
Tier Iprojects (EIF)
DTIS 10 500 000 1 200 000Programme support 2 000 000Projects (WII or T2) 24 500 000Pre-DTIS 250 000NIU support + DTIS update 13 500 000TOTAL 12 500 000 24 500 000 14 950 000
Source: UNCTAD secretariat compilaiton, based on UNDP, Trust Fund reports (several issues), and UNOPS, Trust Fund reports (several issues). * Graduated from LDC status on 1 Jan 2008. ** With multidonor fund other than IF/EIF.
Table 17 (contd.)

The Least Developed Countries Report 201070
3. TECHNOLOGY TRANSFER – TRIPS ARTICLE 66.2
So far, technology has been an undeveloped area of international support measures for LDCs. However, there is one area of SDT within WTO agreements that is specifically concerned with this issue, namely Article 66.2 of the Agreement on Trade-Related Aspects of Intellectual Property Rights (TRIPS). It states: “Developed Country Members shall provide incentives to enterprises and institutions in their territories for the purpose of promoting and encouraging technology transfer to least-developed country members in order to enable them to create a sound and viable technological base.” It therefore embodies a positive legal obligation (Correa, 2005: 253).
Clearly, the intent of the provision is to encourage the transfer of technology to those LDCs that are members of the WTO. But the extent to which this has occurred in practice is a matter of intense dispute. A fundamental point of contention relates to the very concept of technology transfer, which could amount to anything, from transfer of codified technology (as in machinery and equipment, products and processes), tacit knowledge and know-how, to just vocational training and educational activities. A second important issue relates to the absence of an operative institutional apparatus that could help LDCs realize the objective of the Article.
Article 66.2 imposes an obligation on developed-country members to provide incentives to enterprises and institutions in their territories to promote and encourage technology transfer to LDC members of the WTO. But as Correa (2007a) points out, “the precise nature of the incentives is not established” and “unlike other obligations imposed by the TRIPS Agreement, there are no clearly set standards to assess compliance with this obligation” (p.18). Only the end is specified, namely to enable LDCs to create a sound and viable technological base.
The Council for TRIPS in February 2003 established a reporting mechanism to monitor implementation of the obligations of Article 66.2. It produces reports annually which provide information on: (i) the incentive regime established by developed-country members of the WTO, including any specific legislative, policy and regulatory frameworks, (ii) the type of incentives and the government agency or entity making those incentives available, (iii) eligible enterprises, and (iv) any information on the functioning in practice of those incentives, such as types of technology transfers and the LDCs to which the technologies have been transferred.
An assessment (Correa, 2007b) of the reports found that none of them “concretely inform about specific incentives made available to enterprises and institutions for the transfer of technology to LDCs”, and that at least one country (New Zealand) reported not providing “any direct incentives to organizations to promote technology transfer to LDCs” (p.25). Instead, developed-country members interpreted the obligation in different and “overly broad” ways. Thus, incentives for transfer of technology included “activities as diverse as trade and investment promotion, training of IP and customs officials, funding provided to multilateral organizations such as the World Bank, granting of general incentives to their own enterprises, building capacity to ensure pest surveillance and management and phytosanitary matters, assistance in developing legislation, scientific cooperation and governance issues” (p.23). One country, Australia, argued that “programmes designed to promote innovation and competitiveness of the Australian economy…in turn can contribute to increased transfers of technology in export markets, including
Technology has been an undeveloped area of international support
measures for LDCs. However, there is one area of SDT
within WTO agreements that is specifically concerned with this issue, namely Article 66.2
of the Agreement on Trade-Related Aspects of Intellectual
Property Rights.
A fundamental point of contention relates to the
very concept of technology transfer, which could amount
to anything from transfer of codified technology, tacit
knowledge and know-how, to just vocational training and
educational activities.
A second important issue relates to the absence of an operative institutional apparatus that could help LDCs realize the objective
of the Article.

71How Effective are LDC-specific International Support Measures?
LDCs, through exports and outward or direct investment by Australian firms in other countries or through joint ventures between Australian firms and overseas companies” (p.23). In effect the major outcome of Article 66.2 is the reporting mechanism. The incentives offered so far are “inappropriate or insufficient” in relation to the obligation.
Another assessment sought to determine whether Article 66.2 has resulted in an increase in business between developed countries and LDCs (Moon, 2008). Based on country self-reports to the TRIPS Council between 1999 and 2007, and focusing mainly on the public policies and programmes that developed countries undertake to encourage their organizations/enterprises to engage in technology transfer, the study made two important findings. It concluded that a lack of clarity in definitions of key terms such as “technology transfer” and “developed country” render it difficult to conclude as to which WTO members are obligated to provide incentives, of what kind and towards what ends. Pointing to the fact that many countries did not submit the reports regularly to the WTO council and those that submitted did so irregularly, the review concluded that of 292 programmes and policies reported, only 31 per cent specifically targeted LDC members of the WTO. Of these, approximately a third of the programmes that targeted LDCs did not actually promote technology transfer. Thus, out of the 292 programmes, only 22 per cent involved technology transfer specifically targeted to LDC members (Moon, 2008:9). In order to generate more evidence on the issue, at the Fourth Session of the Committee on Intellectual Property and Development of WIPO in April 2010 the group of like-minded developing countries9 called for a study on the extent to which obligations contained in the TRIPS Article 66.2 have been fulfilled.
4. CLIMATE CHANGE – THE LDC FUND
The LDC Fund (LDCF) was established in 2001 to support the LDC Work Programme set up as a result of the commitment of all parties to UNFCCC in Article 4 (9) to “take full account of the specific needs and special situations of the least developed countries in their actions with regard to funding and transfer of technology.” The Work Programme and the LDCF have focused in particular on supporting the preparation and implementation of national adaptation programmes of action (NAPAs). This is important as it has offered LDCs a process through which they are able to “identify priority activities that respond to their urgent and immediate needs with regard to adaptation to climate change” and to obtain financing to support the activities they have identified (UNFCCC, 2009a: 5–7).
The LDCF relies on voluntary contributions from developed countries. Donor contributions to the Fund are held in trust by the World Bank, as part of its investment portfolio for all trust funds held by it (World Bank, 2010). According to that report, as on May 2010, 22 contributing participants had pledged contributions to the LDCF equivalent to $221.5 million and the total amount deposited was $169.1 million. The Global Environment Facility (GEF) secretariat had committed $76 million, of which $66 million related to LDCF projects (including preparation activities), $7 million to fees and $3 million were for corporate and administrative expenses. Only $24 million had been transferred to GEF agencies, the remaining $52 million were still outstanding for payment. Of the GEF agencies UNDP and the United Nations Environment Programme (UNEP) accounted for the largest share of LDCF commitments: 88 per cent and 10 per cent respectively.
In effect the major outcome of Article 66.2 is the
reporting mechanism. The incentives offered so far are inappropriate or insufficient in relation to the obligation.
Out of the 292 programmes, only 22 per cent involved
technology transfer specifically targeted to LDC members.
The LDC Fund (LDCF) was established in 2001 to help LDCs identify priority
activities that respond to their urgent and immediate needs with regard to adaptation to climate change and to obtain
financing to support the activities they have identified.
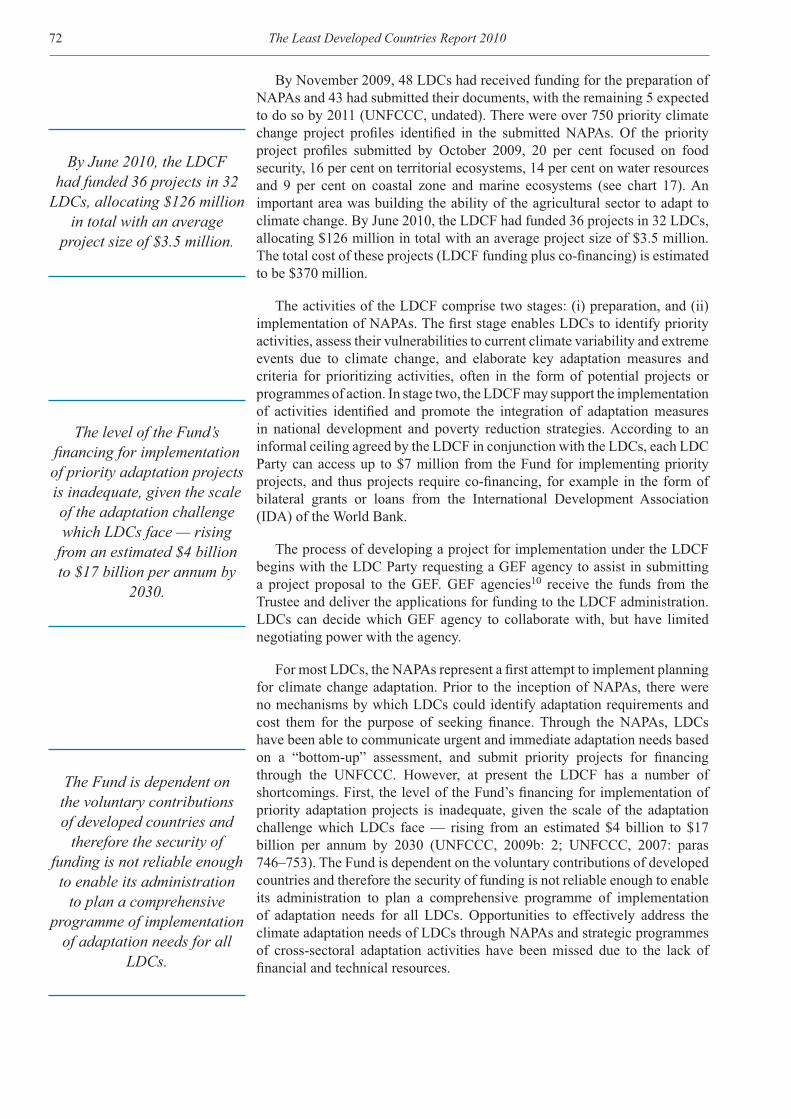
The Least Developed Countries Report 201072
By November 2009, 48 LDCs had received funding for the preparation of NAPAs and 43 had submitted their documents, with the remaining 5 expected to do so by 2011 (UNFCCC, undated). There were over 750 priority climate change project profiles identified in the submitted NAPAs. Of the priority project profiles submitted by October 2009, 20 per cent focused on food security, 16 per cent on territorial ecosystems, 14 per cent on water resources and 9 per cent on coastal zone and marine ecosystems (see chart 17). An important area was building the ability of the agricultural sector to adapt to climate change. By June 2010, the LDCF had funded 36 projects in 32 LDCs, allocating $126 million in total with an average project size of $3.5 million. The total cost of these projects (LDCF funding plus co-financing) is estimated to be $370 million.
The activities of the LDCF comprise two stages: (i) preparation, and (ii) implementation of NAPAs. The first stage enables LDCs to identify priority activities, assess their vulnerabilities to current climate variability and extreme events due to climate change, and elaborate key adaptation measures and criteria for prioritizing activities, often in the form of potential projects or programmes of action. In stage two, the LDCF may support the implementation of activities identified and promote the integration of adaptation measures in national development and poverty reduction strategies. According to an informal ceiling agreed by the LDCF in conjunction with the LDCs, each LDC Party can access up to $7 million from the Fund for implementing priority projects, and thus projects require co-financing, for example in the form of bilateral grants or loans from the International Development Association (IDA) of the World Bank.
The process of developing a project for implementation under the LDCF begins with the LDC Party requesting a GEF agency to assist in submitting a project proposal to the GEF. GEF agencies10 receive the funds from the Trustee and deliver the applications for funding to the LDCF administration. LDCs can decide which GEF agency to collaborate with, but have limited negotiating power with the agency.
For most LDCs, the NAPAs represent a first attempt to implement planning for climate change adaptation. Prior to the inception of NAPAs, there were no mechanisms by which LDCs could identify adaptation requirements and cost them for the purpose of seeking finance. Through the NAPAs, LDCs have been able to communicate urgent and immediate adaptation needs based on a “bottom-up” assessment, and submit priority projects for financing through the UNFCCC. However, at present the LDCF has a number of shortcomings. First, the level of the Fund’s financing for implementation of priority adaptation projects is inadequate, given the scale of the adaptation challenge which LDCs face — rising from an estimated $4 billion to $17 billion per annum by 2030 (UNFCCC, 2009b: 2; UNFCCC, 2007: paras 746–753). The Fund is dependent on the voluntary contributions of developed countries and therefore the security of funding is not reliable enough to enable its administration to plan a comprehensive programme of implementation of adaptation needs for all LDCs. Opportunities to effectively address the climate adaptation needs of LDCs through NAPAs and strategic programmes of cross-sectoral adaptation activities have been missed due to the lack of financial and technical resources.
The level of the Fund’s financing for implementation of priority adaptation projects is inadequate, given the scale of the adaptation challenge which LDCs face — rising
from an estimated $4 billion to $17 billion per annum by
2030.
The Fund is dependent on the voluntary contributions of developed countries and
therefore the security of funding is not reliable enough to enable its administration
to plan a comprehensive programme of implementation
of adaptation needs for all LDCs.
By June 2010, the LDCF had funded 36 projects in 32
LDCs, allocating $126 million in total with an average
project size of $3.5 million.
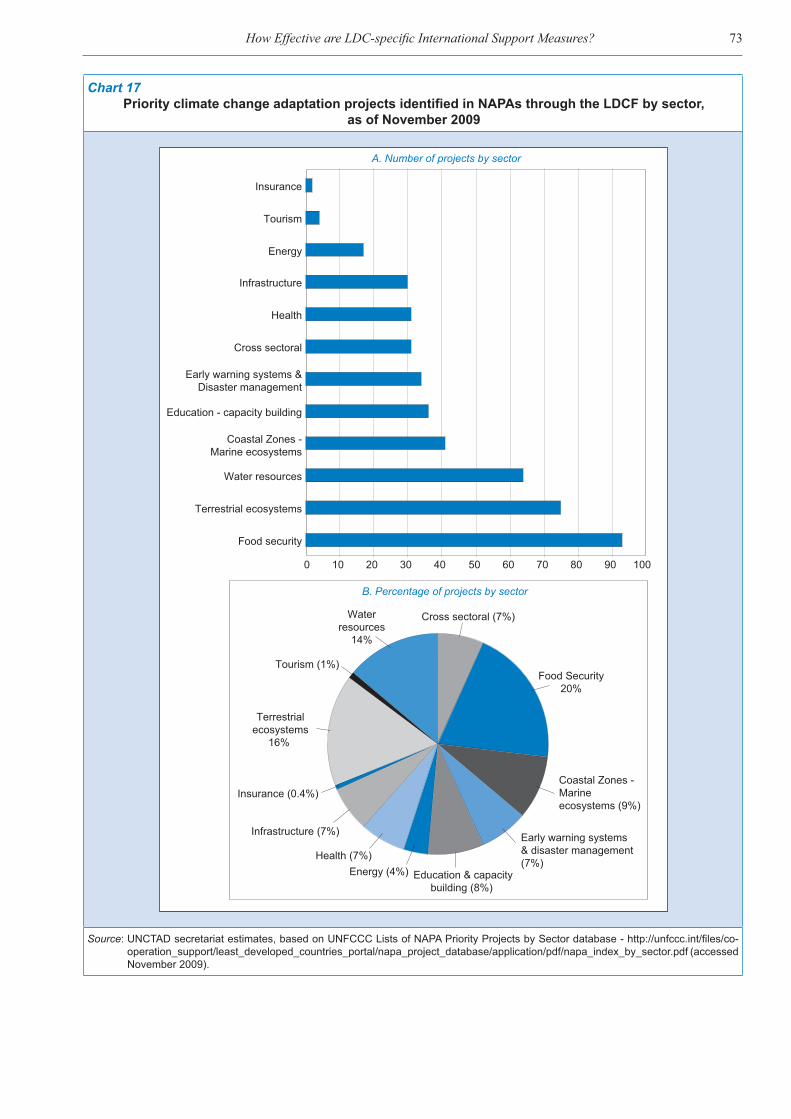
73How Effective are LDC-specific International Support Measures?
Chart 17Priority climate change adaptation projects identified in NAPAs through the LDCF by sector,
as of November 2009
A. Number of projects by sector
100 20 30 40 50 60 70 80 90 100
Food security
Terrestrial ecosystems
Water resources
Coastal Zones -Marine ecosystems
Education - capacity building
Early warning systems &Disaster management
Cross sectoral
Health
Infrastructure
Energy
Tourism
Insurance
B. Percentage of projects by sector
Cross sectoral (7%)
Food Security20%
Coastal Zones - Marineecosystems (9%)
Early warning systems& disaster management(7%)
Education & capacitybuilding (8%)
Energy (4%)Health (7%)
Infrastructure (7%)
Insurance (0.4%)
Terrestrialecosystems
16%
Tourism (1%)
Waterresources
14%
Source: UNCTAD secretariat estimates, based on UNFCCC Lists of NAPA Priority Projects by Sector database - http://unfccc.int/files/co-operation_support/least_developed_countries_portal/napa_project_database/application/pdf/napa_index_by_sector.pdf (accessed November 2009).
The Least Developed Countries Report 201074
Second, the lack of resources has led to a narrowing down of the NAPA processes, from a wide set of priority actions to a few top priority projects, usually on the basis of multi-criteria assessments and expert opinions rather than cost-benefit analyses. Although there are proposals for moving towards sectoral and programmatic approaches, including disbursing funds via budget support mechanisms,11 the project-based approach now predominates (SEI, 2009: paras 62–70; UNFCCC, 2008: paras 199–204). Very few reports mention mainstreaming or policy reform co-objectives, which probably reflects the LDCF’s funding constraints. NAPAs only cover a subset of LDCs’ broader adaptation needs and address short-term requirements, thus neglecting medium- to long-term adaptation needs. Greater development coherence in adaptation funding is therefore difficult for the Fund to achieve because of the relatively small amount of funding available for priority projects. The LDCF’s project-based delivery of climate-change-related financing limits comprehensive solutions to the adaptation and mitigation needs of the LDCs.
Third, the project-based approach is weakly integrated into national development processes. The LDCF’s project-based delivery of climate-change-related financing circumvents national public expenditure systems and strategic planning (UNFCCC, 2008: paras 200–202). It also increases transactions costs, relies heavily on imported technical assistance and does not generally build local capacity (IDD and Associates, 2006 cited in UNFCCC, 2008: para 200). Less reliance on independent consultants, greater use of public sector expertise and efforts to establishing intragovernmental arrangements in NAPA processes could lead to improved technical sustainability of the NAPA outputs (DANIDA, 2009). Although 43 NAPAs have been developed in LDCs, very few actions have been identified in the context of national development strategies, and they have attracted little donor funding (SEI, 2009). Nevertheless, this is not inevitable. Some LDCs, such as Bangladesh and Rwanda, have successfully integrated NAPAs into their PRSPs and national development strategies. Similarly, since 2007 Mozambique and Madagascar have sought to mainstream climate adaptation strategies into their PRSPs to highlight the prevention and mitigation of natural disasters and to improve forecasting and the mapping of risk zones as priorities for future investment.
Fourth, the LDCF’s governance structure should enable direct accountability and reporting between the GEF and the LDCs. The GEF agencies developing these projects are only accountable to the GEF; they are not directly accountable to LDCs who have no direct access or control over the funds. The LDCs do not even have effective control over the LDCF decision-making processes regarding resource allocation, nor does it routinely inform the UNFCCC about adaptation project outcomes. The LDCs have little control over the LDCF’s resources and thus limited effective negotiating power vis-à-vis the GEF agencies (DANIDA, 2009).
Although funding through the GEF is not formally conditional, there are some burdensome reporting and co-financing criteria. GEF agencies such as the UNDP and the World Bank often add further bureaucratic requirements to the process (Ayres and Huq, 2008). There is also dissatisfaction on the part of LDCs about access to climate-change-related funds. Developing countries have called for direct access to funding, notably through the UNFCCC, rather than funding mediated through external agencies. They would also like to see greater coherence and predictability of fund disbursements (SEI, 2009: 67–
The lack of resources has led to a narrowing down of the
NAPA processes, from a wide set of priority actions to a few top priority projects, usually on the basis of multi-criteria
assessments and expert opinions rather than cost-
benefit analyses.
The project-based approach is weakly integrated into
national development processes.
The LDCF’s governance structure does not enable direct accountability and
reporting between the GEF and the LDCs.
75How Effective are LDC-specific International Support Measures?
69). Additionally, finance provided through the LDCF mechanism often has co-financing requirements, as its own funding only covers “full incremental or additional costs” as opposed to ”full costs” which have to be borne either by the recipient Governments themselves or through financing leveraged through other sources. Similar arrangements apply to the World Bank’s climate investment funds whereby access to the funds is mediated by multilateral development banks (MDBs), thus requiring eligible countries to have an “active MDB country programme” in place (World Bank, 2008a: para 17; see also World Bank, 2008b: annex A, para 16). Given current LDC institutional capacities, distinguishing “incremental or additional” costs of climate change impacts from baseline development needs is an extremely complex task. As most LDCs cannot afford to meet the baseline development costs, LDCF commitments of finance towards the additional costs are often inadequate in relation to the scale and urgency of their needs (Ayres and Huq, 2008).
Finally, a survey by an LDC Expert Group (LEG, 2009: chapter 3) conducted in 2009 emphasized the need for improving LDCs’ capacity for project management and for mainstreaming adaptation into national policy, implementation and planning systems. There should also be support for LDCs to establish intragovernmental organizational structures capable of fostering inter-ministerial concerted action on climate adaptation. Despite substantial public and civil sector experience in most LDCs of developing PRSPs and national action plans (e.g. related to the United Nations Convention to Combat Desertification and the Convention on Biological diversity), the use of this expertise has been largely ignored in the development of NAPAs; instead, GEF agencies have preferred to use independent consultants (LEG, 2009). The LDCF should seek to institutionalize the NAPA process within government agencies so as to build (rather than displace) public sector human resource capacity, improve efficiency, and enhance the impact and sustainability of NAPA outputs.
D. A comparative assessment
A juxtaposition of the assessments of how special international support measures for LDCs work in practice indicates some important commonalities which have prevented them from having real or substantial developmental impacts. These commonalities are related to either the design or the implementation of the support measures.
First, various features of the design of some of these special measures limit their effectiveness from the outset. Of the eight measures examined, the scope of SDT for LDCs within WTO agreements are for the most part not oriented to providing development benefits, but rather to providing transitional arrangements which facilitate implementation of those agreements by the LDCs. The other seven measures are targeted at bringing some concrete trade and development benefits, but these are limited by: (i) important exclusions which are explicitly incorporated into the design of the measures to protect commercial interests in the LDCs’ development partners, and (ii) a failure to take account of the economic constraints within LDCs, which prevents these countries from effectively seizing the opportunities created by the special measures.
As most LDCs cannot afford to meet the baseline development costs, LDCF commitments of finance towards the additional
costs are often inadequate in relation to the scale and
urgency of their needs.
Despite substantial public and civil sector experience in most LDCs of developing PRSPs and national action
plans, the use of this expertise has been largely ignored in the development of NAPAs; instead, GEF agencies have preferred to use independent
consultants.
Various features of the design of some of these
special measures limit their effectiveness from the outset.

The Least Developed Countries Report 201076
Examples of the exclusions are market access preferences that offer 97 per cent product coverage, making potentially these preferences commercially meaningless since the remaining 3 per cent in many cases coincide with the export basket of LDCs, or the exclusion of food aid and technical cooperation from the 2001 DAC Recommendation to untie aid. Economic constraints of LDCs limit their utilization of trade preferences and also the ability of their domestic enterprises to benefit from the untying of aid. In each of these cases, these constraints could be overcome by improving the design of the support measures. For example, rules of origin which enable more sourcing from other developing countries, or special efforts to reduce the contract size in aid provision and thus facilitate more local procurement, could considerably enhance the trade and developmental effects of these support measures.
Second, very little action has been taken to implement two out of the eight international support measures for LDCs, namely SDT within WTO agreements and the decision to facilitate LDCs’ accession to the WTO and exercising restraint in seeking concessions in the accession process. With regard to SDT, the failure of implementation is due to LDCs choosing not to utilize the few opportunities of SDT which exist within the agreements. With regard to WTO accession, the developed- country members of WTO have actually sought concessions above and beyond those that had been required of existing LDC WTO members. It is unclear whether the aid target is also being implemented directly by donors or is a by-product of other aid allocation priorities. The econometric evidence shows that LDC status does not affect the geographical allocation of aid for the LDCs as a whole.
Third, there is a major breakdown in funding the implementation of special support measures. The financial flows which have followed from the DTIS and NAPAs have fallen far short of needs. The total amount allocated to LDCs through the IF process between 2000 and 2010 is little more than $1 million per LDC, and the LDCF disbursed $4 million per LDC (in 32 countries) to support climate change adaptation projects between 2001 and June 2010. Similarly, TRIPS Article 66.2 has been implemented in such a way that rather than offering financial incentives for technology transfer, existing activities have simply been reclassified which could — at a stretch of the imagination – be said to fall within the ambit of the Article. The lack of funding for the LDC-specific international support measures contrasts markedly with the United Nations system’s expenditure on operational activities which are strongly focused on LDCs.
Fourth, the development benefits to LDCs that could result from the special measures are sometimes stymied by inertia in existing policy practices. This is evident, for example, in the way the untying of aid actually works. Increased technical assistance for the LDCs is also often necessary to enable them to derive benefits from these measures, but it is not provided, or not provided in a way that allows them to utilize the measures. In some instances, one of the outcomes of the process has been an improvement in the capacities of the implementing agencies. For example, the capacities of the World Bank and UNDP in support of trade and development, which both were very weak in 2000, have certainly been enhanced through their active engagement in the IF and EIF processes.
Fifth, implementation in ways which could bring greater developmental benefits to LDCs is also affected by different interpretations of what a measure actually means. A recurrent pattern is that LDCs and their development partners have different expectations of what the special measures, such as the
Very little action has been taken to implement two
measures, namely SDT within WTO agreements and the
decision to facilitate LDCs’ accession to the WTO and
exercising restraint in seeking concessions in the accession
process.
There is a major breakdown in funding the implementation of special support measures
which contrasts markedly with the United Nations system’s expenditure on operational
activities that is strongly focused on LDCs.
The development benefits to LDCs that could result from
the special measures are sometimes stymied by inertia in existing policy practices. This is evident, for example, in the way the untying of aid
actually works.
Implementation in ways which could bring greater developmental benefits to LDCs is also affected by
different interpretations of what a measure actually
means.

77How Effective are LDC-specific International Support Measures?
2001 DAC Recommendation or indeed the whole EIF process, are intended to deliver. Another example is the interpretation by developed-country WTO members of TRIPS Article 66.2, which actually ignores incentives to enterprises and institutions in their territories to encourage technology transfer.
Sixth, some of the special measures have extended beyond the LDC group and this can, though it does not necessarily, affect their overall developmental outcomes. Such extension of the geographical scope of measures is evident in market access preferences, some SDT provisions and the 2001 DAC Recommendation which was extended to non-LDC HIPCs in 2008. How this affects the development benefits of the measures requires further study. In the case of untying aid, for example, it may be expected to have no effects. However, for preferential market access, the effectiveness of the benefits depends crucially not simply on the preferential margins relative to MFN treatment but also on the kinds of preferences offered to other countries.
Seventh, many of these measures remain best endeavours, and are based on voluntary contributions. Moreover, there are no enforcement mechanisms.
Eighth, a positive feature arising from the comparison is that there is clearly a learning process occurring in the design of international support measures for LDCs. This is perhaps most apparent in relation to the Integrated Framework which, since 1997, has been first improved and then enhanced, but it is also apparent in relation to the design of market access preferences. However, from the LDCs’ point of view this learning process has been painfully slow. For example, it has taken 13 years to make the IF initiative more effective. Moreover, the major difficulties affecting the utilization of market access preferences by LDCs were known at least 40 years ago, and indeed it was precisely these difficulties which provided the rationale for designing special preferences for the least developed amongst the developing countries.
Ninth, a recurrent important outcome of the international support measures is improved reporting and monitoring of what is happening. All five measures — Article 66.2, preferential market access (within the MDGs), the 2001 DAC Recommendation, the LDCF within UNFCCC and the associated Expert Group, and EIF — have instituted monitoring mechanisms. This has led to better data, for example with regard to reporting of the percentage of aid that is tied or the percentage of imports entering duty free in developed-country markets. Developed countries also now regularly report what they are doing in relation to TRIPS Article 66.2.
Tenth, one of the most important outputs of the special mechanisms has been studies which could lead to projects and programmes. This has been the major outcome of both the EIF, which has produced 38 Diagnostic Trade Integration Studies, and the LDCF under which 43 NAPAs have been prepared and 48 LDCs have received funding for their preparation.
Overall, existing special international support measures do not work in a way which is developmentally effective, either because of limits in their design or the manner in which they are implemented. The way these measures work reflects the fact that LDCs have little bargaining power. Therefore, LDCs tend to accept whatever assistance they are given. Commercial interests of rich countries and wide differences of interpretation between LDCs and their development partners also continue to stymie their implementation. It is clear that the learning process in the design and implementation of these
Some of the special measures have extended beyond the LDC group and this can,
though it does not necessarily, affect their overall
developmental outcomes.
Many of these measures remain best endeavours,
and are based on voluntary contributions. Moreover, there are no enforcement
mechanisms.
A positive feature arising from the comparison is that there is clearly a learning process
occurring in the design of international support
measures for LDCs.
One of the most important outputs of the special
mechanisms has been studies which could lead to projects
and programmes.

The Least Developed Countries Report 201078
measures has been painfully slow. During the past decade there has been significant progress in ensuring that special measures are multilaterally agreed and monitored. Now, there is a need to accelerate their improvement and introduce new LDC-specific international support mechanisms so that they have genuine development impacts.
Overall, existing special international support
measures do not work in a way which is developmentally
effective, either because of limits in their design or the manner in which they are
implemented.
79How Effective are LDC-specific International Support Measures?
Notes1 The need to focus on actions within the Brussels Programme of Action was stressed by
Mehmet Arda, Galatasaray University, and Government of Turkey Coordinator, Fourth United Nations Conference on LDCs, at the UN-OHRLLS brainstorming meeting on “Substantive Preparations for UNLDC IV- Towards a New Partnership for LDCs”, held in New York on 14-16 July 2010.
2 The only exception is a short annual report produced by OHRLLS ( Office of the High Representative for Least Developed Countries, Landlocked Developing Countries and Small Island Developing States ) for ECOSOC which is submitted in compliance with General Assembly Resolution 64/213. The last Report was UN (2010e). Economic and social trends in the LDCs are also described in some of UNCTAD’s annual Least Developed Countries Reports.
3 For a very useful summary of the identification of the LDC category and also an overview of special international support measures, see United Nations, 2008.
4 For a detailed early history, see United Nations, 2010c; Komlev and Encontre, 2004.5 The UNFCCC is governed by the Conference of the Parties (COP) whose responsibility
is to “keep under regular review the implementation of the Convention and any related legal instruments that the Parties may adopt” as well as to “make, within its mandate, the decisions necessary to promote the effective implementation of the Convention” (Article 7, UNFCCC, 2002).
6 These are: Angola, Bangladesh, Benin, Burkina Faso, Burundi, Cambodia, the Central African Republic, Chad, the Democratic Republic of the Congo, Djibouti, the Gambia, Guinea, Guinea-Bissau, Haiti, Lesotho, Madagascar, Malawi, Maldives, Mali, Mauritania, Mozambique, Myanmar, Nepal, Niger, Rwanda, Senegal, Sierra Leone, Solomon Islands, Togo, Uganda, the United Republic of Tanzania and Zambia.
7 See, for example, Francois, Hoekman and Manchin, 2005; Elliott, 2009; Carrere and de Melo, 2009.
8 For an overview of SDT provisions granted to LDCs, see UNCTAD, 2004. The WTO (2010b) provides a complete list of documents on SDT within the multilateral framework.
9 The like-minded countries comprise the African Group, the Arab Group, Brazil and India. 10 The GEF develops its projects through ten Implementing Agencies: the United Nations
Development Programme (UNDP), the United Nations Environment Programme (UNEP), the World Bank, the African Development Bank (AfDB), the Asian Development Bank (ADB), the European Bank for Reconstruction and Development (EBRD), the Inter-American Development Bank (IADB), the International Fund for Agricultural Development (IFAD), the United Nations Food and Agricultural Organization (FAO), and the United Nations Industrial Development Organization (UNIDO).
11 Budget support approaches have become a common means of delivering conventional ODA, and are increasingly used by bilateral and multilateral donors. There are many different modalities for budget support, but they generally involve channeling resources directly into a Government’s budget using recipients’ allocation, procurement and accounting systems” (UNFCCC, 2008: para 202), and expenditure is not ring-fenced around specific projects or activities. However, donors often insist on recipient Governments meeting pre-qualification criteria, including fiduciary standards and blueprints for achieving international development targets such as the World Bank and IMF-initiated PRSPs for low-income countries.
ReferencesAyres JM and Huq S (2008). Supporting adaptation to climate change: What role for Official
Development Assistance? Available at: http://www.eed.de/fix/files/doc/DSA%20conf%2008%20paper%20Ayers&Huq1.pdf.
Brenton P (2003). Integrating the least developed countries into the world trading system: The current impact of EU references under Everything but Arms. World Bank Policy Research Working Paper 3018, Washington, DC, April.
CAPRA-TFOC Consortium (2003). Evaluation of the revamped integrated framework for trade related technical assistance to the least developed countries. Interim report. Ontario, Canada.
Carrere C and de Melo J (2009). The Doha Round and market access for LDCs: Scenarios for the EU and US markets. Discussion Paper Series No. 7313, Centre for Economic Policy Research, London.
Clay EJ, Geddes, M and Natali L (2009). Aid untying: Is it working? Thematic study on the developmental effectiveness of untied aid: Evaluation of the implementation of the Paris Declaration and of the 2001 DAC recommendation on untying ODA to the LDCs. Synthesis
The Least Developed Countries Report 201080
report. Copenhagen, Secretariat for the Evaluation of the Paris Declaration and OECD Publication.
Correa C (2005). Can the TRIPS Agreement foster technology transfer to developing countries? In: Maskus KE and Reichman JH, eds., International Public Goods and Transfer of Technology under a Globalized Intellectual Property Regime. Cambridge, Cambridge University Press, p. 229-32.
Correa C (2007a). Technology tansfer and IPRs. Background paper for the Least Developed Countries Report 2007. Geneva, UNCTAD.
Correa C (2007b). Intellectual property in LDCs: Strategies for enhancing technology transfer and dissemination. Background paper for the Least Developed Countries Report 2007. Geneva, UNCTAD.
DANIDA (2009). Operation of the Least Developed Countries Fund for adaptation to climate change: Joint external evaluation. Copenhagen, Ministry of Foreign Affairs/DANIDA, September; available at: www.evaluation.dk.
Elliott KA (2009). Opening markets for poor countries: Are we there yet?. Working paper 184. Center for Global Development, Washington, DC.
Elliott KA (2010). Open markets for the poorest countries: Trade preferences that work. The CGD Working Group on Global Trade Preference Reform. Center for Global Development, Washington DC.
Farfan OH (2005). Understanding and escaping commodity-dependency: A global value chain perspective. Washington, DC, International Finance Corporation, World Bank Group.
Francois J, Hoekman B and Manchin M (2005). Preference erosion and multilateral trade liberalization. World Bank Policy Research Working Paper 3730, World Bank, Washington, DC.
GATT Secretariat (1994). The results of the Uruguay Round of Multilateral Trade Negotiations, Geneva.
Komlev L, and Encontre P (2004). Beyond conventional wisdom in development policy: an intellectual history of UNCTAD, 1964-2004, United Nations publication, New York and Geneva.
LEG (LDC Expert Group) (2009). The least developed countries national adaptation programmes of action: Overview of preparation, design of implementation strategies and submission of revised project lists and profiles. Bonn, UNFCCC secretariat.
Moon S (2008). Does TRIPS Article 66(2) encourage technology transfer to least developed countries? An analysis of country submissions to the TRIPS Council (1999–2007). ICTSD Policy Brief No. 2, ICTSD, Geneva.
OECD (2005). Paris Declaration on aid effectiveness: Ownership, harmonization, alignment, results and mutual accountability, Development Co-operation Directorate - Development Assistance Committee, Organisation for Economic Co-operation and Development, Paris.
OECD (2010). Implementing the 2001 DAC Recommendation on Untying Aid: 2010 Review. Development Co-operation Directorate – Development Assistance Committee, Organisation for Economic Co-operation and Development, Paris.
SEI (Stockholm Environment Institute) (2009). Bilateral finance institutions and climate change: A mapping of climate portfolios. Prepared for the Climate Change Working Group for Bilateral Finance Institutions, and submitted to the United Nations Environment Programme (UNEP) and the Agence Française de Développement (AFD); available at: http://www.sei-international.org/.
Stevens C and Keenan J (2001). The impact of the EU’s Everything But Arms proposal: A report to Oxfam, mimeo, Institute for Development Studies at the University of Sussex, Brighton, UK.
UNCTAD (1969). Special measures in favour of the least developed among the developing countries, Report of the group of experts on special measures in favour of the least developed among the developing countries, TD/B/288.
UNCTAD (1972). Proceedings of the United Nations Conference on Trade and Development (IV). Special measures in favour of the least developed among the developing countries, action programme submitted by the Secretary-General of UNCTAD, TD/135.
UNCTAD (1983). The Least Developed Countries and Action in their favour by the International Community. A/CONF.104/2/Rev.1.
UNCTAD (1992). Paris Declaration and Programme of Action for the Least Developed Countries for the 1990s, United Nations publication, Doc. No. UNCTAD/RDP/LDC/58.
UNCTAD (2002). The Least Development Countries Report 2002: Escaping the Poverty Trap. United Nations publication, New York and Geneva.
UNCTAD (2003). Economic Development in Africa: Trade Performance and Commodity Dependence. United Nations publication, New York and Geneva.
UNCTAD (2004). The Least Development Countries Report 2004: Linking International Trade with Poverty Reduction. United Nations publication, New York and Geneva.
UNCTAD (2007). Erosion of Trade Preferences in the post-Hong Kong Framework: From “Trade is Better than Aid” to “Aid for Trade”, United Nations publication, New York and Geneva.

81How Effective are LDC-specific International Support Measures?
UNCTAD (2008). The Least Development Countries Report 2008: Growth, Poverty, and the Term of Development Partnership. United Nations publication, New York and Geneva.
UNFCCC (2002). Report of the Conference of the Parties on its Seventh Session, held at Marrakesh, 29 October to 10 November 2001 (addendum), FCCC/CP/2001/13/Add.1. 21 January, Bonn.
UNFCCC (2007). Investment and financial flows to address climate change. UNFCCC Secretariat publication, Bonn.
UNFCCC (2008). Investment and financial flows to address climate change, An update. UNFCCC Secretariat Publication, Doc. No. FCCC/TP/2008/7, Bonn, 26 November.
UNFCCC (2009a). Least developed countries under the UNFCCC. Bonn, UNFCCC Secretariat.
UNFCCC (2009b). Financing climate action: investment and financial flows for a strengthened response to climate change. UNFCCC Secretariat Fact Sheet, June, Bonn.
UNFCCC (undated). ‘Frequently Asked Questions about LDCs, the LEG and NAPAs’, modified 4 December 2009, available at: http://unfccc.int/cooperation_support/least_developed_countries_portal/frequently_asked_questions/items/4743.php
United Nations (2002). Declaration and Programme of Action for the Least Developed Countries for the Decade 2001-2010, Adopted by the Third United Nations Conference on the Least Developed Countries in Brussels on 20 May 2001 and Endorsed by the UN General Assembly, United Nations publication, New York.
United Nations (2008). Handbook on the Least Developed Country Category: Inclusion, Graduation and Special Support Measures. United Nations publication, sales no. E.07.II.A.9, New York.
United Nations (2010a). Report of the twelfth session of the Committee for Development Policy (ECOSOC), Doc. no. E/2010/33, New York, 22–26 March.
United Nations (2010b). Report of the Expert Group Meeting on Special International Support Measures for the Least Developed Countries (LDCs). CDP2010/PLEN/5.
United Nations (2010c). Assessing the impact of the international support measures for least developed countries: An analytical framework and some preliminary results. CDP2010/PLEN/6. Revised draft, 11 March, New York, United Nations.
United Nations (2010d). Strengthening International Support Measures for the Least Developed Countries. Committee for Development Policy’s Policy note. United Nations publication, New York.
United Nations (2010e). Implementation of the programme of action for the Least Developed Countries for the decade 2001–2010. Report of the Secretary-General, Doc. no. A/65/80-E/2010/77, New York, 17 May.
United Nations (2010f). Analysis of the funding of operational activities for development of the United Nations system for 2008. Report of the Secretary-General at the United Nations General Assembly and ECOSOC, Doc. no. A/65/79-E/2010/76, New York, 14 May .
World Bank (2004). Integrated framework for trade-related technical assistance: Addressing challenges of globalization. An independent evaluation of the World Bank’s approach to global programs. World Bank Operations Evaluation Department Publication, Washington, DC.
World Bank (2008a). Clean Technology Fund. 9 June; available at: http://www.climateinvestmentfunds.org/cif/node/78.
World Bank (2008b). Strategic Climate Fund. 3 June; available at: http://www.climateinvestmentfunds.org/cif/node/112.
World Bank (2010). Status report on the Least Developed Countries Fund and the Special Climate Fund. World Bank publication, Doc. no. GEF/LDCF.SCCF.8/Inf.2/Rev.1. Washington, DC, May 31.
WTO (2003). Accession of Least-Developed Countries, General Council’s decision of 10 December, 2002, WT/L/508, 20 January, 2003, Geneva.
WTO (2005). Doha Work Programme Ministerial Declaration, WT/MIN(05)/DEC, Hong Kong, 22 December.
WTO (2010a). Market access for products and services of export interest to least developed countries. Doc. no. WT/COMTD/LDC/W/46/Rev.1, Geneva, 26 February.
WTO (2010b). Special and differential treatment provisions in WTO agreements and decisions. Note by the WTO Secretariat. Doc. no. TN/CTD/W/33, Geneva, 8 June.


Chapter
3The Contours of a New International
Development Architecture for LDCs
A. Introduction
This chapter presents a conceptual framework for the design of a New International Development Architecture (NIDA) for LDCs. NIDA is defined as a new architecture of formal and informal institutions, rules and norms, including incentives, standards and processes, which would shape international economic relations in a way that is conducive to sustained and inclusive development in the LDCs. The objectives of such a NIDA are: (a) to reverse the marginalization of LDCs in the global economy and to help them catch up; (b) to support a pattern of accelerated and sustained economic growth which would improve the general welfare and well-being of all people in the LDCs; and (c) to help LDCs graduate from LDC status. These objectives could be achieved through a greater emphasis on the development of productive capacities of LDCs and through a renewed role of the State in promoting development. The new architecture is intended to influence and shape the economic behaviour of all agents within the domains of finance, trade, commodities, technology, and climate change adaptation and mitigation. The NIDA for LDCs should be part of a broader set of systemic reforms which need to be taken in the wake of the financial crisis and global recession, and which would be beneficial for all countries, both developed and developing.
Part of this new international development architecture must involve the design of a new generation of international support mechanisms (ISMs) for the LDCs. It is necessary to strengthen these measures by introducing institutional mechanisms for their implementation and by ensuring adequate financing. It is also important to move beyond a focus on trade, and in particular market access, to special measures which help build up the productive base of LDC economies. New ISMs should also seek to address emerging international challenges of the coming decade, and associated new structural weaknesses and vulnerabilities (see chapter 4 of this Report).
However, although a new generation of special ISMs targeted at LDCs is essential, it is not enough. This is because, as argued in chapter 2 of this Report, the existing international economic architecture which facilitates or constrains development and poverty reduction in the LDCs does not simply consist of special international support mechanisms specifically targeted at LDCs. These special mechanisms work within a more general framework of rules, norms, practices and understandings which guide the international economic relations of all developing countries, including the LDCs, as well as sub-categories of developing countries — such as “low-income countries”, “heavily-indebted poor countries” and “fragile States” — which imperfectly overlap with the category of LDC. This general framework includes, for example, a strictly defined aid architecture and debt relief regime, currently accepted practices in the provision of agricultural subsidies in rich countries, and an increasingly
NIDA is defined as a new architecture of formal
and informal institutions, rules and norms, including incentives, standards and processes, which would
shape international economic relations in a way that is
conducive to sustained and inclusive development
in the LDCs.
The objectives of such a NIDA are: (a) to reverse the
marginalization of LDCs in the global economy and to help them catch up; (b)
to support a pattern of accelerated and sustained
economic growth which would improve the general welfare and well-being of all people in the LDCs; and (c) to help LDCs graduate from LDC
status.

The Least Developed Countries Report 201084
stringent intellectual property rights (IPR) regime for developing countries. At the same time, there is neither an effective international commodity policy nor a regime encouraging technology transfer. All these add up to conditions that are not conducive to sustained, inclusive development. Given the weaknesses in the design and implementation of special international support measures for LDCs, these general regimes actually now play a greater role in affecting development and poverty reduction in the LDCs than the special measures.
This implies that even if it were possible to design, agree and implement a new generation of more effective international support mechanisms for LDCs, this in itself would be insufficient to promote more sustained and inclusive development within the LDCs. For this development to occur, the global economic regimes that are currently enabling or constraining development and poverty reduction in all developing countries, including the LDCs, would also have to support the same outcomes. To the extent that the general development architecture works in a way that does not support the special needs and interests of the LDCs, the overall results would be neutral or even negative. In effect, the right hand (the general framework) would take away what was given by the left hand (the special ISMs). A necessary condition to make the special international support mechanisms for LDCs effective is therefore not simply to improve them, but also to ensure that the global economic regimes affecting developing countries in general, including LDCs, and sub-categories within them which overlap with the LDCs, are also reformed so that they work to support development and poverty reduction in the LDCs.
The term “international support mechanism” is used in this Report, rather than “international support measure”, to convey the idea that special international support for LDCs is not simply a matter of designing new policy measures. The Report calls for a new generation of LDC-specific international support mechanisms that should be accompanied by resources, including financial resources, institutions, policy frameworks and organizational entities, to make them implementable. Only then can the ISMs effectively address the specific structural weaknesses and vulnerabilities that confront LDC economies. Moreover, the ISMs will only be effective if they are embedded within a more general policy framework of reform.
The chapter thus contends that the new generation of special ISMs for LDCs should be part of a larger agenda aimed at reforming and enhancing the effectiveness of the international development architecture and global governance for all developing countries. Combining ISMs for LDCs with a new international policy and cooperation framework that can deliver a more stable, equitable and inclusive global governance regime for all countries is one of the most pressing challenges facing the international community today. Doing so will not only contribute to the greater development effectiveness of special international support for LDCs but also to mainstreaming LDC issues into a wider development agenda.
The chapter is organized in five sections. Section B summarizes some key weaknesses of the global economic regimes which impinge on development and poverty reduction efforts in the LDCs. Section C presents the design of a NIDA for LDCs, focusing on its pillars, the underlying principles and the processes involved in its creation. The last two sections focus on two fundamental issues in the design of a NIDA. Section D discusses the nature of the paradigm shift in policy which is envisaged to promote new, more sustainable and inclusive national development paths in LDCs, discussing
Part of this new international development architecture must
involve the design of a new generation of international support mechanisms (ISMs) for the LDCs. These should
move beyond a focus on trade, and in particular market
access, to special measures which help build up the
productive base of LDC economies.
Although a new generation of special ISMs targeted at LDCs is essential, it is not enough.
It is also necessary to reform global economic
regimes which strongly affect development in LDCs.
The term “international support mechanism” is
used in this Report, rather than “international support
measure”, to convey the idea that special international support for LDCs is not
simply a matter of designing new policy measures.

85The Contours of a New International Development Architecture for LDCs
in particular the crucial need to incorporate the development of productive capacities in national development strategies and the role of the State in promoting development. The design of the international architecture follows closely from these core ideas to facilitate these national development processes. Section E re-examines the role of ISMs specifically targeted at LDCs, as these ISMs are a key part of the NIDA.
The conceptual framework developed in this chapter is applied in the rest of this Report. Chapter 4 proposes elements of an agenda for action to create a NIDA for LDCs that is attuned to some possible trends in the global economy over the coming decade, while the last three chapters of the Report discuss this positive agenda in more detail.
B. Weaknesses of the global economic regimes from an LDC perspective
The rationale for a new international development architecture for the LDCs stems from the weaknesses of the current international economic architecture. Chapter 2 of this Report shows how existing LDC-specific international support measures are failing to have any significant developmental impact in LDCs. This section briefly examines the weaknesses of the global economic regimes from an LDC perspective as a basis for presenting a positive agenda that includes both systemic reforms as well as a new generation of ISMs for LDCs. In doing so it draws on analyses of previous LDC Reports since 2000.
Four major weaknesses in the existing global economic regimes cause them to constrain rather than enable development and poverty reduction in the LDCs.
• First, there are certain policy issues that are missing from the international economic architecture even though they are very important to LDCs because of their stage of development and their form of integration into the global economy.
• Second, the global economic regimes are founded on models of trade, finance and technology that are inappropriate for the LDCs, given their initial conditions, structural weaknesses and vulnerabilities.
• Third, these models have been propagated through conditionalities and micro-incentives for encouraging compliance which have undermined country ownership of national development strategies and limited policy space. Rather than encouraging policy diversity and learning tailored to local conditions, a one-size-fits-all policy approach has been applied.
• Fourth, there is a lack of policy coherence between different components of the global regimes and between the global regimes and special international support measures for the LDCs.
1. MISSING ELEMENTS
From an LDC perspective, the major element missing from the global economic regimes is the lack of an international commodity policy of any kind. This is important because many LDC economies are still commodity-dependent, and the way in which commodity markets behave and the increasing interdependence between these markets and financial markets, is integrally
The rationale for a new international development architecture for the LDCs stems from the weaknesses of the current international
economic architecture.
The major weaknesses of current global economic
regimes are: (1) certain policy issues are missing;
(2) the regimes are founded on models inappropriate
for the LDCs...
... (3) conditionalities have undermined country
ownership and limited policy space; (4) there is a lack of coherence between different components of the economic
architecture.
For LDCs, the major missing element is the lack of an international commodity
policy.

The Least Developed Countries Report 201086
associated with the boom-bust nature of the growth experience of the LDCs and their structural constraints. It also has a bearing on the interrelationship between the food, financial and climate crises and their effects on the LDCs.
The poor long-term growth performance of the LDCs, as well as the persistence and all-pervasiveness of extreme poverty is closely related to the commodity dependence of the LDCs. Most of them were very badly affected by the collapse of commodity prices in the early 1980s. This price collapse amounted to a loss of real purchasing power of 40–60 per cent for many of the countries that were dependent on commodity exports. As noted by Maizels (1992), it was a deeper crisis than that caused by the Great Depression of the 1930s and was closely related to the emergence of the debt crisis in very poor countries. As a result, the commodity-dependent LDCs were caught in an international poverty trap in which an interrelated complex web of external trade and finance relationships reinforced domestic vicious circles of underdevelopment resulting in economic stagnation and persistent mass poverty (UNCTAD, 2002). By the end of the 1990s, 85 per cent of the LDCs dependent on non-oil primary commodity exports had an unsustainable external debt (ibid.: table 36). External indebtedness in turn was associated with the emergence of an aid-debt-service system which undermined the effectiveness of aid.
Economic growth in LDCs picked up again with the commodity price boom of the 2000s, driven by rising demand from large, rapidly growing developing economies, and by the overall buoyancy of the global economy. But people in LDCs were unable to fully reap the benefits of the price boom due to various changes in international commodity markets, some of which were associated with the implementation of structural adjustment programmes and the dismantling of international commodity regulations. In agricultural commodity production and marketing, in particular, there are considerable asymmetries in market power and access to information, technology and marketing know-how between transnational corporations (TNCs), on the one hand, and local entrepreneurs, farmers and traders in developing countries, on the other. Thus, under the prevailing market structures, the potential benefits of productivity improvements tend to be appropriated largely by TNCs and global supermarket chains, instead of accruing to fragmented producers and farmers. Moreover, the governance structures of primary commodity value chains have become increasingly buyer-driven with a shift in the distribution of value skewed in favour of consuming countries. In the mineral sector, many State-owned enterprises were privatized in the 1990s (often as part of structural adjustment programmes), and, depending on how privatization was negotiated and implemented, a large share of the mineral rents from the recent commodity boom was not guaranteed to be used for economic development of the producer countries.
The heightened price volatility following the dissolution of international commodity agreements led to a rapid expansion of derivatives markets for many commodities, as demand for risk-hedging instruments intensified. The rapid growth of derivatives markets subsequently attracted new players who are not engaged in trading physical commodities and whose activities have led to a radical change in the structure of trading on commodity markets. This has led to a loosening of the relationship between derivatives markets and physical markets. But also, the “financialization” of commodity markets has further accentuated price volatility.
The poor long-term growth performance of the LDCs and
pervasive extreme poverty are closely related to the commodity dependence
of the LDCs.
People in LDCs were unable to fully reap the benefits
of the price boom.
In agriculture, there are considerable asymmetries between TNCs and local entrepreneurs, farmers
and traders in developing countries.
87The Contours of a New International Development Architecture for LDCs
In the long term, a gradual transformation into more diversified economic structures of the LDCs is the key to more resilient, inclusive and sustained development and poverty reduction. But in the short and medium term, there is a vital need for some kind of international commodity policy that recognizes the increasing links between the commodity problem, development finance and debt issues. The persistent reluctance to recognize commodity-related development issues, and to act on them, has been extremely costly in terms of foregone development opportunities for commodity-dependent developing countries, and in particular LDCs. This is not a matter of going back to the old international commodity agreements. Elements of a new positive agenda for LDCs in the area of commodities are taken up in chapter 6 of this Report.
2. INAPPROPRIATE MODELS OF FINANCE, TRADE AND TECHNOLOGY
The structural weaknesses of the LDCs mean that the global economic regimes which constrain or enable development and poverty reduction in all developing countries (including the LDCs) do not work as expected in an LDC context. The evidence used to justify the national and international policies and practices associated with these regimes is usually drawn from more advanced developing countries, where data is more readily available. These frameworks are, by definition, not designed in a way that specifically addresses the structural weaknesses of LDCs. Policies and practices that could work in one context are often inappropriate in the LDC context. They do not produce the expected outcomes, and indeed they can often hinder the achievement of desired development and poverty reduction objectives. In short, failures have arisen from the application of models for finance, trade and technology that are not appropriate to address the structural weaknesses and vulnerabilities of the LDCs.
(a) Finance
At the heart of the development problem in LDCs are the low investment levels that prevent these countries from achieving sustained growth, structural transformation and poverty reduction. The scarcity of domestic resources available for financing not simply investment but also governance is due to their very low per capita incomes, a weak domestic formal sector and mass poverty. Yet LDCs do have latent resources, associated with the high levels of unemployment and underemployment of the population, which could be mobilized. Indeed, mobilizing domestic resources was one of the central aims of the development policies enacted by Governments before the current models were prescribed and came into prominence. However, the thrust of economic reforms which LDCs have been implementing has not been domestic resource mobilization but rather the attraction of foreign direct investment (FDI) and integration into global private capital markets. These reforms have actually curtailed the efforts of development banks, often parastatal, to promote domestic resource mobilization, and have thus perpetuated LDCs’ heavy dependence on external finance.
The thrust of the continuing reforms in LDCs has been to diminish the role of the State in promoting development while encouraging a greater reliance on the creative power of market forces. However, in spite of financial liberalization, financial systems have not been able to mobilize and efficiently channel savings into investment and technical change. Growth of the domestic private sector has been hampered by the thinness of the domestic entrepreneurial class, small or missing markets and low technological
Some kind of international commodity policy that
recognizes the increasing links between the commodity problem, development finance
and debt issues is required.
Failures have arisen from the application of models
for finance, trade and technology that are not
appropriate to address the structural weaknesses and
vulnerabilities of the LDCs.
Economic reforms have curtailed the efforts of development banks to
promote domestic resource mobilization, and have thus
helped perpetuate LDCs’ heavy dependence on
external finance.
In spite of financial liberalization, financial
systems have not been able to mobilize and efficiently
channel savings into investment and technical
change.

The Least Developed Countries Report 201088
capabilities. In addition, firms in LDCs generally face a permanent credit crunch. Most LDCs have thus found it difficult to generate adequate levels of private investment and sufficient jobs as they have not succeeded in expanding formal employment activities. The economic reform process has certainly resulted in some micro-level entrepreneurial success stories. Indeed, the commodity boom during 2002–2008 resulted in a real estate boom in many LDCs and the associated expansion of service sectors. However, in the absence of any sectoral development policies and coordination of linkages between sectors, this has not added up to structural transformation.
A further problem is that the economic reforms implemented by LDCs have included macroeconomic policies that have successfully controlled inflation but have not been oriented towards promoting economic growth and the creation of employment opportunities. The key role of fiscal policy and public investment for crowding in private investment has been underutilized (UNCTAD, 2009).
In spite of extensive reforms and the increasing globalization of production and finance since the 1980s, LDC Governments and enterprises still generally lack access to long-term international bank finance, and portfolio equity flows to most LDCs remain scarce. In general, foreign investors and lenders are still reluctant to place their money in most LDCs owing to the small scale of the majority of projects, the costs of asset development, high levels of risk that are rooted in the vulnerability of LDCs to shocks, lack of business support services, and weak physical infrastructure and governance problems (UNCTAD, 2000). It is true that net FDI inflows have increased significantly for LDCs as a group, but they remain concentrated in a few countries, have tended to focus on resource extraction and have generally involved increased profit remittances to the extent that the net transfers associated with FDI have been negative since 2005 (chart 18).
Chart 18FDI inflows and profit remittances on FDI in LDCs, 1988–2008
($ billions)
0
5
10
15
20
25
1988 1989 1990 1991 1992 1993 1994 1995 1996 1997 1998 1999 2000 2001 2002 2003 2004 2005 2006 2007 2008
Foreign direct investment, net inflows
$ bi
llion
s
Profit remittances on FDI
Source: UNCTAD secretariat calculations, based on World Bank, World Development Indicators (online) (accessed June 2010).
The key role of fiscal policy and public investment for crowding in private
investment has been underutilized.
In spite of extensive reforms, LDC Governments and
enterprises still generally lack access to long-term
international bank finance, and portfolio equity flows
remain scarce.
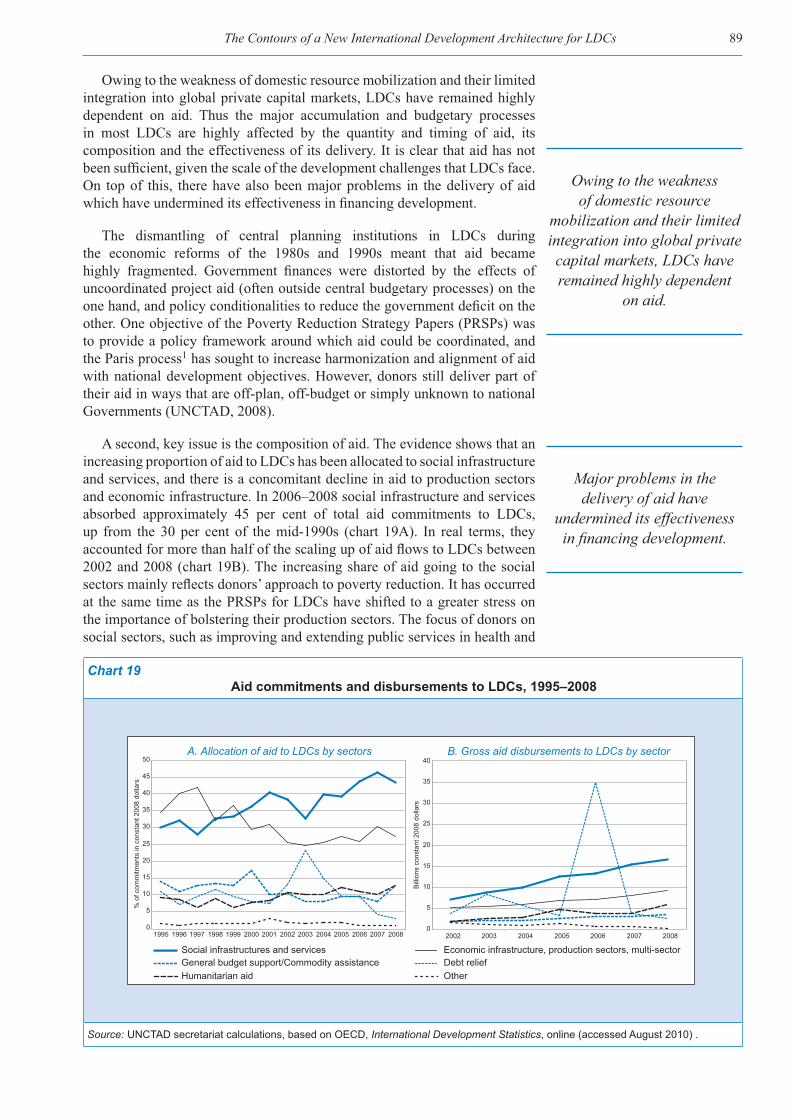
89The Contours of a New International Development Architecture for LDCs
Owing to the weakness of domestic resource mobilization and their limited integration into global private capital markets, LDCs have remained highly dependent on aid. Thus the major accumulation and budgetary processes in most LDCs are highly affected by the quantity and timing of aid, its composition and the effectiveness of its delivery. It is clear that aid has not been sufficient, given the scale of the development challenges that LDCs face. On top of this, there have also been major problems in the delivery of aid which have undermined its effectiveness in financing development.
The dismantling of central planning institutions in LDCs during the economic reforms of the 1980s and 1990s meant that aid became highly fragmented. Government finances were distorted by the effects of uncoordinated project aid (often outside central budgetary processes) on the one hand, and policy conditionalities to reduce the government deficit on the other. One objective of the Poverty Reduction Strategy Papers (PRSPs) was to provide a policy framework around which aid could be coordinated, and the Paris process1 has sought to increase harmonization and alignment of aid with national development objectives. However, donors still deliver part of their aid in ways that are off-plan, off-budget or simply unknown to national Governments (UNCTAD, 2008).
A second, key issue is the composition of aid. The evidence shows that an increasing proportion of aid to LDCs has been allocated to social infrastructure and services, and there is a concomitant decline in aid to production sectors and economic infrastructure. In 2006–2008 social infrastructure and services absorbed approximately 45 per cent of total aid commitments to LDCs, up from the 30 per cent of the mid-1990s (chart 19A). In real terms, they accounted for more than half of the scaling up of aid flows to LDCs between 2002 and 2008 (chart 19B). The increasing share of aid going to the social sectors mainly reflects donors’ approach to poverty reduction. It has occurred at the same time as the PRSPs for LDCs have shifted to a greater stress on the importance of bolstering their production sectors. The focus of donors on social sectors, such as improving and extending public services in health and
Chart 19Aid commitments and disbursements to LDCs, 1995–2008
A. Allocation of aid to LDCs by sectors
0
5
10
15
20
25
30
35
40
45
50
1995 1996 1997 1998 1999 2000 2001 2002 2003 2004 2005 2006 2007 2008
Social infrastructures and services Economic infrastructure, production sectors, multi-sectorGeneral budget support/Commodity assistance Debt reliefHumanitarian aid Other
B. Gross aid disbursements to LDCs by sector
0
5
10
15
20
25
30
35
40
2002 2003 2004 2005 2006 2007 2008
% o
f com
mitm
ents
in c
onst
ant 2
008
dolla
rs
Bill
ions
con
stan
t 200
8 do
llars
Source: UNCTAD secretariat calculations, based on OECD, International Development Statistics, online (accessed August 2010) .
Owing to the weakness of domestic resource
mobilization and their limited integration into global private capital markets, LDCs have remained highly dependent
on aid.
Major problems in the delivery of aid have
undermined its effectiveness in financing development.

The Least Developed Countries Report 201090
education, is certainly important. However, sustainable poverty reduction also requires the expansion of employment and income-earning opportunities, and for this reason, aid to the production sectors of an economy and for developing the economic infrastructure is vital.
A third issue is the extreme instability of disbursements of official development assistance (ODA) to LDC in the 2000s. During the period 2000–2008, the coefficient of variation of ODA allocations across LDCs was 43 per cent (Weeks, 2010). This was almost three times the variability of the net barter terms of trade of these countries, and for only 5 of 39 LDCs were the fluctuations in the terms of trade greater than ODA instability. Such strong instability, which donors could dramatically reduce, causes considerable difficulty for budget planning in recipient countries. A particularly serious problem is the unpredictability of disbursements in relation to commitments. Another problem is the timing of aid flows, which in the past has often been procyclical.
(b) Trade
A central aspect of the economic reform process has been the implementation of deep and extensive trade liberalization. The implicit development strategy underlying trade liberalization was to increase the efficiency of domestic resource allocation by aligning domestic with international prices, and to promote export-led growth by removing the anti-export bias implicit in the previous import substitution policies. But the impact of trade liberalization on a particular country depends on the circumstances in which it takes place and on the complementary policies. In LDCs, trade liberalization has been undertaken at a much lower level of development than it was in the now developed countries and also in other developing countries. In the LDCs, few domestic enterprises have the ability to compete either internationally or even in their own domestic markets, and lack the necessary complementary industrial and technological policies to build up local capabilities. The overall productivity gap in terms of output per worker between developed countries and LDCs is 30 to 1 in the favour of the former. Agricultural productivity is particularly low in the LDCs. All of this has raised major issues of timing, sequencing and speed of trade liberalization.
Most LDCs have undertaken rapid and comprehensive trade liberalization to the extent that they now have open economies. Most undertook sweeping trade liberalization in the late 1980s and the 1990s, through a rapid succession of measures taken unilaterally, especially in the context of structural adjustment programmes (UNCTAD, 2004: 179–187). Subsequently this policy direction has been maintained and reinforced through several mechanisms, especially:
(i) The continued use of trade-related conditionalities by international financial institutions and bilateral donors;
(ii) Membership of the World Trade Organization (WTO). Although all WTO agreements provide for special and differential treatment for LDCs, and the conditions for their initial membership were not very demanding, membership imposed some additional obligations on these countries. This was especially the case for those LDCs that acceded to the WTO after 1995. They were subject to much more demanding entry conditions, which required further liberalization (UNCTAD, 2004: 49–64);
(iii) Bilateral trade and investment agreements which LDCs have increasingly participated in, or are negotiating, especially with developed countries (e.g. Economic Partnership Agreements with the European Union). Many of these agreements require greater trade liberalization than the
Sustainable poverty reduction requires the expansion of employment and income-
earning opportunities, thus aid to the production sectors and economic infrastructure
is vital.
In the LDCs, few domestic enterprises have the ability to compete either internationally or even in their own domestic
markets.
Most LDCs have undertaken rapid and comprehensive trade liberalization to the extent that they now have
open economies.

91The Contours of a New International Development Architecture for LDCs
WTO agreements, for example with regard to the trade in goods and services, investment and public procurement, as well as more stringent IPR protection than is required by the WTO Agreement on Trade-Related Aspects of Intellectual Property Rights (TRIPS).
Therefore, even today, LDCs are continuing their drive towards greater trade liberalization and stronger IPR protection.
The extent of trade liberalization in the LDCs is evidenced by the fact that LDCs’ average most-favoured-nation (MFN) tariff on agricultural products is at a similar level to that in other developing countries, and it is somewhat higher than in the transition economies and developed countries. Tariffs on industrial goods and on total trade are somewhat higher in LDCs than in other country groups (chart 20). The difference, however, is in single digits, which means that tariffs, on average, do not provide any substantial protection to LDCs’ domestic firms.
Chart 21 shows the distribution of MFN tariff rates on all goods for different country groups. The data suggest that most developed countries have a lower average tariff than other groups of countries. However, some of them also have higher average tariffs (chart 21D). This means that in the majority of developed countries trade liberalization has been somewhat deeper than in LDCs, but also that the average tariffs in some developed countries are at a similar level to or even higher than those in LDCs. The data for weighted average tariffs are even more conclusive in this regard, since it shows that there is a group of eight developed countries that have average tariffs in the 26–28 per cent range. Hence, some developed countries protect their economies much more than LDCs.
Chart 20Average MFN tariffs for country groups
(Unweighted average of countries’ simple average tariff)
0
2
4
6
8
10
12
14
16
18
Developedcountries
LDCs Transitioneconomies
Otherdeveloping countries
Total trade
Per c
ent
Agricultural goods Industrial goods
Source: UNCTAD secretariat calculations, based on WITS (accessed August, 2010).Note: The goods classification is that of the WTO.
Even today LDCs are continuing their drive towards
greater trade liberalization and stronger IPR protection.
Tariffs, on average, do not provide any substantial
protection to LDCs’ domestic firms.

The Least Developed Countries Report 201092
Trade liberalization has been associated with an increase in LDCs’ trade integration into the global economy. The share of total exports and imports in gross domestic product (GDP) for LDCs increased, on average, from 36 per cent in 1985 to 62 per cent in 2008. Exports have also boomed following trade liberalization. But the share of LDCs in world trade has been a constant at close to 0.33 per cent during the last 10 years if oil is excluded. Moreover, the composition of exports from the LDCs has become more concentrated. The process of liberalization is intended to change the incentive structure towards one where exported goods are more aligned with static comparative advantages. For LDCs, their comparative advantages have meant a concentration on commodities and labour-intensive, low-skill and low-value-added manufactures in their exports. As a result, there has been a “lock-in effect”, whereby LDCs (as a group) have become more commodity-dependent or have focused on low-skill manufactures.
In addition, trade liberalization has failed to improve the balance-of-payments situation of many LDCs since they have tended to increase their imports more than their exports. The exceptions to this pattern are oil-exporting LDCs, which have benefited from the continuous increase in prices of their main export product over products over the past 10 years. Moreover, trade liberalization has adversely affected LDC’s fiscal revenue earnings. Although their imports as a share of GDP have increased significantly, trade taxes have declined, from 39 per cent of all tax revenue in the early 1990s to 31 per cent during the 2000–2006 period.
Chart 21Frequency distribution of MFN tariffs, by country groups
(Simple average, per cent)N
umbe
r of c
ount
ries
Num
ber o
f cou
ntrie
s
Num
ber o
f cou
ntrie
sN
umbe
r of c
ount
ries
A. LDCs
0
2
4
6
8
10
12
0 4 8 12 16 20 24
0 4 8 12 16 200 2 4 6 8 10 12 14 16
B. Other developing countries
0 4 8 12 16 20 24 28 320
5
10
15
20
C. Transition economies
0
2
4
6
8
10D. Developed countries
0
1
2
3
4
5
6
7
Source: UNCTAD secretariat calculations, based on WITS.Note: Data are the latest available as of August 2010.
Some developed countries protect their economies much
more than LDCs.
There has been a “lock-in effect”, whereby LDCs (as
a group) have become more commodity-dependent or have focused on low-skill
manufactures.
93The Contours of a New International Development Architecture for LDCs
Trade liberalization has also had the effect of weakening linkages among domestic firms. Those linkages had been established during the previous period, which was characterized by higher protection. Large-scale trade liberalization exposed domestic industries in LDCs to competition for which they were ill-equipped. As a result, large segments of the manufacturing sector have been wiped out in the past 20 years. This process of deindustrialization has been more severe in countries at lower levels of development.2 It has intensified the problem associated with an enclave economy, where some sectors or firms are very closely integrated with the global economy, while having few links with the rest of the national economy. Coupled with the discouraging effect that agricultural subsidies in developed countries have on agricultural production in LDCs, trade liberalization has also been associated with LDCs’ increased dependence on food imports and the delinking of rural-urban growth linkages.
On balance, the score card of the positive and negative effects of trade liberalization is very mixed (UNCTAD, 2004: 188–212). Instead of economic diversification, LDCs today have, on average, a less diversified economy and more concentrated exports. Instead of reducing their structural vulnerabilities, trade liberalization has accentuated them. In short, trade liberalization in LDCs was premature, given their level of development.
(c) Technology
In the area of technology, the global economic regimes have failed to devise mechanisms for technology transfer, while leading to the increasing application of an IPR regime that militates against learning and the development of a sound technological base in LDC economies.
Reconciling universal standards of protection of IPRs with the weak technological base of LDCs has been difficult for a variety of reasons. It was expected that the extension of IPRs would entail costs of various kinds for LDCs due to the considerable policy changes that would be required from these countries to conform to the TRIPS Agreement (Maskus, 2000: 6).3 However, three types of benefits were also envisaged. As opposed to a direct increase of investments in research and development (R&D), these benefits were primarily supposed to have the following indirect effects in promoting innovation through: (a) an increase in FDI, technology transfer, licensing and technology sourcing of value-added goods through foreign subsidiaries, with potentially positive implications for domestic learning; (b) more innovative activities resulting from access to patent disclosures and technologies; and (c) competitive returns for innovative firms in developing countries from stronger IPRs and less legal uncertainty (Edwin, Lai and Qiu, 2003).
After over a decade of studies on the relationship between IPRs, FDI and technological flows, some interesting results emerge. A global IPR regime appears to skew R&D systematically away from technologies that offer the greatest societal benefits, to those that offer the highest market returns. While there are some safeguards in the global IPR regime (notably parallel imports and compulsory licensing), these are limited in scope; and many countries have, in varying degrees, forgone these flexibilities by subscribing to “TRIPs-plus” bilateral agreements with major technology exporters. Ways and means to address these deficits and financing innovation of relevance to the poorer countries remain much-debated issues internationally, especially in areas of public interest such as health, agriculture and access to knowledge.
Trade liberalization has also had the effect of weakening linkages among domestic
firms.
Deindustrialization has been more severe in countries at lower levels of development
and has intensified the problem associated with an
enclave economy.
Trade liberalization in LDCs was premature, given their
level of development.
The global economic regimes have failed to devise mechanisms for technology transfer, while leading to an
IPR regime that militates against learning and the development of a sound
technological base in LDC economies.
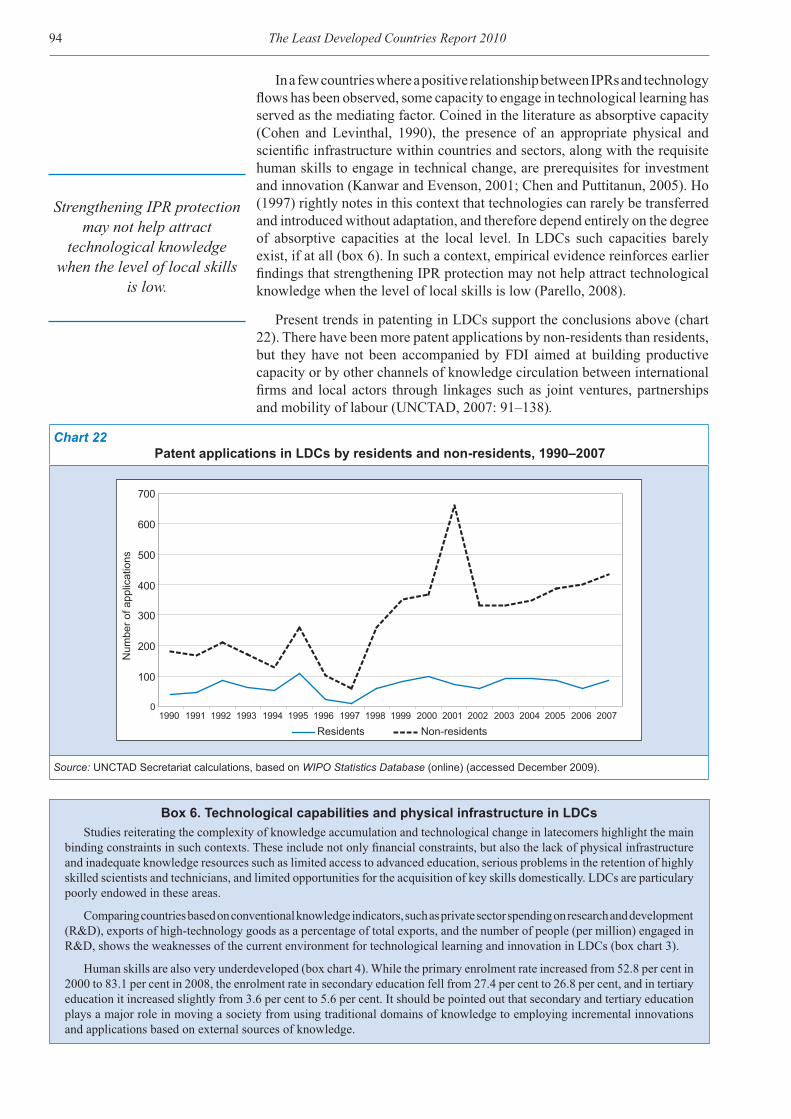
The Least Developed Countries Report 201094
In a few countries where a positive relationship between IPRs and technology flows has been observed, some capacity to engage in technological learning has served as the mediating factor. Coined in the literature as absorptive capacity (Cohen and Levinthal, 1990), the presence of an appropriate physical and scientific infrastructure within countries and sectors, along with the requisite human skills to engage in technical change, are prerequisites for investment and innovation (Kanwar and Evenson, 2001; Chen and Puttitanun, 2005). Ho (1997) rightly notes in this context that technologies can rarely be transferred and introduced without adaptation, and therefore depend entirely on the degree of absorptive capacities at the local level. In LDCs such capacities barely exist, if at all (box 6). In such a context, empirical evidence reinforces earlier findings that strengthening IPR protection may not help attract technological knowledge when the level of local skills is low (Parello, 2008).
Present trends in patenting in LDCs support the conclusions above (chart 22). There have been more patent applications by non-residents than residents, but they have not been accompanied by FDI aimed at building productive capacity or by other channels of knowledge circulation between international firms and local actors through linkages such as joint ventures, partnerships and mobility of labour (UNCTAD, 2007: 91–138).
Box 6. Technological capabilities and physical infrastructure in LDCsStudies reiterating the complexity of knowledge accumulation and technological change in latecomers highlight the main
binding constraints in such contexts. These include not only financial constraints, but also the lack of physical infrastructure and inadequate knowledge resources such as limited access to advanced education, serious problems in the retention of highly skilled scientists and technicians, and limited opportunities for the acquisition of key skills domestically. LDCs are particulary poorly endowed in these areas.
Comparing countries based on conventional knowledge indicators, such as private sector spending on research and development (R&D), exports of high-technology goods as a percentage of total exports, and the number of people (per million) engaged in R&D, shows the weaknesses of the current environment for technological learning and innovation in LDCs (box chart 3).
Human skills are also very underdeveloped (box chart 4). While the primary enrolment rate increased from 52.8 per cent in 2000 to 83.1 per cent in 2008, the enrolment rate in secondary education fell from 27.4 per cent to 26.8 per cent, and in tertiary education it increased slightly from 3.6 per cent to 5.6 per cent. It should be pointed out that secondary and tertiary education plays a major role in moving a society from using traditional domains of knowledge to employing incremental innovations and applications based on external sources of knowledge.
Chart 22Patent applications in LDCs by residents and non-residents, 1990–2007
100
200
300
400
500
600
700
01990 1991 1992 1993 1994 1995 1996 1997 1998 1999 2000 2001 2002 2003 2004 2005 2006 2007
Num
ber o
f app
licat
ions
Residents Non-residents
Source: UNCTAD Secretariat calculations, based on WIPO Statistics Database (online) (accessed December 2009).
Strengthening IPR protection may not help attract
technological knowledge when the level of local skills
is low.
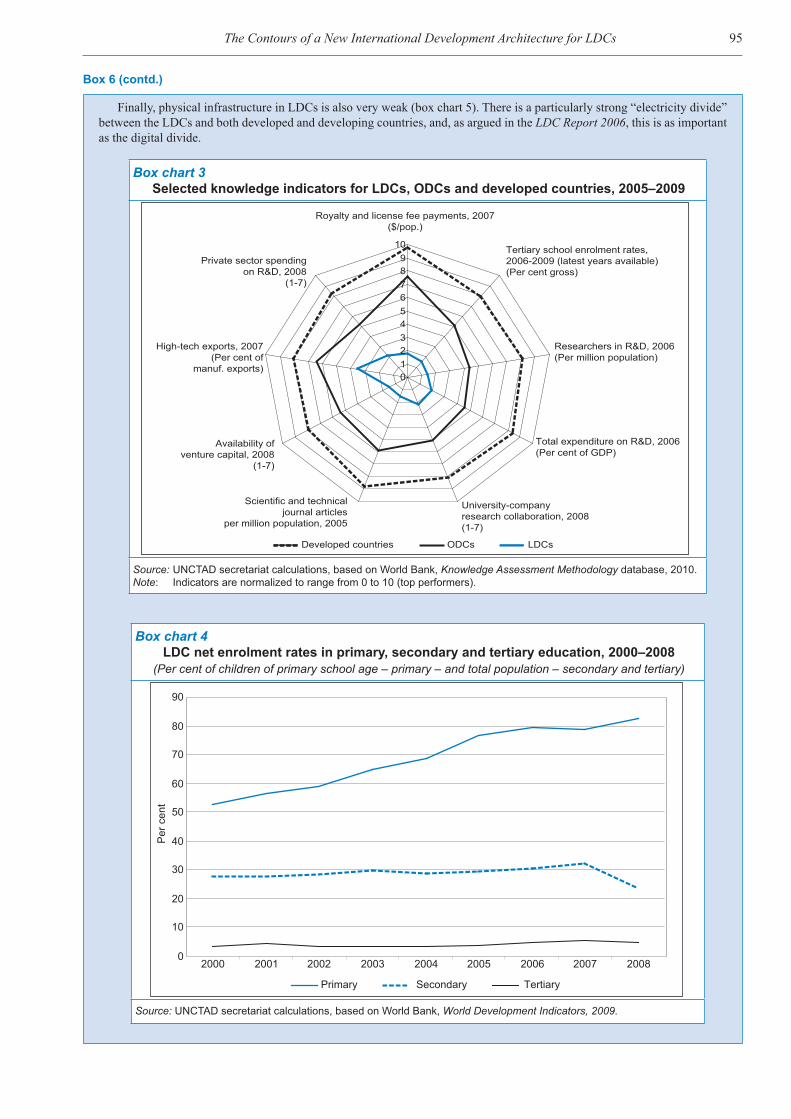
95The Contours of a New International Development Architecture for LDCs
Finally, physical infrastructure in LDCs is also very weak (box chart 5). There is a particularly strong “electricity divide” between the LDCs and both developed and developing countries, and, as argued in the LDC Report 2006, this is as important as the digital divide.
Box chart 3Selected knowledge indicators for LDCs, ODCs and developed countries, 2005–2009
0123456789
10
Royalty and license fee payments, 2007($/pop.)
Tertiary school enrolment rates,2006-2009 (latest years available)(Per cent gross)
Researchers in R&D, 2006(Per million population)
Total expenditure on R&D, 2006(Per cent of GDP)
University-companyresearch collaboration, 2008(1-7)
Scientific and technicaljournal articles
per million population, 2005
Availability ofventure capital, 2008
(1-7)
High-tech exports, 2007(Per cent of
manuf. exports)
Private sector spendingon R&D, 2008
(1-7)
Developed countries ODCs LDCs
Source: UNCTAD secretariat calculations, based on World Bank, Knowledge Assessment Methodology database, 2010.Note: Indicators are normalized to range from 0 to 10 (top performers).
Box chart 4LDC net enrolment rates in primary, secondary and tertiary education, 2000–2008
(Per cent of children of primary school age – primary – and total population – secondary and tertiary)
0
10
20
30
40
50
60
70
80
90
2000 2001 2002 2003 2004 2005 2006 2007 2008
Primary
Per
cen
t
Secondary Tertiary
Source: UNCTAD secretariat calculations, based on World Bank, World Development Indicators, 2009.
Box 6 (contd.)

The Least Developed Countries Report 201096
A second, very important impact of the greater proliferation of IPRs worldwide has been the shrinking policy space available to LDCs to develop their own catch-up policies. Innovation is continuously encouraged by the wide accessibility of society to already produced knowledge at low costs (Nelson, 1990; Foray, 1995), but IPRs limit the ways and means by which countries and firms can access knowledge locally to generate newer knowledge. Yet this has played a key role in economic development since the eighteenth century (Mokyr, 2003). It is also clear that in the short or medium term, universal IPR enforcement will reduce the freedom to design and implement technology acquisition and to use policies that are central to catch-up processes (Amsden and Chu, 2003). While the TRIPS Agreement contains flexibilities for the LDCs, most LDCs have, to varying degrees, forgone these flexibilities through “TRIPs-plus” regimes negotiated with major technology exporters or included in bilateral trade and investment treaties.
An urgent shift in focus is needed to ensure that the global knowledge framework addresses intellectual property, technology transfer and the growing knowledge divide between countries in a balanced way which addresses the complexity of process of technological acquisition in developing countries, and in particular LDCs, instead of focusing exclusively on the granting of private IPRs. Technology and its transfer are largely an annexure to provisions governing the granting of IPRs within the TRIPS Agreement. While some headway has been made, and the initiation of the WIPO Development Agenda is a big step (UNCTAD, 2007: 100–101), the current global technology framework relegates to secondary importance the issues of technology transfer, technical assistance and knowledge accumulation, all of which are extremely important for the creation of productive capacities in LDCs.4 Elements of a
Box chart 5Selected physical infrastructure indicators in LDCs, ODCs and developed countries
0
2
4
6
8
10
Paved roads(Per cent of total roads)
Total telephonesper 1,000 people
Internet usersper 100 people
Improved water source(Per cent of urban population with access)
Fixed broadbandInternet subscribers
per 100 people
Electric power consumption(kWh per capita)
Developed countries ODCs LDCs
Source: UNCTAD secretariat calculations, based on World Bank, Knowledge Assessment Methodology database, 2010.Note: Indicators are normalized to range from 0 to 10 (best performers).
Box 6 (contd.)
Very important impact of the greater proliferation of IPRs worldwide has been the shrinking policy space
available to LDCs to develop their own catch-up policies.

97The Contours of a New International Development Architecture for LDCs
positive agenda for LDCs in these areas are taken up in chapter 6 of this Report.
3. WEAK COUNTRY OWNERSHIP AND LACK OF POLICY SPACE
There is broad agreement that country ownership of development strategies and policies is essential for their effective implementation. It is also necessary to have strong development partnerships. Country ownership is understood in different ways, but at its core is the notion that Governments should be able to exercise leadership in the design and implementation of national development strategies. This is a prerequisite for devising solutions that are tailored to their specific circumstances. However, since the early 1980s, access to official aid has been conditional, in one way or another, on the implementation by LDC Governments of economic reform programmes designed to promote stabilization, liberalization and privatization, or on their implementation of poverty reduction strategies.
Few, if any, LDCs were in the vanguard of the trend towards liberalization, but they pursued it at an accelerated pace from the late 1980s and have further deepened liberalization over the past 10 years. Between 1988 and the end of the 1999, 33 out of 48 LDCs undertook policy reforms under the Structural Adjustment Facilities (SAFs) and Enhanced Structural Adjustment Facilities (ESAFs) financed by the International Monetary Fund (IMF), and 27 of these countries were engaged in implementing the agreed policies for three or more years (UNCTAD, 2000). After 1999, the ESAF was replaced by the Poverty Reduction and Growth Facility (PRGF), and borrowers from that facility had to prepare Poverty Reduction Strategy Papers (PRSPs). As a result, the economic reform process was deepened and reforms also sought to achieve poverty reduction objectives, particularly through the allocation of aid and government funding to priority social sectors. During the 2000s, 38 LDCs prepared PRSPs (three of which were interim PRSPs) and 16 have finalized two documents, while 29 LDCs have undertaken economic reforms under the PRGF (table 18).
The inadequacy of the one-size-fits-all approach to development has been increasingly recognized, resulting in the advocacy of a more context-specific approach to development based on country ownership. Theoretically, this should allow greater recognition of the specific structural weaknesses and vulnerabilities of the LDCs. However, although there have been major changes in the practice of policy conditionality, with an increasing tendency to encourage recipient-country Governments to draw up their own policies, macroeconomic stabilization, privatization and liberalization were still important types of policy conditionalities in LDCs even in the late 2000s. One aim of the PRSP process was to give countries greater leadership in the design and implementation of their programmes. But the evidence shows that the way in which PRSPs are designed and implemented is still strongly influenced by donors’ policy conditionality, monitoring benchmarks and financing choices (UNCTAD, 2008: 93–134). It is also proving very difficult to realize the potential of national leadership in the design and implementation of national development strategies in most LDCs because of weak technical capabilities and a reluctance on the part of the LDC Governments themselves to experiment. They fear that the adoption of policies deemed inappropriate by donors could adversely affect their access to external finance. Thus, the potential for learning and experimentation in policymaking and greater domestic ownership of policies is being realized only very slowly.
The current global technology framework relegates to secondary importance
technology transfer, technical assistance and knowledge accumulation, which are extremely important for
the creation of productive capacities in LDCs.
Ownership of development strategies and policies is
essential for their effective implementation.
Access to official aid has been conditional on
stabilization, liberalization and privatization, or on the implementation of poverty
reduction strategies.
The way in which PRSPs are designed and implemented
is still strongly influenced by donors’ policy conditionality, monitoring benchmarks and
financing choices.
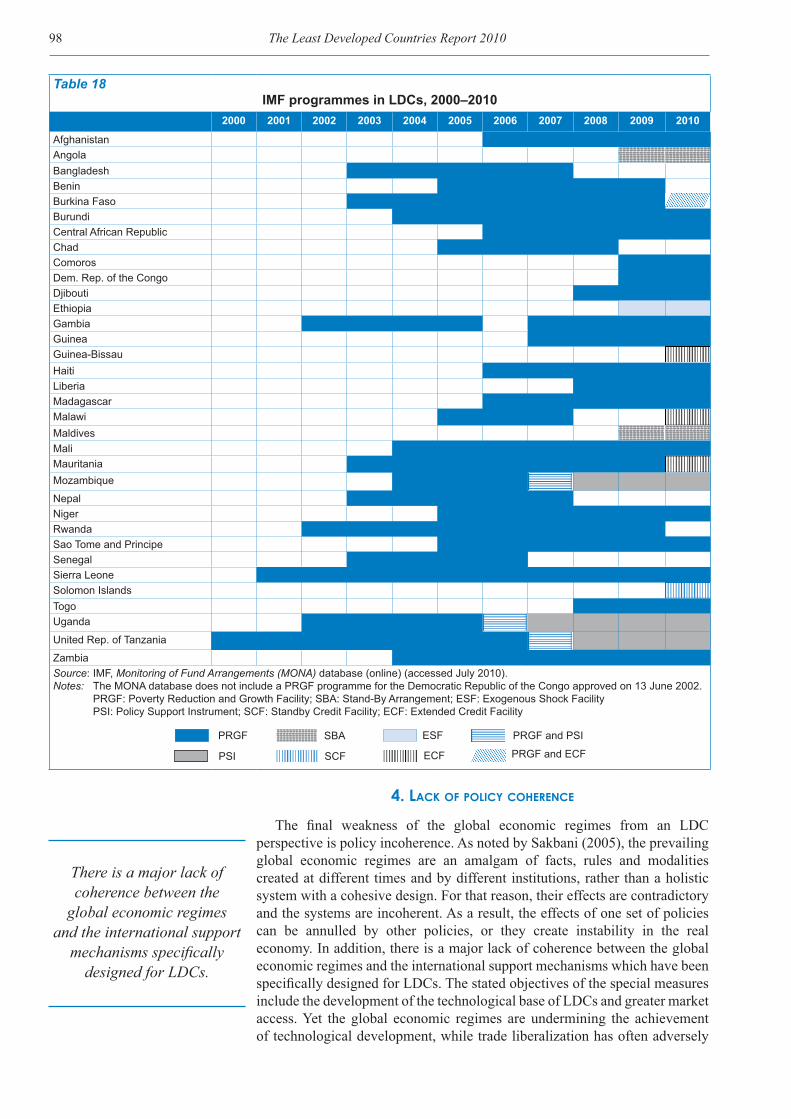
The Least Developed Countries Report 201098
Table 18IMF programmes in LDCs, 2000–2010
2000 2001 2002 2003 2004 2005 2006 2007 2008 2009 2010
AfghanistanAngolaBangladeshBeninBurkina FasoBurundiCentral African RepublicChadComorosDem. Rep. of the CongoDjiboutiEthiopiaGambia GuineaGuinea-BissauHaitiLiberiaMadagascarMalawiMaldivesMaliMauritaniaMozambique
NepalNigerRwandaSao Tome and PrincipeSenegalSierra LeoneSolomon IslandsTogoUganda
United Rep. of Tanzania
ZambiaSource: IMF, Monitoring of Fund Arrangements (MONA) database (online) (accessed July 2010).Notes: The MONA database does not include a PRGF programme for the Democratic Republic of the Congo approved on 13 June 2002. PRGF: Poverty Reduction and Growth Facility; SBA: Stand-By Arrangement; ESF: Exogenous Shock Facility PSI: Policy Support Instrument; SCF: Standby Credit Facility; ECF: Extended Credit Facility
PRGF PRGF and PSI
PRGF and ECF
SBA ESF
ECFPSI SCF
4. LACK OF POLICY COHERENCE
The final weakness of the global economic regimes from an LDC perspective is policy incoherence. As noted by Sakbani (2005), the prevailing global economic regimes are an amalgam of facts, rules and modalities created at different times and by different institutions, rather than a holistic system with a cohesive design. For that reason, their effects are contradictory and the systems are incoherent. As a result, the effects of one set of policies can be annulled by other policies, or they create instability in the real economy. In addition, there is a major lack of coherence between the global economic regimes and the international support mechanisms which have been specifically designed for LDCs. The stated objectives of the special measures include the development of the technological base of LDCs and greater market access. Yet the global economic regimes are undermining the achievement of technological development, while trade liberalization has often adversely
There is a major lack of coherence between the
global economic regimes and the international support
mechanisms specifically designed for LDCs.

99The Contours of a New International Development Architecture for LDCs
affected local industries and, consequently, the necessary supply capacities to take advantage of market access simply do not exist. The right hand has therefore been taking away the possibility to realize what the left hand was meant to be giving.
C. A new international development architecture for LDCs: Pillars, principles and processes
1. THE OVERALL ARCHITECTURE
A NIDA for LDCs would be constituted through reforms of the global economic regimes in areas which are directly relevant for development and poverty reduction in LDCs, as well as the design of a new generation of special international support mechanisms (ISMs) for the LDCs which address their specific structural constraints and vulnerabilities. In addition, with the increasing importance of South-South flows of trade, FDI, official finance, and knowledge, South-South development cooperation, both within regions and between LDCs and large, fast-growing developing countries, should play an important role in a NIDA for LDCs. And such cooperation should also include some ISMs for LDCs.
Chart 23The New International Development Architecture for LDCs and the global economic regimes
LDC-SpecificInternational Support
Mechamisms
South-South Development Cooperation
Source: UNCTAD secretariat.
The right hand has therefore been taking away the
possibility to realize what the left hand was meant
to be giving.

The Least Developed Countries Report 2010100
Chart 23 illustrates the relationships between these different elements of a NIDA for LDCs. It shows that the NIDA would not involve reform of all global economic regimes but only those that directly affects development and poverty reduction in LDCs. Similarly, the NIDA would involve some aspects of South-South development cooperation – not its totality. The chart also shows that the special ISMs for the LDCs are not stand-alone policies and institutions; they are embedded within the global economic regimes or within South-South development cooperation frameworks. Thus the ISMs would be a concrete application of the principle of special and differential treatment or the principle of common and differentiated responsibility within these broader cooperation frameworks to the development problems of LDCs.
Reforms to the global economic regimes that are relevant for the LDCs and the ISMs for the LDCs are important not just for the LDCs themselves; they can also contribute to the provision of global public goods, such as commodity price stability, and the prevention of global public bads, such as pervasive extreme poverty, complex humanitarian emergencies, political insecurity and reservoirs of communicable diseases.
South-South development cooperation is understood here to refer to the processes, institutions and arrangements that are designed to increase trade, investment, financial flows and technology transfer, as well as the exchange of knowledge and skills between developing countries — including LDCs — in order to achieve common development goals. Geographically, it covers bilateral, intraregional and interregional cooperation, as well as collaboration among developing countries on multilateral issues, designed to enhance their participation and integration into the world economy. South-South development cooperation offers new sources of ideas, models and practices for LDCs and thus provides major additional opportunities because of the alternative approaches it embodies. In addition, South-South economic relations provide new markets, new sources of technology and new sources of external capital to LDCs.
In chart 23, South-South development cooperation is seen to overlap with the global economic regimes but is not embedded within them. Moreover, some ISMs are specific to the global economic regimes, whereas others are specific to South-South development cooperation, and yet others (for example, duty-free and quota-free market access) are common to both cooperation frameworks. There is a need to increase policy coherence between the global economic regime and South-South cooperation. However, the NIDA for LDCs does not envisage immediate total alignment, as this could significantly reduce the creative potential of South-South development cooperation. There may be aspects of South-South development cooperation, such as modalities of infrastructure financing, which could provide powerful new ways to finance development in LDCs. Thus, a more realistic approach to achieving policy coherence would be through LDCs’ national policies, which could mainstream both North-South and South-South official financial flows into national development strategies through strengthened country ownership.
2. THE PILLARS OF A NIDA
The proposed NIDA for LDCs would have five major pillars, which relate to both the global economic regimes and South-South development cooperation, as well as some new policies and regimes. The pillars are: finance, trade,
A NIDA for LDCs would be constituted through reforms of the global economic regimes in areas which are directly relevant for development and poverty reduction in
LDCs, as well as the design of a new generation of
special international support mechanisms (ISMs)
for the LDCs.
South-South development cooperation offers new
sources of ideas, models and practices for LDCs and provides major additional
opportunities because of the alternative approaches it
embodies.
Some ISMs are specific to the global economic
regimes, others are specific to South-South development
cooperation, and yet others are common to both cooperation frameworks.

101The Contours of a New International Development Architecture for LDCs
technology, commodities and climate change. Chart 24 provides a view of the architecture of NIDA. The main features of the pillars of the NIDA are:
(i) Reform of the international financial architecture, including the aid and debt relief regime, as well as measures related to fostering domestic financial resource mobilization and private capital flows;
(ii) Reform of the multilateral trade regime;
(iii) An international commodity policy;
(iv) An international knowledge architecture that enables access to knowledge, its use and generation, including technology transfer and acquisition; and
(v) A regime for climate change adaptation and mitigation.
A new generation of special ISMs for the LDCs would need to be elaborated within each of the pillars.
A regime for international migration could also be considered as an additional pillar of the NIDA. However, this Report does not consider migration as a separate pillar, but instead treats migration issues to the extent that they are aspects of the finance, trade and technology pillars, focusing, for example, on the possibility of mobilizing the skills of the LDC diaspora for technological development in their countries of origin, or on the provision of special treatment in rules governing trade in services. IOM (2010) provides a recent overview of international migration issues for LDCs.
Chart 24The New International Development Architecture for LDCs
New InternationalDevelopment Architecture
for LDCs (NIDA)
South-SouthDevelopment Cooperation
Reform inGlobal Economic Regimes
Relevant for LDCs
Improved LDC-specific International Support Mechanisms
Fin
an
ce
Tra
de
Te
ch
no
log
y
Co
mm
od
itie
s
Cli
ma
te C
ha
ng
e
Source: UNCTAD secretariat.
The proposed NIDA for LDCs would have five major pillars, which relate to both the global economic regimes and South-South development cooperation: finance, trade,
commodities, technology and climate change.
A new generation of special ISMs for the LDCs would
need to be elaborated within each of the pillars.

The Least Developed Countries Report 2010102
3. PRINCIPLES OF THE NIDA FOR LDCS
The overall design of the NIDA for LDCs should:
(i) Enable new, more inclusive development paths in LDCs based on the development of productive capacities, the associated expansion of productive employment and improvement in the well-being of all their people;
(ii) Foster and support country ownership of national development strategies and enhance policy space for development policies;
(iii) Facilitate strategic integration into the global economy in line with the development needs and capacities of the LDCs, including through a better balance between external and domestic sources of demand;
(iv) Redress the balance between markets and the State so that the State plays a more significant role in guiding, coordinating and stimulating the private sector towards the achievement of national development objectives;
(v) Promote greater domestic resource mobilization in LDCs with a view to reducing their dependence on aid;
(vi) Promote greater policy coherence between the different domains of trade, finance, technology, commodities, and climate change mitigation and adaptation, and also between the global economic regimes and the ISMs;
(vii) Support South-South development cooperation as a strong complement to North-South development cooperation; and
(viii) Foster more democratic and universal participation in the global system of governance with a view to giving LDCs a greater voice and representation.
The contents of the NIDA should follow from these eight fundamental principles.
4. PROCESSES FOR THE DESIGN OF THE NIDA
The system of global governance needs to be reformed in order to advance LDC interests in the design of global economic regimes and also for the creation of more effective special ISMs for LDCs. While LDCs as a category have a high profile within the United Nations system, they do not have the same recognition and voice in other international institutions. In international financial institutions, they are disadvantaged by voting systems that are weighted according to a country’s economic strength. This is most evident in the IMF, where LDCs together have just 2.9 per cent of the votes — the same as Canada and less than Italy (with 3.2 per cent) — despite constituting 25 per cent of the membership and 10 per cent of the total population. Addressing the democratic deficit in global governance should therefore be an important part of the process of creating a NIDA for the LDCs. However, this issue does not fall within the scope of this Report and therefore it is not further discussed.
The design of the NIDA for LDCs should: (i) Enable new, more inclusive development
paths in LDCs; (ii) Foster and support country ownership
of national development strategies; ....
... (iii) Facilitate strategic integration into the global economy; (iv) Redress the
balance between markets and the State...
... (v) Promote greater domestic resource
mobilization; (vi) Promote greater policy coherence between trade, finance,
technology, commodities, and climate change mitigation...
... (vii) Support South-South development cooperation;
(viii) Foster more democratic participation in the global
system of governance.
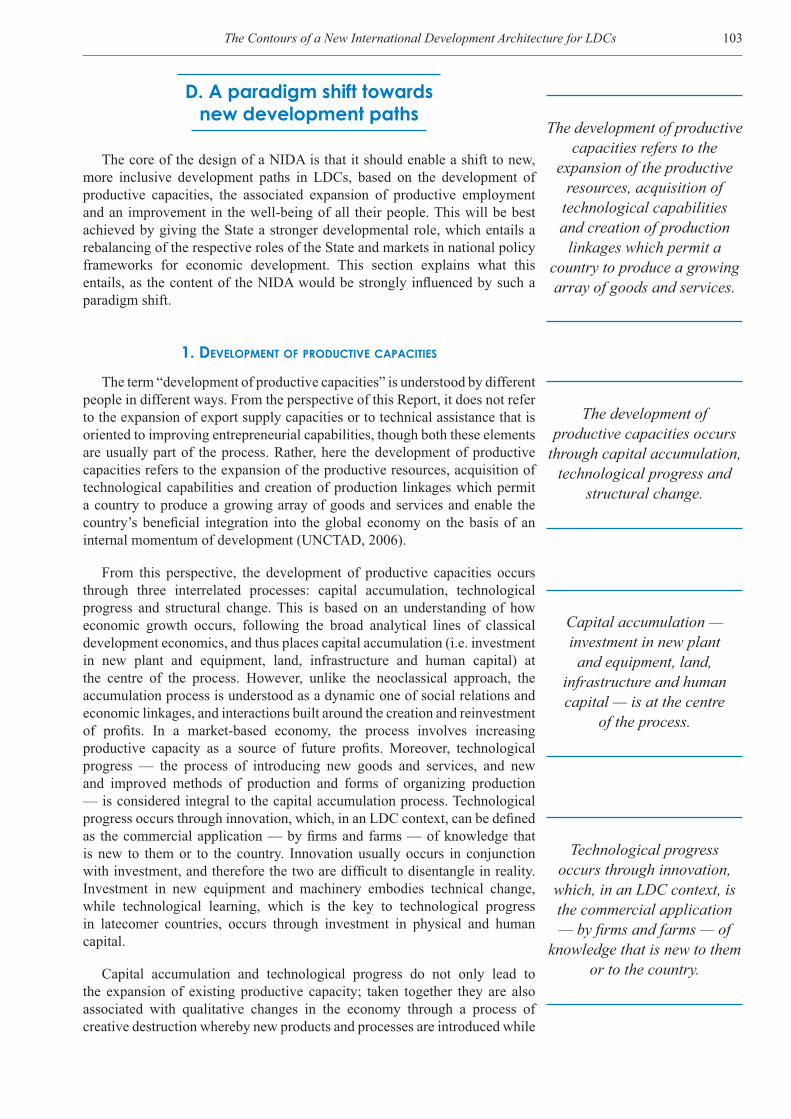
103The Contours of a New International Development Architecture for LDCs
D. A paradigm shift towards new development paths
The core of the design of a NIDA is that it should enable a shift to new, more inclusive development paths in LDCs, based on the development of productive capacities, the associated expansion of productive employment and an improvement in the well-being of all their people. This will be best achieved by giving the State a stronger developmental role, which entails a rebalancing of the respective roles of the State and markets in national policy frameworks for economic development. This section explains what this entails, as the content of the NIDA would be strongly influenced by such a paradigm shift.
1. DEVELOPMENT OF PRODUCTIVE CAPACITIES
The term “development of productive capacities” is understood by different people in different ways. From the perspective of this Report, it does not refer to the expansion of export supply capacities or to technical assistance that is oriented to improving entrepreneurial capabilities, though both these elements are usually part of the process. Rather, here the development of productive capacities refers to the expansion of the productive resources, acquisition of technological capabilities and creation of production linkages which permit a country to produce a growing array of goods and services and enable the country’s beneficial integration into the global economy on the basis of an internal momentum of development (UNCTAD, 2006).
From this perspective, the development of productive capacities occurs through three interrelated processes: capital accumulation, technological progress and structural change. This is based on an understanding of how economic growth occurs, following the broad analytical lines of classical development economics, and thus places capital accumulation (i.e. investment in new plant and equipment, land, infrastructure and human capital) at the centre of the process. However, unlike the neoclassical approach, the accumulation process is understood as a dynamic one of social relations and economic linkages, and interactions built around the creation and reinvestment of profits. In a market-based economy, the process involves increasing productive capacity as a source of future profits. Moreover, technological progress — the process of introducing new goods and services, and new and improved methods of production and forms of organizing production — is considered integral to the capital accumulation process. Technological progress occurs through innovation, which, in an LDC context, can be defined as the commercial application — by firms and farms — of knowledge that is new to them or to the country. Innovation usually occurs in conjunction with investment, and therefore the two are difficult to disentangle in reality. Investment in new equipment and machinery embodies technical change, while technological learning, which is the key to technological progress in latecomer countries, occurs through investment in physical and human capital.
Capital accumulation and technological progress do not only lead to the expansion of existing productive capacity; taken together they are also associated with qualitative changes in the economy through a process of creative destruction whereby new products and processes are introduced while
The development of productive capacities occurs
through capital accumulation, technological progress and
structural change.
Capital accumulation — investment in new plant
and equipment, land, infrastructure and human capital — is at the centre
of the process.
Technological progress occurs through innovation,
which, in an LDC context, is the commercial application — by firms and farms — of
knowledge that is new to them or to the country.
The development of productive capacities refers to the
expansion of the productive resources, acquisition of
technological capabilities and creation of production
linkages which permit a country to produce a growing array of goods and services.

The Least Developed Countries Report 2010104
others decline and disappear. Capital accumulation and technological progress thus drive the process of structural change, in which there is a change in the intersectoral and intrasectoral composition of production and in the pattern of linkages between sectors and segments of the economy. Structural change, in turn, increases the potential of an economy to accelerate capital accumulation and technological progress. This is because there are dynamic products or leading sectors which can induce greater investment and innovation thanks to their productivity growth potential, market demand potential or potential to engender dynamic production linkage effects with other activities and sectors, owing to production complementarities. Historically, the expansion of the scale of manufacturing activities within a national economy has been empirically associated with increased productivity both within the sector itself and in the wider economy. However, in general terms the most important basic feature which distinguishes more dynamic activities is that they are subject to increasing returns to scale rather than decreasing returns to scale.
From the UNCTAD perspective, demand also matters. The sustained development of productive capacities occurs when there is a virtuous circle of cumulative causation in which the development of productive capacities and the growth of demand mutually reinforce each other. Demand growth stems from three sources: domestic consumption, domestic investment and net exports. Exports are particularly important, as both consumer demand and investment demand depend on national income, whereas exports are autonomously determined. Moreover, both investment and consumer demand have an import component, which, without export earnings, would be constrained by the need to ensure balance-of-payments equilibrium. But the importance of exports does not mean that domestic sources of demand should be neglected. A classic study identifying recurrent patterns of economic development found that even in small economies at early stages of development, domestic demand growth was typically the source of over 75 per cent of economic growth (Chenery, Robinson and Syrquin, 1986).
In virtuous cases, a long-term process of economic growth based on the development of productive capacities occurs as a series of cumulative steps whereby a given expansion of output creates the conditions for the further expansion of output. Furthermore, technical progress and growth of new innovations will lead to increases in productivity and creation of new economic activities, which in turn will influence economic growth through increases in incomes of the population and through growth of productivity and employment. As incomes rise, patterns of consumption also change, with a lower demand for food (as a proportion of income) and a higher demand for investment goods. This in turn will stimulate the development of new types of consumer goods, raw materials and machinery. In the course of successive stages of economic transformation of the economy, a change in one direction will make possible complementary developments in another. The application of new techniques of production will in turn lead to a widening market and growing external economies, thereby further fuelling the process of economic transformation. Hence economic transformation is induced by the long-term growth of the economy through a chain of cause and effect movements in the economy.
Such a long-term process of economic growth is the foundation for substantial poverty reduction. This is because, first, the development of the productive base of the economy increases employment opportunities, though the relationship is quite complex owing to the simultaneous creation and destruction of economic activities as well as the trade-off between labour
Capital accumulation and technological progress thus
drive the process of structural change.
When the development of productive capacities and the growth of demand mutually reinforce each other, there is
a virtuous circle of cumulative causation.
Technical progress and growth of new innovations will lead to increases in productivity
and creation of new economic activities.
The development of the productive base of the economy increases
employment opportunities.
105The Contours of a New International Development Architecture for LDCs
productivity growth and employment expansion. Second, the development of productive capacities helps to widen the fiscal base of the State, enabling the provision of public services that underpin human development and also better governance. Human development is an integral part of this process: as public services improve, falling levels of poverty enable more household expenditure on education and health and all kinds of human capacities are improved through the workplace.
2. THE IMPORTANCE OF A DEVELOPMENTAL STATE
Some low-income developing countries have managed to achieve the type of virtuous circle associated with the development of productive capacities described above. They provide important examples of what is possible and how to achieve it. But the development of productive capacities, with the associated expansion of productive employment opportunities and reduction in poverty, is not automatic. Indeed, just as economic transformation is induced through a chain of cause and effect movements in the economy, so also an opposite vicious circle of economic stagnation and mass poverty can occur. They key policy challenge for the LDCs is to find their way out of this vicious circle and the problem of being locked in to commodity dependence and low-skill manufactures, and to promote a virtuous circle of the development of productive capacities.
This Report, as with earlier LDC Reports, adopts the view that meeting this policy challenge requires a reassessment of the current policy framework adopted by the LDCs. There is a need for a strengthened role for the State, involving a rebalancing of the respective roles of the market and the State in the process of economic development. In short, the sustained development of productive capacities through a process of cumulative causation requires a developmental State and an international environment which bolsters the developmental role of the State.
A developmental State may be broadly defined as one which gives top priority to economic development in Government policy and seeks to design policies and institutions that promote this goal with a view to improving the living standards and well-being of the population. In order to develop productive capacities with a view to transforming the economy, accelerated interventions in key areas are necessary. These interventions should be implemented within the broader framework of national development strategies aimed at long-term, equitable and sustainable growth and structural change (UNCTAD, 2009). The immediate priority would be to ensure the sustainability of economic recovery, rising rural productivity and the creation of decent work during a period in which economic growth is likely to be slower than it was before the current crisis.
National Governments, with the full involvement of civil society organizations, and supported by the international community, need to take urgent measures to implement national development strategies that enable accelerated reduction of poverty, inequality and marginalization. This means promoting the fiscal space for delivery of key public services and long-term public investments in infrastructure, agriculture and human skills. It also means re-examining existing macroeconomic frameworks. Macroeconomic policies should not just focus narrowly on stabilizing the economy and curbing inflation; they should also ultimately be supportive of growth of real output and employment. This requires a relaxation of unnecessarily stringent fiscal
Developing productive capacities helps to widen
the fiscal base of the State, enabling the provision of
public services that underpin human development and
better governance.
The sustained development of productive capacities
requires a developmental State and an international
environment which bolsters the developmental role
of the State.
A developmental State may be defined as one which gives
top priority to economic development in Government policy and seeks to design
policies and institutions that promote this goal.
Promoting the fiscal space for delivery of key public
services and long-term public investments in infrastructure, agriculture and human skills
is required.

The Least Developed Countries Report 2010106
and monetary restrictions, and use of countercyclical fiscal and monetary policies to boost employment and incomes in order to reduce poverty and minimizing the impact of external and other shocks. A proactive fiscal policy is a major instrument for the development of productive capacities, for accelerated poverty reduction and for the achievement of the Millennium Development Goals (MDGs). The key fiscal measures that foster growth include maintaining the economy near its potential in the short term and using public sector investment to foster growth by “crowding in” private sector investment. This would require countries to strengthen domestic resource mobilization and adopt mechanisms for countercyclical policy responses.
The development of productive capacities cannot take place in a vacuum; it requires an enabling environment that can create the necessary conditions for the process of structural transformation. In any market-oriented system this requires a process of financial deepening involving the development of an appropriate or suitable financial environment, including a financial infrastructure that enables investments in plants and equipment, new imported technologies, human capital accumulation and the development of productive capacities. In addition, an important objective of public financing for productive development should be to channel resources to productive sectors without compromising financial and macroeconomic stability.
In creating a dynamic business environment, micro-macro interactions have been widely recognized to be the most complex and important of all economic interactions in the areas of investment, production and distribution. While macro influences on microeconomic decision-making are critical, the inverse is just as important. For example, under conditions of persistent macroeconomic instability, there is an aversion to invest in fixed capital. While this underscores the need to ensure that aggregate demand grows steadily over a period of time, it does not guarantee investment or the development of productive capacities. For the latter to occur, the Government should undertake a proactive agricultural policy to boost agricultural productivity and also a proactive industrial policy to channel resources towards industrial development, as part of the larger imperative to create jobs and reduce poverty. The industrial policy should include selective investment financing guided by the State, while a strategic trade policy should complement the industrial policy (UNCTAD 2009: 141–179). A proactive stance by the Government is needed to channel the effects of macro over micro factors in order to strengthen the economy’s productive base. Given that most LDCs have small open economic regimes, this can be a daunting task.
Successful developmental States have also pursued policies of strategic integration with the global economy. That is to say, the timing, speed and sequencing of opening up to the rest of the world have been decided on the basis of how they support national interests in terms of promoting development and poverty reduction. This implies a development-led approach to trade rather than a trade-led approach to development, as well as a gradual approach to trade liberalization and capital-account liberalization. At present, applying the principle of strategic integration in a context where LDCs have already undertaken deep trade liberalization is a complex policy task.
Finally, an important element of the approach of successful developmental States is that they have combined some social policies with structural transformation. In this regard, some developing countries have tried a number of important policy innovations, such as conditional cash transfers, which have proved quite effective in alleviating real misery. Such innovations could also be part of LDCs’ new development strategies for LDCs.
A proactive fiscal policy is a major instrument for the development of productive capacities, for accelerated
poverty reduction and for the achievement of the MDGs.
The industrial policy should include selective investment
financing guided by the State, while a strategic trade policy should complement the
industrial policy.
Successful developmental States have pursued a
development-led approach to trade rather than a trade-led
approach to development.
An important element of the approach of successful
developmental States is that they have combined some
social policies with structural transformation.

107The Contours of a New International Development Architecture for LDCs
All of this does not imply a return to old-style development planning. A basic feature of development governance in successful developmental States has been the adoption of the mixed-economy model which sought to develop policies and institutions that could harness the pursuit of private profit to the achievement of national development objectives. Competent bureaucracies were constructed in a few key strategic agencies, such as planning ministries, and developmental capabilities were built up through a continuous process of learning about which policies worked and which did not. Also, Governments did not devise policies in a top-down fashion, but in close cooperation with the business sector. The whole process was driven by a development- oriented leadership comprising both politicians and bureaucrats, committed to achieving a development vision for society. The power and political legitimacy of this visionary group was rooted in a social contract, in the sense that the aims of the development project were broadly shared within society, thus ensuring social mobilization behind the goals of the project. The risks, costs and benefits of structural transformation were shared amongst the different groups of society, and the pay-off was the opportunity of much higher living standards for future generations.
E. The role of special international support mechanisms for LDCs
1. THE ORIGINAL ROLE
The role of special international support measures for the least developed amongst the developing countries was originally set out by Raúl Prebisch in the Report of the Secretary-General to UNCTAD I, entitled Towards a New Trade Policy for Development (United Nations, 1964). That report identified a set of international trade and development policies to support the achievement of the international development goal of the first United Nations Development Decade: that the developing countries should attain a minimum annual growth rate of 5 per cent. It also highlighted the importance of recognizing “the different situations of developing countries, depending on their degree of development, and to adapt and coordinate the measures adopted so that the advantages derived therefrom accrue in particular to the less advanced amongst the developing countries in order to give strong impetus to their growth” (United Nations, 1964: 62). The idea that special measures be adopted to encourage the exports of the “least developed amongst the developing countries” was discussed in particular as an issue within the design of a general system of preferences for developing countries, which was advocated to help those countries promote exports of manufactures and overcome the limitations of inward-oriented industrialization.
The original case for special international support measures for the LDCs thus involved two steps. There was a case, first, for a concerted implementation of a set of international policies to encourage development in developing countries, and, second, for special treatment in the design of those policies. Such a design could encompass, for example, the allocation of financial assistance, the content of technical assistance, and the coverage and time period of preferences so that the “least developed amongst the developing countries” could derive practical benefits from them. These special measures were thus basically justified on the grounds of fairness and inclusiveness to ensure that all developing countries could benefit from opportunities created
The original case for special international support
measures for the LDCs involved two steps. There was a case, first, for a concerted implementation of a set of international policies to
encourage development in developing countries, and,
second, for special treatment in the design of those policies.
A basic feature of development governance in successful developmental States has been the adoption of the
mixed-economy model which sought to develop policies and institutions that could harness the pursuit of private profit to the achievement of national
development objectives.

The Least Developed Countries Report 2010108
by international policies adopted to support them in their development efforts. It was also stated that “it should not be the objective of any special measures taken in favour of the least advanced developing countries to create discrimination among the developing countries but to ensure due benefits for the least developed among them so that all developing countries can gain equitable benefits” (Resolution 24 II).
Therefore the role of the special measures for LDCs was to address the specific problems which these countries faced. As the report of the first expert group charged to examine special measures for the least developed amongst the developing countries stated, “to be meaningful any special measures to be recommended should be related to one or more of the specific problems confronted by these countries” (UNCTAD, 1969: 5). In general terms, these problems were initially identified as being related to the very early stages of economic and social development of these countries. They suggested a number of structural weaknesses, along with low per capita income and low domestic savings, namely:
• Low labour productivity, especially in agriculture;
• Scarcity of skilled manpower and technical and managerial cadres to carry out the essential tasks in promoting development;
• Lack of knowledge of national natural resource potentials;
• Low level of economic infrastructure;
• Dependence on a narrow range of primary commodities;
• Lack of industrialization; and
• Weak financial systems.
The expert group recommended that “[T]he special measures to be recommended in favour of the least developed countries should be designed to eliminate or at least to attenuate these basic characteristics or weaknesses” (UNCTAD, 1969: 6).
2. REAFFIRMING THE ROLE OF INTERNATIONAL SUPPORT MECHANISMS
The basic role of special international support mechanisms in favour of the LDCs at present is the same as originally advocated. LDCs continue to have structural weaknesses which cause slower development and poverty reduction than in other developing countries, including other low-income developing countries. Thus the role of the special mechanisms would be to address these structural weaknesses. However, the nature and importance of particular structural weaknesses has been changing with globalization, and there are also new structural vulnerabilities associated with emerging international issues such as climate change. Also, there are now new agreed international development goals, in particular focusing on poverty reduction and the achievement of human development in the context of the MDGs. The role of ISMs has been shifting in line with these new goals.
(a) Structural weaknesses and vulnerabilities of LDCs
The problem of the marginalization of LDCs in the global economy remains acute, though its sources are shifting. As shown in chapter 1 of this Report, the average GDP per capita of LDCs as a group declined from 1970 until 1994, but it stabilized in the second half of the 1990s and has been increasing
The role of the special measures for LDCs was to
address the specific problems which these countries faced, which were related to their
very early stages of economic and social development.
The basic role of special international support
mechanisms in favour of the LDCs at present is the same
as originally advocated...
... However, the nature and importance of particular
structural weaknesses has been changing with globalization, and there are also new structural
vulnerabilities associated with emerging international issues
such as climate change.

109The Contours of a New International Development Architecture for LDCs
since 2000. The overall result of these trends is that there has been no income convergence of LDCs with other developing countries or with advanced economies over the whole period between 1970 and 2008. Moreover, despite the positive trend since 2000, other developing countries also grew more rapidly during this period, and thus LDCs still continued to diverge from other developing countries. The productivity gap widened during the boom years.
The weak long-term economic performance of the LDCs and overall lack of convergence of these countries with the more advanced developing countries can be attributed to some form of underdevelopment trap. The nature of this trap has been specified in different ways by different analysts (for example, UNCTAD, 2002; Collier, 2007; and Guillaumont, 2010), but both UNCTAD (2002) and Guillaumont (2010) emphasize the significance of structural constraints. According to UNCTAD, these are related to the form of integration into the global economy, particularly associated with the interaction between commodity dependence and mass poverty, but also with the lack of structural transformation. Weak governance is associated with the very low per capita incomes of LDCs but has been accentuated by past policies. Guillaumont (2010) sees the divergence of LDCs as being related to their low human resource assets and also to their structural vulnerability and weak resilience to shocks.
The originally identified structural weaknesses of LDCs and the related role of ISMs were defined before the surge in the globalization of production and finance since the 1980s. While these weaknesses are still related to internal conditions (such as the lack of infrastructure and low levels of human capital), they have been reinforced by the closer integration of LDCs into the global economy. Low-productivity agriculture still remains the main source of livelihood for most people in LDCs, just as it was 30 years ago. Still, there is an accelerating process of urbanization, with more and more people seeking work in sectors other than agriculture. Rapid rates of population growth and a very youthful population structure means that the LDCs will be confronted with a massive employment challenge in the coming years, which will need to be addressed in the context of LDCs’ generally open economies and greater competition with other countries. Costs of production may be low, but labour productivity is also pitifully low, as most workers earn their living in informal economic activities using their raw labour, with rudimentary tools and equipment, little education and training and poor infrastructure. Meeting the employment challenge should therefore be seen as a major priority for the coming decade.
The LDCs’ rapid insertion into the global economy since the 1980s has become a major source of instability for these economies, especially in the areas of finance and trade. This has locked them into a vicious cycle or a low-equilibrium poverty trap characterized by low productive capacities, low domestic resource mobilization and low technological capacity to respond. The incentive structure in these countries is oriented towards short-term profits, closely associated with the boom-bust nature of their growth experiences. Additionally, their increasing dependence on aid for growth continues to pose major challenges to their ability to autonomously devised policy responses to the latest economic and financial crisis and for their long-term development. The combination of internal and external impediments prevents most LDCs from responding appropriately to various development challenges, and thus they remain vulnerable to major external shocks.
The weak long-term economic performance of the LDCs and their
overall lack of convergence with the more advanced
developing countries can be attributed to some form of underdevelopment trap.
Structural constraints are related to the form of
integration into the global economy, particularly
associated with the interaction between commodity
dependence, mass poverty, and lack of structural
transformation.
The LDCs’ rapid insertion into the global economy since the 1980s has become a major source of instability for these economies, especially in the areas of finance and trade.
The Least Developed Countries Report 2010110
(b) New international development goals
Special ISMs for the LDCs should not be seen as acts of charity. Rather, accelerating development and poverty reduction in the LDCs should be seen as being in the mutual interests of the LDCs, other developing countries and developed countries. This mutual interest partly arises from the economic interdependence of countries, but it is also related to the common purpose of achieving new international development goals, in particular the MDGs.
The three main ways in which development in the LDCs can benefit other developing countries and developed countries are the availability of untapped natural resources, domestic markets which could grow significantly and the creative potential of LDCs’ youthful populations. The abundant natural resources in the LDCs are already being exploited, but one feature of their LDC status is the lack of knowledge of their available natural assets. With regard to their markets, accelerated development and exports of the LDCs increases their import capacity and thus enables other countries to boost their own exports in a global expansion of international trade. Finally, a key resource of the LDCs is the creativity of their populations. At present, 60 per cent of their population is under 25 years old. Productive employment of this segment of their populations would provide a massive demographic dividend. Conversely, their lack of employment presents a huge burden, not to mention the waste of the creative potential of these people if they are forced to live from hand to mouth to survive. The rapidly growing population of the LDCs, which is expected to exceed one billion people in 2017, means that together they will have an increasing impact on international economic interdependence in spite of their very low per capita incomes.
The economic development of the LDCs can be understood as a global public good because it contributes to the elimination of certain global public bads. If improvements to public health continue to progress only very slowly, the LDCs could become reservoirs for internationally communicable diseases owing to their continued economic underdevelopment. During the past decade, LDCs have had to cope with various complex humanitarian emergencies, associated with social conflicts and natural disasters. These emergencies are both a product and a cause of persistent underdevelopment, and they will recur in the coming decade unless these countries can accelerate their development. The governance challenge which LDCs face is also an important issue. This is intimately linked to the problem of preserving peace and security in the world. Governance failures are usually seen as an internal issue related to the wrong choice of policies, weak institutions and poor leadership. But in practice, as argued in the LDC Report 2009, the GDP per capita of LDCs is so low that it is difficult for them to mobilize sufficient government revenues in absolute terms to provide the necessary basic services of a modern State. The national governance problem in LDCs is thus real, but it is very difficult to resolve without economic development and without increasing the fiscal resource base of their Governments.
Finally, the case for special international support for the LDCs must be seen within the context of achieving recently agreed international development goals, in particular the MDGs. As indicated in chapter 1 of this Report, despite some progress, most LDCs are off-track to achieve many MDGs by 2015, and can only hope to achieve these goals through major concerted international support efforts. If the relatively slow rates of poverty reduction are allowed to continue, and other developing countries continue to do well, the LDCs will at some point in the future become the major locus of extreme poverty in the world.
Accelerating development and poverty reduction in the LDCs should be seen as being in the mutual interests of the LDCs, other developing countries and developed countries.
The rapidly growing population of the LDCs,
which is expected to exceed one billion people in 2017,
means that together they will have an increasing impact on international economic interdependence in spite of their very low per capita
incomes.
The national governance problem in LDCs is real,
but is very difficult to resolve without economic development and without
increasing the fiscal resource base of their Governments.
The case for special international support for the
LDCs must be seen within the context of achieving
recently agreed international development goals, in particular the MDGs.

111The Contours of a New International Development Architecture for LDCs
3. AVOIDING THE SUBSTITUTION OF ISMS FOR GLOBAL ECONOMIC REFORMS
A key feature of the new architecture being proposed for LDCs is an integrated policy approach which embeds ISMs targeted at LDCs within both global economic regimes and South-South cooperation. Some might argue that with the increasing differentiation of the world economy, the development dimension of global economic regimes should be focused exclusively on the poorest countries, particularly the LDCs. Collier (2007), for example, argues that the core development challenge of the new millennium is the failure of the growth process in the poorest countries in the world, and that if nothing is done to rectify this, these countries “will gradually diverge from the rest of the world economy over the next couple of decades, forming a ghetto of misery and discontent” (Collier, 2007: xi). He believes the solution to this problem is that the geographical scope of international development assistance, more broadly conceived than ODA, should be focused on the poorest countries. But this approach seems analytically flawed (Gore, 2010) and is rejected here, as there are major dangers in treating international support mechanisms for LDCs as a substitute for systemic reforms.
Treating ISMs as substitutes would have unintended effects. First, it is clear from the experience of the past 30 years that the problem is not simply the weak growth performance of the poorest countries, but also the fact that some developing countries that are a little more advanced than the LDCs have experienced growth failures and collapses which have pushed them down into the LDC group. Second, it is necessary to see the global development process in dynamic terms. If the more advanced developing countries find it difficult to deepen their industrialization and move up the technological ladder, shifting away from the production of the simple products that are also being exported by the poorer countries, it will be difficult for the poorest countries to develop. As noted in the LDC Report 2002: “To the extent that the more advanced developing countries meet a glass ceiling which blocks their development, there will be increasing competition between the LDCs and other developing countries” (p.162). In this situation, special ISMs for the LDCs could accelerate the graduation of some of these countries out of the LDC category. But at the same time, one might expect some of the other developing countries that are just above the LDC threshold to experience weak economic performance or growth and possibly enter the LDC category or reach structural economic conditions similar to those of LDCs. Thus some countries would get richer and others poorer. This means that, although the special measures could provide benefits for some LDCs, globally the exercise would be fruitless.
What is needed is a mix of more developmental and coherent global economic regimes for all developing countries, including LDCs, along with special measures targeted to address the specific handicaps and vulnerabilities of the LDCs. As more advanced developing countries move up the development ladder, LDCs could move into producing products which formerly were, but which can no longer be, competitively produced by these more advanced developing countries. Moreover, the whole process should be facilitated by South-South development cooperation, which reinforces the mutually supportive economic relationships between the more advanced and the least developed developing countries. A good example is China’s plan to build special processing zones in Zambia and Ethiopia and move labour-intensive manufacturing activities into these countries. This could potentially generate productive employment, transfer skills and technology and also generate broader technological learning and export opportunities.
There are major dangers in treating international support
mechanisms for LDCs as a substitute for systemic
reforms.
If the more advanced developing countries find it difficult to deepen their
industrialization and move up the technological ladder, it will be difficult for the poorest
countries to develop.
What is needed is a mix of more developmental and coherent global economic regimes for all developing countries, including LDCs, along with special measures
targeted to address the specific handicaps and
vulnerabilities of the LDCs.

The Least Developed Countries Report 2010112
F. Conclusions
The basic message of this chapter is that accelerating development and poverty reduction in the LDCs will require not simply better LDC-specific ISMs, but rather a new international development architecture (NIDA) for the LDCs. Existing LDC-specific support measures work within a more general framework of rules, norms, understandings and practices which guides the international economic relations of all developing countries, including LDCs and sub-categories of countries that largely overlap with the LDCs, such as low-income countries. Given the weaknesses in the design and implementation of current LDC-specific international support measures, these general regimes actually have a greater impact on development and poverty reduction in the LDCs than the special measures. A NIDA for the LDCs should be constituted through reforms of those aspects of the global economic regimes that are directly relevant for the LDCs, as well as through the design of a new generation of special ISMs for the LDCs that would aim at developing their productive capacities. With the increasing importance of South-South flows of trade, FDI, official finance and knowledge, South-South development cooperation — both within regions and between LDCs and large, fast-growing developing countries — should play an important role in a NIDA for LDCs. Such cooperation should also include some LDC-specific support mechanisms.
The term “mechanism” is used here, rather than “measure”, to convey the idea that effective LDC-specific affirmative action is not only a matter of designing policy measures; it also implies the deployment of resources, institutions and organizational entities to ensure maximum effectiveness in the implementation of those measures. The chapter rejects the idea that LDC-specific ISMs can be considered a substitute for systemic reforms in areas relevant to LDCs. It also rejects the idea that all development cooperation should be focused on the LDCs or the poorest countries in the global economy. Such an approach would be counterproductive, because while some LDCs are likely to graduate from the LDC category, other developing countries, in the absence of development assistance, could fall into that category. In addition, the potential dynamic complementarities between LDCs and the more advanced developing countries would not be exploited. Thus, a new generation of ISMs for the LDCs will be effective only if they are embedded within a more general set of systemic reforms.
The current approach to international support for LDCs focuses mainly on international trade, whereas this chapter identifies five major pillars for the proposed NIDA: finance (including domestic resource mobilization, private capital flows, aid and debt relief), trade, technology, commodities and climate change adaptation and mitigation. Systemic reforms, LDC-specific ISMs and South-South development cooperation are necessary in each of these pillars.
The chapter sets out eight principles which should inform the design of the NIDA: (i) promoting new development paths, (ii) fostering country ownership, (iii) facilitating strategic integration into the global economy, (iv) increasing the developmental role of the State, (v) reducing aid dependence, (vi) promoting policy coherence between the different pillars of the NIDA, and between systemic reforms and LDC-specific ISMs, (vii) supporting South-South cooperation as a complement to North-South cooperation, and (viii) giving greater voice and representation to LDCs in the global system of governance.
Accelerating development and poverty reduction in the LDCs will require not simply better LDC-specific ISMs, but
rather a new international development architecture
(NIDA).
A NIDA for the LDCs should be constituted through reforms of those aspects of the global
economic regimes that are directly relevant for the LDCs and through the design of a new generation of special
ISMs for the LDCs.
A new generation of ISMs for the LDCs will be effective only if they are embedded within a more general set of systemic
reforms.
113The Contours of a New International Development Architecture for LDCs
Most fundamentally, the content of the NIDA should enable a shift to new, more inclusive development paths in LDCs, based on the development of their productive capacities, an associated expansion of productive employment and an improvement in the well-being of all their people. This will be best achieved by giving the State a stronger developmental role, which entails a rebalancing of the respective roles of the State and markets in national policy frameworks for economic development. The NIDA should facilitate this paradigm shift. Finally, the NIDA for LDCs should be part of a broader set of systemic reforms, away from business as usual, which need to be taken in response to the financial crisis and global recession, and which would be beneficial for all countries, both developed and developing.
Notes1 The Paris process was launched with the adoption of the Paris Declaration on Aid Effectiveness
in March 2005 and brings together aid donor and recipient countries.2 See, for example, Shafaeddin, 2005; Ocampo and Vos, 2008; Sundaram and von Arnim,
2008.3 Prior to the inception of the TRIPS Agreement, in 1994, a large number of developing
and least developed countries did not provide the same standards of IPR protection as required by the Agreement. The patent protection terms were much shorter than the 20 years mandated by the Agreement. National patent laws also contained several provisions that were subsequently disallowed under the TRIPS Agreement, such as the “working” requirement, which mandated that inventions be produced domestically in order to qualify for the granting of a patent.
4 The lack of technical assistance to help for countries implement pro-development IPR strategies has been discussed at length in the literature. See, for example, Kostecki, 2006; and Roffe et al., 2007.
ReferencesAmsden AH and Chu WW (2003). Beyond Late Development: Taiwan’s Upgrading Policies.
Cambridge, MA, MIT Press. Chen Y and Puttitanun T (2005). Intellectual property rights and innovation in developing
countries. Journal of Development Economics, 78(2): 474–493.Chenery H, Robinson S and Syrquin M, eds. (1986). Industrialization and Growth: A Comparative
Study. New York and Oxford, Oxford University Press.Cohen WM and Levinthal DA (1990). Absorptive capacity: A new perspective on learning and
innovation. Administrative Science Quarterly, 35(1): 128–152.Collier P (2007). The Bottom Billion: Why the Poorest Countries are Falling Behind and What
Can Be Done About It. Oxford, Oxford University Press.Edwin L, Lai C and Qiu LD (2003). The North’s intellectual property standard for the South.
Journal of International Economics, 59(1): 183–209, January.Foray D (1995). Knowledge distribution and the institutional infrastructure: The role of intellectual
property rights. In: Albach H and Rosenkrantz S, eds., Intellectual Property Rights and Global Competition: Towards a New Synthesis. Berlin, WZB Publications: 77–118.
Gore C (2010). ‘The Bottom Billion’: A critique and alternative view. In: Nissanke M and Mavrotas G, eds., Commodities, Governance and Economic Development under Globalization. London, Palgrave Macmillan: 269–300.
Guillaumont P (2010). Caught in a Trap. Identifying the Least Developed Countries. Paris, Economica.
Ho S (1997). Technology transfer to China during the 1980s: How effective? Some evidence from Jiangsu. Pacific Affairs, 70(1): 85–106.
IOM (2010). Mainstreaming migration, development and remittances in the LDC post-Brussels Plan of Action. Background paper for the Migration and Development series seminar: Migration, Development and Remittances in the LDCs Context – An LDC IV Preparatory Event, New York, 17 June 2010. Geneva, International Organization for Migration. Available at: http://www.unitar.org/ny/sites/unitar.org.ny/files/plugin-Background%20paper%20LDC-IV%20preconference.pdf.
Kanwar S and Evenson RE (2001). Does intellectual property protection spur technological change? Center Discussion Paper, No. 831. New Haven, CT, Economic Growth Center, Yale University.
The NIDA for LDCs should be part of a broader set of
systemic reforms, which need to be taken in response to the
financial crisis and global recession, and which would
be beneficial for all countries, both developed and developing.

The Least Developed Countries Report 2010114
Kostecki M (2006). Intellectual property and economic development: What technical assistance to redress the balance in favour of developing nations? ICTSD Issue Paper No. 14. Geneva, International Centre for Trade and Sustainable Development.
Maizels A (1992). Commodities in Crisis: The Commodity Crisis of the 1980s and the Political Economy of International Commodity Policies. Oxford, Oxford University Press.
Maskus K (2000). Intellectual Property Rights in a Global Economy. Washington, DC, Institute for International Economics.
Mokyr J (2003). Long-term economic growth and the history of technology. In: Aghion P and Durlauf S, eds., Handbook of Economic Growth, vol.1B. North-Holland, Elsevier: 1113–1180.
Nelson RR (1990). Capitalism as an engine of progress. Research Policy, 19(3): 193–214, June.
Ocampo JA and Vos R (2008). Uneven Economic Development. London, Zed Books.Parello CP (2008). A North–South model of intellectual property rights protection and skill
accumulation. Journal of Development Economics, 85(1–2): 253–281.Roffe P, Vivas D and Vea G (2007). Maintaining policy space for development: A case study on
IP technical assistance in FTAs. ICTSD Programme on IPR and Sustainable Development, Issue Paper No.19. Geneva, International Centre for Trade and Sustainable Development.
Sakbani M (2005). The global economic system: asymmetries and inconsistencies. Foresight, 7(1): 11–25.
Shafaeddin, SM (2005). Trade liberalization and economic reform in developing countries: Structural change or de-industrialization? UNCTAD Discussion Papers, No.179. Geneva, United Nations Conference on Trade and Development.
Sundaram JK and von Arnim R (2008). Economic liberalization and constraints to development in Sub-Saharan Africa. DESA Working Paper, No.67. New York, United Nations.
UNCTAD (1969). Report of the first Expert Group charged to examine ‘Special measures for the least developed amongst the developing countries’. Geneva, United Nations Conference on Trade and Development.
UNCTAD (2000). The Least Developed Countries Report 2000: Aid, Private Capital Flows and External Debt: The Challenge of Financing Development in LDCs. United Nations publication, sales no. E.00.II.D.21. New York and Geneva, United Nations Conference on Trade and Development.
UNCTAD (2002). The Least Developed Countries Report 2002: Escaping the Poverty Trap. United Nations publication, sales no. E.02.II.D.13. New York and Geneva, United Nations Conference on Trade and Development.
UNCTAD (2004). The Least Developed Countries Report 2004: Linking International Trade with Poverty Reduction. United Nations publication, sales no. E.04.II.D.27. New York and Geneva, United Nations Conference on Trade and Development.
UNCTAD (2006). The Least Developed Countries Report 2006: Developing Productive Capacities. United Nations publication, sales no. E.06.II.D.9. New York and Geneva, United Nations Conference on Trade and Development.
UNCTAD (2007). The Least Developed Countries Report 2007: Knowledge, Technological Learning and Innovation for Development. United Nations publication, sales no. E.07.II.D.8. New York and Geneva, United Nations Conference on Trade and Development.
UNCTAD (2008). The Least Developed Countries Report 2008: Growth, Poverty and the Terms of Development Partnership. United Nations publication, sales no. E.08.II.D.20. New York and Geneva, United Nations Conference on Trade and Development.
UNCTAD (2009). The Least Developed Countries Report 2009: The State and Development Governance. United Nations publication, sales no. E.09.II.D.9. New York and Geneva, United Nations Conference on Trade and Development.
United Nations (1964). Towards a new trade policy for development. Report of the Secretary-General to UNCTAD I. New York, United Nations.
Weeks J (2010). Enabling recovery and macro stability. Study prepared for UNCTAD as a background document to The Least Developed Countries Report 2010. Geneva, United Nations Conference on Trade and Development.

Chapter
4The Coming Decade and an Agenda for Action to Create a NIDA for LDCs
A. Introduction
This chapter seeks to provide concrete content to the new international development architecture (NIDA) for the LDCs. Its mechanisms should be forward-looking and attuned to possible trends over the coming decade. With this in mind, section B presents some economic scenarios for LDCs in the decade 2011–2020 using the Global Policy Model developed by the United Nations Department of Economic and Social Affairs (UN-DESA), and it presents policy simulations which indicate the feasibility and relative effectiveness of different development strategies. These include development strategies which increase government spending on infrastructure investment, export promotion and the development of productive capacities of the LDCs through the realization of an export-investment nexus. The model is based on historical relationships, but there will certainly be new international factors that will affect the prospects for development and poverty reduction in the LDCs. Section C describes two of these factors: (i) climate change, and (ii) increasing economic relationships between LDCs and other developing countries (ODCs). Finally, section D outlines major elements of an agenda for action to create a NIDA for the LDCs in the areas of finance, trade, commodities, technology and climate change. It recommends a number of specific international actions for reform of the global economic regimes and of South-South development cooperation in ways that are particularly relevant for LDCs and proposes international support mechanisms (ISMs) specifically targeted at LDCs. These elements of a positive agenda to improve the situation of the LDCs could be taken up within the negotiation processes around the Fourth United Nations Conference for LDCs to be held in Istanbul from 29 May to 3 June 2011. The final three chapters of this Report elaborate on this agenda for action in more detail.
B. Global scenarios for 2011–2020 and policy simulations for LDCs
The Global Policy Model (GPM) has been developed for UN-DESA as a tool for investigating alternative policy scenarios for the world economy. It traces the impacts of trends, shocks and policy responses over short-, medium- and long-term timescales. The model enables globally consistent economic projections for the world economy and for groups of countries within it, and an examination of the impacts of economic shocks, such as delayed recovery from a crisis, as well as the outcomes of some basic macroeconomic policy scenarios. It has been adopted by UNCTAD specifically for the purpose of this Report to provide more detailed information on the LDCs. The model, based on historical data from 1970 to 2008 for 129 countries, provides consistent annual time series of national accounts, balance of payments and external positions, trade by broad commodity groups, interest rates and exchange
NIDA should be forward-looking and attuned to possible trends over the
coming decade.
New international factors that will affect the prospects for development and poverty
reduction in the LDCs are climate change, and
increasing economic relations between LDCs and other
developing countries.

The Least Developed Countries Report 2010116
rates, inflation, government debt, exchange reserves and other bank assets and liabilities, and energy production. For modelling purposes, individual countries are aggregated into blocs (country groups) defined by world regions, income levels and other economic or institutional characteristics.1
The model has thus far not identified LDCs as a separate group. But for this Report and on the initiative of UNCTAD data were compiled on LDCs and disaggregated into four groups: African energy exporters, Bangladesh, other Asian and Pacific LDCs and other African LDCs plus Haiti, thereby allowing the simulation of LDC-specific policy scenarios (Cripps, 2010).
Economic behaviour in the model is determined by reaction functions representing common or normal adjustment processes that are broadly consistent with recorded annual movements of macroeconomic variables in recent decades. The model is regular in the sense that it uses the same equation structure for each bloc. Values of reaction coefficients or elasticities are in most cases based on panel estimations as the equations are intended to “explain” differences between blocs as well as movements through time. Differences between blocs are reflected in their “fixed effect” factors and attributed to their initial conditions, and to long-term factors including geographical position. More immediate effects of differences or changes in institutions and policies are captured as time-varying residuals. The model is calibrated for each country or bloc with econometric panel regressions using annual data from 1980 to 2008.
Any number of scenarios may then be defined and simulated as a basis for examining how changes in institutions, policies, rules, expectations and confidence factors are likely to impact the bloc where they occur and spill over to other blocs and the world economy as a whole. Projections and scenarios can be devised, based on these economic relationships and assumptions, showing how different kinds of policies could affect the variables. Global outcomes and outcomes in specific country groups incorporate the interdependence between different groups, including spillover effects of economic policies and potential benefits from cooperation.
The GPM assumes that economies are typically demand-driven systems in the short term, but supply constraints may become binding, depending on natural resources availability and financing constraints on investment, which may hamper technological progress and the expansion of productive capacities. Countries and country blocs interact via their external accounts and their contribution to the determination of international prices. The main groups of variables defined for each bloc are as follows: (i) national income and population, (ii) government accounts, (iii) private income, expenditure, capital and wealth, (iv) monetary policy and assets and liabilities of the banking system, (v) exchange rates, reserves and external assets and liabilities, (vi) inflation and capacity utilization, (vii) current account of the balance of payments, (viii) trade in goods and services by commodity group, and (ix) production and use of primary energy. Aggregate demand components such as domestic consumption, investment, public expenditure and net exports contribute to income growth, while they impact and are shaped by the current account, international prices, exchange rates, inflation and changes in external assets and liabilities. Therefore, while any source of aggregate demand can be an important factor for GDP growth in the short run, a strong net exports dynamic is key to strengthening external balances and contributing to sustained growth in the longer run. Investment and exports are naturally linked via their interaction on income and aggregate demand. However, alternative policies
The GPM was adapted for the first time to identify LDCs
as a separate group; they were then disaggregated into four groups: African energy exporters, Bangladesh, other Asian and Pacific LDCs and
other African LDCs plus Haiti.
Investment and exports are naturally linked in the GPM via their interaction on income and aggregate
demand.
The Global Policy Model (GPM) presents policy
simulations for 2011–2020 which indicate the feasibility
and relative effectiveness of different development
strategies.

117The Coming Decade and an Agenda for Action to Create a NIDA for LDCs
that promote investment and exports can have different impacts on supply, the demand structure of trade and international financial positions.
As mentioned, the model allows for dynamic resource constrains to emerge which interact with demand in shaping internal and international prices. International prices, such as the oil price, are driven by supply trends and global demand. In the case of energy, an increasing supply/demand elasticity response is assumed when oil prices increase in real terms beyond the current level. Productive capacity responds to aggregate demand with a time lag. The growth rate is endogenous, and can be pushed up if demand expands at a higher rate without generating unsustainable domestic or external deficits, albeit at the cost of increased inflation while supply adjusts. Implicitly, investment and restructuring allow faster growth of output per person employed in the economy as a whole even if the labour force is static.
Table 19 shows the income per capita of these groups of countries in 1970 and 2008, and the scale of the income gap between LDCs and other developing and developed countries, and also the tendency of this gap to widen. Table 20 shows the sources of foreign exchange of the LDCs in 2008, indicating the differences in the extent of integration of each of these groups into the global economy. This highlights the fact that the lack of foreign exchange is one of the most binding constraints on LDCs’ progressive accumulation of capital and on their current production activity and consumption expenditure. Sources of foreign exchange are extremely limited in most LDCs. African energy exporters earn $569 per capita per year in foreign exchange, which is comparable to other low-income countries that are not LDCs. But all other LDCs earn little more than $100 per capita per year in foreign exchange. In the case of non-energy African LDCs a major component of foreign exchange earnings in 2008 was foreign capital inflow, without which their foreign exchange earnings would have been less than $90 per capita. Although LDCs are highly commodity-dependent, the scale of commodity exports in
Table 19Per capita income for high-, middle- and low-income blocs, 1970 and 2008
2008 population (million)
National income per person ($ PPP)
1970 2008 % increase
World total 6 746 4 351 8 561 97LDCs
African energy exporters 94 1 343 2 313 72Bangladesh 160 909 1 276 40Other Asian LDCs 127 1 033 1 155 12Other African LDCs 421 907 792 -13
Other low-income blocsChina 1 315 301 4 911 1 531South Asia 1 378 733 2 461 236East Asia low ncome 352 858 2 771 223Other Africa 329 2 176 2 859 31
Middle-income blocsCIS and other 284 5 595 10 315 84West Asia and North Africa 414 3 457 9 589 177Latin America 571 5 037 9 229 83East Asia middle income 184 1 174 5 418 362
High-income blocsUSA 316 18 434 36 846 100Europe 524 11 235 24 460 118Japan 127 12 252 27 418 124Other developed 148 8 365 26 781 220
Source: Cripps, 2010, based on the database of the UN-DESA Global Policy Model.
The lack of foreign exchange is one of the most binding
constraints on LDCs’ progressive accumulation of capital and on their current
production and consumption.

The Least Developed Countries Report 2010118
per capita terms is actually much lower than for other developing-country groups. No LDC features as a significant exporter of services or primary commodities other than energy. The inflow of income and transfers, including workers’ remittances and all types of foreign aid, was between $20 and $50 per capita in 2008. In the same year the foreign exchange receipts per capita of the world’s middle-income groups were $1,500 to $2,000 and those of the high-income groups were upwards of $5,000 per capita. The very low level of exports and inward remittances undoubtedly presents a major obstacle for development policies in LDCs.
The rest of this section summarizes the results of the GPM for the four groups of LDCs, using a baseline scenario which assumes a rather optimistic view of global economic growth, and also for four different policy scenarios which are designed to achieve accelerated economic growth in the LDCs. A stress test which assumes a delayed recovery from the global financial crisis and recession is also undertaken to determine the sensitivity of the outcomes to slower growth in the global economy.
1. BASELINE PROJECTIONS
The baseline projection presents an optimistic view of global developments in the coming decade as compared with the protracted recovery expected in most global economic forecasts at present (United Nations, 2010). The optimistic outlook should provide an opportunity for substantial improvements in LDCs. It shows the annual global population growth rate declining slowly to 1 per cent, while annual per capita income grows at around 4 per cent, implying a 50 per cent cumulative increase in the world as a whole over the 2011–2020 decade. Although government debt in the world as a whole is estimated to have increased to 68 per cent of global GDP in 2010, and may increase further in the next year or two, the resumption of fairly rapid economic growth is projected to result in lower fiscal deficits and falling ratios of debt to GDP
Table 20Sources of foreign exchange, 2008
(Dollars per capita)
Primary commoditiesexcluding energy Energy Manufactures Services
LDCsAfrican energy exporters 11 517 12 29Bangladesh 8 0 54 7Other Asian LDCs 26 16 40 24Other African LDCs 28 3 21 18
Other low-income blocsChina 26 15 749 86South Asia 18 17 73 51East Asia low income 107 89 218 55Other Africa 91 270 161 61
Middle-income blocsCIS and other 175 1 185 467 235West Asia and North Africa 85 1 500 559 285Latin America 321 274 555 145East Asia middle income 308 272 1 227 296
High-income blocsUSA 428 144 2 516 1 257Europe 888 633 6 957 2 535Japan 76 50 3 914 766Other developed 1 036 1 416 7 878 2 010
Source: Cripps, 2010, based on the database of the UN-DESA Global Policy Model.
The very low level of exports and inward remittances
undoubtedly presents a major obstacle for development
policies in LDCs.
The baseline projection presents an optimistic view
of global developments in the coming decade which should
provide an opportunity for substantial improvements
in LDCs.

119The Coming Decade and an Agenda for Action to Create a NIDA for LDCs
thereafter, bringing the global average ratio of government debt to GDP to less than 50 per cent in 2020, without any special measures to cut government spending or increase taxes. The prices of primary commodities and oil and exports of manufactures have risen relative to domestic expenditure, and growth of world trade as a whole is slower than in previous decades. Energy efficiency, as measured by energy use per constant PPP dollars of GDP, is expected to improve by about 3 per cent per year. Total primary energy production (measured in billion tons of oil-equivalent) should increase at the same rate as in the past (i.e. about 2 per cent annually). Prices of oil and primary commodities relative to prices of goods and services in general are projected to rise significantly, by 34 per cent and 23 per cent, respectively, over the decade. World markets for commodities and services are projected as being consistent with what happened before 2000 but not as buoyant as 2000–2008.
Table 21 summarizes the baseline projections for LDCs, assuming the global context outlined above and development policies similar to those followed in the past. Per capita exports of African energy exporters and Bangladesh are projected to grow as fast, or faster, than in other parts of the world, permitting per capita income to grow at an average annual rate of about 5 per cent, which is significantly faster than the rate of growth expected in high-income countries. For the African energy exporters this reflects projections of higher
Table 21Baseline projections for LDCs: population, income and exports per capita, 2010–2020
Values in: Average annual growth rate (%)
2000 2010 2015 2020 2001–2010 2011–2015 2016–2020
African energy exportersPopulation (millions) 76 99 110 121 3 2 2Income per capita (PPP dollars) 1 309 2 169 2 630 3 363 5 4 5Exports per capita (dollars) 206 476 651 906 9 7 7
Primary commodities 14 10 14 21 -3 6 9 Energy products 168 428 583 806 10 6 7 Manufactures 17 10 11 10 -5 2 -1 Services 8 28 43 68 13 9 10
BangladeshPopulation (millions) 141 164 175 184 2 1 1Income per capita (PPP dollars) 886 1 361 1 791 2 333 4 6 5Exports per capita (dollars) 45 66 82 100 4 5 4
Primary commodities 4 8 10 13 8 4 6 Energy products 0 0 1 1 ... ... 3 Manufactures 36 49 59 67 3 4 3 Services 5 8 13 19 5 9 8
Other Asian LDCsPopulation (millions) 111 132 145 159 2 2 2Income per capita (PPP dollars) 683 1 228 1 402 1 687 6 3 4Exports per capita (dollars) 69 92 96 103 3 1 2
Primary commodities 17 25 22 21 4 -2 -1 Energy products 3 10 9 9 11 -2 1 Manufactures 28 34 40 47 2 3 3 Services 20 24 25 26 2 1 1
Other African LDCsPopulation (millions) 337 445 507 571 3 3 2Income per capita (PPP dollars) 625 820 817 850 3 0 1Exports per capita (dollars) 37 60 58 59 5 -1 0
Primary commodities 17 23 21 21 3 -1 -1 Energy products 1 3 5 6 11 10 2 Manufactures 8 16 15 17 7 -1 3 Services 11 18 17 15 5 -2 -1
Source: UN-DESA Global Policy Model simulations analysed and reported in Cripps, 2010.
Per capita exports of African energy exporters and
Bangladesh are projected to grow as fast, or faster, than in other parts of the world,
permitting per capita income to grow at an average annual
rate of about 5 per cent.

The Least Developed Countries Report 2010120
oil prices, while for Bangladesh it reflects benefits from a higher proportion of manufactures in its exports and also external economies associated with the size of its economy. African energy exporters are projected to accumulate a significantly positive net external position, while Bangladesh is expected to balance its external position and reduce government debt to 15 per cent of GDP in 2020. Despite some overall improvements in macroeconomic performance, average national income per capita in 2020, measured at around $3,400 in 2000 PPP for African energy exporters and $2,300 for Bangladesh, will still be a small fraction of the average for the world as a whole ($12,800), and less than one tenth of the average for high-income countries ($35,700).
The baseline projections are less optimistic for both the other LDCs blocs. Exports of primary commodities and services are projected to grow more slowly in LDCs than in other parts of the world, implying that average income levels will lag further behind. Other African LDCs do particularly badly because of weak export performance, high rates of population growth and rising costs of oil imports. The model projects a flat trend for per capita exports from these countries and reduction in current account deficits. In these countries the average per capita income is projected to show little or no increase, remaining at around $850. Government debt is projected to remain at around 70 per cent of GDP in the Other African LDCs, and net external positions are expected to become increasingly negative, reaching nearly 90 per cent of GDP for the Other Asian LDCs and no less than 150 per cent of GDP for the African LDCs.
The projected baseline outcome relies on a possibly optimistic assumption that these countries will be able to borrow increasing amounts in order to cover rising current-account deficits. Adequate access to external financing is critical to the growth strategies of these countries. If such finance is not available, their growth performance in terms of GDP and income per capita would inevitably be worse, and it is possible that further substantial declines in living standards will occur in many very low-income countries in Africa.
2. POLICY SCENARIOS
The main objective for LDCs must be to achieve substantially higher, sustainable growth rates that will allow them to catch up at least with other developing countries in coming decades. In the model simulations, an ambitious objective is set for accelerated growth of income in each of the four groups of LDCs distinguished here. The objective is a 2 per cent improvement in growth of income per capita during the period 2011–2015 relative to the past decade (2001–2010) and a further 2 per cent acceleration over the period 2016–2020. This would bring the long-term per capita income growth rate to 9.2 per cent per annum for African energy exporters, 8.4 per cent for Bangladesh, 10 per cent for other Asian LDCs and 6.8 per cent for other African LDCs. These objectives for LDCs compare with an expected per capita income growth rate of around 4 per cent in the world as a whole and 2–3 per cent in high-income countries.
These targets require a further and sustained acceleration of economic growth in the LDCs during the coming decade (table 22). One consequence of the achievement of this target would be that informal understanding reached by Heads of State at their retreat at the United Nations International Conference on Financing for Development, held in Monterrey on 18–23 March 2002, could be realized. In their Spirit of Monterrey Declaration, they
The baseline projections are less optimistic for other
African LDCs.
If sufficient external financing is not available, LDC growth performance in terms of GDP and income per capita would
inevitably be worse, and could decline in many very low-
income countries.
The main objective for LDCs must be to achieve
substantially higher, sustainable growth rates that will allow them to catch up
at least with other developing countries in coming decades.

121The Coming Decade and an Agenda for Action to Create a NIDA for LDCs
stated: “We undertake to assist the world’s poorest countries to double the size of their economies within a decade, in order to achieve the MDGs”. Although this would represent a breakthrough compared with the period 1971–2000, income per capita in 2020 would still remain below $3,000 in most LDCs and below $1,500 in non-energy African LDCs.
Since the model is macroeconomic in character, relying on internationally available data and covering all regions of the world, it is not feasible to represent government policy instruments individually and explicitly. Instead the model calibrates the potential influence of policy on the observable behaviour of macroeconomic variables. Thus fiscal policy is expected to influence government revenue and expenditures, monetary policy may influence interest rates, credit expansion, external capital flows and exchange rates while exports and imports are subject to the influence of industrial policies and trade policies, including export taxes, tariffs and non-tariff regulation. For each behavioural variable, the model specifies a normal pattern of response to initial conditions and other variables. Departures from the normal pattern, whether caused by policy initiatives or other factors, such as changes in institutions, resources or expectations, appear as residual, add factors in the historical movement of each variable.
For the purposes of scenarios it is assumed that policy innovations may be capable of changing or overriding the normal pattern of behaviour, modelled by the insertion of add factors and calculated to achieve a desired objective or follow a particular rule. The scope for policy changes to modify behaviour is limited by constraining calculated add factors to remain within bounds set by observed volatility of historical residuals for the variable and country group.
Simulations are calculated for four different types of policies which could be chosen by the LDCs as a means of improving living standards and accelerating economic growth. These are:
(i) Accelerated growth of government spending: Government spending on goods and services will be increased steadily over a medium- or long-term horizon at a pace that is the same as the long-term target growth rate of GDP.
Table 22Accelerated growth targets for LDCs, 2015 and 2020
Level Growth rate (% p.a.)
Estimated Assumed Estimated Assumed
2000 2010 2015 2020 2001–10 2011–15 2016–20
African energy exporter LDCsPopulation (millions) 76 99 110 121 2.6 2.2 1.9Income per capita (PPP dollars) 1,309 2,169 3,067 4,758 5.2 7.2 9.2National income (billion PPP dollars) 100 214 337 576 7.9 9.5 11.3
BangladeshPopulation (millions) 141 164 175 184 1.6 1.3 1Income per capita (PPP dollars) 886 1,361 1,855 2,776 4.4 6.4 8.4National income (billion PPP dollars) 125 224 325 511 6 7.7 9.5
Other Asian LDCsPopulation (millions) 111 132 145 159 1.8 1.9 1.9Income per capita (PPP dollars) 683 1,228 1,809 2,920 6 8 10National income (billion PPP dollars) 76 162 262 464 7.9 10.1 12.1
Other African LDCsPopulation (millions) 337 445 495 558 2.8 2.1 2.4Income per capita (PPP dollars) 625 820 1,035 1,434 2.8 4.8 6.8National income (billion PPP dollars) 211 365 512 800 5.7 7 9.3
UN-DESA Global Policy Model simulations analysed and reported in Cripps, 2010.
The model calibrates the potential influence of policy on the observable behaviour of macroeconomic variables.
For the purposes of scenarios it is assumed that policy
innovations may be capable of changing or overriding the normal pattern of behaviour.

The Least Developed Countries Report 2010122
(ii) Accelerated infrastructure investment: Government spending on goods and services will be increased steadily, but this will be complemented by increased investment by private firms, State enterprises and households and will focus on social and physical infrastructure, stimulating production for the domestic market and improving export performance. Typical instruments for achieving higher investment include industrial policies, credit and tax incentives. Investment spending will be encouraged to grow slightly faster than the long-term target growth rate of GDP.
(iii) Export expansion and diversification: Improved services and infrastructure will contribute to a stronger export performance. Industrial and trade policies will focus on achieving accelerated growth of exports in all sectors with a target annual growth rate of total exports that is 3 per cent higher than the target annual growth rate of GDP. Simulations assume a variety of incentives applied across the range of export industries, including non-oil primary products, energy, manufactures and services.
(iv) Promotion of an export-investment nexus: This is to be achieved through a combination of the other policies. A combination of infrastructure development and export expansion policies represents a more balanced policy package that should complement the promotion of dynamic sources of demand, improvement of external sustainability and the creation of productive linkages and economies of scale, in addition to the expansion of domestic industries and services and the creation of effective domestic infrastructure.
The purpose of the simulations is to examine the feasibility, potential benefits and problems associated with each type of policy in quantitative terms. For each type of policy, the simulations indicate the feasibility of the scale of policy intervention, the degree of success in accelerating income growth, and potential side-effects, such as increased deficits or levels of debt, that might make the policy untenable. Each type of policy is simulated separately to give a clearer idea of the implications for different groups of LDCs. There is no presumption that Governments of individual LDCs will or should choose any of the specific strategies. In practice they will select a mix of these and other policies, depending on their judgement of priorities and feasibility. However, the analysis provides a sounder basis for considering changes in international policies, including specific ISMs for LDCs that might improve feasibility or reduce problems associated with each of those policies.
The main results may be summarized as follows (table 23):
(i) It is feasible to achieve the growth targets through accelerated growth of government spending in all the LDC blocs, except other African LDCs. This policy is not projected to result in large increases in the debt-to-GDP ratio, as tax revenues and GDP itself will grow faster in response. However, it will tend to compound external debt problems, especially in the case of non-energy African LDCs. A large programme of external grants to support domestic government spending would be necessary to make this policy viable for most African LDCs.
(ii) More broad-based demand expansion through accelerated growth of government spending and private investment focusing on social and physical infrastructure improvement has the same potential to promote income growth in LDCs, and will improve prospects for exports. This will increase GDP and tax revenues and reduce external deficits and
Four different types of policies which could be chosen by
the LDCs are (i) Accelerated growth of government
spending; (ii) Accelerated infrastructure investment; (iii) Export expansion and
diversification; and (iv) Promotion of an export-
investment nexus.
It is feasible to achieve the growth targets through
accelerated growth of government spending in all the LDC blocs, except for
the group labelled “other African LDCs”.

123The Coming Decade and an Agenda for Action to Create a NIDA for LDCs
the accumulation of external debt, and it may be a beneficial strategy for LDCs that start with good external positions. But this policy alone is unlikely to be able to rescue LDCs with large external debts and weak export prospects from their current predicaments.
(iii) Industrial and trade policies designed to promote exports in all sectors have a good chance of reducing external deficits and accelerating GDP growth and tax revenue, implying lower ratios of government debt and external liabilities to GDP. The benefits for per capita income may be less than those deriving from domestic demand stimulus, but the risks of a problem of external indebtedness also appear to be much lower, especially for non-energy African LDCs. The simulation for this type of policy shows external liabilities in 2020 being reduced, from over 140 per cent of GDP in the absence of policy initiatives to less than 50 per cent of GDP. There would still be an increase in external debt relative to GDP along the way, especially in the initial years, implying that external financial assistance may still be a necessary condition for the viability of this approach in highly indebted LDCs.
(iv) Not surprisingly, the most effective approach for accelerated growth of production and income is likely to be a combination of demand expansion through government spending, infrastructure investment and export promotion, which should provide a broad range of development opportunities for public and private institutions in different regions of each country. The impact is projected to be somewhat weaker for African energy exporting LDCs and Bangladesh, which have better baseline development prospects, and stronger for Other Asian and Other African LDCs for which baseline prospects are not so good. Policies of demand expansion and infrastructure investment could boost the annual income growth rate by 0.4–0.8 per cent in Bangladesh and by
Table 23Projected income per capita of LDC blocs according to alternative types of policy, 2010, 2015 and 2020
(PPP dollars)
2010 2015 2020
African Energy ExportersBaseline 2 169 2 630 3 363Accelerated government spending 2 169 3 081 4 710Accelerated infrastructuraI investment 2 169 3 076 4 545Export expansion and diversification 2 169 2 899 4 015Export-investment nexus 2 169 3 255 4 866
BangladeshBaseline 1 361 1 791 2 333Accelerated government spending 1 361 1 873 2 591Accelerated infrastructuraI investment 1 361 1 861 2 619Export expansion and diversification 1 361 1 856 2 597Export-investment nexus 1 361 1 892 2 738
Other Asian LDCsBaseline 1 228 1 402 1 687Accelerated government spending 1 228 1 569 2 235Accelerated infrastructuraI investment 1 228 1 652 2 449Export expansion and diversification 1 228 1 574 2 266Export-investment nexus 1 228 1 765 2 837
Other African LDCsBaseline 820 817 850Accelerated government spending 820 970 1 278Accelerated infrastructuraI investment 820 1 011 1 373Export expansion and diversification 820 925 1 210Export-investment nexus 820 1 054 1 531
Source: UN-DESA Global Policy Model simulations analysed and reported in Cripps, 2010.
Industrial and trade policies designed to promote exports
in all sectors have a good chance of reducing external
deficits and accelerating GDP growth and tax revenue.
The most effective approach for accelerated growth is
likely to be a combination of demand expansion through
government spending, infrastructure investment and
export promotion.

The Least Developed Countries Report 2010124
over 2 per cent in the other LDC groups, as compared with export promotion alone. Or viewed the other way round, export promotion policies could boost the annual GDP growth rate by 0.3–0.6 per cent in Bangladesh and between 0.5 and 1.5 per cent in the other LDC groups, as compared with policies of demand expansion and infrastructure investment alone. Although such policies entail significant domestic and external costs, the cumulative benefits for production, trade and government revenue generated by a consistent application of domestic policies over the medium term means that the policies will eventually finance themselves as government debt and external debt fall relative to GDP.
In all these scenarios, external constraints are significant. From a macroeconomic perspective, the most important functions of international policies to support the LDCs appear to be financial assistance for increasing investment and developing export industries and export promotion, and grants to cover government budget deficits. From these scenarios, it is clear that a significant improvement in per capita income in LDCs over the coming decade will require substantial external assistance of this kind. Making this external assistance effective will be a clear priority.
3. IMPACT OF DELAYED RECOVERY ON THE BASELINE AND POLICY SCENARIOS The “delayed recovery” scenario differs from the baseline scenario because
of progressive fiscal policy adjustments in Europe and the United States aimed at reducing budget deficits to 2 per cent and 3 per cent of GDP, respectively, and bringing down the ratio of government debt to GDP. One rationale for such policies is the need to reduce the burden of debt service when interest rates return to more normal levels.
This is projected to have a strongly negative impact on world income, trade, and commodity and oil prices. The negative effects on GDP in the first few years would be sufficient to cause the ratio of government debt to GDP globally to rise from 68 per cent in 2010 to 80 per cent in 2015, before eventually declining to 46 per cent in 2020 – about the same level as in the baseline projection. Although the world economy would broadly recover by 2020, the negative impact on income, trade, and commodity and oil prices, compared with the baseline, is estimated to be in the range of 12–18 per cent.
The impact of a delayed recovery on LDCs is shown in table 24. A delayed recovery from recession would substantially reduce income growth up to 2015 in the more dynamic LDCs, Bangladesh and the energy-exporting African countries, but this effect would be largely reversed by 2020. There should be less impact on income in Other Asian and Other African LDCs over the same period, as their growth is assumed to be less dependent on exports in the model and they should “benefit” from the lower oil prices associated with a weaker global recovery.
Comparing the sensitivity of the different strategies to the delayed recovery, it is clear that the negative effects of the delayed recovery would be mitigated by an accelerated government spending policy and accelerated infrastructure investment strategy. But delayed recovery is projected to reduce the positive effects of export-led growth policies on exports, income per capita and external positions of debtor blocs substantially. The exception is Bangladesh, which, according to the model simulations would be capable of offsetting some deterioration in global conditions by intensifying its export promotion policies.
The most important functions of international policies to
support the LDCs appear to be financial assistance for increasing investment and
developing export industries and export promotion, and grants to cover government
budget deficits.
A delayed recovery from recession would substantially reduce income growth up to 2015 in the more dynamic
LDCs, but this effect would be largely reversed by 2020.
The negative effects of the delayed recovery would be mitigated if an accelerated
government spending policy and accelerated infrastructure
investment strategy are adopted.
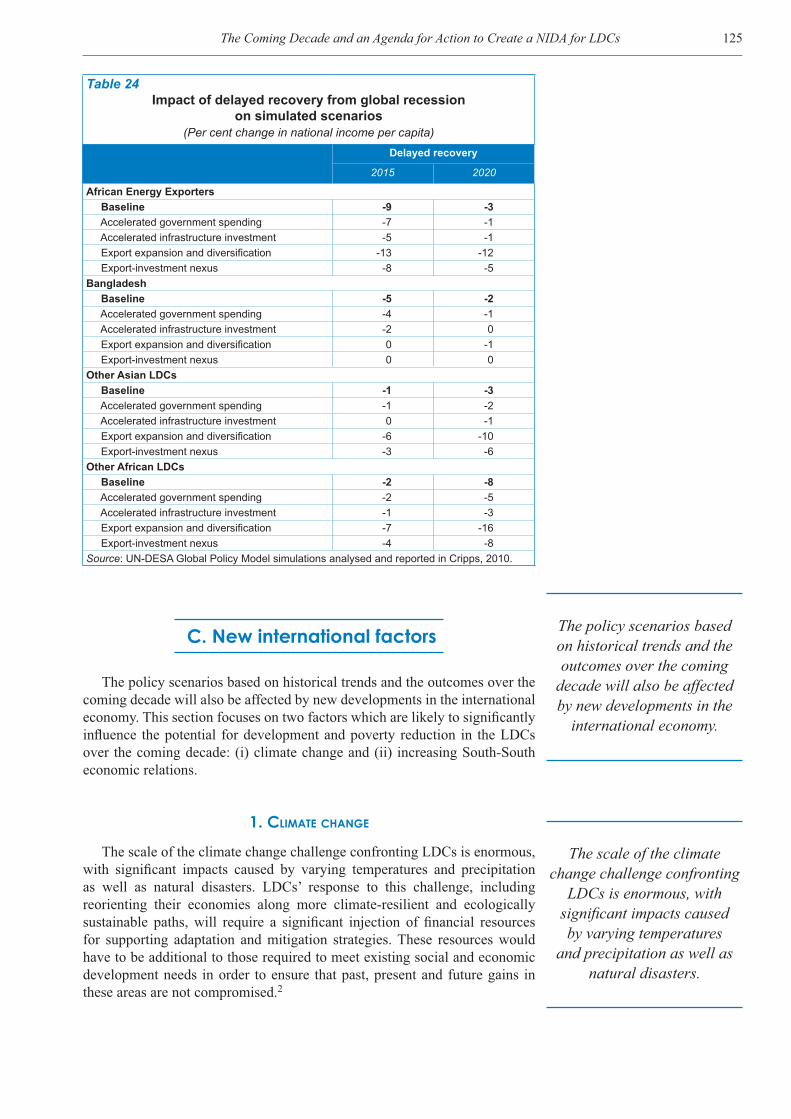
125The Coming Decade and an Agenda for Action to Create a NIDA for LDCs
C. New international factors
The policy scenarios based on historical trends and the outcomes over the coming decade will also be affected by new developments in the international economy. This section focuses on two factors which are likely to significantly influence the potential for development and poverty reduction in the LDCs over the coming decade: (i) climate change and (ii) increasing South-South economic relations.
1. CLIMATE CHANGE
The scale of the climate change challenge confronting LDCs is enormous, with significant impacts caused by varying temperatures and precipitation as well as natural disasters. LDCs’ response to this challenge, including reorienting their economies along more climate-resilient and ecologically sustainable paths, will require a significant injection of financial resources for supporting adaptation and mitigation strategies. These resources would have to be additional to those required to meet existing social and economic development needs in order to ensure that past, present and future gains in these areas are not compromised.2
Table 24Impact of delayed recovery from global recession
on simulated scenarios(Per cent change in national income per capita)
Delayed recovery
2015 2020
African Energy Exporters Baseline -9 -3 Accelerated government spending -7 -1 Accelerated infrastructure investment -5 -1 Export expansion and diversification -13 -12 Export-investment nexus -8 -5Bangladesh Baseline -5 -2 Accelerated government spending -4 -1 Accelerated infrastructure investment -2 0 Export expansion and diversification 0 -1 Export-investment nexus 0 0Other Asian LDCs Baseline -1 -3 Accelerated government spending -1 -2 Accelerated infrastructure investment 0 -1 Export expansion and diversification -6 -10 Export-investment nexus -3 -6Other African LDCs Baseline -2 -8 Accelerated government spending -2 -5 Accelerated infrastructure investment -1 -3 Export expansion and diversification -7 -16 Export-investment nexus -4 -8Source: UN-DESA Global Policy Model simulations analysed and reported in Cripps, 2010.
The policy scenarios based on historical trends and the outcomes over the coming
decade will also be affected by new developments in the
international economy.
The scale of the climate change challenge confronting
LDCs is enormous, with significant impacts caused by varying temperatures
and precipitation as well as natural disasters.
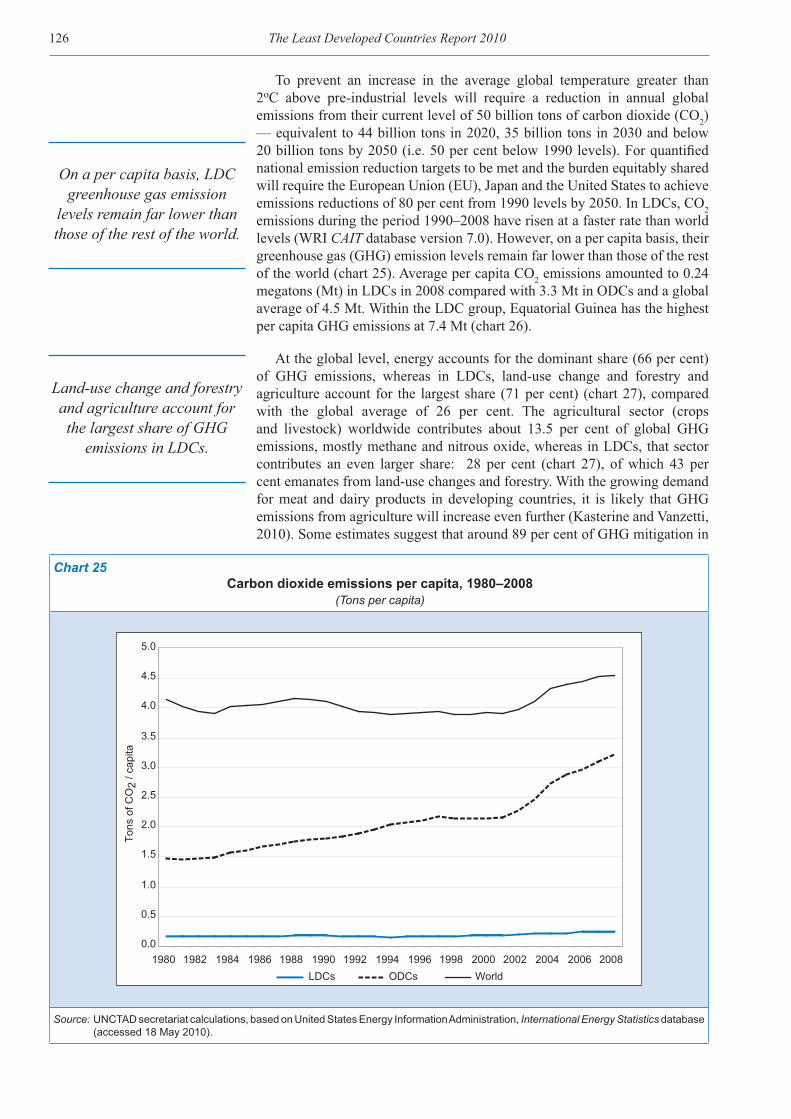
The Least Developed Countries Report 2010126
To prevent an increase in the average global temperature greater than 2oC above pre-industrial levels will require a reduction in annual global emissions from their current level of 50 billion tons of carbon dioxide (CO2) — equivalent to 44 billion tons in 2020, 35 billion tons in 2030 and below 20 billion tons by 2050 (i.e. 50 per cent below 1990 levels). For quantified national emission reduction targets to be met and the burden equitably shared will require the European Union (EU), Japan and the United States to achieve emissions reductions of 80 per cent from 1990 levels by 2050. In LDCs, CO2 emissions during the period 1990–2008 have risen at a faster rate than world levels (WRI CAIT database version 7.0). However, on a per capita basis, their greenhouse gas (GHG) emission levels remain far lower than those of the rest of the world (chart 25). Average per capita CO2 emissions amounted to 0.24 megatons (Mt) in LDCs in 2008 compared with 3.3 Mt in ODCs and a global average of 4.5 Mt. Within the LDC group, Equatorial Guinea has the highest per capita GHG emissions at 7.4 Mt (chart 26).
At the global level, energy accounts for the dominant share (66 per cent) of GHG emissions, whereas in LDCs, land-use change and forestry and agriculture account for the largest share (71 per cent) (chart 27), compared with the global average of 26 per cent. The agricultural sector (crops and livestock) worldwide contributes about 13.5 per cent of global GHG emissions, mostly methane and nitrous oxide, whereas in LDCs, that sector contributes an even larger share: 28 per cent (chart 27), of which 43 per cent emanates from land-use changes and forestry. With the growing demand for meat and dairy products in developing countries, it is likely that GHG emissions from agriculture will increase even further (Kasterine and Vanzetti, 2010). Some estimates suggest that around 89 per cent of GHG mitigation in
Chart 25Carbon dioxide emissions per capita, 1980–2008
(Tons per capita)
0.0
0.5
1.0
1.5
2.0
2.5
3.0
3.5
4.0
4.5
5.0
1980 1982 1984 1986 1988 1990 1992 1994 1996 1998 2000 2002 2004 2006 2008
Tons
of C
O2
/ cap
ita
LDCs ODCs World
Source: UNCTAD secretariat calculations, based on United States Energy Information Administration, International Energy Statistics database (accessed 18 May 2010).
On a per capita basis, LDC greenhouse gas emission
levels remain far lower than those of the rest of the world.
Land-use change and forestry and agriculture account for the largest share of GHG
emissions in LDCs.
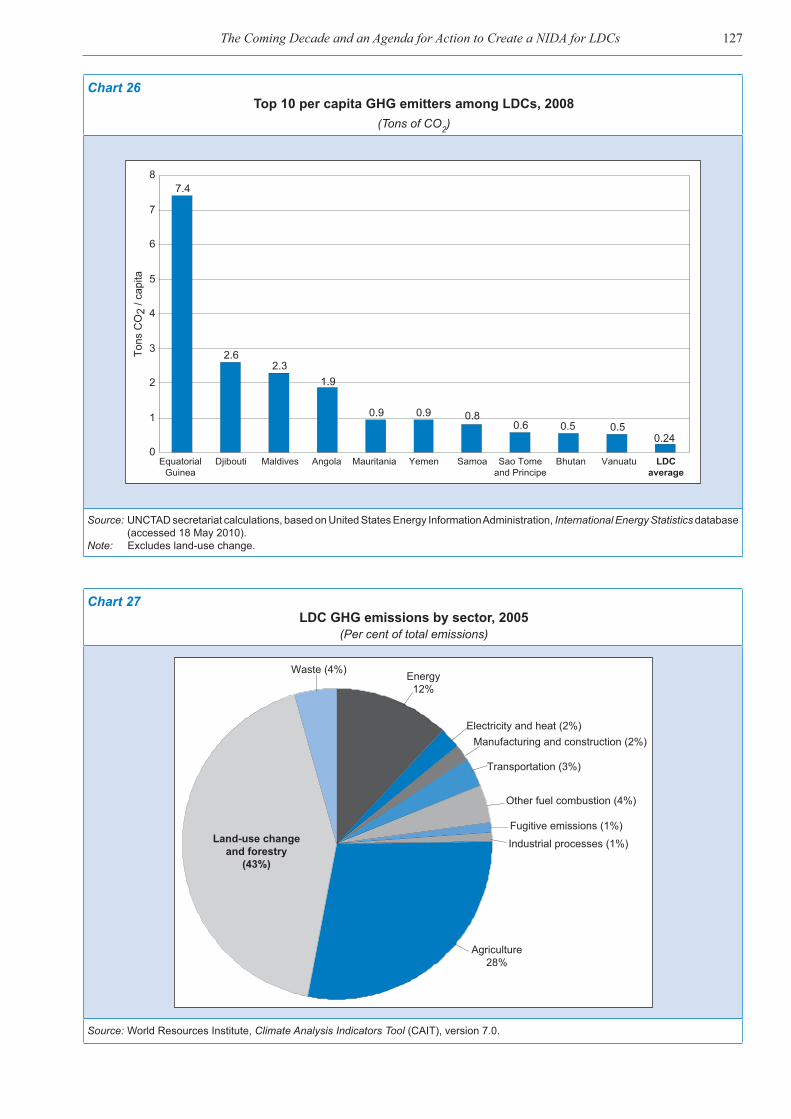
127The Coming Decade and an Agenda for Action to Create a NIDA for LDCs
Chart 26Top 10 per capita GHG emitters among LDCs, 2008
(Tons of CO2)
7.4
2.62.3
1.9
0.9 0.9 0.80.6 0.5 0.5
0.240
1
2
3
4
5
6
7
8
EquatorialGuinea
Djibouti Maldives Angola Mauritania Yemen Samoa Sao Tomeand Principe
Bhutan Vanuatu LDCaverage
Tons
CO
2 / c
apita
Source: UNCTAD secretariat calculations, based on United States Energy Information Administration, International Energy Statistics database (accessed 18 May 2010).
Note: Excludes land-use change.
Chart 27LDC GHG emissions by sector, 2005
(Per cent of total emissions)
Transportation (3%)
Electricity and heat (2%)Manufacturing and construction (2%)
Other fuel combustion (4%)
Fugitive emissions (1%)
Waste (4%)
Industrial processes (1%)
Energy12%
Agriculture28%
Land-use changeand forestry
(43%)
Source: World Resources Institute, Climate Analysis Indicators Tool (CAIT), version 7.0.
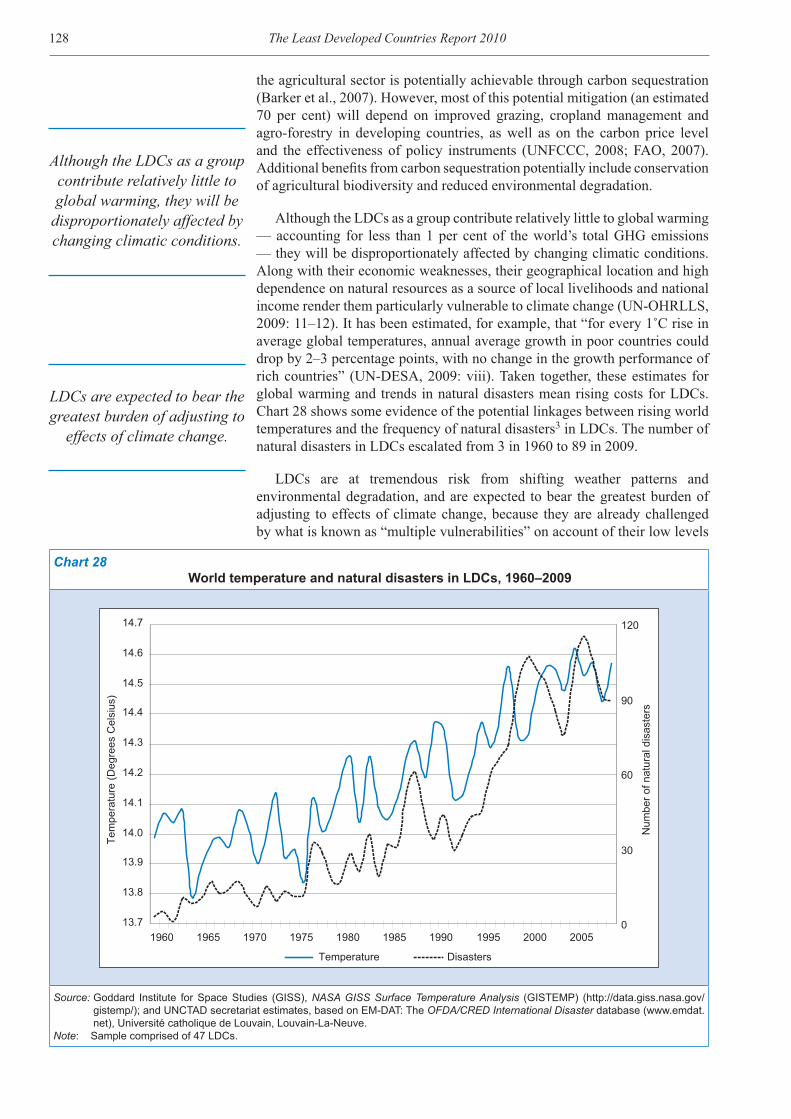
The Least Developed Countries Report 2010128
the agricultural sector is potentially achievable through carbon sequestration (Barker et al., 2007). However, most of this potential mitigation (an estimated 70 per cent) will depend on improved grazing, cropland management and agro-forestry in developing countries, as well as on the carbon price level and the effectiveness of policy instruments (UNFCCC, 2008; FAO, 2007). Additional benefits from carbon sequestration potentially include conservation of agricultural biodiversity and reduced environmental degradation.
Although the LDCs as a group contribute relatively little to global warming — accounting for less than 1 per cent of the world’s total GHG emissions — they will be disproportionately affected by changing climatic conditions. Along with their economic weaknesses, their geographical location and high dependence on natural resources as a source of local livelihoods and national income render them particularly vulnerable to climate change (UN-OHRLLS, 2009: 11–12). It has been estimated, for example, that “for every 1˚C rise in average global temperatures, annual average growth in poor countries could drop by 2–3 percentage points, with no change in the growth performance of rich countries” (UN-DESA, 2009: viii). Taken together, these estimates for global warming and trends in natural disasters mean rising costs for LDCs. Chart 28 shows some evidence of the potential linkages between rising world temperatures and the frequency of natural disasters3 in LDCs. The number of natural disasters in LDCs escalated from 3 in 1960 to 89 in 2009.
LDCs are at tremendous risk from shifting weather patterns and environmental degradation, and are expected to bear the greatest burden of adjusting to effects of climate change, because they are already challenged by what is known as “multiple vulnerabilities” on account of their low levels
Chart 28World temperature and natural disasters in LDCs, 1960–2009
13.7
13.8
13.9
14.0
14.1
14.2
14.3
14.4
14.5
14.6
14.7
1960 1965 1970 1975 1980 1985 1990 1995 2000 2005
Tem
pera
ture
(Deg
rees
Cel
sius
)
0
30
60
90
120
Num
ber o
f nat
ural
dis
aste
rs
Temperature Disasters
Source: Goddard Institute for Space Studies (GISS), NASA GISS Surface Temperature Analysis (GISTEMP) (http://data.giss.nasa.gov/gistemp/); and UNCTAD secretariat estimates, based on EM-DAT: The OFDA/CRED International Disaster database (www.emdat.net), Université catholique de Louvain, Louvain-La-Neuve.
Note: Sample comprised of 47 LDCs.
Although the LDCs as a group contribute relatively little to global warming, they will be
disproportionately affected by changing climatic conditions.
LDCs are expected to bear the greatest burden of adjusting to
effects of climate change.

129The Coming Decade and an Agenda for Action to Create a NIDA for LDCs
of economic and human development (table 25, and UN-DESA, 2009: 71). Clearly, with their lack of social and physical infrastructure, inadequate institutions and narrow economic base, LDCs may be “exposed not just to potentially catastrophic large-scale disasters, but also to a more permanent state of economic stress as a result of higher average temperatures, reduced availability of water sources, more frequent flooding and intensified windstorms” (UN-DESA, 2009: 63, and table 25). If, for example, the potential correlation between hydrological variability (mean rainfall) and key economic variables in LDCs is considered, the implications of climate change for the rural poor and for domestic food security are serious (UNCTAD, 2009a; Couharde, Davis and Generoso, 2010). As a result of climate change, many African LDCs may experience greater rainfall, modifications in rainy season food crop production characteristics, shorter growing seasons and increased floods. For other African LDCs, reduced rainfall may result in longer dry seasons, drought and the unviable agricultural production in areas where subsistence farming might previously have been practiced. Either scenario will adversely affect their economies and food security in the absence of significant adaptation efforts.
LDCs accounted for 40 per cent of all casualties related to natural disasters during the period 2000–2010. There has been an increase in the frequency and intensity of extreme weather events, with five times as many such incidents occurring from 2000 to 2010 as during the 1970s (table 26). The increase in the number of people affected cannot be explained solely by population growth; over the same period, the LDC population grew approximately 2.7 times, from 314 million to 854 million.
Currently, over 2.8 billion people reside in areas prone to one or more of the physical manifestations of climate change, namely desertification, droughts, floods, storms and rising sea level (Global Humanitarian Forum, 2009: 15). The regions most at risk from droughts and floods are sub-Saharan Africa and South Asia, where the majority of LDCs are located (chart 29A). The LDC small island developing states (SIDS) and LDCs in Asia are particularly vulnerable to the impact of storms (chart 29A and B). These are also the areas that are least able to cope with the social and economic fallout from climate-related incidents. Sub-Saharan Africa remains the most vulnerable region, with 15 out of 20 of the world’s most vulnerable countries located there (Global Humanitarian Forum, 2009: 58). One third of Africa’s population lives in drought-prone areas, and it is projected that by 2020 between 70 million and 220 million people in Africa will suffer from the effects of increased water stress resulting from climate change (table 26, and UN-ORHLLS, 2009: 15). As shown in table 27, since 1980, the 10 LDCs to have experienced the highest incidence of extreme weather events reported 244 storms, 347 floods and 78 droughts. Haiti has been disproportionately affected by the impact of natural disasters, especially since the January 2010 earthquake, which, according to official estimates, resulted in 222,570 fatalities (approximately 2 per cent of the Haitian population), 300,000 injured, 1.3 million displaced, 97,294 houses destroyed and 188,383 houses damaged in the Port-au-Prince area and in much of southern Haiti.4
On average, developing countries experience more damage from climate-related impacts as a percentage of their GDP than developed countries (UNFCCC, 2008: 23). During the period 2000–2010, LDCs recorded economic losses totalling $14.1 billion,5 although the LDCs as a group accounted for only 2 per cent of global economic losses due to natural disasters. Within the LDC group, Bangladesh and Myanmar suffered the greatest economic losses
The implications of climate change for the rural poor and
for domestic food security are serious.
LDCs accounted for 40 per cent of all casualties related
to natural disasters during the period 2000–2010.
The regions most at risk from droughts and floods are sub-
Saharan Africa and South Asia, where the majority of
LDCs are located.

The Least Developed Countries Report 2010130
Table 25LDC climate change vulnerabilities and regional impacts
Sub-Saharan Africa (SSA) impacts Sectoral vulnerabilities
TemperatureSince 1960 decadal warming rates of 0.290C in tropical forestsa and 0.1 to 0.30C in southern SSA.b Higher warming throughout SSA in all seasons compared to the global average. Drier subtropical regions are likely to become warmer than the more temperate tropical zones.a
PrecipitationPredictions suggest a trend of declining precipitation in current semi-arid to arid parts of SSAa. Inter annual rainfall variability is large across SSA and for some regions multi-decadal variability is substantial:• annual rainfall in southern SSA has declined; • annual mean rainfall in East SSA has increased;• greater rainfall in the Sahel may be counteracted through
evaporation.Extreme eventsThere has been an increase in the frequency and intensity of extreme events, particularly droughts and floods in SSA.c
Adaptation capacitySSA has a low adaptive capacity to climate change due to:• Widespread poverty• Weak institutions and low levels of human capital,• Inadequate physical infrastructure and conflicts
WaterAn estimated 72-220 million face severe water shortages by 2020.a, b
There is likely to be increased water stress in many SSA LDCs:• Lake Chad has decreased in size by 50 percent since 1970;• Scenarios predict decreased rainfall, increased potential
evaporative losses (15-25 percent) and diminished runoff (30-40 percent) from the Zambezi River affecting water availability in Angola, DR Congo; Malawi, Mozambique, UR Tanzania and Zambia.a, d
Agriculture and food securityOver 60 percent of households rely on agriculture for their livelihoods, heat-related plant stresses are expected to contribute to reduced yields:f• Rain-fed crop yields could decline by 50 percent by 2020 in some
regions; with net revenues from crops falling by 90 percent.d, e
• Predicted worsening food insecurity and increased malnutrition.e• Fish stocks are likely to decline with rising water temperatures.
In some countries production may rise, e.g. a warming of 3-5 per cent in the Gambia River could increase fish production by 13-21 percent.g
Health d, h
Estimates suggest a possible expansion of climatically suitable areas for malaria in SSA with a 5-7 per cent potential increase (mainly altitudinal), with limited increase in the latitudinal extent of it by 2100. Also likely alteration of spatial and temporal transmission of dengue fever, meningitis and cholera.Ecosystems and biodiversity d, g
Desertification in SSA, especially the Sahel and southern SSA.Deforestation, forest fires and degradation of grasslands.Estimated 25-40 per cent of animal species in SSA national parks will become endangered.Coastal zones d
Threat of inundation in East SSA and degradation of marine ecosystems. Cost of adaptation to rising sea levels could rise to 10 percent of GDP.
Asia impacts Sectoral vulnerabilities
Temperature d, h
Predicted warming above the global mean in central, eastern, northern and southern Asia.Precipitation d, h
Predicted rise in precipitation in northern, southern and eastern Asia. Less precipitation anticipated in central Asia in summer. Increased reduction in Himalayan and Tibetan Plateau glaciers, making Nepal and Bangladesh prone to increased flooding during the wet season. For Asia, climate models predict an annual mean increase in precipitation of 3 per cent by 2020 and 7 per cent by 2050.g
Extreme events c
There has been an increase in the frequency and intensity of extreme events, particularly:• increased tropical cyclones droughts and El Nino events;• flooding and landslides; and• longer summer heat waves particularly in East Asia.Adaptation capacity g
Most Asian LDCs adaptive capacity is hindered by:Widespread poverty and income inequalityWeak institutions and Limited technology
WaterIn Central, South and Eastern Asia an estimated 100 milliond people at risk of greater water stress due to decreased freshwater availability. With melting glaciers, greater incidence of floods and a decrease in river flows.Agriculture and food securityA decline in water supply and soil moisture during the dry season would enhance water stress resulting in:• Lower rice yields negatively impacting agricultural trade and
economic growth prospects in Asia.e Moreover, by 2050 calorie availability will be lower relative to 2000 levels – thus higher levels of food insecurity;e
• Increased land degradation and desertification; and• Agricultural productivity may rise in northern Asia due to higher
latitudes.h
HealthAnticipated rise in heat stress, water-borne diseases (e.g. cholera) and endemic mortality due to diarrheal disease in south and southeast Asia.Ecosystems and biodiversityForest fires may increase in frequency. In Nepal for example, unseasonably high temperatures could threaten the extinction of species of apes, pandas and leopards.Coastal zonesCoastal zones and low lying delta areas in Bangladesh, Myanmar and Cambodia will be severely affected by rising sea levels and greater frequency of storms.

131The Coming Decade and an Agenda for Action to Create a NIDA for LDCs
LDC SIDS impacts Sectoral vulnerabilities
TemperaturePredicted warming below the global mean in the Indian ocean, North-South Pacific and Caribbean SIDS. Seasonal ocean surface and island air temperatures have increased from 0.6 to 1.00C since 1910 in the South Pacific.h
Precipitation d, h
Increase in annual rainfall in the equatorial Pacific, the northern Indian Ocean and the Maldives. Predicted decline in rainfall in the Indian Ocean and eastern pacific. This is critical for SIDS as most rely on rainwater as the main source of freshwater (potable).Extreme events c
Increase in the frequency and intensity of extreme events, particularly cyclones, storms, floods and coral bleaching.Adaptation capacityLDC SIDS have a low adaptive capacity to climate change due to significant structural economic weaknesses, coupled with a high dependence on natural resources as a source of local livelihoods and national income.
Water d, h
Due to the rising sea level and changes in precipitation, water sources are seriously compromised. By 2050 a predicted 10 per cent reduction in average rainfall would result in a 20 per cent reduction in the freshwater lens of Kiribati.Agriculture and food security g, h
The rising sea level, inundation, soil salinization and decline in the freshwater supply will negatively affect agricultural land and food security. Damage from cyclones and rising sea surface temperatures will also negatively impact fisheries (which contributes 10 per cent of GDP in some SIDS).Health d, h
Anticipated rise in heat stress and the occurrence of disease vectors (e.g. malaria, dengue, etc).Ecosystems and biodiversity d, h
Higher temperatures and CO2 levels will affect mangroves, sea grasses and coral reefs. A greater frequency of extreme events will retard the development of forest cover as these are slow to regenerate. Forests may be more sustainable on some high latitude islands.Coastal zones d, h
The rising sea level will impact coastal settlements, infrastructure and exacerbate coastal erosion. The long-term habitability of some islands is threatened by inundation and coastal erosion.
Source: (a) Christensen et al. (2007); (b) Kruger and Shongwe (2004); (c) EM-DAT: OFDA/CRED database; (d) UNFCCC (2007); (e) IFPRI (2009); (f) UNCTAD (2009a); (g) Huq et al. (2003); (h) UN-OHRLLS (2009).
Table 25 (contd.)
Table 26Incidence and total number of people affected by extreme weather events in LDCs, 1970–2010
Drought Extreme temperature Flood Storm LDC total
1970–1979 Number of extreme weather events 28 - 46 42 116Number of people affected 34 373 000 - 58 873 060 7 076 803 100 322 863
1980–1989 Number of extreme weather events 54 3 93 60 210Number of people affected 98 448 767 10 131 813 034 20 616 945 250 878 756
1990–1999 Number of extreme weather events 43 9 167 94 313Number of people affected 63 223 526 1 034 000 73 355 634 31 169 955 168 783 115
2000–2010 Number of extreme weather events 58 11 350 126 591Number of people affected 83 293 578 266 800 88 222 558 21 213 326 192 996 262
Source: UNCTAD secretariat estimates, based on EM-DAT: OFDA/CRED International Disaster Database (www.emdat.net), Université catholique de Louvain, Louvain-La-Neuve (accessed April 2010).
Note: Sample comprised of 47 LDCs (data were unavailable for Afghanistan and Equatorial Guinea).
($5.8 billion and $4.5 billion respectively). Overall, LDC-SIDS are among the most susceptible in the world to natural disasters, as a result of which they suffer significant shocks to their economies (UN-ORHLLS, 2009: 10-11).
Clearly, LDCs fall short of the requirements for a high adaptive capacity to climate change set out by the Intergovernmental Panel on Climate Change (IPCC) in 2001. These include: a stable and prosperous economy, a high degree of access to technology, well-delineated roles and responsibilities for the implementation of adaptation strategies, systems for dissemination of climate change adaptation information at national, regional and local levels, and equitable access to resources (McCarthy et al, 2001, as quoted in UN-OHRLLS, 2009: 7). The low adaptive capacity of LDCs to climate change will be eroded further if global mitigation actions are not taken with a view to achieving targets within a reasonable time frame, and if countries remain locked into unsustainable development paths, leading to “higher emissions,
LDCs fall short of the requirements for a high
adaptive capacity to climate change set out by the
Intergovernmental Panel on Climate Change.
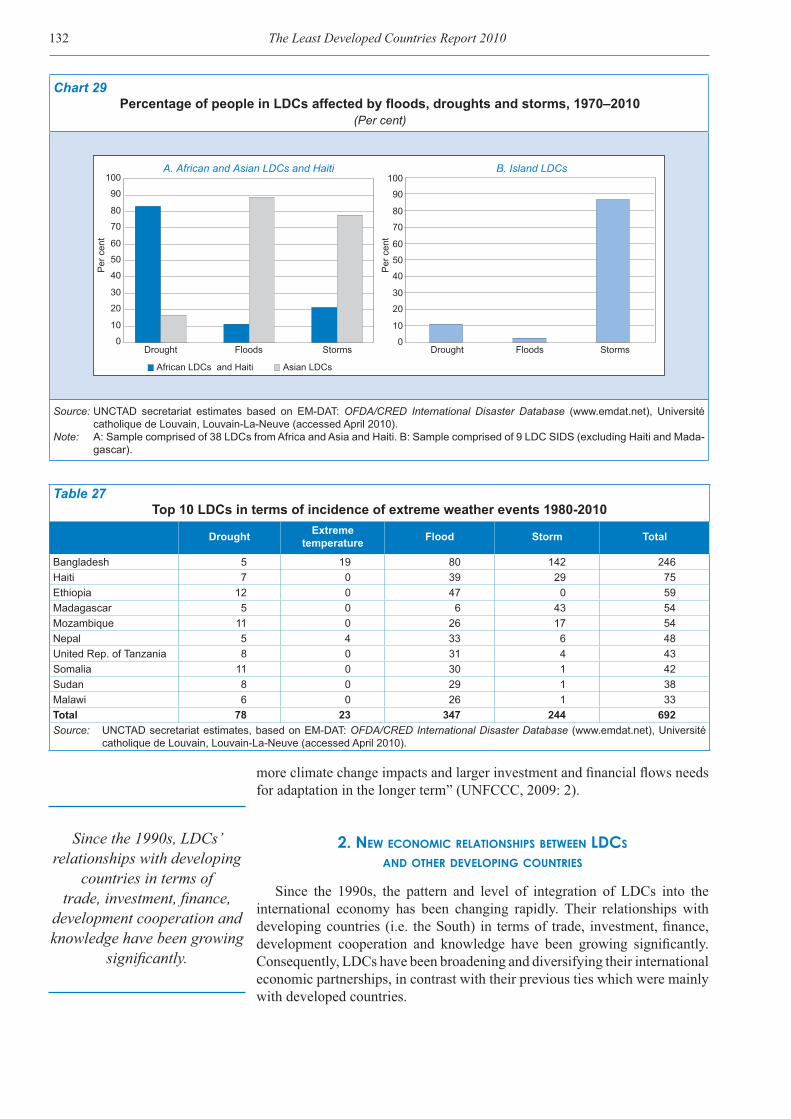
The Least Developed Countries Report 2010132
Chart 29Percentage of people in LDCs affected by floods, droughts and storms, 1970–2010
(Per cent)
0
10
20
30
40
50
60
70
80
90
100
0
10
20
30
40
50
60
70
80
90
100
Per
cen
t
Per
cen
t
Floods Storms
African LDCs and Haiti
A. African and Asian LDCs and Haiti
Asian LDCs
DroughtDrought Floods Storms
B. Island LDCs
Source: UNCTAD secretariat estimates based on EM-DAT: OFDA/CRED International Disaster Database (www.emdat.net), Université catholique de Louvain, Louvain-La-Neuve (accessed April 2010).
Note: A: Sample comprised of 38 LDCs from Africa and Asia and Haiti. B: Sample comprised of 9 LDC SIDS (excluding Haiti and Mada-gascar).
Table 27Top 10 LDCs in terms of incidence of extreme weather events 1980-2010
Drought Extreme temperature Flood Storm Total
Bangladesh 5 19 80 142 246Haiti 7 0 39 29 75Ethiopia 12 0 47 0 59Madagascar 5 0 6 43 54Mozambique 11 0 26 17 54Nepal 5 4 33 6 48United Rep. of Tanzania 8 0 31 4 43Somalia 11 0 30 1 42Sudan 8 0 29 1 38Malawi 6 0 26 1 33Total 78 23 347 244 692Source: UNCTAD secretariat estimates, based on EM-DAT: OFDA/CRED International Disaster Database (www.emdat.net), Université
catholique de Louvain, Louvain-La-Neuve (accessed April 2010).
more climate change impacts and larger investment and financial flows needs for adaptation in the longer term” (UNFCCC, 2009: 2).
2. NEW ECONOMIC RELATIONSHIPS BETWEEN LDCS AND OTHER DEVELOPING COUNTRIES
Since the 1990s, the pattern and level of integration of LDCs into the international economy has been changing rapidly. Their relationships with developing countries (i.e. the South) in terms of trade, investment, finance, development cooperation and knowledge have been growing significantly. Consequently, LDCs have been broadening and diversifying their international economic partnerships, in contrast with their previous ties which were mainly with developed countries.
Since the 1990s, LDCs’ relationships with developing
countries in terms of trade, investment, finance,
development cooperation and knowledge have been growing
significantly.
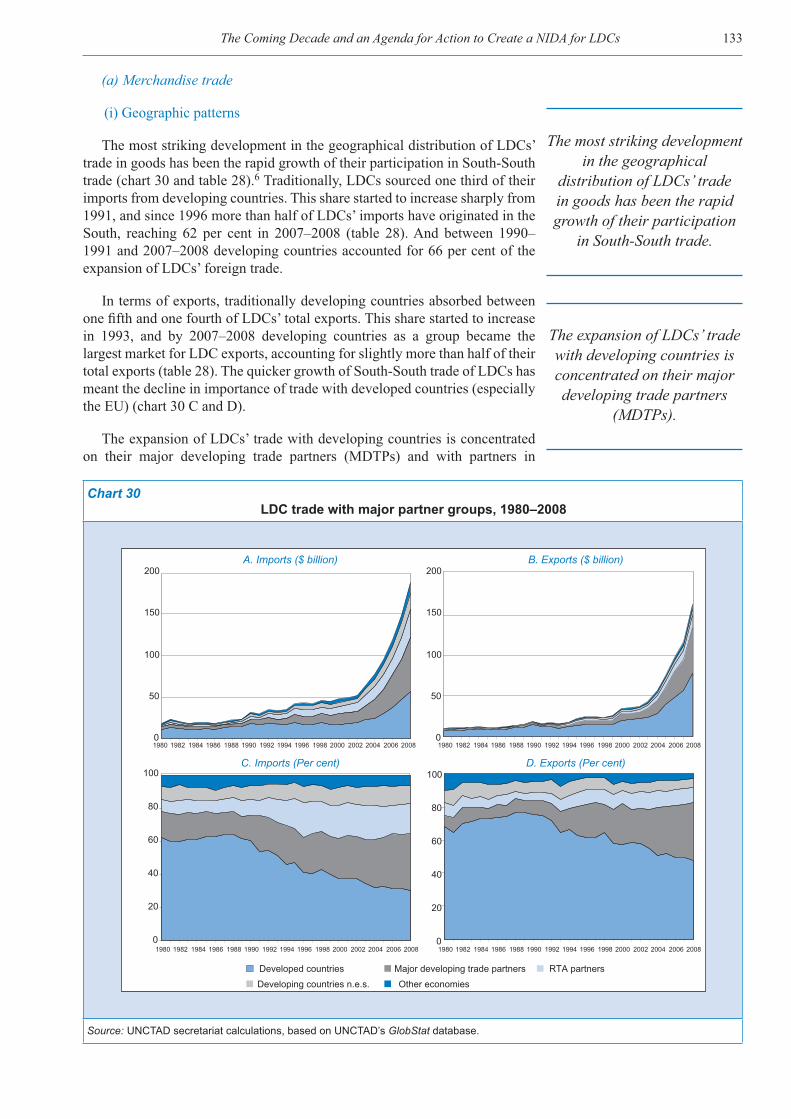
133The Coming Decade and an Agenda for Action to Create a NIDA for LDCs
(a) Merchandise trade
(i) Geographic patterns
The most striking development in the geographical distribution of LDCs’ trade in goods has been the rapid growth of their participation in South-South trade (chart 30 and table 28).6 Traditionally, LDCs sourced one third of their imports from developing countries. This share started to increase sharply from 1991, and since 1996 more than half of LDCs’ imports have originated in the South, reaching 62 per cent in 2007–2008 (table 28). And between 1990–1991 and 2007–2008 developing countries accounted for 66 per cent of the expansion of LDCs’ foreign trade.
In terms of exports, traditionally developing countries absorbed between one fifth and one fourth of LDCs’ total exports. This share started to increase in 1993, and by 2007–2008 developing countries as a group became the largest market for LDC exports, accounting for slightly more than half of their total exports (table 28). The quicker growth of South-South trade of LDCs has meant the decline in importance of trade with developed countries (especially the EU) (chart 30 C and D).
The expansion of LDCs’ trade with developing countries is concentrated on their major developing trade partners (MDTPs) and with partners in
Chart 30LDC trade with major partner groups, 1980–2008
A. Imports ($ billion)
0
50
100
150
200
0
50
100
150
200
1980 1982 1984 1986 1988 1990 1992 1994 1996 1998 2000 2002 2004 2006 2008
1980 1982 1984 1986 1988 1990 1992 1994 1996 1998 2000 2002 2004 2006 2008 1980 1982 1984 1986 1988 1990 1992 1994 1996 1998 2000 2002 2004 2006 2008
1980 1982 1984 1986 1988 1990 1992 1994 1996 1998 2000 2002 2004 2006 2008
Developed countries Major developing trade partners RTA partnersDeveloping countries n.e.s. Other economies
C. Imports (Per cent)
0
20
40
60
80
100
0
20
40
60
80
100
B. Exports ($ billion)
D. Exports (Per cent)
Source: UNCTAD secretariat calculations, based on UNCTAD’s GlobStat database.
The most striking development in the geographical
distribution of LDCs’ trade in goods has been the rapid growth of their participation
in South-South trade.
The expansion of LDCs’ trade with developing countries is concentrated on their major developing trade partners
(MDTPs).

The Least Developed Countries Report 2010134
regional trade agreements (RTAs). LDCs’10 largest developing-country trade partners in 2007–2008 accounted for three quarters of all South-South trade flows of LDCs and for 42 per cent of LDC total world trade (table 29). All the MDTPs, apart from Brazil and South Africa, are located in Asia. The LDCs’ largest trading partner is China, whose importance has grown, especially as an export market. It alone absorbed 23 per cent of LDC exports in 2007–2008, overtaking the EU and the United States to become the largest export destination for LDCs in 2007. In terms of LDC imports, there is a more even distribution between their imports from China and from other MDTPs. LDC imports from the MDTPs have accelerated sharply since the mid-1990s, so that in 2007-2008 the MDTPs accounted for approximately one third of LDC imports (table 28) – almost double the share of the early 1980s. LDC exports to MDTPs grew even more rapidly than imports, and in 2007–2008 the MDTPs accounted for 35 per cent of LDCs’ exports (table 28).7
LDCs strengthened their regional integration efforts as part of their trade liberalization process in the 1990s (UNCTAD, 2004: 182–184), and have since participated in continuing regional integration initiatives.8 LDC exports to RTA partners have been growing rapidly (table 28), especially since 2000. On the other hand, their imports from RTA partners have expanded at the slowest pace among the large partner groups, and most likely have been displaced by those from MDTPs. Consequently, while the market share of MDTP imports by LDCs grew by 13 percentage points, to 32 per cent, between the mid-1990s and 2007–2008, that of their RTA partners shrank by 7 percentage points, to 18 per cent (table 28).
(ii) Regional distribution of LDCs’ trade
The trends for the LDCs as a group have been driven by developments in African LDCs. As recently as the mid-1990s, African LDCs’ foreign trade was strongly concentrated with developed countries, which accounted for more than half of their total trade and an even higher share of their exports. Since then, however, their trade with MDTPs has been growing considerably faster than their trade with developed countries and RTA partners. While the share of MDTPs in African LDC imports doubled to reach 31 per cent between 1995–1996 and 2007–2008, their export market share tripled to 40 per cent (table 30).
Table 28LDCs’ trade with major partner groups, 1995–1996 and 2007–2008
(Annual averages)
Partner group
LDC imports LDC exports
1995–1996 2007–2008Annual growth rate (%)
1995–1996 2007–2008Annual growthrate (%)
Value($ million) % Value
($ million) %1995–1996
to 2007–2008
Value($ million) % Value
($ million) %1995–1996
to 2007–2008
Developed countries, including: 13 932 40.0 45 248 33.0 10.3 14 147 58.3 68 378 47.9 14.0European Union 9 137 26.3 28 844 21.0 10.1 7 064 29.1 28 918 20.2 12.5United States 1 846 5.3 6 810 5.0 11.5 4 947 20.4 29 245 20.5 16.0
Developing countries, of which:
18 999 54.5 85 104 62.0 13.3 9 223 38.0 71 803 50.3 18.7
Major developing trade partners 6 477 18.6 43 275 31.5 17.1 4 513 18.6 50 347 35.3 22.3RTA partners 8 682 24.9 24 690 18.0 9.1 3 054 12.6 14 190 9.9 13.7Developing countries n.e.s. 3 840 11.0 17 139 12.5 13.3 1 656 6.8 7 266 5.1 13.1
Other economies 1 868 5.4 6 911 5.0 11.5 879 3.6 2 645 1.9 9.6Total 34 798 100 137 263 100 12.1 24 249 100 142 826 100 15.9Source: UNCTAD secretariat calculations, based on UNCTAD’s GlobStat database.Note: For the composition of the country groups, see p. xv-xvi.
All the MDTPs, apart from Brazil and South Africa,
are located in Asia.
LDCs strengthened their regional integration efforts
as part of their trade liberalization process in
the 1990s, and have since participated in continuing
regional integration initiatives.

135The Coming Decade and an Agenda for Action to Create a NIDA for LDCs
Table 29LDCs’ total trade with major developing trade partners, 2007–2008
(Annual average)
PartnerValue
($ million)% total trade
with developing countries% total trade with world
% cumulative % cumulative
China 39 181 25.0 25.0 14.0 14.0India 11 607 7.4 32.4 4.1 18.1South Africa 9 694 6.2 38.5 3.5 21.6Thailand 8 329 5.3 43.9 3.0 24.6United Arab Emirates 5 860 3.7 47.6 2.1 26.7Saudi Arabia 4 718 3.0 50.6 1.7 28.3Taiwan Province of China 4 380 2.8 53.4 1.6 29.9Brazil 4 079 2.6 56.0 1.5 31.4Singapore 3 148 2.0 58.0 1.1 32.5Republic of Korea 2 626 1.7 59.7 0.9 33.4Source: UNCTAD secretariat calculations, based on UNCTAD’s GlobStat database.Note: Total trade = Imports + Exports.
Table 30Trade of LDCs by region with major partner groups, 2007–2008
(Per cent summing up by column)
Partner groupImports Exports
LDCs - Africa
LDCs - Asia
LDC - Americas
LDCs - Oceania
LDCs - Africa
LDCs - Asia
LDC - Americas
LDCs - Oceania
Developed countries, including: 38.0 20.9 65.6 57.3 46.8 50.7 81.4 41.2 European Union 27.6 8.8 7.8 2.2 18.0 27.2 6.0 6.3 United States 4.7 3.3 52.6 5.1 21.3 17.5 71.2 1.6Developing countries, of which:
57.0 73.6 34.1 42.6 51.2 48.0 18.5 57.5
Major developing trade partners 31.1 33.6 9.9 23.8 39.6 22.9 4.8 37.3 RTA partners 15.7 23.4 1.1 11.3 7.0 18.8 0.1 3.1 Developing countries n.e.s. 10.2 16.6 23.1 7.5 4.6 6.3 13.6 17.1Other economies 4.9 5.5 0.3 0.1 2.1 1.3 0.0 1.3World 100 100 100 100 100 100 100 100Source: UNCTAD secretariat calculations, based on UNCTAD’s GlobStat database.Note: For the composition of the LDC and partner groups, see p. xv-xvi.
For Asian LDCs, the recent growth of trade with MDTPs has been less dramatic; MDTPs were already their major import sources in the mid-1990s (contrary to all other LDCs), and at present supply one third of Asian LDCs’ imports (table 30). Asian LDCs’ exports, by contrast, have remained more focused on developed-country markets (mainly the EU member States and the United States), which account for half of their total exports. Despite that, it is the Asian LDCs for which regional trade has been the most important (table 30). Among the major partner groups, exports to RTA partners have expanded the most rapidly since the mid-1990s, to the point that the importance of MDTPs has shrunk somewhat, to 23 per cent.
(iii) Product composition
The most important items in the LDC import basket are low, medium and high skill- and technology-intensive manufactures, which account for over half of their total imports.9 Traditionally, LDCs have sourced these goods mainly from developed countries, but the share of these countries fell to 42 per cent in 2007–2008 from 65 per cent in the mid-1990s. At the same time, with the rise of MDTPs as world-scale exporters of these manufactures, they have now become the second major source for LDCs imports of these manufactures, with a 34 per cent share. The composition of LDC imports from MDTPs is rapidly becoming similar to that of their imports from developed countries.
It is the Asian LDCs for which regional trade has been the most important.
The composition of LDC imports from MDTPs is
rapidly becoming similar to that of their imports from
developed countries.

The Least Developed Countries Report 2010136
The export basket of LDCs, by contrast, is dominated by commodities. Fuels have constituted a growing share of LDC exports over the past 15 years, due to rising prices and volumes.10 In the past, these exports had been directed mainly to developed countries. However, since 2000, MDTPs have overtaken developed countries as the leading markets, accounting for 48 per cent of LDC fuel exports, compared with the share of developed countries of 41 per cent in 2007–2008. Fuels account for 81 per cent of LDC exports to MDTPs — much higher than their share of exports to developed countries (52 per cent) (chart 31). In addition to fuels, non-fuel commodities constitute 19 per cent of LDC exports to MDTPs.
The major difference in the composition of exports of LDCs to developed countries and to MDTPs is in labour- and resource-intensive manufactures. These goods are exported mainly by Asian LDCs and mostly to European and United States markets. In LDC exports to MDTPs, by contrast, these goods are virtually absent, given that China is itself a major worldwide exporter of such goods. LDCs, especially African LDCs, export a higher share of primary commodities to MDTPs than to developed countries.
The composition of Asian LDCs’ exports to MDTPs and developed countries is quite different from that of African LDCs. The bulk (87 per cent) of Asian LDC exports to the North consists of labour- and resource-intensive manufactures. In exports to MDTPs, on the other hand, Asian LDCs specialize in commodities, which make up 92 per cent of their exports, two thirds of which consist of fuels. Thus Asian and African LDCs’ trade patterns with MDTPs are similar, but with developed countries they are markedly different.
Chart 31Composition of LDC exports, by major trade partner groups, 2007–2008
Per
cen
t
0
10
20
30
40
50
60
70
80
90
100
Major developingtrade partners
RTApartners
Developedcountries
Low, medium and high skill- and technology-intensive manufacturesLabour / resource-intensive manufacturesNon-fuel commoditiesFuels
Source: UNCTAD secretariat calculations, based on UNCTAD’s GlobStat database.
MDTPs have overtaken developed countries as the leading markets for fuels, accounting for 48 per cent
of LDCs’ fuel exports.
Asian and African LDCs’ trade patterns with MDTPs
are similar, but with developed countries are markedly
different.

137The Coming Decade and an Agenda for Action to Create a NIDA for LDCs
RTAs offer LDCs opportunities to upgrade and diversify their exports. Regional markets absorb 27 per cent of these countries’ exports of low- medium- and high-technology and skill-intensive manufactures. Thus LDCs’ exports through such agreements are the most diversified of all their major trading partners (chart 32).
(b) Foreign direct investment
Growing trade linkages of LDCs with the South have been accompanied by increased FDI flows. The share of developing countries in total FDI inflows of LDCs rose from 32 per cent in 1999–2001 to 48 per cent in 2006–2008, while that of developed countries shrank to slightly less than half (chart 33). In Southern Africa, the bulk of outward investment of developing countries takes place regionally. More than two thirds of South Africa’s outward FDI is directed to other countries of the Southern African Development Community (SADC). South Africa accounted for over 70 per cent of the total inward FDI of the Democratic Republic of the Congo, Lesotho and Malawi in 1994–2003, and for some 30 per cent of that of Mozambique, the United Republic of Tanzania and Zambia (Rumney and Pingo, 2004). A novel feature of developing-country investment in LDCs since the turn of the century has been the growth of interregional flows. MDTPs have played a major role in this trend; in 2006–2008 they accounted for more than one fifth of total inward FDI in LDCs (chart 33). For instance, the stock of Chinese outward FDI to LDCs rose 10-fold, from $369 million in 2003 to $3,989 million in 2008.
Investment in natural-resource-rich African LDCs by developing-country firms has tended to concentrate on the following sectors: oil and gas, mining, energy, and, more recently, agriculture, fisheries and seafood farming. Other sectors targeted by developing-country investors in these LDCs have been construction, infrastructure, and, to a lesser extent, telecoms and finance. Some large-scale projects are undertaken by State-owned transnational corporations (TNCs) (e.g. some natural resource and energy companies from Brazil, China
Chart 32Index of diversification of LDC exports in bilateral trade with major partner groups, 2007–2008
Inde
x
Major developingtrade partners
RTApartners
Developedcountries
0.0
0.1
0.2
0.3
0.4
0.5
0.6
0.7
0.8
Source: UNCTAD secretariat calculations, based on data from UNCTAD’ GlobStat database.Note: The index of diversification is the complement of the Herfindahl-Hirschmann index. It is normalized to obtain values ranging from 0
to 1 (maximum diversification)
LDCs’ exports to RTAs are the most diversified of all their
exports to major trading partners.
The share of developing countries in total FDI inflows of LDCs rose from 32 per cent in 1999–2001 to 48 per cent in 2006–2008, while that of
developed countries shrank to slightly less than half.

The Least Developed Countries Report 2010138
and South Africa). More recently, these FDI flows have started to diversify, with some Chinese and Indian investments in African LDCs in apparel, food processing, retail ventures, commercial real estate and transport, construction and tourism. Part of China’s strategic industrial plan in Africa is to establish five preferential trade and industrial zones to facilitate entry of Chinese businesses, including in two LDCs: Ethiopia and Zambia and (Brautigam, Farole and Yiaoyang, 2010).11
Developing-country FDI in Asian LDCs has tended to concentrate on light manufacturing and, to a lesser extent, natural resources and telecoms. The investing companies tend to be mainly private TNCs, primarily from China, India and the countries of the Association of Southeast Asian Nations (ASEAN).
(c) South-South development cooperation
A major aspect of the growing linkages between LDCs and ODCs has been the strengthening of South-South development cooperation. The project of South-South cooperation dates back to the post-war decolonization period, with the Buenos Aires Plan of Action (1978) marking a milestone in its development. However, developing countries neglected the issue over the two subsequent decades. It was only towards the end of the 1990s that policymakers once again began to give priority to the strengthening of economic relations and flows between developing countries. To this end, a number of developing countries, notably Brazil, China, India, South Africa and Turkey, have sharply increased their development cooperation budgets, established dedicated agencies, initiated new programmes and funds and strengthened existing ones (Ventura-Dias, 2010).
A major characteristic of South-South development cooperation is the sectoral focus: typically, South-South development cooperation is more geared
Chart 33Inward FDI in LDCs, by groups of country of origin of investor, 1999–2001 and 2006–2008
(Per cent)
0
10
20
30
40
50
60
70
80
90
100
1999–2001 2006–2008Developed countries MDTPs
RTA partnersDeveloping economies n.e.s.
Other economies
Source: UNCTAD secretariat calculations, based on the UNCTAD FDI/TNC database.
Developing-country FDI in Asian LDCs has tended
to concentrate on light manufacturing and, to a lesser extent, natural resources and
telecoms.
A major aspect of the growing linkages between LDCs and ODCs has been the
strengthening of South-South development cooperation.
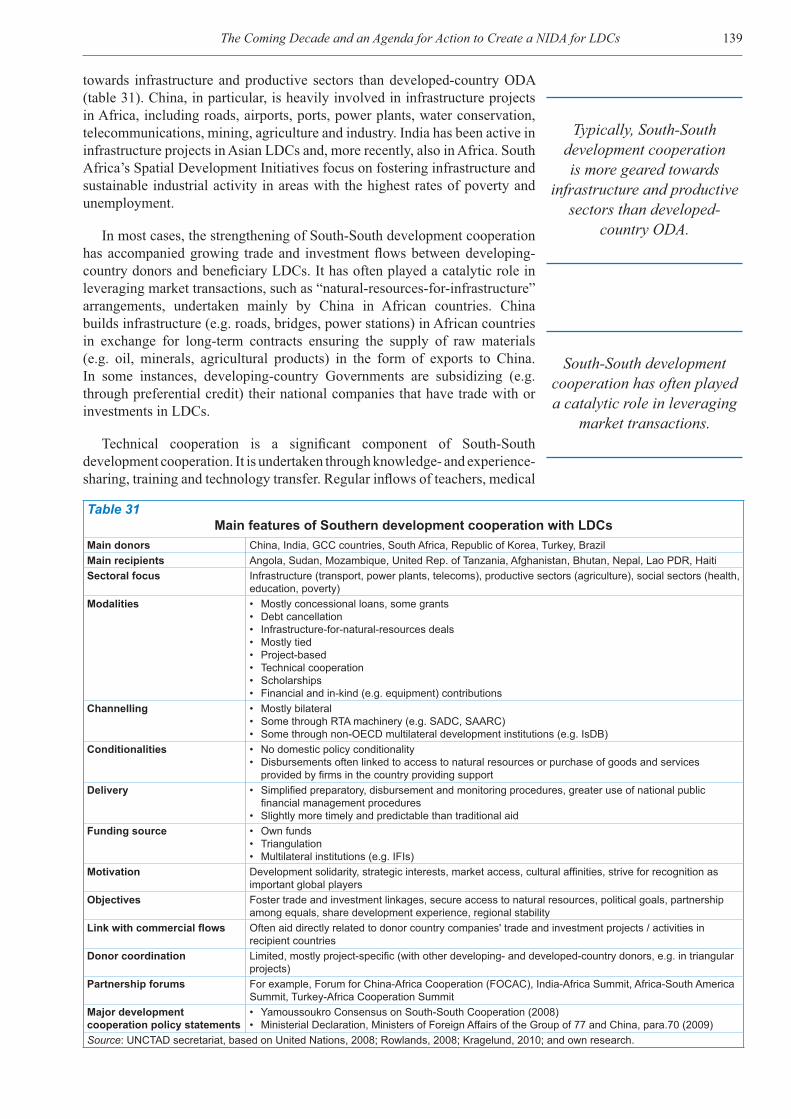
139The Coming Decade and an Agenda for Action to Create a NIDA for LDCs
towards infrastructure and productive sectors than developed-country ODA (table 31). China, in particular, is heavily involved in infrastructure projects in Africa, including roads, airports, ports, power plants, water conservation, telecommunications, mining, agriculture and industry. India has been active in infrastructure projects in Asian LDCs and, more recently, also in Africa. South Africa’s Spatial Development Initiatives focus on fostering infrastructure and sustainable industrial activity in areas with the highest rates of poverty and unemployment.
In most cases, the strengthening of South-South development cooperation has accompanied growing trade and investment flows between developing-country donors and beneficiary LDCs. It has often played a catalytic role in leveraging market transactions, such as “natural-resources-for-infrastructure” arrangements, undertaken mainly by China in African countries. China builds infrastructure (e.g. roads, bridges, power stations) in African countries in exchange for long-term contracts ensuring the supply of raw materials (e.g. oil, minerals, agricultural products) in the form of exports to China. In some instances, developing-country Governments are subsidizing (e.g. through preferential credit) their national companies that have trade with or investments in LDCs.
Technical cooperation is a significant component of South-South development cooperation. It is undertaken through knowledge- and experience-sharing, training and technology transfer. Regular inflows of teachers, medical
Table 31Main features of Southern development cooperation with LDCs
Main donors China, India, GCC countries, South Africa, Republic of Korea, Turkey, BrazilMain recipients Angola, Sudan, Mozambique, United Rep. of Tanzania, Afghanistan, Bhutan, Nepal, Lao PDR, HaitiSectoral focus Infrastructure (transport, power plants, telecoms), productive sectors (agriculture), social sectors (health,
education, poverty)Modalities • Mostly concessional loans, some grants
• Debt cancellation • Infrastructure-for-natural-resources deals • Mostly tied • Project-based • Technical cooperation • Scholarships • Financial and in-kind (e.g. equipment) contributions
Channelling • Mostly bilateral • Some through RTA machinery (e.g. SADC, SAARC) • Some through non-OECD multilateral development institutions (e.g. IsDB)
Conditionalities • No domestic policy conditionality• Disbursements often linked to access to natural resources or purchase of goods and services
provided by firms in the country providing supportDelivery • Simplified preparatory, disbursement and monitoring procedures, greater use of national public
financial management procedures • Slightly more timely and predictable than traditional aid
Funding source • Own funds • Triangulation • Multilateral institutions (e.g. IFIs)
Motivation Development solidarity, strategic interests, market access, cultural affinities, strive for recognition as important global players
Objectives Foster trade and investment linkages, secure access to natural resources, political goals, partnership among equals, share development experience, regional stability
Link with commercial flows Often aid directly related to donor country companies' trade and investment projects / activities in recipient countries
Donor coordination Limited, mostly project-specific (with other developing- and developed-country donors, e.g. in triangular projects)
Partnership forums For example, Forum for China-Africa Cooperation (FOCAC), India-Africa Summit, Africa-South America Summit, Turkey-Africa Cooperation Summit
Major development cooperation policy statements
• Yamoussoukro Consensus on South-South Cooperation (2008) • Ministerial Declaration, Ministers of Foreign Affairs of the Group of 77 and China, para.70 (2009)
Source: UNCTAD secretariat, based on United Nations, 2008; Rowlands, 2008; Kragelund, 2010; and own research.
Typically, South-South development cooperation is more geared towards
infrastructure and productive sectors than developed-
country ODA.
South-South development cooperation has often played a catalytic role in leveraging
market transactions.
The Least Developed Countries Report 2010140
personnel, agricultural experts and engineers have provided core expertise in the fields of education, health, agriculture, environmental conservation and engineering in LDCs.
(d) Development impact of South-South economic relations
The rapidly growing economic relationships between LDCs and ODCs have turned this into an essential partnership, though the ever-increasing linkages between the two present both opportunities and challenges to LDCs. Foremost, the acceleration of economic growth in several developing countries and closer regional integration imply greater diversification of economic and development partnerships for LDCs. The consequent widening of the scope of trade, investment, official finance and knowledge flows contributes to reducing LDCs’ vulnerability to external shocks, as it spreads the risks associated with such shocks.
Among the economic linkages of LDCs with the South, their relationships with MDTPs tend to be quite different from those with regional partners. There are large asymmetries between LDCs and MDTPs in terms of their income, technology, size, financial resources and institutional capabilities. By contrast, such gaps are much smaller between LDCs and their regional partners. Managing these different types of South-South linkages to ensure that both parties mutually benefit thus presents different challenges. From an LDC perspective, South-South economic ties will be particularly beneficial if they directly or indirectly foster capital accumulation, employment, technological learning, diversification and upgrading of output and exports, domestic economic linkages and/or strengthening of national capacities.
Several theoretical models suggest that closer economic integration between initially asymmetric partners can have adverse long-term consequences for the weaker partners.12 Even if the weaker partner benefits from its stronger partner’s greater innovations (e.g. through the import of cheaper goods), its long-term growth rate tends to slow down. More generally, asymmetric relations between agents from the more advanced developing countries (e.g. investors and traders) and agents from the LDCs (e.g. Governments) can result in unbalanced concessions by the weaker partner(s) during negotiations of investment and trade deals. Avoiding this situation requires policy action to redirect some aspects of South-South economic relations, while the already existing positive features need reinforcing. It also points to the importance of regional integration as a key aspect of South-South development cooperation for LDCs.
(i) Economic relations with major developing-country partners
Table 32 provides a summary of the main features of the economic flows between LDCs and their major ODC trade partners that represent opportunities, but also challenges, to the development of productive capacities in the LDCs.
Trade
It is often argued that South-South trade provides an opportunity for developing countries to diversify their foreign trade (e.g. Klinger, 2009; Shirotori and Molina, 2009). Indeed, for LDCs, the sharp rise in their trade with developing countries has contributed not only to their trade expansion but also to the geographical diversification of their trade flows.
The acceleration of economic growth in several developing countries and closer regional
integration imply greater diversification of economic
and development partnerships for LDCs.
From an LDC perspective, South-South economic ties
will be particularly beneficial if they directly or indirectly foster capital accumulation, employment, technological
learning, diversification and upgrading of output and
exports, domestic economic linkages and/or strengthening
of national capacities.

141The Coming Decade and an Agenda for Action to Create a NIDA for LDCs
Table 32Impacts on LDCs' development of their economic relations with major developing country partners
Field Opportunities Challenges
Trade Strong expansion of LDC exports and importsGeographic diversification of exports and imports away from traditional partners• diversification of risks related to external
demand and supply shocks• increase in variety of imported goods and
servicesMajor Southern markets provide strong boost to foreign demand for LDC goods and services (i.e. export surge)For commodity exporters: Southern demand pushes commodity prices upwardsImports of cheap consumer goods benefit consumers and helps reduce poverty
Tends to reinforce LDC specialization in traditional sectors, especially commodities • also in the case of Asian LDCsHigher product concentration of exports to MDTPs than in exports to developed countries or RTA partnersImports from MDTPs can displace intraregional trade (esp. manufactures trade of African RTAs)MDTP exports can displace exports of LDCs in third markets (esp. manufactures and in regional markets)For commodity importers: Southern demand pushes commodity prices upwardsCompetition from cheap imports could threaten LDC industry and agriculture • adverse impact on domestic output and jobsPreferential market access schemes (including DFQF) as yet typically fail to open market access in sectors where LDCs are most competitive (e.g. food, garments)
FDI Mostly greenfield investments to develop new activities
• contributes to fixed investment (capital accumulation) in LDCs
Investment in manufatcuring has strong positive impact on jobs • also FDI in tourism, though to a lesser extentCapital-intensive investment in natural resources can cause overall productivity level to increase • also FDI in services, though to a lesser extentInvestment in natural resources and manufatcuring has strong positive impact on exports• also FDI in tourism, though to a lesser extentFDI inflows contribute to close external financing gap of LDCsAllows exploitation of previously untapped natural resources• greater utilization of resourcesLonger-term commitment thanks to strategic investment in natural-resource sectors
Investment in natural resources and manurfacturing reinforces LDC specialization in traditional sectors (commodities and labour-intensive manufacturing)Limited domestic spillover of technology and know-how of investment in
mining, agriculture, manufacturing and tourism, which often operate as enclaves
• limited job-creating impact, due to capital-intensive operations and/or employment of home country nationals (especially in managerial positions) –except manufacturing and (to some extent) tourism
• few backward and forward linkages with the domestic economy of host country
• high import content of FDI• little upgrading of domestic productive structure• restricted learning effects by domestic firms and workersAppropriation of mining, oil and agricultural rents can be unfavourable to LDCs’ governments• weakens state capacityDistribution of FDI in LDCs very concentrated in a few LDCsLarge-scale FDI in LDC agriculture “land grab”:• displaces small farmers• jeopardizes domestic food security• tends to accelerate land degradation• can contribute to increased povertySouthern FDI impact so strong in some industries / countries that it has come to dominate these sectors in some LDCsSome footlose investment in manufacturing
Development cooperation
Similarity of economic, social and environmental conditions provides great scope for knowledge-sharing with LDCs• inter alia through technical cooperationEmphasis on infrastructure and productive
sectors• helps address major structural shortcomings
of LDCsAbsence of economic policy conditionality:• preserves LDC policy space• contributes to recipient country’s ownership of policiesDiversification of aid sources:• widens external funding of LDC economies• increases bargaining power of LDCs vis-à-vis donors• contributes to reducing aid volatilitySimpler aid delivery and monitoring procedures place less burden on limited state resources of LDCs
There is not always a match between reipient LDCs’ needs and the commercial priorities and interests of southern partners’s firmsBilateral relations between donors and individual LDCs (rather than
RTAs / RECs or regional organizations):• reinforces unequal power relations between donors and recipients• limits the contribution of development assistance to creating regional
synergiesStill low volumes of South-South official finance as compared to North-South aid • limits the potential positive impact of South-South cooperationTied aid is not always the most efficient form of delivering official development financeFocus on loans (vs. grants) contributes to debt accumulationHigher number of donors increases complexity of aid management and delivery
Technology Technology imported through trade, FDI or development assistance is more adapted to LDC conditions:• lower technology level• more similar labour/capital ratios
Source: UNCTAD secretariat, based on own research.
The Least Developed Countries Report 2010142
Concerning the product composition of their foreign trade with MDTPs, while their imports have become increasingly diversified, their exports have become more concentrated. Imports of cheap manufactures most likely have contributed to improving the purchasing power of LDC consumers, and hence to alleviating poverty (Balat and Porto, 2007; Aguilar and Goldstein, 2009).
However, the surge of imports from MDTPs has also had a dampening impact on domestic industrial output and on regional trade.13 The growth of trade with MDTPs has reinforced the commodity specialization of LDCs, both African and Asian. Thus it has not been associated with product diversification of LDC exports towards goods with higher value added and/or higher learning potential. Nevertheless, it is important to understand the economic relations between LDCs and MDTPs in dynamic terms. Looking ahead, there is potential for further growth of LDC processed exports to fast-growing developing countries. The latter have modernizing industries and rapidly increasing middle classes with rising incomes and purchasing power, which increases their demand not only for natural resources, but also for more diversified, non-traditional exports such as processed commodities, light manufactured products, household consumer goods, food and tourism. LDCs have the potential to export these non-traditional goods and services competitively to some of these developing countries.
Foreign direct investment
Inward FDI can have a positive development impact on LDCs if it contributes to promoting the latter’s productive capacities. FDI from ODCs can be more effective than that from developed countries because of the greater similarity of economic and institutional conditions between the home and host countries. Such similarity facilitates the establishment of developing-country TNCs in LDC hosts, fosters job creation and enables a more effective transfer of technology and knowledge to local agents (UNCTAD, 2006b: 183–200).
The acceleration of FDI flows from developing countries to LDCs has certainly contributed to boosting the latters’ exports, and it has probably also played a role in their capital formation. In addition, developing-country FDI in manufacturing and tourism has accelerated job creation. However, these two sectors, account for a smaller share of such FDI inflows in LDCs; most of these flows are directed to capital-intensive projects (especially natural resources), which tend to have a limited impact on job creation. Moreover, frequently FDI projects in LDCs — in the primary sector and many in the secondary and tertiary sectors — tend to operate as enclaves, which are very well integrated internationally but have limited linkages with the domestic economy (Centre for Chinese Studies, 2006). This seriously limits the potential of this form of FDI to stimulate domestic activity, learning and technology upgrading (UNCTAD, 2007a: 33–36).
Crucially, the fiscal linkages of South-South FDI in natural resources tend to be very weak. These linkages are potentially the major way of ensuring development benefits from foreign investment in extractive industries. However, in many cases, in order to attract foreign investment, LDCs have offered very favourable conditions to foreign investors in these sectors (including those from developing countries) (UNCTAD, 2005a: 108–115, and 2005b: 37–63). Consequently, the amounts of taxes, levies and royalties paid by TNCs engaged in natural resource activities tend to be very limited, except when the State directly owns part of natural-resource exploiting companies (UNCTAD, 2010b: 155–158). Host-country LDC Governments tend to capture
Imports of cheap manufactures most likely have contributed to improving the purchasing power of LDC consumers, and hence to
alleviating poverty ...
... but has also had a dampening impact on
domestic industrial output and on regional trade.
The acceleration of FDI flows from developing countries
to LDCs has certainly contributed to boosting the latters’ exports, and it has
probably also played a role in their capital formation.

143The Coming Decade and an Agenda for Action to Create a NIDA for LDCs
only a small share of resource-related rents, thus depriving their countries of crucial potential benefits from those investments.
Overall, developing-country FDI in LDCs has in the past contributed to locking these countries into their traditional specializations and positions in the international division of labour, with a concentration in commodities and low value-added manufacturing. Thus the development effect of South-South FDI is similar to that of South-South trade, with which it is strongly associated. Still, it has the potential to contribute to the diversification of the economic structure of LDCs, as shown by the proportion of developing-country FDI directed to non-traditional sectors (e.g. manufacturing, and financial and telecom services), which is still small, but may grow in the future and contribute to the diversification of LDC economies.
South-South development cooperation
Most of the positive impacts of South-South development cooperation on LDCs stem from the similarity of economic, social, institutional and environmental conditions prevailing in the donor and recipient countries (table 32), as well as mutual respect and solidarity arising from a common development experience. The similarities in conditions imply a strong potential for knowledge transfer and experience sharing. Policymakers and societies in middle-income developing countries have the experience of dealing simultaneously with several layers of economic and social problems, including structural bottlenecks and deficiencies, low physical and human capital accumulation, poverty and external constraints on development. Many larger developing countries have successfully devised original strategies and policies for dealing with these issues, which they can share with LDCs. This pertains especially to agriculture, food security, energy, health, education, social policies, industrial policy, planning, international negotiations and climate change. These are already included in their development cooperation projects with LDCs, but there is potential for further expansion.
Official financial flows from developing countries to the LDCs supplements official inflows from DAC donors. It therefore contributes to easing LDC external financing constraints. Its stronger orientation towards improving productive capacities implies that it makes a more direct contribution to the long-term development of LDCs and addresses some of the major structural shortcomings of these countries (UNCTAD, 2006a). Although official financial flows from southern partners are often tied to non-policy conditions (such as the purchase of goods and services provided by firms in the country providing support), the absence of policy conditionality is highly appreciated by LDC recipients (UNCTAD, 2010a).
Until recently, a main shortcoming of development assistance from the South in the form of official finance was the smaller amount compared with that provided by the North.14 However, several developing-country donors (e.g. Brazil, China and India) have augmented their development cooperation budgets substantially in recent years, with a consequent increase in the positive impacts of such assistance.
(ii) Economic relations with regional partners
Regional integration among developing countries can be an effective tool for development. It allows domestic firms to learn how to operate internationally and achieve economies of scale, it enables diversification of exports and it
Overall, developing-country FDI in LDCs has in the past contributed to locking these
countries into their traditional specializations and positions in the international division
of labour.
The similarity of conditions prevailing in the donor and recipient countries imply a
strong potential for knowledge transfer and experience
sharing.
Official financial flows from developing countries to the LDCs supplements official
inflows from DAC donors and contributes to easing LDC
external financing constraints.
Several developing-country donors have augmented their
development cooperation budgets substantially
in recent years.
The Least Developed Countries Report 2010144
entails lower adjustment costs than integration with high-income developing or developed countries. In addition, South-South regional integration enables the geographical diversification of trade, investment and official finance. Moreover, regional synergies can be created through joint investment infrastructure projects and/or through the regional division of labour.15 For all these reasons, in addition to political motivations, most developing countries — including LDCs — are increasingly participating in regional integration initiatives. Economic relations of LDCs with RTA partners conform more to this expected pattern than their links with other partner groups, as reflected for instance in their regional trade patterns analysed earlier.
At present, the following are some of the main obstacles to regional integration fulfilling its potential as a development tool for LDCs:
• The gap between the stated objectives of integration plans and projects, and their actual implementation;
• The relatively small size of economies, which means that RTA partners are much smaller export markets and that the resources available for common projects are limited, even when they are pooled;
• The low level of resources set aside for joint intraregional projects;
• Physical and infrastructural barriers that hamper the movement of goods, services and people among member countries of the same RTA (UNCTAD, 2009b);
• Simultaneous membership of several competing RTAs and overlapping mandates of many African RTAs.16
These limitations and the low level of development of most RTA members largely explain the rather low intraregional trade in most RTAs that include LDCs as members (tables 10 and 12). Yet, despite these shortcomings, many of the positive effects of regional integration are already evident. This shows the potential for achieving even more beneficial development outcomes once these shortcomings are — at least partially — overcome.
D. An agenda for action to create a NIDA for LDCs
The creation of a new international development architecture for the LDCs requires comprehensive reforms in the areas of finance, trade, commodities, technology and climate change. These should include: (i) systemic reforms of the global regimes governing these areas; (ii) the design of a new generation of ISMs for the LDCs, building on the lessons of the past; and (iii) enhanced South-South development cooperation in favour of LDCs. The main elements of an agenda for action, discussed in detail in the last three chapters of this Report, are presented in table 33 and briefly discussed below.
1. FINANCE
Given LDCs’ limited domestic financial resources, financing their development in a sustained and stable way is sometimes reduced to the question of the quantity and quality of aid. However, although the aid architecture remains important, this chapter seeks to place the financing challenge within a broader framework. It focuses on two major areas for action which would
Regional synergies can be created through joint investment infrastructure
projects and/or through the regional division of labour.
The gap between the stated objectives of integration
plans and projects, and their actual implementation is a major obstacle to regional
integration fulfilling its potential as a development
tool for LDCs.
Many of the positive effects of regional integration are
already evident and the potential for achieving even more beneficial development
outcomes, once existing shortcomings are overcome,
is clear.
The creation of a NIDA should include systemic
reforms of the global regimes, a new generation of ISMs
for the LDCs, and enhanced South-South development cooperation in favour of
LDCs.

145The Coming Decade and an Agenda for Action to Create a NIDA for LDCs
contribute to the creation of the proposed NIDA: (i) the provision of resources for productive investment, particularly through the promotion of domestic financial resource mobilization, the creation of innovative sources of long-term development finance and innovative uses of aid to develop productive capacities, in addition to debt relief; and (ii) the promotion of country ownership and creation of policy space to help mobilize and direct those resources in line with local conditions.
In this framework, aid certainly has an important role to play. Indeed, in the short and medium term there are major financing needs which can only be met through official financial flows. While humanitarian aid, to alleviate the immediate suffering of people living in abject poverty, is necessary, the major role of aid should be of a developmental nature. It should play a catalytic role in leveraging other forms of development finance. Thus aid should aim to promote greater domestic resource mobilization and the creation of an investment-profits nexus which is in LDCs based on the domestic private sector. This would also help LDCs to reduce their dependence on aid.
Priorities for systemic reforms in the global economic regime should include: (i) promoting domestic resource mobilization through increased aid for developing tax administration capability and financial deepening and with global financial and tax cooperation to reduce illicit capital flight and transfer pricing; (ii) promoting country ownership of national development strategies through reform and reduction of conditionalities and helping to rebuild developmental State capacities; and (iii) the enhancement of current debt relief initiatives show that the debt overhang in 20 LDCs which are current in debt distress, or at risk of debt distress is addressed. In addition, a new generation of ISMs should include: (i) increasing LDCs’ access to development finance by meeting DAC-countries aid commitments (0.15-0.20% of GNI); (ii) increasing share of aid for development of productive capacities through more aid for infrastructure and skills, innovative uses of aid, including new approaches to private sector development and PPPs incentivizing FDI in infrastructure development; (iii) supporting better aid management policies in LDCs, in particular through sharing experiences; and (iv) devising innovative sources of funding for LDCs, including in particular SDRs allocation. The design of contingency financing and anti-shock facilities for LDCs is also an important issue which is discussed and taken up further in the commodities pillar.
2. TRADE
In the area of trade, it is clear that the successful conclusion of a Doha Round of multilateral trade negotiations under the aegis of the WTO in a way which gives central importance to development outcomes for all developing countries would also benefit LDCs. In addition, the Report makes three major proposals. First, it supports the “early harvest” notion for LDCs, which was presented by LDC Trade Ministers in the context of the Doha Round negotiations. This includes, in particular, full implementation of duty-free and quota-free (DFQF) market access for all products originating from all LDCs, in line with Decision 36 of Annex F of the Hong Kong WTO Ministerial Declaration, and a waiver decision on preferential and more favourable treatment for services and service suppliers in LDCs. This Report proposes that implementing these measures should not be made contingent on the completion of the Doha Round. Providing full DFQF market access for LDCs on all product lines is also part of Goal 8 of the MDGs, and its
Aid should have a developmental nature and
play a catalytic role in leveraging other forms of
development finance.
Priorities for systemic reforms should include: (i)
promoting domestic resource mobilization; (ii) reform and reduction of conditionalities attached to assistance; (iii) the enhancement of current
debt relief initiatives.
ISMs should include: (i) the fulfilment by DAC donors of their commitment; (ii)
increasing the share of aid for the development of productive capacities through innovative
uses of finance; (iii) supporting better national aid management policies; and (iv) devising innovative sources of
funding for LDCs.

The Least Developed Countries Report 2010146
Table 33An agenda for action towards a New International Development Architecture
for the least developed countriesSystemic Reforms in Global
Economic RegimesSouth-South
Development CooperationLDC-specific International
Support Mechanisms
Finance • Promote domestic resource mobilization through: - Increased aid for developing tax
administration capability and financial deepening
- Global financial and tax cooperation to reduce illicit capital flight and transfer pricing
• Promote country ownership of national development strategies:- Reform and reduce conditionalities- Help rebuild developmental State
capacities• Enhance debt relief initiatives to
address the continuing debt burden in many LDCs
• Scale up official financial flows, including by diversifying funding sources
• Expand debt relief by Southern creditors
• Regional financing schemes (funds, development banks, joint investment projects)
• Establish regional development corridors
• Create synergies between South-South and North-South official financial flows
• Developing countries in a position to do so to adopt minimum share for LDCs of their official financial flows
• Increase the developmental impact of South-South FDI through:- Home and host country measures
and policies;- Multilateral financing of
diversification projects;
• Increase LDCs’ access to development finance by meeting DAC-countries aid commitments (0.15-0.20% of GNI)
• Support better aid management policies in LDCs
• Devise innovative sources of funding for LDCs, including in particular SDRs allocation
• Increase share of aid for development of productive capacities through:- More aid for infrastructure and
skills- Innovative uses of aid,
including new approaches to private sector development and PPPs incentivizing FDI in infrastructure development
Trade • Conclude the Doha Round giving central importance to the development outcomes for all developing countries
• Urgently implement the so-called “early harvest” without waiting for the completion of the Doha Round negotiations
• Deepen regional integration in South-South RTAs
• LDCs to develop a pro-active policy stance on South-South economic relations
• Foster regional trade through better information and trade facilitation
• Developing countries in a position to do so provide DFQF market access for LDC exports
• Enable LDCs to pursue strategic integration into global economy
• Empower LDCs to use all flexibilities provided under WTO rules
• Strengthen the special and differential treatment for LDCs
• Improve preferential market access for goods of LDCs, including 100 per cent DFQF by all developed countries
• Extend preferential market access for LDC services exports
• Simplify the accession of LDCs to the WTO
• Accelerate the provision of Aid for Trade through EIF
Commodities • Establish a counter-cyclical financing facility for low income commodity-dependent countries to deal with external shocks
• Set up an innovative commodity price stabilization schemes, including physical and virtual reserves
• Establish transaction tax (multi-tier) for commodity-derivative markets
• Establish a counter-cyclical loan facility indexed to debtors’ capacity to pay
• Strengthen ability of LDCs to manage resource rents
• Technical and financial assistance to enable resource-based industrialization
Technology • Make the global IPR regime more development friendly by- Creating a balance between
private and public dimensions of knowledge
- Supporting emergence of a new and coherent reality of technology transfer that complements domestic capabilities building
• Promote knowledge-intensive activities through mobilization of domestic resources
• Support the emergence of the learning-oriented developmental state that could facilitate knowledge based activities
• Share knowledge and experiences of industrial development strategies
• Set up regional R&D hubs• Strengthen South-South cooperation
on technology, including by providing finance on preferential terms for transfer of technology to LDCs
• Technology-sharing consortia• Technology licence bank for
LDCs• The International Spark Initiative
to promote enterprise innovation• The LDC Talents Abroad Initiative
to pool in the diaspora• Provide IP-related technical
assistance to LDCs that is comprehensive, coherent and development-focused
• Focus the technology transfer under Article 66.2 on expanding the reach of LDCs to technologies across the gamut of competencies in all sectors, accompanied by the know-how

147The Coming Decade and an Agenda for Action to Create a NIDA for LDCs
Table 33 (contd.)
accelerated implementation would be an important aspect of strengthening the Global Partnership for Development between 2010 and 2015, even though it has been negotiated in the WTO Doha Round. Secondly, LDCs should be empowered to use all the flexibilities already available under WTO rules to foster the development of their productive capacities and pursue their own form of strategic integration into the global economy. This will allow them to develop a new strategic trade policy to support their development and poverty reduction efforts in a manner compatible with the new post-crisis global macroeconomic environment. It would also enable them to take advantage of the new opportunities associated with South-South trade. However, to achieve all this they would need appropriate support. Thirdly, the EIF offers an important operational mechanism for ensuring that aid for trade development in the LDCs is focused on priority activities, and is integrated within national development and poverty reduction strategies. However, during the past decade, the flow of aid for trade, using the OECD statistical definition of this category, was increasing more slowly in LDCs than in other developing countries. A priority ISM for LDCs should be to accelerate that flow to LDCs, and ensure that it is directed at enhancing their productive capacities and international competitiveness in line with the principle of country ownership. Trade-related capacity-building should be seen as part of the wider objective of developing LDCs’ productive sectors and promoting the development of their private sectors. Thus, in addition to trade facilitation, it should include support for technological development and diversification out of commodity dependence.
3. COMMODITIES
In the area of commodities, the long-term goal should be structural transformation leading to more diversified economies. However, in the short and medium term, some new forms of international commodity policy are required.
LDCs should be empowered to use all the flexibilities already available under WTO rules to foster the development of their
productive capacities.
Systemic Reforms in Global Economic Regimes
South-South Development Cooperation
LDC-specific International Support Mechanisms
Climate change • Enhance the sustainability and predictability of climate change financing
• Develop accountable, transparent and representative climate finance governance
• Share knowledge and experience in mitigation and adaptation to climate change
• Strengthen South-South collaboration on renewable energy through technical cooperation, technology transfer, trade and investment.
• Make UNFCCC a key pillar of predictable and equitable climate change finance framework for LDCs
• Replenish and reform LDC Fund• Incorporate climate adaptation
project preparation facility in LDC fund.
• LDC-specific exceptions in mobilization of resources for climate change financing (e.g. Tuvalu proposal for differentiated taxation on international transport)
• Provide technical assistance to support implementation of REDD+ in LDCs
• Reform CDM to promote LDC access to renewable energy sector technology and finance
• Provide technical assistance to support LDC integration of climate adaptation and mitigation needs into national development plans
Source: UNCTAD secretariat.
EIF flows should accelerate and be directed at
enhancing their productive capacities and international
competitiveness.

The Least Developed Countries Report 2010148
Priority actions in the global economic regime could include the introduction of new measures for reducing the volatility of commodity markets and the adverse impacts of that volatility, such as:
(i) The establishment of a global countercyclical facility that ensures fast disbursement of aid at times of commodity price shocks, with low policy conditionality and high concessionary elements;
(ii) Setting up of innovative commodity price stabilization schemes, consisting of both physical and virtual reserve facilities;
(iii) Introduction of taxation measures to reduce speculation in global commodity markets; and
(iv) A counter-cyclical loan facilities indexed to debtors’ capacity to pay.
The new generation of ISMs in the area of commodities should focus on various kinds of financial and technical assistance to enable greater local value added and linkages from resource-based diversification. These should include support to LDCs for improving the use of resource rents and avoiding Dutch disease effects, investment in improving knowledge of their natural resource potential, and the provision of technical assistance for LDC negotiations with transnational corporations (TNCs) to ensure that a greater proportion of the rents from natural resource exploitation accrue to the LDCs, and that those rents support resource-based industrialization.
4. TECHNOLOGY
In the area of technology, the NIDA should focus on achieving a new balance between the private and public dimensions of knowledge. Knowledge is both a public good and a proprietary good (or quasi-private good), and includes features of both appropriability and exclusivity. The present global framework for technology issues is fragmented and incomplete, with a strong emphasis on proprietary knowledge in the form of intellectual property rights (IPRs). Within this framework, issues of technology transfer and knowledge accumulation — which are fundamental to improving productive capacities in LDCs — have been accorded secondary importance. The new knowledge architecture should focus on enabling a more development-friendly technology and IPR regime. It can do this by creating a balance between the public and private dimensions of knowledge and supporting the emergence of a new, coherent system of technology transfer that facilitates LDCs’ domestic efforts to build innovative capacity. It should also strengthen LDCs’ efforts to mobilize domestic resources to promote knowledge-intensive activities and the emergence of a learning-oriented developmental State.
New forms of international public goods are required to counter the continued marginalization of LDCs in the acquisition and use of technologies, and also to achieve a gradual realignment of incentives provided under the global IPR regime. The Report makes specific proposals to make TRIPS Article 66.2 work for the LDCs. The Report also offers specific proposals for new ISMs for LDCs in the area of technology, as follows:
(i) Regional technology sharing consortia; (ii) A technology licence bank; (iii) A multi-donor trust fund for financing enterprise innovation in LDCs;
and(iv) Diaspora networks to pool LDC talents from abroad.
Priority actions in the global economic regime could
include the introduction of new measures for reducing the volatility of commodity markets and the adverse impacts of that volatility.
ISMs in the area of commodities should focus on enabling greater local value
added and linkages from resource-based diversification.
The new knowledge architecture should focus on
enabling a more development-friendly technology and
IPR regime by creating a balance between the public and private dimensions of
knowledge and supporting the emergence of a new, coherent system of technology transfer.
New forms of international public goods are required to counter the continued
marginalization of LDCs in the acquisition and use of
technologies.

149The Coming Decade and an Agenda for Action to Create a NIDA for LDCs
These knowledge-based global public goods would help overcome some major limitations of the innovation environment in LDCs.
5. CLIMATE CHANGE ADAPTATION AND MITIGATION
The proposals concerning technology also apply to some of the international policies for climate change adaptation and mitigation. In addition, a critical priority at present is the establishment of an overall architecture for financing such mitigation and adaptation to increase the volume, predictability and sustainability of such financing. It is important for climate-change-related financing to be consistent with the United Nations Framework Convention on Climate Change (UNFCCC) and the Bali Action Plan which targets finance for the promotion of sustainable economic development. Specific ISMs for LDCs include: adequate financing of the LDC Fund (LDCF), increasing technical assistance to LDCs for incorporating climate adaptation needs into their national development strategies, constructive engagement in helping LDCs to reduce emissions from deforestation and forest degradation (REDD), and improved access for LDCs to the Clean Development Mechanism (CDM) as a means of overcoming the financial barriers that prevent LDCs’ access to renewable energy technology. The implementation and adoption of LDC proposals on transportation levies and carbon taxes, which call for various exceptions for LDCs, should also be supported.
6. SOUTH-SOUTH DEVELOPMENT COOPERATION
South-South cooperation is a cross-cutting issue relating to all the pillars of the proposed NIDA. In general, the increasing integration of LDCs with some large and fast-growing economies (such as Brazil, China, India and South Africa — the so-called emerging countries), and to a lesser extent with ODC partners in regional trade agreements (RTAs) through trade, FDI, official development finance and knowledge-sharing can help LDCs develop their productive capacities. To this end, South-South economic relations need to foster domestic economic linkages, employment creation, technological learning, diversification and upgrading of output and exports and the strengthening of State capacities. At present, this potential is being realized only to a limited extent — far below its possibilities. In order to fulfil the development potential of the evolving South-South economic relations, the Report makes the following recommendations for the proposed NIDA:
• Strengthening South-South development cooperation, by intensifying development cooperation activities and projects, sharing knowledge of successful alternative development strategies adopted by ODCs, improving the transparency of South-South development cooperation, and increasing the synergy between North-South and South-South development cooperation;
• Deepening regional integration through RTAs in which LDCs participate, through measures taken by RTA partners and supported by large developing countries, developed-country donors and multilateral institutions;
• Increasing the development impact of South-South FDI by means of home- and host-country policies and through different agreements between TNCs from the South and LDC host Governments;
ISMs for LDCs in the area of technology include: (i)
Regional technology sharing consortia; (ii) A technology
licence bank; (iii) A trust fund for financing enterprise innovation in LDCs; and (iv)
Mobilizing LDC diaspora networks.
A critical priority at present is the establishment of an overall
architecture for financing climate change adaptation and mitigation to increase the volume, predictability and sustainability of such
financing.
ISMs for LDCs include: adequate financing of the
LDC Fund, increasing technical assistance to LDCs, constructive engagement in
REDD, and improved access to the CDM.
In the area of South-South relations, the NIDA should
include: strengthening South-South development cooperation; deepening
regional integration; increasing the development impact of South-South FDI;
enhancing the transfer of technology from developing
countries to LDCs; and broadening market access
for LDCs.

The Least Developed Countries Report 2010150
• Enhancing the transfer of technology from developing countries to LDC workers, firms and farms, including technology relating to “new” areas (e.g. sustainable energy and climate change); and
• Broadening market access for LDCs’ exports of goods and services.
The Report proposes the following specific ISMs for consideration within South-South cooperation:
• Developing countries in a position to do so should set aside a minimum share of their official development finance for LDCs;
• Special mechanisms dedicated to LDCs should be established in South-South political forums (e.g. Forum on China-Africa Cooperation);
• RTAs should adopt SDT measures for LDCs;
• Large and dynamic developing countries in a position to do so should offer DFQF market access to LDC exports;
• Large and dynamic developing countries should finance transfer of their technologies to LDCs on preferential terms;
• South-South collaboration on renewable energy should be strengthened through technical cooperation, trade and investment.
In order to improve the development impact of these actions, LDC Governments need to formulate proactive strategies for their deeper economic integration with the other countries of the South. This should include enacting policies that steer this process to maximize its contribution to the development of their productive capacities.
Together, these proposals constitute an ambitious agenda for action. The remainder of this Report discusses the specific proposals in more detail.
ISMs for consideration within South-South cooperation are: a minimum share of their official development finance for LDCs; Special mechanisms dedicated to
LDCs in South-South political forums; SDT measures for LDCs within RTAs; finance
transfer of their technologies to LDCs; South-South
collaboration on renewable energy.

151The Coming Decade and an Agenda for Action to Create a NIDA for LDCs
Notes1 A full technical description of the model is available at: http://www.un.org/esa/policy/
publications/ungpm.html2 Adaptation involves adjusting practices, processes and capital in response to actual or
potential climate change, as well as changes in the policy environment, including social and institutional structures. Adaptation assists in moderating potential damages, takes advantage of opportunities and helps cope with the consequences of climate change. Climate change mitigation refers to actions aimed at reducing the causes of climate change, including reducing greenhouse gas (GHG) emissions and/or enhancing their sinks (i.e. increasing the uptake of CO2 by forests, plants and soils), so as to prevent further global warming. However, it is important to note that some adaptation measures may also constitute mitigation actions, which entail financial costs in terms of trade-offs with economic development.
3 Throughout this Report reference is made to the emergency events database, EM-DAT, of the Centre for Research on the Epidemiology of Disasters (CRED) for data on natural and climatological disasters (http://www.emdat.be/). EM-DAT distinguishes between two generic categories of disasters: natural and technological. The natural disaster group has five subgroups: biological, geophysical, climatological, hydrological and meteorological. These in turn cover 12 disaster types and more than 32 sub-types. Here, we focus on the natural disaster generic group and the climatological data subgroup, which comprises events caused by long-term meso- to macro-scale processes (in the spectrum from intraseasonal to multidecadal climate variability), such as extreme temperatures, droughts and wildfires. Where reference is made to extreme weather events, this includes data from the hydro-meteorological subgroups specifically relating to drought, floods, storms and extreme temperatures.
4 See Haitian Government’s Directorate of Civil Protection estimates, at: http://earthquake.usgs.gov/earthquakes/eqinthenews/2010/us2010rja6/#summary.
5 UNCTAD secretariat estimates, based on EM-DAT: OFDA/CRED International Disaster Database.
6 In this section developing countries are grouped into three categories: (i) major developing trade partners (MDTPs); (ii) RTA partners; and (iii) developing economies not elsewhere specified (n.e.s.) For the full names, composition and explanation of the choice of RTA groups mentioned in this chapter, see p.xxx of this Report).
7 The shares mentioned in the text and in the tables refer to trade values. Therefore, the corresponding growth rates reflect both volume and price developments.
8 The following RTAs are considered for the trade flow analysis in the present section: ASEAN Free Trade Area (AFTA), Caribbean Community (CARICOM), Common Market for Eastern and Southern Africa (COMESA), Economic Community of Central African States (ECCAS), Economic Community of West African States (ECOWAS), Pacific Island Countries Trade Agreement (PICTA), Southern African Development Community (SADC), SAARC Preferential Trade Arrangement (SAPTA), Arab Maghreb Union (UMA) (see p.xxx of this Report).
9 For the classification of goods used here, see p.xxx of this Report.10 Between 1995–1996 and 2007–2008, approximately three quarters of the increase in fuel
export revenues was due to price effects, while the remaining was due to volume growth. 11 There is also a Chinese industrial zone in Sierra Leone, which it is driven by the Chinese
private initiative, without “official” support.12 See, for example, Lucas, 1988; Young, 1991; Grossman and Helpman,1991: 237–257;
Rivera-Batiz and Romer, 1991; Feenstra, 1996; and Fujita, Krugman and Venables,1999. 13 Empirical studies suggest that exports of labour-intensive manufactures from the MDTPs
have jeopardized domestic, regional and global markets for producers of the same goods in several African LDCs. The strong rise in imports of clothing, textiles, leather goods and footwear from MDTPs over the last 10 years has been associated to declines in domestic output and employment of the corresponding industries in Ethiopia, Lesotho, Madagascar and Senegal (Ademola, Bankole and Adewuyi, 2009; Kaplinsky, 2008; Gebre-Egziabher, 2009; Hazard et al., 2009). Exports of those products as well as natural resource-intensive manufactures by MDTPs have displaced intra-regional trade in Africa (Khan and Baye, 2008; Onjala, 2008; Burke, Naidu and Nepgen, 2008), as well as the exports of those goods by African producing countries (including LDCs) to third markets (Kaplinsky, 2008; Giovannetti and Sanfilippo, 2009). Empirical studies also indicate that the rise of the exports of MDTPs are affecting exports of South Asian LDCs in third markets (Qureshi and Wan, 2008). More broadly, the share of RTA partners in total imports of African and Asian LDCs and Haiti declined between 1995–1996 and 2007–2008, while that of MDTPs rose. These changes were especially strong in African LDCs, where the share of RTA partners fell by 11 percentage points, while that of MDTPs rose by 17 percentage points.

The Least Developed Countries Report 2010152
14 South-South official development finance corresponded to between 7.8 per cent and 9.8 per cent of total ODA flows in 2006 (United Nations, 2008).
15 There is extensive literature on regional integration among developing countries including, for example, UNCTAD, 2005a and 2008; UNECA, 2004, 2006, 2008 and 2010; and Schiff and Winters, 2003.
16 Out of the 53 member States of the African Union (including all the 33 African LDCs), 26 belong to two RTAs, 20 belong to three of them and one State belongs to four RTAs (UNECA, 2006).
ReferencesAdemola OT, Bankole A-S and Adewuyi AO (2009). China-Africa trade relations: Insights from
AERC scoping studies. European Journal of Development Research, 21(4) September: 485–505.
Aguilar R and Goldstein A (2009). The chinisation of Africa: The case of Angola. World Economy, 32(11) November: 1543–1562.
Balat, JF and Porto G (2007). Globalization and complementary policies: Poverty impacts on rural Zambia. In: Harrison A, ed., Globalization and Poverty. Chicago, University of Chicago Press: 373–415.
Barker T, Bashmakov I, Alharthi A, Amann M, Cifuentes L, Drexhage J, Duan M, Edenhofer O, Flannery B, Grubb M, Hoogwijk M, Ibitoye FI, Jepma CJ, Pizer WA, Yamaji K (2007). Mitigation from a cross-sectoral perspective. In Metz B, Davidson OR, Bosch PR, Dave R and Meyer LA, eds, Climate Change 2007: Mitigation. Contribution of Working Group III to the Fourth Assessment Report of the Intergovernmental Panel on Climate Change. Cambridge and New York, Cambridge University Press.
Brautigam D, Farole T and Xiaoyang T (2010). China’s investment in African special eocnomic zones : Prospects, challenges, and opportunities. Economic Premise No.5. Washington, DC, World Bank, March.
Burke C, Naidu S and Nepgen A (2008). Scoping study of China’s relations with South Africa. Nairobi, African Economic Research Consortium.
Centre for Chinese Studies (2006). China’s interest and activity in Africa’s construction and infrastructure sectors. Stellenbosch, Centre for Chinese Studies, University of Stellenbosch.
Christensen JH, Hewitson B, Busuioc A, Chen A, Gao X, Held I, Jones R,. Koli RK, Kwon W-T, Laprise R, Rueda VM, Mearns L, Menéndez CG, Räisänen J, Rinke A, Sarr A and Whetton P (2007). Regional climate projections. In: Solomon S, Qin D. Manning M, Chen Z, Marquis M, Averyt KB, Tignor M and Miller HL, eds., Climate Change 2007: The Physical Science Basis. Contribution of Working Group I to the Fourth Assessment Report of the Intergovernmental Panel on Climate Change. Cambridge, Cambridge University Press: 847–940.
Couharde C, Davis J and Generoso R (2010). LDC climate variability, agricultural income and migration (forthcoming).
Cripps F (2010). LDC challenges for the next decade: An analysis using UN-DESA’s Global Policy Model. Study prepared for UNCTAD as a background document to The Least Developed Countries Report 2010. Geneva, UNCTAD.
FAO (2007). The State of Food and Agriculture. Rome, Food and Agricultural Organization. Available at: www.fao.org/docrep/010/a1200e/a1200e00.htm.
Feenstra R (1996). Trade and uneven growth. Journal of Development Economics, 49(1), April: 229-256.
Fujita M, Krugman P and Venables AJ (1999). The Spatial Economy: Cities, Regions, and International Trade. Cambirdge, MA and London, MIT Press.
Gebre-Egziabher T (2009). The developmental impact of Asian drivers on Ethiopia with emphasis on small-scale footwear producers. World Economy, 32(11): 1613–1637.
Giovannetti G and Sanfilippo M (2009). Do Chinese exports crowd-out African goods? An econometric analysis by country and sector. European Journal of Development Research, 21(4) September: 506–530.
Global Humanitarian Forum (2009). The anatomy of a silent crisis. Geneva, Global Humanitarian Forum.
Grossman GM and Helpman E (1991). Innovation and Growth in the Global Economy. Cambridge, MA, MIT Press.
Hazard E, De Vries L, Barry MA and Anouan AA (2009). The developmental impact of the Asian drivers on Senegal. World Economy, 32(11) November: 1563–1585.
Huq S, Rahman A, Konate M, Sokona Y and Reid H (2003). Mainstreaming Adaptation to Climate Change In Least Developed Countries (LDCs). Report by International Institute

153The Coming Decade and an Agenda for Action to Create a NIDA for LDCs
for Environment and Development, London. Available at: http://www.iied.org/pubs/pdfs/9219IIED.pdf.
IFPRI (2009). Climate Change: Impact on Agriculture and Costs of Adaptation (updated in October). Washington, DC, International Food Policy Research Institute.
Kaplinsky R (2008). What does the rise of China do for industrialisation in Sub-Saharan Africa? Review of African Political Economy, 35(115) March: 7–22.
Khan SA and Baye FM (2008). China-Africa economic relations: The case of Cameroon. Nairobi, African Economic Research Consortium.
McCarthy JJ, Canziani OF, Leary NA, Dokken DJ and White KS, eds. (2001). Climate Change 2001: Impacts, Adaptation, and Vulnerability. Contribution of Working Group II to the Third Assessment Report of the Intergovernmental Panel on Climate Change. Cambridge, Cambridge University Press.
Kasterine A and Vanzetti D (2010). The effectiveness, efficiency and equity of market-based instruments to mitigate GHG emissions from the agri-food sector. In: UNCTAD, Trade and Environment Review 2009/2010. Geneva, UNCTAD ( accessible at: www.unctad.org/Templates/WebFlyer.asp?intItemID=5304&lang=1).
Klinger B (2009). Is South-South trade a testing ground for structural transformation? Policy Issues in International Trade and Commodities Study Series, No. 40. New York and Geneva, United Nations Conference on Trade and Development.
Kragelund P (2010). The potential role of non-traditional donors’ aid in Africa. Geneva, International Centre on Trade and Sustainable development.
Kruger AC and Shongwe S (2004). Temperature trends in South Africa: 1960–2003. International Journal of Climatology, 24: 1929–1945.
Lucas RE Jr (1988). On the mechanics of economic development. Journal of Monetary Economics, 22(1): 3–42.
Onjala J (2008). A scoping study on China-Africa economic relations: The case of Kenya. Nairobi, African Economic Research Consortium.
Qureshi MS and Wan G (2008). Trade expansion of China and India: threat or opportunity. Research Paper, No.2008/08, February .Maastricht, United Nations University - World Institute for Development Economics Research.
Rivera-Batiz LA and Romer PM (1991). International trade with endogenous technological change. European Economic Review, 35(4), May: 971–1004.
Rowlands D (2008). Emerging donors in international development assistance: A synthesis report. Ottawa, International Development Research Centre.
Rumney R and Pingo M (2004). Mapping South Africa’s trade and investment in the region. In: Stability, poverty reduction and South African trade and investment in Southern Africa. Pretoria, South African Regional Poverty Network: 16–23.
Schiff M and Winters LA (2003). Regional Integration and Development. Washington, DC, World Bank.
Shirotori M and Molina AC (2009). South-South trade: The reality check. Issues in the New Geography of International Trade. Geneva, United Nations Conference on Trade and Development.
UNCTAD (2004). The Least Developed Countries Report 2004: Linking International Trade with Poverty Reduction. United Nations publication, sales no. E.04.II.D.27. New York and Geneva, United Nations Conference on Trade and Development.
UNCTAD (2005a). Economic Development in Africa 2005: Rethinking the Role of Foreign Direct Investment. United Nations publication, sales no. E.05.II.D.12. New York and Geneva, United Nations Conference on Trade and Development.
UNCTAD (2005b). Trade and Development Report 2005: New Features of Global Interdependence. United Nations publication, sales no. E.05.II.D.13. New York and Geneva, United Nations Conference on Trade and Development.
UNCTAD (2006a). The Least Developed Countries Report 2006: Developing Productive Capacities. United Nations publication, sales no. E.06.II.D.9. New York and Geneva, United Nations Conference on Trade and Development.
UNCTAD (2006b). World Investment Report 2006: FDI from Developing and Transition Economies: Implications for Development. United Nations publication, sales no. E.06.II.D.11. New York and Geneva, United Nations Conference on Trade and Development.
UNCTAD (2007a). The Least Developed Countries Report 2007: Knowledge, Technological Learning and Innovation for Development. United Nations publication, sales no. E.07.II.D.8. New York and Geneva, United Nations Conference on Trade and Development.
UNCTAD (2007b). Trade and Development Report 2007: Regional Cooperation for Development. United Nations publication, sales no. E.07.II.D.11. New York and Geneva, United Nations Conference on Trade and Development.
UNCTAD (2009a). The Least Developed Countries Report 2009: The State and Development Governance. United Nations publication, sales no. E.09.II.D.9. New York and Geneva, United Nations Conference on Trade and Development.
The Least Developed Countries Report 2010154
UNCTAD (2009b). Economic Development in Africa Report 2009: Strengthening Regional Economic Integration for Africa’s Development. United Nations publication, sales no. E.09.II.D.7. New York and Geneva, United Nations Conference on Trade and Development.
UNCTAD (2010a). Economic Development in Africa Report 2010: South-South Cooperation: Africa and the New Forms of Development Partnership. United Nations publication, sales no. E.10.II.D.13. New York and Geneva, United Nations Conference on Trade and Development.
UNCTAD (2010b). Trade and Development Report, 2010: Employment, Globalization and Development. United Nations publication, sales no. E.10.II.D.3. New York and Geneva, United Nations Conference on Trade and Development.
UN-DESA (2009). World Economic and Social Survey 2009: Promoting Development, Saving the Planet. New York, United Nations Department for Economic and Social Affairs. United Nations publication, sales no. E.09.II.C.1. New York, United Nations.
UNECA (2004). Assessing Regional Integration in Africa (ARIA I). ECA Policy Research Report. Addis Ababa, Economic Commission for Africa.
UNECA (2006). Assessing Regional Integration in Africa II (ARIA II): Rationalizing Regional Economic Communities. Addis Ababa, Economic Commission for Africa.
UNECA (2008). Assessing Regional Integration in Africa III (ARIA III): Towards Monetary and Financial Integration in Africa. Addis Ababa, Economic Commission for Africa.
UNECA (2010). Assessing Regional Integration in Africa IV (ARIA IV): Enhancing Intra-African Trade. Addis Ababa, Economic Commission for Africa.
UNFCCC (2007). Investment and financial flows to address climate change. Bonn, UNFCCC secretariat.
UNFCCC (2008). Investment and financial flows to address climate change: An update. FCCC/TP/2008/7. Bonn, UNFCCC secretariat, 26 November.
UNFCCC (2009a). Financing climate action: Investment and financial flows for a strengthened response to climate change. Fact Sheet, June, Bonn, UNFCCC Secretariat.
United Nations (2008). Trends in South-South and triangular development cooperation: Background study for the Development Cooperation Forum. New York, United Nations, April.
United Nations (2010). World Economic Situation and Prospects 2010. Update as of mid-2010. New York, United Nations. Available at: http://www.un.org/esa/policy/wess/wesp2010files/wesp10update.pdf.
UN-OHRLLS (2009). The impact of climate change on the development prospects of the least developed countries and small island developing States. New York, UN-OHRLLS.
Ventura-Dias V (2010). South-South cooperation as a credible international support instrument for structural change in LDCs. Study prepared for UNCTAD as a background document to The Least Developed Countries Report 2010. Geneva, United Nations Conference on Trade and Development.
Young A (1991). Learning by doing and the dynamic effects of international trade. Quarterly Journal of Economics, 106(2): 369–405.

Chapter
5An Agenda for Action:
(I) Finance and (II) Trade
Governments of the LDCs face many challenges in fostering sustainable growth and structural transformation in a manner that would reduce poverty substantially. Following the analyses in chapters 2 to 4, this Report advocates a paradigm shift towards new, more inclusive development paths based on promoting the productive capacities of LDCs through a strengthened developmental role of the State. This should be facilitated by means of a new international development architecture (NIDA) for the LDCs which encompasses both coherent systemic reforms of the global economic regimes of relevance to the LDCs and improved LDC-specific international support mechanisms (ISMs). Policy changes are necessary in all the five major pillars of the NIDA — finance, trade, commodities, technology and climate change. This chapter focuses on two pillars which generally receive the most attention. These are, firstly, the financial architecture, including domestic resource mobilization, private capital flows, aid, investment and debt relief, and secondly, the multilateral trade regime.
A. Finance
Of the five pillars of the NIDA, finance is the most fundamental. Capital accumulation is at the centre of the growth process, and is intimately linked with technological change and structural transformation. And increased investment is the key to an effective development strategy of catching up: it is needed for expanding productive capacities and productive employment, reducing commodity dependence, upgrading production of simple manufactures and promoting productivity growth.
As indicated in chapter 3, the central problem for LDCs is that they need to raise investment levels in order to achieve sustained growth, structural transformation and poverty reduction, but their domestic resources are grossly inadequate for financing not simply investment but also national governance. In addition, owing to their structural vulnerabilities, their economies are very volatile — a situation which discourages long-term investment and encourages very short-term, opportunistic entrepreneurial activity. Such activity is often focused on natural resource extraction, which does little to build the productive base of their economies.
Given the current low levels of domestic financial resources in LDCs, their problem of financing development in a sustained and stable way is sometimes reduced to the question of the quantity and quality of aid. But while the aid architecture remains important, this chapter seeks to place the financing challenge in a broader framework. It focuses on two major areas for action within a positive agenda for NIDA. These are: (i) the provision of resources for productive investment, particularly through the promotion of domestic financial resource mobilization, the creation of innovative sources of long-term development finance and innovative uses of aid to develop productive capacities, in addition to debt relief; and (ii) the promotion of
Policy changes are necessary in all the five major pillars of the NIDA. This chapter
focuses on two pillars which generally receive the most
attention.
Of the five pillars, finance is the most fundamental.
Capital accumulation is at the centre of the growth process, and is intimately linked with
technological change and structural transformation.
The central problem for LDCs is that they need to raise
investment levels, but their domestic resources are
grossly inadequate.
The Least Developed Countries Report 2010156
country ownership and creation of policy space to help mobilize and direct those resources in line with local conditions.
In this framework, aid certainly has an important role to play. Indeed, in the short and medium term there are major financing needs which can only be met through official financial flows. However, the major role of aid should not be humanitarian, to alleviate the immediate suffering of people living in abject poverty; rather it should be developmental and should play a catalytic role in leveraging other forms of development finance. Thus the role of aid should be to promote greater domestic resource mobilization and to promote the creation of an expanding investment-profits nexus embedded within LDCs and based on the domestic private sector. This would also help LDCs’ reduce aid dependence. This section of the chapter proposes a number of specific elements of a positive agenda that would support this strategic orientation.
Many of the elements of the positive agenda involve systemic reforms rather than LDC-specific international support mechanisms. However, one major thrust of these systemic reforms is to promote development financing practices that are more suited to the LDC context. Some LDC-specific international support mechanisms also proposed are: (i) the fulfilment of existing commitments by DAC donors to provide 0.15 or 0.20 per cent of their gross national income (GNI) to LDCs through innovative sources of financing; (ii) technical support for the improvement of national aid management policies in LDCs, including through annual forums, to enable them to exchange relevant information and experiences; and (iii) increased efforts to enhance the development impact of untying aid by DAC donors. The design of contingency financing and anti-shock facilities to ensure real macroeconomic stability in LDCs is also discussed. A specific proposal is made under the commodities pillar.
1. PROMOTING DOMESTIC FINANCIAL RESOURCE MOBILIZATION
Greater mobilization of domestic financial resources is key to reducing aid dependence. Recent data indicate that official development assistance was on average equivalent to 39 per cent of total public expenditure in 44 LDCs during the period 2006-2008 (Weeks, 2010). In a sample of 25 LDCs in 2008, the median amount of country programmable aid (which excludes humanitarian aid, debt relief, administrative costs, food aid and core funding for NGOs from total aid) was equivalent to 80 per cent of government final consumption expenditure. Building the capacity as well as real democratic foundations of developmental States requires increased domestic tax and revenue generation. National efforts in this regard involve both the public sector, through improved tax mobilization, and the private sector, through greater savings mobilization for domestic investment. The national efforts can be supported by a number of international measures such as: (i) helping build capacity for tax mobilization; (ii) financial and tax cooperation; and (iii) supporting development of the financial sector in the LDCs. Natural resource development strategies are also significant for enhancing domestic financial resource mobilization (as discussed in chapter 6).
(a) Capacity-building for tax mobilization
Donor agencies and international organizations can assist LDCs in building competent and effective tax administrations. They already provide technical assistance and capacity-building support to national revenue agencies, but can
Greater mobilization of domestic financial resources
is key to reducing aid dependence.
The national efforts can be supported by a number of
international measures such as: (i) helping build capacity
for tax mobilization; (ii) financial and tax cooperation;
and (iii) supporting development of the financial
sector in the LDCs.
157An Agenda for Action: (I) Finance and (II) Trade
do considerably more by providing training and equipment. Capacity-building should foster a creative approach to tax mobilization which recognizes the realities of the current level of development of the LDCs.1 As argued in the LDC Report 2009, there is a need to increase domestic indirect taxes and to pay greater attention to property taxes, which could be a strong potential source of government revenues. Strengthening property taxes is particularly important in the context of fast urbanization. Such a policy would not only help to make the general tax structure more progressive, it could also help to finance urban infrastructure needs. A strategy that helps to boost the productivity of urban informal economic activities through credit, training and internet connectivity could also be part of a social contract whereby hitherto untaxed informal enterprises are brought into the formal system.
A “matching fund” approach to some aid flows could also be a useful element of reforms to strengthen government capacities for greater domestic resource mobilization. As explained in the LDC Report 2009, currently donors often provide budget support when a Government specifies its expenditure needs and calculates a financing gap to be filled through official development assistance (ODA). However, such an approach can be a disincentive to Governments to raise their own domestic revenues. A better option would be for donors to agree to match a percentage of funds collected by the Governments, up to a fixed limit (Di John, 2008). Such additional matching funds would thereby constitute an incentive to recipient Governments to raise more revenues.
(b) Financial and tax cooperation2
Global financial and tax cooperation to address the issue of illegal capital outflows, including from LDCs, would further support domestic financial resource mobilization in LDCs. It is difficult to estimate the exact amount of illicit outflows of finance from developing countries – including both capital outflows, which are illegally earned, transferred or utilized, and trade invoicing through overpricing of imports and/or underpricing of exports –, but they appear to be very significant. One recent estimate of illicit outflows of finance from developing countries from these two sources alone suggested a magnitude of between $373 billion and $435 billion in 2002, rising to between $859 billion and $1.09 trillion in 2006 (Kar and Devon, 2008). Emerging-market economies and some of the more advanced developing countries accounted for the largest share of the illicit outflows from developing countries, while African countries accounted for only 3–4 per cent, and about half of the African total originated in Nigeria. However, available country-specific data relating to particular LDCs suggest that, even though the absolute amounts of such outflows from LDCs are small compared to those from the more advanced developing countries, they are significant relative to their own GDP, aid receipts or export earnings. In a few countries (e.g. Angola, Ethiopia, the Gambia, Guinea, Madagascar, the Sudan and Uganda), illicit outflows over the period 1970–2008 exceeded net ODA receipts, in some (e.g. in Angola, Guinea and Uganda) by a considerable margin. Across all African LDCs, illicit outflows amounted to some 65 per cent of ODA inflows, on average, over this 38-year period (Culpeper, 2010).
International support to staunch this type of capital flight (but not the legitimate capital outflows based on formal decisions by investors to move money out of developing countries) would require greater financial and tax cooperation. So far, financial and banking authorities in a number of developed and developing countries have been complicit in attracting and domiciling
There is a need to increase domestic indirect taxes and to pay greater attention to
property taxes, which could be a strong potential source of
government revenues.
A “matching fund” approach to some aid flows could also be a useful element of reforms to strengthen
government capacities for greater domestic resource
mobilization.
Global financial and tax cooperation to address
the issue of illegal capital outflows, including from
LDCs, would further support domestic financial resource
mobilization in LDCs.

The Least Developed Countries Report 2010158
illicit capital flight through secrecy and other non-transparent mechanisms. Such regimes have protected wrongdoers and at the same time deprived developing countries of investment capital. This practice needs to be outlawed through financial cooperation involving collaboration between the financial sector and banking authorities. The ultimate aim would be to repatriate illicit capital to the countries of origin. The Financial Action Task Force could expedite moves for greater disclosure by enhancing its recommendations on transparency in the global financial system.
By virtue of intra-firm transactions, TNCs are able to shift profits from higher to lower tax jurisdictions in order to minimize global tax liabilities. The most common manifestation of such transfer pricing arrangements involves over- (or under-) invoicing import costs in high- (or low-) tax jurisdictions while under- (over-) invoicing export costs in order to reduce (or increase) taxable profit margins. It is difficult to uncover such transfer pricing arrangements, since TNCs typically report earnings on a globally consolidated basis, thus obscuring the configuration of their country-specific revenues and expenses. However, it is now evident, in the wake of the current economic and financial crisis, that OECD countries are themselves increasingly concerned about substantial tax losses due to transfer pricing, and are, for the first time, prepared to confront the problem. Accordingly, some OECD countries are currently aiming to move towards requiring country-by-country reporting of TNCs headquartered in their jurisdictions. A recommendation by the International Accounting Standards Board that all transnational corporations should adopt country-by-country reporting would expedite uniformity and universality in this regard. It would also assist host developing countries in getting a truer picture of TNC profits realized in their jurisdiction, and potentially in obtaining a fairer share of the global taxes levied on such TNCs.
In order to stem illicit capital outflows, the LDCs should also consider imposing some levels of capital controls. Although this is unorthodox, the principle that some forms of time-bound and limited capital controls are important for achieving development objectives is now increasingly accepted. For example, the IMF (2010) has agreed with the idea of using capital controls on a short-term basis to deal with the effects of volatility and uncertainty in international financial markets.
(c) Financial deepening
Since an essential part of the new development paradigm entails a much greater focus on the creation of employment in the productive sectors, strengthening the financial sector to ensure that savings are allocated to commercially viable activities is paramount. Donors and international agencies can support the creation of a more active and dynamic financial sector in the LDCs in a number of ways, including through the provision of technical assistance. For example, the establishment of credit reference bureaus is important to facilitate transactions by reducing the information asymmetry facing lenders. Additionally, many donor countries continue to maintain development financing institutions to provide credit and business advice to their small and medium-sized enterprises (SMEs). These institutions could advise their newly established (or re-established) counterparts in LDCs on how to operate independently on a commercially viable basis, and help them achieve their development objectives. It is true that in the past such institutions had a poor track record. However, particularly in the wake of the global financial crisis, it is necessary to re-assess the role for public sector
In some LDCs, illicit outflows over the period 1970–2008 exceeded net ODA receipts.
By virtue of intra-firm transactions, TNCs are able to shift profits from higher
to lower tax jurisdictions in order to minimize global tax
liabilities.
Since an essential part of the new development paradigm entails a much greater focus
on the creation of employment in the productive sectors,
strengthening the financial sector to ensure that savings
are allocated to commercially viable activities is paramount.
159An Agenda for Action: (I) Finance and (II) Trade
banks or development financing institutions in an LDC context where private enterprises face a permanent credit crunch. There are also new approaches to increasing access to finance in which targeted and time-limited government interventions help private financial institutions to address specific market failures, for example, through acting to enable private intermediaries to achieve economies of scale or reduce the costs of providing specific financial services (de la Torre, Gozzi and Schmukler, 2007). Examples of such pro-market public activism are operational in middle-income countries, and could also be more widely applied in LDCs. Also, particular attention should be given to mobilizing rural savings, given the continuing dependence of the majority of the population in LDCs on agriculture.
2. INNOVATIVE SOURCES OF FINANCE
Over the next decade, LDCs will face extraordinary challenges for which domestic financial resources are likely to be inadequate, even if more can be mobilized. Against this background there is a continuing need for DAC donors to fulfil their past commitments to provide aid to LDCs equivalent to 0.15 or 0.20 per cent of their GNI. However, if national aid budgets are not increased, new and innovative sources of financing will be required to help LDCs tackle their development challenges.
Over the past decade, and particularly since the 2002 Monterrey Conference on Financing for Development, there has been a number of ideas for new and innovative funding mechanisms for development (Atkinson, 2004). The challenge of identifying and launching new mechanisms was taken up by the Leading Group on Innovative Financing for Development formed in 2006 and now comprising 55 member States (of which 13 OECD members) and 4 observer countries. The Leading Group emerged out of a concern that the MDG targets may not be met. It has spearheaded an airline ticket levy, the International Finance Facility for Immunization, and the Advance Market Commitment for pharmaceutical research. The first two initiatives have raised $500 million and $1.2 billion respectively. However, the discussion on innovative financing and the Leading Group predate both the growing consensus on the enormity of the costs of climate change adaptation and mitigation, as well as the global economic crisis of 2008-2009, which have significantly altered the terms of the debate as well as the scope of the challenge (see chapter 7).
In the wake of the crisis, financial sector taxes (now including taxes on domestic financial transactions, or a financial transaction tax and a currency transaction tax) are increasingly being viewed as prudential mechanisms to inhibit speculation as well as means of mobilizing public revenue from a sector that has been seen as paying less than its share of taxes. But most of all, taxes on the financial sector are now considered necessary to help pay for the deficits spawned by the stimulus measures (beyond bank bailouts) that most industrialized countries enacted to thwart a possible depression. However, there is currently very little consensus on introducing these taxes and using the revenues for international development purposes.
Against this background, perhaps the most promising innovative source of financing for meeting aid commitments to the LDCs is from an additional allocation of special drawing rights (SDRs). The G-20 meeting in April 2009 resulted in a decision to substantially expand the amount of SDRs almost tenfold, from SDR 21.4 billion to SDR 204 billion, or the equivalent of $318
Donors and international agencies can support the creation of a more active
and dynamic financial sector in the LDCs in a number
of ways, including through the provision of technical
assistance.
Over the next decade, LDCs will face extraordinary
challenges for which domestic financial resources are likely
to be inadequate. There is a continuing need for DAC donors to fulfil their past
commitments to provide aid to LDCs equivalent to 0.15 or
0.20 per cent of their GNI.
Perhaps the most promising innovative source of financing
for development of LDCs is from an additional allocation
of special drawing rights (SDRs).

The Least Developed Countries Report 2010160
billion.3 However, there are a number of problems related to the current system of allocating SDRs among IMF member countries, particularly from the standpoint of LDCs, which receive a very small share of the total. Only $18 billion worth of the $250 billion allocation recommended by the G-20 in April 2009 was disbursed to low-income countries. Moreover there are some shortcomings relating to the nature of SDRs and the modalities of their allocation.
From the standpoint of the LDCs, SDRs serve two vital purposes. First, they provide reserve assets, and thereby liquidity to ensure the continuity of commercial transactions with trading partners. In this respect, SDRs provide a low-cost alternative to other sources of international reserves. Second, as they can be exchanged (with prescribed SDR holders, typically central banks) for freely usable currencies, they provide holders with real resources that can be used for development purposes.
With regard to the first purpose, SDRs are allocated by the IMF on the basis of their quotas at the Fund. Thus, about SDR 73 billion of the general allocation of SDR 161 billion, or 45 per cent, were allocated to the G-7 industrialized countries, of which SDR 27.5 billion went to the United States alone. In contrast, LDCs were allocated 2.37 per cent (table 34). Thus, the IMF members who least need reserves are getting the lion’s share, while the poorest countries, who need them the most, are allocated a pittance.
With regard to the use of the SDR as a means of exchange for development purposes, arguments were made soon after the creation of the SDR in the 1970s to allocate these to developing-country members on the basis of need, that is, as a means of providing unconditional aid resources (sometimes referred to as the “SDR-Aid link”). After the breakdown of the Bretton Woods fixed-exchange rate system, the SDR-Aid Link was included in a number of proposals to reform the international monetary system, along with the more general proposal to transform the SDR into the world’s principal reserve asset. However, despite strong support for the link idea from developing countries, it was not taken up.
Recently, there has been a number of new proposals for a growing role for the SDR, including for the provision of resources for development. After the decision in 1997 to allocate additional SDRs, the financier George Soros (2001), among others, proposed that the rich countries not needing them donate their SDRs to a special new competitive mechanism, independent of Governments and existing international institutions, to support international development programmes. In 2001, a report of the United Nations High-level Panel on Financing for Development (the Zedillo Report) recommended the “revival” of SDR emissions after a hiatus of 20 years. More recently, the idea of the SDR-Aid link, or a “development-focused allocation of SDRs” has re-emerged in the context of financing global public goods (Aryeetey, 2004). In addition, the 2009 Report of the Commission of Experts of the President of the United Nations General Assembly on Reforms of the International Monetary and Financial System (the Stiglitz Report) addressed these issues and proposed a number of alternative ideas aimed at creating a truly global reserve system which could be based on the SDR.
The 2009 general allocation of $250 billion in SDRs (along with the special allocation of about $30 billion soon after) is a major opportunity for new thinking. On the basis of the IMF’s quota formula, more than half of this amount was allocated to richer countries (not including emerging market
About SDR 73 billion of the general allocation of SDR 161 billion, or 45 per cent, were allocated to the G-7
industrialized countries, of which SDR 27.5 billion went to the United States alone.
In contrast, LDCs were allocated 2.37 per cent
The 2009 general allocation of $250 billion in SDRs (along with the special allocation of about $30 billion soon after)
is a major opportunity for new thinking.

161An Agenda for Action: (I) Finance and (II) Trade
Table 34New SDR allocation to LDCs in 2009
Member country
General and Special SDR Allocations(in millions of SDRs) Share of SDR
allocatedto LDCs
Share of LDCs GDP in 2008
(current prices and exchange
rate)
Share of LDCs’
populationin 2008
General SDR allocation1,3
Special SDR allocation2 Total3
Afghanistan 120 8.6 128.6 3.0 2.5 3.3Angola* 212.2 60.8 273 6.3 6.9 2.2Bangladesh 395.3 67.9 463.3 10.7 15.6 19.6Benin 45.9 3.9 49.8 1.1 1.3 1.1Bhutan* 4.7 1.3 6 0.1 0.3 0.1Burkina Faso 44.6 3.5 48.2 1.1 1.6 1.9Burundi 57.1 3.1 60.2 1.4 0.2 1.0Cambodia 64.9 3.6 68.5 1.6 2.2 1.8Central African Republic 41.3 2.8 44 1.0 0.4 0.5Chad 41.5 2.7 44.2 1.0 1.6 1.3Comoros 6.6 1.2 7.8 0.2 0.1 0.1Dem. Republic of Congo 395.1 29.4 424.5 9.8 2.3 7.9Djibouti 11.8 2.2 14 0.3 0.2 0.1Equatorial Guinea 24.2 1.3 25.5 0.6 3.5 0.1Eritrea* 11.8 3.4 15.2 0.4 0.3 0.6Ethiopia 99.1 17.7 116.8 2.7 5.1 9.9Gambia 23.1 1.6 24.6 0.6 0.2 0.2Guinea 79.4 5.5 84.9 2.0 1.0 1.2Guinea-Bissau 10.5 1.9 12.4 0.3 0.1 0.2Haiti 60.7 4.1 64.8 1.5 1.4 1.2Kiribati* 4.2 1.2 5.3 0.1 0.0 0.0Lao People's Dem. Republic 39.2 2.1 41.3 1.0 1.0 0.8Lesotho 25.9 3.3 29.1 0.7 0.3 0.3Liberia 95.8 7.2 103 2.4 0.2 0.5Madagascar 90.6 7.2 97.8 2.3 1.8 2.3Malawi 51.4 3.9 55.4 1.3 0.8 1.8Maldives 6.1 1.3 7.4 0.2 0.2 0.0Mali 69.2 4.3 73.5 1.7 1.7 1.6Mauritania 47.7 4.2 51.9 1.2 0.6 0.4Mozambique* 84.2 24.6 108.8 2.5 1.9 2.7Myanmar 191.6 10.7 202.3 4.7 5.2 6.1Nepal 52.9 7.1 60 1.4 2.6 3.5Niger 48.8 4.8 53.5 1.2 1.0 1.8Rwanda 59.4 3.7 63.1 1.5 0.9 1.2Samoa 8.6 1.3 9.9 0.2 0.1 0.0Sao Tome and Principe 5.5 1 6.5 0.1 0.0 0.0Senegal 119.9 10.4 130.3 3.0 2.6 1.5Sierra Leone 76.9 5.2 82.1 1.9 0.5 0.7Solomon Islands 7.7 1.5 9.3 0.2 0.1 0.1Somalia 32.8 4.2 36.9 0.9 0.5 1.1Sudan 125.8 16.1 141.9 3.3 13.8 5.1Timor-Leste* 6.1 1.6 7.7 0.2 0.1 0.1Togo 54.4 4.9 59.4 1.4 0.6 0.8Uganda 133.8 9.9 143.7 3.3 3.1 3.9United Rep. of Tanzania 147.4 11.7 159.1 3.7 4.2 5.2Vanuatu* 12.6 3.7 16.3 0.4 0.1 0.0Yemen 180.5 23 203.5 4.7 6.1 2.8Zambia 362.6 38.3 400.8 9.2 2.8 1.5Total LDCs allocation 3 891.4 444.9 4 336.1 100 100 100Total new allocations3 161 184.33 21 452.70 182 637.00 LDCs share of world population 12.1LDCs share in new allocations (%) 2.41 2.07 2.37 LDCs share of world GDP 0.8Source: UNCTAD secretariat calculations, based on IMF, Finance Department (www.imf.org); and UNCTAD’s GlobStat database. 1 The general allocation of 74.13 per cent of quotas took place on August 28, 2009. 2 Provided under the Fourth Amendment of the Articles of Agreement (took place on September 9, 2009). 3 Assuming that no members opt out. * Countries that will receive allocations for the first time as a result of both the General and Special SDR Allocation.
The Least Developed Countries Report 2010162
economies or the more advanced developing countries). In other words, possibly a large amount of money could be reallocated almost immediately for development purposes. Thus there is a need to revise the allocation mechanism away from the IMF’s quota-based formula towards one based on development needs, particularly those of LDCs. After considering a redistribution of the SDRs allocated in 2009, such a revision should get urgent attention. An LDC-specific international support mechanism should ensure that these countries receive an allocation that is proportional to their share of the global population.
3. ENHANCING COUNTRY OWNERSHIP OF NATIONAL DEVELOPMENT STRATEGIES
Country ownership of national development strategies is the cornerstone of development effectiveness and also aid effectiveness. It implies that national Governments should have the ability to freely choose the strategies which they design and implement, and take the lead in both policy formulation and implementation. Enhanced country ownership of national development strategies in the LDCs is vital because it provides the basis for the formulation and implementation of development strategies that reflect local conditions and aspirations. It also enables experimentation, trial and error, pragmatism and policy pluralism. But achieving country ownership is very difficult in a situation of chronic aid dependence, and it is even more difficult when countries need official debt relief. There is a constant tension between the promotion of country ownership and the desire of international financial institutions (IFIs) and bilateral donors to ensure that their assistance is being used to support what they regard as a credible strategy. Ensuring that the high levels of aid dependence do not result in donor domination is a very complex challenge for both aid donors and aid recipients in a context where there are major inequalities between the parties in terms of resources, capabilities and power. In practice, “the greater degree of aid dependence, the greater degree of accountability of the government to donors and the lesser to their citizens” (Culpeper, 2010: 3).
In the long-term, increasing domestic financial resource mobilization is the key to enhanced country ownership. However, in the short-term, international policies can help to promote country ownership of national development strategies in five major ways, discussed below.
(a) Focusing on the core meaning of country ownership
From the start, it is necessary to clarify the meaning of country ownership. Unfortunately, the term is still equated with some form of national commitment (or buy-in) to the policy reforms advocated by the IFIs. Moreover, even in the monitoring of the implementation of the Paris Declaration, there is severe restriction of its meaning. In the Declaration, under the principle of ownership, aid recipients should be committed to:
• Exercise leadership in developing and implementing their national development strategies through broad consultative processes;
• Translate these national development strategies into prioritized results-oriented programmes expressed in medium-term expenditure frameworks and annual budgets; and
• Take the lead in coordinating aid at all levels in conjunction with other development resources in dialogue with donors encouraging the participation of civil society and the private sector.”
Possibly a large amount of money could be reallocated
almost immediately for development purposes.
An LDC-specific international support mechanism should ensure that these countries receive an allocation that is
proportional to their share of the global population.
Country ownership of national development strategies is the cornerstone of development effectiveness and also aid
effectiveness.
In practice, the greater degree of aid dependence,
the greater degree of accountability of the
government to donors and the lesser to their citizens.

163An Agenda for Action: (I) Finance and (II) Trade
The Declaration also states that donors should be committed to: “Respect country leadership and help strengthen their capacity to exercise it” (OECD, 2005: 3). But the systematic monitoring of progress towards country-led development strategies now examines only the second of the aid recipient’s commitments, in particular whether aid recipients have “an operational development strategy”, which is defined in terms of results orientation and financial frameworks.
In effect, what is being monitored as “ownership” are the actions which recipient countries should take in order to increase the confidence of donors which contribute their resources to national budgets of recipients. Such confidence is of course critical for country ownership, in the sense that if donors allocate their funds to general budget support, this can, if no further strings are attached, ensure that aid is well-aligned with country priorities. However, in effect this is ownership of process conditionality relating to how a country undertakes development planning. In equating ownership with whether a development strategy is deemed operational and specifying what should constitute “operational”, the monitoring of ownership has become a way in which process conditionality in financial governance is being reinforced. The deeper issues of freedom of choice of national Governments, as well as their exercise of leadership, are sidelined. Yet these should be at the heart of mutual understanding of what it means “to put countries in the driver’s seat”.
(b) Reducing and reforming policy conditionality
Although there has been a shift in the practice of policy conditionality, there is a need for further reforms, which balance donors’ legitimate concerns about how money is spent with recipients’ legitimate concerns that policy conditionality is still overly detailed and sometimes intrusive. Such conditionality effectively sets the pace and strategic directions of the policy agenda, and generally in ways that ensure the implementation of what IFIs consider being best practices. The IMF Independent Evaluation Office assessment of progress made by the IMF in streamlining conditionality after 2000 concluded that “there is no evidence of a reduction in the number of structural conditions following the introduction of the streamlining initiative” and that “arrangements continued to include conditions that do not appear to have been ‘critical to programme objectives’” (IMF, 2007: 24, 26). An analysis for the LDCs suggests only a very slight decline in the number of structural conditions, but policy reforms in sensitive areas – those which limit fiscal space or require public sector restructuring, involve banking liberalization and privatization, or other types of liberalization – remain important features of the conditionalities (UNCTAD, 2008). These appear to go beyond the IMF’s core mandate and they also seem insensitive to the challenges of the correct policy sequencing, particularly for low-income borrowing countries (Saner and Guilherme, 2008).
Since the financial crisis, the IMF has announced further reforms relating to policy conditionality, in particular the abandonment of structural performance criteria (Bird, 2009). However, it remains to be seen how this is working out in practice. One analysis has concluded that there has been “very little fundamental change in IMF practices” (van Waeyenberge, Bargawi and McKinley, 2010: 36). Ocampo et al. (2010) suggest that in the aftermath of the crisis there have been signs of a reduction in the number of conditions applied, but only with regard to stand-by arrangements, and not to the Poverty
The deeper issues of freedom of choice of national
Governments, as well as their exercise of leadership, are sidelined. Yet these should be at the heart of mutual understanding of what it means “to put countries
in the driver’s seat”.
Conditionality effectively sets the pace and strategic
directions of the policy agenda, and generally in ways that ensure the
implementation of what IFIs consider being best practices.
One analysis has concluded that there has been very little
fundamental change since the crisis in IMF practices regarding conditionalities in low-income countries.

The Least Developed Countries Report 2010164
Reduction and Growth Facility (PRGF), which is targeted at low-income countries. For LDCs, the evidence indicates that some of the IMF programmes concluded after the crisis included not only restrictive monetary policies but also procyclical fiscal provisions and other measures, such as freezing of wages in the public sector and cuts in consumer subsidies, which are bound to dampen aggregate demand and negatively affect poor households (table 35). In effect, it appears that there is an asymmetry in the practices between low-income countries and non-low-income countries, with more restrictive policies in the former.
Against this background, there is need for further debate on the rationale and effectiveness of policy conditionality and reforms, which would make it less intrusive and more supportive of country ownership.
(c) Strengthening the role of regional and subregional development banks
Regional and subregional development banks can and should play an important complementary role to lending by the multilateral development banks (Griffith-Jones, Griffith-Jones and Hertova, 2008; Helleiner, 2010). These banks could help in financial deepening, provide cheap finance as well as guarantees to catalyse finance, and also provide contingency finance. The European Investment Bank and Andean Development Corporation provide good examples of the sort of funding support these banks could provide, such as infrastructure financing and guarantees. The following are some of the main strengths of regional and subregional development banks: (i) they allow a far great voice to developing-country borrowers, as well as a greater sense of regional ownership and control; and (ii) they are able to rely more on exerting informal peer pressure rather than imposing conditionalites. Thus, strengthening the role of these banks in the provision of finance to the LDCs could not only increase the sources of finance, but could also bolster country ownership of national development strategies.
Griffith-Jones, Griffith-Jones and Hertova (2008) argue that there is a clear case for creating new regional and subregional development banks in
Table 35IMF conditionalities in LDCs during the 2008–2009 crisis
Fiscalpolicy
Monetarypolicy
Public-sector wage bill
Liquidity and money supply
growth
Interestrate
Afghanistan X X X Burkina Faso X Burundi X X X X Central African Republic X Djibouti X X X Gambia X X X Haiti V X V X Liberia V Malawi X X X Mali X Mozambique V Niger V Sao Tome and Principe V X X Senegal X Togo V United Republic of Tanzania V V V V Zambia V VSource: Based on Weisbrot et al., 2009. X = contractionary elements; V = expansionary elements
There is need for further debate on the rationale
and effectiveness of policy conditionality and reforms, which would make it less
intrusive and more supportive of country ownership.
Regional and subregional development banks can and should play an important
complementary role to lending by the multilateral
development banks
165An Agenda for Action: (I) Finance and (II) Trade
developing regions, as well as expanding existing institutions. It is perhaps too complicated to envisage a dedicated LDC development bank; however, institutional arrangements could be promoted within regional and subregional development banks to ensure that they cater to the special needs of LDCs.
(d) Rebuilding State capacities
Rebuilding State capacities is essential for enhanced country ownership of national development strategies. At present, about 20 per cent of the aid to LDCs goes towards supporting governance and related activities (UNCTAD, 2009b). It is important that this be used for building developmental State capabilities, rather than promoting an unrealistically ambitious good governance agenda which involves the importation of inappropriate Western institutions, such as techniques of new public management. Rebuilding developmental State capacities should involve improved capacity for collecting and using statistics as well as the promotion of the local production of development knowledge (Zimmerman and McDonnell, 2008). There is also a particularly urgent need to rebuild capabilities for indicative economic planning, as well the capabilities of ministries of agriculture, industry and trade.
(e) Introducing and strengthening aid management policies
One important step that can be taken to increase country ownership is the adoption of an aid management policy in LDCs. This can play an important role in reducing the multiple ways in which aid delivery is undermining ownership by being unaccounted, off-budget, off-plan and misaligned.
An aid management policy differs from a national development strategy. The latter identifies goals, objectives and targets, and the actions needed to achieve them, whereas an aid management policy “is designed and used to ensure that assistance received is of such a type, and is so deployed, as to maximize its contribution to the priorities set out in the country’s statements of development strategy” (Killick, 2008: 5). By adopting an aid management policy, it is possible to separate the development strategy and the aid management policy while ensuring that the two are interrelated. In this way, development (or poverty reduction) strategies would no longer be devised with a view to seeking aid, but instead they would focus on LDCs’ strategic interests and national needs as identified by their own policymakers.
A well-working aid management policy should:
• Improve the coordination of assistance and reduce uncertainties about actual and prospective aid inflows;
• Avoid, or reduce, the proliferation of sources of assistance and of discrete donor initiatives;
• By this and other means, increase the policy space of Governments, reduce the proliferation of conditionalities and increase the predictability of receipts;
• As a result of improved Government-donor relations and better harmonization and alignment, it should reduce transaction costs;
• Provide a platform for greater mutual accountability; and
• Provide a framework through which technical assistance can become increasingly demand-driven and oriented to recipients’ capacity development needs (see Killick 2008).
Institutional arrangements could be promoted within regional and subregional
development banks to ensure that they cater to the special
needs of LDCs.
Rebuilding State capacities is essential for enhanced
country ownership of national development strategies.
One important step that can be taken to increase country ownership is the adoption
of an aid management policy in LDCs.

The Least Developed Countries Report 2010166
An aid management policy can also provide an institutional framework for coordinating North-South and South-South official finance.
The implementation of an aid management policy can offer a practical way to reduce those processes that weaken country ownership which arise from aid being off-budget, off-plan, unaccounted and unpredictable. It can also be a cornerstone for building trust and mutual understanding between donors and recipients which are essential for tackling the other processes that are undermining the ability of countries to take the lead in the design and implementation of their national development strategies. Moreover, judging from LDCs’ experiences thus far, it is apparent that aid management policies can offer a powerful bottom-up approach to better aid coordination around national priorities (Menocal and Mulley, 2006; de Renzio and Mulley, 2006).
One possible international support mechanism for the LDCs would be to organize an international forum under the auspices of the UN, in which LDCs could periodically share their experiences with aid and debt management policies. Such a forum could build on existing work by UNCTAD and UNDP on debt management. This would help them draw up best practices building on the pioneering experiences of countries such as Uganda and the United Republic of Tanzania which have already adopted such policies.
4. INNOVATIVE USES OF AID TO PROMOTE THE DEVELOPMENT OF PRODUCTIVE CAPACITIES
A significant issue for LDCs and their development partners, as discussed in chapter 4, is the low proportion of aid currently allocated to economic infrastructure and production sectors. Investment in education and other social sectors is certainly vital in the LDCs but the lack of complementary investment in production sectors means that the overall approach to poverty reduction is “walking on one leg”. It is in effect ignoring the fact that poverty reduction depends on both private incomes, which are closely associated to employment opportunities, as well as public services. The current approach is actually perpetuating aid dependence and storing up problems for the future. For example, donors are providing front-end investments in social programmes such as universal primary education and child health care to support the achievement of the Millennium Development Goals (MDGs), but for any sector to advance in a sustainable manner, recurrent investment and support for operation and maintenance costs are needed. Unless donors intend to support the MDGs indefinitely, beyond 2015, the LDCs will have to assume an increasing share of the costs involved. This means that Governments will need to generate revenues, primarily through taxation, to support the necessary expenditures. It would ultimately depend not only on increased efforts to promote domestic financial resource mobilization (as discussed above in section 1), but also on building the productive base of the economy. Therefore it is critical to use aid to create an expanding investment-profits nexus embedded within LDCs and based on the domestic private sector.
Aid can play a direct role in this regard through its traditional function of supporting public investment. Assuming that estimates for low-income countries can be applied to the LDCs as well, their annual infrastructure investment needs are roughly equivalent to between 7.5 per cent and 9 per cent of their GDP (Briceno-Garmendia, Estache and Shafik, 2004). This includes new investments in operations and maintenance requirements, including for main networks such as roads, rail, electricity, water and
One possible ISM for the LDCs would be to organize
an international forum under the auspices of the UN, to periodically share their
experiences with aid and debt management policies.
A significant issue for LDCs and their development
partners is the low proportion of aid currently allocated to economic infrastructure
and production sectors. The current approach is actually perpetuating aid dependence
and storing up problems for the future.
Unless donors intend to support the MDGs
indefinitely, beyond 2015, the LDCs will have to assume an increasing share of the costs
involved.
167An Agenda for Action: (I) Finance and (II) Trade
sanitation and telecommunications. However, in 2004, ODA for transport, telecommunications and energy infrastructure was equivalent to only 0.5 per cent of LDCs’ GDP, and ODA and private investment in these sectors together were equivalent to only 0.7 per cent of their GDP (UNCTAD, 2006). This shows a massive infrastructure financing gap. It will be equally important to bridge the electricity divide which currently separates the LDCs from other developing countries, as well as ensuring that the new opportunities associated with investment in information and communication technologies (ICT) are realized. Public investment in rural infrastructure, large-scale national transport, communications and power infrastructure, as well as cross-border regional networks, should have major development benefits, especially in terms of crowding in private investment.
Beyond the traditional use of aid to support public investment, promoting the development of productive capacities also requires innovative uses of public finance. In particular there is a need for: (i) catalytic mechanisms which use public finance for market creation and for promoting private sector development, (ii) public-private partnership mechanisms which use public funds to leverage or mobilize private finance to support infrastructure provision and/or service delivery, and (iii) innovative solidarity mechanisms, such as debt buy-downs and countercyclical lending, which allow countries to adjust borrowing terms and conditions when they are adversely affected by shocks (Girishankar, 2009). International efforts to support such innovative financial solutions are estimated to have cost $52.7 billion between 2000 and 2008. However, middle-income countries tended to benefit more; official flows to catalyse private sector development to IBRD-eligible countries more than twice the per capita level of IDA-only and blend countries.4
At present, discussions on the catalytic use of aid for developing productive capacities in LDCs have focused mainly on how to use ODA to increase FDI flows to LDCs. This fosters a situation in which FDI and foreign affiliates have a privileged status over domestic investors. As pointed out by Mistry and Olesen (2003: 150), “too much emphasis is put on attracting foreign investment and not enough on retaining domestic capital”. For example, foreign investors are given protection and have recourse to remedies from bilateral insurers, export credit agencies and aid agencies in their home countries and risk coverage guarantees from host countries as well as multilateral agencies. In addition, LDCs are trying to attract FDI by offering foreign companies privileges and exemptions that are often not provided to domestic firms. This present Report views the excessive focus on promoting FDI and neglect of domestic investment as a biased and counterproductive approach. Mistry and Olesen (2003: 150) note: “Emerging evidence suggests that an imbalance in emphasis on risk coverage (and incentives) for foreign investors may be encouraging domestic capital flight (especially from LDCs), some of which is round-tripped back as privileged foreign investment (direct or portfolio)”. In addition, it is clear that vibrant domestic private investment is very important for attracting sustained foreign capital (Ndikumana and Verick, 2008).
From this perspective, this section focuses on catalytic support for private sector development and on public-private partnerships for the provision of infrastructure services. Promoting local business development in the LDCs as well as regional linkages by implementing the OECD DAC 2001 Recommendation to Untie Aid is one way of ensuring the catalytic use of aid for private sector development. The International Spark Initiative to promote enterprise innovation in LDCs, discussed in the technology section of chapter 6 (pp. 215–220), is another example of the catalytic use of aid.
Beyond the traditional use of aid to support public
investment, promoting the development of productive
capacities also requires innovative uses of public
finance.
There is a massive infrastructure financing gap
in LDCs.
Discussions on the catalytic use of aid for developing
productive capacities in LDCs have focused mainly on how to use ODA to increase FDI flows to LDCs. This fosters a situation in which FDI
and foreign affiliates have a privileged status
over domestic investors.
The Least Developed Countries Report 2010168
(a) Catalytic uses of aid for private sector development
Multilateral and bilateral approaches to private sector development are currently dominated by the idea that given the right enabling environment, the private sector will develop and deliver equitable growth spontaneously. According to Gibbon and Schulpen (2004: 44), the striking feature of this consensus is that “it still pays much more attention to (re-)defining the role of government than it does to the nature of the private sector and its effects on development.” There is also a strong aversion to direct government support to enterprises, even temporary, as this is perceived to distort markets, crowd out private investment and encourage political patronage.
The problem with this approach in an LDC context is that there is a missing middle in the enterprise structure, with very weak development of SMEs, particularly medium-sized enterprises, in the formal sector. These domestic firms can have considerable local comparative advantage and also development potential, and they may try to develop those assets, but because of problems of risk, poor business support services and weak infrastructure, they are not “commercially bankable”, in the sense that it is difficult to finance their growth on purely commercial terms. Yet such finance could provide market-based solutions to those problems. There is thus a private enterprise gap. Neither private financial institutions nor official development institutions are willing to provide the resources for investment in business development, and without business development the problems which limit SMEs’ access to commercial financing solutions will persist (see UNCTAD, 2000: 91–97).
In these circumstances, it is necessary to consider more creative approaches to the provision of direct support for private sector development. One proposal in this regard, which has been promoted by the Commonwealth Secretariat, is the establishment of a new facility focusing specifically on LDCs and other small, vulnerable economies, in the form of a dedicated and separate fund which would be owned by international financial institutions but legally distinct from them. Its specific aim would be to reduce the cost and risks to existing and new private direct investment. It would assist private investment in the production of traded goods and services in eligible States by offering domestic-currency loans, quasi-equity investment capital and guarantees, and by retailing a special form of cover for political risk, similar to that provided by the Multilateral Investment Guarantee Agency (MIGA), only simpler (Hughes and Brewster, 2002).
It should also be possible to be more proactive in implementing the 2001 DAC Recommendation on the Untying of Aid to support business development in the LDCs. This would require support to local businesses to help them bid for contracts and also modifications in the design of tenders, paying particular attention to the size of lots. There are also possibilities for creating greater synergies between the achievement of human development goals and the building of local productive capacities for the provision of local education and health services.
(b) Public-private partnerships to support private investment in infrastructure in LDCs
Given the scale of the needs for infrastructure development in the LDCs, efforts should also be made to increase private sector participation in the provision of infrastructure (see UNCTAD 2008). Mistry and Olesen (2003) focus on the challenge of mitigating risks for foreign investors in LDCs,
Multilateral and bilateral approaches to private sector development are currently dominated by the idea that
given the right enabling environment, the private sector will develop and deliver equitable growth
spontaneously.
The problem with this approach in an LDC context is that there is a missing middle
in the enterprise structure, with very weak development of SMEs in the formal sector.
It is necessary to consider more creative approaches to the provision of direct support for private sector
development.
A new facility is needed that would assist private
investment in the production of traded goods and services in eligible States by offering
domestic-currency loans, quasi-equity investment
capital and guarantees, and by providing a special form of
cover for political risk.

169An Agenda for Action: (I) Finance and (II) Trade
particularly in infrastructure, and make a number of concrete proposals. These proposals, which are directed primarily at the EU (and summarized in UNCTAD, 2003a, box VI.3), include:
• Increase funding of multilateral risk insurance agencies such as MIGA for the creation of a special purpose capital or guarantee pool by like-minded donors which would be dedicated to covering political and non-commercial risk in LDCs.
• Sponsor a regional risk cover agency or create institutional capacity at the EU level which would focus on LDCs political risk cover and would seek the same status as MIGA.
• Create more capacity in regional development banks for providing regional risk cover.
• Increase the non-commercial risk insurance capacity of bilateral export credit agencies and official bilateral insurers through specific funding and subsidies to cover a wider range of non-commercial risks in LDCs.
• Provide project-related subsidies to cover the premium costs of political risk insurance and non-commercial risk insurance for specific projects being undertaken by OECD source countries or eligible developing-country firms in LDCs.
• Establish credit enhancement arrangements for mobilizing available domestic funding, in developing countries in general, but also, and particularly, in LDCs.
These measures could be further enhanced through home-country measures that encourage outward FDI to LDCs. In this regard, Mistry and Olesen (2003) suggest that DAC donor countries should consider:
• Providing full (100 per cent) or a large percentage (50-80 per cent) of tax credits, rebates or deductions (depending on which of these would have the greatest impact on influencing TNC behaviour in the donor country concerned) on equity invested by the home-country companies in LDCs against their tax liabilities in their home countries.
• Establishing special purpose investment promotion departments for FDI in LDCs (with commensurate budgets) within bilateral aid or investment agencies, thus ensuring that support for FDI flows to LDCs becomes a major priority in bilateral aid.
• Exploring the possibility of establishing a small special purpose LDC infrastructure investment fund that would provide equity and debt financing and of mobilizing domestic-currency resources for lending to infrastructure projects in LDCs.
If such measures were to be implemented to attract private capital inflows for infrastructure development, it would be important to ensure that their spillover effects (such as technology and skills transfer) also benefit domestic investors.
5. THE CONTINUING NEED FOR DEBT RELIEF IN LDCS
As a result of the improved external environment in the early and mid-2000s and implementation of the enhanced HIPC Initiative and MDRI, the debt burden of the LDCs as a group has diminished significantly. This has freed much-needed financial resources that were previously absorbed by onerous debt servicing (see chart 34, panels A and B below) and removed a major
Given the scale of the needs for infrastructure development
in the LDCs, efforts should also be made to increase
private sector participation in the provision of infrastructure.
Establish credit enhancement arrangements for mobilizing available domestic funding,
in developing countries in general, but also, and particularly, in LDCs.
DAC donor countries should consider providing full
(100 per cent) or a large percentage (50-80 per
cent) of tax credits, rebates or deductions on equity
invested by the home-country companies in LDCs against their tax liabilities in their
home countries.

The Least Developed Countries Report 2010170
Chart 34Debt burden in LDCs
Den
sity
dis
tribu
tion
Per
cen
tA. External debt stock to GNI among LDCs (excluding Liberia)
.000
.004
.008
.012
.016
.020
0 50 100 150 200 250 300 350 400200820001990
B. Total debt service(% of exports of goods, services and income)
0
5
10
15
20
25
1990 1991 1992 1993 1994 1995 1996 1997 1998 1999 2000 2001 2002 2003 2004 2005 2006 2007 2008
LDC Average LDC median
Source: UNCTAD secretariat calculations, based on World Bank, World Development Indicators (online).
14 LDCs which still remain in debt distress or at high
risk of debt distress were not identified as HIPCs or had not reached the completion point.
risk factor which was constraining investment. Most of the debt was owed to official creditors, and high levels of external indebtedness also undermined aid effectiveness. However, this important progress does not mean that the debt issue is no longer relevant in LDCs. Firstly, as at April 2010, 14 LDCs which still remain in debt distress or at high risk of debt distress were not identified as HIPCs or had not reached the completion point. Secondly, there were 6 LDCs at high risk of debt distress and a further 5 at moderate risk, despite having reached the HIPC completion point and benefiting from substantial debt relief (see chapter 1). In addition, even in the best-case scenario of a fast recovery and a long-term growth path, LDCs and developing countries alike will face higher debt burdens as a result of the latest economic and financial crisis.
171An Agenda for Action: (I) Finance and (II) Trade
The persistence of the debt overhang in almost half of the LDCs indicates that there is a need to extend eligibility under the sunset clause of the HIPC Initiative, thereby enabling LDCs which have been unable to get debt relief to do so. Greater participation of multilateral creditors and countries outside the Paris Club in debt relief initiatives would be crucial for enabling a significant reduction of the debt burden on the poorest countries. Indeed, although the composition of debt varies significantly across countries, non-Paris Club countries and multilateral creditors own a fairly large proportion of the debt of low-income countries (IMF, 2010).
In the context of further debt relief, it would be desirable to amend the IMF-World Bank Debt Sustainability Framework (DSF) for low-income countries. In particular, the relationship between the external debt threshold and governance, which, in the current DSF is captured through the World Bank Country Policy and Institutional Assessment (CPIA) indicators, is arbitrary. In addition, the DSF should be expanded to include relevant aspects that are currently overlooked. Notably, the DSF does not distinguish between debt for financing current expenditure and debt used for investment projects, which, if and when profitable, could well ensure debt sustainability. Failure to capture this distinction may add to the volatility of public investments, thus further jeopardizing LDCs’ development prospects. Similarly, so far the DSF has overlooked the importance of debt composition, both in terms of currency denomination and maturity. In this respect, the structure of debt should be examined within the DSF, as it is an important determinant of sustainability (see also UNCTAD, 2010a).
There is also a need to review the minimum concessionality requirements faced by countries that are eligible to borrow under the PRGF or IDA. Under the current regulations, these countries are prevented from contracting an external borrowing that does not include a concessionality component of at least 35 per cent. Some form of flexibility would be advisable in this respect, such as focusing on average concessionality requirements rather than on each individual borrowing operation.
6. THE NEED FOR COMPENSATORY FINANCING FOR SHOCKS
The fuel, food and financial crises which the LDCs successively experienced in the latter half of the 2000s are indicative of the need for anti-shock financing facilities for LDCs. The IFIs have certainly responded to the global crisis since 2008 by significantly increasing emergency financing for low-income countries and LDCs (see box 7) so that these countries now have greater recourse to quick-disbursing anti-shock financing. However, there are still weaknesses in the shock-financing architecture. Firstly, although the IFIs now acknowledge the need for applying only low conditionality in their support programmes for countries under severe stress, practice still varies considerably, with some programmes such as the IMF’s Exogenous Shock Facility (ESF) still setting economic performance targets. Secondly, grant funding is almost non-existent. The World Bank’s recently launched crisis response window (CRW), delivered through the IDA, offers the possibility of grant funding on the basis of debt sustainability criteria. In other words, grant funding is not offered unless the borrower crosses a threshold of unsustainable debt. Thirdly, the key target of IMF programmes is to remedy balance-of-payments disequilibria and thereby strengthen macroeconomic stability. The programmes are not oriented towards longer term development objectives related to poverty reduction and social and economic progress. The World
The persistence of the debt overhang in almost half of
the LDCs indicates that there is a need to extend eligibility
under the sunset clause of the HIPC Initiative, thereby enabling LDCs which have
been unable to get debt relief to do so.
In the context of further debt relief, it would be desirable
to amend the IMF-World Bank Debt Sustainability
Framework (DSF) for low-income countries.
The fuel, food and financial crises which the LDCs
successively experienced in the latter half of the 2000s
are indicative of the need for anti-shock financing facilities
for LDCs.
The Least Developed Countries Report 2010172
Box 7. Recent developments in IMF and World Bank contingency financing facilities open to LDCs
IMF facilities
The IMF has provided emergency financing under a number of different facilities since 1962, offering short-term assistance to countries afflicted by temporary external shocks or natural disasters. The Compensatory Financing Facility (CFF) was created in 1963 to help members avoid undue adjustment to temporary export shortfalls caused by exogenous shocks. This facility was later enhanced to provide funding for a temporary increase in the costs of cereal imports. Although a low-conditionality facility, the financial terms are non-concessional, with repayment expected within five years or less. Because of this, the CFF has been increasingly onerous for low-income countries. Moreover, access has been increasingly difficult because of complexities surrounding eligibility, particularly the “temporariness” of the shock. Although the CFF was streamlined in 2000, because of these problems it has fallen into almost complete disuse, leading to recurring proposals to abolish it altogether, and other Fund facilities have taken its place.
The Fund’s basic programme for helping countries cope with shocks is the emergency assistance loan, primarily designed to help countries cope with financial shocks associated with natural disasters. In 1995, coverage was extended to countries in post-conflict situations. While these IMF loans do not require adherence to performance criteria, the terms of financing are non-concessional, requiring repayment of the principal within five years. However, since 2005 the interest rate charged on such loans has been subsidized by bilateral donors, bringing it down to 0.5 per cent per year. More recently still, PRGF-eligible Fund members have been allowed even greater concessions in terms of the interest rate: between 0 and 0.25 per cent. The Fund’s emergency loans do not carry performance criteria, but borrowers are required to indicate the general economic policies they propose to follow.
In November 2005, the IMF established its Exogenous Shocks Facility (ESF), specifically designed as a rapid-reaction facility for low-income countries experiencing shocks such as natural disasters, commodity price escalations (e.g. food and fuel prices), conflict, and trade-disrupting crises in neighbouring countries. Access to ESF support was augmented in 2008 and 2009. The ESF effectively extended members’ access to rapid emergency financing from 25 per cent of quota (under emergency assistance loans) to 50 per cent for each shock, and to 150 per cent of quota over two years. Financing terms under the ESF are equivalent to those under the PRGF (i.e. an interest rate of 0.5 per cent and repayment beginning at five-and-a-half years and ending ten years after the disbursement).
Conditionality under the ESF varies: under rapid access, the borrowing member only has to commit to appropriate policies to address the shock, and in exceptional cases to take targeted upfront measures. Under the high access component, which gives access to 150 per cent of quota, conditionality is more demanding, requiring an economic programme of the same standard as required under the PRGF.
World Bank funding programmes
The Bank has had a number of funding programmes to help members cope with crises. For low-income (IDA-eligible) countries, these comprise the two programmes under the Vulnerability Financing Facility: the Global Food Crisis Response Program and the Rapid Social Response Program. The former was launched in May 2008, in coordination with the United Nations High-Level Task Force on Food Security, to provide immediate relief to countries particularly badly hit by high food prices. With initial funds of $1.2 billion (of which $200 million were in the form of grants), the amount was increased to $2 billion in April 2009. Funding has supported vulnerable populations through food-for-work schemes, supplementary rations and micronutrients for mothers and their children, and school feeding programmes. The Rapid Social Response Program aims at sustaining national investments in health, education and social safety nets. Some $2.03 billion in IDA lending was projected for the period 2009–2011.
However, the mounting demands of the latest economic crisis have left a financing gap for IDA recipient countries. Despite the fact that the fifteenth replenishment of the IDA (IDA-15) for the period 2008–2011 was the largest in the IDA’s history, securing $41.6 billion in donor pledges, a gap of $11.6 billion was identified in relation to core spending requirements in IDA countries (IDA, 2009a). The responses to the crisis until 2009 (including that of the Vulnerability Financing Facility) were ad hoc, and in a sense “taxed” normal long-term development programming.
Accordingly, the Pittsburgh meeting of G-20 Leaders in September 2009 acknowledged the need for accelerated and additional concessional financing support for low-income countries to cushion the impact of the crisis on the poorest. The World Bank was asked to explore the benefits of a new crisis response facility to protect low-income countries from future crises.a The Bank responded by proposing a crisis response window (CRW) on a pilot basis, to be operationalized in 2010 as part of IDA-15 with a view to integrating this facility as part of IDA-16 (IDA, 2009b). The pilot facility was approved by the Bank in December 2009. An amount of $1.3 billion was allocated to support low-income countries affected by declining trade flows, FDI and remittances, and/or experiencing fiscal stress on account of the crisis. Some 55 countries, most of them LDCs, were proposed as eligible for support.
The CRW was designed to complement the IMF’s crisis facilities, which are aimed at strengthening macroeconomic stability and achieving balance-of-payments equilibrium, while the World Bank’s new programme is aimed at addressing broader key public expenditure needs. It also complements the Bank’s earlier, ad hoc Vulnerability Financing Facility that had focused on food security and key social sectors. Although there is no thematic or sectoral earmarking for support, countries will be encouraged to give priority to core social spending on health, education and social safety nets, which have been jeopardized

173An Agenda for Action: (I) Finance and (II) Trade
or reduced on account of the latest crisis. Implementation is expected to be rapid and to make a difference on the ground. The terms of financing would be the same as under the IDA, including the possibility of a grant portion, depending on debt sustainability considerations.
A substantial portion of the pilot CRW is to be allocated during the first half of 2010 and the rest during the 12-month period remaining in the IDA-15 replenishment period. Depending on the outcome of the pilot phase, it is intended to propose a permanent CRW as part of the IDA-16 replenishment.
Source: Culpepper, 2010. a G-20 Communiqué, Pittsburgh, 25 September 2009.
Bank is more oriented to sustaining social achievements and cushioning the effects of crises through provision of social safety nets. It pays little attention to the need to sustain the development of productive capacities. Finally, it is uncertain whether the level of current facilities is adequate, particularly as one of the more significant initiatives — the World Bank’s CRW — is still only in a pilot phase. The adequacy of this and other anti-shock facilities will become more evident as this pilot phase is implemented and evaluated in the course of preparing for the sixteenth round of IDA replenishment (IDA-16), which may include a more permanent facility in the World Bank Group.
There is a strong case for a new compensatory financing architecture to provide funding for shocks to LDCs. The LDCs are not only highly prone to natural disasters (see chapter 4), they are also extremely vulnerable to external shocks, manifested in structural deficits of the current account and a very volatile cyclical component. Volatility in export revenues is a major contributory factor, largely owing to the fact that commodity-dependent countries, typically characterized by high export concentration, are more exposed to terms-of-trade shocks (Williamson, 2005). At the same time, it is clear that private capital flows are also highly volatile (Bhinda and Martin, 2009), though they do not represent as important a source of balance-of-payments volatility in LDCs as in emerging economies owing to the smaller size of these inflows into economies of LDCs. Overall, in view of LDCs’ import sensitivity, it is clear that safeguarding their capacity to import, even at times of exogenous shocks to their economy, is critical for the sustainable development of their productive capacities.
In designing a new compensatory financing architecture, it is necessary to learn from past experiences. Recently, the European Commission (EC) approved an ad hoc Vulnerability-FLEX mechanism which is open to 13 ACP countries and seeks to avoid some of the weaknesses of previous EU anti-shock facilities. The aim of this mechanism is to support developing countries in coping with crises. Support under V-FLEX is provided as an additional single payment to the already existing budget support programmes, or, if necessary, it is provided through existing projects or programmes. It is disbursed rapidly and in the form of grants. However, there are questions as to whether the size of the available resources is sufficient (Dalleau, 2010).
Some important principles that should guide a new compensatory financing mechanism are:
• Sufficient speed of disbursement, in order to minimize the costs of adjustment.
• The amount disbursed should be proportional to the needs for responding to the precise shock, in order to prevent long-lasting effects on a country’s economic trajectory.
Box 7 (contd.)
There is a strong case for a new compensatory financing
architecture to provide funding for shocks to LDCs.
The LDCs are not only highly prone to natural disasters,
they are also extremely vulnerable to external shocks,
manifested in structural deficits of the current account
and a very volatile export revenues.
In designing a new compensatory financing
architecture, it is necessary to learn from past experiences.
The Least Developed Countries Report 2010174
• Low or no conditionality, as high conditionality implies lengthier processes; moreover, exogenous shocks should not require domestic adjustment measures until it is proven they have persistent effects.
• Grant funding.
• Alignment with a country’s needs.
• Shocks should be precisely measured and monitored – for example, export shortfalls should be measured in terms of export purchasing power, rather than in nominal values.
Compensatory financing is particularly important in relation to commodity-price shocks, and the issue is taken up further in chapter 6.
B. Trade
International trade is vital for development and poverty reduction in the LDCs. But the links between trade, development and poverty reduction are neither simple nor automatic. The evidence presented throughout this Report suggests that the way LDCs have been integrating into the world economy over the past 30 years has not had a favourable impact on their development. Indeed, LDCs are more marginalized within the global economy today than they were three decades ago. Moreover, on average they have less diversified economies and more concentrated exports, and they have become more commodity-dependent than before. Instead of attenuating their structural vulnerabilities, integration has amplified them. Their income levels, instead of gradually catching up with developed countries, have been falling even further behind. As a result, their poverty rates are very high and other social indicators weak (as indicated in chapter 1).
In an open world economy, LDCs face a major development challenge, which arises quite simply because the productivity gap between LDCs and developed countries is enormous. Based on the purchasing power parity estimates of the World Bank and the employment data of the International Labour Organization, in 2008 the average GNI per worker in LDCs was $3,022 (at current international dollars), compared with $68,607 in OECD countries — a ratio of 22 to 1 in favour of OECD countries. When compared with the productivity gap between the leaders (the Netherlands and the United Kingdom) and the poorest countries in the group of now developed countries (Finland and Japan) in the nineteenth century, the situation of LDCs today is far worse. According to Chang (2003), the gap in the nineteenth century was in the range of 2–4 to 1. This suggests that the gap today between the OECD countries and the LDCs is more than five times greater than the gap of the early catching up countries. The magnitude of that gap also suggests that firms from LDCs have few, if any, possibilities to compete with firms from developed countries.
As briefly discussed in chapter 3 and in more detail in UNCTAD (2004), LDCs have undertaken extensive trade liberalization since the late 1980s. Indeed, the extent and depth of their trade liberalization has resulted in very open trade regimes by international standards. Some of them now have even more open trade regimes than other developing countries, and others have trade regimes that are as open as those of developed countries. On average, their tariffs are only slightly higher than in other countries. Hence, the main policy challenge of LDCs is how to promote development in the
International trade is vital for development and poverty reduction in the LDCs. But
the links between trade, development and poverty
reduction are neither simple nor automatic.
The evidence throughout this Report suggests that the way LDCs have been integrating into the world economy over the past 30 years has not had a favourable impact on their development. LDCs are more
marginalized within the global economy today than they were
three decades ago.
In an open world economy, LDCs face a major
development challenge, which arises because the productivity gap between
LDCs and developed countries is enormous.

175An Agenda for Action: (I) Finance and (II) Trade
context of an open trade regime. To reverse the above-mentioned negative trends, LDCs need to promote diversification of their economies and build up their productive capacities. A major question is how they can achieve these objectives, given the extent of openness of their economies and the size of the productivity gap.
This section of the chapter proposes some aspects of the design of the multilateral trading system to address this challenge as part of a NIDA for LDCs. It focuses on three major areas for action: (i) the possibility of an “early harvest” for LDCs emerging from the Doha Round of multilateral trade negotiations under the aegis of the WTO, in particular in relation to duty-free and quota-free (DFQF) market access; (ii) empowering LDCs to use existing flexibilities provided under current trade rules so that they can implement a strategic trade policy; and (iii) financing trade development through the Enhanced Integrated Framework and Aid for Trade. All three areas of action are complementary, as realizing commercial benefits from preferential market access depends upon both the availability of finance to develop export supply capacities and also on trade policies that provide appropriate incentives.
In contrast to the other pillars of the NIDA, the LDCs themselves formulated a set of detailed proposals on how the multilateral trading system could best promote their development interests. These proposals were contained in a series of LDC Ministers’ Declarations adopted at Zanzibar in 2001, Dhaka in 2003, Dakar in 2004, Livingstone in 2005, Maseru in 2008 and Dar es Salaam in 2009. The Dar es Salaam Declaration (WTO, 2009) includes a very rich and detailed set of proposals (see box 8). While all these proposals are important, the present chapter focuses on a few priorities for LDC-specific ISMs within the multilateral trading system.
1. THE “EARLY HARVEST” FOR LDCS, EMERGING FROM THE DOHA NEGOTIATIONS
(a) The timing of the “early harvest”
It is clear that the successful conclusion of the Doha Round of multilateral trade negotiations at the WTO in a manner which maintains the central importance of development outcomes for all developing countries would also benefit LDCs. Such benefits would arise partly from its overall boost to global prosperity. In addition, LDCs would gain if other developing countries could upgrade their export structures and move up the trade development ladder, thereby creating space for the tail-end latecomer countries. On the other hand, when other developing countries are hindered in their development processes, their competition with LDCs intensifies.
LDCs could also benefit from LDC-specific preferential treatment within the Doha Round. The Dar es Salaam Declaration at the Sixth LDC Trade Ministers’ Meeting was particularly concerned with how to advance and promote the interests of LDCs in the Round. It proposed a set of issues which could constitute an “early harvest” for the LDCs from the negotiations, namely: (i) full implementation of DFQF market access for all products originating from all LDCs, in line with Decision 36 of Annex F of the Hong Kong WTO Ministerial Declaration, (ii) a waiver decision on preferential and more favourable treatment for services and services suppliers of LDCs, and (iii) an ambitious, expeditious and specific outcome for cotton-trade-related aspects,5 in particular the elimination of trade-distorting domestic support
The main policy challenge of LDCs is how to promote
development in the context of an open trade regime.
In contrast to the other pillars of the NIDA, the LDCs themselves formulated a set of detailed proposals on how the
multilateral trading system could best promote their
development interests. These proposals were contained in a series of LDC Ministers’
Declarations.
It is clear that the successful conclusion of the Doha
Round of multilateral trade negotiations at the WTO in a manner which maintains the central importance of
development outcomes for all developing countries would
also benefit LDCs.

The Least Developed Countries Report 2010176
Box 8. The Dar es Salaam Declaration of Trade Ministers of LDCs
Apart from calling for an early harvest of LDC package under the Doha Round, the Dar es Salaam Declaration identified an LDC common platform on key trade and development issues. On the DFQF market access, the Declaration called for a full implementation of the DFQF market access for “all products” from “all LDCs” “by early 2010” “with a view to ensuring commercially meaningful market access for at least 97 per cent of products” which reflects particular concern of Asian LDCs. Developed countries are called upon to specify the products to be included in the 97 per cent coverage “by the time of the draft schedule” and to achieve 100 per cent coverage “no later than the end of implementation period” with the specification of target dates for DFQF treatment on a product-by-product basis, thereby addressing the ambiguity left in the Hong Kong Ministerial Declaration regarding the timing for achieving 100 per cent coverage.
As regards agriculture, the Declaration reaffirmed LDCs’ right for access to all SDT and exemption from any form of reduction commitments, including for those LDCs forming customs union with non-LDCs. This is significant as some LDCs that are part of customs union (e.g. Lesotho in SACU, Rwanda, Burundi, Tanzania in EAC) may be subject to deeper liberalization commitments on account of non-LDC partners that have to undertake such commitments under agricultural tariff cutting modalities. It also calls for an early harvest on cotton, strengthened disciplines on green box, prohibition of export restriction on food items by non-LDCs, and elimination of NTBs affecting commodities, as well as greater LDC flexibilities regarding special safeguard mechanism (SSM) and monetization of non-emergency food aid.
On NAMA, as in agriculture, the Declaration reaffirmed LDCs’ right for access to all SDT and exemption from any form of reduction commitments (including sectoral), again also for those LDCs forming customs union with non-LDCs. It reiterated LDCs flexibility in determining the extent and level of tariff bindings, the elimination of all NTBs affecting LDCs exports and LDC flexibility in using export taxes.
Preference erosion was key issue. The Declaration called for provisions on tropical products (in agriculture) and sectoral initiatives (in NAMA), both of which could lead to “formula-plus” deeper tariff cuts, not to harm export interests of LDCs by causing particularly significant preference erosion. As regards NAMA sectorals, it stresses that “DFQF market access should be provided to LDCs in the products included in the sectoral initiatives from the start of the implementation periods”. This may be significant as proposed sectoral initiative include textile and clothing, which are the major products currently not covered under the US GSP scheme. Thus, extending DFQF coverage to this sector will significantly increase coverage in that market.
As regards services, the Declaration stresses the need for immediate decision granting a waiver for preferential treatment for LDCs, particularly in Mode 4 (as early harvest). Since the waiver decision is only enabling in nature (i.e., it does not guarantee effective provision of preferential market access in individual developed country), it is important to ensure that such preferential market opening be expeditiously achieved on sectors and modes of export interest to LDCs.
On trade facilitation, the Declaration rejected the early harvest for trade facilitation, reaffirming it to be part of a single undertaking. It rather highlighted the need for priority to be given to LDCs in the provision of technical assistance and capacity building support, as well as for flexibilities in LDCs’ implementation of commitments, subject to self-assessment, provision of assistance and capacity acquisition.
On TRIPS, the Declaration made a call for TRIPS amendment to include mandatory requirement for the disclosure of the country of origin of genetic resources and traditional knowledge in patent application in the context of TRIPS-Convention on Biological Diversity (CBD) relationship. It also called for an effective provision of incentives for transfer of technology under TRIPS Article 66.2.
As regards rules, the Declaration supported the exemption of LDCs from the prohibition of fishery subsidies. It also supported the incorporation of SDT in GATT Article XXIV on regional trade agreements in view of the continued engagement of African LDCs in ACP-EU negotiations for EPAs.
Reflecting the continued difficulty faced by acceding LDCs, the Declaration reaffirmed the need for “a binding mechanism” to fast-track the LDC accession, “the urgent and effective implementation” and “precise interpretation” of the 2002 LDC Accession Guidelines.
On Enhanced Integrated Framework and Aid for Trade, the Declaration stressed the need for national ownership, additional predictable funding and expeditious approval of projects (EIF) and priorities to LDCs (AfT).
It is significant that the Declaration called for incorporating the development dimension of the Doha Round into the UN LDC-IV Conference.
Source: WTO, 2009.
measures and export subsidies, and the granting of DFQF market access for cotton and cotton by-products originating in LDCs (WTO, 2009: 2). As regards LDC WTO accession, the Dar es Salaam Declaration stressed the need to adopt a binding mechanism to fast-track the accession of LDCs, to avoid raising non-trade concerns, and to take immediate actions including the precise interpretation of the 2002 Decision.

177An Agenda for Action: (I) Finance and (II) Trade
Implementing these measures should not be made contingent on the completion of the Doha Round. Providing DFQF market access for LDCs is also part of Goal 8 of the MDGs, and its accelerated implementation would be an important aspect of strengthening the Global Partnership for Development between 2010 and 2015, even though it has been negotiated under the auspices of the WTO Doha Round. This is ample reason for urgent implementation of this proposal without waiting for completion of that Round.6
(b) Improving the commercial benefits of preferential market access for goods
At the Hong Kong Ministerial Conference (WTO, 2005), it was agreed that developed country members of the WTO would allow 100 per cent duty-free quota-free (DFQF) access for all products originating from all LDCs without explicit timeframe. It was also agreed that at least 97 per cent of tariff lines on imports originating in LDCs to enter developed countries DFQF be provided by developed country member facing difficulties to provide 100 per cent DFQF market access by 2008 or by the start of the implementation period of the Doha Round results.
Measures enabling wide-ranging market access, combined with flexible rules of origin, could result in a substantial increase in LDCs’ exports to both developed and other developing countries (Carrère and de Melo, 2009; Elliott, 2010). However, as discussed in chapter 2, the legal obligation of DFQF market access does not necessarily bring commercial benefits. To make preferential market access commercially advantageous for LDCs, a number of further measures should be taken.
First, the target for tariff line coverage of at least 97 per cent must be met as expeditiously as possible by all developed countries. Currently, this target has been met by all developed countries but the United States. According to data in Elliot (2010), the current product coverage of the United States’ Generalized System of Preferences for LDCs (with the exception of the African Growth and Opportunity Act – AGOA, which covers some LDCs) has product coverage of only 83 per cent. Therefore, it is still possible to substantially improve the preferential market access of LDCs. In practice, the provision of DFQF access for 97 per cent of LDCs’ exports of goods as soon as possible should be a matter of priority, and then all developed-country members of the WTO should move towards 100 per cent.
Second, even if 97 per cent target is achieved, given that LDCs’ exports are very concentrated, it is possible that the remaining 3 per cent of tariff lines not covered by the DFQF access provision cover a substantial proportion of the exports of LDCs. In other words, it is possible that the products that matter most for LDCs would be excluded from the preferential market access programmes. That is certainly the case with regard to exports originating from the Asian LDCs that concentrate on apparel products. Thus, it is essential that developed countries ensure that when granting 97 per cent coverage, products of commercial interest to LDCs are effectively included in that coverage.
Third, progressing towards 100 per cent coverage in all developed countries must be accelerated. Since the Hong Kong Declaration did not specify target date by which to achieve the 100 per cent coverage, there is risk that the target, which it may be recalled was the ultimate goal of the Declaration, may be further delayed. To date, 100 per cent coverage has been achieved
Measures enabling wide-ranging market access,
combined with flexible rules of origin, could result in a
substantial increase in LDCs’ exports to both developed and
other developing countries.
The target for tariff line coverage of at least 97 per cent must be met as
expeditiously as possible by all developed countries.
Progress towards 100 per cent coverage in all developed countries must be
accelerated.
Implementing the “early harvest” should not be made contingent on the completion
of the Doha Round.
The Least Developed Countries Report 2010178
only in some developed countries. Thus, it is imperative that momentum be maintained towards meeting this ultimate goal.
Extending DFQF coverage for 100 per cent in all OECD countries is expected to create an additional export gain of $2 billion, and gains would be greater up to $5 billion if major middle-income countries offer DFQF access.7 In the United States, for example, an un-adopted draft legislation, “New Partnership for Trade Development Act of 2009 (HR. 4101)”, envisaged extending DFQF benefits for all products from all LDCs.
At the same time, extending product coverage to 100 per cent will affect exports of African countries in the US market as they will experience erosion of AGOA trade preferences, especially its apparel benefits (see box 9). It is thus important to address meaningfully adjustment challenges for certain sub-Saharan African countries, and measures for enhancing their competitiveness would be essential. Innovative mechanism needs to be explored towards addressing such adjustment challenges.
In addition, developing-country members of the WTO in a position to do so could usefully provide trade preferences to LDCs which are expected to generate significant gains given their increasing importance as export markets for a number of LDCs. There has been a number of initiatives recently in that direction, including by India, China and Brazil. China improved its market access conditions regarding 30 African LDCs. It would phase in zero-tariff treatment to 95 per cent of tariff lines for them within 3 years starting with 60 per cent in 2010. India grants preferential market access for all 49 LDCs. Effective in 2008, it grants duty-free treatment on 85 per cent of tariff lines with progressive tariff elimination over five years. Brazil announced its intention in 2009 to grant DFQF access for LDCs covering 80 per cent of all tariff lines by mid-2010 and to cover all tariff lines by 2014. Other developing countries should follow suit and strive to provide DFQF access to LDCs by 2015, the year MDGs should be accomplished.
Box 9. Selected issues in DFQF market accessa
Product coverage and simplified Rules of Origin (RoO) are two major issues regarding DFQF. In United States, AGOA benefits for Sub-Saharan Africa (SSA) are significant for those receiving apparel benefits because preferential margin is large and existing preferences are fully used by eligible exporters. In contrast, Asian LDCs trading under normal GSP scheme do not enjoy similar preferences. This implies scope for improvement by extending product coverage for Asian LDCs. UNCTAD's estimates show that full coverage would increase the value of preferences (i.e. tariff rent) from $1.4 million to $555 million for Bangladesh. Extending DFQF to 100 per cent of products would however induce preference erosion for SSA. Trade simulation analysis using SMART model suggests that while it will increase Bangladesh's exports by $847 million and Cambodia's by $555 million, or 23 per cent and 28 per cent of their pre-policy-change export levels respectively, Lesotho, Madagascar, Kenya, Mauritius and Swaziland will see a decrease in exports in the range of $3-6 million or 1.6 per cent to 1.9 per cent of their pre-policy-change exports.
RoO are significant in affecting LDCs’ ability to effectively utilize existing trade preferences. In the EU, which now provides DFQF treatment for all products under EBA, a key issue under consideration is reforming its preferential RoO. UNCTAD estimates find that the utilization of EBA preferences by 41 LDCs eligible only for EBA was 81 percent in 2008. This rate is contrasted with the higher utilization of 9 ACP-LDCs that had formed EPAs with EU (98%), thus using EPA RoO. Relatively low utilization for EBA-only LDC41 is largely explained by 8 Asian LDCs, owing to their reliance on apparel products which faced relatively stringent RoO in the EU market, requiring them to assemble apparels from yarn, and not from fabric ("double transformation"). New RoO are currently being formulated to help LDCs increase utilization.
a “Evolution of the international trading system and of international trade from a development perspective: The impact of the crisis-mitigation measures and prospects for recovery (TD/B/57/3)” and “International trade and development: Report of the Secretary-General (A/65/211)”.
One study shows that extending DFQF coverage
for 100 per cent in all OECD countries is expected to create an additional export gain of $2 billion, and gains would be greater up to $5 billion
if major middle-income countries offer DFQF access.
Developing-country members of the WTO in a position to do so could usefully
provide trade preferences to LDCs which are expected
to generate significant gains given their increasing
importance as export markets for a number of LDCs.

179An Agenda for Action: (I) Finance and (II) Trade
Another problem of the preferential market access is that it is unilateral and potentially subject to abrupt changes. Thus, the Hong Kong Declaration specifies that the preferential market access for LDCs should be made long-lasting. Stability and predictability of market access would encourage investments by both domestic and foreign investors in sectors that have export potential. Preference-granting countries may be urged to enact their preferential scheme as at a longest time span as possible so as to ensure stability, security and predictability in their schemes.
In addition, rules of origin have been identified as one of the main obstacles for full utilization of the preferential market access. Therefore, rules of origin for LDCs’ exports should be liberalized, simplified and made more transparent in accordance with the Hong Kong Declaration (see box 10).
Finally, new, innovative ways to make preferential market access for the exports from LDCs commercially meaningful should be explored. For example, developed countries could encourage their domestic firms through the provision of favourable tax treatment or grant support for partial cost-coverage to develop supply sources in the LDCs. This would enable the LDCs to take advantage of the preferential market access they have been offered but are at present unable to exploit due to their insufficient supply-side capacity (Mistry and Olesen, 2003). Another possibility is to encourage developing-country investors to invest in LDCs to take advantage of LDCs’ preferential market access. This form of South-South cooperation could strengthen development in both LDCs and other developing countries. DFQF initiatives could also be linked with support measures aimed at building productive
Box 10. Rules of origin
The mere granting of tariff preferences or duty-free market access to exports originating in LDCs does not automatically ensure that the trade preferences will be effectively utilized. Preferences are conditional on compliance with rules of origin requirements. The function of rules of origin is to reduce the risk of trade diversion, and to ensure that the benefits of tariff reductions under those rules apply to products genuinely manufactured or grown in countries that enjoy trade preferences. However, several studies have shown that excessively stringent rules of origin lead to low levels of utilization (see, for example, UNCTAD, 2003; and Persson and Wilhelmsson, 2006).
Moreover, successive rounds of negotiations in GATT/WTO have substantially lowered the preferential margin since the 1970s, and hence the need for stringent rules of origin is simply anachronistic. Finally, major preference-giving countries believe these rules to be outdated, as stated by the European Commission (2007): “Rules of origin are old and have not followed evolutions in world trade. The present rules were initially drawn up in the 1970s and they have not materially changed much since, whereas the commercial world has.”
The LDCs managed to include a formulation on rules of origin in the Hong Kong Ministerial Declaration, wherein WTO members agreed to: “ensure that preferential rules of origin applicable to imports from LDCs are transparent and simple, and contribute to facilitating market access.” Although useful, that formulation did not specify what the rules of origin should be, nor did it address their impact on the utilization of trade preferences.a
The LDCs are currently reviewing a proposal for an across-the-board rule of origin based on a percentage criterion. This would require a calculation of the value of material used in the manufacturing of a given product, which would avoid the shortcomings of other kinds of calculations and it would also avoid the proliferation of product-specific rules of origin by product line. In addition, the calculation methodology takes into account the cost of transport of inputs to the LDCs. This is a factor that unduly penalizes them, especially the island and landlocked LDCs.
The proposal has given particular attention to the setting of the level of percentages on the basis of field findings from a questionnaire answered by enterprises from Eastern and Southern Africa, and using a methodology developed by UNCTAD (2003). This methodology has also been used by the European Commission (2007) in setting the percentages in the proposed new preferential rules of origin for GSP, including for its Everything-but-Arms initiative, which are under consideration for adoption in the EU. The Commission found that by lowering the threshold from a level of 55–60 per cent to 30–45 per cent, full utilization would be achieved with total trade effects roughly three times greater than if the upper threshold were used. Even greater trade effects could be expected in the case of the LDC proposal where the percentage levels are set at 15-25 per cent.
a Rules of Origin and Origin Procedures Applicable to LDC Exports (UNCTAD/DITC/TNCD/2009/4).
Preference-granting countries may be urged to enact their preferential scheme as at a
longest time span as possible to ensure stability, security and predictability in their
schemes.
Rules of origin for LDCs’ exports should be liberalized,
simplified and made more transparent.
The Least Developed Countries Report 2010180
capacities, facilitating integration into supply chains, promoting trade and competitiveness in beneficiary LDCs such as Aid for Trade.8
(c) Preferential market access for LDC services exports
Services represent an additional promising area for granting preferential market access to LDCs. In accordance with the Modalities for special treatment for LDCs in service negotiations adopted in 2003 (WTO, 2003a), WTO members are considering “a waiver, available to all Members, from the obligations of Article II, paragraph 1 of the GATS in respect of preferential treatment benefiting all LDC Members” in providing such a mechanism. Thus, early harvest of a waiver decision can be a reasonable way forward. The challenge remains on effectively securing preferential market access opportunities such as in Mode 4 (movement of natural persons) under the waiver.
Preferential treatment of LDCs in respect of services would likely be welfare enhancing. It is less likely to cause trade diversion for other developing countries since it is more likely to be new access, and it would not entail government revenue loss unlike trade in goods. Significant preference could be offered, given that the existing barriers are prohibitive or quite high. Such access would also give a stronger boost to LDCs’ economic diversification. Service sector development and trade, such as tourism, movement of service suppliers and IT-related services, could become powerful drivers of local and even national development.
Service exports in the form of Mode 4 are another promising area. Migration to cities and the inability of the labour market to absorb newcomers have resulted in increasing levels of emigration from LDCs. If employment opportunities in LDCs do not improve, that outward flow is likely to grow even further. Thus, provisions of services through Mode 4, and broader labour movement, covering all skill categories, as well as facilitated recognition of qualification, would be important. The rising importance of remittances in many LDCs indicates that the process of spontaneous emigration is already well under way. It also shows that there are benefits for both home and host countries. For the home country, the benefits from emigration include remittances and payments to workers, alleviation of the pressure on the domestic labour market, and opportunities for the transfer back to the home country of ideas and technologies. For host countries, in particular developed ones, foreign workers compensate for the scarcity of less skilled workers.
A more organized process of delivering labour services under Mode 4 could potentially increase these benefits for both. Liberalization of 3 per cent of OECD counties’ labour market is estimated to bring global welfare gains of $156 billion. The contribution of Mode 4, and broader labour movement, to development is significant as global labour migrants continue to rise as a channel for transfer of skills and ideas. Mode 4 remains relatively restricted due to concern over its impact on domestic labour market, allowing only intra-corporate transferees and business visitors/services salesperson. While inclusion of new categories of services suppliers are under consideration by a few countries, offers have so far fallen far short of expectations from developing countries and LDCs in terms of sectoral coverage, removal of quota and economic needs test/labour market test and facilitation of administrative procedures for entries of Mode 4 services suppliers.
Thus, members of the WTO could improve market access conditions for LDCs’ services exports, especially those falling under Mode 4, including
Preferential treatment of LDCs in respect of services is less likely to cause trade
diversion for other developing countries since it is more
likely to be new access, and it would not entail government revenue loss unlike trade in
goods.
Service sector development and trade, such as tourism,
movement of service suppliers and IT-related services, could become powerful drivers of
national development.
Provisions of services through Mode 4, and broader labour movement, covering all skill categories, as well as facilitated recognition of qualification, would be
important.
Members of the WTO could improve market
access conditions for LDCs’ services exports, especially those falling under Mode 4, including through the provision of temporary
visa schemes.

181An Agenda for Action: (I) Finance and (II) Trade
through the provision of temporary visa schemes. A waiver decision on preferential and more favourable treatment to services and service suppliers of LDCs is therefore important.
(d) Accession to the WTO
The accession process of LDCs to the WTO is cumbersome and slow. Moreover, the accession process has often led to commitments that are deeper and more stringent than those applicable to existing WTO members, with the result that acceding countries’ policy flexibilities are reduced substantially while certain SDT provisions such as transitional periods are subject to negotiations on a case-by-case basis. Since acceding countries are in a weaker bargaining position as they seek the membership, concern emerged to streamlining and improving the accession process to make it fairer and more balanced.
Although this aberration is not part of the LDC Ministers’ proposed “early harvest”, the process of accession could be quickly changed by the significant improvement and prompt and effective implementation by the WTO members of the Decision on the Accession of LDCs of December 2002 (WTO, 2003), to be supported by adequate institutional arrangements, transparency and follow-up mechanisms. A fundamental issue is that the WTO Agreement Article XII does not provide any guidance apart from saying accession should be done “on terms to be agreed”. This has been significant challenge for LDCs. This is why the Dar es Salaam Declaration proposed various initiatives, including “precise interpretation of 2002 Decision” with a view to its improvement. So what is needed seem to be not only implementation of the Decision but also improvement, and some practical follow-up mechanism.
In particular:
• Accession of LDCs to the WTO should be facilitated, and should be made consistent with LDCs’ development status. In other words, new LDC members should not be forced to accept more onerous commitments than the existing LDC members. Instead, the WTO member States should automatically grant all LDCs the right to benefit from the SDT provisions contained in WTO agreements, and refrain from seeking market accession concessions taking into account the levels of concessions and commitments undertaken by existing WTO LDCs’ Members (2002 Decision). This could be promoted by adopting a binding mechanism for fast-track mechanism for the accession of LDCs.
• WTO members should adopt a rule that the LDC accession process be completed within a shortest period of time, e.g., three-year period. This could be made feasible by the automatic granting of SDT to all LDCs at the start of negotiations, which would substantially reduce the length of the process.
• WTO members should simplify the process of accession for LDCs by avoiding unnecessary procedures. This would also reduce the length of the process.
2. EMPOWERING LDCS TO USE FLEXIBILITIES PROVIDED UNDER WTO RULES
Improved market access can potentially help LDCs, but it is economically irrelevant unless they are able to take advantage of that opportunity. This
The accession process of LDCs to the WTO is
cumbersome and slow and has often led to commitments that are deeper and more stringent
than those applicable to existing WTO members.
Accession of LDCs to the WTO should be facilitated,
and should be made consistent with LDCs’ development
status.
The WTO member States should automatically grant all LDCs the right to benefit from the SDT provisions contained
in WTO agreements, and refrain from seeking market accession concessions above
the levels undertaken by existing WTO LDC Members.
WTO members should adopt a rule that the LDC accession process be completed within a
shortest period of time.

The Least Developed Countries Report 2010182
depends on policies and finance, which are the subjects of this present and subsequent section.
As argued in chapter 3 and earlier in more detail by UNCTAD (2004), rapid and comprehensive trade liberalization in the LDCs has not had the desired effects, given the very low level of development of their productive capacities and their large productivity gap with other countries. LDCs need to develop what could be called a “strategic trade policy”, as opposed to the current trade policy of maximizing trade liberalisation as an end in itself. That kind of new trade policy is needed to support their development and poverty reduction efforts. It would have to be compatible with the new post-crisis global macroeconomic environment and would take advantage of the new opportunities associated with South-South trade. They should be given the necessary support to enable them to use all the flexibilities already available under WTO rules to foster the development of their productive capacities and pursue their strategic integration into the global economy.
Strategic integration into the global economy means starting at the development end rather than at the trade end of the relationship between trade and development (UNCTAD, 2006a). The first step towards promoting LDCs’ fuller participation in the multilateral trading system, consistent with their wider development goals, is to empower LDCs to use all the policy space currently available to them under the existing multilateral trade regime. In practice, at present most LDCs do not use all the policy space permitted de jure under the prevailing rules of the game. Furthermore, proliferation of RTAs, especially North-South RTAs, have meant policy space available for LDCs under WTO are being overridden or bypassed by deeper and broader commitments under such agreements. WTO accession has also led to WTO-plus commitments for acceding LDCs. The next step is to ensure that the flexibilities provided under SDT are genuinely supportive of the development of productive capacities.
(a) Using available flexibilities
An example, and probably the most important one, of how LDCs do not use available flexibilities at present is the large gap between bound and applied tariff rates in LDCs. This difference, called “tariff overhang” or “tariff water”, is indicative of the degree of flexibility each member of the WTO has within the current rules. Foletti et al. (2009) find that LDCs have relatively large policy space regarding the “water”, but they do not use it. The bound tariff rates of LDC WTO members are mostly higher than 40 per cent, and in some cases even much higher (chart 35). However, the applied tariff rates are much lower. The gap between the two is very pronounced, which means they could, in principle, use tariff instruments for trade development much more actively than they are currently doing.
LDCs do not utilize all the flexibilities under the WTO rules and all the policy space available to them partly because of the propagation of one-size-fits-all policies via structural adjustment programmes and the conditionalities attached to financial support from the IFIs, including debt relief. Buira (2003) notes that the weaker the recipient country, the more likely it is that conditionality will lead to an imposition of IMF policies. According to Paul Volcker, former Governor of the Federal Reserve Board, “When the Fund consults with a poor and weak country, the country gets in line. When it consults with a big and strong country, the Fund gets in line” (cited in Buira,
LDCs need to develop what could be called a
“strategic trade policy”, as opposed to the current trade policy of maximizing trade liberalisation as an end in
itself.
The first step towards promoting LDCs’ fuller
participation in the multilateral trading system, consistent with their wider development goals, is to
empower LDCs to use all the policy space currently
available to them under the existing multilateral
trade regime.
LDCs do not utilize all the flexibilities under the WTO
rules and all the policy space available to them partly
because of the propagation of one-size-fits-all policies via structural adjustment
programmes and the conditionalities attached to financial support from the IFIs, including debt relief.
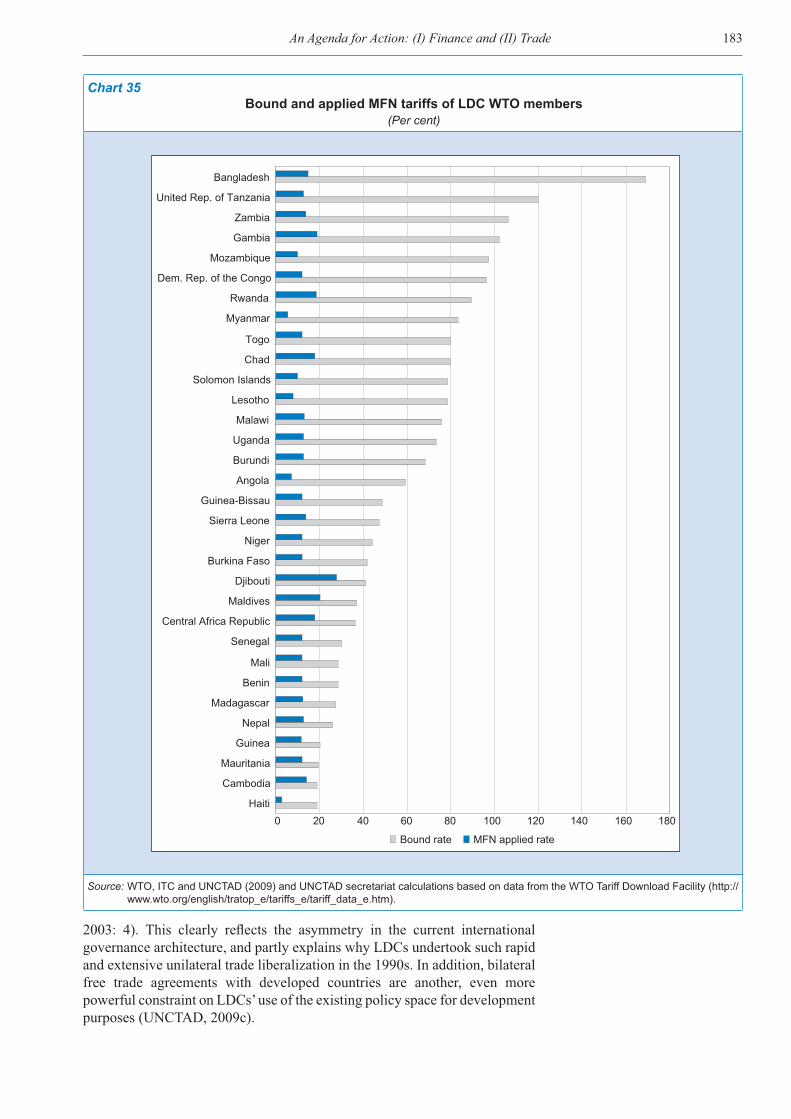
183An Agenda for Action: (I) Finance and (II) Trade
Chart 35Bound and applied MFN tariffs of LDC WTO members
(Per cent)
Bound rate MFN applied rate
0 20 40 60 80 100 120 140 160 180Haiti
Cambodia
Mauritania
Guinea
Nepal
Madagascar
Benin
Mali
Senegal
Central Africa Republic
Maldives
Djibouti
Burkina Faso
Niger
Sierra Leone
Guinea-Bissau
Angola
Burundi
Uganda
Malawi
Lesotho
Solomon Islands
Chad
Togo
Myanmar
Rwanda
Dem. Rep. of the Congo
Mozambique
Gambia
Zambia
United Rep. of Tanzania
Bangladesh
Source: WTO, ITC and UNCTAD (2009) and UNCTAD secretariat calculations based on data from the WTO Tariff Download Facility (http://www.wto.org/english/tratop_e/tariffs_e/tariff_data_e.htm).
2003: 4). This clearly reflects the asymmetry in the current international governance architecture, and partly explains why LDCs undertook such rapid and extensive unilateral trade liberalization in the 1990s. In addition, bilateral free trade agreements with developed countries are another, even more powerful constraint on LDCs’ use of the existing policy space for development purposes (UNCTAD, 2009c).
The Least Developed Countries Report 2010184
LDCs should be enabled and encouraged to adopt a strategic trade policy within a broader set of policies aimed at developing their productive capacities and increasing employment opportunities. It is important to emphasize that the Dar es Salaam Declaration calls for efforts to ensure that coherence between the WTO and IFIs, in line with the rights and flexibilities that LDCs have obtained under the WTO, be fully operationalized to support LDCs’ development objectives.
Ideally, the speed and degree of trade liberalization should take into account, first and foremost, the goal of developing LDCs’ productive capacities. However, given the very open trade regimes of most of the LDCs, that option is no longer available to them. Instead, a new strategic trade policy should first give priority to supporting agricultural production and, second, to selective promotion of new activities that will enable economic diversification and the gradual development of international competitiveness.
(i) Strengthening agricultural production in LDCs
Trade liberalization, coupled with agricultural subsidies in developed countries, has seriously reduced the incentives of LDCs to produce and export agricultural products.9 It is important that developed countries remove trade-distorting agricultural subsidies on goods that compete with LDC exports, most notably rice, sugar and cotton. In addition, the international community should strive to enable LDCs to pursue a more proactive agricultural policy using all the policy instruments available, including tariff and non-tariff measures, to increase their food security and stimulate production for exports. It will be difficult to promote a new Green Revolution in staple food productivity in LDCs in the absence of an appropriate agricultural trade policy.
(ii) Promoting new activities through the selective use of industrial and trade policies
Carefully managed strategic integration into the global economy should also include the use of trade policy to accelerate industrialization and diversification of the economy. It is necessary to move away from the existing pattern of integration that is based mainly on static comparative advantages. The choice of policy instruments in a dynamic process of structural change itself is bound to evolve over time. New, promising activities may merit time-bound infant industry support, while other, more mature sectors could be opened up to international competition. A reasonable trade policy for LDCs would be to remove the anti-export bias, if and where it still exists. At the same time, it would provide selective, temporary protection to economic activities that have the potential to increase exports or substitute imports, or both. Selective use of import tariffs for purposes of economic diversification is of greater value for LDCs than for developed countries, as the former lack public funds to provide subsidies or other types of incentives to promote new activities. Certain subsidies (tax incentives, tax expenditure, etc.), technology transfer or export performance requirements for investors, local content requirement in government procurement, might be implemented by resource-scarce LDCs as well.
Since various LDCs, most notably in Asia, are in the early stages of industrialization, the production and export of labour-intensive, low-skill manufactures has already brought substantial benefits, such as increased employment, higher incomes and productivity, and the upgrading of basic techniques and organizational skills. Some of them now participate in global
The Dar es Salaam Declaration calls for efforts to ensure that coherence between the WTO and IFIs, in line with the rights and flexibilities that LDCs have obtained under the WTO, be fully operationalized to support LDCs’ development
objectives.
A new strategic trade policy should first give priority
to supporting agricultural production and, second, to selective promotion of new activities that will enable economic diversification
and gradual development of international competitiveness.
The international community should strive to enable LDCs to pursue a more proactive agricultural policy using all the policy instruments available, including tariff
and non-tariff measures, to increase their food security and stimulate production
for exports.

185An Agenda for Action: (I) Finance and (II) Trade
value chains by taking on some of the more labour-intensive segments of production of TNCs, mainly because of their very low labour costs. Others have tried to establish their own firms in these production segments. Both options should be encouraged and extended to all LDCs. However, these measures by themselves do not guarantee a shift towards a permanent path of rapid and sustained development. They should be viewed as only a first step in that direction. Labour-intensive exports have clear limits, as they are also subject to the fallacy of composition.10 Therefore, technological upgrading in manufacturing, as well as in other sectors, is necessary for shifting production and exports to higher value-added and skill-intensive products.
Countries that successfully increase their low-wage, labour-intensive production and exports should gradually adopt policies designed to replace imported skill- and technology-intensive parts and components with domestically produced ones to raise the domestic value-added content of their exports. This would require a different approach to trade policy than has hitherto been pursued. It would also require a set of complementary policies, notably those concerning technological upgrading, to be able to move to the next stage of development (see chapter 6). The overall aim should be to combine selective, time-bound protection and export promotion as integral parts of a single strategy aimed at accelerating investment, income and productivity growth in the long run (box 11).
When devising a strategic trade policy, important lessons can be learnt to avoid the pitfalls of the earlier import-substitution experiences of many countries, particularly those in Latin America. For example, if certain sectors continue to be protected for too long, the result could be inefficiency and rent seeking. The experiences of successful latecomers, especially in East
Box 11. Trade policy and the optimal degree of openness of LDCs
Bhaduri (2005) and Akyüz (2009) argue that openness should not be independent of time and space as it is under the present free trade paradigm. Instead, it should take into account each country’s stage of development and the direction in which it is trying to steer its economy. These highly specific circumstances therefore require the multilateral trade regime to be flexible enough to allow all countries to reach their “ideal” level of openness suited to their conditions at a particular juncture. It should also be based on the principle of non-reciprocity, to allow LDCs to shield some of their activities from the competition they are not yet prepared to face.
Ideally, such a regime should allow domestic producers to acquire inputs at world prices (i.e. tariff-free inputs), while protecting those producers against damaging competition from abroad. Operationally, this calls for a selective and differentiated tariff structure, where inputs are exempt from import duties while tariff rates on goods that compete with domestic production are raised. Imports of luxury consumer goods should also be subject to the highest tariffs possible under the WTO rules, while imports of food not produced domestically should be duty free. In addition, domestic agricultural production of LDCs should be shielded from foreign competitors, many of which are from developed countries and receive large subsidies by their Governments.
Concerning the development of productive capacities, it makes little sense to levy tariffs on all imports, since LDCs do not produce many of these products. Instead, tariffs should be imposed on the types of products where LDCs have a reasonable chance of developing their own production. Tariffs on capital goods and most machinery at the early stages of industrialization are counterproductive: since they have to be imported, they would be unaffordable if subject to tariffs and would thereby deprive the economy of essential means of production. In order to promote import substituting production, tariffs on imported goods that could be produced domestically, and which either raise value added or are labour-intensive, should be increased to ensure a reasonable period of learning and experimentation by local producers. This would help to enhance productive capacities in the long run, diversify the productive structure and create jobs, thereby reducing pressures on the labour market.
For LDCs to be able to adopt these instruments of trade policy, the WTO rules would have to be interpreted more flexibly to allow LDCs a more active use of promotion measures – both tariffs and non-tariff ones – for LDCs’ infant industries. This would give LDCs more policy space to shift from their heavy dependence on commodities to more diversified and higher value added production. Only then would it be possible for these countries to take fuller advantage of their preferential access to the markets of developed countries and integrate more favourably into the global economy.
Technological upgrading in manufacturing, as well as in other sectors, is necessary for shifting production and
exports to higher value-added and skill-intensive products.
The overall aim should be to combine selective, time-
bound protection and export promotion as integral parts of a single strategy aimed at accelerating investment,
income and productivity growth in the long run.

The Least Developed Countries Report 2010186
Asia, show that different mechanisms, such as reciprocal control mechanisms, performance requirements and sunset clauses, could be effectively employed for avoiding these problems.
Even if the present institutional capacities of LDCs are not sufficiently advanced for them to implement a set of complex policies and instruments, this should not deter them. After all, at the time of their industrialization, many of today’s developed countries did not have the same set of institutions they now have, but were able to catch up with leaders through a learning process. The consequences for LDCs of the application of one-size-fits-all policies have already been observed, especially with regard to trade liberalization, and the record is at best mixed. Therefore, it is time for them to look for other ways to achieve their development goals.
Another important consideration in devising a strategic trade policy should be given to regional economic integration initiatives. In general, LDCs are small countries with very small domestic markets, which means they are unable to benefit from economies of scale. This drawback can be overcome through regional economic integration, which provides a much larger market and offers LDCs an opportunity to export to other countries while being shielded to some extent from competition from the more advanced developing and developed countries. In addition, evidence suggests that intraregional trade, even among LDCs and/or low-income countries, usually has a higher technological content than North-South trade (chapter 4). Thus, LDCs should strive to strengthen the existing regional integration schemes among partners at similar levels of development, and engage more forcefully in South-South cooperation, as argued in chapter 7. This would help increase the policy space of these countries regionally.
In sum, LDCs need all the flexibilities provided under the multilateral trading rules in order to spur development of their productive capacities. Such flexibilities should be firmly secured for them and should not be diluted by RTAs or WTO accession processes. Empowering them to use these flexibilities should be made the overarching feature of the international community’s support for the development of these countries.
(b) Strengthening special and differential treatment for LDCs
As discussed in chapter 2, the SDT provisions for LDCs in WTO agreements mainly take the form of longer transition periods so that they are not immediately exposed to multilateral disciplines. However, the length of the transition period is currently completely arbitrary. For example, in the TRIPS Agreement, the transition period for LDCs was 11 years from the date of entry into force (1 January 1995), and was extended in 2005 until 1 July 2013. A major problem is that the transition period is not related in any meaningful way to the capacity of individual LDCs to produce and export, and to their overall level of development. It would be possible to improve SDT for LDCs if the transition periods granted to LDCs for non-application of WTO rules were linked to objective economic and social criteria, rather than to fixed time frames as is currently the case. Thus, while the priority should be to enable LDCs to use available flexibilities, strengthening SDT should not be forgotten.
A major problem is that the transition period in SDT is not related in any meaningful way to the capacity of individual LDCs to produce and export,
and to their overall level of development.
While the priority should be to enable LDCs to use available
flexibilities, strengthening SDT should not be forgotten.

187An Agenda for Action: (I) Finance and (II) Trade
3. ACCELERATING THE PROVISION OF AID FOR TRADE
Finance is also critical for trade development and for enabling LDCs to take advantage of market access opportunities. As shown in chapter 2, the EIF offers an important operational mechanism for ensuring that aid for trade development in the LDCs is focused on priority activities and is integrated within national development and poverty reduction strategies. However, thus far, the flow of aid for trade, using the OECD statistical definition of this category, has been increasing more slowly in LDCs than in other developing countries. A priority international support mechanism for LDCs should be to accelerate the flow of aid for trade to LDCs, and ensure that it is directed at enhancing their productive capacities and international competitiveness. Trade capacity-building should be seen as part of the wider objective of developing LDCs’ productive sectors and promoting the development of their private sectors.
As the Diagnostic Trade Integration Study (DTIS) is the basic building block of the EIF, it is clear that its content is vital for the overall outcome of the process of mainstreaming trade into national development strategies. In this regard, it is necessary to elaborate appropriate methodologies for mainstreaming trade into development and poverty reduction strategies. UNCTAD (2004) offers an approach which places the balance of trade, export and import forecasts and the growth elasticity of poverty reduction at the centre of policy analysis for the purpose of identifying trade policy options.
Special care needs to be taken to ensure that the DTIS is carried out in a way that promotes country ownership. This can be facilitated through technical support for the establishment of an efficient trade-policy-making process within LDCs in which: (i) the country’s trade interests are clearly identified within an overall development strategy; (ii) those interests are translated into policies and negotiating goals; and (iii) roles are distributed and resources allocated for implementation of those policies and promotion of those interests (Solignac Lecomte, 2003: 3). Inter-ministerial coordination across a range of government ministries, as well as consultation with the private sector, are a vital part of this process (Saner, 2010).
In general, it is clear that trade facilitation which reduces the transaction costs that are currently inhibiting trade flows is an important element that needs to be financed. However, it is necessary to go beyond the technical assistance that facilitates trade to also supporting national policies geared to increasing the supply capacity of LDCs. An important component would be to help LDCs develop more dynamic and diversified economies by reducing their commodity dependence, increasing their local value added and developing their technological capabilities. Finance is required for promoting sustainable agriculture in LDCs, and for boosting their manufacturing and services sectors as well as for improving their trade-related infrastructures, especially transport and communications. Some of the priority actions which could be supported to promote resource-based diversification and technological development are discussed in the next chapter.
A priority international support mechanism for LDCs
should be to accelerate the flow of aid for trade to LDCs, and ensure that it is directed at enhancing their productive capacities and international
competitiveness.
It is clear that trade facilitation which reduces
the transaction costs that are currently inhibiting trade
flows is an important element that needs to be financed. However, it is necessary
to go beyond the technical assistance that facilitates trade to also supporting
national policies geared to increasing the supply capacity
of LDCs.
The Least Developed Countries Report 2010188
Notes1 For a discussion on the practicalities of domestic resource mobilization in Africa, see
UNCTAD, 2009a. 2 This and the next section draw largely on Culpeper, 2010.3 The increase in 2009 included both the SDR 161.2 billion recommended by the G-20 plus
a special allocation of SDR 21.5 billion, proposed in 1997 under the Fourth Amendment of the IMF Articles, to allow all members to participate equitably in the SDR system, even if they joined the Fund after prior SDR allocations.
4 “IDA-only” are countries with the GNI per capita below $1,165, eligible for interest-free credits and grants from the International Development Association, while “blend” countries are IDA-eligible based on per capita income levels, but are also creditworthy for some IBRD borrowing.
5 Addressing cotton ambitiously, expeditiously, and specifically is the stated objective of the WTO membership since July 2004 (July 2004 Package). Cotton issue enjoys a wide-spread strong support from the LDC Group, as well as Africa, ACP, G20 and some developed countries as “litmus test” for the development dimension of the Doha Round. Cotton-4 has proposed specific formula to reduce cotton domestic support which remains to be agreed. The outstanding issue is the ability of the US to reduce domestic support, particularly product-specific limit on blue box support which US has argued could only be determined after agreement on a general reduction formula on domestic support, and subject to better market access opportunities in large emerging economies.
6 This idea was initially proposed by the Center for Global Development (Elliott, 2010).7 Bouët et al. 2010.8 Such support mechanism was proposed in the above mentioned draft US legislation (HR
4101).9 A good example is rice production in Haiti (for details, see UNCTAD, 2010b).10 “Fallacy of composition” refers to a situation where a strategy that is good for one producer
or one country turns out to be bad if this same strategy is used by all of them at the same time.
ReferencesAkyüz Y (2009). Industrial tariffs, international trade, and development. In: Cimoli M, Dosi
G and Stiglitz J, eds., Industrial Policy and Development. Oxford and New York, Oxford University Press:
Aryeetey G (2004). A development-focused allocation of the special drawing rights. Discussion Paper 2003/3, UNU-WIDER, Helsinki.
Atkinson AB (2004). New sources of development finance: Funding the Millennium Development Goals. UNU-WIDER, Helsinki
Bhaduri A (2005). Toward the optimum degree of openness. In: Galagher K, ed., Putting Development First: The Importance of Policy Space in the WTO and International Financial Institutions. London and New York, Zed Books: 69-79.
Bhinda N and Martin, M (2009). Private capital flows to low-income countries: dealing with boom and bust. FPC CBP Series No. 2, Debt Relief International, London.
Bird G (2009). Reforming IMF conditionality: From “streamlining” to “major overhaul”. World Economics, 10 (3) July-September: 81–104.
Briceno-Garmendia C, Estache A and Shafik N (2004). Infrastructure services in developing countries: access, quality, costs and policy reform. World Bank Policy Research Working Paper 3468, World Bank, Washington, DC.
Bouët A et al. (2010). The costs and benefits of duty-free, quota-free market access for poor countries: Who and what matters. Research paper for the Center for Global Development, Washington, DC, March.
Buira A (2003). An analysis of IMF conditionality. G-24 Discussion Paper No. 22, UNCTAD, Geneva.
Carrère C and de Melo J (2009). The Doha Round and market access for LDCs: Scenarios for the EU and US markets. CEPR Discussion Paper no.7313 (June). London, Centre for Economic Policy Research.
Chang H-J (2003). Kicking Away the Ladder – Development Strategy in Historical Perspective. London, Anthem Press.
Culpeper R. (2010). Global governance, international support mechanisms and LDCs: Reality and opportunities. Study prepared for UNCTAD as background paper for the The Least Developed Countries Report 2010. Geneva, 15 May.
189An Agenda for Action: (I) Finance and (II) Trade
Dalleau M (2010). The Vulnerability-Flex Mechanism: A success story? Trade Negotiations Insights, 9 (2). Geneva, International Centre for Trade and Sustainable Development.
de la Torre A, Gozzi JC and Schmukler SL (2007). Innovative experiences in access to finance: Market friendly roles for the visible hand? Policy Research Working Paper No.4326, World Bank, Washington, DC.
De Renzio P and Mulley S (2006). Donor coordination and good governance: Donor-led and recipient-led approaches. Oxford, Managing Aid Dependency Project, University of Oxford and University College, London.
Di John J (2008). Taxation, resource mobilization and productive capacity-building in LDCs. Study prepared for UNCTAD as background paper for the Least Developed Countries Report 2008. Geneva, UNCTAD.
Elliott KA (2010). Open markets for the poorest countries: Trade preferences that work. Washington, DC, CGD Working Group on Global Trade Preference Reform, Center for Global Development.
European Commission (2007). Impact assessment on rules of origin for the Generalized System of Preference (GSP), Taxud/GSP-RO/IA/1/07, Brussels, 25 October.
Foletti L, et al. (2009). Smoke in the water: the use of tariff policy flexibility in crises. Policy Research Working Paper no. 5050, World Bank, Washington, DC.
Gibbon P and Schulpen L (2004). Comparative appraisal of multilateral and bilateral approaches to financing private sector development. In: Odedokun M, ed., External Finance for Private Sector Development: Appraisals and Issues London, Palgrave Macmillan (for UNU-WIDER): 42–91.
Girishankar N (2009). Innovating development finance. Policy Research Working Paper 5111. Washington, DC, World Bank.
Griffith-Jones S, Griffith-Jones D and Hertova D (2008). Enhancing the role of regional development banks. G–24 Discussion Paper Series no. 50. Geneva, UNCTAD.
Helleiner G (2010, forthcoming). Towards realistic governance reform in international financial institutions. Global Economy Journal, 10(3).
Hughes A and Brewster H (2002). Lowering the threshold: Reducing the cost and risk of private direct investment in least developed, small and vulnerable economies. Commonwealth Secretariat Paper Series, London.
IDA (2009a). IDA15 Mid-Term Review: Implementation Report Washington, DC, International Development Association, Resource Mobilization Department.
IDA (2009b). Proposal for a pilot IDA crisis response window. Washington, DC, International Development Association, Resource Mobilization Department.
IMF (2007). Structural conditionality in IMF- supported programs. Independent Evaluation Office, Washington, DC.
IMF (2010). Preserving debt sustainability in low-income countries in the wake of the global crisis. Washington, DC.
Kar D and Devon CS (2008). Illicit Financial Flows from Developing Countries: 2002-2006, Global Financial Integrity, Washington DC.
Killick T (2008). Aid management policies in least developed countries. Study prepared for UNCTAD as a background paper for The Least Developed Countries Report 2008. Geneva, UNCTAD.
Menocal AR and Mulley S (2006). Learning from experience? A review of recipient-government efforts to manage donor relations and improve the quality of aid. ODI Working Paper no. 268, Overseas Development Institute, London.
Mistry PS and Olesen NE (2003). Mitigating risks for foreign investments in least developed countries. Report prepared for the EGDI-Secretariat, Swedish Ministry for Foreign Affairs, Stockholm, Sweden.
Ndikumana L and Verick S (2008). The linkages between FDI and domestic investment: Unravelling the developmental impact of foreign investment in sub-Saharan Africa. Development Policy Review, 26(6), 713–726.
Ocampo JA et al. (2010). The great recession and the developing world. Paper prepared for the Conference on Development Cooperation in Times of Crisis and on Achieving the MDGs. Madrid, 9-10 June, 2010.
OECD (2005). Paris declaration on aid effectiveness: Ownership, harmonization, alignment, results and mutual accountability. Development Co-operation Directorate - Development Assistance Committee, Organization for Economic Co-operation and Development, Paris.
Persson M and Wilhelmsson F (2006). Assessing the effects of EU trade preferences for developing countries. Lund, Lund University.
Saner R and Guilherme R (2008). IMF conditionalities for the least developed countries. G-24 Policy Brief No. 19, Washington, DC.
Saner R (2010). Trade policy governance through inter-ministerial coordination: a source book for trade officials and development experts. Republic of Letters Publishing, Dordrecht, The Netherlands.
The Least Developed Countries Report 2010190
Solignac Lecomte HB (2003). Building capacity to trade: What are the priorities?, Web Docs No. 11, OECD Development Centre, Paris (http://www.oecd.org/dev/technics).
Soros G (2001). Open societies, sovereignty, and international terrorism. Address to the Asia Society Hong Kong Centre, 19, September 2001.
UNCTAD (2000). The Least Developed Countries Report 2000: Aid, Private Capital Flows and External Debt: The Challenge of Financing Development in LDCs. United Nations publication, sales no. E.00.II.D.21, Geneva and New York.
UNCTAD (2003a). World Investment Report 2003 - FDI policies for development: national and international perspectives; UNCTAD; New York and Geneva.
UNCTAD (2003b). Trade preferences for LDCs: An early assessment of benefits and possible improvements, UNCTAD/ITCD/TSB/2003, Geneva.
UNCTAD (2004). LDC Report 2004: Linking International Trade with Poverty Reduction. United Nations publication, New York and Geneva.
UNCTAD (2006). The Least Developed Countries Report 2006: Developing Productive Capacities. United Nations publication, sales no. E.06.II.D.9, Geneva and New York.
UNCTAD (2008). The Least Developed Countries Report 2008: Growth, Poverty and the Terms of Development Partnership. United Nations publication, sales no. E.08.II.D.20, Geneva and New York.
UNCTAD (2009a). Enhancing the Role of Domestic Resources in Africa’s Development: a Policy Handbook. UNCTAD. New York and Geneva.
UNCTAD (2009b). LDC Report 2009: The State and Development Governance. United Nations publication, New York and Geneva.
UNCTAD (2009c). Economic Partnership Agreements: Comparative analysis of the agricultural provisions, UNCTAD/DITC/TNCD/2009/3, Geneva.
UNCTAD (2010a). Responding to the challenges posed by the global economic crisis to debt and development finance. New York and Geneva.
UNCTAD (2010b). Rebuilding Haiti: a new approach to international cooperation. UNCTAD Policy Brief No. 13, New York and Geneva.
van Waeyenberge E, Bargawi H and McKinley T (2010). Standing in the way of development? A critical survey of the IMF’s crisis response in low-income countries. Brussels, The European Network on Debt and Development and Third World Network.
Weeks J (2010). Enabling recovery and macro stability in LDCs. Study prepared for UNCTAD as a background paper for the Least Developed Countries Report 2010, New York and Geneva.
Weisbrot M et al. (2009). IMF-supported macroeconomic policies and the world recession: A look at forty-one borrowing countries. London, Centre for Economic Policy Research.
Williamson J (2005). Policies to reduce the vulnerability of low-income countries. In: Teunissen JJ and Ackermann A, eds., Protecting the Poor: Global Financial Institutions and the Vulnerability of Low-Income Countries. The Hague, Forum on Debt and Development: 14–34.
WTO (2003a). Modalities for the special treatment of Least-Developed Country members in the negotiations on trade in services, Council for Trade in Services, TN/S/13, Geneva.
WTO (2003b). Accession of Least-Developed Countries, General Council’s Decision of 10 December, 2002, WT/L/508, 20 January, Geneva.
WTO (2005). Doha Work Programme Ministerial Declaration, WT/MIN(05)/DEC, Hong Kong, 22 December.
WTO (2009). Dar es Salaam Declaration, LDC Ministerial Meeting, WT/MIN/(09)2, Geneva.WTO, ITC and UNCTAD (2009). World Tariff Profiles 2009. Geneva, World Trade Organization,
International Trade Centre and United Nations Conference on Trade and Development. Zimmermann F and McDonnell I (2008). Broadening ownership for development. In: OECD
Development Centre, Financing Development 2008: Whose Ownership? Paris, OECD Development Centre.

Chapter
6An Agenda for Action: (III) Commodities and
(IV) TechnologyThis chapter treats two of the five core pillars of the NIDA, namely,
commodities and technology. Without an effective technology policy, the commodity value chain cannot be developed, diversification out of commodities is unlikely to happen, and LDCs which have diversified out of commodities will not be able to upgrade from low-skill manufactures or simple services. Both the commodities and technology issues have been largely neglected in the international economic architecture and represent salient opportunities for constructive initiatives, with major benefits for LDCs.
A. Commodities
The behaviour of commodity prices is a major development problem for commodity-dependent countries, and in particular the LDCs. The problem arises from a combination of long-term declining terms of trade (for a number of primary commodities) and extremely volatile prices over the short term, which undermines the prospects for productive investment and has negative effects on the productivity of capital. As reported in Borensztein et al. (2009), commodity prices shocks are very persistent, with the year-on-year volatility of prices varying from 10 to 40 per cent across primary commodities. This is likely to exert a negative impact on an economy’s balance of payments and external indebtedness. Moreover, price volatility not only hampers fiscal planning, it can also exacerbate social inequalities and impede development (chart 36).
Chart 36Price volatility for selected commodity groups, 2000–2010
(Indices, 2000=100)
0
50
100
150
200
250
300
350
400
450
500
Jan2 0 0 0
Jul2 0 0 0
Jan2 0 0 1
Jul2 0 0 1
Jan2 0 0 2
Jul2 0 0 2
Jan2 0 0 3
Jul2 0 0 3
Jan2 0 0 4
Jul2 0 0 4
Jan2 0 0 5
Jul2 0 0 5
Jan2 0 0 6
Jul20 0 6
Jan2 0 0 7
Jul2 0 0 7
Jan2 0 0 8
Jul20 0 8
Jan2 0 0 9
Jul2 0 0 9
Jan2 0 10
Food and tropical beverages Vegetable oilseeds and oil Agricultural raw materialsMinerals, ores and metals Crude petroleum
Source: UNCTAD secretariat calculations, based on UNCTAD’s GlobStat database.
The behaviour of commodity prices is a major development
problem for commodity-dependent countries, and in particular the LDCs.
The Least Developed Countries Report 2010192
The persistent reluctance of the international community to recognize commodity-related development issues has been extremely costly in terms of foregone development opportunities for commodity-dependent developing countries, particularly LDCs. The workings of international commodity markets are clearly unsatisfactory at present: they are leading to recurrent crises with high social and economic costs for the LDCs. The issue of food security is directly linked to this complex problematic and it therefore requires an urgent response from the international community.
The recent food price crisis has revealed a serious case of market failure in the international commodity markets. There is general consensus that global grain markets, in particular, are not functioning well, largely owing to unregulated speculation (i.e. through financial derivatives) by financial investors in agricultural commodity markets. This has generated uncontrollable volatility, leading to increasing concerns regarding the impact of such excessive speculation; if it is allowed to continue, it could well lead to another speculative bubble and another food crisis. This type of market failure in international grain markets needs to be corrected through global collective action. In order to curtail market volatility and ensure a reliable supply of food, numerous stabilization schemes have been considered for some time. Trade-related factors also play an important role in food security, but the link between export volumes and export prices is tenuous, as illustrated by Thailand’s experience in 2008 when the large surges in rice exports preceded the price surges. It is therefore clear that there is a need to improve the effectiveness of the international grain markets before trade can become a vehicle for growth in LDCs. This should be a major theme of a future international policy agenda, and as such, an important objective of the NIDA. In the area of commodities, the long-term goal should be structural transformation leading to more diversified economies. But in the short and medium term, some new forms of international commodity policy are required.
Priority actions in the global economic regime could include the introduction of new measures for reducing the volatility of commodity markets and the adverse impacts of that volatility. Such actions may include the following:
(i) Establishment of a global counter-cyclical financing facility that ensures fast disbursement of aid with low policy conditionality and high concessionary elements upon commodity price shocks;
(ii) Setting up of innovative commodity price stabilization schemes, consisting of both physical and a virtual reserve facilities;
(iii) Introduction of taxation measures to reduce speculation in global commodity markets;
(iv) The counter cyclical loan facility.
A focus for the new generation of ISMs in the area of commodities should be on financial and technical assistance to enable greater local value-added and linkages from resource-based diversification. The problem of highly volatile export earnings can be dealt with through revenue stabilization measures at the national level as well as global measures to reduce commodity price volatility. The ISMs should thus include support to manage and use resource rents better and avoid Dutch disease effects. Financial and technical assistance can also improve country knowledge of the LDCs’ natural resource potential and enhance LDC negotiation capacity with TNCs to ensure that a greater proportion of the rents from natural resource exploitation accrue to the LDCs and that those rents support resource-based industrialization.
The persistent reluctance of the international community
to recognize commodity-related development issues has been extremely costly in
terms of foregone development opportunities for commodity-
dependent developing countries, particularly LDCs.
The recent food price crisis has revealed a serious case
of market failure in the international commodity
markets.
193An Agenda for Action: (III) Commodities and (IV) Technology
Resource rents are economic rents derived from utilization of natural resources. The concept is derived from David Ricardo’s “economic rents” that can be interpreted as the excess of economic return on a product above the total cost of the product.
1. INTERNATIONAL SUPPORT MECHANISMS FOR COMMODITY PRICE STABILIZATION
(a) A global counter-cyclical financing facility
The case for a global counter-cyclical financing facility is predicated on the need for countercyclical macroeconomic demand management to facilitate sustainable socio-economic development for commodity-dependent LDCs. Many LDCs find it difficult to conduct successful countercyclical macroeconomic policy at the national level on their own. This is not just because their Governments often lack the capacity to pursue a policy mix that requires highly specialized technical knowledge, but the opportunity cost of holding savings abroad is perceived to be too high in the light of their immediate needs to accelerate economic development and reduce debilitating poverty. Given this, a global countercyclical financial facility for low-income commodity-dependent countries is proposed here, which would ensure the fast disbursement of aid with low policy conditionality and high concessionary elements at times of commodity price shocks.
Demand management of LDC economies is very complex, since an externally induced balance-of-payments crisis can lead to a sharp drop in domestic demand. Orthodox stabilization policies adopted primarily to restore external equilibrium in such circumstances can move the economy further away from internal equilibrium, at least in the short run. In the light of low domestic aggregate demand, these policies can well be procyclical, in the direction of both internal and external market forces, rather than countercyclical as they should be (Nissanke, 2003). For commodity-dependent economies, macroeconomic management is judged as countercyclical when an appropriate policy configuration of fiscal, monetary, exchange rate and financial policies would allow softening the impacts of commodity price shocks on both the external and the internal balances simultaneously.
Many high- and middle-income countries such as Norway and Chile are known to have successfully abated “Dutch disease” by moderating the transmission of commodity price shocks to the rest of the economy through the establishment of stabilization funds. For example, Chile formally adopted a structural fiscal balance policy in 2001 with a view to developing a cyclically-neutral fiscal policy. This policy enables current expenditure to be stabilized by linking it to the structural level of fiscal revenues.1, 2 According to this rule-based mechanism, every year the Ministry of Finance calculates a potential structural budget based on the output gap between trend GDP and actual GDP and on the medium-term forecast for copper prices. Expenditure is then calculated with respect to this structural budget so as to allow an annual surplus of 1 per cent. As a result, since 2001, the country has accumulated large surpluses. The surplus is then channelled to the Economic and Social Fund (the former Copper Buffer Fund) and to the Pension Reserve Fund, which are placed in a sovereign fund offshore. The central bank can then recapitalize the assets every five years). This measure allows the provision of financing during revenues for future downturns in the copper price. Thus
Many LDCs find it difficult to conduct
successful countercyclical macroeconomic policy at the national level on their own.
Given this, a global countercyclical financial facility for low-income commodity-dependent
countries is proposed here, which would ensure the fast disbursement of aid with low
policy conditionality and high concessionary elements at times of commodity price
shocks.

The Least Developed Countries Report 2010194
Chile deliberately opted for saving the windfall earnings from high copper prices accruing to the public sector and delaying spending for the future when there may be a need to overcome short-term constraints on the absorptive capacity that would have repercussions on the extent of currency appreciation associated with periods of boom.3
A countercyclical fiscal policy thus entails the accumulation of revenues from the resources sector during booms, and the use of those revenues in situations of falling prices. This policy not only stabilizes revenues over the commodity price cycle, but also reduces the pressure on the exchange rate to appreciate during the boom period. This kind of stabilization policy can be implemented quite easily where revenues from natural resources accrue to the Government, such as in Norway, where the State owns the oil and gas resources. In Chile, the Government retained a 40 per cent share of the assets of its previously State-owned copper mining company, Codelco, and following its privatization, was able to negotiate reasonable returns from the private companies in royalty payments and a fair tax rate on the remaining share. Further, a new tax regime for the mines was approved and enacted in 2005. This has largely contributed to the accumulation of fiscal surpluses, both in absolute terms and as a percentage of GDP, since the beginning of the recent copper boom in 2002–2003.
Unfortunately, many low-income developing countries and in particular LDCs, by contrast settled for very unfavourable terms and deals during the process of privatization of their national resources negotiated under the auspices of the International Monentary Fund (IMF) and World Bank. For example, Bova (2010) reports that Zambia’s copper industry, which was earlier dominated by the State-owned enterprise, Zambia Consolidated Copper Mines (ZCCM), underwent a sweeping privatization process in the 1990s. The company was split into a number of mining companies owned by transnational corporations (TNCs), with the Government retaining a small share. Despite the attempt to secure a better deal through the Mines and Minerals Act of 1995, these TNCs benefited from very low royalties, export taxes and taxes on profits, negotiated under development agreements signed subsequently between the Government and the TNCs involved.4 As a result, the contribution of the mining sector to the fiscal budget has been very marginal. Further, the foreign exchange earned from copper exports has gone directly to the currency market under the float-cum-monetary target regime that has been in operation, rather than to the central bank. This has not only resulted in a procyclical movement of exchange rates (a large currency appreciation during the boom and a sharp depreciation during the bust), but it has also prevented the Zambian Government from establishing stabilization funds from export revenues. Thus, under its prevailing monetary and fiscal regimes, Zambia is left with little room to pursue a countercyclical policy intervention.
These negative impacts could be offset by appropriate countercyclical financial facilities for low-income countries at the global level. However, the Compensating Financing Facility with low policy conditionality established at the IMF in 1963 did not offer funding on a concessional basis. The subsequent IMF facilities that replaced it have been highly conditional upon accepting a policy package requiring pro-cyclical, contractionary demand management, which proved very costly to many LDCs in terms of forgone socio-economic development. The contractionary bias in the IMF facilities was so strong that it prevented the LDC Governments concerned from undertaking social programmes or public investment on a sustainable basis during the 1980s and 1990s when most commodity prices were declining and displayed high volatility.
A countercyclical fiscal policy can be implemented quite
easily where revenues from natural resources accrue to the Government, such as in
Norway, where the State owns the oil and gas resources.
Many low-income developing countries and in particular
LDCs, settled for very unfavourable terms and
deals during the process of privatization of their national resources...
... and are, therefore, left with little room to pursue a countercyclical policy
intervention.
195An Agenda for Action: (III) Commodities and (IV) Technology
Historically, apart from the international commodity agreements (ICAs), there have been a number of compensatory facilities to offset shortfalls of commodity export earnings, such as the IMF’s Compensatory and Contingency Financing Facility (CCFF) and the European Commission’s STABEX – the compensatory finance scheme to stabilize African, Caribbean and Pacific (ACP) countries’ export earnings (Maizels, 1994; Hewitt, 1993 and 2010). While the original IMF Compensatory Financing Facility (CFF) was established in 1963 as a low-conditionality, semi-automatic mechanism for temporary balance-of-payments support (on a non-concessional basis), the CCFF — the new, non-concessional facility established in 1988 to replace the CCF — has become so highly conditional upon accepting procyclical demand management, that since its inception very few countries have turned to it for assistance. The CCFF and CFF mechanisms of the IMF were replaced by the Exogenous Shock Facility (ESF) in 2006. This is a concessional loan facility for countries facing an exogenous shock that qualify for Poverty Reduction and Growth Programmes. The ESF was not used until it was reformed in 2008 and when the LDCs began to feel the full impact of the global economic crisis in 2009.5
Similarly, the STABEX scheme has met with rather limited success owing to the procyclical nature of its disbursements. Moreover, since compensation under the STABEX was delivered in the form of grants only to agricultural sectors affected by income shocks, it has been argued that it resulted in a diversion from other forms of official development assistance (ODA), and that the STABEX has tended to discourage diversification efforts.6 FLEX, which replaced STABEX and SYSMIN under the Cotonou Agreement of 2000, has been under criticism for its slow disbursements and resource constraints, though the recently introduced V-FLEX mechanism is a significant improvement (see chapter 5). In addition, loans extended by the Poverty Reduction and Growth Facility (PRGF) of the IMF are intended to assist countries to cope with economic shocks beyond their Governments’ control which have a negative impact on their economies. However, the conditionalities associated with those loans have often been too restrictive.
With the emergence of market fundamentalism and the consequent demise of ICAs (for various political and technical reasons), the use of market mechanisms for managing commodity price risks has been advocated by the donors for dealing with risks stemming from extreme price volatility and the accompanying income shocks. The international financial institutions (IFIs) have been actively encouraging primary commodity producers to use market-based, commodity-linked financial risk-hedging instruments by participating in futures and derivatives markets. So far, these have not proved very successful.
To sum up, an adequate compensatory financing facility which provides fast disbursement of aid with low policy conditionality to help LDCs and other low-income countries deal with commodity price shocks, does not exist. Yet, it is necessary.
(b) Innovative commodity price stabilization schemes
Unregulated markets and the use of derivative instruments (i.e. financial contracts) by financial investors with little interest in physical commodities have generated excessive volatility. Consequently, stakeholders in physical commodities have been unable to rely on price signals emanating from markets for making informed decisions concerning future demand and supply
To sum up, an adequate compensatory financing
facility which provides fast disbursement of aid with low policy conditionality to help LDCs and other low-income
countries deal with commodity price shocks, does not exist.
Yet, it is necessary.
The Least Developed Countries Report 2010196
developments, including decisions affecting investment and technological progress required for substitution and conservation of resources. In the light of the recent large price swings that contributed to the current global economic crisis, there is a fresh case to be made for price stabilization.
Disappointment with the previous commodity stabilization schemes through buffer stock management and export quota allocation under the ICAs of the 1980s cannot be used as a legitimate and easy excuse for no action. While price variations can provide traders and investors with attractive short-term gains, the long-term consequences from asset price bubble-bust cycles are now widely acknowledged to be devastating, inflicting very heavy collateral damage on trade and real economies as well as very high social costs worldwide. The recent global economic crisis is a clear testimony to the existence of an enormous wedge between private returns and social returns from activities in asset markets. It has created not only winners and losers in a grossly unfair proportion, but also a negative-sum game for the global economy and community.
The significant failures in commodity markets warrant effective intervention through new stabilization mechanisms alongside various international regulatory measures. As commodity market operations have become very sophisticated, using complex derivative products and instruments, any policy intervention has to be innovative. Relying exclusively on buffer stock management for stabilization can be both ineffective and costly in the context of rapidly changing market fundamentals, such as those observed during the period 2002–2008. Similarly, earlier experiences demonstrate that stabilization schemes through export quota allocations or other supply management mechanisms among producing countries entail significant transaction costs for the negotiating parties, as well as other technical problems, such as coordination failures and free-rider problems. Undeniably, good inventory management of all commodities and goods is a necessary condition for avoiding extreme price volatility in the short run. Strategic reserve holdings should always be kept at a prudent level for many essential commodities. It is now well recognized that the inadequately low levels of stocks of some grains contributed to the food crisis of 2008.
In addition to improving strategic inventory management, it has become important to establish an effective instrument for efficient intervention with “innovative” stabilization mechanisms. Such an intervention should be “market friendly” so that intervention is switched on and off as market conditions vary. Intervention should not impede market development and deepening, as increased liquidity is critical for effective risk hedging. However, as soon as markets build up towards bubble conditions, an intervention should be triggered to signal traders that their destabilizing speculation will be counteracted. However, when market fundamentals evolve fast, it may be hard to maintain commodity prices within a particular reference zone pre-negotiated with conventional stabilization instruments. When it becomes difficult to defend price levels due to rapidly changing parameters that affect fundamentals, a more effective strategy may be one that aims at intervening to dispel rapid and excessive volatility in markets by inducing a swift change in trading behaviour away from destabilizing speculative trading. Thus, new stabilization schemes should contain an element of “virtual” intervention that can be activated fast with a view to taming markets quickly when speculative bubbles are about to develop.
The significant failures in commodity markets also
warrant effective intervention through new stabilization
mechanisms alongside various international regulatory
measures.
New stabilization schemes should contain an element of “virtual” intervention that can be activated fast with a view to taming markets quickly when speculative
bubbles are about to develop.
197An Agenda for Action: (III) Commodities and (IV) Technology
From a development perspective, there is need for a global facility with the following innovative modalities and mechanisms: (a) a set of innovative commodity price stabilization mechanisms distinctly different from the earlier schemes operated under the ICAs of the 1980s; and (b) a global commodity supply management facility to enable countercyclical demand management in commodity-dependent low-income economies.
A new global international arrangement consisting of a two-pronged approach to stabilizing food prices through food reserves has been proposed by von Braun and Torero (2009) (called the IFPRI proposal). The intervention mechanism proposed involves the establishment two types of reserve mechanisms: an actual physical system and a virtual reserve system, which will minimize any speculative attacks on food commodity markets in order to avoid price spikes in the future. This approach is a combination of market and State efforts to stabilize commodity prices, which could create the conditions to modernize agriculture in LDCs, through improving the investment climate. While this physical, public, globally managed grain reserve system would remain small, a virtual reserve mechanism would need to be backed by a fund, to be financed by the main grain-producing countries. The virtual reserve facility, backed by funded promissory notes, could be used for timely intervention in futures markets to prevent price spikes and keep prices close to long-run fundamentals. This scheme thus attempts to realign prices with market fundamentals and reduce any “excess” volatility created by “noise traders” through the use of “virtual” reserves.
Under the first prong — physical food reserves — the strategic reserves of each country would be maintained at about a 5 per cent level of the current food aid flow, and perhaps managed by the World Food Programme (WFP) in different locations in developing regions. Their management could be potentially financed by emerging funds provided by the G-8+5 countries (i.e. G-8 plus Brazil, China, India, Mexico and South Africa). The second prong would be operated by member countries participating in the proposed scheme (the Club), and would be backed by a virtual reserve with promissory notes. It is also envisaged to establish two institutions: an intelligence unit and a high level technical commission, to closely monitor price movements, and design and maintain a dynamic price band system based on market fundamentals. These entities, it is envisaged, would help prevent noise traders from engaging aggressively in destabilizing speculation, while monitoring legitimate investments.
(c) A multi-tier transaction tax system for commodity derivatives markets
The public goods function of price stabilization could also be realized by the application of a multi-tier transaction tax system applied to commodity derivatives markets. A currency transaction tax could be imposed with the aim of making “exchange rates reflect to larger degree long-run fundamentals relative to short-range expectations and risks” by strengthening the weight of regressive expectations relative to extrapolative expectations. It is envisaged that the multi-tier transaction tax structure would be embedded in a moving target zone system. The scheme would be applied to each commodity, achieving similar results to those sought through the dynamic price band system in von Braun and Torrero (2009).
As discussed in the literature on the target zone exchange-rate regime, a band can perform the function of crystallizing market expectations of where the fundamental equilibrium may thus make expectations stabilize at the
A new global international arrangement consisting of a two-pronged approach to
stabilizing food prices through food reserves has been
proposed.
The public goods function of price stabilization could be
realized by the application of a multi-tier transaction tax
system applied to commodity derivatives markets.

The Least Developed Countries Report 2010198
time horizons relevant for influencing market behaviour (Krugman, 1991; Svensson, 1992). A successful band regime can also be very effective in limiting price variability by preventing noise traders, particularly stop-loss traders, from making money by introducing noise into markets (Rose, 1996). A band can exert a stabilizing effect on prices only when it can ensure that expectations are formed in a stabilizing manner. The transaction tax proposed would be one of a number of policy instruments used to introduce and sustain the required credibility for stabilization purpose.
Under the two-tier tax system, for example, the first-tier tax rate would be set at zero or a near zero rate under a tranquil, normal market condition when prices are within a band, so that markets can function efficiently with plenty of liquidity. However, once prices start deviating significantly from the target price band, a higher, second-tier tax would be levied on a portion of derivatives transactions and deals as a “surcharge” to curb the “excess” in price volatility. Importantly, this system would need to be executed under a two-tier structure at minimum, since the credibility of the surcharge levy would be anchored in the fact that the transaction tax system is already in place. The price surcharge could be administered both timely and swiftly only in conjunction with the underlying transaction tax, which would serve as “a monitoring and controlling device for the price surcharge”. Thus the surcharge would function as “an automatic circuit-breaker at times of speculative attacks” as envisaged by Spahn (1996: 24) with regard to its application in currency markets. In a less volatile condition, neither liquidity nor market efficiency would be impaired or compromised, as a zero or a near-zero rate would be applied. At the speculative end, however, the high price surcharge would be applied temporarily to tame markets. Under a multi-tier system, tax rates could be varied in a more refined manner as market conditions change.
Once such system is seen to be operating efficiently and with credibility, the threat of a surcharge levy alone may well be sufficient to keep prices within a target zone, without having to resort to costly, sizeable holdings of reserves or buffer stocks. The system would thus allow breathing space for an orderly realignment of commodity prices with shifting fundamentals. In this context, it should be noted that the band in the proposed multi-tier tax scheme would be a moving one that reflects continuous changes in fundamentals. Further, the width of the band should be adjusted according to the way changes in fundamentals evolve, though it would always be better to set the band wide enough to allow a margin of error in forecasting, possibly due to a high degree of uncertainty, and also so as not to undermine liquidity. The main aim of the scheme would not be to set and defend a particular narrow, pre-negotiated price band, as in the earlier stabilization mechanisms, but to prevent excessive price volatility not warranted by market fundamentals, such as those observed in 2008—2009.
The scheme would be deemed successful, when it manages to drive destabilizing speculation out of markets and the surcharge is never levied. With this form of credible intervention, using the threat of imposing a high tax rate when traders cross some critical thresholds, markets should become neither dominated by uninformed, noise traders nor contaminated by noises. In this sense, the scheme would operate as a virtual intervention with a view to achieving commodity price stabilization through the “announcement” or “honeymoon” effect (Krugman, 1991; Krugman and Miller, 1993). With regard to the development of price dynamics, the scheme aims to work effectively in influencing the formation of traders’ expectation.
The main aim of the scheme would not be to set and
defend a particular narrow, pre-negotiated price band,
as in the earlier stabilization mechanisms, but to prevent
excessive price volatility not warranted by market
fundamentals, such as those observed in 2008—2009.
199An Agenda for Action: (III) Commodities and (IV) Technology
(d) A countercyclical loan facility: Indexing the contingency facility to debtors’ capacity to pay
As noted by some observers (Nissanke, 2010), the protracted debt crisis in the heavily indebted poor countries (HIPCs) was associated with the failure on the part of the donor community to institute an effective and flexible facility for contingency financing on an ex-ante basis to deal with external shocks faced by HIPCs. Instead, throughout the 1980s and 1990s, official creditors applied ex-post debt relief mechanisms, with attached policy conditionalities, in response to recurrent liquidity crises and the ensuing debt overhang. Hence it is critically important to establish genuinely flexible, state-contingent debt relief mechanisms in order to avoid the recurrence of debt crises and debt overhang, which have stalled the economic development of low-income countries for so long. This is because the state-contingent schemes could make a distinction between the consequences of debtors’ own efforts and events beyond their control. Such a scheme could specify their contractual obligations contingent on the nature of conditions prevailing in the country and hence deal explicitly and effectively with uncertainty associated with exogenous shocks and systemic risks that are present in any intertemporal financial transactions. For example, as Krugman (1988) notes, the trade-off between debt forgiveness and financing in a typical negotiation can be improved by indexing repayment to the “state of nature”, which is verifiable.
Another potentially very important innovation in the global regime is a countercyclical loan facility indexed to the debtors’ capacity to pay. Cohen et al. (2008) contended that subsidized contingent loans are superior to outright grants in financing productive investment in countries facing high vulnerability to external shocks, such as natural resource price volatility. They suggest that debt and debt cancellations are two complementary instruments, which, if properly managed, perform better than either loans or grants taken in isolation. Taking these arguments further, they propose a new contingency facility: the countercyclical loan (CCL). The CCL facility would transform the grace period of a typical concessional loan into a fixed initial grace period and a floating grace period. More concretely, they propose to reduce the grace period of a typical concessional loan from ten to five years, and to keep the remaining grace period as an asset that the country could draw upon when a negative shock takes place. The negative shock is defined as an export shock, whereby current exports fall below a moving average of the previous five years.
By indexing the contingency facility to the debtors’ capacity to pay, the CCL may not completely avoid the potential “incentive” problem. However, it amply demonstrates that any technical issues associated with creating an “efficient” contingency facility can be overcome if there is a strong political commitment to such a facility.
2. DOMESTIC RESOURCE GENERATION AND REVENUE MANAGEMENT
(a) Managing rents and stabilizing revenue
Natural resource rents are potentially the most important source of revenue in a number of LDCs since a large share of FDI in LDCs targets the extractive industries. In the mining sector, most LDC Governments lease property rights to foreign TNCs for exploiting a mining area in exchange for economic rents. This often raises issues relating to patrimonial States, corruption,
Another potentially very important innovation in the global regime is a
countercyclical loan facility indexed to the debtors’
capacity to pay.
The CCL facility would transform the grace period of a typical concessional
loan into a fixed initial grace period and a floating grace
period.

The Least Developed Countries Report 2010200
governance, weak States, conflict and lack of capital controls. The issue of fair distribution of national resource rents (i.e. increased fiscal receipts for LDC Governments from mining activities), especially to host Governments, has not been resolved. Overall, most LDCs have expressed dissatisfaction in this area. The practice of mineral taxation needs to be elaborated, allowing the host-country Governments to gain much-needed revenues for use in achieving their economic and social development goals. For LDCs to benefit from their natural resources, such as minerals, oil, gas, copper, gold, phosphates, tin and cobalt, the vital issue of resource revenue-sharing with TNCs needs to be resolved.
Resource rents that exhibit major short-term price instability are based on changes in the international economy and the consequent supply and demand for commodities, over which LDCs have no control. International commodity prices are characterized by long-term stability but high short-term volatility, which leads to instability in LDC Governments’ fiscal regimes (i.e. in terms of the level and distribution of resource rents). This instability makes it difficult for Governments to devise and implement their development plans. Thus stabilizing resource rents is considered an essential condition for revenue stabilization. Revenue stabilization may be understood as any policy that promotes a predictable level of minerals-derived government revenues. This includes both the revenues obtained from the State-owned enterprises as well as taxes collected from private industry.
An important policy issue in terms of rent management is the avoidance of Dutch disease. Many LDCs have ample, underutilized productive capacities that can be readily mobilized to respond to increased demand (UNCTAD, 2006 and 2007). Most LDCs operate far below the “production possibility frontier” — they are not fully utilizing all the available productive resources for the Dutch disease to take root. The role of public sector spending should be to crowd in private investment rather than crowd it out. It is unrealistic to assume full employment conditions in LDCs. When this condition is relaxed, the immediate likelihood of the Dutch disease diminishes considerably.
However, many LDCs suffer from serious supply bottlenecks, particularly weak infrastructure and skills. Governments can make greater use of fiscal policy to overcome the main constraints on growth through public investment to stimulate private investment and channel resources towards the expansion of aggregate supply in strategic economic sectors. This should mitigate possible Dutch disease effects. But in order for fiscal policy to be effective, it must be supported by monetary and exchange-rate policies.
Therefore — the so-called Dutch disease is not an inexorable curse; its prevention is highly dependent on policies, institutions, learning conditions, and other complementary monetary and fiscal policies which would neutralize the negative impacts of foreign capital inflows, including ODA. This requires the channelling of resources to strengthen national capacities to mobilize public revenue and domestic savings, and improve the fiscal regime and tax collection. All of this should help Governments to manage short-term, adverse macroeconomic effects, thereby mitigating the Dutch disease. However, it is also undeniable that some effects of the Dutch disease (slow growth, deindustrialization, low productivity and low export earnings) have been observed in some LDCs, such as Zambia (Weeks, 2008). Mineral-rich LDCs have undoubtedly experienced lower levels of industrialization and structural change than many other developing countries that lack any static comparative advantage in natural resources. Further research is required into this issue, as
Natural resource rents are potentially the most important
source of revenue in a number of LDCs since FDI in LDCs targets the extractive
industries.
The vital issue of resource revenue-sharing with TNCs
needs to be resolved.
An important policy issue in terms of rent management is the avoidance of Dutch
disease.

201An Agenda for Action: (III) Commodities and (IV) Technology
the evidence remains ambiguous regarding the long-term impact of foreign inflows into resource-rich LDCs, and how best to manage them during boom years as well as price collapses.
(b) A resource-based development strategy
Based on the experiences of successful resource-based industrialization, it can be assumed that the key elements of a strategy based on natural resources to catalyze industrialization, particularly the “deepening” of the resources sector, can best be achieved by optimizing linkages with the local economy. The following are some of the principal resource-related opportunities:
• Resource rents: The use of resource differential and windfall rents to improve the basic physical and knowledge infrastructure of a country through investment in physical infrastructure (e.g. transport, telecoms and energy) and social infrastructure (e.g. human resource development, R&D and technology);
• Infrastructure: The collateral use of high-rent resource-related infrastructure to open up other resources’ potential (such as agriculture, forestry and tourism)7 by providing access to zones of economic potential with lower returns (e.g. agriculture), which cannot afford their own dedicated infrastructure;
• Downstream value addition: Use of the locational advantage of producing crude resources to establish resource-processing industries (e.g. beneficiation), which in turn could provide the inputs for manufacturing;
• Upstream value addition: Use of the resources sector market to develop the resource supply/inputs sector (capital goods, consumables, services). This often offers a relatively large market for specific inputs for particular resource exploitation.
• Technology/product development: Resource exploitation technologies generally need adaptation to local conditions (e.g. climate, mineralogy, terrain), which provides opportunities for the development of niche technological competencies in the resources inputs sector. This sector tends to be knowledge-intensive and accordingly needs “priming” through public investment in human resource development and R&D.
The new generation of ISMs in the area of commodities should focus on various kinds of financial and technical assistance to enable greater local value added and linkages from resource-based diversification. There are three crucial ISMs needed for optimizing resource endowments, as discussed below.
ISM 1: Improving the knowledge infrastructure for raising the level/ quality of data on a country’s natural resource potential.
The less that is known about the potential value of a resource, the greater will be the share of the rents that the investor will understandably demand, due to the high risk and cost of discovering or dimensioning the resource, which may not be viable. This applies mainly to mineral and energy resources, but also influences the deals struck for other resources such as agricultural terrains, forestry, fisheries and tourism attractions. Most LDCs lack basic geological mapping or, at best, they are poorly mapped. This increases the risk for investors, who consequently demand extremely favourable tax regimes for any operation that may result from their exploration. It stands to reason that the more a country knows about the potential value of a resource,
The new generation of ISMs in the area of commodities
should focus on various kinds of financial and technical
assistance to enable greater local value added and
linkages from resource-based diversification.
The key elements of a strategy based on natural resources
to catalyze industrialization, particularly the “deepening” of the resources sector, can
best be achieved by optimizing linkages with the local
economy.
The Least Developed Countries Report 2010202
the greater will be its ability to strike an equitable deal on the division of future rents and benefits accruing from the exploitation of the resource. It is therefore important for an LDC to tackle this “knowledge infrastructure” challenge. Numerous studies suggest very high potential returns to the State from investment in basic geological surveys (Jourdan, 2008). Thus, in addition to investing in physical infrastructure development in LDCs, bilateral and multilateral donors could consider investing in improving LDCs’ resource knowledge infrastructure.
ISM 2: Improving LDC capacities for negotiating contracts
Generally, the negotiation of contracts between LDCs and resource-exploiting TNCs is extremely asymmetrical: TNCs usually have considerably greater resources and skills than the host-country Governments. Recognizing this shortcoming, the African Development Bank is establishing a legal advisory capacity to support its member States in handling complex, long-term contract negotiations. The LDCs need to optimize the leasing (licensing) of their natural resource assets at the outset (i.e. through the exploitation contract). This is because it is difficult to renegotiate contracts at a later stage without sending negative signals to investors regarding the certainty of contracts, as it would lead to negative perceptions among investors, concerning the investment risk.
ISM 3: Resource pooling
The third critical intervention area is in creating or improving LDCs’ capacities for ongoing auditing, monitoring, regulating and improving resource exploitation regimes and for developing linkages between the resource sector and the rest of the domestic economy. This could be facilitated by including a skills transfer clause in all contracted consultancies during the lease/licensing negotiations, as well as using a targeted strategy for the ongoing development of skills. Given the dearth of people with these skills in LDCs, consideration could be given to the pooling of resources with neighbouring countries through joint regulation of cross-border resource-related infrastructure (e.g. transport authorities, power pools, water catchment bodies), possible joint management of cross-border resources and the creation of a regional capacity within regional economic communities. This capacity could also be enhanced by acceding to regional and international resource monitoring and oversight bodies such as the African Union’s African Peer Review Mechanism (APRM), the Extractive Industries Transparency Initiative (EITI) and the Kimberley Process for diamonds certification.
Ultimately, there is no one-size-fits-all strategy for strengthening LDC resource governance and institutions, but there are a few broadly applicable strategies, such as accession to international protocols (e.g. APRM, EITI) and the establishment of critical institutions, to facilitate the optimal exploitation of natural resources.
With the aim of addressing the discussed challenges of the commodity-dependent economies, including the impact on long-term energy and food security, UNCTAD has established an agenda of research, analysis, capacity building, policy implementation and outreach, especially in the area of oil and gas. This agenda seeks to extract greater development gains from natural resources in commodity-dependent economies. The objective of these activities is to bring together key stakeholders through venues such as the Africa Oil, Gas, Minerals Trade and Finance Conferences (since 1997), the Sustainable Commodity Initiative (since 2002) and the Global Commodities
Improving the knowledge infrastructure for raising
the level/quality of data on a country’s natural resource potential, improving LDC capacities for negotiating
contracts and resource pooling are critical.
There is no one-size-fits-all strategy for strengthening LDC resource governance and institutions, but there
are a few broadly applicable strategies, such as accession
to international protocols (e.g. APRM, EITI) and the establishment of critical
institutions.

203An Agenda for Action: (III) Commodities and (IV) Technology
Forum (since 2009). The UNCTAD Initiative on Oil and Gas illustrates how technical support and information exchange can improve the development gains from commodities.
B. Technology
1. INTRODUCTION
Following the discussion in chapter 3 of this Report, there are two critical weaknesses in the current knowledge architecture. First, there has been an almost exclusive focus on the promotion of technological change and knowledge accumulation activities through the granting of exclusive intellectual property rights (IPRs). This trend, largely evolved in line with the development of the knowledge-based economy in the industrialized world, and does not reflect the ground realities in which LDC economies operate. The second weakness relates to the difficulties of considering technology transfer and technology-sharing issues within a regime that is primarily geared to IPR protection. While the multilateral intellectual property architecture has been etched out in the WTO TRIPS Agreement, as yet there is no global framework governing issues of technology which would treat intellectual property, technology transfer and the growing knowledge divide between countries in a balanced way. Currently, technology and its transfer is largely an annexure to provisions governing IPRs within the TRIPS Agreement. It focuses unevenly on IPR protection rather than on creating more global public goods that could ensure access to knowledge and technological know-how by developing countries and LDCs. While some headway has been made, and the Development Agenda for the World Intellectural Property Organization (WIPO) is a step in that direction (box 12), the inherent conflict between the a priori goals and principles of the IPR regime and the emerging consensus on the development needs of LDCs has yet to be addressed.
In the field of technology, LDCs have not been able to use targeted measures, such as the extension of deadlines for IPR protection for LDCs, to the best extent possible. This is mainly because of a fundamental friction in the universal framework conditions within which they operate. The ongoing struggle for policy space and policy support to create a level playing field in technology issues within the WTO and the WIPO Development Agenda has been accompanied by a parallel trend wherein greater IPR protection has become an important component of economic partnership agreements and free trade agreements (Latif, 2010). The mutually exclusive nature of the two discourses and the shrinking policy space for LDCs as a result, is reflected in the struggle over the scope, applicability and use of Article 66.2 of the TRIPS Agreement and in the unresolved issues relating to technology transfer in the WIPO Development Agenda, both of which are discussed in chapters 3 of this Report.
LDCs urgently require a new, coherent and dynamic pro-development knowledge architecture that is centred on their technological needs. The new knowledge architecture is construed as a system of formal and informal practices, rules, institutions and standards that manage the creation and diffusion of knowledge in ways that are equally applicable and accessible to all countries regardless of their stage of development. Such new knowledge
While the multilateral intellectual property
architecture has been etched out in the WTO TRIPS
Agreement, as yet there is no global framework governing issues of technology which
would treat intellectual property, technology transfer and the growing knowledge
divide between countries in a balanced way.
LDCs urgently require a new, coherent and dynamic pro-development knowledge
architecture that is centred on their technological needs.

The Least Developed Countries Report 2010204
Box 12. Progress under the WIPO Development Agenda
The WIPO’s Development Agenda, adopted in 2007, stems from a critique of WIPO and its technical assistance programmes.a It seeks to create a balance between IPR holders and the development interests of LDCs and other developing countries (ODCs). The agenda, which consists of 45 recommendations that form part of six clusters of activities, is regarded as a significant institutional step in global intellectual property relations. The premise of the agenda is that WIPO needs to improve its developmental orientation in all its activities, in order to be able to assist developing countries and LDCs in their quest for greater access to knowledge and greater policy flexibility to design and implement development-relevant IPR rules.
Several recommendations of the Development Agenda deal directly and specifically with issues of importance to LDCs, including technology transfer (Cluster C, recommendation 26). While two projects are currently under way as part of the Development Agenda, a third, on technology transfer, has been postponed by the Committee on Development of Intellectual Property (CDIP) owing to a lack of consensus on what constitutes technology transfer.
In principle, the Development Agenda aims to benefit LDCs and ODCs that have experienced long-standing normative and practical constraints on access to public goods and limited options to pursue development-related IPR rules. However, its effectiveness will depend on the institutional processes that dominate WIPO.
a Developing countries first presented a detailed plan to reform WIPO in April 2005, as a result of which a provisional committee was created for the development agenda in October 2005. The initial proposal by Argentina and Brazil was co-sponsored by 12 additional developing countries. The “friends of development” coalition concluded that WIPO needed to improve its developmental orientation in all its activities, and called for the establishment of a development agenda to reform and guide WIPO’s future activities.
architecture is required both to enhance the knowledge intensity of countries’ activities and to close the gap between formal and informal production structures in their economies (Ocampo, 2005). A fundamental role of the new knowledge architecture would be to garner greater international support to enable LDCs to tread this path by providing a coherent framework of institutional mechanisms (through ISMs) that promote the emergence of technological capacity in LDC economies.
This Report suggests that the new knowledge architecture needs to be based on four major systemic reorientations of the overall economic regime:
(i) Create a balance between the private and public dimensions of knowledge;
(ii) Support the emergence of a new, coherent reality for technology transfer that complements the building of domestic capabilities;
(iii) Support the mobilization of domestic resources to promote knowledge-intensive activities; and
(iv) Support the emergence of the learning-oriented developmental State.
(a) Creating a balance between the private and public dimensions of knowledge
Knowledge has been assumed to have properties of a purely public good, in that it is non-rivalorus and non-excludable. Its non-rivalorus nature implies that the possessor of an idea or information is not diminished when others use the idea. A low marginal cost for the reproduction or distribution of knowledge results in its non-excludability, which in effect makes it relatively affordable for others to have access to new information, except when that information is legally constrained by an IPR. This view of knowledge as a public good, inspired by the work of Arrow (1962), was seminal in the sense that it provided the basis for a new framework to look at issues related to the generation of socially relevant information. However, two aspects stand out: Arrow contended that an incentive scheme is required, but he did not specify what sort (Gallini and Schotchmer, 2002); and, although he pointed
A fundamental role of the new knowledge architecture would be to garner greater
international support to promote the emergence of
technological capacity in LDC economies.

205An Agenda for Action: (III) Commodities and (IV) Technology
out clearly why knowledge sometimes exhibits properties of a public good, he did not categorize knowledge and specify the categories of knowledge in which these features were manifest. In other words, while there are instances where already created information can be disseminated at marginal costs, this certainly does not hold good for technological knowledge and information. Hence, the view of knowledge as a public good which is freely available, for instance in codified information accessible without or at little cost and easily transmitted across space and time, does not reflect the reality of innovation and development in firms and countries.8
Technological knowledge is both a public good and a proprietary good (or quasi-private good) as elaborated by scholars of evolutionary economics (e.g. Nelson and Winter, 1982). There are several important activities in technical change for which IPRs do not offer any incentives at all, and in LDCs these activities assume much importance. By focusing unevenly on one particular incentive for knowledge creation that is of limited use in an LDC context (e.g. granting IPRs to ensure returns on R&D investments) the IPR regime is shifting precious resources and institutional capacity away from creating an environment conducive to knowledge acquisition and use (Gehl Sampath and Kozul Wright, 2010). At least the same amount of resources need to be devoted to ensure the effective implementation of Article 66(2) of the TRIPS Agreement.
(b) Supporting the emergence of a new coherent regime for technology transfer that complements the building of domestic capabilities
Technological learning can result from the transfer of technology that occurs in various ways, including the presence of foreign-owned firms; joint ventures; FDI inflows; technical assistance programmes and other forms of aid; technology licensing contracts; imports from upstream suppliers, especially of capital goods; research collaborations; and subcontracting agreements (Knell, 2007). However, so far the many debates on technology transfer in the WTO and other international forums, have failed to produce a consensus on what comprises successful technology transfer and the ways and means in which to assess it.
This Report calls for a change in perspective to factor in the twin relationship between technology transfer and domestic technological capabilities. The development of local capacity to adapt, apply and develop appropriate technologies that are best suited to local conditions is an essential adjunct to effective policies for technology transfer and adaptation. Extensive evidence on the topic points to the fact that successful transfer of technologies is equally rooted in the presence of sufficient absorptive capacity in the local contexts (in terms of ability to engage in learning by doing, and incrementally innovate) as it is in the appropriate design of technology transfer initiatives. Although industrial policy narratives are replete with examples of countries that managed to build sectors primarily on the basis of continuous investments in technological capabilities without large-scale transfers of technology, in the LDC context progress in achieving greater domestic technological capabilities needs to be supported by greater international support for technology transfer.
For this to materialize, a new reality of technology transfer needs to find shape; that is based on three considerations. First, the relative importance and scope of knowledge and technological change in the catch-up process has changed. Experiences of the newly industrializing economies and the now
There are several important activities in technical change for which IPRs do not offer any incentives at all, and in
LDCs these activities assume much importance.
The development of local capacity to adapt, apply and develop appropriate technologies that are best
suited to local conditions is an essential adjunct to effective
policies for technology transfer and adaptation.

The Least Developed Countries Report 2010206
industrialized countries indicate a pattern of accumulation of capabilities, wherein learning trajectories of firms and other actors in the innovation system almost always progress from reverse engineering and adaptation to incremental innovation, and then to an R&D-based approach (Kim, 1997; Amsden, 1989; Amsden and Chu, 2003). Budworth (1996) similarly classifies innovation into several degrees, predicting that incremental innovations are most likely to be prevalent in latecomer countries such as LDCs. In this classification, incremental innovations can range from small changes in process technologies that lead to significant improvements in production methods or organizational techniques that help improve delivery efficiency of existing products, or lead to the production of new, technologically improved products. In the early literature, however, incremental innovation is not usually recognized as being part of the R&D process, because it may overlap with development and is not formalized as a clear category of activity (Rosenberg, 1982). Despite this, incremental innovation is a very important stage in capacity-building processes at the firm level and, affirms the ability of enterprises to use and adapt existing knowledge and create commercially viable products. Such product creation, although not new to the world or science at large, constitutes a significant step towards the creation of independent local enterprises in latecomer countries, thus becoming the backbone of industrial activity.
While these distinctions are important, technological progress and catch-up in LDCs may not necessarily follow the same trajectory as witnessed earlier due to several new limitations on reverse engineering and imitation of technologies, especially as part of TRIPS-plus clauses contained in regional arrangements and bilateral free trade agreements to which several LDCs are signatories (LDC Report, 2007). Technology’s ubiquitous role in economic development calls for a more progressive approach for LDCs, which would perceive knowledge accumulation and capacity for innovation more broadly as creating a basis for technical change and progress across a wider range of competencies in a continuum of incremental innovation and greater R&D capabilities simultaneously. This dual focus is critical for bridging the existing and newly emerging gaps in knowledge infrastructure.
Such an alternative conceptual understanding of technology and innovation provides the rationale for a new institutional knowledge infrastructure that will promote knowledge spillovers associated with collective learning and external economies (Marshall, 1921; Young, 1928; Stigler, 1961; Richardson, 1996), as well as the “democratization of knowledge” (von Hipell, 2006). This will require a particular emphasis on institutional cooperation, not only within but also between the various components of national systems of innovation in LDCs, including with external sources of knowledge. Its aim would be to encourage shared or joint technological activities in networks that promote learning.
(c) Supporting the mobilization of domestic resources to promote knowledge-intensive activities
Technical change and knowledge accumulation is linked to trade, commodities, climate change adaptation and mitigation and other important areas of international cooperation between LDCs and other countries in the global economy. These interdependencies and inter-linkages are now becoming more apparent than ever before. For instance, it is now being acknowledged the impact of trade openness and lower trade barriers (through liberalization, promotion of FDI and other measures) on economic growth is contingent on other pieces of a bigger developmental puzzle to fall in place. As Rodrik (1999:
A change in perspective is called for, to factor in the twin relationship between technology transfer and domestic technological
capabilities.
Technical change and knowledge accumulation is
linked to trade, commodities, climate change adaptation
and mitigation and other important areas of
international cooperation between LDCs and other countries in the global
economy.
207An Agenda for Action: (III) Commodities and (IV) Technology
13) notes, “Countries whose economies grow fast typically also become more open; but the converse progression — from greater openness to faster growth is much less apparent.”
These other pieces of the puzzle include appropriate technology and industrial policies, infrastructure expansion, availability of human capital, financial investment, and appropriate policies and institutional capacity. Investments in infrastructure, especially in the industrial sector, have significant growth-enhancing effects in countries at lower levels of development (Ocampo and Vos, 2008). In the absence of this, investments in human capital alone, without corresponding changes in the productive structure to create demand for the skills acquired, carry the danger of knowledge flight through emigration (Ocampo, et al., 2007: 200; LDC Report 2007, ch. 4).
The new knowledge architecture therefore needs to support the mobilization of domestic resources to strengthen local institutions for promoting learning based on local knowledge, infrastructure and human skills, for three main reasons (Archibugi and Pietrobelli, 2003):
• The local capabilities that determine a country’s potential for knowledge use and acquisition are not easily built or cheaply replicable;
• The tacit component of knowledge continues to be elusive, and less easy to transfer and replicate in a different context; and
• The innovative core of firms worldwide is moving from trading in embodied innovations to disembodied ones, where technological expertise is coded in terms of managerial and organizational specializations, and technological innovations are safeguarded through IPRs and trademarks. In this context, merely locating production within a country might not lead to significant knowledge “spillovers”.
Faced with a lack of appropriate institutional support that could foster complementarities between different sources of learning as required for production activities, LDCs suffer from an absence of “institutional density” that could stimulate technological progress (Amin and Cohendet, 2000). ISMs should therefore seek to foster the creation of institutional mechanisms for and within LDCs that address this gap, such as knowledge networks, technology districts, joint ventures and/or knowledge-intensive business services (Antonelli, 2005). Such mechanisms may be established both within markets and in hierarchies (firms), or as hybrid initiatives. By fostering such accommodation of the dualistic nature of knowledge, ISMs would provide instruments that can accommodate both cooperation and competition. Knowledge-based networks encourage learning and stimulate scientific and technological development in a climate of constant change and growing internationalization of scientific-based economic activities. Learning can be promoted through markets, hierarchies or networks, but ideally all three coordination mechanisms should be working simultaneously.
(d) Supporting the emergence of a learning-oriented developmental State
The developmental State plays an important catalytic role in removing the binding constraints on technological learning so that the advantages of openness can be realized. Previous LDC Reports have suggested that greater intervention is required to channel capital and entrepreneurial leadership to nascent industries, and at the same time, more interventionist and comprehensive (“big push”) measures must aim to reduce domestic consumption and increase savings. The required catch-up cannot be expected
The new knowledge architecture needs to support the mobilization of domestic resources to strengthen local
institutions for promoting learning based on local
knowledge, infrastructure and human skills.
The developmental State plays an important catalytic role in removing the binding constraints on technological
learning so that the advantages of openness
can be realized.

The Least Developed Countries Report 2010208
to occur by market forces left to themselves; it also requires proactive policies, State guidance and institution-building — in other words, a developmental State. The learning-oriented developmental State facilitates and champions technological learning, mitigating the costs through both market and non-market interventions for the generation of domestic knowledge and learning activities.
This process involves explicit industrial policies that give priority to learning activities both within firms and in the wider context of innovation within the country, in addition to the importation of technologies. The State, through the promotion of development-oriented industrial policies, is pivotal for inducing a virtuous cycle of long-term economic growth based on the development of productive capacities through all possible means. To this end, technical progress and innovation capacity will be of utmost importance (LDC Report 2009; Kozul-Wright and Gehl Sampath, 2010). More and more countries are beginning to adopt such an approach to industrial policy in order to jumpstart growth of productivity and employment. Technological progress is important for the development of new types of consumer goods, machinery and technologies to respond to newer patterns of consumption that accompany rising incomes. The application of new techniques of production or the adaptation of existing techniques to local contexts will spur greater productivity, employment and competitiveness.
This new and important role of the State needs to be supported through ISMs that enable the LDC State to use existing policy space within international agreements to promote knowledge- and technology-sharing in ways conducive to their economic development and social needs. State intervention, supported by ISMs, would be critical to ensuring the “strategic integration” of LDCs into world markets, while allowing some policy autonomy and insulation from external systemic pressures. In such a new knowledge architecture, the State’s role is palpably different: from merely directing, to actively enabling learning processes and collaborations. Clearly, as noted earlier, the experiences of the earlier industrializers provide useful lessons for latecomers in initiating their own process of industrialization through learning. However, this does not imply simply imitating their technological growth process; it also means configuring new and context-relevant “institutional instruments”. In this new role, the State articulates the links between science, technology and economic activities through networking and collaboration, and fine-tunes the learning components (education, R&D, labour training) into an integrated development strategy (Amsden and Chu, 2003).
This perspective represents a crucial departure from the standard discourse on technological progress relating to the so called “equality assumption” – the little- discussed but ubiquitous premise which underlies the dominant economic paradigm, that all economic activities are essentially the same, implying that economic structure is irrelevant. From our perspective, however, changes in economies’ productive structures are essential in order to generate growth in economic activities, characterized by increasing returns, dynamic imperfect competition and rapid technological progress. However, not all economic activities are drivers of growth. For example, commodities and agricultural activities, which tend to be characterized by decreasing returns to scale, low productivity, low value added and low rates of formal employment, are less likely to drive such a growth process. Different economic activities transmit different learning patterns and knowledge spillovers. Economic activities that drive dynamic growth are those that are reflected in the ability to absorb innovation and new knowledge, which enables increasing returns
The State, through the promotion of development-oriented industrial policies,
is pivotal for inducing a virtuous cycle of long-term economic growth based on
the development of productive capacities through all
possible means.
In this new role, the State articulates the links between
science, technology and economic activities through
networking and collaboration, and fine-tunes the learning
components into an integrated development strategy.

209An Agenda for Action: (III) Commodities and (IV) Technology
to scale. History shows that successful growth episodes entail not only rapid capital formation (investment) but also proactive policies for “transferring and mastering skills and above all, creating a viable market…” (Ocampo, et al., 2007: 209). Therefore, there is a case for intervention by LDC Governments to enhance the efficiency of markets through various institutional means (Stiglitz and Greenwald, 1986).
2. HOW ARTICLE 66.2 OF THE TRIPS AGREEMENT CAN WORK FOR LDCS
The purpose of the obligation under Article 66.2 is to ensure the transfer of technology to LDCs in order to help LDCs upgrade their ‘technological base’, as opposed to just supporting their scientific development. Scientific cooperation, training and education that is not accompanied by specific technological components,, although important for LDCs, do not sufficiently meet the obligation set out in the provision. In particular, “science” is not to be confused with “technology” and technological know-how, which involves a series of strategic and purposeful actions to help build a country’s knowledge base and innovation capabilities. Despite the fact that in certain high-tech disciplines (such as biotechnology) the boundaries between science and technology seem to have blurred somewhat, scientific training is neither of direct commercial orientation, nor does it result in industrial application in the absence of capabilities.9 The experience of a number Asian countries has shown that access to technology may provide the basis for technological upgrading at the initial stages of industrialization, while a scientific base is developed to support later stages as and when scientific inputs become more critical.
In addition, since Article 66.2 belongs to a treaty that specifically deals with technologies protected under IPRs, the technologies referred to cannot be limited to those in the public domain they should also include those protected under various forms of IPRs. Developed countries have used a vast array of incentives to promote diverse production and technological activities, including tax exemptions of various types, financial support, preferences in government purchases and technical assistance. In addition, the WTO Agreement on Subsidies and Countervailing Measures (SCM) allows the use of R&D subsidies, subject up to a temporal limit, and, in the same vein, WTO members are not prevented from creating incentives for R&D specifically aimed at generating technologies for LDCs, or for transferring existing technologies through licensing and other disembodied means.
This Report suggests that the discourse on technology transfer and what it entails should be based on a clear understanding that technical progress depends upon the availability of a wider range of competencies in LDCs between incremental innovation to R&D-based activities, in a simultaneous way. Technology transfer under Article 66.2 should be focused on expanding the reach of LDCs to technologies across the gamut of competencies (from reverse engineering, to incremental innovations, to R&D-derived new technologies) in all sectors, and should be accompanied by the associated know-how. The provision and its mandate should be construed as promoting a greater balance of existing IPRs with the need to share them more widely and make them accessible to LDCs. Developed countries should actively take part in not only setting up incentive structures for firms in their countries to engage in such transfers of technologies, but also set up monitoring and reporting mechanisms to record transfer of technology experiences. In addition to such a definition, which corresponds to the knowledge needs of LDCs, realizing the
Technology transfer under Article 66.2 should be focused
on expanding the reach of LDCs to technologies across the gamut of competencies (from reverse engineering, to incremental innovations,
to R&D-derived new technologies) in all sectors, and should be accompanied by the associated know-how.
The purpose of the obligation under Article 66.2 is to ensure the transfer of technology to LDCs in order to help LDCs upgrade their ‘technological
base’, as opposed to just supporting their scientific
development.

The Least Developed Countries Report 2010210
objective of Article 66.2 requires the establishment of concrete institutional initiatives. Previous suggestions in this regard have included technology consortia and patent pools (Correa, 2007). Some of the ISMs listed in the next section could also be used to realize the goals of Article 66.2. In addition, a mechanism could be set up to enable the sharing of experiences in best practices in technology transfer, and encourage accountability and greater dissemination.
Initiatives for technology transfer should also include the transfer of horizontal technologies, such as for the implementation of technical standards, metrology, testing and quality control, project feasibility and management. This assistance may be provided by some international organizations, such as UNCTAD, the United Nations Industrial Development Organization (UNIDO) and WIPO, in addition to national institutions.11 Such technical assistance will have a greater impact if based on some agreed common principles, as suggested in box 13 below.
Box 13. Principles for IP-related technical assistance to LDCs
Development-focused international technical cooperation requires the provision of technical assistance aimed at helping LDCs achieve the Millennium Development Goals (MDGs). It should also aim at helping LDCs integrate their technological regimes into their IPR, innovation and industrial policies. Such technical assistance should be guided by the following principles:
Creation of comprehensive and coherent assistance programmes. Technical cooperation should assist countries in devising coherent national IPR policies that are linked to broader development and public policy objectives. The existence of such policies should be recognized as a necessary part of developing a coherent approach to the implementation of international IP-related commitments.
A focus on an integrated approach. Technical assistance programmes should be designed to include training in matters relating to the use of competition law and policy to address potential abuse of intellectual property and practices that could unduly deter trade and the transfer and dissemination of technology and innovation.
Neutral, unbiased and non-discriminatory approaches. The provision of technical assistance should be unbiased, neutral and development-focused. It should be of an advisory nature based on actual and expressed needs, and should not discriminate between recipients or issues to be addressed. Moreover, it should not be perceived as being a reward system for supporting certain positions in international negotiations.
Assessment-based criteria. Recommendations should be based on a thorough assessment of the potential positive and negative socio-economic effects of IPRs, including their impact on GDP, dissemination of technologies, access – especially by the poor – to the outcomes of foreign and local innovations, transfer of rents (via profits and royalties) and affected social groups and sectors.
Full use of TRIPS flexibilities. Technical assistance should inform LDCs about the flexibilities allowed by the TRIPS Agreement (e.g. parallel imports, compulsory licensing, definition of patentability standards and exceptions to exclusive rights) and the advantages of incorporating them into national legislation. It should also inform LDCs about the negative implications of accepting TRIPS-plus obligations in RTAs.a
Full use of flexibilities outside the TRIPS. Technical assistance should also inform LDCs of flexibilities other than the TRIPS flexibilities, including the use of utility models to the protect innovations of small and medium-sized enterprises that could be of use to LDCs.
Source: Correa, 2007. a In February 2007, the third session of the Provisional Committee on Proposals Related to a WIPO Development Agenda
(PCDA) agreed a set of criteria for development-oriented technical assistance. Among other criteria, it was agreed that “WIPO technical assistance shall be, inter alia, development-oriented, demand driven and transparent, taking into account the priorities and the special needs of developing countries, especially LDCs, as well as the different levels of development of Member States, and activities should include time frames for completion. In this regard, design, delivery mechanisms and evaluation processes of technical assistance programmes should be country-specific” (see Summary by the Chair of the PCDA, at: www.wipo.int/edocs/mdocs/mdocs/en/pcda_3/pcda_3_summary.doc).
Realizing the objective of Article 66.2 requires the establishment of concrete institutional initiatives.

211An Agenda for Action: (III) Commodities and (IV) Technology
3. LDC-SPECIFIC INTERNATIONAL SUPPORT MECHANISMS FOR TECHNOLOGY AND KNOWLEDGE SHARING
The search and acquisition of technologies marks the beginning of knowledge use, dissemination and adaptation processes that form the basis of what is broadly understood to be “technological learning”. Innovation, therefore, is at once a discovery and a search process; it is not composed entirely of radical discoveries, but refers also to the interactive process of economic application of knowledge in production. Most often this occurs by actors in LDCs acquiring technological knowledge or learning, and adapting products, processes and organizational practices that are already in use in other parts of the world. But it can also include “new to the world”, “bottom of the pyramid” type innovations of products and processes, which meet the previously unmet needs of the poor.
Improved productivity, higher local value-added, increased competitiveness, better quality products and the introduction of new activities into an economy all depend on a myriad of small and large innovative activities. And it is through these innovative activities that LDCs’ economies can move away from their strong dependence on primary commodities and low-skill manufacturing. It is also through these innovative activities that substantial poverty reduction can occur — though the relationship between technological change and poverty reduction is complex. It depends on the labour intensity of the technologies and on the economy-wide processes of creative destruction whereby employment opportunities decline in some sectors while they expand in others through technological change.
Technological knowledge that forms the core of this exercise exhibits several attributes that are localized and globalized at the same time, including the ways and means of creation and dispersion of tacit knowledge, the cumulativeness of knowledge systems and the path dependence of institutions in shaping the knowledge patterns of countries. A knowledge base is developed, maintained and disseminated through local knowledge systems that are embodied in the myriad of interdependent knowledge institutions within a country (LDC Report 2006). At the same time, the local knowledge system is routinely influenced by global-local knowledge interfaces — a term that denotes the global influences that impact upon the external knowledge sources which localized firms/organizations can tap into, the collaborations that can be formed, the synergies that can develop from such collaborations and the markets that can be expected for local products, but which at the same time are also influenced by a range of global factors.
International economic opportunities, as part of global trade, investment and other forms of multilateral and bilateral transactions between LDCs and the global economy, are therefore crucial to LDCs in their endeavours to build technological capabilities. They facilitate and provide newer global-local knowledge interfaces on a routine basis. Using these opportunities to promote innovation is central to developing productive capacities in LDCs, and essential for fostering structural change and diversification away from commodity dependence. This is even more important in view of the deep trade liberalization which most LDCs have already undertaken and as global competition becomes increasingly knowledge-based. Innovation will also be central to adaptation to climate change and the transition to a less carbon-intensive growth path. Yet, at present, donors have little idea about how to use aid effectively to promote science, technology and innovation in the LDCs.
It is through innovative activities that LDCs’
economies can move away from their strong dependence on primary commodities and
low-skill manufacturing.
The local knowledge system is routinely influenced by global-
local knowledge interfaces.

The Least Developed Countries Report 2010212
Some ISMs currently exist to address the need for technology transfer and knowledge sharing in LDCs and ODCs. Product development partnerships, especially in pharmaceutical innovation and food crops, are good examples of innovation initiatives aimed at creating public goods of relevance to LDCs in addition responding to needs for technical know-how (Maskus and Reichman, 2004). Recent literature suggests that similar ISMs could be applied to emerging areas of importance to LDCs and ODCs, such as the development of climate change technologies (Maskus and Okediji, 2010 forthcoming). However such ISMs seek to compensate for the shortcomings in the global IPR regime, and aim, in particular, at meeting the pressing needs for innovative products and services for the poor, such as health and access to medicines and food security and nutrition.
This Report proposes new ISMs to respond to the growing knowledge divide. Such ISMs should work towards the gradual realignment of incentives provided under the global IPR regime with the development needs of LDCs by promoting knowledge sharing, while at the same time strengthening the local innovation capabilities of LDCs. In bridging the knowledge divide, the ISMs should play a key role in two respects. They should support LDCs in building local technological capabilities by addressing some of these countries’ key institutional weaknesses that pose a challenge to firms and organizations operating there (see box 14). They should also endeavour to seek options that would facilitate technological catch-up in LDCs outside the
Box 14. Institutional limitations to technological learning in LDCs
Previous LDC Reports (2006–2009) have addressed in detail three sets of institutional and inter-organizational limitations that impede technological learning in LDCs. These are summarized below.
(i) Insufficiency of investments in technological learning
Learning opportunities for innovation may arise from a variety of sources, such as investments in new machinery and equipment, technology suppliers, mobility of labour and interactions with other knowledge agents (e.g. other firms, formal R&D units within enterprises, R&D business associations). In addition there can be some external sources, such as contract manufacturing for exports and supplying to global value chains. However, learning does not occur automatically or without costs – policy and institutions matter. As the LDC Report 2007 noted, the opportunities for industrial learning in LDCs have been quite limited due to their institutional shortcomings in providing adequate physical and knowledge infrastructure and incentives to engage in a collective learning process with others.
(ii) Lack of a supportive environment for innovation
There is an urgent need to mobilize domestic resources to build greater physical and knowledge infrastructure, and to create financial instruments that reduce innovation-related risks in LDCs. This includes gradually reviving public sector activities in applied research and industrial R&D, and supporting the emergence of a strong local enterprise sector. In the absence of this, access to knowledge will at best remain simply access to information owing to the lack of capabilities of local actors to build further upon it. In an effort to mobilize greater domestic resources for innovation, it would be desirable to set clear targets and quantity of domestic resources that will be invested as part of national strategies for science, technology and innovation to improve the domestic learning environment.
(iii) Lack of sufficient support to the enterprise sector to learn and innovate
Apart from a set of standard constraints, such as risk and uncertainty of engaging in product development, access to a skilled labour force and weak technological capabilities, three major sets of constraints on enterprise innovation are evident from newer studies on latecomer countries (see, for example, Gehl Sampath, 2010; and Oyeyinka and Gehl Sampath, 2010). The first relates to the scale and scope of public sector funding aimed at building capabilities to exploit technology and generate innovation. This concerns both domestic R&D and pilot and design-related activities for eventual commercialization. The second dimension relates to the scale of capabilities in the private sector, which equally lags behind, primarily due to limited access to credit to expand and engage in newer forms of product and process development. Finally, firms rely on extension services for standards setting, testing, metrology, quality control, information, IPRs, and vocational, technical and skills training. These services, usually provided by a network of public and private research institutions, need to be strengthened within LDCs. By focusing on provision of these services, ISMs could offer much-needed support in helping firms in LDCs to expand, grow and innovate.
Source: LDC Reports, 2006–2009.
This Report proposes new ISMs that should
work towards the gradual realignment of incentives
provided under the global IPR regime with the development needs of LDCs by promoting knowledge sharing, while at the same time strengthening
the local innovation capabilities of LDCs.

213An Agenda for Action: (III) Commodities and (IV) Technology
ambit of the TRIPS Agreement and the ongoing discussions on IPRs. This includes, for example, the use of utility models to support local innovations and the innovative use of tariffs to promote local industry.
The ISMs presented below are expected to help the new global knowledge architecture move towards a gradual reorientation of the basic principles on which technology issues for LDCs are construed, thus offering a firmer basis to implement other existing ISMs as well. These ISMs could be applied across sectors in all LDCs, and should also be considered in the context of ongoing international negotiations in the WTO and WIPO. They could be used by the international community and/ or the LDCs themselves as part of regional integration strategies for technological change and knowledge sharing, and as modes of South-South Cooperation. They could also be used in triangular cooperation between LDCs, ODCs and the international donor community.
The ISMs proposed here include: creating a technology sharing consortia for innovation in LDCs; a technology licence bank; a multi-donor trust fund for financing enterprise innovation in LDCs; and a diasora network to pool LDC talents from abroad.
(a) To create a technology-sharing consortia for innovation in LDCs
For the dissemination of technologies and knowledge required for catch-up growth in LDCs, an important market-based initiative could be the setting up and supporting of technology-sharing consortia, or what are also called technology or knowledge commons. These are superior, in efficiency terms, to individual firm-based proprietary knowledge and technology generation and use. A technology consortium refers to a group of firms that agree on a particular set of terms to share one another’s current or future innovations so that each firm in the consortium benefits from the combined innovation activities of the entire consortium. Joint adaptive research and exchange of technology (rather than through pure licensing) would provide firms in the consortium with a degree of protection against free-riding, and could nurture and facilitate the greater use of new technological knowledge by enterprises in LDCs. Based on the voluntary exchange of technology among firms involved in similar activities, the consortium would encourage technological cooperation among independent business firms. This collaboration would lead to faster rates of adoption of new and superior technologies and faster rates of diffusion than via pure licensing arrangements.
A technology consortium can generate welfare benefits for its members by facilitating a wider and more rapid diffusion and adoption of innovation. The sharing of information will reduce the incentives for individual firm-based R&D investment. Technology consortia are characterized by inherent incentives to increase, rather than decrease R&D expenditure, as they internalize the externalities of innovation. In order to trade technology, a firm would need to have sufficient internal capacities and technological information of its own to offer in exchange. Hence, there is an inherent built-in incentive for increased R&D outlays by individual firms. In that way, information sharing will increase profit-maximizing spending on innovation, and the cost of saving will in turn increase profit maximization per unit of output per firm.
Market incentives for a technology sharing consortium. Proprietary technology (that can only be obtained from a monopolistic supplier) represents a bottleneck input for most firms. A consortium can help to shield its members from excessive external competition. Firms will not have to rely purely on their own R&D because the consortium will be able to offer a market competitive advantage to its members. This can be socially beneficial, as it
For the dissemination of technologies and knowledge required for catch-up growth
in LDCs, an important market-based initiative
could be the setting up and supporting of technology-
sharing consortia.
A technology consortium can generate welfare benefits for its members by facilitating
a wider and more rapid diffusion and adoption
of innovation.
The Least Developed Countries Report 2010214
would internalize the externalities involved in the innovation process, thereby adding to the incentives for innovation. At the same time it would help speed up the dissemination of innovations and catalyse the retirement of obsolete technical processes.
Policy incentives should be designed to offer resources (from currently uncoordinated aid resources) to firms which opt for inclusion in the consortium, and a degree of protection against the risk and uncertainty associated with the financing of any innovative activity. Such financial resources would be aimed at promoting R&D, primarily adaptive research based on foreign technologies to suit local conditions. Schemes for financing could be designed in a way that offers firms a number of fiscal and investment incentives, specifically to induce them to engage in collaborative R&D at a much higher level than would normally be the case in the LDC context. Such consortia could be created at the national or regional levels comprising only of LDC firms (not including MNCs based in LDCs).
(b) A technology licence bank
The trend of proliferating patents in industrialized countries, especially in high-technology sectors, and the use of IPRs as strategic assets to prevent wider access to knowledge inputs lead to a skewed and unfair distribution of future opportunities for firms in LDCs and ODCs. Not only do firms in LDCs find it difficult to search and acquire knowledge about appropriate technologies, they are also ill-equipped to negotiate licences and licensing fees for the technologies in question, as they lack the requisite managerial and legal expertise. In terms of both new and traditional technologies, search and bargaining costs of acquiring technology licences can be extremely high. LDC firms also lack information on the various kinds of similar technologies available, and their relative costs and merits, all of which affect their ability to make informed choices.
A technology licence bank could address all three of these issues by acting as a licensing pool for technologies. It would offer LDC enterprises technology licences for use of the technologies in the pool. These licences would not be free of cost; they would be subsidized through funds provided either by the LDC Governments or by donor agencies, or by both jointly. The licence bank could also provide a database of technologies and inventions, along with details of supplier firms, their relative merits and licensing costs, thereby creating a much-needed service for firms and organizations in LDCs. A third function of the bank would be to act as a clearing house for the licensed technologies, thereby reducing bargaining asymmetries between firms in developed countries and those in LDCs. It is envisaged that such a technology licence bank is especially useful to promote publicly funded innovations/ technologies and environmentally sound technologies.
To encourage firms in the industrialized countries to participate in the technology licence bank, the bank would pay them fees at the market rate of licensing, in addition to committing to adhere to internationally agreed standards of IPR protection. The firms from the industrialized countries that participate in the licence bank could also receive a label (similar to eco-labelling) certifying that the enterprises are “pro-development”. This label could be used by the firms to gain goodwill from global markets, similar to “fair trade” labels. The Bank would cater only to LDC-local firms (including joint ventures with local equity component of over 60%) and not to transnational companies based in LDCs. Firms from LDCs that express intent in participating in the licence bank would be subsidized according to
Policy incentives should be designed to offer resources to firms which opt for inclusion
in the consortium, and a degree of protection against
the risk and uncertainty associated with the financing
of any innovative activity.
Firms in LDCs find it difficult to search and acquire
knowledge about appropriate technologies.
A technology licensing bank could address these issues
by acting as a licensing pool for technologies.
The licensing bank would provide licences not only for patented products, but also
for products that are protected through other forms of
intellectual property, thereby covering a wide range of
sectors and firms.

215An Agenda for Action: (III) Commodities and (IV) Technology
their ability to pay. Towards this end, the bank would set a series of financial thresholds to determine the amount that LDC firms should be charged for use of the technologies in the licensing pool.
The proposed technology licence bank would be different from patent pooling in two important respects. The licence bank would provide licences not only for patented products, but also for products that are protected through other forms of intellectual property, thereby covering a wide range of sectors and firms. Second, the licence bank would not rely on the altruistic motives of firms in industrialized countries. The firms that own the licences would stand to gain from the goodwill generated by “pro-development” labelling, in addition to receiving the market price for the licences.
(c) The International Spark Initiative: A multi-donor trust fund for financing enterprise innovation in LDCs
This ISM, aimed at financing enterprise innovation in the LDCs, would involve the setting up of national technology/innovation funds which would be internationally financed through official aid, and/ or private foundations or sovereign wealth funds. It would initially target those LDCs which have developed a coherent strategy for science and technology and innovation (STI) to boost development, and which are able to establish the necessary national institutional infrastructure to manage such funds. For reasons that become clear below, it is proposed to call this initiative, the International Spark Initiative.
Since enterprise innovation is the backbone of successful industrial development in LDCs, the proposed ISM would provide a policy, financing and institutional framework for rectifying the weakness of the enterprise sector in LDCs in this area. This would involve devising innovative uses of official development finance which, as argued in chapter 5, should be elaborated with equal vigour as the search for innovative sources of finance. The proposal presented here would build on existing best practices in financing enterprise innovation, both in developed and developing countries, and would seek to avoid the dangers of aid fragmentation through the establishment of some kind of new vertical technology fund for LDCs. By including a technology transfer dimension in the initiative, it would also be possible to contribute to the implementation of Article 66.2 of the TRIPS Agreement. Moreover, the initiative could be considered as an element of aid for trade, with the focus being not simply on greater facilitation of existing trade flows, but also on the creation of new trade flows by building export competitiveness.
The current policy gap and rationale for special support for financing enterprise innovation. At present it is possible to identify three areas of donor discourses that are pertinent to this issue: (i) private sector development, (ii) increasing access to finance, and (iii) aid for science, technology and innovation (STI). However, each of these policy areas has weaknesses with regard to the financing of enterprise innovation.
The strategic focus on increasing access to finance has been on micro-credit and deepening capital markets. Thus there is a critical gap in access to enterprise finance for the few firms in the “missing middle” of the enterprise structure (chart 37).
With regard to private sector development, a wide array of instruments is available (chart 38).
Since enterprise innovation is the backbone of successful
industrial development in LDCs, the proposed ISM would provide a policy,
financing and institutional framework for rectifying the weakness of the enterprise sector in LDCs in this area.
The International Spark Initiative is an ISM aimed
at financing enterprise innovation in the LDC.
It would involve the setting up of national technology/
innovation funds which would be internationally financed through official aid, and/ or private foundations or sovereign wealth funds.

The Least Developed Countries Report 2010216
Chart 37Access of enterprises to finance in Africa
PROJECTFINANCE
Funding
< $10 million
$1-10 million
$50 thousand- 1 million
$100 -$50 thousand
Availability
YES
SOME
NO
YES
PRIVATE EQUITY
MICROFINANCE
START-UP/GROWTH CAPITAL
Source: ODI, Directions for Private Sector Development Instruments in Africa: 8 Strategies for the Policy Maker, June 2005.
Chart 38The mosaic of private sector development (PSD) instruments
Project development
Project preparation
Challenge funds
Private equity for SMEs(donor or corp backed)
Loan subsidies andhigh-risk equity (DFI) Assisted
instruments
Capital markets
Marketinstruments
Enabling environmentinitiatives
Financial institutioncapacity-building
Microfinance (with BAS)
Microfinance
Venture capital
Bank financeProject finance
Free-standing business advisory services
Source: ODI, Directions for Private Sector Development Instruments in Africa: 8 Strategies for the Policy Maker, June 2005.Notes: BAS: business advisory services; DFI: development finance institutions.
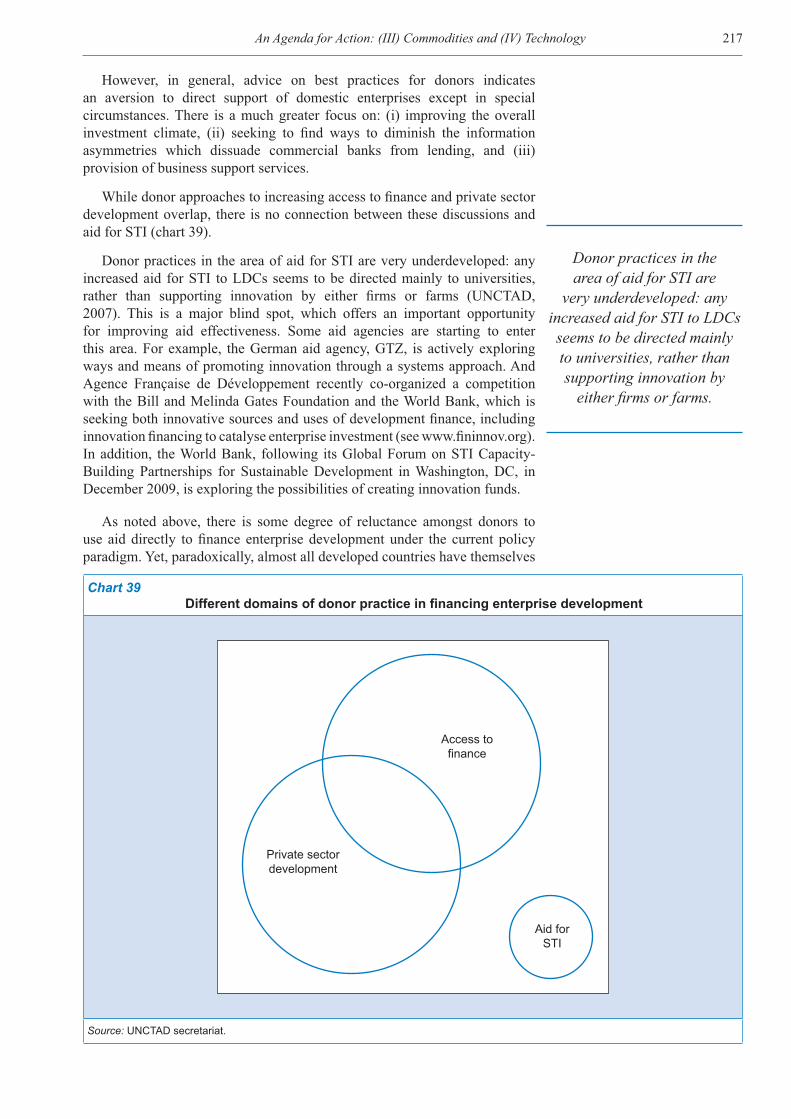
217An Agenda for Action: (III) Commodities and (IV) Technology
However, in general, advice on best practices for donors indicates an aversion to direct support of domestic enterprises except in special circumstances. There is a much greater focus on: (i) improving the overall investment climate, (ii) seeking to find ways to diminish the information asymmetries which dissuade commercial banks from lending, and (iii) provision of business support services.
While donor approaches to increasing access to finance and private sector development overlap, there is no connection between these discussions and aid for STI (chart 39).
Donor practices in the area of aid for STI are very underdeveloped: any increased aid for STI to LDCs seems to be directed mainly to universities, rather than supporting innovation by either firms or farms (UNCTAD, 2007). This is a major blind spot, which offers an important opportunity for improving aid effectiveness. Some aid agencies are starting to enter this area. For example, the German aid agency, GTZ, is actively exploring ways and means of promoting innovation through a systems approach. And Agence Française de Développement recently co-organized a competition with the Bill and Melinda Gates Foundation and the World Bank, which is seeking both innovative sources and uses of development finance, including innovation financing to catalyse enterprise investment (see www.fininnov.org). In addition, the World Bank, following its Global Forum on STI Capacity-Building Partnerships for Sustainable Development in Washington, DC, in December 2009, is exploring the possibilities of creating innovation funds.
As noted above, there is some degree of reluctance amongst donors to use aid directly to finance enterprise development under the current policy paradigm. Yet, paradoxically, almost all developed countries have themselves
Chart 39Different domains of donor practice in financing enterprise development
Private sectordevelopment
Access tofinance
Aid forSTI
Source: UNCTAD secretariat.
Donor practices in the area of aid for STI are
very underdeveloped: any increased aid for STI to LDCs seems to be directed mainly to universities, rather than supporting innovation by
either firms or farms.
The Least Developed Countries Report 2010218
set up special institutions and funds for financing enterprise innovation. This policy is based on the recognition that there is a so-called “valley of death” in early-stage innovation financing, which means that ideas that are potentially of great economic and social benefit do not come to fruition because of the commercial risks of introducing new products or services. The special institutions and funds provide grants and loans to rectify this specific market failure. Some developing countries, such as Brazil and Chile, have also set up such funds, and they have become an important tool in their national development policies. In addition, China implemented a Spark initiative in the early 1980s, which aimed to promote innovation, particularly in town and village enterprises in small towns and rural areas.
The naming of the Spark Initiative points to an additional and fundamental reason why supporting finance for innovation is vital in the context of development: it offers “innovation externalities”. At their simplest, such additionalities and externalities are apparent in the “innovation epidemics” which occur as new processes, products and practices catch on. This cumulative collective learning is expressed in the now familiar S-shaped innovation diffusion wave. However the real impact of innovation at the firm level comes when it generates structural change and economically dynamic multi-agent structures (such as production clusters) as well as a local culture of entrepreneurship. The aim of financing enterprise innovation in the context of development is to leverage such external effects to ensure that markets work more fully in promoting innovation.
The design of the International Spark Initiative. International financial support for enterprise innovation could be implemented through a global vertical (i.e. problem-specific) fund. Such funds already exist, such as the Global Fund to Fight AIDS, Tuberculosis and Malaria, the Global Alliance for Vaccines and Immunization (GAVI), the Education for All — Fast Track Initiative (EFA-FTI) and the President’s Emergency Plan for AIDS Relief (PEPFAR). However, this approach is not advocated here. Global vertical funds tend to be attractive because of their visibility they provide a neat message for politicians, the media and the public and their ability to raise funds in specific areas. Proponents of such funds argue that merging vertical programmes has resulted in unprecedented amounts of money and attention to needy causes. However, these funds also increase aid fragmentation, reduce country ownership and weaken country systems. EURODAD (2008) also argues that, despite efforts to make global vertical funds “Paris-friendly”, “there are still too many global programmes out there that operate in a vacuum….[and] the tendency to add more programmes, without fixing what already exists, is still too prevalent.” (EURODAD, 2008:8). The approach being proposed here is therefore not a purely global vertical fund, but rather a hybrid which combines global and national elements. This is very much in line with an approach World Bank advocates in a paper prepared for the OECD Development Cooperation Directorate, which notes that “neither global programmes nor country programmes alone are a panacea to development assistance issues — they have to be conceived, designed and implemented in tandem.” (OECD, 2006).
Following Teubal (2009), the design of a “benchmark” national technology fund for providing direct support to firms for commercial innovation would include:
• A preliminary assessment of needs based on statistics, interviews, case studies, focused surveys and benchmarking of similar programmes in other countries of a similar type.
Some developing countries, such as Brazil and Chile,
have also set up such funds, and they have become an
important tool in their national development policies.
China implemented a Spark initiative in the early 1980s,
which aimed to promote innovation, particularly in
town and village enterprises in small towns and rural
areas.
219An Agenda for Action: (III) Commodities and (IV) Technology
• Definition of objectives which should encompass (i) the promotion of learning and creation of innovation capabilities – not simply technological, but also marketing, production, exporting and linking with partners and suppliers, (ii) promotion of entrepreneurship, and (iii) identification of areas of sustainable comparative advantage.
• Identification of functions to be supported. These could include technology transfer, design, engineering, learning and start-up time the utilization of new process equipment, training of the labour force, consultancy services and R&D. In an LDC context, it is important to be flexible about the functions being supported.
• Specification of the size of the budget. A technology fund should have at its disposal $10–$20 million per annum, since a minimum level of support is necessary to develop a critical mass of innovative firms.
• Financing instruments. Experience shows that “subsidies (loans or grants) have been found to be more effective than tax concessions” and “there are strong advantages from giving at least one-third of the subsidy up-front”. Similarly, grants are better than loans because of high transaction costs and grants may be transformed into a conditional grant or conditional loan.
• Horizontal or targeted programmes. Horizontal programmes support a particular technological learning or innovation function (e.g. design or R&D), and are open to all firms in the business sector. This is simpler at the beginning, but where there are clear areas of sustainable comparative advantage, target programmes which aim to trigger innovation in the selected industry or technology are also relevant. Thus an evolutionary, hybrid approach is advisable (Teubal, 2009).
The fund should support different kinds of SMEs, including dynamic microenterprises in the informal sector. The types of innovation to be supported should cover a broad spectrum of activities: equipment modernization, technology transfer from abroad, development of local technological capabilities, introduction of new materials, imitation, backward engineering, design, engineering, learning/training, and R&D. However, given the weaknesses of the private sector in LDCs, it is important that the financing mechanism be designed for bundling with various business development services. Part of the innovation process may involve technology transfer, which has its own specific challenges, and these could also be incorporated in the initiative. For example, SMEs in industrialized countries have untapped potential for technology transfer, but they need to be offered incentives, such as a subsidy to the transferrer, as market prices are not enough (Foray, 2009). But technology transfer TT will only be effective if it is accompanied by supporting the building of technology capability in the transferee.
Within this general framework, the International Spark Initiative could have different focuses. The general approach would be oriented to increasing innovation and innovativeness in LDCs’ economies, but the fund could also be designed to target specific innovation challenges as well. An obvious example would be in the area of energy technologies which facilitate a transition to a low-carbon economy.
The implementation process and the financial challenge. An evolutionary approach to policy implementation is proposed, covering a few LDCs that have comprehensive strategies on STI issues. A pre-implementation phase would include planning and assessment of needs and possibilities, with an initial slow take-up and the emergence of snowball effects and collective
The fund should support different kinds of SMEs,
including dynamic microenterprises in the
informal sector.
Given the weaknesses of the private sector in LDCs, it is important that the financing
mechanism be designed for bundling with various
business development services.
The general approach would be oriented to increasing
innovation and innovativeness in LDCs’ economies, but the fund could also be designed to target specific innovation
challenges as well.

The Least Developed Countries Report 2010220
learning. Upon reaching a critical mass of innovating firms, the mechanism would need to be redesigned and other approaches to promoting innovation introduced. The role of the State would diminish over time, as market begin to perform the necessary functions.
Past experiences indicate that a commitment to the programme for at least five years is very important, and there also needs to be adequate funding so that the instrument is sustainable and credible to beneficiaries at the necessary level (Teubal, 2009). Weak implementation can lead to major problems of trust, which can have long-lasting negative impacts on government-business relations. Trust is critical for the successful implementation of the programme; failure could lead to disenchantment with innovation policies.
Two important elements in the design of the initiative should be: (i) the creation of a national innovation coordinator to manage the initiative at the country level, and (ii) the creation of a multi-donor trust fund, which would provide funds to the agencies involved. Some mechanism is needed to ensure the accountability of the national innovation coordinator, which may or may not be attached to a national science, technology and innovation agency or council, and does not necessarily have to be governmental. The involvement of non-State actors might increase credibility. The multi-donor trust fund model would provide a means for collecting funds. With regard to the funding of an initiative to finance enterprise innovation examples from Latin America show that it is possible to finance national technology funds through rents from natural resource sectors (e.g. oil, and natural gas royalties) or through dedicated sectoral funds. For example, a levy of 0.75–1 per cent of net income of enterprises that have concessions for the generation, transmission and distribution of electricity could be used to promote R&D in the sector. The establishment of technology funds by earmarking part of resource rents, or a mixed approach that uses resource rents matched by outside aid, could be effective approaches for LDCs.
(d) LDC talents abroad: Pooling the talents of the diaspora for knowledge-based activities
LDCs’ diaspora can play a significant role in leveraging technical and managerial knowledge through various forms of involvement. Remittances to family and collective remittances to groups in crisis are relatively well-documented in the literature. Other important forms of diaspora assistance to leverage a country’s development potential include investment in commercial enterprises (e.g. as in the software sector in India), providing political leadership (as in China), transferring important sources of knowledge for a country to develop — including documentation of acquired knowledge in local languages (e.g. technology acquisition in the Republic of Korea and the Ethiopian Diaspora Skills Bank) — providing leadership in public sector positions (as in Afghanistan) and finally leveraging tacit know-how in emerging sectors through employment in domestic firms (as in software and pharmaceutical firms in India).
However, while initiatives involving the diaspora are easy to launch, they are very difficult to sustain and promote in ways that contribute to their country’s development. The difficulties in institutionalizing the diaspora makes their role, functions and specific contributions to development difficult to codify and list as a set of “best practices” for other countries to follow. Mostly, the engagement of the diaspora has occurred as a spontaneous response to a country’s development (Kuznetsov, 2006). An exception is the Republic of Korea, where the diaspora played a critical role in the 1990s, returning from the United States to work for local firms (the chaebols) to
LDCs’ diaspora can play a significant role in leveraging
technical and managerial knowledge through various
forms of involvement.
221An Agenda for Action: (III) Commodities and (IV) Technology
develop new technologies that were not being licensed by foreign firms. Most importantly, experiences confirm the fact that the engagement of the diaspora with a country depends mostly on that country’s own institutions and ability to pool the talent from abroad and engage them in the development process. LDCs where the state of institutions and the low potential for engaging in highly skilled activities has led to a brain drain face a formidable challenge in attracting the return of the diaspora to contribute to knowledge growth in their home economies.
There is urgent need for an ISM that would help coordinate different types of diaspora and provide two essential services: the search and pooling of diaspora for LDCs, and seed funds to kick-start the engagement of people living/working abroad as part of knowledge sharing and technology transfer (especially tacit know-how). Such an ISM could be based on some recent empirical experiences on how to mobilize the potential of diaspora for LDCs. However, the design of the ISM would depend on the economic and political conditions of the country as well as the overall abilities of its diaspora (Kuznetsov, 2006). For example,
• Unfavourable country conditions and a sophisticated diaspora: Establish demonstration projects (Kuznetsov, 2006: 233), as in Armenia.
• Unfavourable country conditions and a dispersed diaspora: Focus on individuals and on engagement in a broader policy dialogue for reform. The focus on individuals is important, since organized networks would be difficult to sustain in such conditions. Individuals who have achieved considerable professional success abroad should be pooled and engaged in development projects as well as in policy reform agendas and discourses.
• Moderately favourable country conditions and a sophisticated diaspora: Use the diaspora to initiative a move towards knowledge-intensive activities. In countries where growth is under way, the diaspora’s strength and talents could be pooled to help overcome the binding constraints. For example, emerging niches within successful value chains could be used to attract diaspora talent and engagement in helping the country branch out into more knowledge-intensive activities.
• Moderately favourable country conditions and a dispersed diaspora: Seek to create diaspora networks and promote the return of diaspora in key emerging sectors.
• Favourable country conditions and a sophisticated diaspora: Use diaspora networks as a key resource for transition to a knowledge-based economy. This promotes a situation where the country’s capabilities and the diaspora’s contribution to the country combine in a virtuous way, coordinated through a variety of policy incentives that seek to integrate the diaspora into an emerging positive national identity. Examples include China, India, Ireland and Taiwan Province of China.
• Favourable country conditions and a dispersed diaspora: Countries that are growing but struggling to move away from a dependence on trade in commodities to more structurally diversified production modes could rely on their diaspora to promote knowledge and skills that are urgently needed to make this transition. Even small diaspora networks can make large impacts in leveraging knowledge from outside and coordinating the growth of tacit know-how within industry. Examples include Chile, where the Fondacion Chile has been actively engaged in harnessing diaspora talent to promote knowledge-intensive activities in local firms.
There is urgent need for an ISM that would help
coordinate different types of diaspora and provide two
essential services: the search and pooling of diaspora for
LDCs, and seed funds to kick-start the engagement of people living/working abroad as part of knowledge sharing
and technology transfer (especially tacit know-how).

The Least Developed Countries Report 2010222
Notes1 Such a policy was originally discussed in the context of the two-tier currency transaction
tax – a modified Tobin tax – with a view to stabilizing currency fluctuations (Spahn, 1996; and Nissanke 2005).
2 Chile had accumulated good experience of following this budgetary rule in the 1990s, but the rule was formally adopted in 2001 with the new left-wing government taking a power, and the transparency of the operation has improved significantly since 2001 (Ffrench-Davis, 2010).
3 By late 2008 in Chile, the two stabilization funds combined had accumulated savings amounting to 18 per cent of the country’s GDP, while fiscal liabilities were negligible following the significant amortizations of the previous fiscal surpluses (Ffrench Davis, 2010). With this level of accumulated savings, the structural surplus target was reduced to 0.5 per cent in 2008. As a result of the global economic crisis of 2008–2009, Chile moved to a 0.4 per cent structural fiscal deficit and to a 4 per cent measured deficit to allow a 15 per cent rise in fiscal public investment, and an increase in social expenditure during the recession that ensued.
4 The TNCs paid 0.6 per cent of gross revenue and a 25 per cent tax on exports, instead of the normal 2 per cent and 35 per cent rates, respectively, as stipulated in the Mines and Minerals Act of 1995. They also benefited from many generous tax exemptions (Jourdan, 2008).
5 For a discussion of recent developments in IMF and World Bank contingency financing facilities open to LDCs, see box 7.
6 Compensation for mineral products was administered under a separate facility called SYSMIN.
7 Most LDCs’ tourism potential is based on natural resources such as fauna, flora and geomorphology (e.g. beaches and mountains) rather than on man-made attractions.
8 Romer (1990) has suggested that the public goods nature of knowledge is a derivative of the investment in search and innovation by firms in the process of developing new goods and services. However firms’ search for knowledge takes place in an environment of so-called high appropriability for which IPRs, such as patents, are given. While firms’ innovation outcomes represent private returns for those firms, the social returns could be a sufficiently significant pool of knowledge that is “free” to society.
9 The WTO Agreement on Subsidies and Countervailing Measures (in footnotes 26, 28 and 29 of the Agreement) makes a distinction between “fundamental research”, defined as “an enlargement of general scientific and technical knowledge not linked to industrial or commercial objectives”, “industrial research” and “pre-competitive development”. The provisions of the Agreement do not apply to fundamental research activities independently conducted by higher education or research establishments.
10 Article 31 of the SCM Agreement establishes that the provisions, inter alia, of Article 8 “shall apply for a period of five years, beginning with the date of entry into force of the WTO Agreement. Not later than 180 days before the end of this period, the Committee shall review the operation of those provisions, with a view to determining whether to extend their application, either as presently drafted or in a modified form, for a further period”. However, to date no decision on this matter has been taken.
11 Norway, for instance, has informed the Council for TRIPS about programmes with these objectives that are being undertaken by its bilateral aid agency, NORAD. NORAD is also “supporting several regional and national programmes leading to international recognition and acceptance of certification systems, both on multilateral basis as well as bilaterally. Some of these programmes also include financing of testing laboratories both for food export and particular industrial goods. Assistance is also given to exporters in developing countries and to development of quality and design of products in order to meet international marked requirements” (IP/C/W/480/Add.4, 13 October 2006).
ReferencesAmin A and Cohendet P (2000). Architectures of Knowledge: Firms, Capabilities and Communities.
Oxford, Oxford University Press.Amsden AH (1989). Asia’s Next Giant: South Korea and Late Industrialization. Oxford, Oxford
University Press.Amsden AH and Chu WW (2003). Beyond Late Development: Taiwan’s Upgrading Policies.
Cambridge, MA, MIT Press.Antonelli C (2005). The economics of governance: The role of localized technological change in
the inter-dependence among transaction, coordination and protection. In: Green K, Miozzo

223An Agenda for Action: (III) Commodities and (IV) Technology
M and Dewick P, eds., Technology, Knowledge and the Firm: Implications for Strategy and Industrial Change. Cheltenham, Edward Elgar: 29–50.
Archibugi D and Pietrobelli C (2003). The globalization of technology and its implications for developing countries: Windows of opportunity or further burden? Technological Forecasting and Social Change, 70: 861–883.
Arrow KJ (1962). Economic welfare and the allocation of resources for invention. In: Arrow KJ, ed., The Rate and Direction of Inventive Activity. Princeton, NJ, Princeton University Press: 609–625.
Bova E (2010). Challenges and implications of exchange rate management for commodity dependent countries: A case study on Zambia. PhD thesis submitted to University of London, School of Oriental and African Studies, June.
Borensztein E, Jeane O and Sadri D (2009). Macro-hedging for commodity exporters. IMF Working Paper, WP/2009/229. Washington, DC, International Monetary Fund.
Budworth D (1996). Finance and Innovation, International Thomson Business Press.Cohen D, Djoufelkit-Cottenet H, Jacquet P and Valadier C (2008). Lending to the poorest countries:
A new counter-cyclical debt instrument. OECD Development Centre Working Paper 269. Paris, Organisation for Economic Co-operation and Development.
Correa C (2007). Intellectual property in LDCs: Strategies for enhancing technology transfer and dissemination. Study prepared for UNCTAD as a background document to The Least Developed Countries Report 2007. Geneva, United Nations Conference on Trade and Development. Available at: http://www.unctad.org/sections/ldc_dir/docs/ldcr2007_Correa_en.pdf.
EURODAD (2008). The reality of aid: Global vertical programmes. A tale of too many funds. Brussels, European Network on Trade and Development, July.
Foray (2009). “Technology transfer in the TRIPS Age: The need for new types of partnerships between the least developed and most advanced economies”, ICSTD Programme on IPRs and Sustainable Development, Issue Paper N.23, Geneva.
Ffrench-Davis R (2010). Latin America: The structural fiscal balance policy in Chile: A move towards counter-cyclical macroeconomics. Journal of Globalization and Development, 1(1): article 14.
Gallini N and Schotchmer S (2002). Intellectual property: When is it the best incentive system? In: Jaffe AB, Lerner J and Stern S, eds., Innovation Policy and the Economy, vol. 2. Cambridge, MA, MIT Press: 51–78.
Gehl Sampath P (2010). Reconfiguring Global Health Innovation. London, Routledge.Gehl Sampath P and Kozul-Wright Z (2010). Tracing the contours of a new knowledge architecture
of LDCs. South Centre Issue Paper (forthcoming), South Centre, Geneva. Hewitt A (1993). Commodity market instability and compensatory financing: why Stabex
failed’. In Nissanke M. and A. Hewitt. eds., Economic Crisis in Developing Countries: New Perspectives on Commodities, Trade and Finance. London, Pinter.
Hewitt A (2010). A role for compensatory finance in the 21st Century after the 2008 global financial crisis. In M. Nissanke and G.Movrotas. eds. Commodities, Governance and Economic Development Under Globalization. London, Palgrave Macmillan.
Jourdan P (2008). Challenges of LDC resource-based development. Study prepared for UNCTAD as a background document to The Least Developed Countries Report 2009. Geneva, United Nations Conference on Trade and Development.
Kim L (1997). Imitation to Innovation: The Dynamics of Korea’s Technological Learning. Cambridge, MA, Harvard Business School Press.
Knell M (2007). Uneven technological accumulation and growth in the least developed countries. Study prepared for UNCTAD as a background document to The Least Developed Countries Report 2007. Geneva, United Nations Conference on Trade and Development. Available at: http://www.unctad.org/sections/ldc_dir/docs/ldcr2007_Knell_en.pdf
Kozul-Wright Z and Gehl Sampath P (2010). The return of industrial policy. A South Centre Issue Paper (forthcoming), South Centre, Geneva.
Krugman P (1988). Financing vs. forgiving a debt overhang. Journal of Development Economics, 29(3): 253–68.
Krugman P (1991). Target zones and exchange rate dynamics. Quarterly Journal of Economics, 106: 669–682.
Krugman P and Miller M (1993). Why have a target zone? Carnegie-Rochester Conference Series on Public Policy, 38: 279–314.
Kuznetsov Y (2006). Leveraging the diaspora of talent: Towards a new policy agenda. In: Kuznetsov Y, ed., Diaspora Networks and the International Migration of Skills: How Countries can Draw on their Talent Abroad. Washington, DC, WBI Development Studies, World Bank Institute: 221–237.
Latif AA (2010). A perspective on reform in Arab countries. In: Mendelez-Ortiz R and Roffe P, eds., Intellectual Property and Sustainable Development: Development Agendas in a Changing World. Cheltenham, Edward Elgar: 51–70.
Maizels A (1994). The continuing commodity crisis of developing countries. World Development, 22(11): 1685–95.

The Least Developed Countries Report 2010224
Marshall A (1921). Industry and Trade, 3rd edition. London, Macmillan Publishers. Maskus K and J Reichman (2004). “The globalization of private knowledge goods and the
privatization of global public goods, Duke Law Faculty Scholarship, paper 1195.Maskus K and R Okediji (2010) Intellectual Property Rights and International Technology
Transfer to Address Climate Change: Risks, Opportunities, and Policy Options, ICTSD Issue Paper, Geneva (forthcoming).
Nelson RR and Winter SG (1982). An Evolutionary Theory of Economic Change. Cambridge, MA, Bellknap.
Nissanke M (2003). Stabilization-cum-adjustment over the commodity price cycle. In: Nissanke M and Hewitt A, eds., Economic Crisis in Developing Countries: New Perspectives on Commodities, Trade and Finance. London, Pinter: 56–78.
Nissanke M (2005). Revenue potential of the Tobin tax for development finance: A critical appraisal. In: Atkinson AB, ed., New Sources of Development Finance. UNU-WIDER Studies in Development Economics. Oxford, Oxford University Press: 58–89.
Nissanke M (2010). Reconstructing the aid effectiveness debate. In: Mavrotas G, ed., Foreign Aid for Development: Issues, Challenges, and the New Agenda. Oxford, Oxford University Press: 63–93.
Ocampo JA (2005). The quest for dynamic efficiency: structural dynamics and economic growth in developing countries. In JA Ocampo. ed., Beyond Reforms: Structural Dynamics and Macroeconomic Vulnerability. Palo Alto, Stanford University Press, ECLAC and World Bank.
Ocampo JA and Vos R (2008). Uneven Economic Development. London, Zed Books.Ocampo JA, Sundaram JK and Khan S (2007). Policy Matters. London, Zed Books. OECD (2006). Integrating Global Partnership programmes with country-led national programmes
- synthesis of findings and recommendations. Contribution of World Bank to the Policy Workshop on “Global Programmes and the Paris Agenda”, COM/DCD/DEV (2006)7.
OECD (2007). National Innovation Systems. Paris, Organisation for Economic Co-operation and Development.
Oyelaran-Oyeyinka B and Gehl Sampath P (2010). Latecomer Development: Innovation and Knowledge for Economic Growth. London, Routledge.
Richardson GB (1996). Competition, innovation and increasing return. DRUID Working Paper, No. 10, Copenhagen Business School, Department of Industrial Economics and Strategy, Copenhagen.
Rodrik D (1999). Making Openness Work: The New Global Economy and the Developing Countries. Washington, DC, Overseas Development Council.
Rose A (1996). Explaining exchange rate volatility: An empirical analysis of the “holy trinity” of monetary independence, fixed exchange rates, and capital mobility. Journal of International Money and Finance, 15: 925–945.
Rosenberg N (1982). Inside the Black Box: Technology and Economics. Cambridge, Cambridge University Press.
Romer PM (1990). Endogenous technological change. Journal of Political Economy, 98(5): S71–S102.
Spahn PB (1996). The Tobin tax and exchange rate stability. Finance and Development, June: 24–27.
Stiglitz JE and BC Greenwald (1986). Externalities in economics with imperfect information and incomplete markets. Quarterly Journal of Economics, 101 (2): 229-264.
Stigler GJ (1961). The economics of information. Journal of Political Economy, 69(3): 213–225.
Svensson L (1992). An interpretation of recent research on exchange rate target zones. Journal of Economic Perspectives, 6(4): 119–144.
Teubal M (2009). Direct promotion of ‘commercial’ innovation (CI) in least developed countries (LDCs): A systems evolutionary (S/E) perspective. Study prepared for UNCTAD as a background document to The Least Developed Countries Report 2009. Geneva, United Nations Conference on Trade and Development. Available at: http://www.unctad.org/sections/ldc_dir/docs/ldcr2009_teubal_en.pdf.
UNCTAD (2006). The Least Developed Countries Report 2006: Developing Productive Capacities. United nations Publication, sales no. E.06.II.D.9, Geneva and New York.
UNCTAD (2007). The Least Developed Countries Report: Knowledge, Technological Learning and Innovation for Development. United nations publication. sales no. E.07.II.D.8, Geneva and New York.
von Hippel E (2006). Democratizing Innovation. Cambridge, MA, MIT Press.von Braun J and Torero M (2009). Implementing physical and virtual food reserves to protect
the poor and prevent market failure. IFPRI Policy Brief. Washington, DC: International Food Policy Research Institute.
Weeks J (2008). The reduction of fiscal space in Zambia? Dutch disease and tight-money conditionalities. Country Study No. 14. Brasília, International Poverty Centre, United Nations Development Programme.
Young AA (1928). Increasing returns and economic progress. Economic Journal, 38: 527–542.

Chapter
7An Agenda for Action: (V) Climate Change
and (VI) South-South Development
Cooperation This chapter discusses the final core pillar of the NIDA — climate change
adaptation and mitigation — and also South-South development cooperation, which is a transversal issue. Both these topics raise new policy issues which will become increasingly important for LDCs in the coming decade.
A. Financing climate change adaptation and mitigation in LDCs
Climate change adaptation and mitigation will require both finance and technology. The proposals presented in chapter 6 of this Report are designed to accelerate transfer of technology to and technology acquisition in LDCs, and they can be used not simply for economic development but also to promote a transition to a low-carbon growth path. The present section of this chapter thus focuses on the issue of climate change finance. The section considers the financial challenges confronting LDCs in meeting the adaptation and mitigation requirements occasioned by climate change in the light of their existing structural constraints. It proposes new international support mechanisms (ISMs) for financing their adaptation and mitigation, and examines key elements of a proposed international framework for the mobilization, administration and delivery of such financing.
Given that the international community’s responses to climate change are regulated by an intergovernmental regime establishing rights and obligations for States parties to the regime and by a framework for negotiations on future actions through the United Nations Framework Convention on Climate Change (UNFCCC), any system of financing for climate change adaptation and mitigation should be considered with reference to the decisions and outcomes of deliberations within this forum. However, donors and multilateral development banks (MDBs) are tending to show an increasing preference for climate finance to be channelled outside the UNFCCC on a bilateral basis, which tends to undermine policy coherence and transparency (Tan, 2010). This reflects a lack of global governance of existing climate change financing, with no entity to enforce agreements reached (now and in the future) on climate adaptation and mitigation. This is a matter of concern. Given the clear link between development policy and climate change, a policy of sustainable economic development is necessary to minimize the effects of climate change and prevent its further threats by improving the adaptive capacity of LDCs (UN-DESA, 2009: 71).
This chapter proposes that the financing of climate change adaptation and mitigation, as part of a New International Development Architecture (NIDA) for LDCs, be based on five principles: (i) equity and compatibility
This chapter proposes that the financing of climate change
adaptation and mitigation, as part of a New International Development Architecture
(NIDA) for LDCs, would be based on five principles: (i)
equity and compatibility with the global climate regime; (ii) accountable, transparent and representative governance; ...

The Least Developed Countries Report 2010226
with the global climate regime; (ii) accountable, transparent and representative governance; (iii) policy coherence with international trade and financial regimes and national development strategies; (iv) sustainability and predictability of financing; and (v) effective burden- and cost-sharing mechanisms.
In order to fulfil the principles of equity and common but differentiated responsibilities, the international community needs to allocate responsibility to those who have primarily contributed to the problem for the crisis and recognize the vulnerability of those who have to bear the greatest burden of adjustment to climate change. Recent proposals to improve the existing burden and cost-sharing mechanisms are contained in the Greenhouse Development Rights Framework and the Responsibility-Capacity (GDRFC) Index (Baer, Athanasiou and Kartha, 2008). They include mechanisms for allocating responsibility based on a combination of emissions and incomes per capita and entitlements related to global per capita emission targets. The burden-sharing mechanisms proposed are based on capabilities to share the burden, which are related to income levels and are consistent with LDCs’ development objectives (Baer, Athanasiou and Kartha, 2008). Table 36 shows the results of the GDRFC index for LDCs and other groups. The score for LDCs is 0.1 in 2010, 2020 and 2030. Hypothetically, using the indicator to establish contributions to a $250 billion per annum global climate fund in 2010, the LDCs’ share would be $0.25 billion, that of Annex I countries1 would be $192.5 billion and non-Annex I countries $57.5 billion. Over time, the indicators would shift to reflect changes in responsibility and capacity (table 36). As the costs of climate change adaptation and mitigation for LDCs rise, the greater will be the need to apportion these costs equitably within a progressive framework.
The primary elements of a positive agenda for a NIDA for LDCs in the area of climate change finance are: (i) to enhance the sustainability and predictability of climate financing; (ii) support the development of accountable, transparent and representative governance of a climate fund; (iii) promote the development of renewable energy opportunities; and (iv) encourage greater LDC engagement in initiatives for reducing emissions from deforestation and forest degradation (REDD). These elements are discussed in greater detail below.
Table 36Greenhouse development rights: Results for LDCs and other groups
(Per cent of global, unless otherwise indicated)
2010 2020 2030
Population GDP per capita (PPP dollars) RCI RCI RCI
LDCs 11.7 1 274 0.1 0.1 0.1Annex 1 countries 18.7 30 924 77 69 61Non-Annex 1 countries 81.3 5 096 23 31 39High-income countries 15.5 36 488 77 69 61Middle-income countries 63.3 6 226 22 30 38Low-income countries 21.2 1 599 0.2 0.3 0.5Source: Worldwatch Institute, 2009.Note: RCI – Responsibility Capacity Index.
... (iii) policy coherence with international trade and
financial regimes and national development strategies; (iv) sustainability and
predictability of financing; and (v) effective burden- and
cost-sharing mechanisms.

227An Agenda for Action: (V) Climate Change and (VI) South-South Development Cooperation
1. ENHANCING THE SUSTAINABILITY AND PREDICTABILITY OF CLIMATE-CHANGE-RELATED FINANCING
(a) Systemic issues
Enhanced adaptation activities under the UNFCCC will be critical for LDCs, and must be considered from the perspective of sustainable development. Although adaptation measures should be mainstreamed into wider development planning generally, the costs of increasing the adaptive capacities of developing countries, particularly LDCs, should be calculated in addition to the resources necessary for maintaining economic and human development in these countries. Additional investment and funding for adaptation in LDCs is estimated to cost $4–$17 billion annually (UNFCCC, 2009). These figures are likely to be much higher if mitigation action is not taken soon to prevent further global warming.
Although the Copenhagen Accord emerging from the UNFCCC’s fifteenth session of the Conference of the Parties (COP) has included pledges to scale up financing for developing countries under the UNFCCC, including up to $30 billion between 2010 and 2012 for adaptation and mitigation (Copenhagen Accord, 2009: para 8), this amount still falls short of the conservative end of estimates for such financing. There is a further commitment to mobilize $100 billion for mitigation efforts from a mixture of bilateral and multilateral public and private sources of finance, but this does not represent a commitment to provide financing per se; it merely commits to mobilizing resources (Third World Network, 2010). It also commits parties to the accord to establish a Copenhagen Green Climate Fund, as an operating entity of the UNFCCC’s financial mechanism, which would support adaptation and mitigation activities and a Technology Mechanism to enhance action on development and technology transfer (Copenhagen Accord, 2009: para 10 – 11).
In addition to meeting the costs of adaptation, LDCs will also have to factor in the economic impact of climate change mitigation, in terms of their own transition to a low-carbon economy. A UNFCCC review in 2007 estimated that the additional investment and financial flows in 2030 to address climate change mitigation in developing countries will amount to 0.3–0.5 per cent of global GDP in 2030 and 1.1–1.7 per cent of global investment in the same year (UNFCCC, 2009). Approximately 46 per cent of such new flows are required for developing countries in 2030 due to expected economic growth and population increase, leading to higher energy demand (UNFCCC, 2009: 2; UNFCCC, 2008: para 60). These estimates do not include the operating or maintenance costs of mitigation investments (UNFCCC, 2008: para 63). On the basis of recent cost estimates, there is convergence that the climate change mitigation financing needs of developing countries will amount to $100 billion to $200 billion by 2020–2030, and for adaptation they will be about $86 billion per annum in 2015 (UN-DESA, 2009; UNDP, 2007).
Given the scale of the challenge, it is critical to ensure sufficient financing for international climate adaptation and mitigation and the sustainability and predictability of the financial flows. LDCs are inherently more susceptible to economic shocks due to their structural weaknesses. Their requirement for a stable source of climate-related finance to buffer the unpredictable impacts of climate change and shift to climate-friendly economic investments is therefore more pressing.
Given the scale of the challenge, it is critical to ensure sufficient financing for international climate
adaptation and mitigation and the sustainability and
predictability of the financial flows.

The Least Developed Countries Report 2010228
For LDCs, public external financing would have to provide the bulk of financing for climate-related activities, as it represents a much more stable and predictable source of finance. The need for government action to implement a strategic climate policy also means that such financing should both bolster the capacity of the State to respond to the climate challenge and ensure that those actions do not disrupt LDCs’ wider development objectives. There should also be targeted and enforceable financial commitments by developed countries in this regard, such as a defined budgetary contribution to climate-related financing and compliance with those targets. For example, the size of the LDC Fund (LDCF) is still small relative to the scale of the problem faced by LDCs. Its scope and scale therefore needs to be expanded to meet the adaptation needs of LDCs. Similarly, the Adaptation Fund offers LDCs a more equitable and efficient framework for the administration and delivery of climate-related financing if it is under the aegis of the UNFCCC.
Although there is a role for the market for mobilizing additional financial resources for climate change adaptation and mitigation, as well as for providing climate-related goods and services, market-based solutions cannot constitute the bulk of climate change-related financing for LDCs. The complexity of the legal, financial, procedural and technical measures which must be established to enable effective utilization of carbon trading to mobilize financial resources go beyond the current institutional capacity of most LDCs. They would need to consider carefully the cost effectiveness of prioritizing the development of complex (and costly) regulatory and institutional structures to support the development of carbon markets vis-à-vis focusing on developing the public sector’s capacity to mobilize financial resources and build domestic investment and economic infrastructural frameworks to support wider developmental objectives in order to reduce climate change vulnerabilities.
In many LDCs, public-private partnerships will be essential to finance adaptation and mitigation, as it is doubtful whether private sector mechanisms alone, such as disaster risk insurance and weather derivatives at national, local and household levels (UNEP, 2009: 18–20), are appropriate or adequate substitutes for concerted government measures and public investment in climate change adaptation. Although such instruments may transfer adaptation risk to the marketplace, the premium for such moves in the long term may prove financially disadvantageous to LDCs compared with upfront investment in adaptation measures.
(b) International support mechanisms for LDCs
Many of the proposed financing instruments operating outside the UNFCCC are geared towards private sector solutions to climate change (table 37), either as a source of climate-related financing or as adaptation or mitigation efforts in their own right. The former category includes utilizing and expanding national and international carbon finance markets for the following purposes: to reduce greenhouse gas (GHG) emissions in developed and developing countries, to generate finance for adaptation and mitigation actions in developing countries, including LDCs, and to facilitate private sector investment, notably foreign direct investment (FDI), for funding adaptation and mitigation operations. The “crowding in” of private sector resources in this respect is aimed at supplementing – if not replacing – public sector finance to meet the scale of investments needed to support adaptation and mitigation efforts (UN-DESA, 2009: 157). In addition, the latter category includes using the market and the private sector to allocate and provide goods
The size of the LDC Fund is still small relative to the scale of the problem faced by LDCs.
Market-based solutions cannot constitute the bulk of climate change-related
financing for LDCs.
The “crowding in” of private sector resources is aimed at supplementing – if not replacing – public sector
finance to meet the scale of investments needed to support
adaptation and mitigation.

229An Agenda for Action: (V) Climate Change and (VI) South-South Development Cooperation
Table 37Options for financing climate change adaptation and mitigation for developing countries
Intergovernmental financing options
Amount($ billion) Criteria
Carbon–market- based levies
Application of a levy equivalent to 2 per cent of proceeds from the CDM to international transfers of CERs.
$0.01–$0.05 Estimates post-2012 require assumptions about future commitments.a, b
Pakistan CDM levy $0.2–0.5 Proposed 3 to 5 per cent levy on CDM, primarily to finance climate-change adaptation through the Adaptation Fund.f
Auctions of emissions allowances
Auction of allowances for international aviation and marine emissions
$10–$25 Annual average for aviation rises from 2010 to 2030. Proposed by Norway MFA assuming a 2 per cent levy. b
- Annual average for maritime transport rises from 2010 to 2030b
Levies on transport and travel emissions
International air travel levy $10–$15 Based on a fee of $6.50 per passenger per flight.b
Tuvalu’s burden sharing mechanism (BSM)
$0.04Annex II;
$0.003 non-Annex I
Proposal for a differentiated system of taxation on aviation and maritime transport, with a 0.01 per cent levy imposed on airfares and freight operated by Annex II countries, decreasing to 0.001 per cent for non-Annex 1 countries (LDCs/SIDS are exempt).e
Aviation fuel taxes $4 Tax on kerosene (fuel consumption per X distance).g
Uniform global tax
Uniform global tax on CO2 emissionse, f $18–$20
A global tax on all carbon emissions with a per capita exemption for LDCs based on the proposed Swiss Global Carbon Adaptation Tax. However, to the extent that the tax is successful it would progressively reduce the tax base, thus reducing revenues available for adaptation.
Tobin tax $15–$20 A tax of 0.01 per cent on wholesale currency transactions.
Assessed contributions
Mexico World Climate Change Funde $10–$95
Proposal for a Green Fund recommends that countries contribute on the basis of their historical emissions, population and income. Primarily for mitigation, rising from $10 billion to $95 billion in 2030 (plus an annual 2 per cent adaptation levy fund). LDCs would be able to draw on the funds without making contributions; ODCs would have to make a financial contribution.
China plus G77b $185–$402UNFCCC (2008) estimate based on a 0.5 per cent to 1 per cent of GDP contribution of Annex 1 countries via an unspecified revenue-raising mechanism.
Miscellaneous funding options
Funds to invest foreign exchange reservesc $200 Voluntary contributions of up to 5 per cent of foreign exchange reserves to a
fund to invest in mitigation projects.Access to renewables programmes in developed countriesc
$0.5Eligible renewables projects in developing countries could earn certificates that could be used for compliance with obligations under renewables programmes in developed countries, up to a specified maximum amount.
Debt-for-equity swapsc -Creditors negotiate an agreement that cancels a proportion of the non-performing foreign debt outstanding in exchange for a commitment by the debtor Government to invest the cancelled amount in clean energy projects.
Donated special drawing rightsc $18 Some SDRs issued by developed countries could be donated to raise revenue
for UNFCCC purposes.
Public-private partnership financing options Leveraging private sector climate change adaptation and mitigation investment through the following:
Bonds
Government bonds (e.g. EU-Global Climate Funding Mechanism)d
$1.3until 2015
Traditional government borrowing, with budgets used directly to support LDC projects. Government bears risks related to projects financed by the bonds. Useful for raising large investments through institutional investors. The EU's Global Climate Funding Mechanism (GCFM) and the United Kingdom’s International Financing Facility propose such a mechanism to meet adaptation financing.
Green bonds c,d -
Issued by a developed-country government institution with a sovereign guarantee (e.g. similar to World Bank green bonds), with a stronger link between bonds and investments. Raised funds would be directed to private sector co-investors in emissions reduction projects in LDCs. However, the risk remains with the government, but both public and private sectors have similar incentives to ensure maximum returns from the project. Some LDCs (e.g. Equatorial Guinea and the Sudan) might also be able to issue their own green bonds. An estimated $120 billion of developed-country SDRs could be used as capital, and green bonds could be issued for raising $40 billion per annum as concessional loans for clean energy investments.c
Increased use of emission offsetsd -
Regulated entities would be required to cover their emission liabilities through a large number of offsets generated in LDCs, thus creating financial flows to LDCs. The bonds would offer the potential to access cheap abatement opportunities and funds for LDCs in the short term.
Sources: a UNFCCC, 2007; b UNFCCC, 2008; c Bredenkamp and Pattillo, 2010; d Stern et al., 2009; e Müller, 2008; f Africa Partnership Forum, 2009; and g Landau, 2004.
The Least Developed Countries Report 2010230
and services to facilitate adaptation and mitigation measures in developed and developing countries. Pursuant to this, public financing may be utilized to create market incentives and an enabling regulatory environment for the operation of commercial instruments and investments (table 37).
LDC Governments themselves could, through a combination of domestic resource mobilization (e.g. carbon taxes) and international carbon taxes and transportation levies, raise significant funds to finance adaptation and mitigation (table 37). Proposed initiatives such as imposing levies on emissions from international travel and transport should not lead to an unfair or undue burden on LDCs, and therefore should not be applied uniformly across all countries. Most proposals for carbon taxes and taxes on international freight or transport, such as the Swiss-initiated global carbon tax, the international air passenger levy or international maritime emissions reduction schemes, allow exceptions for LDCs to varying degrees. For example, Tuvalu’s burden-sharing mechanism (adaptation blueprint) allows for a differentiated system of taxation on aviation and maritime transport, with a 0.01 per cent levy imposed on air fares and freight operated by Annex II countries, decreasing to 0.001 per cent for non-Annex I countries, and exemptions for flights and maritime freight to and from LDCs and SIDS (Africa Partnership Forum, 2009: 10). Such a tiered system balances the responsibilities between historical polluters and countries which bear the greatest burden of adjustment to climate change. Similarly, Maldives (on behalf of the LDCs) has proposed an international air passenger adaptation levy on fuels. The levy would be set fees per airline ticket, differentiated by class of travel. The estimated revenue streams from these funds could be significant, and could be combined with additional fund-raising schemes (table 37). As these proposals do not tie the revenue stream to the price of carbon, they are also likely to be more predictable. LDCs could also consider expanding the role and risk capacity of rural and community development banks to mobilize financing sources for local climate adaptation and mitigation projects.
The donation of special drawing rights for climate finance (perhaps in the form of Copenhagen Accord’s proposed Green Climate Fund) could also be part of a portfolio of measures to help address the adaptation and mitigation needs of LDCs (Bredenkamp and Pattillo, 2010). Similarly, the proposal for a Global Climate Financing Mechanism (GCFM), which would frontload climate finance (as a dollar invested now is likely to be more effective than a dollar spent in 2030 to tackle climate change) by borrowing from the private capital market with future revenues from the carbon market being used for repayment, could be further developed (table 37). The GCFM would have the potential to serve as a bridging financial facility until, for example, carbon taxes or an emissions allowance quota auctioning system could be established to generate sufficient revenues to meet developing-country adaptation and mitigation needs (Landau, 2004).
With regard to domestic resource mobilization for climate-related finance, applying a green tax on specific forms of GHG-emission-intensive industries in LDCs might also induce private firms to develop more climate-friendly modes of production (table 37). Revenues from such taxes could be allocated to GHG reduction projects that would otherwise be unviable under the clean development mechanism (CDM).2
Most proposals for carbon taxes and taxes on
international freight or transport allow exceptions
for LDCs.
Maldives (on behalf of the LDCs) has proposed an
international air passenger adaptation levy on fuels.

231An Agenda for Action: (V) Climate Change and (VI) South-South Development Cooperation
Chart 40UNFCCC and non-UNFCCC channels of climate-related financing
B. Non-UNFCCC
Multilateral
World Bank United Nations
Bilateral
Non-UNFCCC Financing
Scaling-UpRenewable
EnergyProgramme
ForestInvestmentProgramme
Pilot Programmefor ClimateResilience
Reducingemissions fromdeforestation
& forestdegradation(UN-REDD)
MDGAchievementFund (UNDP)
Cool EarthPartnership (Japan)
International ForestCarbon Initiative(Australia)
Global ClimateChange Alliance(EuropeanCommission)
International ClimateChange Initiative(Germany)
ClimateInvestment Funds
(CIF)
StrategicClimateFund
CleanTechnology
Fund
Forest CarbonPartnership
Facility
UNFCCC financing:
Article 11 UNFCCC: Financial Mechanism
Non-UNFCCC financing:
Article 11 (5): Bilateral, regionalor multilateral channels
Global Environment Facility (GEF)(UNFCCC):
Funded by voluntary contributionsfrom developed countries
Adaptation Fund Board(Kyoto Protocol):
Funded by 2 per cent levy ontransactions from CDM but
can also receive contributions
Operatingentities
SpecialClimateChangeFund(SCCF)
LeastDevelopedCountriesFund(LDCF)
GEFTrustFund
Adaptation Fund
*Operating entities under the UNFCCC financialmechanism report to and operate under the guidanceof the UNFCCC Conference of Parties
A. UNFCCC
Source: UNCTAD secretariat.Note: These schemes are not exhaustive.
The Least Developed Countries Report 2010232
2. DEVELOPING ACCOUNTABLE, TRANSPARENT AND REPRESENTATIVE CLIMATE FUND GOVERNANCE
(a) Systemic issues
There are two main channels of climate adaptation and mitigation financing available to developing countries: through the UNFCC, and through non-UNFCCC channels (chart 40). The two main areas of contention concerning the design of an international architecture for climate change financing concern: a) the sources of financing, and b) the modalities for financing. Regarding the former, developed countries have expressed a preference for non-UNFCCC channels for the mobilization, administration and disbursement of climate-related financing, namely through existing bilateral and multilateral official development assistance (ODA) institutions such as the World Bank (Khor, 2008: 17; South Centre, 2009: 1–2). LDCs, on the other hand, would prefer such financing to be channelled through the UNFCCC with oversight of the funds provided under the authority of the COP. They believe this would assure greater accountability, transparency and, importantly, consistency with the UNFCCC’s climate regulatory regime. A fundamental concern about having the climate funds located outside the UNFCCC is that they would remain primarily donor-driven initiatives premised on an asymmetric aid relationship between the donor and the recipient of financing (Porter et al., 2008: 51).The relationship of these funds to the UNFCCC’s core principles and obligations is also unclear, and may create parallel structures of climate change governance that are contrary to the Convention.
Channelling funds through ODA mechanisms also complicates the accounting of climate change-related financing and conflates developed countries’ treaty-based financing obligations under the UNFCCC and their voluntary ODA commitments. Apart from causing funding to be “double counted” (i.e. using the same resources to meet both UNFCCC and ODA commitments), the utilization of funds outside the Convention to meet treaty obligations also makes it difficult for the UNFCCC to monitor developed countries’ compliance with their obligations (Porter et al., 2008).
Many of the shortcomings of the current modalities of climate-related financing arise from the fragmented and unrepresentative way in which climate funds are administered and regulated. This is compounded by the asymmetrical structures of decision-making that govern most of these funds, which allow developed countries and international financial institutions to effectively serve as gatekeepers for the funding urgently required by LDCs. These governance deficiencies have led to funds being disbursed through mechanisms that do not reflect the needs and priorities of recipient countries and that impose greater administrative burdens on these countries. Representative governance structures giving equal voice to both the recipient and financing countries are also critical for properly identifying the scope and scale of the challenges facing developing countries in the context of climate change and for tackling those challenges in accordance with countries’ economic and human development needs.
In addition a system of monitoring and reporting is needed to map the various financial flows so that those flows can be measured, reported and verified in the context of developed countries’ obligations under the UNFCCC. The G-77 and China have proposed that a new financial mechanism be established under the UNFCCC which would require that any funding pledged outside the Convention be disregarded as part of the fulfilment of developed
Many of the shortcomings of the current modalities of climate-related financing arise from the fragmented and unrepresentative way in which climate funds are
administered and regulated.

233An Agenda for Action: (V) Climate Change and (VI) South-South Development Cooperation
countries’ obligations. If implemented, this might stem the proliferation of multiple funding arrangements and prevent further fragmentation of financial resources. The proposed new financial mechanism operating under the authority and guidance of and fully accountable to the COP, would mean that financing would be placed within a much more representative decision-making and accountable structure, and it would ensure that the financing is compliant with the provisions of the UNFCCC.
The establishment of a new financing mechanism under the Convention would not preclude the establishment of funds outside it, but would reduce the incentives for developed countries to do so, and it would encourage them to enhance the capacity of the new financing mechanism to better “handle the potential financial flows and associated administrative and logistical matters” (South Centre, 2009: 13, para 26). It would also strengthen the links between financial resources and developed countries’ commitments under the Convention, in addition to scaling up implementation of assistance to LDCs, while reducing the possibilities of double-counting and mixing of ODA and climate financing (ibid: para 27–29). The role of the MDBs in any future governance structure will be critical. The UNFCCC could provide an overarching governance structure for climate-related finance, of which MDBs and the climate investment funds would be key elements to leverage finance for climate change adaptation and mitigation in LDCs.
The mobilization, administration and delivery of climate finance need to be coordinated, as do the funded strategies and measures. The link between development strategies and climate change policy is crucial for LDCs. Removing structural obstacles to their economic and human development would assist in reducing their vulnerability to climate change and contribute towards meeting the broader challenge of transiting towards a low-carbon economy.
Consequently, ISMs for climate-related financing should be designed to address the constraints that LDCs face in meeting the multiple challenges of climate change and economic and social development. Support mechanisms such as the LDCF (discussed below) should not exacerbate these pressures through the imposition of more onerous conditionalities or by reducing the financing of non-climate-related development investments. Greater policy coherence is required between the new global and bilateral climate change funds and the national development plans of LDCs as recipients of this finance. At present there is insufficient alignment of Poverty Reduction Strategy Papers (PRSPs) with LDCs’ national development policies and plans. It is also difficult to determine the degree of harmonization between the different bilateral and multilateral initiatives, outlined above, in the LDC context. LDCs need to lead in the design and implementation of their climate adaptation and national development strategies and donors need to align and harmonize their aid behind country priorities and systems.
(b) Reforming the LDCF
Funding of the national adaptation programmes of action (NAPAs) has been neither predictable nor sufficient to tackle the climate adaptation challenges in LDCs. The LDCF was established in 2001, long before the creation of the Adaptation Fund under the Kyoto Protocol, or the Cool Earth Partnership (Japan) and the Global Climate Change Alliance (European Union). However, even though it has made relatively slow progress in implementing priority adaptation projects because of the complexity of LDCF procedures, the
The LDCF should continue to support LDC adaptation,
albeit in a reformed and financially replenished mode, by delivering effective finance
and technical assistance.
The LDCF could play a role in enabling LDCs to access other adaptation
funds by providing a project preparation facility which
could address the co-financing constraints many LDCs face in accessing climate finance.
The link between development strategies and climate change
policy is crucial for LDCs.
The Least Developed Countries Report 2010234
Fund should continue to support LDC adaptation, albeit in a reformed and financially replenished mode, by delivering effective finance and technical assistance.
The amount of the required financial resources needs to be sufficient to perform the tasks expected of the LDCF (to support entire NAPA programmes rather than individual projects). If funds are limited, it may require a mandate to gradually reduce the scope of its activities to specific groups of actions or countries, rather than covering all LDCs inadequately. For example, the LDCF could play a role in enabling LDCs to access other adaptation funds by providing a project preparation facility which could address the co-financing constraints many LDCs face in accessing climate finance. In addition, the LDCF could, perhaps, develop a facility comprising non-governmental organizations (NGOs)/civil society to fund local level NAPA priorities identified by them, through innovative climate adaptation funding schemes.
In an era of intense post-Copenhagen climate-related debates on finance and the possible replacement of the Kyoto Protocol after 2012, the UNFCCC and its partners will need to consider whether the LDCF is still suited to its purpose. It could be argued that reform of the LDCF’s operational structure, including the incorporation of a direct access component to the funding mechanisms for LDCs (as in the Adaptation Fund) and ensuring reliable funding (on a non voluntary basis) would make the LDCF a viable and necessary entity to assist LDCs in adapting to climate change.
The LDCF’s LDC Expert Group (LEG) and Council need to reach out more widely (e.g. to include civil society organizations) and build on potential improvements outlined in the LEG (2005) draft on NAPA implementation strategies and the guidelines of the Development Assistance Committee of the Organisation for Economic Co-operation and Development (OECD/DAC) on mainstreaming adaptation by more closely aligning NAPA priority projects with government policies and budgetary processes (DANIDA, 2009).
LDC Governments should introduce a climate change adaptation planning cycle into their investment and budgetary plans to provide a means of coordinating funding for adaptation from various sources, and maintain the momentum, from NAPA preparation to implementation, of identified adaptation priorities. DANIDA (2009) proposes that systematic and inclusive learning platforms be initiated as a NAPA priority so that stakeholders can share lessons on implementation and improve the impact of adaptation projects.
Since LDCs lack the necessary technical capacities, they could also take steps to enhance their adaptation capacity through regional and cross-border arrangements to pool financial and other resources, especially for the development of regional early warning systems for extreme weather events.
General budgetary support as an aid modality linking ODA to national policies may enable more flexible funding for LDC public budgets through administrative mechanisms which carry low transaction costs and strengthen national management of finances, resource control systems and accountability at the national level to promote greater climate- related finance. This will also require greater harmonization and alignment of donor funds at the national level (UNCTAD, 2008). For example, donors could pool their adaptation funds into a single national fund held by the finance ministry. The funds would be released on application by the respective line ministries to fund climate adaptation investments and programmes (OECD, 2009: 84).
LDC Governments should introduce a climate change adaptation planning cycle into their investment and
budgetary plans to provide a means of coordinating funding for adaptation from various sources.
LDCs could take steps to enhance their adaptation
capacity through regional and cross-border arrangements to pool financial and other
resources.
A major challenge for LDCs will be that of transiting
towards more sustainable and secure energy sources while maintaining and expanding access to affordable energy.

235An Agenda for Action: (V) Climate Change and (VI) South-South Development Cooperation
3. DEVELOPING RENEWABLE ENERGY OPPORTUNITIES
As energy use, primarily sourced from high carbon-emitting fossil fuels, account for 66 per cent of total GHG emissions, a major challenge for LDCs will be that of transiting towards more sustainable and secure energy sources while maintaining and expanding access to affordable energy for industrial and household use (UN-DESA, 2009: xi–xii and 35). Two thirds of developing- country parties to the UNFCCC have reported energy supply measures as key priorities for investment and financial flows, notably switching from fossil fuels to renewable energy (UNFCCC, 2007: para 758). UN-DESA (2009: 42) has identified energy as “the critical link between development and climate change mitigation” as global access to energy services remains as unequally distributed as income. It is estimated that four out of five people without electricity live in rural areas in developing countries, mainly in LDCs in South Asia and sub-Saharan Africa (UN-DESA, 2009). Electricity consumption per capita in LDCs averaged 9 per cent of that of other developing countries (ODCs) during the period 1990–2007 (chart 41).
Although there remain significant obstacles to LDCs’ expansion of energy services to their population,3 access to sustainable energy sources is crucial for helping them meet their socioeconomic development objectives. Energy poverty affecting approximately 75 per cent of LDCs’ populations will generate greater environmental pressures due to increased demand for the energy deficit to be addressed (UNCTAD, 2006). The estimated amount of carbon dioxide (CO2) emissions that would be produced in meeting the needs of those who
Chart 41Electricity consumption in LDCs and ODCs, 1990–2007
(Kilowatt-hours per capita)
0
200
400
600
800
1 000
1 200
1 400
1 600
1 800
1990 1991 1992 1993 1994 1995 1996 1997 1998 1999 2000 2001 2002 2003 2004 2005 2006 2007
Kilo
wat
t-hou
rs p
er c
apita
African LDCs and Haiti Asian LDCs Island LDCs Other developing countries
Source: UNCTAD secretariat calculations, based on United Nations Statistics Division, UNdata, Energy Statistics Database (accessed May 2010).
LDCs are endowed with substantial renewable energy
resources, but less than 10 per cent of their capacity is utilized.

The Least Developed Countries Report 2010236
currently have no electricity or cleaner energy would represent a modest 2 per cent increase in global CO2 emissions (Socolow, 2006). Stimulating the development and consumption of non-fossil fuel energy sources in LDCs may require a shift in the balance of existing subsidy arrangements. The removal of national subsidies for fossil fuels (e.g. kerosene, diesel and natural gas) may require compensatory measures for the poorest consumers in LDCs.
LDCs, particularly in sub-Saharan Africa, are endowed with substantial renewable energy resources (e.g. 12 per cent of the global hydropower potential), but less than 10 per cent of their 1.1 gigawatt capacity is utilized (Water for Agriculture and Energy in Africa, 2008). Yet in 2007, LDCs accounted for only 2 per cent of global net generation of renewable electricity as compared with 45 per cent in the ODCs. The biggest LDC producers of renewable electricity are Bhutan, the Democratic Republic of the Congo, Mozambique and Zambia.4 Greater decentralized power generation through small-scale renewable energy projects for the 1.6 billion people without access to modern energy could also boost “green” employment and development prospects in many LDCs (Sanchez and Poschen, 2009).
Similarly, although only 16 LDCs have a CDM project, most of these projects have focused on renewable energy (primarily hydropower and biomass energy) and reforestation (chart 42). So far, the CDM has had a negligible impact in terms of meeting LDC mitigation and adaptation needs, but if improved it has the potential to overcome financial barriers to renewable energy technology faced by LDCs.5 For example, a key requirement of the CDM is that the projects that industrialized countries invest in should conform with LDCs’ development priorities. This gives LDCs some scope to prioritize projects involving renewable energy technology for CDM investment. There is tremendous scope and potential for growth in LDCs’ renewable energy technology and power generation sectors. The renewable energy sector could
Chart 42LDC CDM projects, by sector
Afforestation(4%)
Energy efficiencyown generation
(2%)
Energy efficiencyindustry
(6%)
Energy efficiencyhouseholds
(6%)
Fossil fuel switch(4%)
Biomass energy(13%)
Methaneavoidance
(9%)
Landfill gas(11%) Hydropower
(23%)
Reforestation(16%)
Solar (6%)
Source: UNCTAD secretariat estimates, based on UNEP Risoe Centre on Energy, Climate and Sustainable Development, CDM/JI Pipeline Analysis and Database (http://cdmpipeline.org/index.htm) (accessed 1 March 2010).
Note: Sample of 16 LDCs.
Most CDM projects of LDCs have focused on renewable energy and reforestation.
There is an urgent need to develop effective forestry
management and land-use change policies in LDCs to assist them in meeting the challenges of mitigation
and adaptation.

237An Agenda for Action: (V) Climate Change and (VI) South-South Development Cooperation
make a significant contribution towards the development of a productive knowledge economy based on research, development and innovation in LDCs. This would reduce the reliance of some LDCs (especially SIDS) on energy imports, and promote the sustainable development of industry through investment in “green” technologies (e.g. wind, geothermal, hydro and solar power). Similarly, the development of bio-energy provides the potential both for reducing GHGs and the substitution of fossil fuels.
There is also an urgent need to develop effective forestry management and land-use change policies in LDCs to assist them in meeting the twin challenges of mitigation and adaptation in this context. Deforestation and the associated loss of biodiversity in LDCs are likely to continue until there is a globally recognized approach to measuring the impact of deforestation through the delivery of significant resources such as those disbursed by the Global Environment Facility (GEF) e.g. Reducing Emissions from Deforestation and forest Degradation (REDD) (see item below). This will probably necessitate moving beyond traditional project-based approaches to deforestation (e.g. protected area schemes), which have not significantly reduced the rate of commercially driven deforestation or sufficiently incorporated the needs of forest-dependent communities.
4. A CONSTRUCTIVE APPROACH TO REDD
(a) Systemic issues
The utility of forests as key weapons in the fight against climate change is increasingly recognized by Governments, and REDD has become an important element in negotiations under the multilateral climate change regime. In LDCs, deforestation and forest degradation account for 65 per cent of carbon emissions (UN-DESA, 2009: 42). During the period 1990 to 2007, forested area in LDCs declined from an average of 30 per cent to 27 per cent of their total land area. Curbing deforestation and forest degradation is therefore seen as “a highly cost-effective and relatively quick way of reducing greenhouse gas emissions” (UN-DESA, 2009: 164). Providing financing to developing countries, especially LDCs, for REDD is viewed as important for achieving the three objectives of: (i) supporting global mitigation efforts; (ii) supporting climate change adaptation in LDCs and ODCs, as well as poverty reduction in general; and (iii) promoting biodiversity through forest conservation (UN-DESA, 2009; Myers Madeira, 2008: 9).
Under REDD approaches countries and/or actors would be financially rewarded for undertaking measurable, verifiable and reportable REDD activities aimed at maintaining their forests and switching to more sustainable land-use policies. Several recent multilateral initiatives, most notably the World Bank’s Forest Carbon Partnership Facility (FCPF), assist countries in developing national REDD strategies in addition to testing incentive structures for REDD projects (FAO, UNDP and UNEP, 2009). At least four LDCs are involved in UN-REDD: Cambodia, the Democratic Republic of the Congo, the United Republic of Tanzania and Zambia. REDD+ actions comprise measures which extend to the agricultural and the bio-energy sectors, insofar as they impact forests.
Different incentive structures have been proposed for financing REDD activities, involving public and market-based financing and national, sectoral or project-based approaches. Public financing could involve
Under REDD approaches countries and/or actors would
be financially rewarded for undertaking measurable, verifiable and reportable REDD activities aimed at
maintaining their forests and switching to more sustainable
land-use policies.
Public financing could involve financial commitments
from developed countries to an international fund
for disbursement to REDD participants.
The Least Developed Countries Report 2010238
financial commitments from developed countries to an international fund for disbursement to REDD participants. Integrating REDD activities into carbon markets would involve incorporating REDD activities in offsetting schemes and crediting developed countries with emissions reductions in compliance with their mitigation targets under the Kyoto Protocol. A project-based system would generate credits in a local area, while national approaches would involve payments to national authorities for nationally-based REDD operations (Myers Madeira, 2008).
Although, in principle, REDD has the potential to serve as a key source of income for mitigation measures in LDCs and reducing GHG emissions, LDCs need to be cautious in committing to specific REDD arrangements for the reasons discussed below.
First, there remains methodological uncertainty about both the calculation of costs and monitoring the effects of REDD. REDD activities were notably excluded from offset mechanisms under the Kyoto Protocol because of uncertainty surrounding the “magnitude of deforestation emissions and the ability to monitor deforestation” (Myers Madeira, 2008: 9). There is also difficulty in costing lost revenue streams to national Governments and local communities as a result of REDD and in determining the appropriate level of compensation (FOEI, 2008: 12). The inclusion of plantations and other agricultural sectors in the definition of forests also skews the real carbon-reduction impacts of REDD, as plantations’ capacity for carbon storage is only 20 per cent that of natural forests (FOEI, 2008: 23). Further, basing costs on historical baselines may disadvantage LDCs, as they have lower rates of deforestation than middle-income rainforest countries, such as Brazil and Indonesia, and are thus able to generate more resources from REDD activities (Myers Madeira, 2008: 29).
Second, it has been argued that REDD activities do not address the key drivers of deforestation, particularly the demand for timber, agricultural commodities and unsustainable land-use policies (FOEI, 2008: 24–26). For example, without a reduction in demand for timber and other forestry products, a reduction in supply could lead to an increase in timber, livestock and crop prices, thus creating an incentive for deforestation, both nationally or abroad (FOEI, 2008: 24; Myers Madeira, 2008: 11). This “market leakage” results in deforestation becoming more profitable in areas outside the REDD framework. REDD activities do not address other drivers of deforestation such as weak governance, corruption and illegal logging, and may, under some circumstances, reward those responsible for deforestation by creating perverse incentives. The increase in the value of forests as a result of REDD without a corresponding framework for protecting the land tenure of forest dwellers and indigenous communities in LDCs may also adversely affect communities that are dependent on forests for their livelihoods (FOEI, 2008: 16–17). If REDD is to succeed, these complex political and social issues need to be addressed (Horta, 2009).
Third, REDD activities do not address the structural reasons underlying the high dependence on the forestry sector as a source of external revenue for LDCs and the high carbon emissions from unsustainable land-use largely due to their lack of economic diversification and technological capacity. Providing payments for REDD activities may be an option for meeting the twin objectives of mitigation and adaptation. However, unless REDD approaches
Arresting deforestation and forest degradation has the potential to provide an
additional source of finance to LDCs through REDD...
... but without a focus on governance, rights and
security of resource tenure, REDD is likely to fail.

239An Agenda for Action: (V) Climate Change and (VI) South-South Development Cooperation
are embedded within a broader, integrated strategy that encompasses building resilience to climate change, a strong regulatory framework and secure land-tenure rights, its climate-related funding activities may not be sustainable. 6
Arresting deforestation and forest degradation has the potential to provide an additional source of finance to LDCs through REDD, even if a global REDD mechanism does not materialize or fails for other reasons, as forest-based products annually generate billions of dollars of revenue internationally. The World Bank (2006) has estimated annual losses from global illegal deforestation at $15 billion per annum.
(b) International support mechanisms for LDCs
Since 2000, international REDD negotiations at the UNFCCC’s COP have been largely confined to discussions about measuring forest carbon stocks in order to trade carbon credits. For LDCs in particular, but also developing countries in general, this fails to address the underlying drivers of deforestation and degradation. Without a focus on governance, rights and security of resource tenure, REDD is likely to fail. Recognizing this, the 2008 Tuvalu REDD submission (FCCC/AWGLCA/2008/MISC.5/Add.2 (Part I)), on behalf of the Alliance of Small Island States (AOSIS), called for “options for exploring demand side measures relating to drivers of deforestation (e.g. export of timber and forest products)”. More explicitly, Tuvalu maintained that carbon stocks included in wood products not certified as “sustainable” and imported by an Annex I Party from a non-Annex I Party should count as an emission by the Annex I Party. To date, however, other Parties have not supported this proposal. Therefore REDD must measure more than carbon; it should also ensure wide stakeholder participation in policy development, secure land-tenure and resource rights, and encourage strong forest protection laws and enforcement. For LDCs, these would be key elements of their engagement in the REDD process as it evolves, whether or not a global mechanism is introduced. Some of these elements are elaborated below.
For LDCs national REDD strategies should be informed by on-the-ground realities and practical lessons from early REDD implementation. While REDD will need to reflect diverse national circumstances, LDCs will need to ensure that the key building blocks of the future REDD+, such as safeguards, reference levels, baselines, and measurement, reporting and verification (MRV) reflect their needs, but also their current capacities.
If the expected reduction of emissions from REDD are to be realized, LDCs will need assistance in developing their capacities to enforce their environmental and forest management legislation. At present, timber production that violates LDCs’ environmental and forest management legislation not only acts as a barrier to REDD, but also costs these countries billions of dollars per annum (Daviet, 2009). Thus it may be necessary to develop special programmes or measures/ requirements for LDCs so as to increase their participation in the REDD scheme. LDCs should ensure that these special measures or requirements feature in forthcoming climate change COP conferences. Significant funding in the form of grants is needed for the initial stages of REDD+ to enhance LDC participation.
If the expected reduction of emissions from REDD are to be realized, LDCs will need
assistance in developing their capacities to enforce their environmental and forest management legislation.
The acceleration of economic growth in several developing countries and their expanding
international linkages have made the South an increasingly important
partner of the LDCs over the past 20 years.

The Least Developed Countries Report 2010240
Box 15. Differences among developing-country partners of LDCs
LDCs differ from other groups of countries in several respects, such as income, technology, knowledge, size of the economy, productive and financial resources, human resources and institutional capabilities. Obviously, such gaps are the widest between LDCs and developed countries (UNCTAD, 2006: 137–140 and 193–200; UNCTAD, 2007: 1–5), but there are also considerable differences between LDCs and ODCs. Among the ODC subgroups, LDCs display the largest differences vis-à-vis the MDTPs and the smallest vis-à-vis their RTA partners. Per capita GDP — the broadest indicator of development — is six times higher in MDTPs than in LDCs, while it is just three times higher in RTA partners (box table 2). Moreover, the income gap between MDTPs and LDCs has been widening. The technological gap is even wider, as evident by indicators such as gross domestic expenditure on R&D per capita and the share of medium- and high-technology-intensive and skill- intensive exports in total exports. In both cases, the level in MDTPs is some 21 times higher than in LDCs, while the gap with RTA partners is much narrower (box table 2).
There is also a huge contrast in the size of the economies of LDCs and MDTPs. The economy of the latter as a group is 20 times larger than that of the LDCs as a group. China’s economy alone is eight times bigger than the economies of all LDCs combined. By contrast the combined economies of RTA partners as a group are just four times bigger (box table 2).
These contrasts imply asymmetries in negotiating powers and in the benefits that may be expected from closer economic integration. The smaller asymmetries between LDCs and their RTA partners, as well as the greater similarities in their economic, social and ecological conditions largely explain why such RTAs can have positive development effects on them. The larger gap separating LDCs from MDTPs implies that policy actions and initiatives are necessary in order to counter the adverse effects of integration with very diverse partners.
Box table 2Differences between LDCs and their main developing country partner groups, 2007–2008
Dimension Economic size Income Technology
IndicatorsCountrygroups
GDP($ billions)
GDP per capita($)
GERD per capita*(PPP $)
Share of exports of medium- and
high-tech manufacturesin total exports
(Per cent)
LDCs 460 569 2 2RTA partners 2 048 1 902 11 24MDTPs 9 321 3 218 49 45Source: UNCTAD secretariat calculations, based on data from the UN-DESA Statistics Division, UNESCO and UNCTAD’s
GlobStat database.* GERD: Gross domestic expenditure on research and development. Data for 2005–2007 for a sample of seven LDCs, 13 RTA
partners and 7 MDTPs.
B. South-south economic relations involving LDCs
The acceleration of economic growth in several developing countries and their expanding international linkages have made the South an increasingly important partner of the LDCs over the past 20 years. As chapter 4 of this Report shows, linkages of the LDCs with other developing countries (ODCs) through trade, FDI, official finance, people and knowledge have grown rapidly, so that these flows have become comparable to — and in some cases even larger than — those with the traditional, major developed-country partners of LDCs. Among developing countries, two groups have the most extensive linkages with LDCs: their major developing trade partners (MDTPs) and their partners in regional trade agreements (RTAs). The LDCs’ economic and political linkages with these two major developing-country partner groups are quite different, due to differences between the MDTPs and RTA partners (box 15).
The shift of LDC economies away from their previous focus on linkages mainly with the North diversifies their pattern of international integration.
In order to realize the potential gains from the
closer integration of LDCs with their RTA partners and MDTPs, a positive agenda is
needed, comprising strategies, initiatives and ISMs as part of
the proposed NIDA.
241An Agenda for Action: (V) Climate Change and (VI) South-South Development Cooperation
Potentially, it can have positive impacts on the development of productive capacities in LDCs, thus representing an opportunity for development and poverty reduction. At the same time, however, it also carries the risk of locking LDCs into their traditional position at the lower rung of the ladder in the international division of labour.7 These risks derive mainly from closer economic integration with economies that are relatively more developed and/or much larger (box 15).
In order to realize the potential gains from the closer integration of LDCs with their RTA partners and MDTPs, a positive agenda is needed, comprising strategies, initiatives and ISMs as part of the proposed NIDA. These elements of the NIDA agenda should strengthen those aspects of the economic relations of LDCs with ODCs that are opportunities for the development of productive capacities in the LDCs. At the same time, they should aim at tackling the challenges brought by those relations. So far, LDCs’ participation in the present, so-called “second wave of globalization” has resulted in an increase in their flows of trade, investment, development cooperation and knowledge with developing countries. Yet most LDCs have not made an assessment of the impact of these strengthening linkages on their development outlook, nor have they formulated a clear and coherent strategy to deal with ODC economic agents (e.g. firms, Governments and agencies).
In order to reap the developmental benefits of growing economic relations with ODCs, LDC Governments need to adopt a proactive approach to South-South trade, investment, development assistance and technology (Kaplinsky and Farooki, 2009). In formulating a positive agenda for South-South linkages involving LDCs, the following elements should be included:
• Undertaking an analysis of the current and potential benefits and shortcomings resulting from LDCs’ ties with other developing countries;
• Formulating a clear policy and strategy for negotiating with economic agents, both public and private, from ODCs;
• Mainstreaming South-South economic linkages in LDCs’ national development strategies and policies; and
• Articulating the South-South and North-South dimensions of LDCs’ international relations, so that they become mutually supportive.
LDCs will reap greater developmental benefits from South-South linkages if they adopt a proactive stance towards development cooperation, ensuring that it has positive impacts on trade, foreign investment, knowledge transfer and migration. Regional institutions (e.g. United Nations Regional Commissions, RTAs, regional development banks, the Planning and Coordinating Agency of the New Partnership for Africa’s Development – NEPAD) can be instrumental in assisting LDCs formulate and negotiate clear strategies. The major orientations and elements of such a positive agenda are outlined in the next sections according to the five pillars of the NIDA.
1. FINANCE
(a) Scaling up and improving South-South official financial flows
General measures and principles
Guiding principles. South-South cooperation and development assistance should continue to be guided by the principles of non-exploitative and
LDCs need to formulate a clear policy and strategy for negotiating with economic
agents, both public and private, from ODCs.
LDCs should articulate the South-South and North-
South dimensions of their international relations, so that they become mutually
supportive.
South-South cooperation and development assistance should continue to be guided
by the principles of non-exploitative and horizontal relationships between the
more advanced developing countries and LDCs.

The Least Developed Countries Report 2010242
horizontal relationships between the more advanced developing countries and LDCs. At the same time, they should respect certain basic principles, such as national ownership of development strategies and policies, donor alignment with recipient-country priorities, demand-driven projects, and not attaching policy conditionalities to the disbursement of official finance.
Scaling up South-South official financial flows. Given the very large needs and structural shortcomings of LDCs and the positive aspects of South-South development cooperation, such cooperation should be strengthened in order to leverage its developmental impacts. Different forms and sources should be combined to finance this increase, including the following:
• Increasing development cooperation budgets. Since 2006, donors such as Brazil, China and India have significantly augmented their development cooperation budgets, a trend which should continue and be adopted by other developing-country donors;
• Joint financing by developing countries, such as the projects financed by the India-Brazil-South Africa Partnership (IBSA) in Burundi and Guinea-Bissau;
• Multilateral and regional financing. An example of this mode of financing is the joint project of the Chinese Government and the World Bank on capacity development for poverty reduction, in which China is sharing its strategy and policies on poverty reduction with 35 African countries, mostly LDCs.8 Another example is a cluster of regional projects that include a South-South cooperation component, such as those covering the Greater Mekong subregion, supported by the Asian Development Bank, with resources from China, India, Japan and Thailand among others. The Greater Mekong subregion comprises Asian LDCs (Cambodia, Myanmar and the Lao People’s Democratic Republic), and China, Thailand and Viet Nam;9
• Triangular cooperation. This mode of development cooperation typically combines knowledge transfer between developing countries with financing from developed countries, so as to partly solve the problem of chronic underfunding of South-South cooperation projects (Fordelone, 2009);10
• Private sector funding. Foundations are a largely unexploited source of finance for South-South development cooperation, which should be exploited by the main actors involved.
New negotiating modes. LDCs’ development partners — especially the largest among them — should start to negotiate a more significant part of their development cooperation policies and projects with blocs of recipient countries. These blocs can be RTAs, regional economic communities or wider structures like the African Union or the NEPAD Planning and Coordinating Agency. This contrasts with the present bilateral and project-based delivery of South-South development cooperation and has two main advantages. First, it rebalances the asymmetries of power, technical capacities and resources that currently exist between individual LDCs and major developing-country donors. Individual LDCs will benefit from increasing their bargaining power by pooling their voices through regional and multilateral entities.11 Second, development cooperation negotiations involving LDC groupings increase the scope for creating synergies, for example when discussing projects that have regional impacts, such as regional development corridors, cross-border infrastructures and joint regional initiatives (e.g. technological research centres).12
Development cooperation negotiations involving LDC
groupings increase the scope for creating synergies, for example when discussing
projects that have regional impacts.
South-South development cooperation should be
strengthened in order to leverage its developmental
impacts.

243An Agenda for Action: (V) Climate Change and (VI) South-South Development Cooperation
Strengthening synergies between South-South and North-South development cooperation. South-South cooperation is sometimes presented as an alternative to North-South cooperation. This is a misconception; the former cannot replace the latter. Indeed, despite the growing weight of economic linkages of LDCs with ODCs, traditional donors from the North remain their most important sources of external financing. An international environment that is conducive to the development of LDCs is one that combines North-South partnerships and South-South linkages, and creates synergies between them.
More broadly, synergies between South-South and North-South economic relations also stem from other mechanisms. First, having a number of alternative economic partners (e.g. from the South) provides LDC Governments and businesses with more bargaining power vis-à-vis other foreign agents (e.g. from the North), not only with regard to aid, but also for investment and trade. Second, some financing modes imply cooperative arrangements such as triangular and multilateral financing of South-South cooperation, given that multilateral institutions typically receive most of their financing from developed countries. Third, South-South official financial flows can complement North-South aid. For example, southern partners are much more focused on infrastructure development than traditional donors.
Measures ensuring better domestic coordination of fragmented initiatives by LDCs will help avoid duplication, increase the effectiveness of both North-South and South-South development cooperation and make them more supportive of domestic priorities and national development strategies (Davies, 2008). Coordination of official financial flows is especially important because the emergence of new sources of finance further complicates LDCs’ management of ODA. At present, such management is hampered by the multiplicity of donors which frequently are not well coordinated and have different aid disbursement and reporting systems. Such complexity strains the limited management capacities of LDCs. Donor coordination is best undertaken at the national level to ensure donor alignment with national priorities and development strategies. Some LDCs have set up aid management systems for such coordination and for using their scarce institutional capabilities more efficiently (UNCTAD, 2008: 121–126). North-South and South-South coordination of official financial flows can also be achieved through the recently established United Nations Development Cooperation Forum.
(b) International support mechanisms for LDCs within South-South cooperation
Developing countries should take into account the specific vulnerabilities and deficiencies of LDCs when designing and implementing their development cooperation policies. Source countries of official financial flows could consider adopting the support mechanisms described below.
Set aside minimum shares for LDCs. Developing countries in a position to do so might consider establishing targets to set aside a minimum share of their total budget of official financial flows for the benefit of LDCs. This share should be higher than LDCs’ share in the population or GDP of all development cooperation recipient countries, so as to accelerate economic growth in the LDCs.
Specific mechanisms within existing forums. Some developing countries have established forums for discussing and coordinating their development
Measures ensuring better domestic coordination
of fragmented initiatives by LDCs will help avoid duplication and increase the effectiveness of both
North-South and South-South development cooperation.
The Least Developed Countries Report 2010244
assistance, such as the Forum for China-Africa Cooperation (FOCAC) launched in 2000, which has already held four ministerial conferences, the India-Africa Summit (the first of which was held in 2008); the Africa-South America Summit (started in 2006) and the Turkey-Africa Cooperation Summit, which was held in 2008. These initiatives do not include any LDC-specific mechanisms or institutions, and therefore they do not take into account the specific problems or challenges facing LDCs. This needs to be rectified by donors from the South and LDCs devising some LDC-specific institutional mechanisms within the existing forums to address the particular problems of the LDCs. They should promote discussion and negotiation of development assistance policies and projects that would specifically consider the structural deficiencies of LDCs and devise solutions to help overcome them.
(c) Increasing the development impact of FDI from the South
In principle, FDI flows from developing countries to LDCs can provide a number of development benefits, as mentioned in chapter 4 of this Report. However, those positive effects are not automatic; they generally require a number of policy actions, as discussed below.
Direct action by home-country Governments. Governments of developing countries that invest in LDCs should strongly encourage their firms to reach agreements with LDC economic agents (i.e. Governments, firms and workers) and adopt mechanisms that will promote the development of productive capacities in LDCs, as outlined in chapter 4 of this Report. The home-country Governments can directly influence their outward investors, especially if these are State-owned companies, financed by official institutions or funded by sovereign funds. These State-backed companies are responsible for a significant share of investments in oil, mining and agriculture in LDCs.
Incentives by home-country Governments. Home-country Governments can also adopt policy measures to influence the behaviour of their private firms dealing with LDCs. They can grant preferences (e.g. financial and fiscal incentives) to those national transnational corporations (TNCs) investing in LDCs which manage to promote development through their FDI, for example by creating more domestic linkages in the host LDC economies, effectively transferring knowledge to LDC persons and firms, developing innovative activities and generating more fiscal revenues for the host countries. Other home-country instruments that can help developing-country FDI in LDCs achieve developmental aims are the provision of information and technical assistance and investment insurance (UNCTAD, 2001).
Agreements between developing-country investors and host-country Governments. Many of the conditions and objectives that determine the development impact of FDI are contained in agreements between foreign investors and host-country Governments. The terms of operation of developing-country TNCs in the area of natural resources is discussed below in the subsection on commodities. In addition to the fair appropriation of natural resource rents by national agents, several other measures for improving the development impact of FDI can be included in LDC host-country legislation or in the terms of agreements between the recipient LDC Governments and investors (UNCTAD, 2001 and 2003). The following are examples of such measures:
Governments of developing countries that invest in LDCs should strongly
encourage their firms to reach agreements with LDC economic agents and adopt
mechanisms that will promote the development of productive
capacities in LDCs.
Several measures for improving the development
impact of FDI can be included in LDC host-country
legislation or in the terms of agreements between the
recipient LDC Governments and investors.

245An Agenda for Action: (V) Climate Change and (VI) South-South Development Cooperation
Box 16. Increasing the development impact of FDI in agriculture
In order to ensure that FDI in LDCs’ agriculture has a positive development impact and avoids the adverse impacts usually associated with “land grabs” (UNCTAD, 2009b), inclusive business models should be adopted that promote local participation in economic activities (including outgrower schemes), joint equity with local communities and local content requirements for both inputs and outputs (Cotula et al., 2009).
These inclusive models have the following advantages:
• They create backward linkages by bringing together domestic smallholders and large-scale international investors, which in turn ensures the long-term sustainability of a project;
• They create and preserve jobs of the local workforce;
• They allow smallholders to continue growing other products besides those that are outcontracted;
• They can facilitate transfer of knowledge to smallholders if foreign investors invest in their training;
• They do not impose unnecessary restrictions on host-country policymaking (for instance, requiring host countries to commit not to restrict food exports even in the event of a food crisis);
• They adhere to international codes of conduct that are being elaborated, particularly their provisions relating to local food security, transparency and respect for local patterns of land use and property rights (Meinzen-Dick and Markelova, 2009).
UNCTAD, the Food and Agriculture Organization of the United Nations (FAO), the International Fund for Agricultural Development (IFAD), the World Bank Group and some national governments have collaborated since 2009 to develop the Principles for Responsible Agricultural Investment that Respects Rights, Livelihoods and Resources (UNCTAD, 2010b). They should eventually be translated into toolkits of best practices, guidelines, governance frameworks, and possibly codes of practice by the major sets of actors involved in investment in agriculture in developing countries, including LDCs.
• Requiring TNCs to provide training and knowledge transfer to their local employees, as well as subcontracting farms and firms with which they establish backward linkages;
• Modalities that result in a greater development impact of FDI on LDC agriculture (box 16);
• Targets for sourcing a certain proportion of inputs domestically;
• Targets for introducing a level of processing of raw materials in the host country, where this is technically feasible;13
• Conducting some research and development (R&D) activities in the LDC host country.
LDC host-country Governments should formulate an FDI policy that provides incentives for foreign investment in sectors and areas that would help resolve supply and delivery bottlenecks as well as structural deficiencies in their countries. These policies and objectives should be reflected in the terms of establishment negotiated with the foreign direct investors. A similar policy stance should apply to the LDC countries that are likely to host Chinese preferential trade and industrial zones for Chinese business entry (e.g. Ethiopia and Zambia) and other similar projects.
Multilateral financing for diversification. Multilateral and regional financing institutions can also facilitate FDI from developing countries that is conducive to LDCs’ long-term development and diversification. Such institutions should favour those sectors/investment projects that are the most likely to foster local employment creation, transfer of knowledge and the building of linkages with the domestic economy. The World Bank, for example, has some joint projects with Chinese firms to invest in lower value added manufacturing in some African LDCs.
LDC Governments should formulate an FDI policy that
provides incentives for foreign investment in sectors and
areas that would help resolve their structural deficiencies.
Multilateral and regional financing institutions can also facilitate FDI from developing countries that is conducive to LDCs’ long-term development
and diversification.

The Least Developed Countries Report 2010246
Most of the policy measures mentioned above are applicable not only to FDI in LDCs originating from the South, but also to that originating from the North.
2. TRADE
(a) Deepening regional integration
Structural features are more similar between LDC economies and those of other members of the same RTAs than between LDCs and any other major partner group (box 15). Thus, close regional economic integration can potentially contribute significantly to the development of productive capacities of LDCs. However, in spite of stated policy intentions, the degree of regional integration is low or even declining in most RTAs of which LDCs are members, due to factors discussed in chapter 4 of this Report.
In order to realize the potential contribution of RTAs to the development of LDCs, deeper and more efficient regional integration initiatives are needed, supported by those RTAs’ development partners in the South and the North. The main measures required to achieve deeper and more efficient integration are discussed below.
For LDCs to reap the potential benefits from regional integration, the plans and discourses within RTAs need to be implemented by all the RTA members, including the LDCs. As mentioned in chapter 4 of this Report, one of the main obstacles to closer regional integration is the gap between the stated goals and plans and inadequate implementation, even of some non-ambitious measures. The following are some of the main measures that should be considered as top priority for implementation
Rationalize African RTAs. The RTAs in Africa need to avoid the problems generated by overlaps and multiple membership. This can be done in various ways, ranging from a minimalist one of coordinating and harmonizing strategies, programmes and cooperation instruments of existing RTAs, to a more ambitious one of merging existing RTAs so that there is only one per region (North, West, Central, East and Southern Africa) (UNECA, 2006).14 Such rationalization should contribute significantly to strengthening the regional integration of African RTAs, including their respective LDCs.
Widen and deepen regional integration in South Asia. In order to increase intraregional flows of trade, investment, technology, knowledge and people, the member countries of the SAARC (South Asian Association for Regional Cooperation) Preferential Trade Arrangement (SAPTA) may consider implementing much more ambitious measures for regional integration and commit financial, political, human and institutional resources to achieve this goal.
Extend the scope of integration. Those RTAs that restrict themselves to the most basic forms of integration (e.g. preferential market access for goods) should make efforts to extend that integration through the stronger liberalization of trade in goods. They could also consider adopting other mechanisms and instruments of deeper integration, such as integration of services, capital and labour markets, as well as harmonization of policies.
Regional integration can advance even further through other instruments that directly affect members’ productive capacities. These could include
In order to realize the potential contribution of RTAs to the development of LDCs,
deeper and more efficient regional integration initiatives
are needed, supported by those RTAs’ development partners in the South and
the North.
RTAs could also consider adopting mechanisms
and instruments of deeper integration, such as
integration of services, capital and labour markets, as well as
harmonization of policies.

247An Agenda for Action: (V) Climate Change and (VI) South-South Development Cooperation
joint investment projects (e.g. for improving transboundary infrastructure of transport and communications, as mentioned below), pooling resources to establish joint scientific and technological research centres and projects (also more on this below), and favouring the establishment of regional value chains that deepen the regional division of labour. Such joint initiatives leverage scarce resources of members and strengthen synergies between their economies.
An important step towards deeper regional integration is monetary and financial cooperation, which may include establishing regional development banks and funds (such as the FonPlata of the Southern Common Market — Mercosur — in South America). Regional and subregional banks could provide financial support for greater cooperation among developing countries (Griffith-Jones, Griffith-Jones and Hertova, 2008). The already existing regional institutions of this type in Asia, Africa and the Americas have already been active in financing a number of South-South cooperation projects.
Develop regional development corridors and infrastructure. Developing cross-border infrastructure would overcome one of the main obstacles to regional integration, especially in Africa (UNCTAD, 2009a). Building transnational structures such as roads, railways, waterways, air transport links, telecoms and energy supply lines (development corridors) has an even stronger impact on the development of productive capacities of neighbouring countries if it is accompanied by local development projects in different sectors (e.g. agriculture, industry). One example of this combination of projects is the Spatial Development Initiatives (SDIs) launched by South Africa. Its main project is the Maputo Development Corridor involving the Maputo Corridor Toll road, the railway from Ressano Garcia to Maputo and the Maputo Port and Harbour, as well as projects in agriculture, mining and tourism. NEPAD also plans to help establish Pan-African corridors and networks. Since these are large-scale and long-term projects, their financing requires a combination of funding from national budgets, donors (from the North and South) and regional and multilateral financing institutions. Foreign donors should therefore increase their financing of such types of projects.
Coordinate resources regionally for more effective international negotiations. LDCs and their RTA partners can combine their political, human and institutional resources to negotiate with international partners not only for development cooperation assistance and ODA (as discussed earlier), but also in the fields of trade, investment and migration. Joint action enhances their negotiating power vis-à-vis foreign partners (both bilateral and multilateral), makes more efficient use of their scarce resources, and helps avoid a race to the bottom in competition for FDI, trade deals and development cooperation projects.
Improve information on regional supply capacities. Better knowledge of goods and services available within the same region (e.g. through virtual information platforms and more trade fairs) can obviate the need for imports from distant suppliers (be they developed or developing) and strengthen intra-RTA trade. It can thereby increase demand for some of the goods and services that can be competitively supplied by LDCs. Improvements in this type of information flow would foster the establishment of regional value chains.
Trade facilitation. In the case of LDCs, the scope for expanding trade by reducing trade costs is greater in intra-RTA trade because these costs are relatively higher than in trade flows with other partners (e.g. developed
An important step towards deeper regional integration is monetary and financial cooperation, which may
include establishing regional development banks and funds.
LDCs and their RTA partners can combine their political,
human and institutional resources to negotiate with
international partners development cooperation
assistance, ODA, but also in the fields of trade, investment
and migration.
The Least Developed Countries Report 2010248
countries and MDTPs) (Kowalski and Shepherd, 2006). There is considerable evidence to show that trade could be expanded within existing regional integration schemes by just simplifying and reducing documentation requirements across borders, enhancing transparency, expediting the release of goods from customs, standardizing trade-related regulations and improving border agency coordination within and among members of a common RTA (Milner, Morrissey and Zgovu, 2008; UNECA, 2010: 193–240).
International support mechanisms for LDCs
While the variations in levels of income, development and influence among members of the same RTA are narrower than between LDCs and MDTPs, they are not negligible. South-South RTAs should acknowledge the existing variations between their members, and provide special and differential treatment for their LDC members. Favourable treatment could include the following:
• Redistribution of common resources in favour of LDCs. RTAs could allocate to LDCs a proportion of the resources that they mobilize (e.g. import duties, common budget, resources for fixed investment) that is superior to LDC member countries’ share in imports, population or GDP, thereby supporting the catch-up of LDCs with other RTA members;15
• Preferential and non-reciprocal treatment for LDCs. This is already in place in the South Asian Free Trade Area (SAFTA), where non-LDC members (i.e. India, Pakistan and Sri Lanka) grant additional non-reciprocal preferences to SAFTA’s LDC members;
• Grant differential and longer delays to LDCs for trade liberalization;
• More favourable criteria for LDCs in calculating contributions to the common budget;
• Assistance by the more advanced members to develop other members’ productive capacities.16
(b) Broadening market access for LDC exports
LDC’s developing-country trade partners should expand preferential market access for LDC goods and services. The MDTPs and other large and/or more advanced developing countries in a position to do so should offer non-reciprocal duty-free and quota-free (DFQF) market access to the goods of all LDCs. Research results indicate that the elasticity of trade to trade barriers (e.g. tariffs) is higher in South-South trade than in other trade flows (e.g. Kowalski and Shepherd, 2006). A simulation of the impact on LDCs members of the WTO (32 countries) of an increase in DFQF coverage from 97 per cent to 100 per cent of tariff lines by Brazil, China and India showed that this would lead to $5.6 billion worth of additional exports by those LDCs. This is almost triple the estimated gains resulting from an analogous policy change in OECD countries ($2.1 billion additional exports) (Elliott, 2009). Moreover, in both cases, since most of the additional exports would originate mainly from non-oil exporting LDCs, such market access measures offer the potential for trade diversification.
Another way of expanding market access is by offering preferential treatment in the context of the Global System of Trade Preferences (GSTP) for South-South trade. Recent GSTP commitments by developing countries should be implemented without delay, particularly with regard to those
South-South RTAs should acknowledge the existing variations between their
members, and provide special and differential treatment for
their LDC members.
The MDTPs and other large and/or more advanced
developing countries in a position to do so should offer non-reciprocal duty-free and quota-free market access to
the goods of all LDCs.
249An Agenda for Action: (V) Climate Change and (VI) South-South Development Cooperation
products with higher externalities for LDCs. Efforts should be made to ensure that preferences are within the supply capacity of LDCs, and that they promote forward and backward linkages with the rest of the economy, thereby enabling the development of local suppliers and technology transfer.
The limitations of preferential market access in fostering exports and output diversification and growth are well known. Therefore, for the above-mentioned preferential schemes to be effective, they should be well designed and be complemented by other measures and policies, as discussed below.
First, the following elements should be included in the design of an effective DFQF scheme for LDCs:
• Full (100 per cent) coverage of tariff lines;
• Extension to all LDCs;
• Flexible rules of origin that allow production to take place also in smaller economies. This can be achieved typically by permitting cumulation17 (e.g. on a regional basis or across LDCs);18
• Stabililty and predictability. Preferences should be permanent and have a stable legal basis in the preference-giving developing countries;
• Transparency on coverage, coverage extension schedule and graduation conditions;
• Absence of conditionalities (political or otherwise, such as reciprocity requirements).
Preferences negotiated by other developing countries in the context of the GSTP should follow similar principles.
Second, preferential market access should be accompanied by the ISMs proposed in the previous subsections that foster the productive capacities of the preference-receiving LDCs. This will not only result in a more effective use of the preferences, but also prevent them from having an anti-diversification effect.19 Support for LDCs’ trade should encompass the upgrading of small and medium-sized enterprises (SMEs) through the provision of training for managers, improving marketing and product quality, helping the country’s facilities and quality control mechanisms conform to world sanitary and phytosanitary (SPS) standards and through trade facilitation.
3. COMMODITIES
Some of the elements of the positive agenda for South-South FDI (outlined above) aim to improve forward and backward linkages with TNCs, as well as learning externalities. Yet in the case of natural resources (e.g. petroleum and hard rock mining, agriculture, fishing and forestry), often it is the fiscal linkages that are the major channel for promoting the developmental impacts of FDI in LDCs, provided national Governments can capture a reasonable share of the rents and use them for financing development. Thus the rules that determine the sharing of the rents between TNCs and national Governments have a bearing on the extent of the development impacts of FDI in natural resources.
It is therefore important for LDC Governments to negotiate with their foreign investors in natural resources for reasonable royalties, levies and taxes.
For preferential schemes to be effective, they should
be well designed and be complemented by other measures and policies.
Preferential market access should be accompanied
by the ISMs that foster the productive capacities of the preference-receiving LDCs.
In the case of natural resources, often it is the fiscal
linkages that are the major channel for promoting the
developmental impacts of FDI in LDCs, provided national Governments can capture a
reasonable share of the rents and use them for financing
development.
The Least Developed Countries Report 2010250
Where fiscal linkages have been minimal, the terms of agreements between TNCs and LDC Governments should be renegotiated. A more equitable sharing of resource rents can be achieved if natural-resource-rich developing countries collectively formulate some generally agreed principles concerning the fiscal treatment of foreign investors (UNCTAD, 2005: 108–115) in order to avoid the temptation to engage in a race to the bottom to attract FDI.
4. KNOWLEDGE-SHARING AND TECHNOLOGY TRANSFER
The similarity of economic, social and ecological conditions between developing countries and of the development challenges that confront them (currently or in the recent past) create strong potential for knowledge-sharing and transfer between MDTPs and RTA partners, on the one hand, and LDCs on the other. The smaller technological distance between LDCs and their developing-country partners (be they MDTPs or RTA partners) and the greater suitability of technologies developed in these countries also facilitates knowledge transfer from ODC partners to LDCs.
The catch-up experiences of ODCs are relatively recent and highly relevant to LDCs, especially given that several ODCs are also struggling with similar development challenges, including widening income disparities, climate change, food insecurity and lack of technical expertise. South-South cooperation between LDCs and ODCs offers important possibilities for technology transfer, knowledge-sharing and the sharing of experiences with policies covering a range of sectors/activities, including agriculture, health, social security, formulation and implementation of an effective industrial policy, trade facilitation and local capacity-building, and energy, including renewable energy technologies.
Although knowledge-sharing and transfer are present in many development cooperation projects, it can be strengthened not only in development cooperation operations, but also in commercial transactions, as discussed below.
(a) Sharing knowledge of development strategies
Knowledge transfer and technical cooperation already are an important component of South-South development cooperation, but projects tend to focus on specific areas/technologies, such as agriculture, health, information and communication technologies (ICTs), and education. Largely missing is the broader picture of accumulated knowledge and experience of development strategies and policies. Through a combination of policy and market mechanisms, together with concerted actions by State-owned and private enterprises, the more advanced developing countries have been able to build technical competence and create domestic conditions for technology transfer. In most cases, successful developing countries have followed their own development strategies, which differ from the conventional policy framework advocated by traditional donors, both multilateral and bilateral (Amsden, 2003).
It is this knowledge and experience gained from trial-and-error problem-solving that successful developing countries could fruitfully transmit to LDCs through knowledge- and experience-sharing, training, and other forms of knowledge transfer. So far, developing countries that have been successful in achieving rapid development (particularly the East Asian newly
The similarity of economic, social and ecological
conditions between developing countries and of the
development challenges that confront them create strong
potential for knowledge-sharing and transfer between
MDTPs and RTA partners and LDCs.
LDC policymakers could benefit immensely from the
insights into alternative development strategies to the conventional ones proposed
by many donors.

251An Agenda for Action: (V) Climate Change and (VI) South-South Development Cooperation
industrializing economies) seem not to have engaged very actively in sharing the broader elements of their development strategies and policies through their development cooperation (Wade, as quoted in Gallagher, 2009). This attitude contrasts with their readiness to provide technical assistance to lower income countries in specific areas. Yet it is knowledge-sharing about how they overcame many of the problems currently faced by LDC that could be most useful to LDC policymakers. These policymakers could benefit immensely from the insights into alternative development strategies to the conventional ones proposed by many donors.
There are several ways in which developing countries can share experiences and knowledge with LDCs, including the organizing of seminars and round tables; sponsoring internships of LDC officials in their key strategic development planning institutions and ministries; and enabling greater academic exchange on development policies and strategies between research institutions and universities in donor developing countries and LDCs. The latter mechanism can also comprise joint research projects comparing alternative development strategies and their outcomes.20
Beyond these broader elements of development strategies and policies, South-South development cooperation should also incorporate or strengthen components relating to new and emerging issues (e.g. climate change) and regional integration (see below).
(b) Regional research and development hubs
For the development and acquisition of some technologies, especially those of immense public interest such as pharmaceuticals and agriculture, enterprises need a supportive industrial infrastructure. The relevant facilities are often technology-intensive and costly. For instance, in the case of pharmaceuticals, enterprises seeking to produce good quality generic drugs require testing laboratories, bioequivalence laboratories as well as active pharmaceutical industrial parks to be able to produce in a cost-effective manner. Similarly for R&D in biotechnology, most public research institutes in sub-Saharan Africa, for example, are unable to move beyond tissue culture owing to lack of funding and infrastructure (Oyelaran-Oyeyinka and Gehl Sampath, 2010). Regional R&D facilities to create and sustain R&D within firms or to provide R&D services on a pay-and-go basis could offer a very important solution to these problems faced by LDCs’ public and private sectors in the short and medium term. Some regional initiatives are already under way, a good example being the Engineering Capacity Building Programme by the Germany Technical Cooperation Agency (GTZ). As part of this programme, a bioequivalence facility for the East African region is being set up in collaboration with two pharmaceutical companies from Kenya, one from the United Republic of Tanzania and one from Ethiopia, as well as the School of Pharmacy of the University of Addis Ababa.
Similar regional R&D facilities could be created by LDC Governments and supported through the international community or through South-South collaboration, or even through a triangular facility between the LDCs, ODCs (offering technical know-how and training) and developed countries (offering financial support). A series of pay-and-go industrial facilities could be established in this way for sectors in which individual firms face difficulties in raising capital for infrastructure expansion. Such facilities have been a core component of industrial sector policies in several economies, including China, India, the Republic of Korea and Taiwan Province of China (Noland
Regional R&D facilities to create and sustain R&D within firms or to provide
R&D services on a pay-and-go basis could offer a very important solution to the problems faced by LDCs’
public and private sectors.
The more advanced developing countries should
broaden and increase their current initiatives for establishing joint scientific and technological research
centres in LDCs.

The Least Developed Countries Report 2010252
and Pack, 2003). The regional R&D funds could also set research priorities for technological expansion of firms in particular sectors that are especially important from a regional or international perspective, such as “green” technologies, medicines and regionally suited crop varieties, among others.
The more advanced developing countries should broaden and increase their current initiatives for establishing joint scientific and technological research centres in LDCs, such as Chinese and Brazilian research centres for agriculture in African countries. Another initiative that should be strengthened is the Consortium on Science, Technology and Innovation for the South, which resulted from the transformation of the Third World Network of Scientific Organizations by the Group of 77 and China in 2008, in order to promote science-based sustainable economic development of Southern countries.
(c) Other forms of joint South-South knowledge development and sharing
South-South cooperation and regional integration for technology and R&D could take other important forms as well (Gehl Sampath, 2010; Gehl Sampath and Kozul-Wright, 2010), such as the ones discussed below.
Venture capital funding at the regional level
Venture capital funding is one means of promoting emerging enterprises in LDCs that show promise in key sectors, especially select sectors of regional importance, such as pharmaceuticals, agro-processing and ICTs. Firms from the region could be invited to compete for funding awards (Gallini and Scotchmer, 2002).
Co-investment with private investors in innovative enterprises
Regional schemes for the development of early-stage, innovative technologies by local firms through the sharing of technological know-how can be supported through various public-private South-South partnerships. A good example is the technology-sharing arrangement between Quality Chemicals Uganda and Cipla Pharmaceuticals India for the production of anti-retroviral drugs (box 17). As the case demonstrates, technology-sharing between developing countries offers a promising means of building capacity, but it may require co-investment ventures involving the Government, private enterprises in LDCs and other developing countries.
Financing for collaboration between private and public sector enterprises
This scheme is a means of overcoming the lack of incentives at the national/sectoral levels in countries to establish collaborative linkages. A good example is the Millennium Science and Technology Initiative in Uganda, a project sponsored by the World Bank that has specific funds earmarked for collaborative initiatives between private and public sector enterprises.
Knowledge aid
Whenever possible, South-South development cooperation projects should incorporate an element of capacity-building by skilled nationals (e.g. engineers, professionals and technicians) from the more advanced developing countries that are associated with each project, so that these projects become a means of knowledge transfer to LDCs (UNCTAD, 2007: 161–188; Bell, 2007).
Regional venture capital funding is one means
of promoting emerging enterprises in LDCs that
show promise in key sectors, especially pharmaceuticals, agro-processing and ICTs.
Technology-sharing between developing countries offers a promising means of building capacity, but it may require
co-investment ventures involving the Government,
private enterprises in LDCs and other developing
countries.
Whenever possible, South-South development
cooperation projects should incorporate an element of
capacity-building so that these projects become a means of knowledge transfer to LDCs.
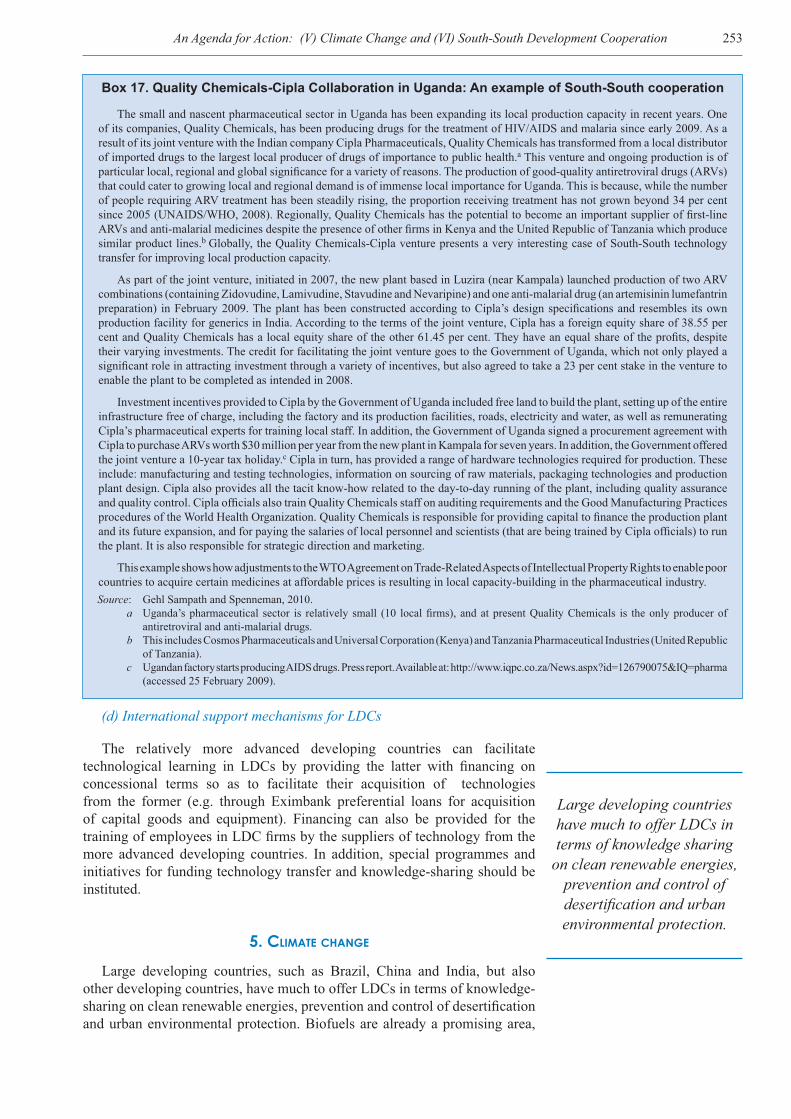
253An Agenda for Action: (V) Climate Change and (VI) South-South Development Cooperation
Box 17. Quality Chemicals-Cipla Collaboration in Uganda: An example of South-South cooperation
The small and nascent pharmaceutical sector in Uganda has been expanding its local production capacity in recent years. One of its companies, Quality Chemicals, has been producing drugs for the treatment of HIV/AIDS and malaria since early 2009. As a result of its joint venture with the Indian company Cipla Pharmaceuticals, Quality Chemicals has transformed from a local distributor of imported drugs to the largest local producer of drugs of importance to public health.a This venture and ongoing production is of particular local, regional and global significance for a variety of reasons. The production of good-quality antiretroviral drugs (ARVs) that could cater to growing local and regional demand is of immense local importance for Uganda. This is because, while the number of people requiring ARV treatment has been steadily rising, the proportion receiving treatment has not grown beyond 34 per cent since 2005 (UNAIDS/WHO, 2008). Regionally, Quality Chemicals has the potential to become an important supplier of first-line ARVs and anti-malarial medicines despite the presence of other firms in Kenya and the United Republic of Tanzania which produce similar product lines.b Globally, the Quality Chemicals-Cipla venture presents a very interesting case of South-South technology transfer for improving local production capacity.
As part of the joint venture, initiated in 2007, the new plant based in Luzira (near Kampala) launched production of two ARV combinations (containing Zidovudine, Lamivudine, Stavudine and Nevaripine) and one anti-malarial drug (an artemisinin lumefantrin preparation) in February 2009. The plant has been constructed according to Cipla’s design specifications and resembles its own production facility for generics in India. According to the terms of the joint venture, Cipla has a foreign equity share of 38.55 per cent and Quality Chemicals has a local equity share of the other 61.45 per cent. They have an equal share of the profits, despite their varying investments. The credit for facilitating the joint venture goes to the Government of Uganda, which not only played a significant role in attracting investment through a variety of incentives, but also agreed to take a 23 per cent stake in the venture to enable the plant to be completed as intended in 2008.
Investment incentives provided to Cipla by the Government of Uganda included free land to build the plant, setting up of the entire infrastructure free of charge, including the factory and its production facilities, roads, electricity and water, as well as remunerating Cipla’s pharmaceutical experts for training local staff. In addition, the Government of Uganda signed a procurement agreement with Cipla to purchase ARVs worth $30 million per year from the new plant in Kampala for seven years. In addition, the Government offered the joint venture a 10-year tax holiday.c Cipla in turn, has provided a range of hardware technologies required for production. These include: manufacturing and testing technologies, information on sourcing of raw materials, packaging technologies and production plant design. Cipla also provides all the tacit know-how related to the day-to-day running of the plant, including quality assurance and quality control. Cipla officials also train Quality Chemicals staff on auditing requirements and the Good Manufacturing Practices procedures of the World Health Organization. Quality Chemicals is responsible for providing capital to finance the production plant and its future expansion, and for paying the salaries of local personnel and scientists (that are being trained by Cipla officials) to run the plant. It is also responsible for strategic direction and marketing.
This example shows how adjustments to the WTO Agreement on Trade-Related Aspects of Intellectual Property Rights to enable poor countries to acquire certain medicines at affordable prices is resulting in local capacity-building in the pharmaceutical industry.Source: Gehl Sampath and Spenneman, 2010. a Uganda’s pharmaceutical sector is relatively small (10 local firms), and at present Quality Chemicals is the only producer of
antiretroviral and anti-malarial drugs. b This includes Cosmos Pharmaceuticals and Universal Corporation (Kenya) and Tanzania Pharmaceutical Industries (United Republic
of Tanzania). c Ugandan factory starts producing AIDS drugs. Press report. Available at: http://www.iqpc.co.za/News.aspx?id=126790075&IQ=pharma
(accessed 25 February 2009).
(d) International support mechanisms for LDCs
The relatively more advanced developing countries can facilitate technological learning in LDCs by providing the latter with financing on concessional terms so as to facilitate their acquisition of technologies from the former (e.g. through Eximbank preferential loans for acquisition of capital goods and equipment). Financing can also be provided for the training of employees in LDC firms by the suppliers of technology from the more advanced developing countries. In addition, special programmes and initiatives for funding technology transfer and knowledge-sharing should be instituted.
5. CLIMATE CHANGE
Large developing countries, such as Brazil, China and India, but also other developing countries, have much to offer LDCs in terms of knowledge-sharing on clean renewable energies, prevention and control of desertification and urban environmental protection. Biofuels are already a promising area,
Large developing countries have much to offer LDCs in terms of knowledge sharing
on clean renewable energies, prevention and control of desertification and urban environmental protection.

The Least Developed Countries Report 2010254
with more than 15 projects under consideration in the Sudan alone, many of which use Brazilian technology.21 Many projects are focusing particularly on the vulnerability of LDCs to climate change mitigation and adaptation. Ways and means will have to be found to improve the scientific capacity of LDCs to assess climate change vulnerabilities and adaptation, and generate and communicate information that is useful for adaptation planning and action. One example is the Capacity Strengthening of LDCs for Adaptation to Climate Change (CLACC) project initiated by the International Institute for Environment and Development (IIED) and the Regional and International Networking Group (RING) partner institutions, which aims to build the capacity of civil society organisations working in 12 selected poor and vulnerable LDCs (nine in Africa and three in South Asia), on issues relating to adaptation to climate change.22 More projects in these areas could be developed through public-private partnerships.
Notes1 Parties to the UNFCCC are classified as: (a) Annex I countries: industrialized countries and
former economies in transition; (b) Annex II countries: a sub-group of the Annex I countries comprising OECD members, excluding former transition economies; and (c) developing countries.
2 The CDM is one of a number of market-based mechanisms designed to address climate change through emissions trading (i.e. cap and trade). It aims to provide economic incentives for the reduction of GHGs. Through the CDM, developing countries could benefit from projects that result in “certified emission reductions” (CERs), thus aiding their mitigation efforts, while developed countries could use the CERs accruing from such projects to contribute towards their quantified emission targets under Article 3 of the Kyoto Protocol. At the same time, funds are generated to support adaptation activities in countries vulnerable to climate change impacts e.g. most of the Pacific island LDCs. CDM transactions have the potential to raise up to $6 billion per annum for adaptation and mitigation purposes, while the primary CDM market has been valued at $12 billion (Clifton, 2009: 19; Griffith-Jones, Hedger and Stokes, 2009: 12). However, the CDM faces an uncertain future because so far there has been no binding decision on international emission quotas or how to achieve them.
3 UN-DESA (2009a: 51) estimates that between 1.6 billion and 2 billion people worldwide, mainly in rural areas, lack access to affordable energy services.
4 UNCTAD secretariat calculations, based on Total Renewable Electricity Net Generation data from the US Energy Information Administration (EIA), International Energy Statistics (http://tonto.eia.doe.gov/cfapps/ipdbproject/IEDIndex3.cfm?tid=6&pid=29&aid=12) (accessed August 2010).
5 The relatively limited impact of the CDM in LDCs is due to their lack of technical capacity, a weak CDM-related institutional framework and high transaction costs associated with the implementation of a CDM project, which essentially limit the participation of LDCs in the initiative. The volume instability and price volatility of carbon markets may also limit the scaling up of the CDM as a means of generating sustainable resources for climate financing in LDCs, especially the large-scale investment necessary for meeting adaptation challenges and shifting towards a low-carbon economy (Clifton, 2009; Griffith-Jones, Hedger and Stokes 2009; UN-DESA, 2009a: 160–161).
6 In recognition of this problem, Tuvalu in 2007 proposed a Forest Retention Incentive Scheme (FRIS) based on funding community-based forestry projects. Communities seeking to set aside forest areas or to manage them sustainably would seek funding to establish a FRIS account which could be drawn upon to fund measures to combat emissions from deforestation and forest degradation. Communities would subsequently be awarded FRIS certificates, issued by national governments under the auspices of the COP, and redeem a proportion of these certificates at a specified time (UNFCCC, 2007). This scheme would be established under the UNFCCC and funded through the Special Climate Change Fund, bilateral ODA, NGO and governmental contributions.
7 For an overview of the main aspects of South-South economic linkages that present opportunities and challenges to the development of productive capacities in LDCs, see table 14 in chapter 4 of this Report.
8 See Impact Alliance, at: http://www.impactalliance.org, Case story 26.9 In 1992, with the assistance of the Asian Development Bank, a programme of subregional
economic cooperation covering the six countries was established, with the aim of increasing
255An Agenda for Action: (V) Climate Change and (VI) South-South Development Cooperation
economic relations among the countries. The programme has contributed to the improvement of infrastructure to enable the development of the resource base of all six countries (see http://www.adb.oeg/GMS; and Ministry of Foreign Affairs, Japan, “Major projects of Japan’s Initiative for the Mekong region development (Dec. 2004 – present)” at: http://www.mofa.go.jp/region/asia-paci/clv/project0512.html).
10 Triangular cooperation projects can also comprise elements of knowledge transfer from developed countries and partial financing from developing countries.
11 The Office of Trade Negotiations of the Caribbean Community (CARICOM) Secretariat — previously called Caribbean Regional Negotiating Machinery — is an example. It proved very successful in representing the interests of the small Caribbean States in their international trade negotiations at the bilateral, regional and multilateral level. It has the responsibility for the coordination, development and execution of negotiating strategies for all the Community’s external trade negotiations.
12 Pooling LDCs’ and low-income countries’ political and institutional resources can be fruitful not only in development cooperation negotiations, but also in those that deal with other areas such as trade, FDI, other capital flows and migration.
13 So far, resource-based manufactures such as aluminium, iron and steel, which are among Africa’s leading exports to China and India, are limited to non-LDCs in Africa, mostly Ghana, Nigeria and South Africa (Broadman, 2007).
14 The plan to merge the Southern African Development Community (SADC), the Common Market for Eastern and Southern Africa (COMESA) and the East African Community (EAC), announced in 2008, is one step towards the rationalization of African RTAs. The question remains if and how it will be implemented.
15 Redistribution of import duty is especially important when most revenues are collected by a larger economy within an RTA and the weaker members receive a larger share of revenues than their share in imports, as done in the Southern African Customs Union (SACU) and the West African Economic and Monetary Union (UEMOA).
16 The European Union (EU) provides an outstanding example of how asymmetries can be treated within an RTA (e.g. through its cohesion funds, and regional development programmes).
17 Intraregional or pan-regional cumulation enables sourcing of inputs from any members, thereby facilitating backward and forward linkages among RTA partners, or among LDCs.
18 It has been suggested that the excessively stringent rules of origin required in order to benefit from the EU’s Everything But Arms (EBA) initiative are a major reason why it did not have a substantial impact in boosting LDC exports (Brenton, 2003).
19 For an example of the anti-diversification effect of European preferential schemes, see Gamberoni, 2007.
20 For instance, the Institute of African Studies of the Zhejiang Normal University in China, founded in 2007, could serve as a platform for knowledge sharing on development policies and strategies between China and African LDCs.
21 There are already eight sugar plants in the Sudan, covering a total area of 100,000 hectares.
22 See: http://www.clacc.net. In 2006, the Convention on Biological Diversity began the process of formulating a four-year plan of action on South-South Cooperation for biodiversity conservation.
ReferencesAfrica Partnership Forum (2009). Carbon finance in Africa. Paper presented at the Special
Session on Climate Change hosted by the United Nations Economic Commission for Africa in Addis Ababa, 3 September.
Amsden AH (2003). The Rise of “The Rest”. Challenges to the West from Late-Industrializing Economies. Oxford, Oxford University Press.
Baer P, Athanasiou T and Kartha S (2008). The right to development in a climate constrained world: The Greenhouse Development Rights Framework. Available at: http://www.ecoequity.org/GDRs.
Bell M (2007). Technological learning and the development of production and innovative capacities in the industry and infrastructure sectors of the least developed countries: What Roles for ODA? Study prepared for UNCTAD as a background document to The Least Developed Countries Report 2007. Geneva, United Nations Conference on Trade and Development. Available at: http://www.unctad.org/sections/ldc_dir/docs/ldcr2007_Bell_en.pdf.
Bredenkamp H and Pattillo C (2010). Financing the response to climate change. IMF Staff Position Note, SPN10/06, 25 March. Washington, DC, International Monetary Fund.
Brenton P (2003). Integrating the least developed countries into the world trading system: The current impact of EU preferences under Everything but Arms. World Bank Policy Research Working Paper, No.3018, April. Washington, DC, World Bank.

The Least Developed Countries Report 2010256
Broadman HG (2007). Africa’s Silk Road: China and India’s New Economic Frontier. Washington, DC, World Bank.
Clifton S-J (2009). Dangerous Obsession: The Evidence against Carbon Trading and for Real Solutions to Avoid a Climate Crunch. A Research Report. London, Friends of the Earth. Available at: http://www.foe.co.uk/resource/reports/dangerous_obsession.pdf.
Copenhagen Accord (2009). Draft decision -/CP.15 Proposal by the President, Copenhagen Accord. Conference of the Parties Fifteenth session, Copenhagen, 7–18 December 2009. Agenda item 9. High-level segment, UNFCCC 1F8C CDCec/CemP/b2e0r0 290/0L9.7. Available at: http://unfccc.int/resource/docs/2009/cop15/eng/l07.pdf.
Cotula L, Vermeulen S, Leonard R and Keeley J(2009). Land Grab or Development Opportunity? Agricultural Investment and International Land Deals in Africa. London and Rome, International Institute for Environment and Development, Food and Agriculture Organization of the United Nations and International Fund for Agricultural Development.
DANIDA (2009): Joint external evaluation: Operation of the least developed countries fund for Adaptation to Climate Change. September, 2009. Published by the Evaluation Department, Ministry Of Foreign Affairs/DANIDA, Denmark. Available at: www.evaluation.dk.
Davies M (2008). China’s developmental model comes to Africa. Review of African Political Economy, 35(1), March: 134–137.
Daviet F (2009). Legally REDD: Building readiness for REDD by supporting developing countries in the fight against illegal logging. WRI Working Paper. Washington, DC, World Resources Institute.
Elliott KA (2009). Opening markets for poor countries: Are we there yet? Washington, DC, Center for Global Development, May.
FAO, UNDP and UNEP (2009). UN collaborative programme on reducing emissions from deforestation and forest degradation in developing countries. UN-REDD: Framework Document, 20 June 2008. New York and Rome, Food and Agriculture Organization of the United Nations, United Nations Development Programme and United Nations Environment Programme.
Fordelone,TY (2009). Triangular co-operation and aid effectiveness. Paper prepared for the Policy Dialogue on Development Co-operation in Mexico City, 28–29 September 2009. Paris, Organisation for Economic Co-operation and Development.
FOEI (2008). REDD Myths: A Critical Review of Proposed Mechanisms to Reduce Emissions from Deforestation and Degradation in Developing Countries. Issue 114, December. Amsterdam, Friends of the Earth International.
Gallagher K (2009). The economic crisis and the developing world: What next? Interview with Robert Wade and José Antonio Ocampo. Challenge, 52(1): 27–39.
Gallini N and Scotchmer S (2002). Intellectual property: When is it the best incentive system? In: Jaffe AB, Lerner J and Stern S, eds., Innovation Policy and the Economy, vol.2. NBER Book Series Innovation Policy and the Economy. Cambridge, MA and London: MIT Press: 51–78.
Gamberoni E (2007). Do unilateral trade preferences help export diversification? An investigation of the impact of European unilateral trade preferences on the extensive and intensive margin of trade. HEI Working Paper No: 17/2007. Geneva, Graduate Institute of International Studies.
Gehl Sampath P and Kozul-Wright Z (2010). Addressing the growing technological divide: Urgent needs, urgent solutions. Globelics paper (unpublished).
Gehl Sampath P (2010). Reconfiguring Global Health Innovation. London, Routledge.Gehl Sampath P and Spenneman C (2010). Local production and related technology transfer in
the local pharmaceutical sector: The case of Uganda. A study by UNCTAD.Griffith-Jones S, Griffith-Jones D and Hertova D (2008). Enhancing the role of regional
development banks. G-24 Discussion Paper Series, no.50, July. Geneva, United Nations Conference on Trade and Development.
Griffith-Jones S, Hedger M and Stokes L (2009). The role of private investment in increasing climate friendly technologies in developing countries. Background paper for the World Economic and Social Survey 2009: Promoting Development, Saving the Planet. New York, United Nations Department of Economic and Social Affairs.
Horta K (2009). Global climate change politics in the Congo Basin. Berlin, Heinrich Böll Stiftung. Available at: http://www.boell.de/downloads/Climate_Politics_Congo_Basin_K_Horta.pdf.
Kaplinsky R and Farooki M (2009). Africa›s cooperation with new and emerging development partners: Options for Africa›s development. New York, United Nations Office of the Special Adviser on Africa.
Khor M (2008). Some key issues for the post-Bali climate process. TWN Climate Change Series 1, February. Penang, Third World Network.
Kowalski P and Shepherd B (2006). South-South trade in goods. OECD Trade Policy Working Paper, no.40, October. Paris, Organisation for Economic Co-operation and Development.

257An Agenda for Action: (V) Climate Change and (VI) South-South Development Cooperation
Landau J-P (2004). Landau report on innovative financing. Commissioned by the Government of France, December 2004. Available at: http://www.cttcampaigns.info/documents/fr/landau_en/Landau1.pdf/view?searchterm=landau.
LEG (2005). Elements for implementation strategies for national adaptation programmes of action. UNFCCC/TP/2005/5, 2 August 2005. Bonn, LDC Expert Group.
Meinzen-Dick R and Markelova H (2009). Necessary nuance: Toward a code of conduct in foreign land deals. In Kugelman M and Levenstein SL, eds., Land Grab? The Race for the World’s Farmland. Washington, DC, Woodrow Wilson International Center for Scholars: 69–84.
Milner C, Morrissey O and Zgovu E (2008). Trade facilitation in developing countries. Credit Research Paper, No.08/05. Nottingham, Centre for Research in Economic Development and International Trade, University of Nottingham.
Müller B (2008). International adaptation finance: The need for an innovative and strategic approach. Background Paper for the Climate Strategies Project on Energy and Climate: Opportunities for the G8 Toyako Summit, June 2008. Oxford, Oxford Institute for Energy Studies.
Myers Madeira EC (2008). Policies to Reduce Emissions from Deforestation and Degradation (REDD) in Developing Countries: An Examination of the Issues Facing the Incorporation of REDD into Market-based Climate Policies. Washington, DC, Resources for the Future.
Noland M and Pack H (2003). Industrial Policy in an Era of Globalization. Washington, Institute for International Economics.
OECD (2009). Policy Guidance: Integrating Climate Change into Development Co-operation. Paris, Organisation for Economic Co-operation and Development.
Oyelaran-Oyeyinka B and Gehl Sampath P (2010). Latecomer Development: States, Knowledge and Economic Growth. Routledge Studies in Development Economics. London, Routledge.
Porter G, Bird N, Kaur N and Peskett L (2008). New Finance for Climate Change and the Environment. London and Berlin, Worldwide Fund for Nature (WWF) and Heinrich Böll Stiftung.
Sanchez A and Poschen P (2009). The social and decent work dimensions of a new agreement on climate change: A technical brief. International Labour Office Policy Integration Department, June. Geneva, International Labour Office.
Socolow R (2006). Stabilization wedges: Mitigation tools for the next half-century. Keynote address, World Bank Energy Week, World Bank, Washington, DC, 6 March 2006.
South Centre (2009). Developed country initiatives weaken the UNFCCC. Analytical Note SC/GGDP/AN/ENV/7, January. Geneva, South Centre.
Stern N, Romani M, Bohannon M, Bowen A, Zenghelis D and Kaminskaite-Salters G (2009). Meeting the climate challenge: Using public funds to leverage private investment in developing countries. London, Grantham Research Institute for Climate Change and the Environment, London School of Economics and Political Science.
Tan C (2010). Towards a new international development architecture for meeting the financial challenges of the climate crisis in least developed countries. Study prepared for UNCTAD as a background document to The Least Developed Countries Report 2010. Geneva, United Nations Conference on Trade and Development.
Third World Network (2010). Draft TWN analysis on the Copenhagen Accord. Penang, Third World Network, 3 January.
UNCTAD (2001). Home Country Measures. UNCTAD Series on Issues in International Investment Agreements. New York and Geneva, United Nations Conference on Trade and Development.
UNCTAD (2003). Foreign Direct Investment and Performance Requirements: New Evidence from Selected Countries. New York and Geneva, United Nations Conference on Trade and Development.
UNCTAD (2005). Trade and Development Report 2005: New Features of Global Interdependence. United Nations publication, sales no. E.05.II.D.13. New York and Geneva, United Nations Conference on Trade and Development.
UNCTAD (2006), The Least Developed Countries Report, 2006: Global Partnership and National Strategies for Development. United Nations publication, sales no. E.06.II.D.9. New York and Geneva, United Nations Conference on Trade and Development.
UNCTAD (2007). The Least Developed Countries Report 2007: Knowledge, Technological Learning and Innovation for Development. United Nations publication, sales no. E.07.II.D.8. New York and Geneva, United Nations Conference on Trade and Development.
UNCTAD (2008). The Least Developed Countries Report, 2008: Growth, Poverty and the Terms of Development Partnership. United Nations publication, sales no. E.08.II.D.20. New York and Geneva, United Nations Conference on Trade and Development.
UNCTAD (2009a). Economic Development in Africa Report 2009: Strengthening Regional Economic Integration for Africa’s Development. United Nations publication, sales no. E.09.II.D.7. New York and Geneva, United Nations Conference on Trade and Development.
The Least Developed Countries Report 2010258
UNCTAD (2009b). World Investment Report 2009: Transnational Corporations, Agricultural Production and Development. United Nations publication, sales no. E.09.II.D.15. New York and Geneva, United Nations Conference on Trade and Development.
UNCTAD (2010 ). Principles for Responsible Agricultural Investment that Respects Rights, Livelihoods and Resources. A discussion note prepared by FAO, IFAD, the UNCTAD Secretariat and the World Bank Group to contribute to an ongoing global dialogue. (TD/B/C.II/CRP.3). Geneva, United Nations Conference on Trade and Development, 16 April. Available at: http://www.unctad.org/en/docs/ciicrp3_en.pdf.
UN-DESA (2009). World Economic and Social Survey 2009: Promoting Development, Saving the Planet. United Nations publication, sales no. E.09.II.C.1. New York, United Nations.
UNDP (2007). Human Development Report 2007/2008: Fighting Climate Change: Human Solidarity in a Divided World. New York, United Nations Development Programme.
UNECA (2004). Assessing Regional Integration in Africa (ARIA I). ECA Policy Research Report. Addis Ababa, Economic Commission for Africa.
UNECA (2006). Assessing Regional Integration in Africa II (ARIA II): Rationalizing Regional Economic Communities. Addis Ababa, Economic Commission for Africa.
UNECA (2010). Assessing Regional Integration in Africa IV (ARIA IV): Enhancing Intra-African Trade. Addis Ababa, Economic Commission for Africa.
UNEP (2009). Financing a global deal on climate change. A green paper by the UNEP Finance Initiative Climate Change Working Group, June. New York, United Nations Environment Programme.
UNFCCC (2007). Investment and financial flows to address climate change. Bonn, United Nations Framework Convention on Climate Change Secretariat.
UNFCCC (2008). Investment and financial flows to address climate change: An update, FCCC/TP/2008/7, 26 November. Bonn, United Nations Framework Convention on Climate Change Secretariat.
UNFCCC (2009). Financing climate action: Investment and financial flows for a strengthened response to climate change. Fact Sheet, June. Bonn, United Nations Framework Convention on Climate Change Secretariat.
Water for Agriculture and Energy in Africa (2008). Hydropower resource assessment of Africa. Ministerial Conference on Water for Agriculture and Energy in Africa: the Challenges of Climate Change, held in Sirte, Libyan Arab Jamahiriya, 15–17 December 2008. Available at: http://www.sirtewaterandenergy.org/docs/2009/Sirte_2008_BAK_3.pdf.
World Bank (2006). Strengthening forest law enforcement and governance: Addressing a systemic constraint to sustainable development. Report No. 36638-GLB, August. Washington, DC, World Bank.
Worldwatch Institute (2009). 2009 State of the World: Into a Warming World. Available at: www. worldwatch.org/node/5984.

Printed at United Nations, GenevaGE.10-00000–October 2010–8,625
UNCTAD/LDC/2010
United Nations publicationSales No E.10.II.D.5ISBN 978-92-1-112813-0ISSN 0257-7550
������������ ������� ����� � �������������������������������������������������������������������������� �� ������������������ ���������������������������� ����������������������������� ���������������������������� ����� ����� ������ ��� ���� ������ ���������������������������������� ���������� ��� ����� ��� ���� ����������������� ��������������� ������������������ �������� ���������� ������������������� ������������ ������������������������ �� ����������������������� � ���������������� ������������������������� ��������� !"#�$������������������������������ �������� ���
%������������ ����� �������� ���������������������� ��������������������������!"#������������������������������� ������������������������� ���������������������������������������������������� ���� ����� � ������� ���� ������ ��� ������� ������� ��� ������� �������� ��� ������ ��������� ��� ����������������������������������������������&''&(&'')��������������������� �����������������*����������"�����������+������������������������������������� ������������ ���������������������������������������� ���� ����� ,-".$���������!"#��������/� $������������������������0������������������ ������������������������������� � ������������1� $����������������������� ��������� ����� ������������������� �������� �������� ���������������������������������������������������������1���� $��������������� ���������������������!"#��������
����������������������������2� ������ ���� ���������������������������������������������������������� ���������������������������!"#���������������������3�������������������������������������� ������� �������� ���������� ���� 2�� �������� ����� ���������� �� ������� �� ��������� ������� ������������������������,-".����������������������� ������������������������������������������������������������������������� ��� ������������ ������������������������������ �������� ������������������� �� ��������
����,-".�����!"#�������������������� ���� ��������������������������������������������������������� ��������� ����������������������� ���������� �������������������������� ����� ������������������������ ���� ��������������������� ��������������������-���������� ������������������/� $���������������������� ����� ������������ ������ ������� ����������������������������� ��������!"#�1���� $������������������������������������ ������������������������� ������� -3*�$���������!"#���������������������������� �� ����� ����� ����������������������������-� �������3�����3����� ������������ 4������� ������ 5"-�� ��� ��� ��� �� ��� ���������� ���� ������ ���� 3�����3����� ����������� ���� ������� �������� ��� ������� !"#�� ��� ������ ������������ ����������� ���������� ���������������������������������,-".�����!"#���
���� ������� ��������� ���� �2��� ������� ��� ���� ,-"./� ��� ��� ������ ������������ �� ��������� ��� ������ ���������������������������.����������������� ������������������!"#����������������������������������������������������������������������������� ������������,-".�����!"#�����������������-���������������������������2�������������������� ���������������5������6������,������#������� �����!����"���������#���������������������������������&'77��#����������������������������������������!"#����������������������������������������� ����� �������������� ����������������������������� ��� �� ������� ������������ ��� ���� ��� ���� ����� ������� ��������� � ���� ���� ������������ ����������������
FRONT COVER Previous LDC Reports have showcased art from LDCs. For the front cover of this Report, a painting by Léopol Lindor, a Haitian artist, has been selected, as the Haitian earthquake illustrates the ������������� �������������������� �������������������������������������� �������������a catastrophic event analogous to an earthquake, which not only wreaks devastation, but also offers an opportunity for reconstruction and a new beginning. The image is reproduced with permission.