LCWS2013 (Asian Region) CFS 12th November 2013 1 Experimental Hall 3D deformation analysis Asian...
29
LCWS2013 (Asian Region) CFS 12th November 2013 1 Experimental Hall 3D deformation analysis Asian Region Design CONVENTIONAL FACILITIES AND SITING
-
Upload
melanie-cole -
Category
Documents
-
view
216 -
download
0
Transcript of LCWS2013 (Asian Region) CFS 12th November 2013 1 Experimental Hall 3D deformation analysis Asian...

LCWS2013 (Asian Region) CFS
12th November 2013
1
Experimental Hall 3D deformation analysis
Asian Region Design
CONVENTIONAL FACILITIESAND SITING

LCWS2013 (Asian Region) CFS
12 November 2013
Contents
Study 1 : Excavation analysis
Evaluate the distribution of loosened zone around E/H TDR designed E/H dimension Parametric study because rock mass properties and initial
ground stress are under now investigation
Study 2 : Bedrock displacement installing Detector
Evaluate the influence of vertical displacement at E/H bottom floor and surrounding area by push-pulling of detectors
Detectors are heavy but lighter than excavated rock mass weight.
Behavior of displacement is almost elastic. Total weight of excavated rock mass : 350,000 tons at least
950m2 x 142m x 2.65 ton/m3= 357,000 tons Detectors weight : 25,000 tons
2
Study 1 : Excavation analysis

LCWS2013 (Asian Region) CFS
12 November 2013
Design of Experimental Hall of Asian site
3
Cavern Dimension
Main hall H 42.0mW 25.0mL 142.0m
Alcoves H20.5mW 20.0mL 12.5m
UT cavern H 13.5mW 15.0mL 70.0m
Study 1 : Excavation analysis
142m
25m
42m
142m Main Cavern Alcoves ILD
Upper AT
Lower AT
Lower AT
Alcoves SiD
Beam tunnel
20m 20m
Utility Cavern
18m 20.5m
25m
12.5m
12.5m

LCWS2013 (Asian Region) CFS
12 November 2013
Analysis conditions• Analysis method :
– 3D Elastic FEM analysis considering excavation step– Deformation modulus at fractured elements reduced to
one-100th by every excavation step considering plasticity.
• Model size : – H450m x W900 x L900m– Overburden : 200m
4
450m
900m
200m
Study 1 : Excavation analysis
Y
Y
X
X
Z
Z

LCWS2013 (Asian Region) CFS
12 November 2013
Assumption of Rockmass properties
High class Middle class Lower classDensity 26.5 kN/m3 26.5 kN/m3 26.5 kN/m3
Deformation modulus 10.0 GPa 5.0 GPa 2.5 GPaPoisons ration 0.3 0.3 0.3Shear strength 4.0+σtan60° MPa 2.5+σtan55° MPa 1.2+σtan45° MPa
Deformation modulus for analysis set to three classes “H, M, L” considering candidate site rock condition. Share strength is assumed by relationship between properties of previous other granite investigation.
0 2 4 6 8 100
1
2
3
4
5
Deformation modulus GPa
Cohe
sion
MPa
0 2 4 6 8 100
10
20
30
40
50
60
70
Deformation modulus GPa
Angl
e of
inte
rnal
fricti
on d
eg
0 2 4 6 8 100
1
2
3
4
5
6
Deformation modulus GPa
P-w
ave
velo
sity
km/s
0 2 4 6 8 100
1
2
3
4
5
Deformation modulus GPa
S-w
ave
velo
sity
km/s
5
Predicted P wave velocity
Study 1 : Excavation analysis

LCWS2013 (Asian Region) CFS
12 November 2013
Borehole logging test at investigation borehole near E/H site
6
P-wave velocity logging
Planned installation depth
Electrical logging
Study 1 : Excavation analysis
Value of electrical resistivity
m/sec Ω m2/m
Spacing electrodes are 0.25-4.0m

LCWS2013 (Asian Region) CFS
12 November 2013
Ground stress
Case σxBeam line
σyE/H axis
σzVertical
Isotropic Stress-A 1 1 1Anisotropic Stress-B 2 2 1
Stress-C 2 1 1Stress-D 1 2 1
• Isotropic case but Anisotropic cases– Horizontal stress is larger than vertical stress in case of candidate site condition by
some reports• Desirable for E/H direction and max. principle stress direction are same
σx
σz
σy
σy
σx
σz
7
Study 1 : Excavation analysis

LCWS2013 (Asian Region) CFS
12 November 2013 8
Ground stress test at investigation borehole near E/H site
Horizontal stress is larger than vertical stress 1.2-1.8 times
Longitudinal direction of E/H
Study 1 : Excavation analysis
Direction N E S W NK = σH/σzGround stress MPa
Dep
th m
Dep
th m

LCWS2013 (Asian Region) CFS
12 November 2013
Loosened zone around cavern
Loosening around cavern is caused by stress releasing and blasting.
notes
Blasting Usually 1-2m from cavern surfaceControlled blasting methods- Presplit blasting- Smooth blasting- Cushion blasting
Stress releasing
Depend on- Cavern size- Rock properties- Initial stress
In case of large cavern, loosened area by stress releasing is wider.
Definition of loosened zone by stress releasingLoosened zone 1.0 < sf. <1.2 plastic not elasticFractured zone Sf. < 1.0
Shear Strain
Elastic zone
Plastic zoneShea
r St
ress
Fracturing stress F/S
Hard rock case
Rock characteristics are almost elastic. Y/S is very near F/S
Yield stress Y/S
9
Study 1 : Excavation analysis
stressshear
strengthshearsffactorSafty
_
_:_

LCWS2013 (Asian Region) CFS
12 November 2013
Excavation procedure (Bench program)
1st stepInitial stress analysis
2nd stepUpper A/T and Arch of E/H
3rd stepLower A/T and Evc/T
4th stepBench of E/H middle part
5th stepArch of alcoves
6th stepBench of E/H bottom part
Excavation analysis is by six steps as shown on a figure, to roughly understand the variation of stress and deformation on each step. Actual excavation procedure will be more complicated.
10
Study 1 : Excavation analysis
25.000 25.000 25.000
25.000 25.000 25.000

LCWS2013 (Asian Region) CFS
12 November 2013
Excavation procedure (Bench program)
1st stepInitial stress analysis
2nd stepUpper A/T and Arch of E/H
3rd stepLower A/T and Evc/T
4th stepBench of E/H middle part
5th stepArch of alcoves
6th stepBench of E/H bottom part
11
Study 1 : Excavation analysis

LCWS2013 (Asian Region) CFS
12 November 2013
Displacement
12
x:y:z=1:1:1x:y:z=2:2:1x:y:z=2:1:1x:y:z=1:2:1
2 3 4 5 6 7 8 9 10 110
20
40
60
80
100
120
140
160
180
200
Stress AStress BStress CStress D
Deformation modulus (GPa)
Disp
lace
men
t (m
m)
B3 sectionVertical displacement of Arch
B3 sectionVertical displacement of Arch
2 3 4 5 6 7 8 9 10 110
20
40
60
80
100
120
140
160
180
200
Stress AStress BStress CStress D
Deformation modulus (GPa)
Disp
lace
men
t (m
m)
B3 sectionSide wall displacement
B3 sectionSide wall displacement
x:y:z=1:1:1x:y:z=2:2:1x:y:z=2:1:1x:y:z=1:2:1
A1
B 1 B2 B3
B 1 B2 B3
A1
• In case of stress B and C, side wall displacement will be larger relatively.
• Because ground stress of cross section direction is larger.
• But displacements in good rock condition are absolutely small in each case.
Study 1 : Excavation analysis

LCWS2013 (Asian Region) CFS
12 November 2013
2 3 4 5 6 7 8 9 10 110
5
10
15
Stress-A
Stress-B
Stress-C
Stress-D
Deformation modulus (GPa)
Wid
th o
f loo
send
are
a (m
)
2 3 4 5 6 7 8 9 10 110
5
10
15
20
25
Stress-A
Stress-B
Stress-C
Stress-D
Deformation modulus (GPa)
Wid
th o
f loo
send
are
a (m
)
2 3 4 5 6 7 8 9 10 110
1
2
3
4
5
6
Stress-A
Stress-B
Stress-C
Stress-D
Deformation modulus (GPa)
Wid
th o
f loo
send
are
a (m
)
Distribution of loosened zone
13
Study 1 : Excavation analysis
Section B3arch
Section B3arch
Section B3Side wall
Section B3Side wallSection A1
End wallSection A1End wall
x:y:z=1:1:1
x:y:z=2:2:1
x:y:z=2:1:1
x:y:z=1:2:1
x:y:z=1:1:1
x:y:z=2:2:1
x:y:z=2:1:1
x:y:z=1:2:1
x:y:z=1:1:1
x:y:z=2:2:1
x:y:z=2:1:1
x:y:z=1:2:1
X
Z
Y
Y
X
Z

LCWS2013 (Asian Region) CFS
12 November 2013
Loosened zone / Section A1 / H-class
14
Study 1 : Excavation analysis
Section A1Stress-A x:y:z=1:1:1
Section A1Stress-A x:y:z=1:1:1
Section A1Stress-B x:y:z=2:2:1
Section A1Stress-B x:y:z=2:2:1
Section A1Stress-C x:y:z=2:1:1
Section A1Stress-C x:y:z=2:1:1
Section A1Stress-D x:y:z=1:2:1
Section A1Stress-D x:y:z=1:2:1
3.6m
4.7m
1 . 2 m
1 . 2 m

LCWS2013 (Asian Region) CFS
12 November 2013
Loosened zone / Section A1 / M-class
15
Study 1 : Excavation analysis
1.2m
1.2m
6.8m
5.6m
1.6m
Section A1Stress-A x:y:z=1:1:1
Section A1Stress-A x:y:z=1:1:1
Section A1Stress-B x:y:z=2:2:1
Section A1Stress-B x:y:z=2:2:1
Section A1Stress-C x:y:z=2:1:1
Section A1Stress-C x:y:z=2:1:1
Section A1Stress-D x:y:z=1:2:1
Section A1Stress-D x:y:z=1:2:1

LCWS2013 (Asian Region) CFS
12 November 2013
Loosened zone / Section A1 / L-class
16
Study 1 : Excavation analysis
8.8m
4.9m
3.7m
10.8m
4.1m
1.8m
3.8m
6.6m
Section A1Stress-A x:y:z=1:1:1
Section A1Stress-A x:y:z=1:1:1
Section A1Stress-B x:y:z=2:2:1
Section A1Stress-B x:y:z=2:2:1
Section A1Stress-C x:y:z=2:1:1
Section A1Stress-C x:y:z=2:1:1
Section A1Stress-D x:y:z=1:2:1
Section A1Stress-D x:y:z=1:2:1

LCWS2013 (Asian Region) CFS
12 November 2013
Loosened zone / Section B1 / H-class
17
Study 1 : Excavation analysis
1.2m
1.2m
Section B1Stress A x:y:z=1:1:1Section B1Stress A x:y:z=1:1:1
Section B1Stress B x:y:z=2:2:1Section B1Stress B x:y:z=2:2:1
Section B1Stress C x:y:z=2:1:1Section B1Stress C x:y:z=2:1:1
Section B1Stress D x:y:z=1:2:1Section B1Stress D x:y:z=1:2:1
1. 2 m
1. 2 m

LCWS2013 (Asian Region) CFS
12 November 2013
Loosened zone / Section B1 / M-class
18
Study 1 : Excavation analysis
1.8m
4.7m
1.6m
5.3m
1.6m
Section B1Stress A x:y:z=1:1:1Section B1Stress A x:y:z=1:1:1
Section B1Stress B x:y:z=2:2:1Section B1Stress B x:y:z=2:2:1
Section B1Stress C x:y:z=2:1:1Section B1Stress C x:y:z=2:1:1
Section B1Stress D x:y:z=1:2:1Section B1Stress D x:y:z=1:2:1

LCWS2013 (Asian Region) CFS
12 November 2013
Loosened zone / Section B1 / L-class
19
Study 1 : Excavation analysis
2.6m
7.3m
4.1m
9.4m
4.1m
13.4m
4.1m
6.5m
Section B3Stress A x:y:z=1:1:1Section B3Stress A x:y:z=1:1:1
Section B3Stress B x:y:z=2:2:1Section B3Stress B x:y:z=2:2:1
Section B3Stress C x:y:z=2:1:1Section B3Stress C x:y:z=2:1:1
Section B3Stress D x:y:z=1:2:1Section B3Stress D x:y:z=1:2:1

LCWS2013 (Asian Region) CFS
12 November 2013
Loosened zone / Section B3 / H-class
20
Study 1 : Excavation analysis
Section B3Stress A x:y:z=1:1:1Section B3Stress A x:y:z=1:1:1
Section B3Stress B x:y:z=2:2:1Section B3Stress B x:y:z=2:2:1
Section B3Stress C x:y:z=2:1:1Section B3Stress C x:y:z=2:1:1
Section B3Stress D x:y:z=1:2:1Section B3Stress D x:y:z=1:2:1

LCWS2013 (Asian Region) CFS
12 November 2013
Loosened zone / Section B3 / M-class
21
Study 1 : Excavation analysis
1.2m
6.7m
Section B3Stress A x:y:z=1:1:1Section B3Stress A x:y:z=1:1:1
Section B3Stress B x:y:z=2:2:1Section B3Stress B x:y:z=2:2:1
Section B3Stress C x:y:z=2:1:1Section B3Stress C x:y:z=2:1:1
Section B3Stress D x:y:z=1:2:1Section B3Stress D x:y:z=1:2:1
4.9m
1.2m

LCWS2013 (Asian Region) CFS
12 November 2013
Loosened zone / Section B3 / L-class
22
Study 1 : Excavation analysis
1.8m
7.5m
4.9m
12.4m
20.3m
3.7m
4.1m
9.4m
Section B3Stress A x:y:z=1:1:1Section B3Stress A x:y:z=1:1:1
Section B3Stress B x:y:z=2:2:1Section B3Stress B x:y:z=2:2:1
Section B3Stress C x:y:z=2:1:1Section B3Stress C x:y:z=2:1:1
Section B3Stress D x:y:z=1:2:1Section B3Stress D x:y:z=1:2:1

LCWS2013 (Asian Region) CFS
12 November 2013
Analysis conditions• Estimation of displacement distribution around E/H
by installing or push-pulling Detectors.• Rock mass deformation modulus : 5 GPa• Analysis method : 3D Elastic FEM analysis• Displacement is inversely proportional to
deformation modulus because of elastic analysis.• Model size :
– H450m x W900 x L900m– Overburden : 200m
23
450m
900m
200m
Study 2 : Displacement by Detectors movement
ILD Detector
SiD Detector

LCWS2013 (Asian Region) CFS
12 November 2013
Subject 2: Loading condition (Detector position)
Detector ILD or SiD
ILDILD off-lineSiD on-line
SiD
Loading condition LSO
Concrete pallet20m*20m*t3mConcrete slabt=3m
ILD SiD
Loading condition LOS
Both off-line
ILD SiD
Loading condition OLS
ILD on-lineSiD o ff -line
ILD weight : 15,000 tonsSiD weight : 10,000 tons
• Detectors are installed on concrete pallets.
• Thickness of concrete pallets are assumed as 3m.
• Detector weight are loaded on the pallet as a uniformly-distributed load
SiD
Loading condition OOS
SiD installation
ILD
Loading condition LOO
ILD installation
24
Study 2 : Displacement by Detectors movement

LCWS2013 (Asian Region) CFS
12 November 2013
LOO OOS LOS OLS LSO
ILD 1.16mmSiD ---
ILD ---SiD 0.63mm
ILD 1.20mmSiD 0.69mm
ILD 1.28mmSiD 0.88mm
ILD 1.24mmSiD 0.84mm
Base concrete slab displacement by placing detectors
25
Max displacement of ILD is 1.28mm, “OLS” case : ILD online caseMax displacement of SiD is 0.84mm, “LSO” case : SiD online case
Study 2 : Displacement by Detectors movement
Rock mass Deformation modulus : 5GPaConcrete Young’s modulus :25GPa

LCWS2013 (Asian Region) CFS
12 November 2013 26
Displacement distribution of E/H bottom level
-200 -150 -100 -50 0 50 100 150 200-2.0
-1.5
-1.0
-0.5
0.0
0.5
Bottom Level Line-Y00
LOOOOSLOSLSOOLS
y-axis (m)
Verti
cal d
ispla
cem
ent (
mm
)
Study 2 : Displacement by Detectors movement
Deformation modulus : 5GPa
LCWS2013 (Asian Region) CFS
12 November 2013
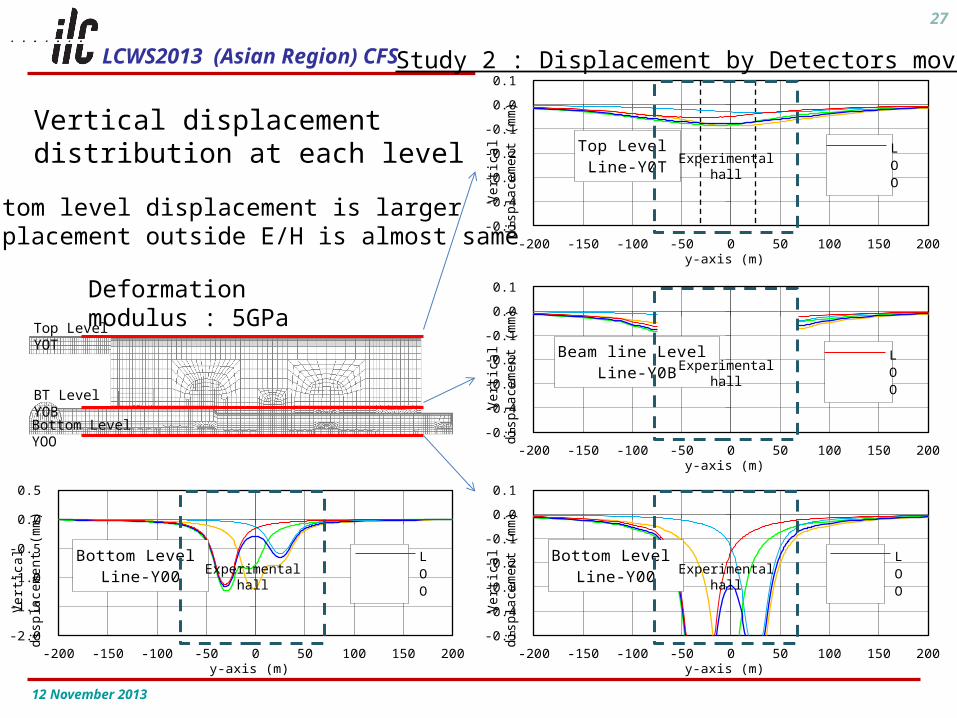
Vertical displacement distribution at each level
27
Top Level YOT
Bottom Level YOO
BT Level YOB
-200 -150 -100 -50 0 50 100 150 200-0.5
-0.4
-0.3
-0.2
-0.1
0.0
0.1
Beam line Level Line-Y0B L
OO
y-axis (m)
Verti
cal d
ispla
cem
ent (
mm
)
-200 -150 -100 -50 0 50 100 150 200-0.5
-0.4
-0.3
-0.2
-0.1
0.0
0.1
Top Level Line-Y0T L
OO
y-axis (m)
Verti
cal d
ispla
cem
ent (
mm
)
-200 -150 -100 -50 0 50 100 150 200-0.5
-0.4
-0.3
-0.2
-0.1
0.0
0.1
Bottom Level Line-Y00 L
OO
y-axis (m)
Verti
cal d
ispla
cem
ent (
mm
)
-200 -150 -100 -50 0 50 100 150 200-2.0
-1.5
-1.0
-0.5
0.0
0.5
Bottom Level Line-Y00 L
OO
y-axis (m)
Verti
cal d
ispla
cem
ent (
mm
)
Experimental hall
Experimental hall
Experimental hall
Experimental hall
Bottom level displacement is largerDisplacement outside E/H is almost same
Study 2 : Displacement by Detectors movement
Deformation modulus : 5GPa

LCWS2013 (Asian Region) CFS
12 November 2013
28
Study 2 : Displacement by Detectors movement
Vertical displacement distribution at each cross section
-200 -150 -100 -50 0 50 100 150 200-0.5
-0.4
-0.3
-0.2
-0.1
0.0
0.1
Beam line LevelLine-XBS
LOOOOSLOSLSOOLS
x-axis (m)
Verti
cal d
ispl
acem
ent (
mm
)
-200 -150 -100 -50 0 50 100 150 200-0.5
-0.4
-0.3
-0.2
-0.1
0.0
0.1
Bottom Level Line-X0S
LOOOOSLOSLSOOLS
x-axis (m)
Verti
cal d
ispl
acem
ent (
mm
)
-200 -150 -100 -50 0 50 100 150 200-0.5
-0.4
-0.3
-0.2
-0.1
0.0
0.1
Beam line LeveiLine-XB0
LOOOOSLOSLSOOLS
x-axis (m)Ve
rtica
l dis
plac
emen
t (m
m)
-200 -150 -100 -50 0 50 100 150 200-0.5
-0.4
-0.3
-0.2
-0.1
0.0
0.1
Bottom Level Line-X00
LOOOOSLOSLSOOLS
x-axis (m)
Verti
cal d
ispl
acem
ent (
mm
)
-200 -150 -100 -50 0 50 100 150 200-0.5
-0.4
-0.3
-0.2
-0.1
0.0
0.1
Beam line LevelLine-XBL LOO
OOSLOSLSOOLS
x-axis (m)
Verti
cal d
ispl
acem
ent (
mm
)
-200 -150 -100 -50 0 50 100 150 200-0.5
-0.4
-0.3
-0.2
-0.1
0.0
0.1
Bottom Level Line-X0L
LOOOOSLOSLSOOLS
x-axis (m)
Verti
cal d
ispl
acem
ent (
mm
)
ILD alcove section
Beam line section
ILD alcove section
SiD alcove section
SiD alcove section
Beam line section

LCWS2013 (Asian Region) CFS
12 November 2013
Relative displacement between “LSO” and “OLS” at Beam line elevation
29
Beam line
The area that displacement more than 0.02mm is within around 100m from the beam line.
Study 2 : Displacement by Detectors movement
mm
Deformation modulus : 5GPa