LCT Population Phylogeny Project Manuscripts · peacock and kirchoff 2007 final report 2 analysis...
110
Peacock and Kirchoff 2007 FINAL REPORT 2 ANALYSIS OF GENETIC VARIATION AND POPULATION GENETIC STRUCTURE IN LAHONTAN CUTTHROAT TROUT (ONCORHYNCHUS CLARKI HENSHAWI) EXTANT POPULATIONS FINAL REPORT UNITED STATES FISH AND WILDLIFE SERVICE MARY M. PEACOCK, PH.D. AND VERONICA KIRCHOFF, M.S. DEPARTMENT OF BIOLOGY UNIVERSITY OF NEVADA, RENO RENO, NEVADA 89557 JUNE, 2007
Transcript of LCT Population Phylogeny Project Manuscripts · peacock and kirchoff 2007 final report 2 analysis...
Peacock and Kirchoff 2007 FINAL REPORT
2
ANALYSIS OF GENETIC VARIATION AND POPULATION GENETIC STRUCTURE IN LAHONTAN CUTTHROAT TROUT (ONCORHYNCHUS CLARKI HENSHAWI) EXTANT POPULATIONS
FINAL REPORT
UNITED STATES FISH AND WILDLIFE SERVICE
MARY M. PEACOCK, PH.D.
AND
VERONICA KIRCHOFF, M.S.
DEPARTMENT OF BIOLOGY UNIVERSITY OF NEVADA, RENO
RENO, NEVADA 89557
JUNE, 2007

Peacock and Kirchoff 2007 FINAL REPORT
3
PROJECT OBJECTIVES - SUMMARY
Here we used ten highly variable nuclear microsatellite markers developed specifically for
Lahontan cutthroat trout ((Oncorhynchus clarki henshawi; Peacock et al. 2004) to resolve
evolutionary and contemporary relationships among populations within and among watersheds
within each DPS designation and among DPS’s, that were not resolved with morphological or
other genetic data (Loudenslager and Gall 1980; Gall and Loudenslager 1981; Williams et al.
1992; Williams et al. 1998; Nielsen and Sage 2002). We asked a series of questions with these
data regarding population dynamics and hierarchical phylogenetic relationships. Specifically,
1) Are the current DPS designations that were determined with morphological, meristic,
allozyme, and mitochondrial genetic data consistent with data from microsatellite markers
and more extensive and systematic sampling of extant LCT populations?
Patterns observed with microsatellite data were largely consistent with earlier data sets
delineating three DPSs. Microsatellite data also provided further support for conclusions drawn
from mtDNA data, which suggests that LCT in the Quinn River and Western basin drainages,
primarily the Truckee River basin populations, form a single evolutionary clade with the
Humboldt River populations having diverged from the western basin prior to the split between
the Quinn and remaining Western basin cutthroat populations. These patterns are consistent with
the extent of and inundation by pluvial Lake Lahontan of the Quinn River and the western most
edge of the Humboldt River. Human perturbations have left the Carson and Walker river
populations with low levels of heterozygosity and strong evidence for genetic bottlenecks
Peacock and Kirchoff 2007 FINAL REPORT
4
making reconstruction of phylogenetic relationships among these and other extant LCT
populations inconclusive.
2) Is there evidence for a metapopulation dynamic within the few remaining interconnected
stream habitats within the Lahontan basin across habitat types?
Metapopulations, defined as groups of small, discrete, but interacting populations, are primarily
characterized by an extinction and colonization dynamic. A major assumption of
metapopulation theory is one of independent population dynamics such that extinction and
colonization probabilities are uncorrelated among subpopulations. Long-term persistence
of the subpopulation assemblage is achieved through the juxtaposition of
interconnectedness and independence with extinction risk spread across the landscape.
Marys River and Maggie Creek are two of the few remaining interconnected stream systems that
support LCT. Patterns of population genetic structure in both of these stream networks show that
LCT are divided into subpopulations within these drainages, the number of which are
commensurate with habitat size and complexity. Genetic subdivision, effective population size
differences among subpopulations, and genetic bottlenecks support assumptions underlying
metapopulation theory.
3) What is the population genetic structure of extant populations within and among
watersheds within each DPS?
The Western and Northwestern DPSs have lost the majority of their native LCT populations.
Therefore what we can infer about historical population genetic structure within and among

Peacock and Kirchoff 2007 FINAL REPORT
5
watersheds comes primarily from the extant populations in the Eastern (Humboldt River) DPS,
which has the greatest number of kilometers of occupied habitat. The Humboldt River subbasins
for which we have data - Marys River, North Fork Humboldt River, Rock Creek, Maggie Creek,
Little Humboldt River, and Reese River all flowed historically into the main stem Humboldt
River. None of these subbasins are currently connected due to water diversions. However, we
observe a hierarchy of genetic structure, which reflects past connectedness among streams within
watersheds and among watersheds, such that stream populations within watersheds are
genetically more similar to each other than to streams in neighboring watersheds which are in
turn are more similar to geographically proximate watersheds than more distance watersheds.
Stream populations in the North Fork Little Humboldt River – Gance Creek, Foreman Creek and
the North Fork Humboldt River – which were interconnected prior to European settlement, show
a pattern of genetic population structure that is similar to the LCT populations found in the
interconnected streams systems of Marys River and Maggie Creek. The Quinn River populations
are much more genetically distinct from each other, but most are also very small and genetically
bottlenecked (e.g., Washburn and Crowley creeks).
There is a striking pattern that emerges when all streams populations are considered. Once
stream habitat is of sufficient size fish begin to assort themselves within streams such that
population genetic structure emerges – i.e., distinct genoptype clusters appear with streams. This
pattern together with levels of genetic variability maintained within populations could be used as
a monitoring tool for efficacy of restoration efforts.
Peacock and Kirchoff 2007 FINAL REPORT
6
4) What is the likely origin of out-of-basin transplanted LCT populations putatively from
the Lake Tahoe-Truckee River basin (pre-extirpation) based upon genetic comparison with
extant LCT populations and museum preserved samples of LCT collected from 1872-1911
from the lower Truckee River and multiple locations in Lake Tahoe?
LCT populations found in Morrison and Bettridge creeks in the Pilot Peak range in Utah,
Macklin Creek in the Yuba River drainage of California, Edwards Creek in the Desatoya
Mountains of central Nevada and O’Harrel Creek in the eastern Sierra Nevada Mountains are
outplanted populations with hypothesized origins in the Truckee and Walker (O’Harrel Creek)
river basins respectively. The Pilot Peak broodstock and Bettridge creek populations were
derived from the Morrison Creek population and are definitively of Truckee River basin ancestry.
Phylogenetic analyses place these LCT populations as the most closely related populations to the
known Truckee River basin historical samples obtained from museum collections with high
bootstrap support (71%). All LCT populations that were sampled range-wide for this study were
included in the phylogenetic analyses conducted for this study. The majority of extant native
populations were sampled for this analysis, which is a critical point as no prior analyses had
included multiple populations from all DPS designations. Macklin Creek LCT were most closely
related to the Willow-Whitehorse populations in Oregon. Stocking records indicate that Macklin
Creek LCT were originally from the Alpine hatchery which was a Lake Tahoe stock and in the
population-level phylogeny Macklin does group with other Truckee basin populations but the
bootstrap support is very weak (18%). The origin of Willow-Whitehorse populations thought to
be Quinn River remains ambiguous at this time. Edwards Creek LCT are more closely aligned
with Reese River LCT than the Truckee River basin and O’Harrel Creek aligns with the Carson
Peacock and Kirchoff 2007 FINAL REPORT
7
River populations. Thus the Pilot Peak strain represents the only outplanted population
considered in this study with Truckee River basin ancestry.
5) Is there historical evidence for population genetic structure of the now extinct LCT
populations from within the Lake Tahoe-Truckee River basin based upon genetic analyses
of museum preserved samples collected from multiple locations within Lake Tahoe and the
lower Truckee River?
The results of Bayesian genotype clustering analysis revealed multiple genotype clusters within
the historic Truckee River basin museum specimens sampled from multiple locations in Lake
Tahoe, upper and lower Truckee River and Pyramid Lake. Three genotype clusters were found in
Lake Tahoe with only two of the clusters extending into the Truckee River and down to Pyramid
Lake. Proportional membership in the two genotype clusters in Lake Tahoe that extend down the
river and to Pyramid Lake changes as you move down the watershed showing both connectivity
between the two lakes but also local subpopulation structure. These data are consistent with
patterns seen in extant populations in the Humboldt River suggesting that interconnected
watersheds were historically comprised of groups of semi-independent subpopulations with
intermittent gene flow among them. These data also suggest that LCT populations have
characteristics of metapopulations that may have facilitated long term persistence of LCT in a
highly variable desert environment.
6) How can the level and pattern of genetic diversity within extant populations inform
priority ranking for recovery activities?

Peacock and Kirchoff 2007 FINAL REPORT
8
Observed patterns of genetic variability and population genetic structure on both small (within
watersheds) and large (landscape level) spatial scales can inform our understanding of the
historic dynamic of unperturbed LCT populations networks. The goal of recovery and/ or
restoration should be naturally reproducing populations capable of being self-sustaining.
Interconnected stream systems were historically large enough to support multiple life history
strategies, i.e., resident and migratory life histories, as well as provide habitat complexity for all
age classes. Patterns observed in the interconnected streams systems of Marys River and Maggie
Creek provide a restoration template as representative of a once wide-spread population
dynamic. Phylogenetic analyses reveal that when dispersal corridors were available fish could
move not only among streams within watersheds but also among watersheds as evidenced by the
patterns seen in the large Humboldt River drainage.
• Restoration activities should focus on restoring stream networks.
• As habitat size, quality and complexity increase through restoration efforts population
genetic structure should emerge consistent with subpopulation formation.
• Genetic variation and partitioning on the landscape can be used as an effectiveness
monitoring tool.
Peacock and Kirchoff 2007 FINAL REPORT
9
INTRODUCTION The “evolutionarily significant unit” or “distinct population segment” concept proposes the use
of genetic and/or ecological data to identify populations or groups of populations within a
species range that represent distinct evolutionary lineages. The ESU concept was formulated in
order to refine recovery objectives for threatened and endangered species (Moritz 1994; Waples
1995). As defined by the National Marine Fisheries and U. S. Fish and Wildlife Services [Bull
trout federal register notice (61FR4722, Feb 7, 1996) final listing determination for Klamath
River- Columbia River bulltrout DPS], this concept provides a useful framework for delineating
distinct groups of populations within a species range and ensuring conservation of the full range
of genetic and adaptive diversity within a species. This approach also allows specific
management objectives and activities to be drafted independently within each distinct population
segment (DPS).
Inland salmonid species of the intermontane western United States historically were found in
diverse habitats including multiple order stream systems and large terminal lakes. This habitat
diversity within a species range is likely responsible for genetic divergence among populations,
which may represent adaptation to different environments (Taylor 1991; Waples 1995; Healey
and Prince 1998). The post-Pleistocene dry down of the large pluvial lake systems (e.g., Lakes
Lahontan and Bonneville) further isolated watersheds. In the 20th century anthropogenic
disturbance has resulted in fragmented stream systems, potentially disrupting a metapopulation
dynamic that was inherent in many of these formerly interconnected systems and isolating
populations into headwater reaches (Gresswell et al. 1994; Dunham et al. 1997; Gresswell et al.
Peacock and Kirchoff 2007 FINAL REPORT
10
1997; Cegelski et al. 2006; Neville et al. 2006). As a result, many of these species are listed as
sensitive by state fish and game agencies or as threatened under the federal Endangered Species
Act (ESA) (Peacock and Kirchoff 2004). Successful recovery strategies will incorporate
consideration of within species diversity including life history variation, population dynamics
and adaptation to distinct environments (Harig et al. 2000; Dunham et al. 2002).
LAHONTAN CUTTHROAT TROUT
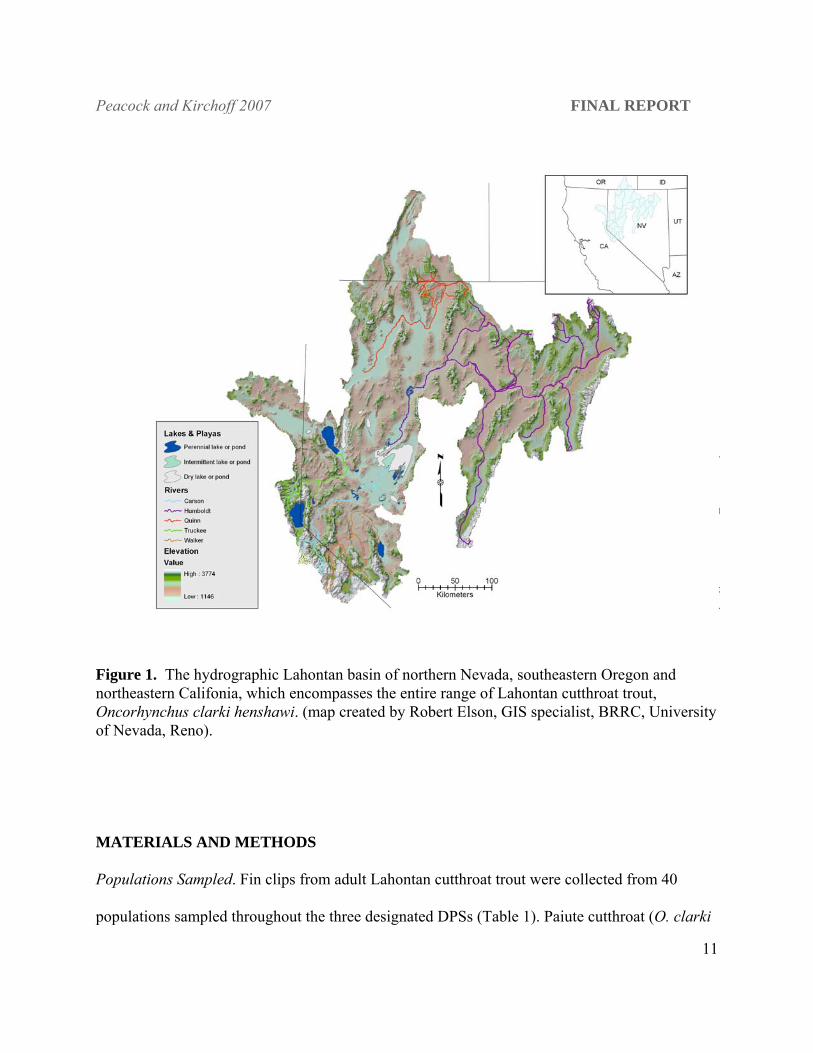
Lahontan cutthroat trout, Oncorhynchus clarki henshawi, endemic to the hydrographic Lahontan
basin of northeastern California, southeastern Oregon and northern Nevada (Figure 1), is one of
approximately 14 allopatrically distributed subspecies of cutthroat trout (O. clarki; Behnke
1992). Behnke (1992) proposed that the Lahontan subspecies be split further into separate
Lahontan and Humboldt (O. Clarki subsp.) subspecies, which would better reflect the lacustrine
and fluvial life histories of these fish and be consistent with morphological differences
[Humboldt fish also have fewer gill rakers and tend to have fewer scales in the lateral series and
above the lateral line (Behnke 1992)]. Classification of cutthroat trout from the Quinn River
system in northeastern Nevada and southeastern Oregon is more ambiguous. Morphological data
suggest that fish in the Quinn River drainage are more similar to Humboldt fish, while mtDNA
data suggest a common origin with western basin or “Lahontan” cutthroat. Currently there is no
formal recognition of the Humboldt subspecies. Based upon morphological, genetic, and
ecological differences Lahontan cutthroat populations have been divided into three DPSs by the
USFWS for recovery activities (Coffin and Cowan 1995): Western (Truckee, Carson, and
Walker Rivers), Eastern (Humboldt River), and Northwestern (Quinn River/Black Rock Desert).
Peacock and Kirchoff 2007 FINAL REPORT
11
Figure 1. The hydrographic Lahontan basin of northern Nevada, southeastern Oregon and northeastern Califonia, which encompasses the entire range of Lahontan cutthroat trout, Oncorhynchus clarki henshawi. (map created by Robert Elson, GIS specialist, BRRC, University of Nevada, Reno).
MATERIALS AND METHODS
Populations Sampled. Fin clips from adult Lahontan cutthroat trout were collected from 40
populations sampled throughout the three designated DPSs (Table 1). Paiute cutthroat (O. clarki
Peacock and Kirchoff 2007 FINAL REPORT
12
seleniris) and rainbow trout (O. mykiss) samples were also included as outgroups in the
construction of phylogenetic trees. LCT from the Humboldt River basin were sampled
throughout the occupied reach of all study streams (N = 10 streams) by University of Nevada
personnel as part of a larger project on population viability (Peacock et al. 1999, Ray et al.
2000). Trout Unlimited biologists provided samples from the Maggie Creek drainage in the
Humboldt River basin (Harig et al. 2004). LCT samples from the other DPSs were provided by
California, Nevada and Oregon state game and fish agencies as well as U. S. Federal agencies
(USFWS, USFS and BLM). Paiute cutthroat trout samples were provided by Dr. Bernie May,
University of California, Davis. Rainbow trout samples were provided by the Nevada
Department of Wildlife Mason Valley hatchery and Utah Division of Wildlife Resources Mantua
hatchery. Additional rainbow trout were collected from naturalized populations in McDermitt
Creek (Quinn River system; DPS members), and Cottonwood and Trout Creeks (Humboldt
River basin; NDOW). Thirty-eight museum preserved tissue samples collected from LCT in the
Lake Tahoe-Truckee River basin (1872-1913) were provided by the Smithsonian Institution and
California Academy of Sciences (Table 2).
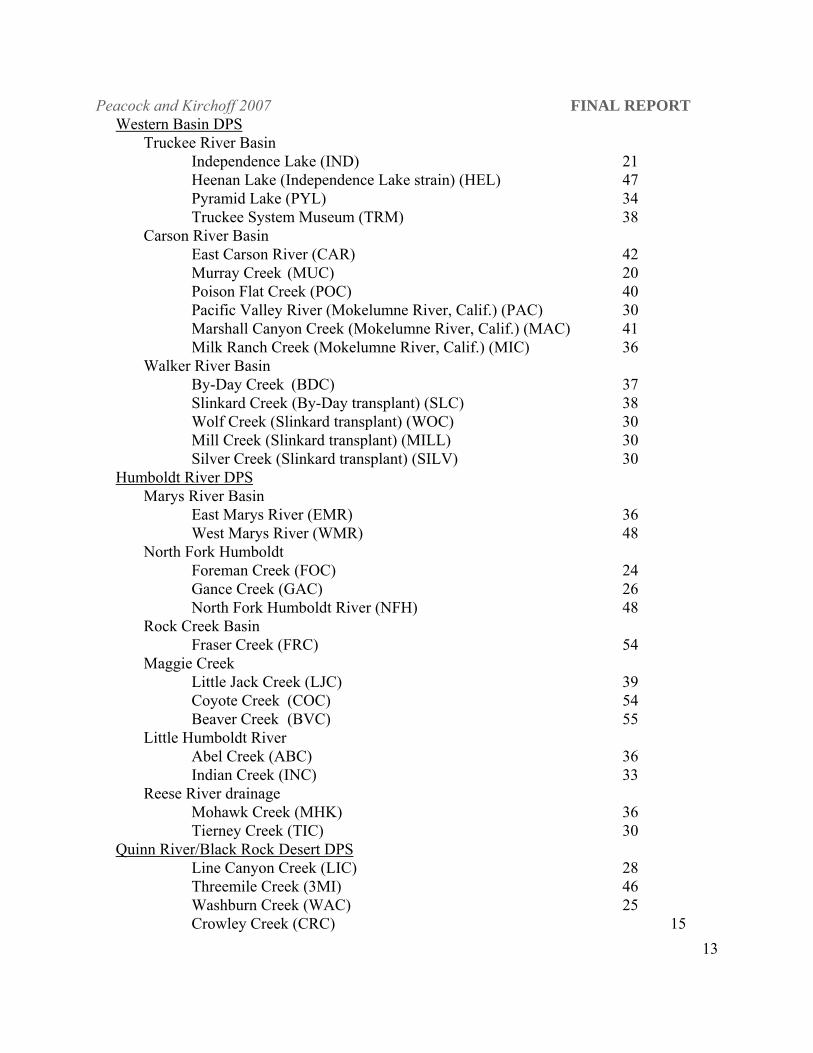
Table 1. Lahontan cutthroat trout populations included in this study listed by DPS and basin within DPS designations. N is the number of individuals sampled per population for this study. Abbreviations for each population that are used elsewhere in the document are listed in parenthesis after each population name. Paiute cutthroat and rainbow trout populations were sampled as outgroups in the phylogenetic analyses. LAHONTAN CUTTHROAT TROUT N
Peacock and Kirchoff 2007 FINAL REPORT
13
Western Basin DPS Truckee River Basin
Independence Lake (IND) 21 Heenan Lake (Independence Lake strain) (HEL) 47 Pyramid Lake (PYL) 34 Truckee System Museum (TRM) 38
Carson River Basin East Carson River (CAR) 42 Murray Creek (MUC) 20 Poison Flat Creek (POC) 40 Pacific Valley River (Mokelumne River, Calif.) (PAC) 30
Marshall Canyon Creek (Mokelumne River, Calif.) (MAC) 41 Milk Ranch Creek (Mokelumne River, Calif.) (MIC) 36
Walker River Basin By-Day Creek (BDC) 37 Slinkard Creek (By-Day transplant) (SLC) 38 Wolf Creek (Slinkard transplant) (WOC) 30 Mill Creek (Slinkard transplant) (MILL) 30 Silver Creek (Slinkard transplant) (SILV) 30 Humboldt River DPS Marys River Basin East Marys River (EMR) 36 West Marys River (WMR) 48 North Fork Humboldt Foreman Creek (FOC) 24 Gance Creek (GAC) 26 North Fork Humboldt River (NFH) 48 Rock Creek Basin Fraser Creek (FRC) 54 Maggie Creek Little Jack Creek (LJC) 39 Coyote Creek (COC) 54
Beaver Creek (BVC) 55 Little Humboldt River Abel Creek (ABC) 36 Indian Creek (INC) 33 Reese River drainage Mohawk Creek (MHK) 36 Tierney Creek (TIC) 30 Quinn River/Black Rock Desert DPS Line Canyon Creek (LIC) 28
Threemile Creek (3MI) 46 Washburn Creek (WAC) 25
Crowley Creek (CRC) 15
Peacock and Kirchoff 2007 FINAL REPORT
14
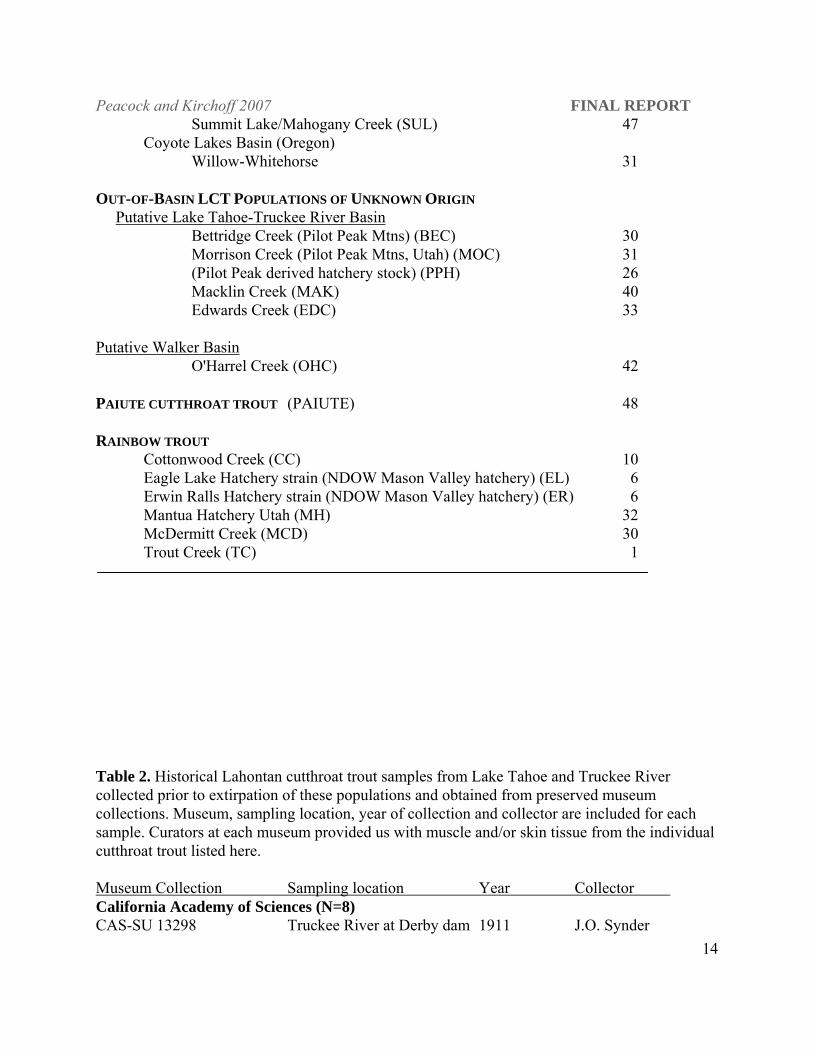
Summit Lake/Mahogany Creek (SUL) 47 Coyote Lakes Basin (Oregon)
Willow-Whitehorse 31 OUT-OF-BASIN LCT POPULATIONS OF UNKNOWN ORIGIN Putative Lake Tahoe-Truckee River Basin Bettridge Creek (Pilot Peak Mtns) (BEC) 30
Morrison Creek (Pilot Peak Mtns, Utah) (MOC) 31 (Pilot Peak derived hatchery stock) (PPH) 26
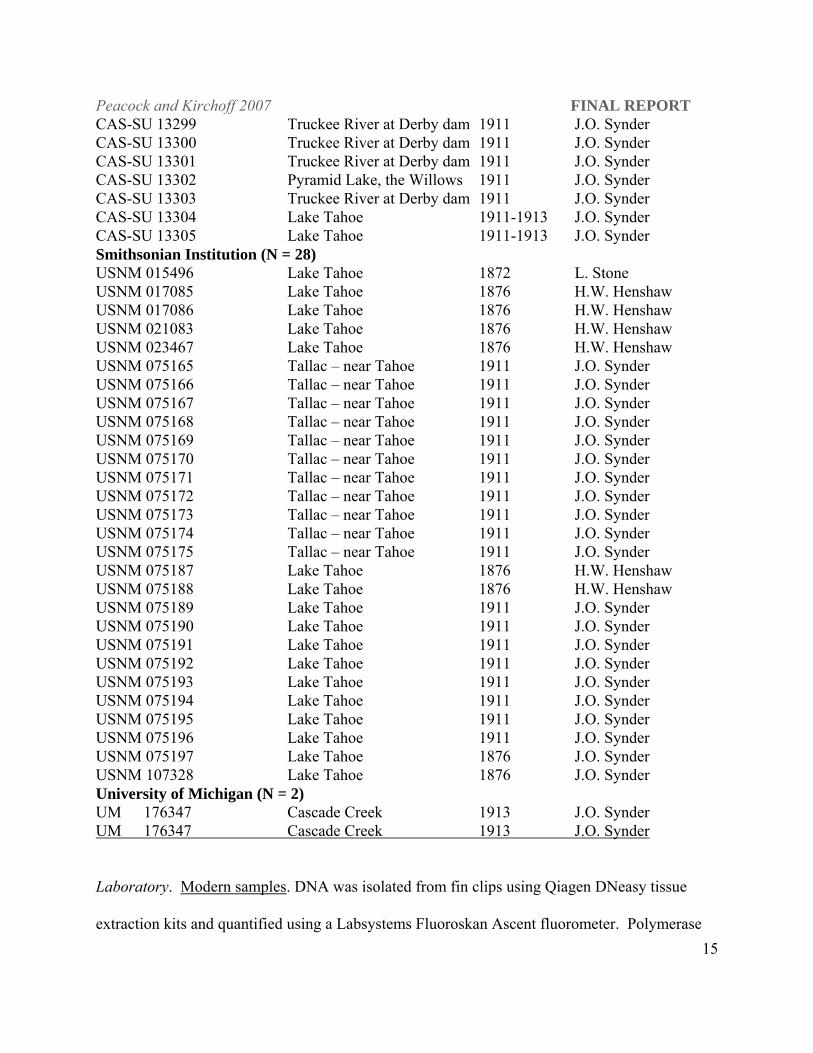
Macklin Creek (MAK) 40 Edwards Creek (EDC) 33 Putative Walker Basin O'Harrel Creek (OHC) 42 PAIUTE CUTTHROAT TROUT (PAIUTE) 48 RAINBOW TROUT Cottonwood Creek (CC) 10 Eagle Lake Hatchery strain (NDOW Mason Valley hatchery) (EL) 6 Erwin Ralls Hatchery strain (NDOW Mason Valley hatchery) (ER) 6 Mantua Hatchery Utah (MH) 32 McDermitt Creek (MCD) 30 Trout Creek (TC) 1 Table 2. Historical Lahontan cutthroat trout samples from Lake Tahoe and Truckee River collected prior to extirpation of these populations and obtained from preserved museum collections. Museum, sampling location, year of collection and collector are included for each sample. Curators at each museum provided us with muscle and/or skin tissue from the individual cutthroat trout listed here. Museum Collection Sampling location Year Collector California Academy of Sciences (N=8) CAS-SU 13298 Truckee River at Derby dam 1911 J.O. Synder
Peacock and Kirchoff 2007 FINAL REPORT
15
CAS-SU 13299 Truckee River at Derby dam 1911 J.O. Synder CAS-SU 13300 Truckee River at Derby dam 1911 J.O. Synder CAS-SU 13301 Truckee River at Derby dam 1911 J.O. Synder CAS-SU 13302 Pyramid Lake, the Willows 1911 J.O. Synder CAS-SU 13303 Truckee River at Derby dam 1911 J.O. Synder CAS-SU 13304 Lake Tahoe 1911-1913 J.O. Synder CAS-SU 13305 Lake Tahoe 1911-1913 J.O. Synder Smithsonian Institution (N = 28) USNM 015496 Lake Tahoe 1872 L. Stone USNM 017085 Lake Tahoe 1876 H.W. Henshaw USNM 017086 Lake Tahoe 1876 H.W. Henshaw USNM 021083 Lake Tahoe 1876 H.W. Henshaw USNM 023467 Lake Tahoe 1876 H.W. Henshaw USNM 075165 Tallac – near Tahoe 1911 J.O. Synder USNM 075166 Tallac – near Tahoe 1911 J.O. Synder USNM 075167 Tallac – near Tahoe 1911 J.O. Synder USNM 075168 Tallac – near Tahoe 1911 J.O. Synder USNM 075169 Tallac – near Tahoe 1911 J.O. Synder USNM 075170 Tallac – near Tahoe 1911 J.O. Synder USNM 075171 Tallac – near Tahoe 1911 J.O. Synder USNM 075172 Tallac – near Tahoe 1911 J.O. Synder USNM 075173 Tallac – near Tahoe 1911 J.O. Synder USNM 075174 Tallac – near Tahoe 1911 J.O. Synder USNM 075175 Tallac – near Tahoe 1911 J.O. Synder USNM 075187 Lake Tahoe 1876 H.W. Henshaw USNM 075188 Lake Tahoe 1876 H.W. Henshaw USNM 075189 Lake Tahoe 1911 J.O. Synder USNM 075190 Lake Tahoe 1911 J.O. Synder USNM 075191 Lake Tahoe 1911 J.O. Synder USNM 075192 Lake Tahoe 1911 J.O. Synder USNM 075193 Lake Tahoe 1911 J.O. Synder USNM 075194 Lake Tahoe 1911 J.O. Synder USNM 075195 Lake Tahoe 1911 J.O. Synder USNM 075196 Lake Tahoe 1911 J.O. Synder USNM 075197 Lake Tahoe 1876 J.O. Synder USNM 107328 Lake Tahoe 1876 J.O. Synder University of Michigan (N = 2) UM 176347 Cascade Creek 1913 J.O. Synder UM 176347 Cascade Creek 1913 J.O. Synder Laboratory. Modern samples. DNA was isolated from fin clips using Qiagen DNeasy tissue
extraction kits and quantified using a Labsystems Fluoroskan Ascent fluorometer. Polymerase
Peacock and Kirchoff 2007 FINAL REPORT
16
chain reactions (PCR) were carried out for all individuals included in the study at ten species-
specific microsatellite loci (Peacock et al. 2004) on a Perkin Elmer Gene amp 9600 thermal
cycler in 15 :l volumes. Twenty ng of template DNA, 0.23 :M of forward and reverse primers
(forward primer fluorescently labeled, OPERON and Applied Biosystems) and 0.4 mM dNTPs
were used in each reaction. Amplitaq Gold buffer (1X) was used for OCH 5-10, 16 and 17 with
MgCl2 added (1.6 mM, OCH 5-10; 1.8 mM, OCH 16 and 17) to these reactions. Titanium Taq
buffer (1X), which includes approximately 3M MgCl2, was used for OCH 11, 13, 14 and 15.
PCR conditions for OCH 5-11 consisted of 30 cycles of 30s 950C, 30s 550C, 30s 720C, followed
by 10 min extension at 720C. PCR conditions for OCH 13-17 consisted of 26 cycles of 30s 950C,
680C 1 min 45s, followed by 10 min extension 720C.
Museum preserved samples. Extracting DNA from formalin preserved samples presents unique
challenges. Formalin penetrates tissues and cross-links the proteins associated with the
chromosomes (Ren et al. 2000). This cross-linking makes DNA extraction difficult and
necessitates multiple extractions and PCRs. At least four different PCR reactions are typically
necessary to achieve results consistent enough to reliably assign alleles. Microsatellite
amplification is usually more successful with small microsatellite inserts [100-200 base pairs
(bp)]. The museum LCT samples were preserved in formalin for an unknown period of time and
then transferred to 70-75% ethanol. Small pieces of muscle and skin tissue were removed by
museum curators and sent to UNR in 2-4 ml of 70% ethanol. Approximately 25 mg of tissue was
removed from each sample and placed in 1.0 ml of phosphate buffered saline solution and
incubated at room temperature for one hour. Samples were inverting frequently to wash the
Peacock and Kirchoff 2007 FINAL REPORT
17
preservatives off of the sample. This process was repeated twice. Two aliquots of tissue were
removed and DNA was extracted separately for each portion where one sample was primarily
skin tissue, and the other muscle to increase probability of getting reliable data. However, no
significant differences were found in PCR success using these two tissue types.
The recommended amounts of lysis buffers and proteinase K (Qiagen DNeasy extraction kits)
were doubled to maximize lysis of the tissues. The washed tissues were transferred to 360 µl
Buffer ATL (Qiagen) and 40 µl proteinase K and incubated minimally overnight to ensure
complete digestion of the tissue. After digestion 400 µl of Buffer AL (Qiagen) was added and the
samples inverted rapidly for 15 seconds to yield a homogenous solution. The lysate was
transferred to a second 1.5 ml microcentrifuge tube that contains 400 µl ice cold 90% ethanol for
precipitation of DNA. Samples were mixed thoroughly and incubated in at 4°C. The
ethanol/lysate mix was transferred to Qiagen DNeasy columns and centrifuged at 6000g for one
minute to bind the DNA to the filter in the column. Columns were washed 2X with AW1 and
AW2 (Qiagen) and allowed to dry. Fifty µl of elution buffer heated to 70°C was applied to the
column and incubated at room temperature for one hour. A second elution step was carried out
using the same protocol. This process yields 100 µl solutions of various concentrations and
quality of DNA.
PCR was carried out multiple times to insure precise and accurate allele assignment. Each
reaction uses 5 µl of template DNA. Both multiplex (3-5 microsatellite primer pairs) and
individual PCR reactions were carried out. Multiplex PCR is an efficient way to screen the
Peacock and Kirchoff 2007 FINAL REPORT
18
DNA for contamination or failures across all loci. All PCR products were diluted in 50 :l
deionized water and 1 :l of diluted PCR product was added to 16 :l ROX/Formamide ladder.
Fragment analysis was carried out on a PE Applied Biosystems 3730 Genetic Analyzer. Alleles
were scored and binned using Genemapper software (version3.7, Applied Biosystems). Allele
calls were compared between the duplicate samples and duplicate PCR reactions. If samples did
not match, PCR was repeated on both samples.
Statistical Analyses. All populations were characterized for gene diversity (heterozygosity; H),
genotypic diversity, and allelic richness (RS; FSTAT, version 2.9.3.2, Goudet 2001). We also
calculated Wright’s F statistics (Wright 1969) in order to test for genetic population structure
(FST) and quantify average levels of inbreeding (FIS) within populations using FSTAT. FST, a
measure of gene flow from allele frequency differences among populations, represents average
gene flow over many generations (Wright 1969). Values range from 0, indicative of no genetic
differentiation, to 1.0, which indicates complete differentiation. This statistic was used to
reconstruct likely historical patterns of movement among streams that are now isolated with no
possibility of natural gene flow.
As a general rule of thumb FST values from 0-0.05 indicate low levels of genetic differentiation,
0.05-0.15 indicate moderate levels of differentiation, 0.15-0.25 great levels differentiation and
above 0.25 very great levels of differentiation (Hartl and Clark 1997). Although these are
theoretical estimates derived from allozyme data, FST estimates from both allozyme and
microsatellite data are often compared directly (Estoup et al. 1998; Allendorf et al. 2000;
Peacock and Kirchoff 2007 FINAL REPORT
19
Innocentiis et al. 2001). Estoup et al. (1998) found that the higher level of polymorphism
observed at microsatellite loci resulted in higher power of statistical tests for differentiation
among population samples and for genotypic linkage disequilibrium, but multilocus FST
estimates computed over the an entire set of brown trout populations were not significantly
different for both categories of markers.
For populations in streams systems that are still interconnected we calculated historical gene
flow using F statistics and assessed contemporary gene flow using a Bayesian genotype
clustering method (Pritchard et al. 2000; STRUCTURE version 2.0). For isolated populations we
used this method to look for within stream population genetic structure. This approach is a type
of assignment test (Paetkau et al. 1995, 2004; Rannala and Mountain 1997; Waser and Stroebeck
1998; Cornuet et al. 1999; Piry et al. 2004), which uses genotype likelihoods within populations
versus allele frequencies to assign individuals to a probable population of origin and identify
first generation immigrants. The utility of the assignment approach is largely due to (1) reliance
on genotype frequencies, which are formed anew each generation, (2) no assumption of drift-
migration equilibrium and (3) effectiveness even when genetic differentiation is low (Paetkau et
al. 2004). Genotype clustering methods can be used to assess historical gene flow as well by
identification of contemporary genotype clusters. Proportional membership of individuals within
clusters across known isolated populations can give an indication of historical connectedness and
gene flow.
The Bayesian approach has been shown to be consistently more accurate at assigning individuals

Peacock and Kirchoff 2007 FINAL REPORT
20
to their population of origin both with an infinite alleles (IAM) and single step (SMM) mutation
models (Cornuet et al. 1999) and makes no apriori assumptions about population boundaries
when estimating prior allelic distributions. The grouping criteria include Hardy-Weinberg
equilibrium and gametic phase equilibrium between loci within groups. In STRUCTURE we used
an admixture model where individuals with novel genotypes can be identified and assigned.
STRUCTURE uses a Markov chain Monte Carlo (MCMC) re-sampling algorithm. We specified
anywhere from 30,000-1,000,000 burn-in period followed by three to five 30,000-1,000,000
MCMC replicates per K (number of genotype clusters) to approximate posterior allelic
distributions against which individual genotypes were compared and assigned to a cluster
(Pritchard et al. 2000). The natural log of the probability of the data [LnP(D)] is used to
determine the best fit of the data.
We also used the program GeneClass2 (version 2.0, Piry et al. 2004) to identify first generation
immigrants (F0) into each of the three tributary populations in the interconnected Maggie Creek
basin, in order to assess degree of population isolation and rates of contemporary gene flow
(Paetkau et al. 2004) in the face of stream culverts. We used the likelihood computation of L =
L_(home)/ L_(max), which is the ratio of the likelihood computed from the population where the
individual was sampled (L_home) over the highest likelihood value among all population
samples including the population where the individual was sampled (L_max) (Paetkau et al.
2004). We also used a Bayesian computation model and probabilities were determined using a
Monte Carlo resampling algorithm (Rannala and Mountain 1997), 1000 simulated individuals
and an alpha level of 0.01.

Peacock and Kirchoff 2007 FINAL REPORT
21
The programs BOTTLENECK (Cornuet and Luikart 1996) and M ratio (Garza and Williamson
2001) were used to detect recent effective population size reductions. BOTTLENECK uses allele
frequency data and heterozygosity excess criteria to determine reductions in population size.
Rapid reductions in effective population size results in excess heterozygosity as allele numbers
per locus are reduced faster than gene diversity (HE) (Luikart et al. 1999). We tested for
bottlenecks using the three mutation models – infinite alleles (IAM; Maruyama and Fuerst
1985), two-phase (TPM; Di Rienzo et al. 1994), and single step (SMM; Ohta and Kimura 1973)
available in BOTTLENECK. Although variation in mutation mode has been demonstrated for loci
with different repeat motifs (Valdes et al. 1993; Di Rienzo et al. 1998; Kruglyak et al. 1998),
there is no consensus on a general mutation model for all microsatellite loci although the two-
phase model has the most empirical support (Di Reinzo et al. 1998). We used the variance for
TPM and proportion of SMM in TPM recommended by the authors (Cornuet and Luikart 1996).
Here we compare all mutation models with special emphasis on the two-phase results as this
model is most likely the best-fit model.
Bottlenecks and/or founder events were also assessed using the M ratio (M = k/r), where k is the
number and r is the size distribution of alleles per locus. The ratio is expected to decrease when a
population is small and subject to random genetic drift as the random loss of alleles will reduce k
more quickly than r (Garza and Williamson 2001). The decline in M will be most pronounced in
those populations that remain small for prolonged periods. The M ratio has a longer temporal
signal than other methods that use heterozygous excess (BOTTLENECK, Cornuet and Luikart
Peacock and Kirchoff 2007 FINAL REPORT
22
1996), as recovery of M depends upon a proportionally greater increase in k than r (Garza and
Williamson 2001). Garza and Williamson (2001), using both empirical data from species known
to have gone through severe bottlenecks and computer simulations, show that M values of less
than 0.68 indicate severe bottlenecks. The M ratio method was used to compare the
interconnected Maggie Creek stream systems to the Marys River where only the M ratio was
used by Neville et al. (2006).
Phylogenies were constructed at various spatial and temporal scales using Cavalli-Sforza genetic
distance measure and a neighbor-joining tree-building algorithm (POPULATIONS, version 1.2.26,
http://www.cnrs-gif.fr/pge). Trees were visualized using the program TREEVIEW, version 1.6.6
(http://taxonomy.zoology/gla.ac.uk/rod/rod.html).
RESULTS
Genetic variation. Stream populations – Eastern DPS Among the naturally reproducing stream
populations included in the study, the Humboldt River populations have the highest overall gene
diversity (averaged over all loci, H = 0.697; Appendix 1). This is likely the result of relatively
large population sizes compared to populations in other DPSs due to both length (km) of
available habitat in isolated streams, interconnectedness among some stream reaches, and
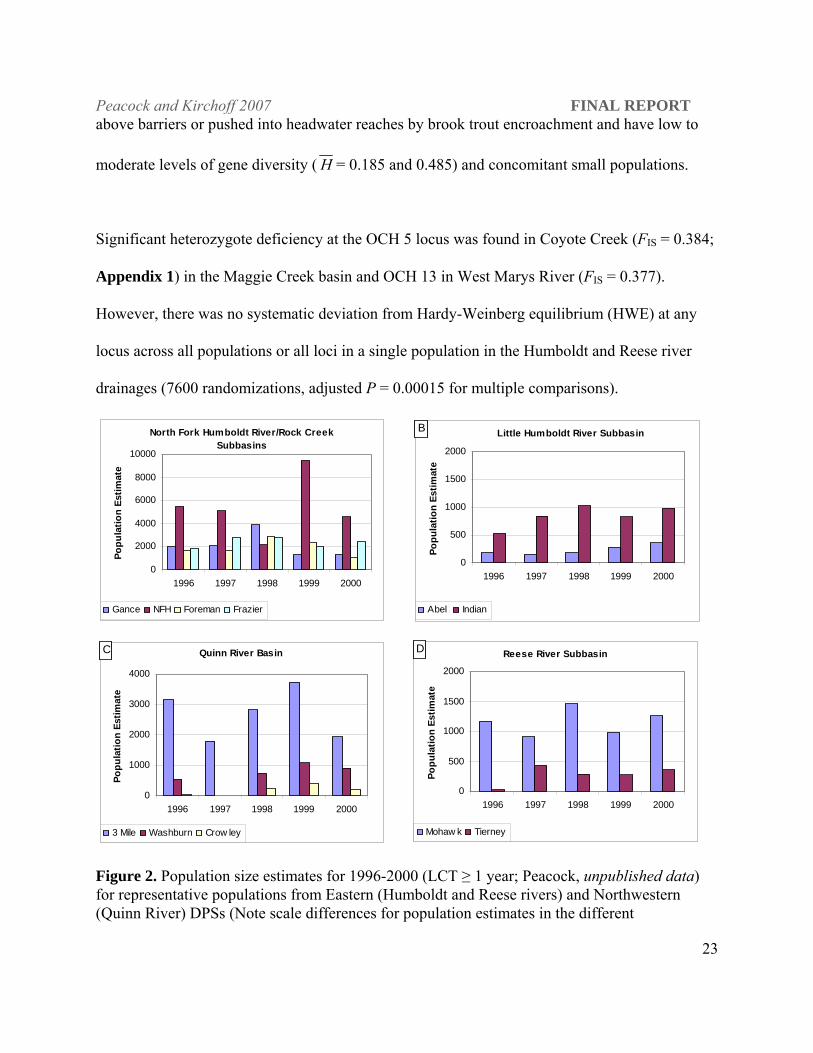
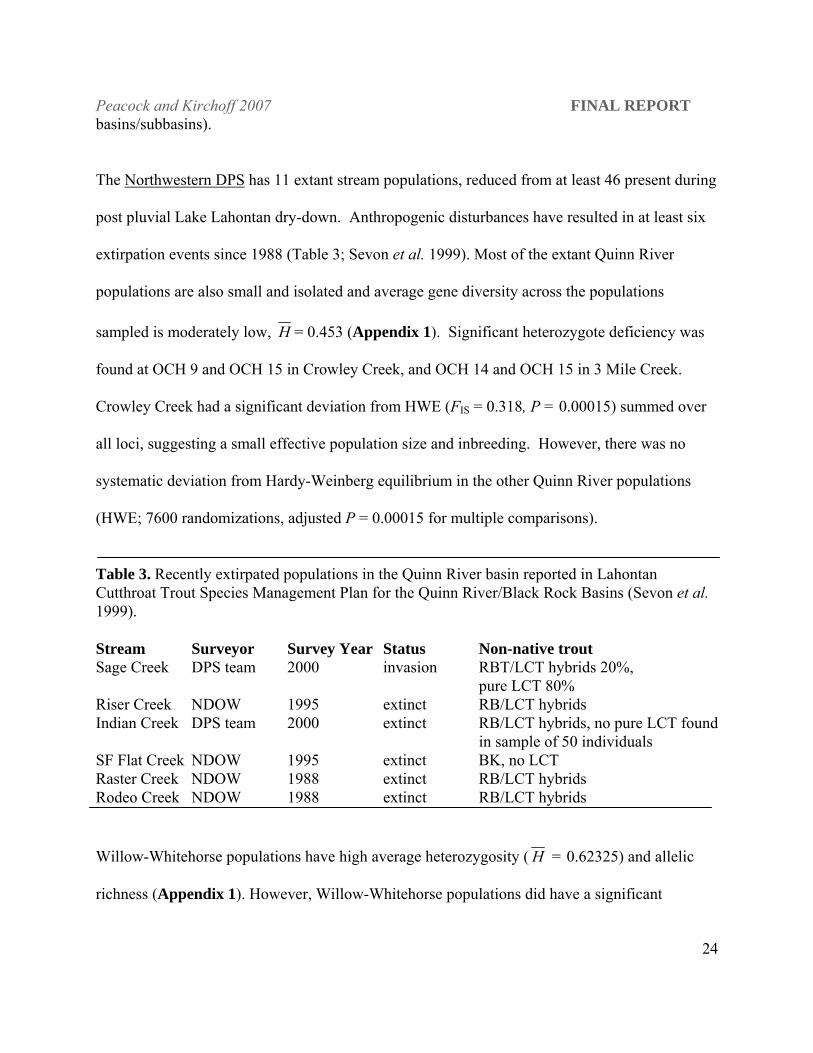
absence of nonnative salmonids in these waters (Figure 2). LCT populations sampled in the
Reese River subbasin (Mohawk and Tierney creeks) and on the eastern side of the Santa Rosa
Mountains in the Little Humboldt River subbasin (Abel and Indian creeks), which historically
drained into the main stem Humboldt River, are now found in small isolated streams either
Peacock and Kirchoff 2007 FINAL REPORT
23
above barriers or pushed into headwater reaches by brook trout encroachment and have low to
moderate levels of gene diversity ( H = 0.185 and 0.485) and concomitant small populations.
Significant heterozygote deficiency at the OCH 5 locus was found in Coyote Creek (FIS = 0.384;
Appendix 1) in the Maggie Creek basin and OCH 13 in West Marys River (FIS = 0.377).
However, there was no systematic deviation from Hardy-Weinberg equilibrium (HWE) at any
locus across all populations or all loci in a single population in the Humboldt and Reese river
drainages (7600 randomizations, adjusted P = 0.00015 for multiple comparisons).
Quinn River Basin
0
1000
2000
3000
4000
1996 1997 1998 1999 2000
Popu
latio
n Es
timat
e
3 Mile Washburn Crow ley
C
Little Humboldt River Subbasin
0
500
1000
1500
2000
1996 1997 1998 1999 2000
Popu
latio
n Es
timat
e
Abel Indian
BNorth Fork Humboldt River/Rock Creek Subbasins
0
2000
4000
6000
8000
10000
1996 1997 1998 1999 2000
Popu
latio
n Es
timat
e
Gance NFH Foreman Frazier
Reese River Subbasin
0
500
1000
1500
2000
1996 1997 1998 1999 2000
Popu
latio
n Es
timat
e
Mohaw k Tierney
D
Figure 2. Population size estimates for 1996-2000 (LCT ≥ 1 year; Peacock, unpublished data) for representative populations from Eastern (Humboldt and Reese rivers) and Northwestern (Quinn River) DPSs (Note scale differences for population estimates in the different
Peacock and Kirchoff 2007 FINAL REPORT
24
basins/subbasins).
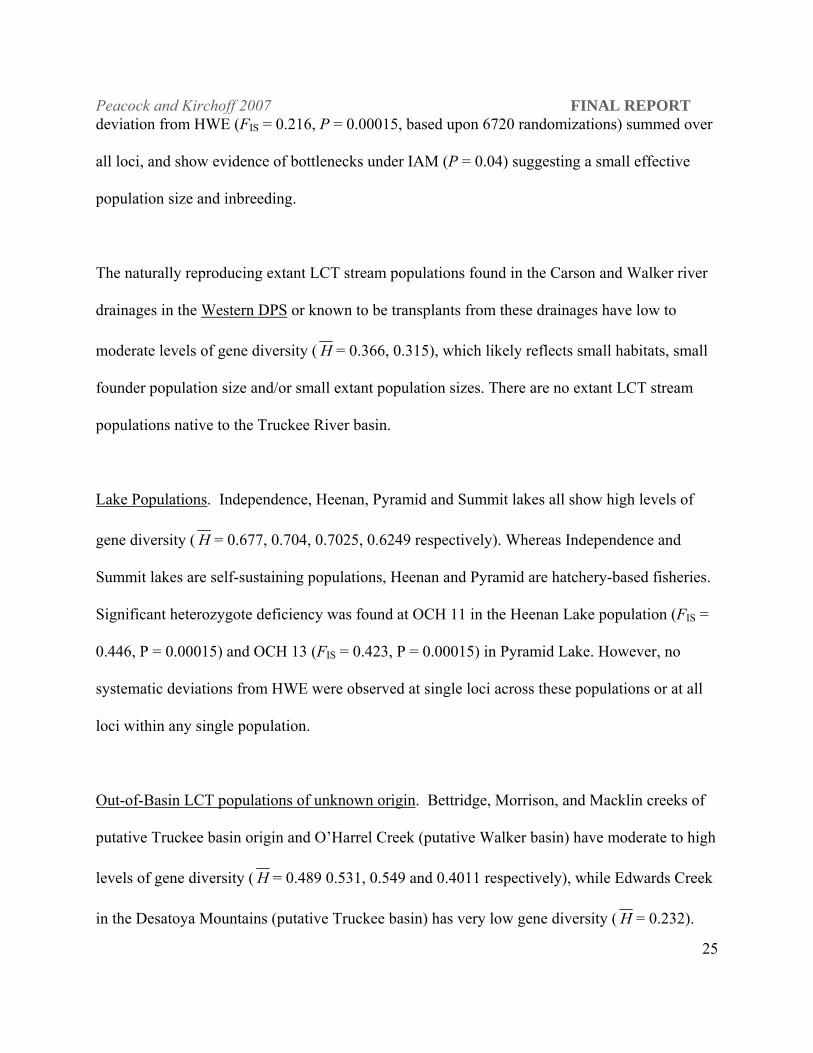
The Northwestern DPS has 11 extant stream populations, reduced from at least 46 present during
post pluvial Lake Lahontan dry-down. Anthropogenic disturbances have resulted in at least six
extirpation events since 1988 (Table 3; Sevon et al. 1999). Most of the extant Quinn River
populations are also small and isolated and average gene diversity across the populations
sampled is moderately low, H = 0.453 (Appendix 1). Significant heterozygote deficiency was
found at OCH 9 and OCH 15 in Crowley Creek, and OCH 14 and OCH 15 in 3 Mile Creek.
Crowley Creek had a significant deviation from HWE (FIS = 0.318, P = 0.00015) summed over
all loci, suggesting a small effective population size and inbreeding. However, there was no
systematic deviation from Hardy-Weinberg equilibrium in the other Quinn River populations
(HWE; 7600 randomizations, adjusted P = 0.00015 for multiple comparisons).
Table 3. Recently extirpated populations in the Quinn River basin reported in Lahontan Cutthroat Trout Species Management Plan for the Quinn River/Black Rock Basins (Sevon et al. 1999). Stream Surveyor Survey Year Status Non-native trout Sage Creek DPS team 2000 invasion RBT/LCT hybrids 20%, pure LCT 80% Riser Creek NDOW 1995 extinct RB/LCT hybrids Indian Creek DPS team 2000 extinct RB/LCT hybrids, no pure LCT found
in sample of 50 individuals SF Flat Creek NDOW 1995 extinct BK, no LCT Raster Creek NDOW 1988 extinct RB/LCT hybrids Rodeo Creek NDOW 1988 extinct RB/LCT hybrids Willow-Whitehorse populations have high average heterozygosity ( H = 0.62325) and allelic
richness (Appendix 1). However, Willow-Whitehorse populations did have a significant
Peacock and Kirchoff 2007 FINAL REPORT
25
deviation from HWE (FIS = 0.216, P = 0.00015, based upon 6720 randomizations) summed over
all loci, and show evidence of bottlenecks under IAM (P = 0.04) suggesting a small effective
population size and inbreeding.
The naturally reproducing extant LCT stream populations found in the Carson and Walker river
drainages in the Western DPS or known to be transplants from these drainages have low to
moderate levels of gene diversity ( H = 0.366, 0.315), which likely reflects small habitats, small
founder population size and/or small extant population sizes. There are no extant LCT stream
populations native to the Truckee River basin.
Lake Populations. Independence, Heenan, Pyramid and Summit lakes all show high levels of
gene diversity ( H = 0.677, 0.704, 0.7025, 0.6249 respectively). Whereas Independence and
Summit lakes are self-sustaining populations, Heenan and Pyramid are hatchery-based fisheries.
Significant heterozygote deficiency was found at OCH 11 in the Heenan Lake population (FIS =
0.446, P = 0.00015) and OCH 13 (FIS = 0.423, P = 0.00015) in Pyramid Lake. However, no
systematic deviations from HWE were observed at single loci across these populations or at all
loci within any single population.
Out-of-Basin LCT populations of unknown origin. Bettridge, Morrison, and Macklin creeks of
putative Truckee basin origin and O’Harrel Creek (putative Walker basin) have moderate to high
levels of gene diversity ( H = 0.489 0.531, 0.549 and 0.4011 respectively), while Edwards Creek
in the Desatoya Mountains (putative Truckee basin) has very low gene diversity ( H = 0.232).
Peacock and Kirchoff 2007 FINAL REPORT
26
Significant heterozygote deficiency was found at OCH 11 in Macklin Creek (FIS = 0.559) and
OCH 17 in Morrison Creek (FIS = 0.427, P = 0.00015). However, no systematic deviations from
HWE were observed at single loci across populations or at all loci within populations.
Phylogenetic analysis at the DPS level
1) Are the current DPS designations determined with morphological, meristic, allozyme,
and mitochondrial genetic data consistent with data from microsatellite markers and more
extensive and systematic sampling of extant LCT populations?
In the 1995 USFWS Recovery Plan for Lahontan cutthroat trout (Coffin and Cowan 1995), three
distinct population segments (DPS) were identified; Northwestern DPS (Quinn River drainage
and Summit Lake basin), Eastern DPS (Humboldt and Reese river drainages) and the Western
DPS (Truckee, Carson and Walker River drainages). These DPS designations were based upon
morphological, meristic, genetic and ecological data (Loudenslager and Gall 1980; Gall and
Loudenslager 1981, Behnke 1992; Williams et al. 1992; Coffin and Cowan 1995; Williams et al.
1998). Here we examine these DPS designations using nuclear microsatellite markers and data
from extensive sampling of populations known to be native (not transplanted) to their respective
DPS (see Table 1).
Behnke (1992) proposed that the Lahontan subspecies be split into separate Lahontan and
Humboldt (O. Clarki subsp.) subspecies, hypothesizing that this would better reflect their
lacustrine versus fluvial life histories of these fish and be consistent with morphological
Peacock and Kirchoff 2007 FINAL REPORT
27
differences (Humboldt fish also have fewer gill rakers and tend to have fewer scales in the lateral
series and above the lateral line). In contrast, the classification of cutthroat trout from the Quinn
River system in northeastern Nevada and southeastern Oregon has remained problematic.
Morphological data suggest that fish in the Quinn River drainage are more similar to Humboldt
fish, while mtDNA data suggest a common origin with western basin or “Lahontan” cutthroat
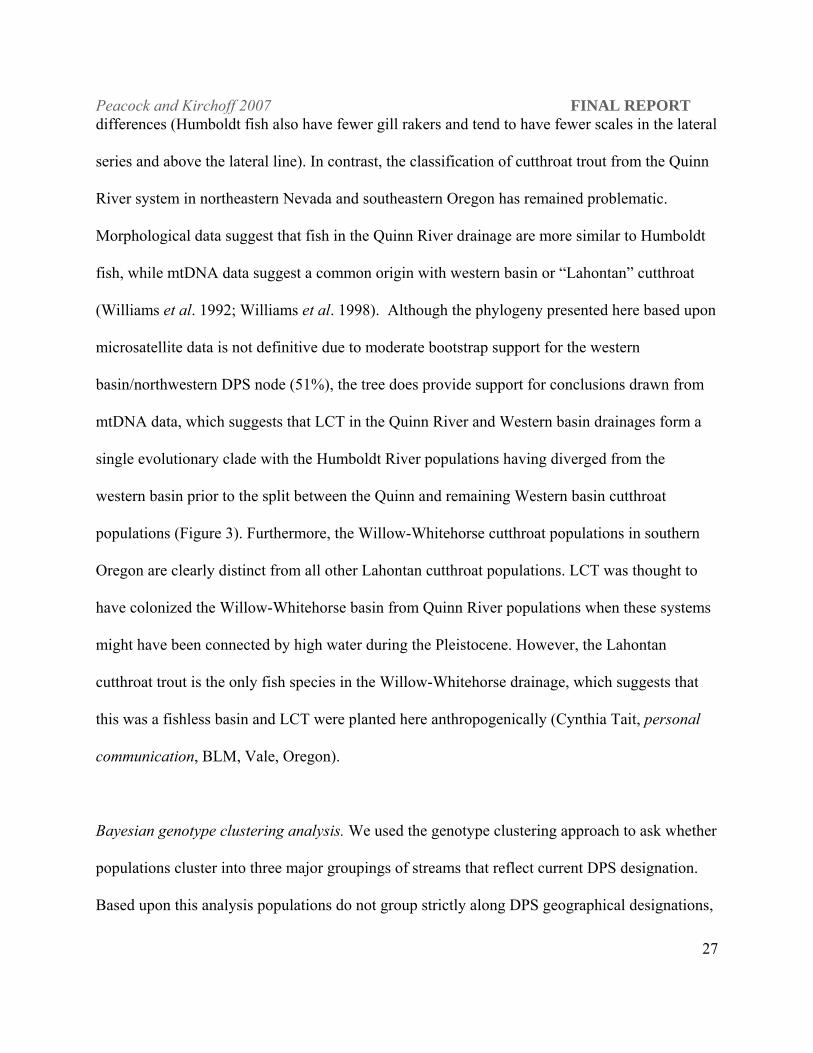
(Williams et al. 1992; Williams et al. 1998). Although the phylogeny presented here based upon
microsatellite data is not definitive due to moderate bootstrap support for the western
basin/northwestern DPS node (51%), the tree does provide support for conclusions drawn from
mtDNA data, which suggests that LCT in the Quinn River and Western basin drainages form a
single evolutionary clade with the Humboldt River populations having diverged from the
western basin prior to the split between the Quinn and remaining Western basin cutthroat
populations (Figure 3). Furthermore, the Willow-Whitehorse cutthroat populations in southern
Oregon are clearly distinct from all other Lahontan cutthroat populations. LCT was thought to
have colonized the Willow-Whitehorse basin from Quinn River populations when these systems
might have been connected by high water during the Pleistocene. However, the Lahontan
cutthroat trout is the only fish species in the Willow-Whitehorse drainage, which suggests that
this was a fishless basin and LCT were planted here anthropogenically (Cynthia Tait, personal
communication, BLM, Vale, Oregon).
Bayesian genotype clustering analysis. We used the genotype clustering approach to ask whether
populations cluster into three major groupings of streams that reflect current DPS designation.
Based upon this analysis populations do not group strictly along DPS geographical designations,
Peacock and Kirchoff 2007 FINAL REPORT
28
but groupings do reflect both historical connectedness and contemporary perturbations to
isolated LCT populations (Figure 4).
0.1
PO P 6
P O P 5
PO P 4
P O P 1
P OP 3
51
P O P 2
72
89Western DPS
Willow-Whitehorse
Northwestern DPS
Eastern DPS
Paiute Cutthroat TroutOncorhynchus clarki seleniris
Rainbow TroutOncorhynchus mykiss
Lahontan Cutthroat TroutOncorhynchus clarki henshawii
72
89
51
Figure 3. Phylogenetic analysis of DPS designation, using a Cavalli-Sforza genetic distance measure and neighbor-joining tree, with Rainbow trout and Paiute cutthroat as outgroups. 2000 iterations were conducted in the program POPULATIONS (version 1.2.6). Populations comprising each DPS are listed in Table 1. Scale represents genetic distance.
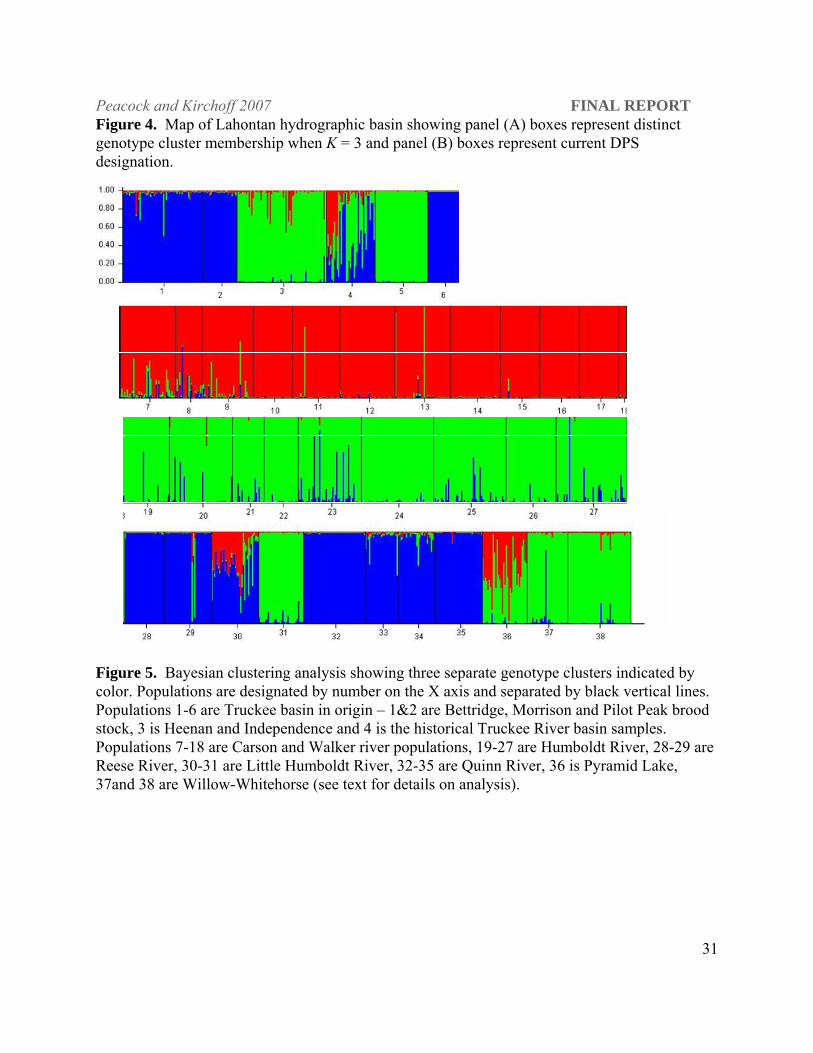
The three genotype clusters are as follows: (1) populations from the Reese River, Abel Creek
(see below) in the Little Humboldt drainage, the Quinn and Truckee rivers tended to form a
single genotype cluster with some exceptions. Bettridge, Morrison and the Pilot Peak broodstock
were in this first cluster. The historical Truckee River samples showed all individuals as having
proportional membership in both this cluster and the following cluster (Figure 5); (2) Heenan
and Independence Lake, LCT from Indian Creek in the Little Humboldt River drainage, all of the

Peacock and Kirchoff 2007 FINAL REPORT
29
Humboldt River populations, Willow-Whitehorse and Pyramid Lake formed the second cluster.
Pyramid Lake individuals were also split in proportional membership between clusters 2 and 3;
(3) The Carson and Walker river populations formed the third distinct genotype cluster with the
Pyramid Lake and Able Creek populations split in membership between the Carson River and
main Humboldt River clusters.
The Reese and Little Humboldt rivers are in the western portion of the large Humboldt River
drainage and are geographically closer to each other than to the other tributaries to the Humboldt
River sampled for this study. Most of the Quinn River drainage and the lower portions of the
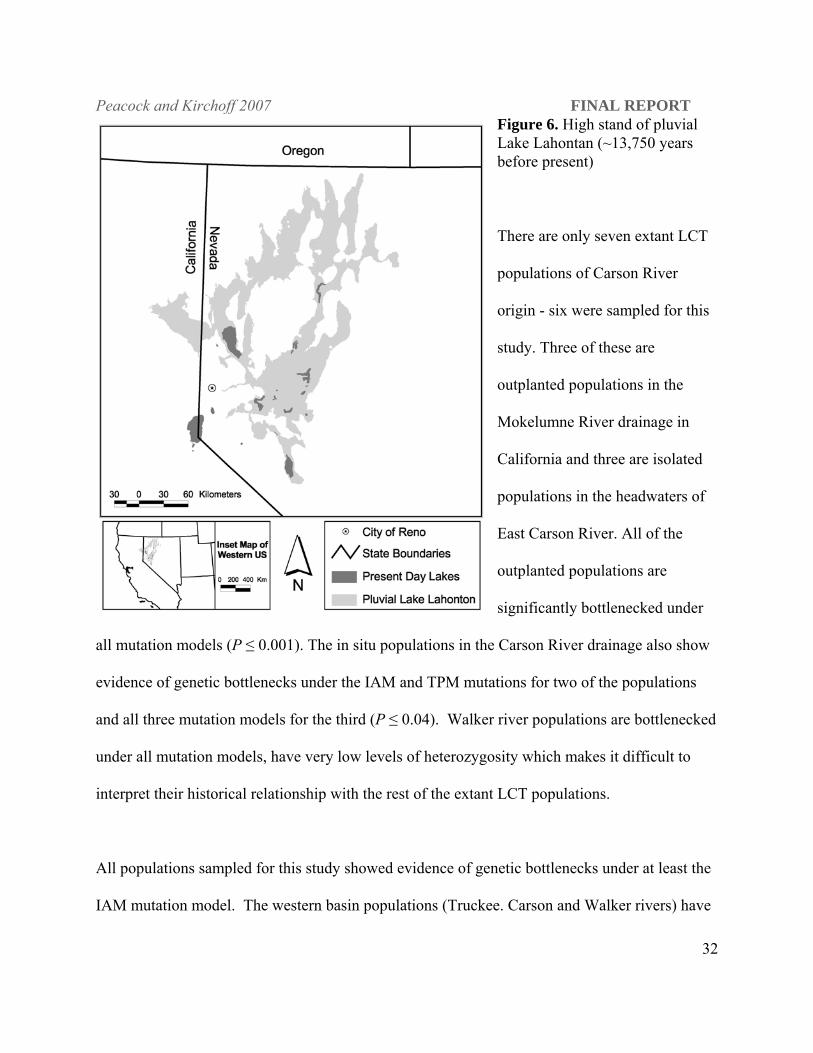
Little Humboldt River drainage were inundated by pluvial Lake Lahontan during its high stand
(~13,750 years ago; Figure 6) providing a dispersal corridor for fish from the Quinn River into
the Humboldt River which may account for the cluster analysis results grouping Quinn River
fish with Reese and Little Humboldt river(s) LCT.
The Reese and Little Humboldt rivers are in the western portion of the large Humboldt River
drainage and are geographically closer to each other than to the other tributaries to the Humboldt
River sampled for this study. Most of the Quinn River drainage and the lower portions of the
Little Humboldt River drainage were inundated by pluvial Lake Lahontan during its high stand
(~13,750 years ago; Figure 5) providing a dispersal corridor for fish from the Quinn River into
the Humboldt River which may account for the cluster analysis results grouping Quinn River
fish with Reese and Little Humboldt river(s) LCT.
Peacock and Kirchoff 2007 FINAL REPORT
30
#1
#2
#3
1&2
2&3
#2
#1
#3
3
1&2
2&
#1
#2
#3
A B
Peacock and Kirchoff 2007 FINAL REPORT
31
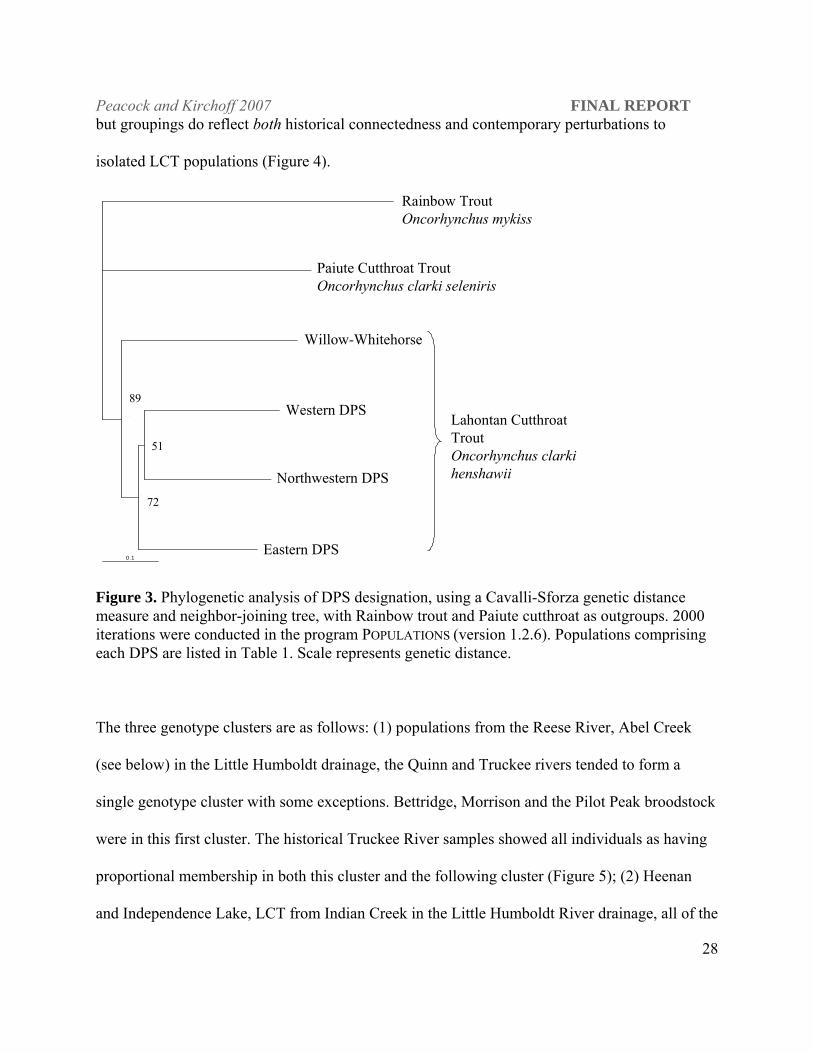
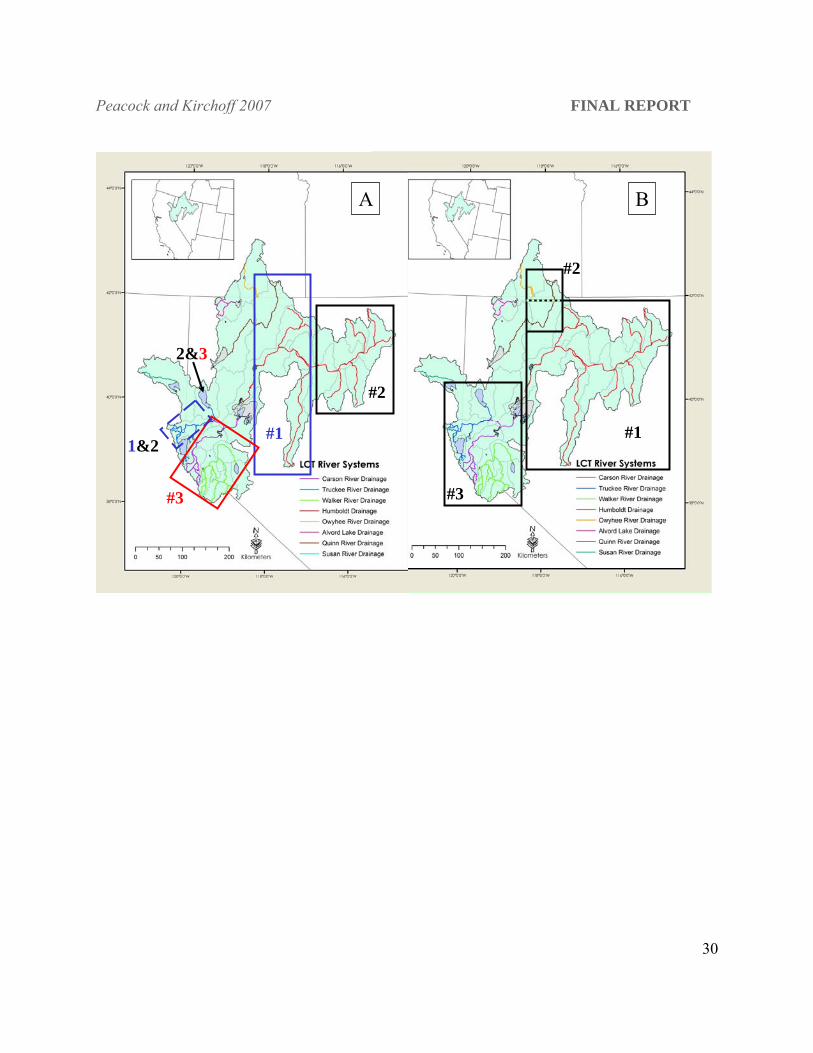
Figure 4. Map of Lahontan hydrographic basin showing panel (A) boxes represent distinct genotype cluster membership when K = 3 and panel (B) boxes represent current DPS designation.
Figure 5. Bayesian clustering analysis showing three separate genotype clusters indicated by color. Populations are designated by number on the X axis and separated by black vertical lines. Populations 1-6 are Truckee basin in origin – 1&2 are Bettridge, Morrison and Pilot Peak brood stock, 3 is Heenan and Independence and 4 is the historical Truckee River basin samples. Populations 7-18 are Carson and Walker river populations, 19-27 are Humboldt River, 28-29 are Reese River, 30-31 are Little Humboldt River, 32-35 are Quinn River, 36 is Pyramid Lake, 37and 38 are Willow-Whitehorse (see text for details on analysis).
Peacock and Kirchoff 2007 FINAL REPORT
32
Figure 6. High stand of pluvial Lake Lahontan (~13,750 years before present)
There are only seven extant LCT
populations of Carson River
origin - six were sampled for this
study. Three of these are
outplanted populations in the
Mokelumne River drainage in
California and three are isolated
populations in the headwaters of
East Carson River. All of the
outplanted populations are
significantly bottlenecked under
all mutation models (P ≤ 0.001). The in situ populations in the Carson River drainage also show
evidence of genetic bottlenecks under the IAM and TPM mutations for two of the populations
and all three mutation models for the third (P ≤ 0.04). Walker river populations are bottlenecked
under all mutation models, have very low levels of heterozygosity which makes it difficult to
interpret their historical relationship with the rest of the extant LCT populations.
All populations sampled for this study showed evidence of genetic bottlenecks under at least the
IAM mutation model. The western basin populations (Truckee. Carson and Walker rivers) have
Peacock and Kirchoff 2007 FINAL REPORT
33
been highly impacted by human development. Few natural populations remain in these
watersheds and tend to be small and very isolated. Random loss of genetic variation through the
genetic bottleneck process can erode information critical to reconstructing historical
phylogenetic relationships. This is likely the cause of the low bootstrap values seen in the
constructed phylogenetic trees and lack of clear genetic cohesion among the western basin
drainages. Never-the-less the pattern seen in the Bayesian clustering analysis supports the
phylogenetic analysis which supports a historical connection between the western (Truckee
River) and northwestern DPSs. Overall, despite the significant human impact to these
populations, geographic proximity and inundation by pluvial Lake Lahontan largely explains the
observed genetic relationships.
Population genetic structure within and among watersheds
Eastern basin DPS. The majority of naturally sustaining fluvial LCT populations are found in
the Humboldt River watershed (Figure 7). The Humboldt River is a large main stem river that
connected 1000's of kilometers of stream habitat pre-European settlement of the Lahontan basin.
Historically, fluvial LCT populations were interconnected at various temporal and spatial scales
facilitating wide-ranging movement. Although water still flows into the main stem Humboldt
River from ancillary drainages, water diversions have largely isolated LCT within headwater
systems in either single streams or small groups of tributaries. Here we use patterns of
population genetic structure on the landscape among both the remaining interconnected streams
and streams once connected but now isolated to assess the natural population dynamics of steam
living Lahontan cutthroat trout.
Peacock and Kirchoff 2007 FINAL REPORT
34
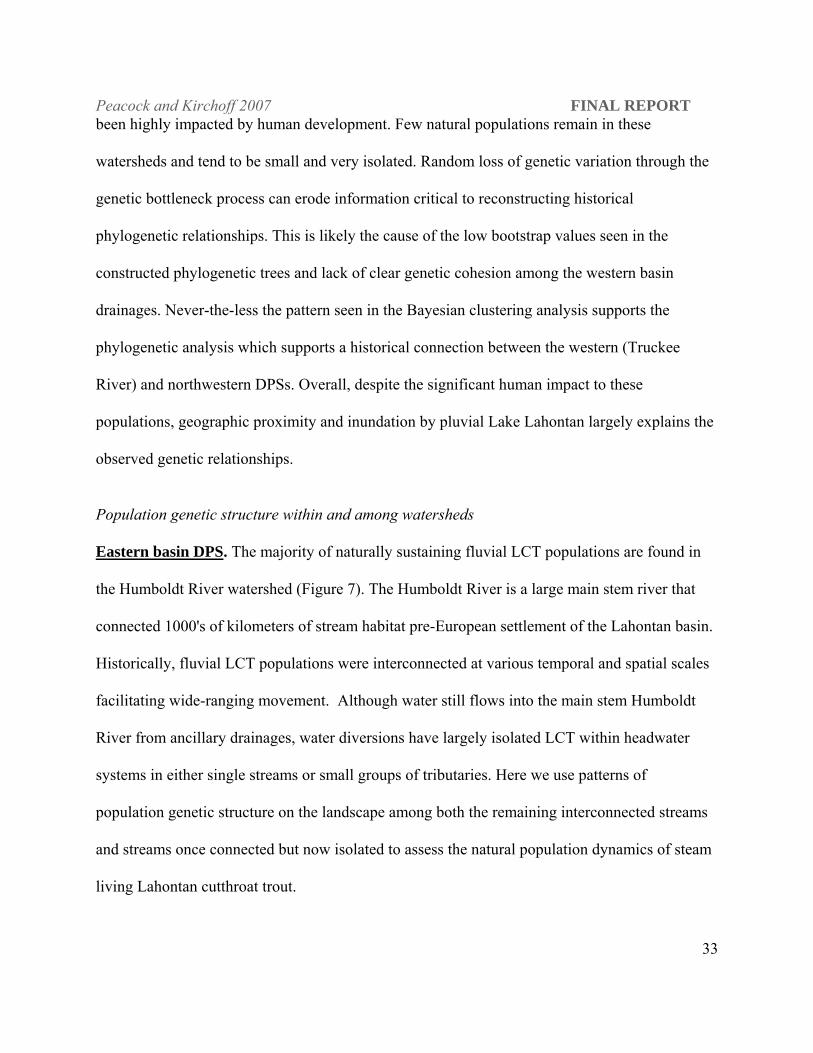
Figure 7. The Humboldt River basin shown in light shading on smaller inset map of the entire Lahontan basin. The larger map shows the Marys River, North Fork Humboldt River, Maggie Creek and Rock Creek (Frazer Creek) drainages (Figure reprinted from Peacock and Kirchoff 2004, Transactions of the American Fisheries Society 133:309-325).
Population level phylogenetic analysis shows that the two most geographically proximate
watersheds, the Marys and North Fork Humboldt rivers, form a single evolutionary clade that
clusters with the next geographically closest watershed, Maggie Creek, with strong bootstrap
support (70, Figures 8). Frazer Creek in the Rock Creek subbasin, the neighboring watershed to
the west, clusters with the Maggie Creek, Marys River and North Fork Humboldt River
populations with equally strong bootstrap support (69). Populations sampled in the Reese River
(Tierney and Mohawk creeks) cluster weakly with Abel Creek, while Indian Creek groups with
the Humboldt populations but also with weak bootstrap support (Figure 8). Overall, phylogenetic
Peacock and Kirchoff 2007 FINAL REPORT
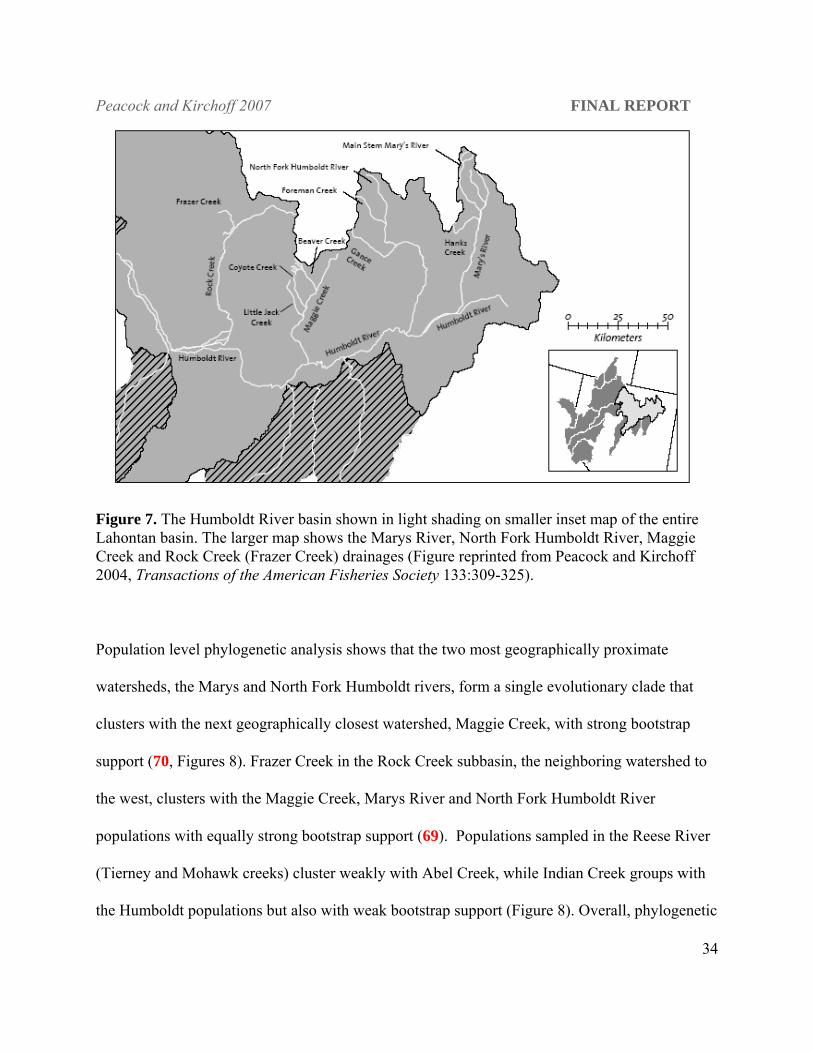
35
patterns reflect spatial structuring of populations on the landscape both within and among
watersheds. Low bootstrap values within clades likely reflect the effects of genetic bottlenecks
and low rates of gene flow from both anthropogenic and natural causes and concomitant loss of
gene diversity and phylogenetic signal.
0 . 1
P O P 1 4
P O P 1 1
P O P 1 0
P O P 1 2
3 6
2 3
P O P 1 3
P O P 6
P O P 7
P O P 8
P O P 9
4 9
3 1
P O P 4
P O P 3
P O P 1
P O P 2
7 8
P O P 5
2 8
1 9
2 5
7 0
6 9
4 2
PAIUTE CUTTHROAT
EMR
WMR
GANCE
FOREMAN
NFH
FRAZER
LITTLE JACK
COYOTE
BEAVER
MOHAWK
TIERNEY
ABEL
INDIAN
70
69MAGGIE CREEK
MARYS RIVER &NORTH FORK HUMBOLDT RIVER
REESE RIVER
LITTLE HUMBOLDT RIVER
Genetic Distance
42
49
78
36
31
28
19
29
23
Figure 8. Phylogenetic analysis of Humboldt River LCT populations using a Cavalli-Sforza genetic distance measure and a neighboring-joining tree with Paiute cutthroat trout as the outgroup. 2000 iterations were conducted in POPULATIONS (version 1.2.26) with bootstrap values indicated at the tree nodes. Red highlighted bootstrap values (69 and 70) indicate major grouping of geographically proximate populations in the Humboldt River drainage (See Table 1 for population abbreviations). EMR and WMR (78) are in the interconnected Marys River basin.
Interconnected watersheds
Peacock and Kirchoff 2007 FINAL REPORT
36
2) Is there evidence for a metapopulation dynamic within the few remaining interconnected
stream habitats within the Lahontan basin across habitat types?
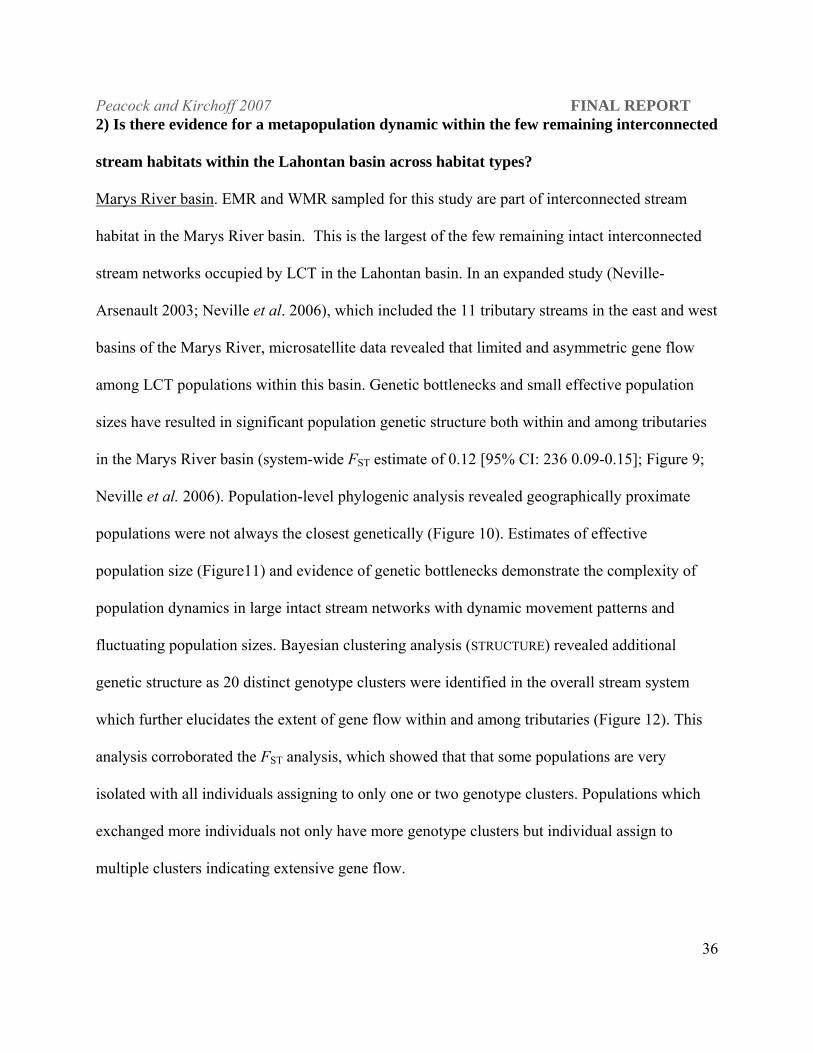
Marys River basin. EMR and WMR sampled for this study are part of interconnected stream
habitat in the Marys River basin. This is the largest of the few remaining intact interconnected
stream networks occupied by LCT in the Lahontan basin. In an expanded study (Neville-
Arsenault 2003; Neville et al. 2006), which included the 11 tributary streams in the east and west
basins of the Marys River, microsatellite data revealed that limited and asymmetric gene flow
among LCT populations within this basin. Genetic bottlenecks and small effective population
sizes have resulted in significant population genetic structure both within and among tributaries
in the Marys River basin (system-wide FST estimate of 0.12 [95% CI: 236 0.09-0.15]; Figure 9;
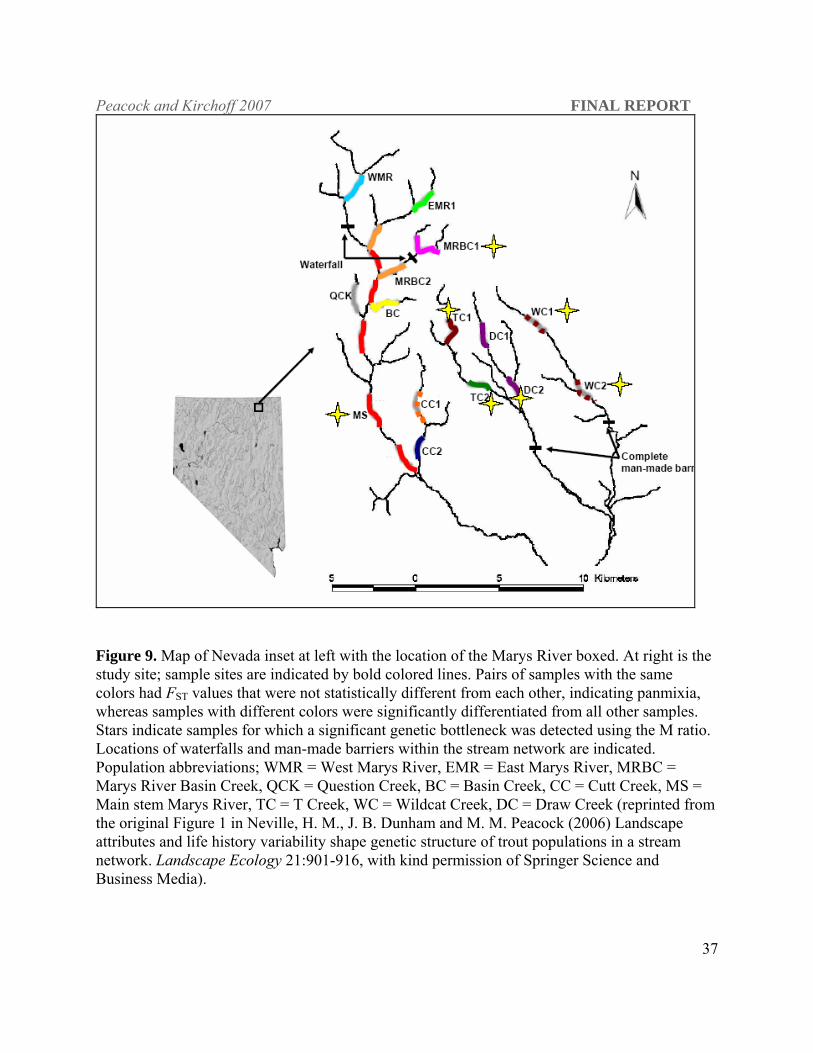
Neville et al. 2006). Population-level phylogenic analysis revealed geographically proximate
populations were not always the closest genetically (Figure 10). Estimates of effective
population size (Figure11) and evidence of genetic bottlenecks demonstrate the complexity of
population dynamics in large intact stream networks with dynamic movement patterns and
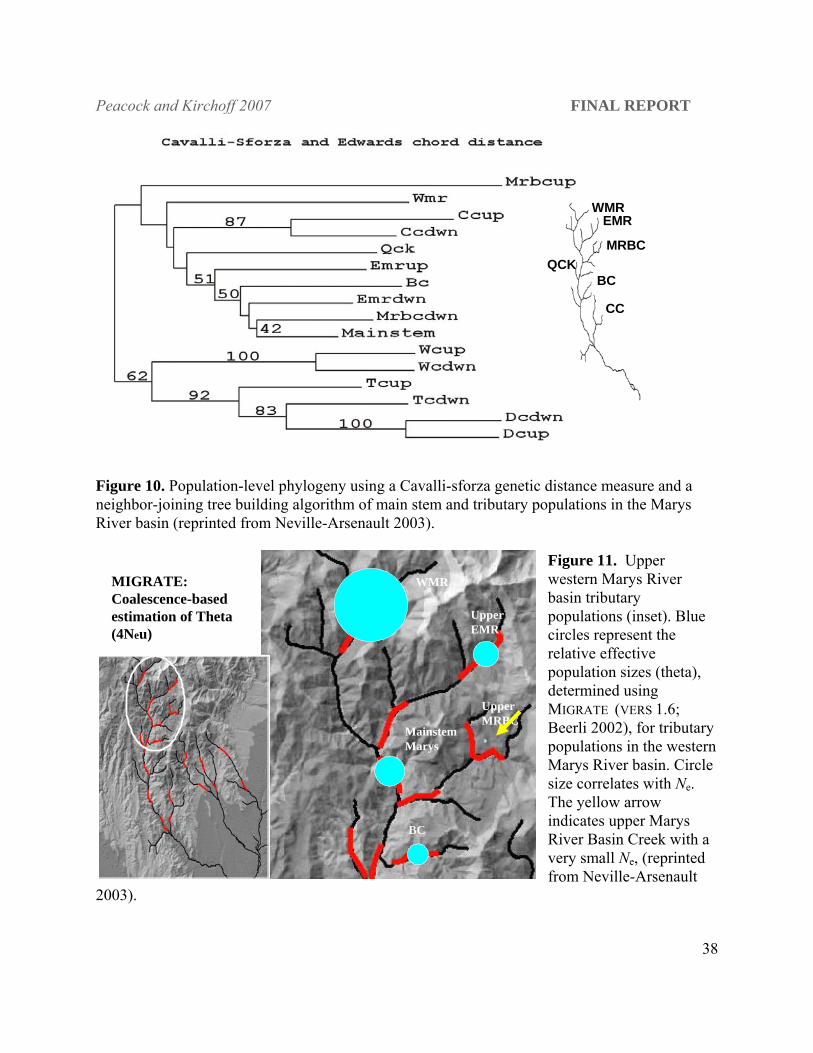
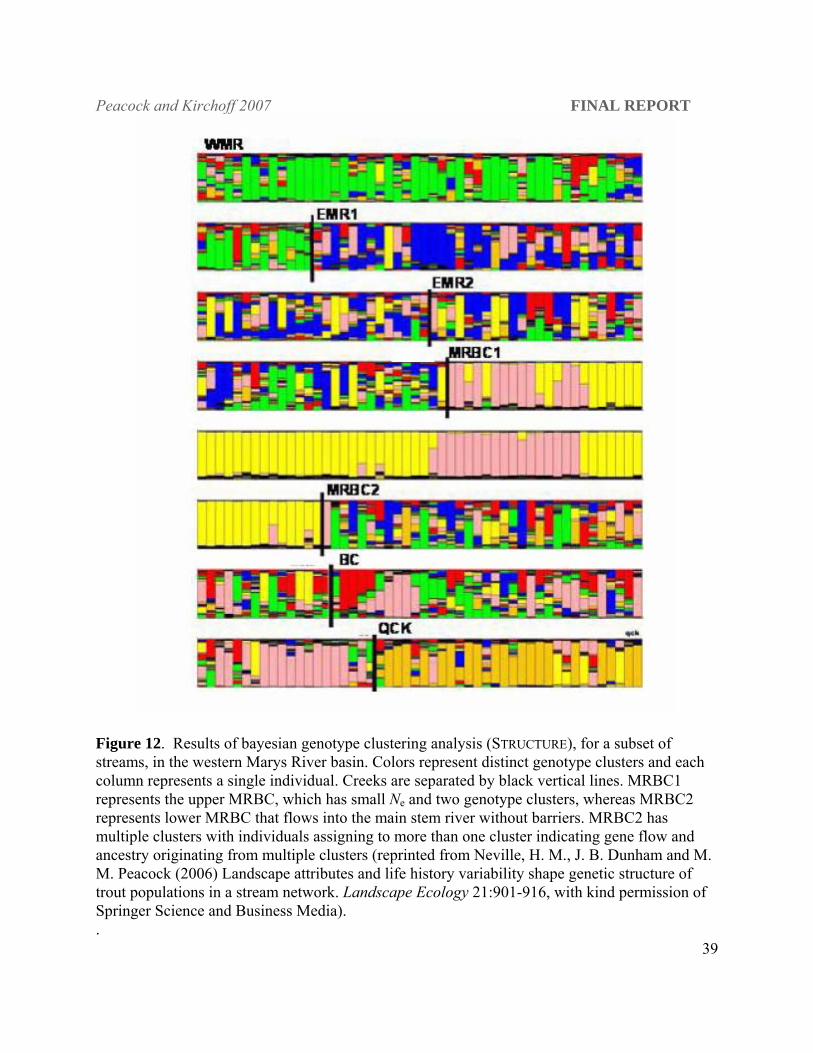
fluctuating population sizes. Bayesian clustering analysis (STRUCTURE) revealed additional
genetic structure as 20 distinct genotype clusters were identified in the overall stream system
which further elucidates the extent of gene flow within and among tributaries (Figure 12). This
analysis corroborated the FST analysis, which showed that that some populations are very
isolated with all individuals assigning to only one or two genotype clusters. Populations which
exchanged more individuals not only have more genotype clusters but individual assign to
multiple clusters indicating extensive gene flow.
Peacock and Kirchoff 2007 FINAL REPORT
37
Figure 9. Map of Nevada inset at left with the location of the Marys River boxed. At right is the study site; sample sites are indicated by bold colored lines. Pairs of samples with the same colors had FST values that were not statistically different from each other, indicating panmixia, whereas samples with different colors were significantly differentiated from all other samples. Stars indicate samples for which a significant genetic bottleneck was detected using the M ratio. Locations of waterfalls and man-made barriers within the stream network are indicated. Population abbreviations; WMR = West Marys River, EMR = East Marys River, MRBC = Marys River Basin Creek, QCK = Question Creek, BC = Basin Creek, CC = Cutt Creek, MS = Main stem Marys River, TC = T Creek, WC = Wildcat Creek, DC = Draw Creek (reprinted from the original Figure 1 in Neville, H. M., J. B. Dunham and M. M. Peacock (2006) Landscape attributes and life history variability shape genetic structure of trout populations in a stream network. Landscape Ecology 21:901-916, with kind permission of Springer Science and Business Media).
Peacock and Kirchoff 2007 FINAL REPORT
38
MRBC
EMRWMR
QCKBC
CC
MRBC
EMRWMR
QCKBC
CC
Figure 10. Population-level phylogeny using a Cavalli-sforza genetic distance measure and a neighbor-joining tree building algorithm of main stem and tributary populations in the Marys River basin (reprinted from Neville-Arsenault 2003).
Figure 11. Upper western Marys River basin tributary populations (inset). Blue circles represent the relative effective population sizes (theta), determined using MIGRATE (VERS 1.6; Beerli 2002), for tributary populations in the western Marys River basin. Circle size correlates with Ne. The yellow arrow indicates upper Marys River Basin Creek with a very small Ne, (reprinted from Neville-Arsenault
2003).
MIGRATE: Coalescence-based estimation of Theta(4Neu)
UpperMRBC
UpperEMR
MainstemMarys
BC
WMR
Peacock and Kirchoff 2007 FINAL REPORT
39
Figure 12. Results of bayesian genotype clustering analysis (STRUCTURE), for a subset of streams, in the western Marys River basin. Colors represent distinct genotype clusters and each column represents a single individual. Creeks are separated by black vertical lines. MRBC1 represents the upper MRBC, which has small Ne and two genotype clusters, whereas MRBC2 represents lower MRBC that flows into the main stem river without barriers. MRBC2 has multiple clusters with individuals assigning to more than one cluster indicating gene flow and ancestry originating from multiple clusters (reprinted from Neville, H. M., J. B. Dunham and M. M. Peacock (2006) Landscape attributes and life history variability shape genetic structure of trout populations in a stream network. Landscape Ecology 21:901-916, with kind permission of Springer Science and Business Media). .

Peacock and Kirchoff 2007 FINAL REPORT
40
Overall, the genetic patterns observed in this basin reflect local diversity in landscape and
perhaps population characteristics, which are more likely to emerge in larger basins like the
Marys River and may represent patterns that were once common to LCT populations prior to
widespread anthropogenic fragmentation of stream networks (Neville Arsenault 2003; Neville et
al. 2006).
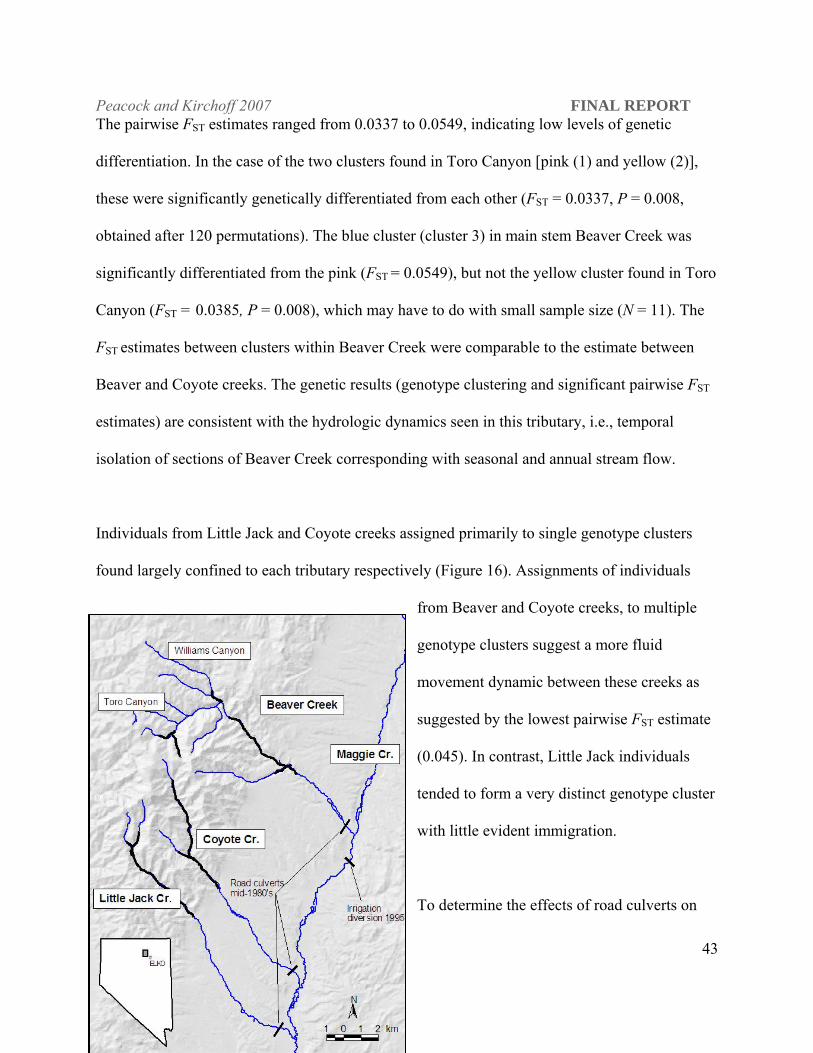
Maggie Creek basin. Similar to the Marys River basin, patterns of complex population structure
were observed in the smaller, but interconnected stream system in the Maggie Creek basin
(Figure 13). In the Maggie Creek basin only three tributaries have (historically and
contemporaneously) suitable habitat for LCT; Beaver, Coyote and Little Jack creeks. These
tributaries are connected via main stem Maggie Creek. The main tributary of Beaver Creek, the
largest and most diverse tributary in the Maggie Creek system, occupies ~10 km of habitat
during base flows, including multiple smaller headwater reaches that flow into Beaver Creek
proper (e.g., Toro Canyon and Williams Canyon creeks, Figure 13; Harig et al. 2004). However,
the headwater reaches can be seasonally disjunct from main stem Beaver Creek during base flow
conditions; for example Toro Canyon was isolated from main stem Beaver Creek by
approximately 5 km of dry streambed during the 2002 sampling season. Coyote and Little Jack
creeks are smaller, have fewer kilometers of occupiable stream (~ 7 km each at base flow), and
have less diverse habitats, with only single headwater tributaries flowing into the main stem
creeks. All streams have the potential to be isolated seasonally, as lower sections of the creeks
and of the main stem Maggie Creek can dry completely during low flow periods. Little Jack
Creek is physically the most isolated of the occupied streams in the system. during base flow

Peacock and Kirchoff 2007 FINAL REPORT
41
conditions the occupied reaches in Beaver and Coyote creeks are separated by ~ 30 km and their
confluences with Maggie creek are separated by ~ 10 km. In contrast, the occupied reaches in
adjacent Coyote and Little Jack creeks are also separated by ~ 30 km, but their confluences with
Maggie Creek are only 4 km apart. Little Jack Creek is a smaller tributary habitat and during
base flows the occupied reach is farther from the confluence with the main stem Maggie Creek.
As such the LCT in Little Jack may be more isolated than LCT in the other tributaries.
The tributaries to Maggie Creek may be currently isolated by a series of man-made, potential
barriers to dispersal movements (Note: these barriers were present at the time of sampling but
have now been removed). Because our interests include both historical and contemporary
patterns of movement we assessed whether these structures function as barriers to contemporary
movement as evidenced by levels of current gene flow. There are two road culverts in the system
that act as partial/seasonal barriers to upstream movement; one each on Coyote and Little Jack
creeks near the confluence with main stem Maggie Creek (see Figure 13). Two additional
structures, a road culvert on Beaver creek and a culvert and irrigation diversion on main stem
Maggie creek, may act as complete barriers to contemporary movement. There have been road
culverts of some kind on these creeks on and off for an undetermined length of time, however,
the current tributary culverts were put in place in mid-1980’s. The irrigation barrier on the main
stem Maggie Creek was installed in 1995. At the time of sampling, fish were found in the upper
headwater reaches of these three tributaries and one individual was found in the main stem
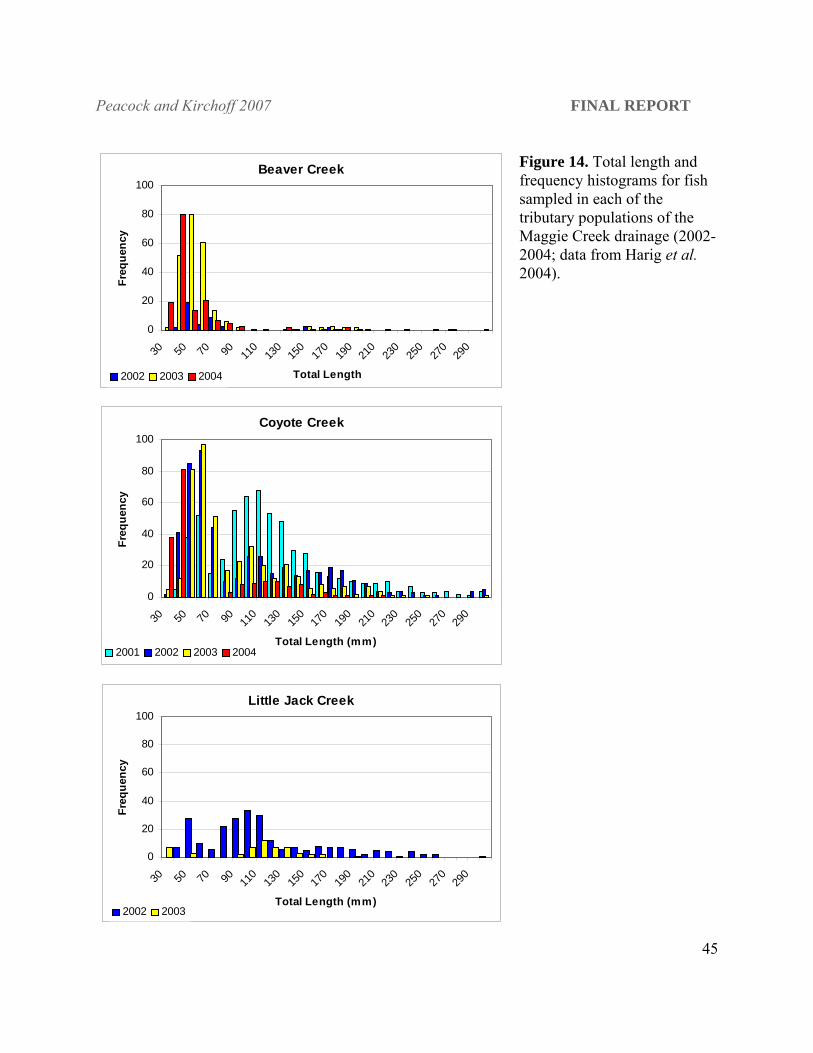
Maggie Creek. All Maggie Creek tributary populations had a full complement of size
classes,suggesting resident populations (see Harig et al. 2004; Figure 14).
Peacock and Kirchoff 2007 FINAL REPORT
42
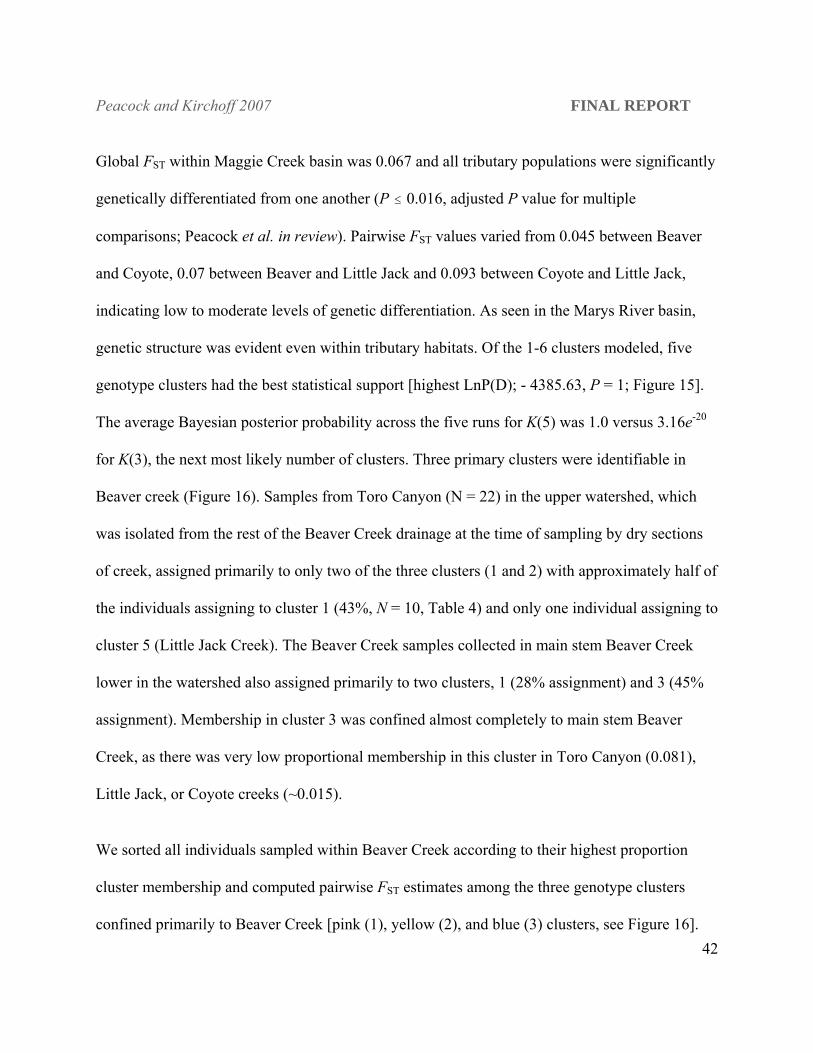
Global FST within Maggie Creek basin was 0.067 and all tributary populations were significantly
genetically differentiated from one another (P # 0.016, adjusted P value for multiple
comparisons; Peacock et al. in review). Pairwise FST values varied from 0.045 between Beaver
and Coyote, 0.07 between Beaver and Little Jack and 0.093 between Coyote and Little Jack,
indicating low to moderate levels of genetic differentiation. As seen in the Marys River basin,
genetic structure was evident even within tributary habitats. Of the 1-6 clusters modeled, five
genotype clusters had the best statistical support [highest LnP(D); - 4385.63, P = 1; Figure 15].
The average Bayesian posterior probability across the five runs for K(5) was 1.0 versus 3.16e-20
for K(3), the next most likely number of clusters. Three primary clusters were identifiable in
Beaver creek (Figure 16). Samples from Toro Canyon (N = 22) in the upper watershed, which
was isolated from the rest of the Beaver Creek drainage at the time of sampling by dry sections
of creek, assigned primarily to only two of the three clusters (1 and 2) with approximately half of
the individuals assigning to cluster 1 (43%, N = 10, Table 4) and only one individual assigning to
cluster 5 (Little Jack Creek). The Beaver Creek samples collected in main stem Beaver Creek
lower in the watershed also assigned primarily to two clusters, 1 (28% assignment) and 3 (45%
assignment). Membership in cluster 3 was confined almost completely to main stem Beaver
Creek, as there was very low proportional membership in this cluster in Toro Canyon (0.081),
Little Jack, or Coyote creeks (~0.015).
We sorted all individuals sampled within Beaver Creek according to their highest proportion
cluster membership and computed pairwise FST estimates among the three genotype clusters
confined primarily to Beaver Creek [pink (1), yellow (2), and blue (3) clusters, see Figure 16].
Peacock and Kirchoff 2007 FINAL REPORT
43
The pairwise FST estimates ranged from 0.0337 to 0.0549, indicating low levels of genetic
differentiation. In the case of the two clusters found in Toro Canyon [pink (1) and yellow (2)],
these were significantly genetically differentiated from each other (FST = 0.0337, P = 0.008,
obtained after 120 permutations). The blue cluster (cluster 3) in main stem Beaver Creek was
significantly differentiated from the pink (FST = 0.0549), but not the yellow cluster found in Toro
Canyon (FST = 0.0385, P = 0.008), which may have to do with small sample size (N = 11). The
FST estimates between clusters within Beaver Creek were comparable to the estimate between
Beaver and Coyote creeks. The genetic results (genotype clustering and significant pairwise FST
estimates) are consistent with the hydrologic dynamics seen in this tributary, i.e., temporal
isolation of sections of Beaver Creek corresponding with seasonal and annual stream flow.
Individuals from Little Jack and Coyote creeks assigned primarily to single genotype clusters
found largely confined to each tributary respectively (Figure 16). Assignments of individuals
from Beaver and Coyote creeks, to multiple
genotype clusters suggest a more fluid
movement dynamic between these creeks as
suggested by the lowest pairwise FST estimate
(0.045). In contrast, Little Jack individuals
tended to form a very distinct genotype cluster
with little evident immigration.
To determine the effects of road culverts on
Peacock and Kirchoff 2007 FINAL REPORT
44
current movement among tributary populations we used the “detection of first generation
migrants” module in GeneClass2. We determined that three individuals sampled from Beaver
Creek were first generation immigrants from neighboring Coyote Creek (P < 0.002). One of
these individuals was sampled in Toro Canyon in the upper Beaver Creek drainage. Five
individuals sampled in Coyote Creek were immigrants from Beaver Creek (P < 0.007) and
additional immigrant assigned to Little Jack Creek (P > 0.000). One immigrant was identified in
Little Jack Creek and assigned to Coyote Creek (P > 0.000). Ne was not calculated for the
Maggie Creek streams, but the M ratio test showed all three tributary populations to have
experienced genetic bottlenecks (M for Beaver = 0.596, Coyote = 0.655, and Little Jack =
0.625).
Figure 13. Maggie Creek basin with tributaries identified and position of road culverts indicated. Extent of occupied habitat during base flow is represented in each tributary by highlighted area within the stream channel.
Peacock and Kirchoff 2007 FINAL REPORT
45
Figure 14. Total length and frequency histograms for fish sampled in each of the tributary populations of the Maggie Creek drainage (2002-2004; data from Harig et al. 2004).
Beaver Creek
0
20
40
60
80
100
30 50 70 90 110
130
150
170
190
210
230
250
270
290
Total Length
Freq
uenc
y
2002 2003 2004
Coyote Creek
0
20
40
60
80
100
30 50 70 90 110
130
150
170
190
210
230
250
270
290
Total Length (mm)
Freq
uenc
y
2001 2002 2003 2004
Little Jack Creek
0
20
40
60
80
100
30 50 70 90 110
130
150
170
190
210
230
250
270
290
Total Length (mm)
Freq
uenc
y
2002 2003
Peacock and Kirchoff 2007 FINAL REPORT
46
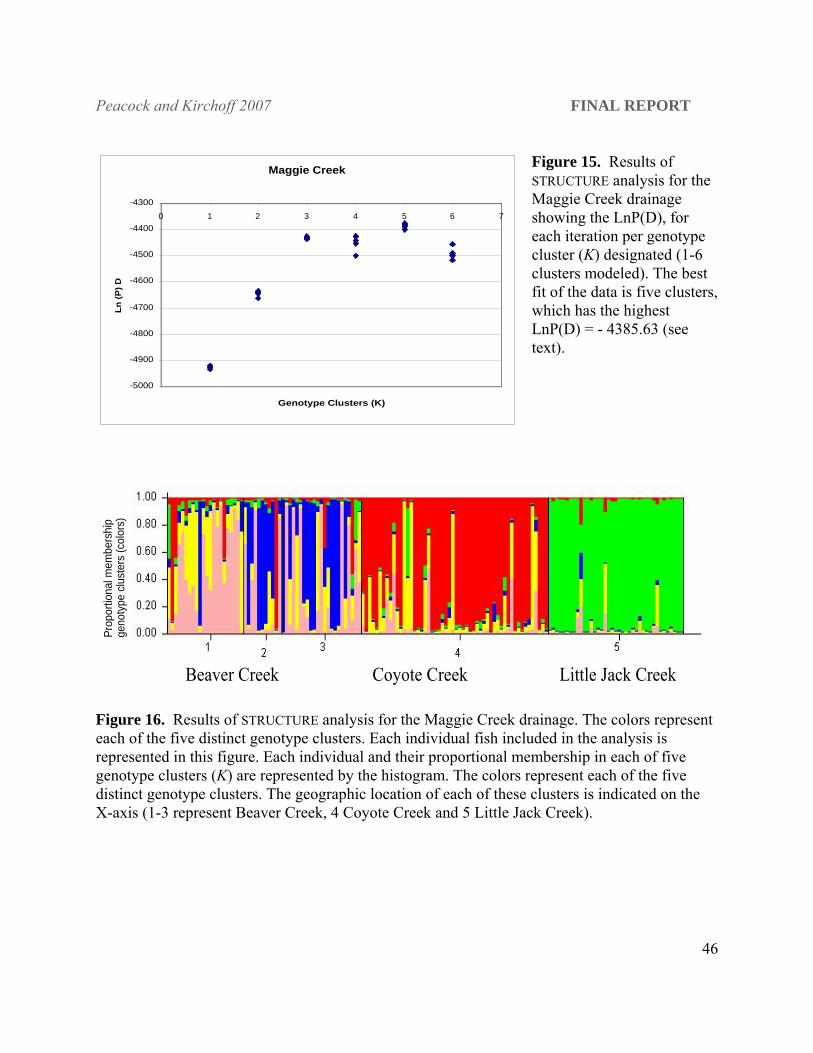
Figure 15. Results of STRUCTURE analysis for the Maggie Creek drainage showing the LnP(D), for each iteration per genotype cluster (K) designated (1-6 clusters modeled). The best fit of the data is five clusters, which has the highest LnP(D) = - 4385.63 (see text).
Maggie Creek
-5000
-4900
-4800
-4700
-4600
-4500
-4400
-43000 1 2 3 4 5 6 7
Genotype Clusters (K)
Ln (P
) D
Prop
ortio
nal m
embe
rshi
p ge
noty
pe c
lust
ers
(col
ors)
Beaver Creek Coyote Creek Little Jack Creek
Figure 16. Results of STRUCTURE analysis for the Maggie Creek drainage. The colors represent each of the five distinct genotype clusters. Each individual fish included in the analysis is represented in this figure. Each individual and their proportional membership in each of five genotype clusters (K) are represented by the histogram. The colors represent each of the five distinct genotype clusters. The geographic location of each of these clusters is indicated on the X-axis (1-3 represent Beaver Creek, 4 Coyote Creek and 5 Little Jack Creek).
Peacock and Kirchoff 2007 FINAL REPORT
47
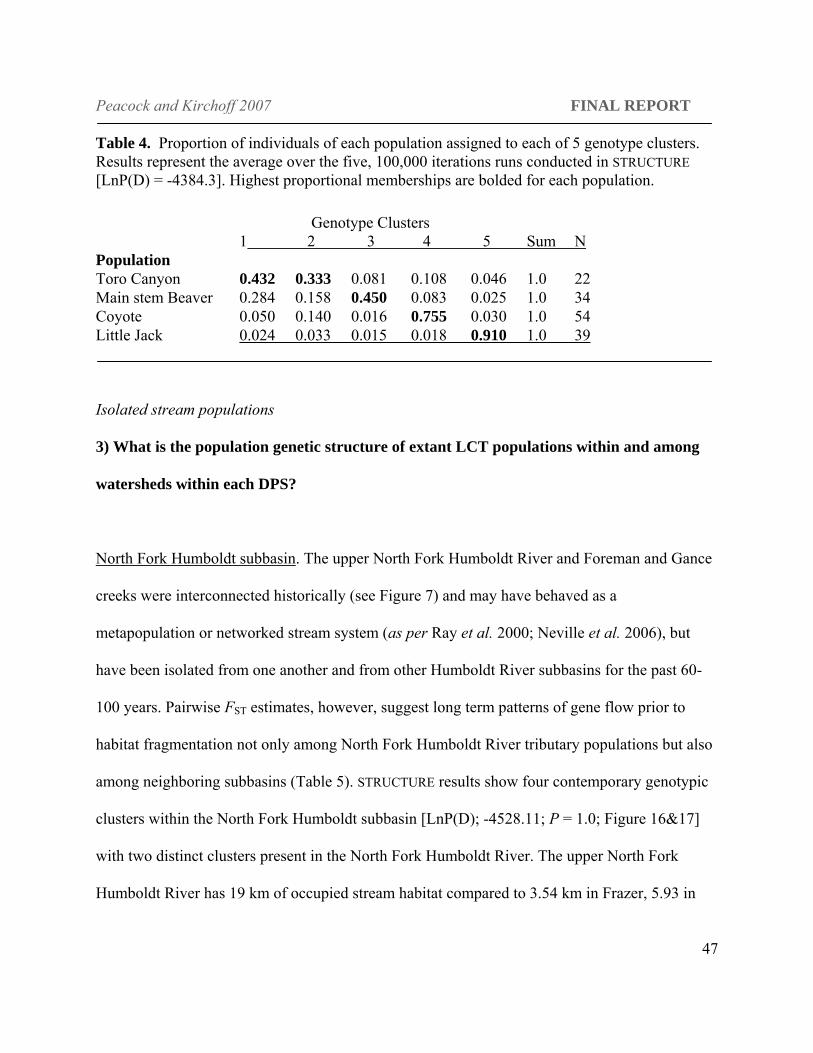
Table 4. Proportion of individuals of each population assigned to each of 5 genotype clusters. Results represent the average over the five, 100,000 iterations runs conducted in STRUCTURE [LnP(D) = -4384.3]. Highest proportional memberships are bolded for each population.
Genotype Clusters
1 2 3 4 5 Sum N Population Toro Canyon 0.432 0.333 0.081 0.108 0.046 1.0 22 Main stem Beaver 0.284 0.158 0.450 0.083 0.025 1.0 34 Coyote 0.050 0.140 0.016 0.755 0.030 1.0 54 Little Jack 0.024 0.033 0.015 0.018 0.910 1.0 39
Isolated stream populations
3) What is the population genetic structure of extant LCT populations within and among
watersheds within each DPS?
North Fork Humboldt subbasin. The upper North Fork Humboldt River and Foreman and Gance
creeks were interconnected historically (see Figure 7) and may have behaved as a
metapopulation or networked stream system (as per Ray et al. 2000; Neville et al. 2006), but
have been isolated from one another and from other Humboldt River subbasins for the past 60-
100 years. Pairwise FST estimates, however, suggest long term patterns of gene flow prior to
habitat fragmentation not only among North Fork Humboldt River tributary populations but also
among neighboring subbasins (Table 5). STRUCTURE results show four contemporary genotypic
clusters within the North Fork Humboldt subbasin [LnP(D); -4528.11; P = 1.0; Figure 16&17]
with two distinct clusters present in the North Fork Humboldt River. The upper North Fork
Humboldt River has 19 km of occupied stream habitat compared to 3.54 km in Frazer, 5.93 in
Peacock and Kirchoff 2007 FINAL REPORT
48
Foreman, and 8.55 in Gance creeks and concomitantly the largest LCT population among these
four streams (see Figure 2). Current isolation of gene pools within the North Fork Humboldt
River subbasin is evident, as there is very little overlap in cluster membership among extant
tributary populations. Frazer Creek forms a singular distinct genotype cluster consistent with its
isolated status (Figure 18). These four populations show evidence of genetic bottlenecks under
the infinite alleles mutation model (IAM; Wilcoxon Sign Rank test, P ≤ 0.001), but not under the
TPM or SMM.
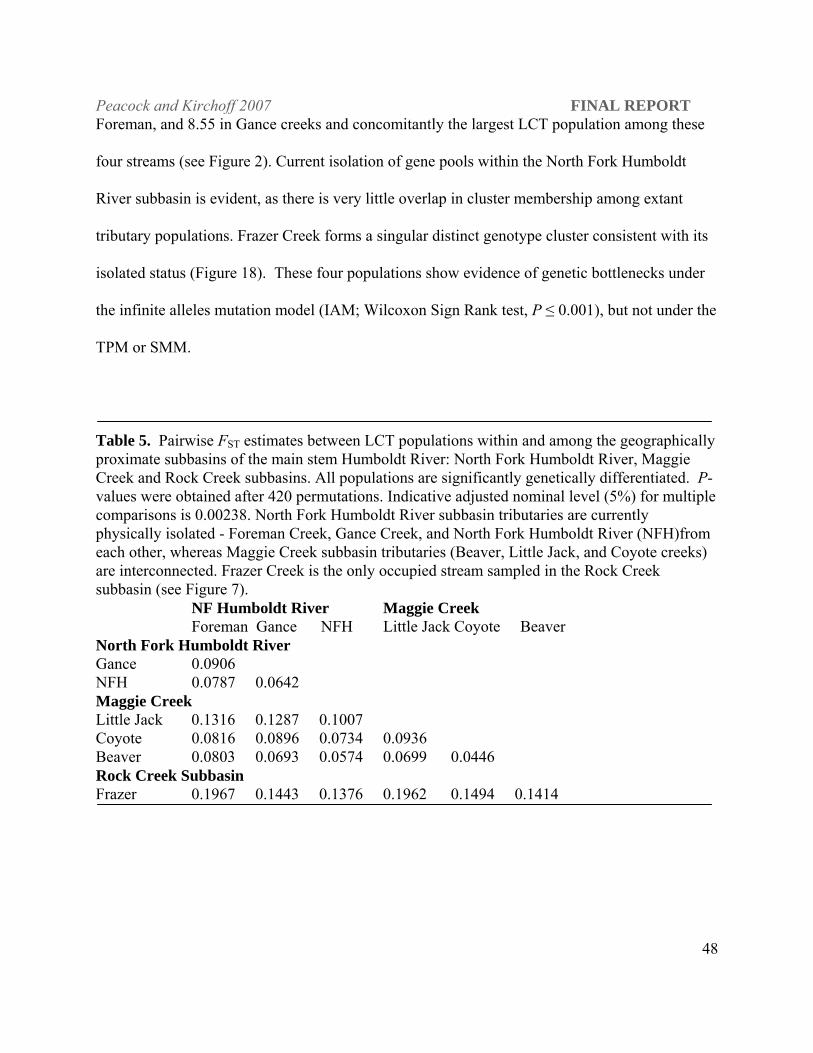
Table 5. Pairwise FST estimates between LCT populations within and among the geographically proximate subbasins of the main stem Humboldt River: North Fork Humboldt River, Maggie Creek and Rock Creek subbasins. All populations are significantly genetically differentiated. P-values were obtained after 420 permutations. Indicative adjusted nominal level (5%) for multiple comparisons is 0.00238. North Fork Humboldt River subbasin tributaries are currently physically isolated - Foreman Creek, Gance Creek, and North Fork Humboldt River (NFH)from each other, whereas Maggie Creek subbasin tributaries (Beaver, Little Jack, and Coyote creeks) are interconnected. Frazer Creek is the only occupied stream sampled in the Rock Creek subbasin (see Figure 7). NF Humboldt River Maggie Creek Foreman Gance NFH Little Jack Coyote Beaver North Fork Humboldt River Gance 0.0906 NFH 0.0787 0.0642 Maggie Creek Little Jack 0.1316 0.1287 0.1007 Coyote 0.0816 0.0896 0.0734 0.0936 Beaver 0.0803 0.0693 0.0574 0.0699 0.0446 Rock Creek Subbasin Frazer 0.1967 0.1443 0.1376 0.1962 0.1494 0.1414

Peacock and Kirchoff 2007 FINAL REPORT
49
Figure 17. Results of STRUCTURE analysis for the North Fork Humboldt River and Rock Creek subbasin populations showing the LnP(D) for each iteration per genotype cluster (K) designated (1-6 clusters modeled). The best fit of the data is five clusters with the highest LnP( D) (see text).
North Fork Humboldt
-4750
-4700
-4650
-4600
-4550
-45000 1 2 3 4 5 6
Genotype Clusters (K)
Ln (P
) D
7
Prop
ortio
nal m
embe
rshi
p ge
noty
pe c
lust
ers
(col
ors)
NF Humboldt River Foreman Gance Frazer Figure 18. The proportional membership of each individual fish in each of five genotype clusters can be assessed by the proportion of each color assigned to each individual column, e.g., individual number one in the North Fork Humboldt River is primarily red, whereas individual two is primarily yellow, suggesting these individuals come from two separate breeding groups. Individual three assigns to the red, green, blue and yellow clusters, which suggests mixed ancestry from the different interbreeding clusters. The geographic location of each of these clusters is indicated on the X-axis.
Reese River subbasin. Mohawk and Tierney creeks in the Reese River subbasin, which
historically drained into the larger Humboldt River, support relatively small populations
compared to streams in the North Fork Humboldt and Rock Creek subbasins despite similar
length (linear km) of occupied habitat (see Figure 2). Dunham et al. (2002) showed that LCT
Peacock and Kirchoff 2007 FINAL REPORT
50
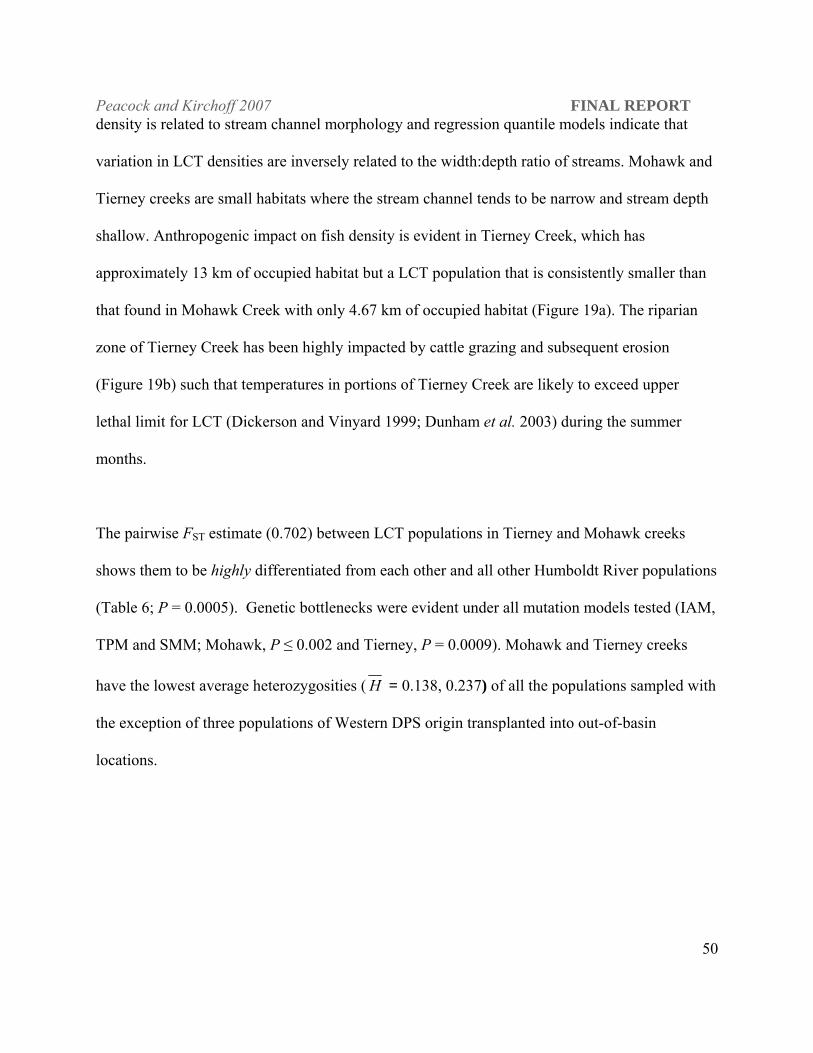
density is related to stream channel morphology and regression quantile models indicate that
variation in LCT densities are inversely related to the width:depth ratio of streams. Mohawk and
Tierney creeks are small habitats where the stream channel tends to be narrow and stream depth
shallow. Anthropogenic impact on fish density is evident in Tierney Creek, which has
approximately 13 km of occupied habitat but a LCT population that is consistently smaller than
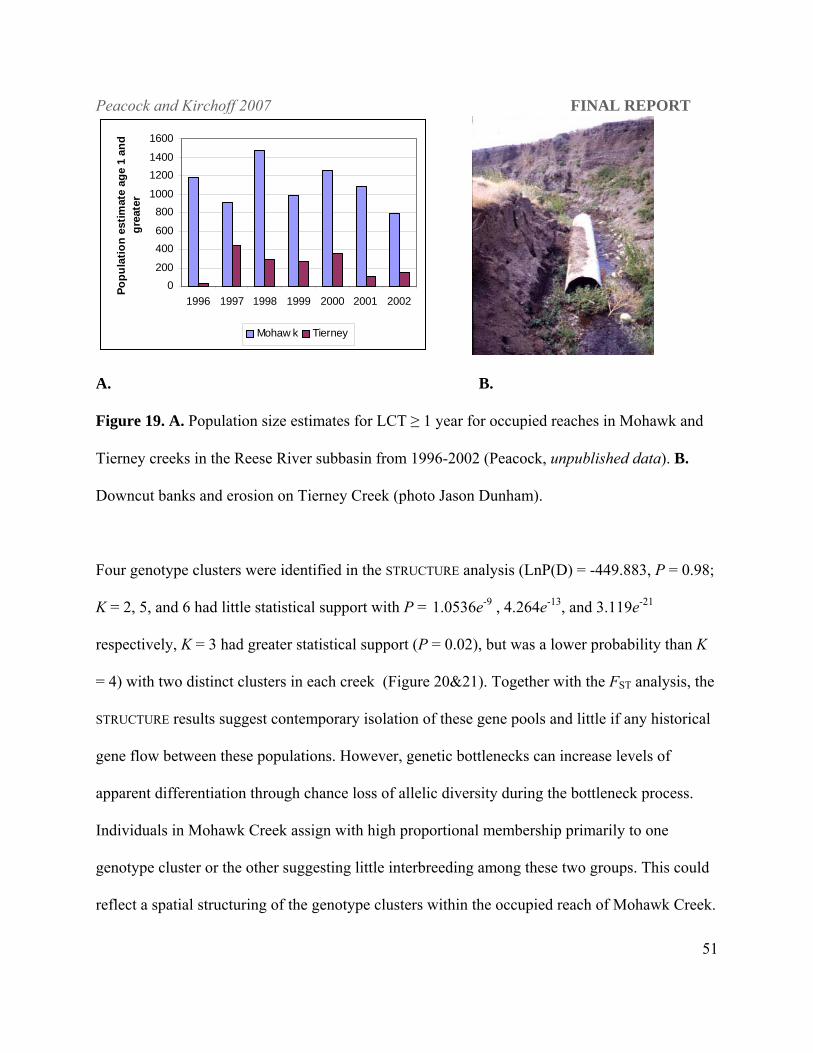
that found in Mohawk Creek with only 4.67 km of occupied habitat (Figure 19a). The riparian
zone of Tierney Creek has been highly impacted by cattle grazing and subsequent erosion
(Figure 19b) such that temperatures in portions of Tierney Creek are likely to exceed upper
lethal limit for LCT (Dickerson and Vinyard 1999; Dunham et al. 2003) during the summer
months.
The pairwise FST estimate (0.702) between LCT populations in Tierney and Mohawk creeks
shows them to be highly differentiated from each other and all other Humboldt River populations
(Table 6; P = 0.0005). Genetic bottlenecks were evident under all mutation models tested (IAM,
TPM and SMM; Mohawk, P ≤ 0.002 and Tierney, P = 0.0009). Mohawk and Tierney creeks
have the lowest average heterozygosities ( H = 0.138, 0.237) of all the populations sampled with
the exception of three populations of Western DPS origin transplanted into out-of-basin
locations.
Peacock and Kirchoff 2007 FINAL REPORT
51
0200
400600
8001000
12001400
1600
1996 1997 1998 1999 2000 2001 2002
Popu
latio
n es
timat
e ag
e 1
and
grea
ter
Mohaw k Tierney
A. B.
Figure 19. A. Population size estimates for LCT ≥ 1 year for occupied reaches in Mohawk and
Tierney creeks in the Reese River subbasin from 1996-2002 (Peacock, unpublished data). B.
Downcut banks and erosion on Tierney Creek (photo Jason Dunham).
Four genotype clusters were identified in the STRUCTURE analysis (LnP(D) = -449.883, P = 0.98;
K = 2, 5, and 6 had little statistical support with P = 1.0536e-9 , 4.264e-13, and 3.119e-21
respectively, K = 3 had greater statistical support (P = 0.02), but was a lower probability than K
= 4) with two distinct clusters in each creek (Figure 20&21). Together with the FST analysis, the
STRUCTURE results suggest contemporary isolation of these gene pools and little if any historical
gene flow between these populations. However, genetic bottlenecks can increase levels of
apparent differentiation through chance loss of allelic diversity during the bottleneck process.
Individuals in Mohawk Creek assign with high proportional membership primarily to one
genotype cluster or the other suggesting little interbreeding among these two groups. This could
reflect a spatial structuring of the genotype clusters within the occupied reach of Mohawk Creek.
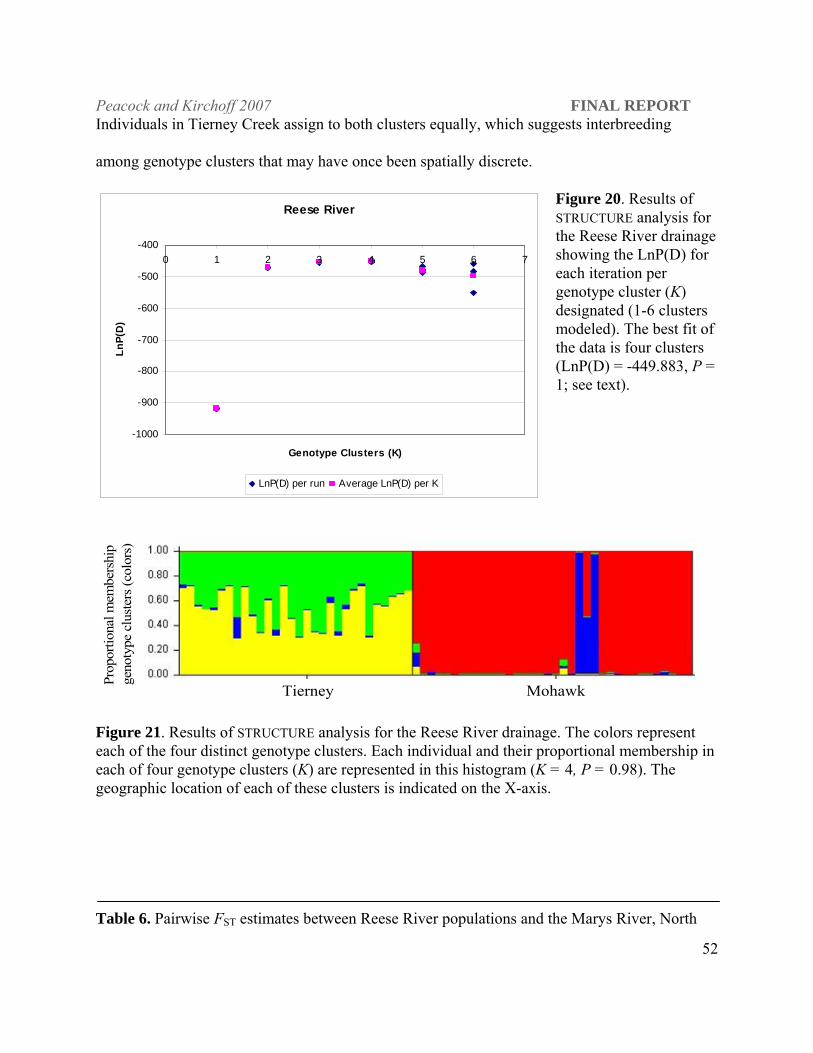
Peacock and Kirchoff 2007 FINAL REPORT
52
Individuals in Tierney Creek assign to both clusters equally, which suggests interbreeding
among genotype clusters that may have once been spatially discrete.
Figure 20. Results of STRUCTURE analysis for the Reese River drainage showing the LnP(D) for each iteration per genotype cluster (K) designated (1-6 clusters modeled). The best fit of the data is four clusters (LnP(D) = -449.883, P = 1; see text).
Reese River
-1000
-900
-800
-700
-600
-500
-4000 1 2 3 4 5 6 7
Genotype Clusters (K)
LnP(
D)
LnP(D) per run Average LnP(D) per K
Tierney Mohawk
Prop
ortio
nal m
embe
rshi
p ge
noty
pe c
lust
ers (
colo
rs)
Figure 21. Results of STRUCTURE analysis for the Reese River drainage. The colors represent each of the four distinct genotype clusters. Each individual and their proportional membership in each of four genotype clusters (K) are represented in this histogram (K = 4, P = 0.98). The geographic location of each of these clusters is indicated on the X-axis. Table 6. Pairwise FST estimates between Reese River populations and the Marys River, North
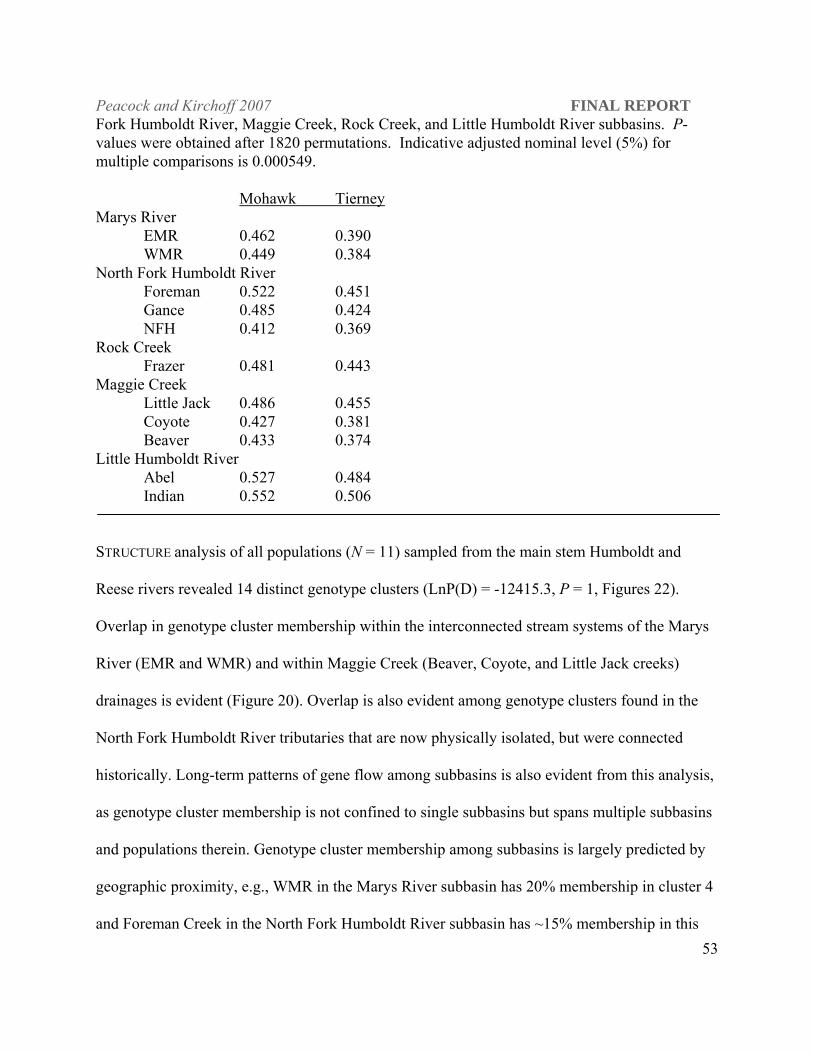
Peacock and Kirchoff 2007 FINAL REPORT
53
Fork Humboldt River, Maggie Creek, Rock Creek, and Little Humboldt River subbasins. P-values were obtained after 1820 permutations. Indicative adjusted nominal level (5%) for multiple comparisons is 0.000549. Mohawk Tierney Marys River
EMR 0.462 0.390 WMR 0.449 0.384
North Fork Humboldt River Foreman 0.522 0.451 Gance 0.485 0.424 NFH 0.412 0.369
Rock Creek Frazer 0.481 0.443
Maggie Creek Little Jack 0.486 0.455 Coyote 0.427 0.381 Beaver 0.433 0.374
Little Humboldt River Abel 0.527 0.484 Indian 0.552 0.506
STRUCTURE analysis of all populations (N = 11) sampled from the main stem Humboldt and
Reese rivers revealed 14 distinct genotype clusters (LnP(D) = -12415.3, P = 1, Figures 22).
Overlap in genotype cluster membership within the interconnected stream systems of the Marys
River (EMR and WMR) and within Maggie Creek (Beaver, Coyote, and Little Jack creeks)
drainages is evident (Figure 20). Overlap is also evident among genotype clusters found in the
North Fork Humboldt River tributaries that are now physically isolated, but were connected
historically. Long-term patterns of gene flow among subbasins is also evident from this analysis,
as genotype cluster membership is not confined to single subbasins but spans multiple subbasins
and populations therein. Genotype cluster membership among subbasins is largely predicted by
geographic proximity, e.g., WMR in the Marys River subbasin has 20% membership in cluster 4
and Foreman Creek in the North Fork Humboldt River subbasin has ~15% membership in this
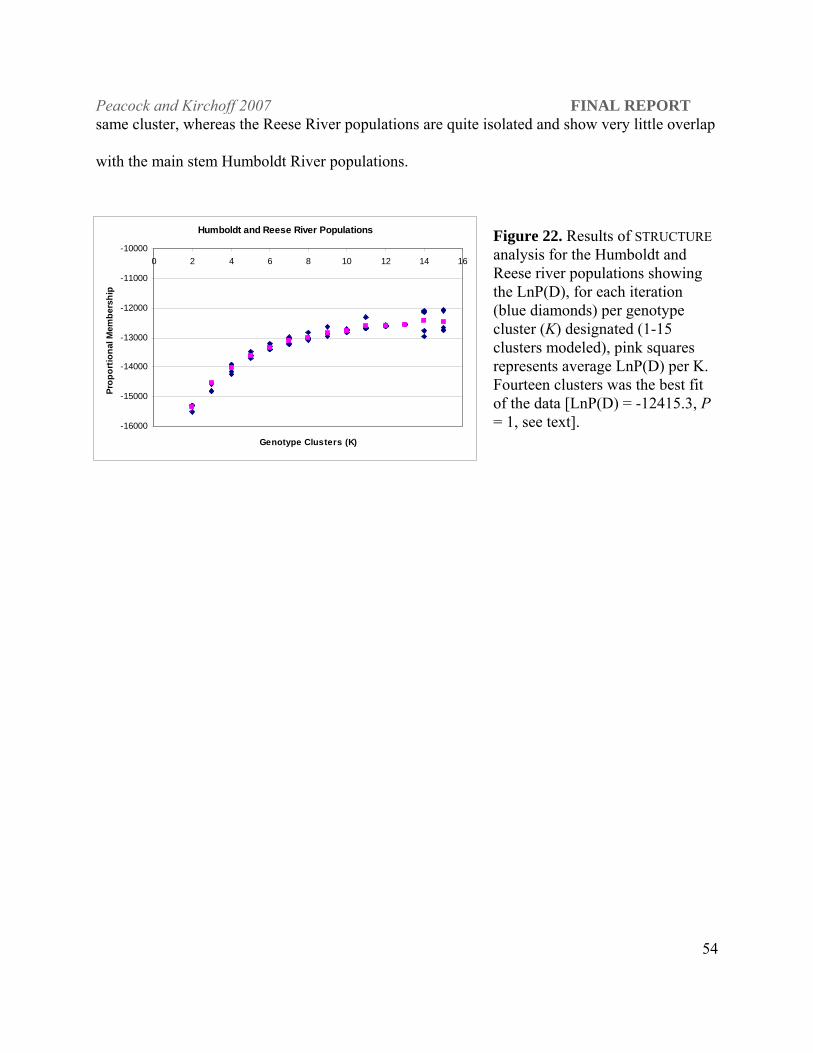
Peacock and Kirchoff 2007 FINAL REPORT
54
same cluster, whereas the Reese River populations are quite isolated and show very little overlap
with the main stem Humboldt River populations.
Humboldt and Reese River Populations
-16000
-15000
-14000
-13000
-12000
-11000
-100000 2 4 6 8 10 12 14 16
Genotype Clusters (K)
Prop
ortio
nal M
embe
rshi
p
Figure 22. Results of STRUCTURE analysis for the Humboldt and Reese river populations showing the LnP(D), for each iteration (blue diamonds) per genotype cluster (K) designated (1-15 clusters modeled), pink squares represents average LnP(D) per K. Fourteen clusters was the best fit of the data [LnP(D) = -12415.3, P = 1, see text].
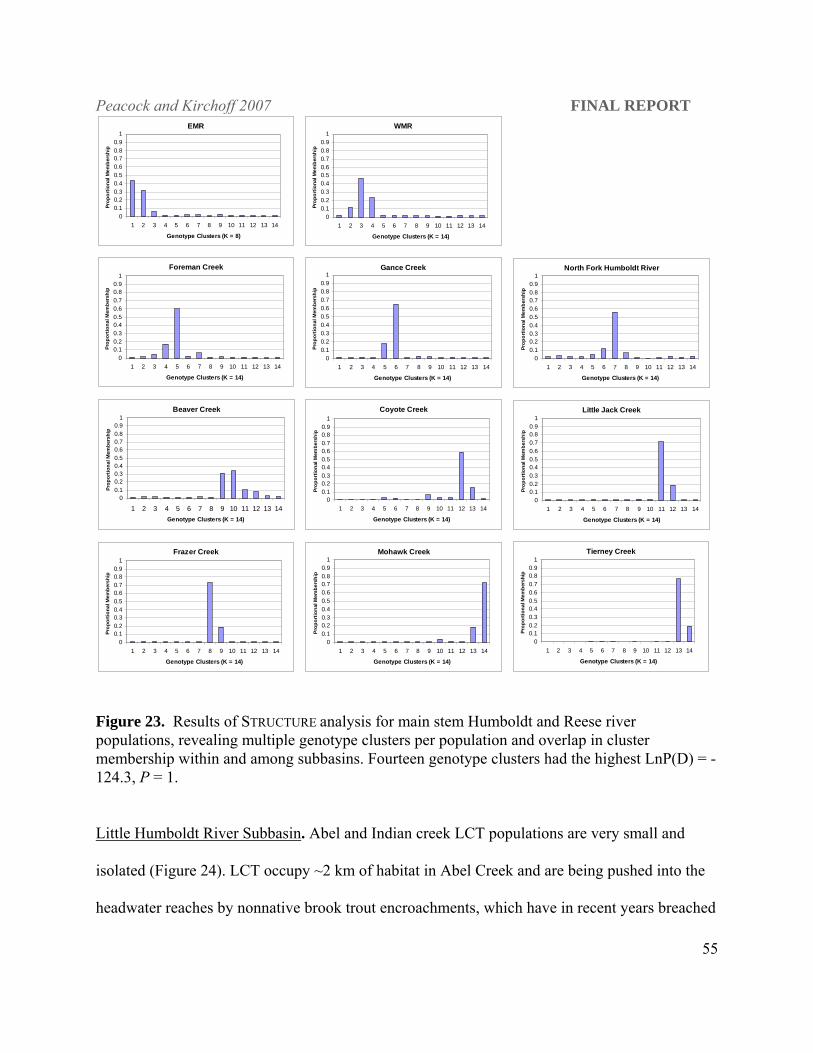
Peacock and Kirchoff 2007 FINAL REPORT
55
EMR
00.10.20.30.40.50.60.70.80.9
1
1 2 3 4 5 6 7 8 9 10 11 12 13 14
Genotype Clusters (K = 8)
Prop
ortio
nal M
embe
rshi
p
WMR
00.10.20.30.40.50.60.70.80.9
1
1 2 3 4 5 6 7 8 9 10 11 12 13 14
Genotype Clusters (K = 14)
Prop
ortio
nal M
embe
rshi
p
Foreman Creek
00.10.20.30.40.50.60.70.80.9
1
1 2 3 4 5 6 7 8 9 10 11 12 13 14
Genotype Clusters (K = 14)
Prop
ortio
nal M
embe
rshi
p
Gance Creek
00.10.20.30.40.50.60.70.80.9
1
1 2 3 4 5 6 7 8 9 10 11 12 13 14
Genotype Clusters (K = 14)
Prop
ortio
nal M
embe
rshi
p
North Fork Humboldt River
00.10.20.30.40.50.60.70.80.9
1
1 2 3 4 5 6 7 8 9 10 11 12 13 14
Genotype Clusters (K = 14)
Prop
ortio
nal M
embe
rshi
p
Frazer Creek
00.10.20.30.40.50.60.70.80.9
1
1 2 3 4 5 6 7 8 9 10 11 12 13 14
Genotype Clusters (K = 14)
Prop
ortio
nal M
embe
rshi
p
Beaver Creek
00.10.20.30.40.50.60.70.80.9
1
1 2 3 4 5 6 7 8 9 10 11 12 13 14Genotype Clusters (K = 14)
Prop
ortio
nal M
embe
rshi
p
Little Jack Creek
00.10.20.30.40.50.60.70.80.9
1
1 2 3 4 5 6 7 8 9 10 11 12 13 14
Genotype Clusters (K = 14)Pr
opor
tiona
l Mem
bers
hip
Coyote Creek
00.10.20.30.40.50.60.70.80.9
1
1 2 3 4 5 6 7 8 9 10 11 12 13 14
Genotype Clusters (K = 14)
Prop
ortio
nal M
embe
rshi
p
Tierney Creek
00.10.20.30.40.50.60.70.80.9
1
1 2 3 4 5 6 7 8 9 10 11 12 13 14
Genotype Clusters (K = 14)
Prop
ortio
nal M
embe
rshi
p
Mohawk Creek
00.10.20.30.40.50.60.70.80.9
1
1 2 3 4 5 6 7 8 9 10 11 12 13 14
Genotype Clusters (K = 14)
Prop
ortio
nal M
embe
rshi
p
Figure 23. Results of STRUCTURE analysis for main stem Humboldt and Reese river populations, revealing multiple genotype clusters per population and overlap in cluster membership within and among subbasins. Fourteen genotype clusters had the highest LnP(D) = -124.3, P = 1.
Little Humboldt River Subbasin. Abel and Indian creek LCT populations are very small and
isolated (Figure 24). LCT occupy ~2 km of habitat in Abel Creek and are being pushed into the
headwater reaches by nonnative brook trout encroachments, which have in recent years breached
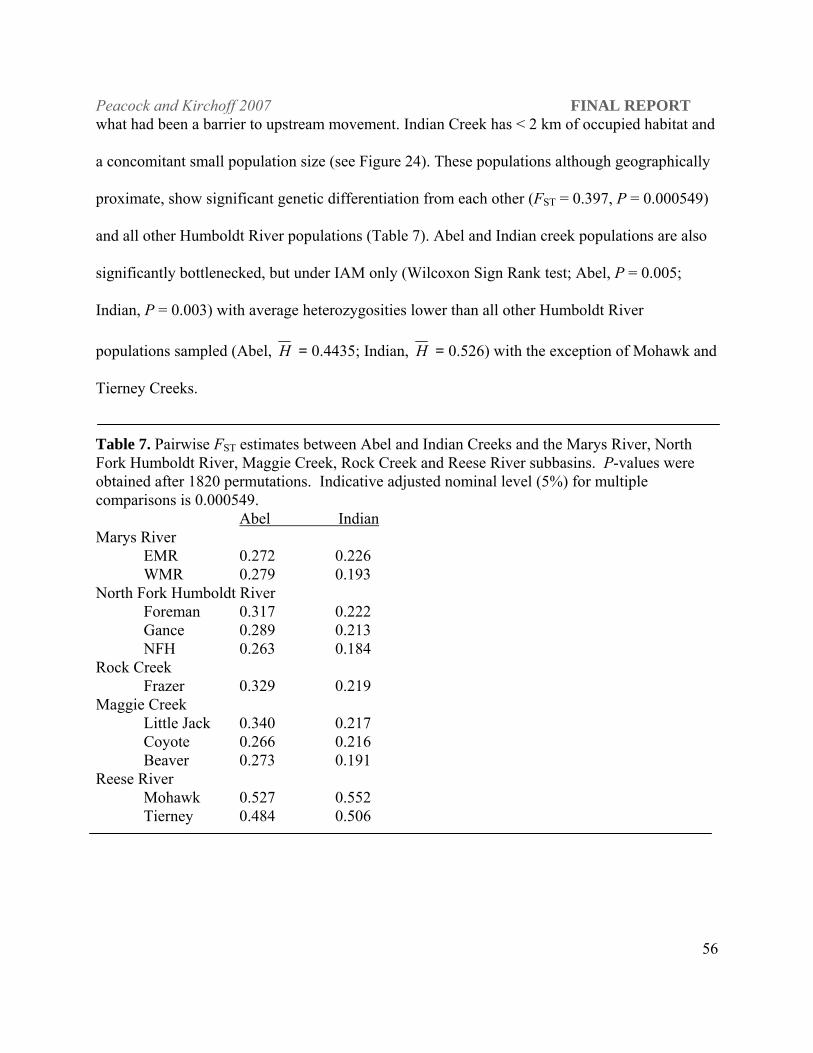
Peacock and Kirchoff 2007 FINAL REPORT
56
what had been a barrier to upstream movement. Indian Creek has < 2 km of occupied habitat and
a concomitant small population size (see Figure 24). These populations although geographically
proximate, show significant genetic differentiation from each other (FST = 0.397, P = 0.000549)
and all other Humboldt River populations (Table 7). Abel and Indian creek populations are also
significantly bottlenecked, but under IAM only (Wilcoxon Sign Rank test; Abel, P = 0.005;
Indian, P = 0.003) with average heterozygosities lower than all other Humboldt River
populations sampled (Abel, H = 0.4435; Indian, H = 0.526) with the exception of Mohawk and
Tierney Creeks.
Table 7. Pairwise FST estimates between Abel and Indian Creeks and the Marys River, North Fork Humboldt River, Maggie Creek, Rock Creek and Reese River subbasins. P-values were obtained after 1820 permutations. Indicative adjusted nominal level (5%) for multiple comparisons is 0.000549. Abel Indian Marys River
EMR 0.272 0.226 WMR 0.279 0.193
North Fork Humboldt River Foreman 0.317 0.222 Gance 0.289 0.213 NFH 0.263 0.184
Rock Creek Frazer 0.329 0.219
Maggie Creek Little Jack 0.340 0.217 Coyote 0.266 0.216 Beaver 0.273 0.191
Reese River Mohawk 0.527 0.552 Tierney 0.484 0.506
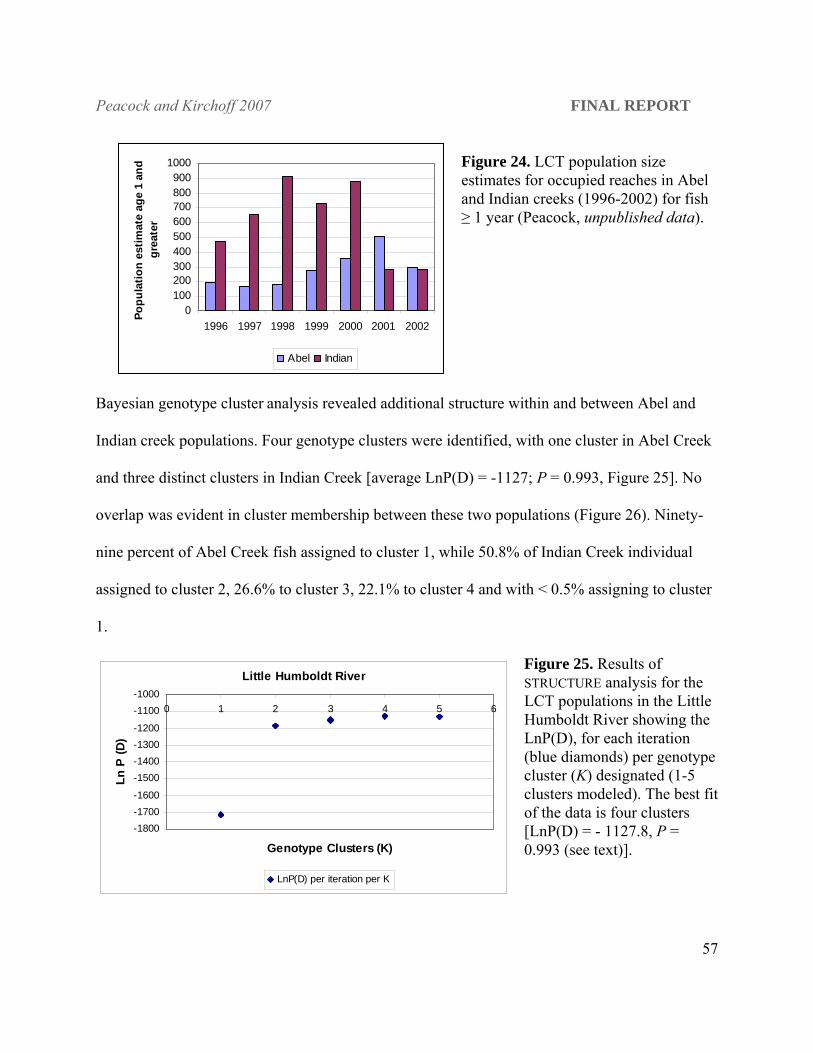
Peacock and Kirchoff 2007 FINAL REPORT
57
0100200300400500600700800900
1000
1996 1997 1998 1999 2000 2001 2002
Popu
latio
n es
timat
e ag
e 1
and
grea
ter
Abel Indian
Figure 24. LCT population size estimates for occupied reaches in Abel and Indian creeks (1996-2002) for fish ≥ 1 year (Peacock, unpublished data).
Bayesian genotype cluster analysis revealed additional structure within and between Abel and
Indian creek populations. Four genotype clusters were identified, with one cluster in Abel Creek
and three distinct clusters in Indian Creek [average LnP(D) = -1127; P = 0.993, Figure 25]. No
overlap was evident in cluster membership between these two populations (Figure 26). Ninety-
nine percent of Abel Creek fish assigned to cluster 1, while 50.8% of Indian Creek individual
assigned to cluster 2, 26.6% to cluster 3, 22.1% to cluster 4 and with < 0.5% assigning to cluster
1.
Figure 25. Results of STRUCTURE analysis for the LCT populations in the Little Humboldt River showing the LnP(D), for each iteration (blue diamonds) per genotype cluster (K) designated (1-5 clusters modeled). The best fit of the data is four clusters [LnP(D) = - 1127.8, P = 0.993 (see text)].
Little Humboldt River
-1800-1700-1600
-1500-1400-1300-1200
-1100-1000
0 1 2 3 4 5 6
Genotype Clusters (K)
Ln P
(D)
LnP(D) per iteration per K
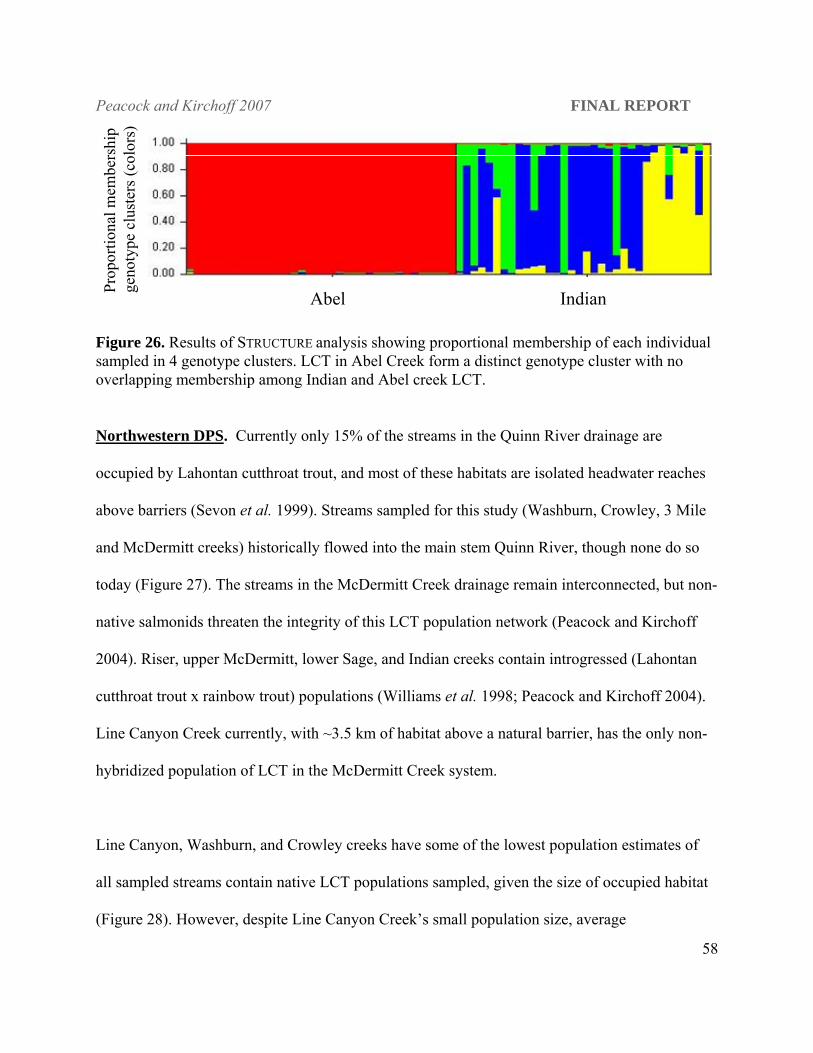
Peacock and Kirchoff 2007 FINAL REPORT
58
Prop
ortio
nal m
embe
rshi
p ge
noty
pe c
lust
ers (
colo
rs)
Abel Indian
Figure 26. Results of STRUCTURE analysis showing proportional membership of each individual sampled in 4 genotype clusters. LCT in Abel Creek form a distinct genotype cluster with no overlapping membership among Indian and Abel creek LCT.
Northwestern DPS. Currently only 15% of the streams in the Quinn River drainage are
occupied by Lahontan cutthroat trout, and most of these habitats are isolated headwater reaches
above barriers (Sevon et al. 1999). Streams sampled for this study (Washburn, Crowley, 3 Mile
and McDermitt creeks) historically flowed into the main stem Quinn River, though none do so
today (Figure 27). The streams in the McDermitt Creek drainage remain interconnected, but non-
native salmonids threaten the integrity of this LCT population network (Peacock and Kirchoff
2004). Riser, upper McDermitt, lower Sage, and Indian creeks contain introgressed (Lahontan
cutthroat trout x rainbow trout) populations (Williams et al. 1998; Peacock and Kirchoff 2004).
Line Canyon Creek currently, with ~3.5 km of habitat above a natural barrier, has the only non-
hybridized population of LCT in the McDermitt Creek system.
Line Canyon, Washburn, and Crowley creeks have some of the lowest population estimates of
all sampled streams contain native LCT populations sampled, given the size of occupied habitat
(Figure 28). However, despite Line Canyon Creek’s small population size, average
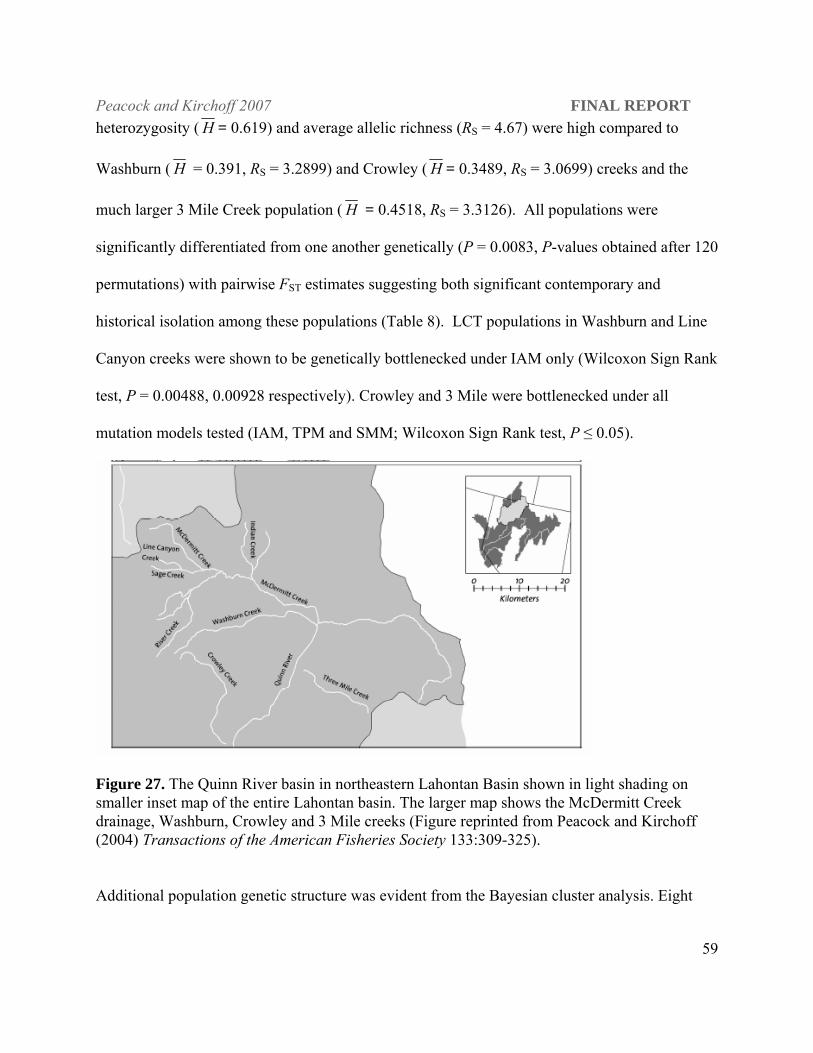
Peacock and Kirchoff 2007 FINAL REPORT
59
heterozygosity ( H = 0.619) and average allelic richness (RS = 4.67) were high compared to
Washburn ( H = 0.391, RS = 3.2899) and Crowley ( H = 0.3489, RS = 3.0699) creeks and the
much larger 3 Mile Creek population ( H = 0.4518, RS = 3.3126). All populations were
significantly differentiated from one another genetically (P = 0.0083, P-values obtained after 120
permutations) with pairwise FST estimates suggesting both significant contemporary and
historical isolation among these populations (Table 8). LCT populations in Washburn and Line
Canyon creeks were shown to be genetically bottlenecked under IAM only (Wilcoxon Sign Rank
test, P = 0.00488, 0.00928 respectively). Crowley and 3 Mile were bottlenecked under all
mutation models tested (IAM, TPM and SMM; Wilcoxon Sign Rank test, P ≤ 0.05).
Figure 27. The Quinn River basin in northeastern Lahontan Basin shown in light shading on smaller inset map of the entire Lahontan basin. The larger map shows the McDermitt Creek drainage, Washburn, Crowley and 3 Mile creeks (Figure reprinted from Peacock and Kirchoff (2004) Transactions of the American Fisheries Society 133:309-325).
Additional population genetic structure was evident from the Bayesian cluster analysis. Eight
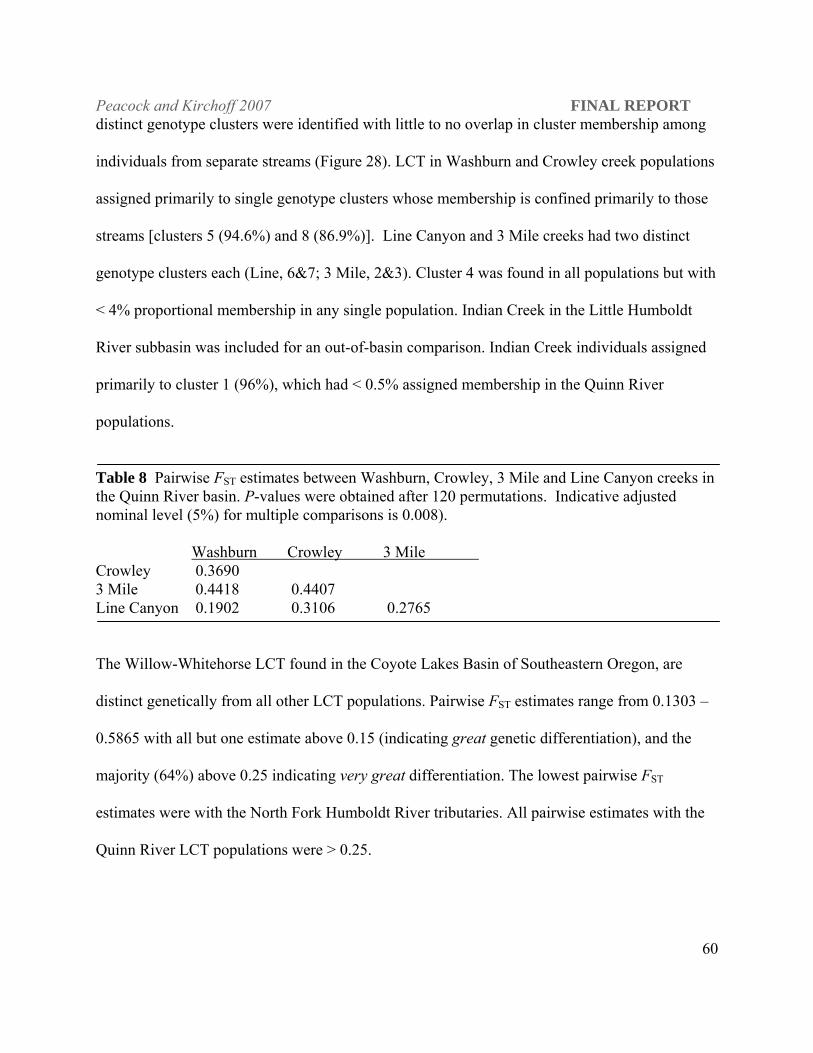
Peacock and Kirchoff 2007 FINAL REPORT
60
distinct genotype clusters were identified with little to no overlap in cluster membership among
individuals from separate streams (Figure 28). LCT in Washburn and Crowley creek populations
assigned primarily to single genotype clusters whose membership is confined primarily to those
streams [clusters 5 (94.6%) and 8 (86.9%)]. Line Canyon and 3 Mile creeks had two distinct
genotype clusters each (Line, 6&7; 3 Mile, 2&3). Cluster 4 was found in all populations but with
< 4% proportional membership in any single population. Indian Creek in the Little Humboldt
River subbasin was included for an out-of-basin comparison. Indian Creek individuals assigned
primarily to cluster 1 (96%), which had < 0.5% assigned membership in the Quinn River
populations.
Table 8 Pairwise FST estimates between Washburn, Crowley, 3 Mile and Line Canyon creeks in the Quinn River basin. P-values were obtained after 120 permutations. Indicative adjusted nominal level (5%) for multiple comparisons is 0.008). Washburn Crowley 3 Mile Crowley 0.3690 3 Mile 0.4418 0.4407 Line Canyon 0.1902 0.3106 0.2765
The Willow-Whitehorse LCT found in the Coyote Lakes Basin of Southeastern Oregon, are
distinct genetically from all other LCT populations. Pairwise FST estimates range from 0.1303 –
0.5865 with all but one estimate above 0.15 (indicating great genetic differentiation), and the
majority (64%) above 0.25 indicating very great differentiation. The lowest pairwise FST
estimates were with the North Fork Humboldt River tributaries. All pairwise estimates with the
Quinn River LCT populations were > 0.25.
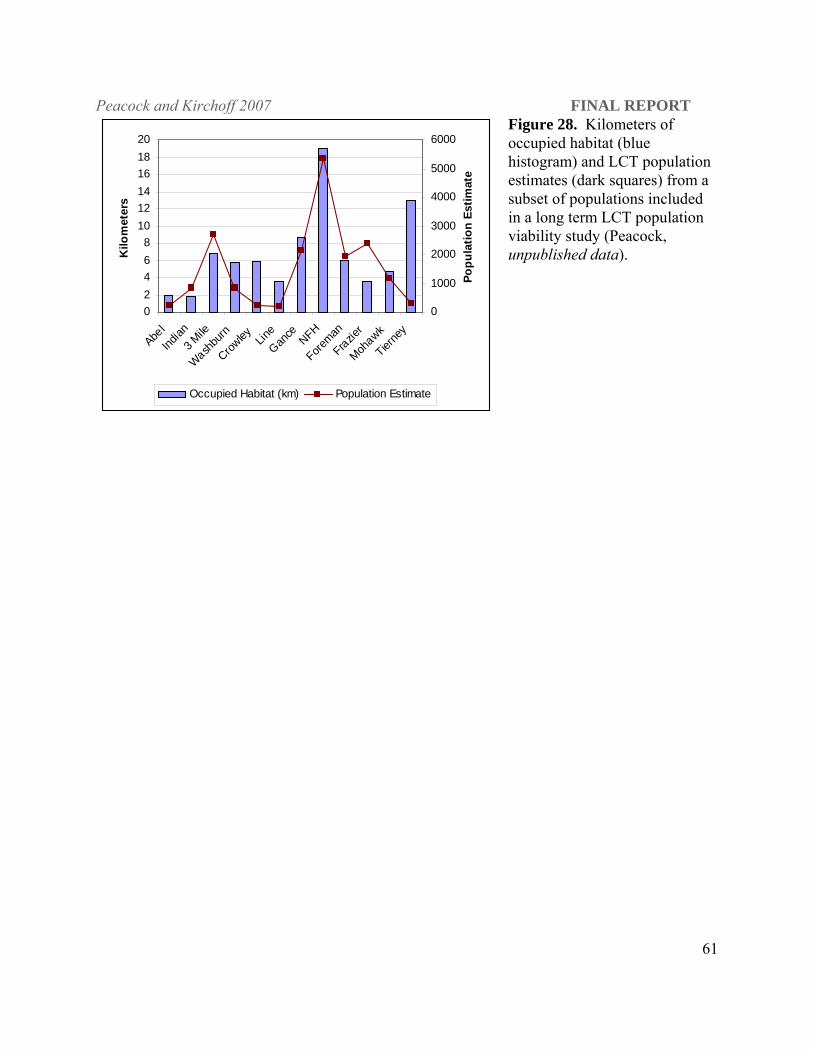
Peacock and Kirchoff 2007 FINAL REPORT
61
Figure 28. Kilometers of occupied habitat (blue histogram) and LCT population estimates (dark squares) from a subset of populations included in a long term LCT population viability study (Peacock, unpublished data).
02468
101214161820
AbelInd
ian3 M
ile
Washbu
rn
Crowley Lin
e
Gance NFH
Foreman
Frazier
Mohawk
Tierne
y
Kilo
met
ers
0
1000
2000
3000
4000
5000
6000
Popu
latio
n Es
timat
e
Occupied Habitat (km) Population Estimate
Peacock and Kirchoff 2007 FINAL REPORT
62
Indian Creek (Santa Rosas)
00.10.20.30.40.50.60.70.80.9
1
1 2 3 4 5 6 7 8
Genotype Clusters (K = 8)
Prop
ortio
nal M
embe
rshi
p
3 Mile Creek
00.10.20.30.40.50.60.70.80.9
1
1 2 3 4 5 6 7 8
Genotype Clusters (K = 8)
Prop
ortio
nal M
embe
rshi
p
Washburn Creek
00.10.20.30.40.50.60.70.80.9
1
1 2 3 4 5 6 7 8
Genotype Clusters (K = 8)
Prop
ortio
nal M
embe
rshi
p
Line Canyon Creek
00.10.20.30.40.50.60.70.80.9
1
1 2 3 4 5 6 7 8
Genotype Clusters (K = 8)
Prop
ortio
nal M
embe
rshi
p
Crowley Creek
00.10.20.30.40.50.60.70.80.9
1
1 2 3 4 5 6 7 8
Genotype Clusters (K = 8)
Prop
ortio
nal M
embe
rshi
p
Figure 29. Eight genotype clusters were identified for the four populations sampled from the Quinn River basin (Line Canyon, 3 Mile, Washburn and Crowley creeks) and one population from the Little Humboldt River subbasin (Indian Creek). Each panel represents the average proportional membership of each population in each of the eight genotype clusters [LnP(D) = -2843.07, P = 1.0).
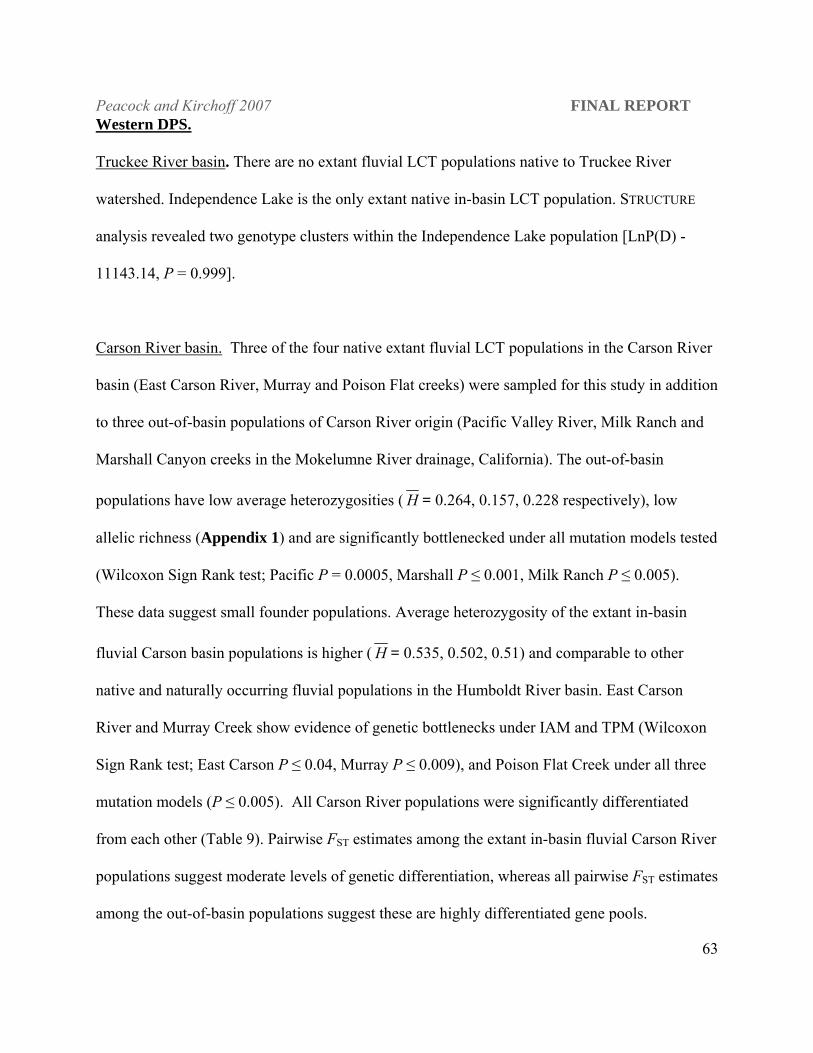
Peacock and Kirchoff 2007 FINAL REPORT
63
Western DPS.
Truckee River basin. There are no extant fluvial LCT populations native to Truckee River
watershed. Independence Lake is the only extant native in-basin LCT population. STRUCTURE
analysis revealed two genotype clusters within the Independence Lake population [LnP(D) -
11143.14, P = 0.999].
Carson River basin. Three of the four native extant fluvial LCT populations in the Carson River
basin (East Carson River, Murray and Poison Flat creeks) were sampled for this study in addition
to three out-of-basin populations of Carson River origin (Pacific Valley River, Milk Ranch and
Marshall Canyon creeks in the Mokelumne River drainage, California). The out-of-basin
populations have low average heterozygosities ( H = 0.264, 0.157, 0.228 respectively), low
allelic richness (Appendix 1) and are significantly bottlenecked under all mutation models tested
(Wilcoxon Sign Rank test; Pacific P = 0.0005, Marshall P ≤ 0.001, Milk Ranch P ≤ 0.005).
These data suggest small founder populations. Average heterozygosity of the extant in-basin
fluvial Carson basin populations is higher ( H = 0.535, 0.502, 0.51) and comparable to other
native and naturally occurring fluvial populations in the Humboldt River basin. East Carson
River and Murray Creek show evidence of genetic bottlenecks under IAM and TPM (Wilcoxon
Sign Rank test; East Carson P ≤ 0.04, Murray P ≤ 0.009), and Poison Flat Creek under all three
mutation models (P ≤ 0.005). All Carson River populations were significantly differentiated
from each other (Table 9). Pairwise FST estimates among the extant in-basin fluvial Carson River
populations suggest moderate levels of genetic differentiation, whereas all pairwise FST estimates
among the out-of-basin populations suggest these are highly differentiated gene pools.
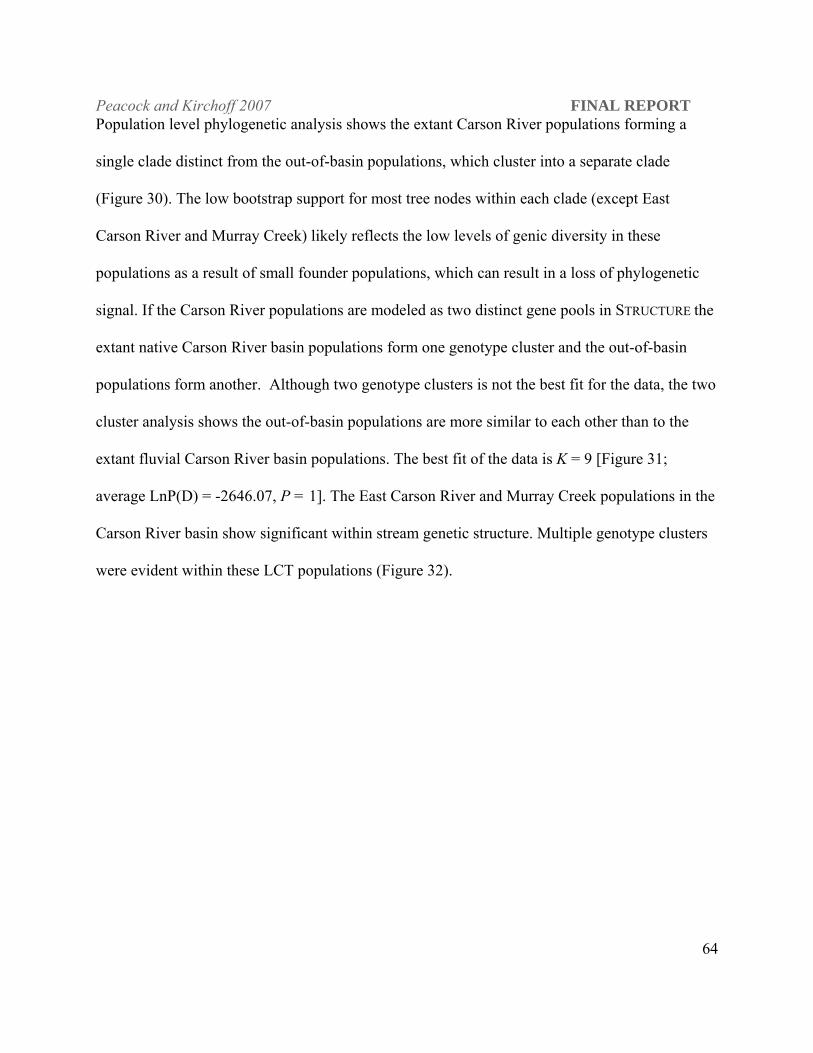
Peacock and Kirchoff 2007 FINAL REPORT
64
Population level phylogenetic analysis shows the extant Carson River populations forming a
single clade distinct from the out-of-basin populations, which cluster into a separate clade
(Figure 30). The low bootstrap support for most tree nodes within each clade (except East
Carson River and Murray Creek) likely reflects the low levels of genic diversity in these
populations as a result of small founder populations, which can result in a loss of phylogenetic
signal. If the Carson River populations are modeled as two distinct gene pools in STRUCTURE the
extant native Carson River basin populations form one genotype cluster and the out-of-basin
populations form another. Although two genotype clusters is not the best fit for the data, the two
cluster analysis shows the out-of-basin populations are more similar to each other than to the
extant fluvial Carson River basin populations. The best fit of the data is K = 9 [Figure 31;
average LnP(D) = -2646.07, P = 1]. The East Carson River and Murray Creek populations in the
Carson River basin show significant within stream genetic structure. Multiple genotype clusters
were evident within these LCT populations (Figure 32).
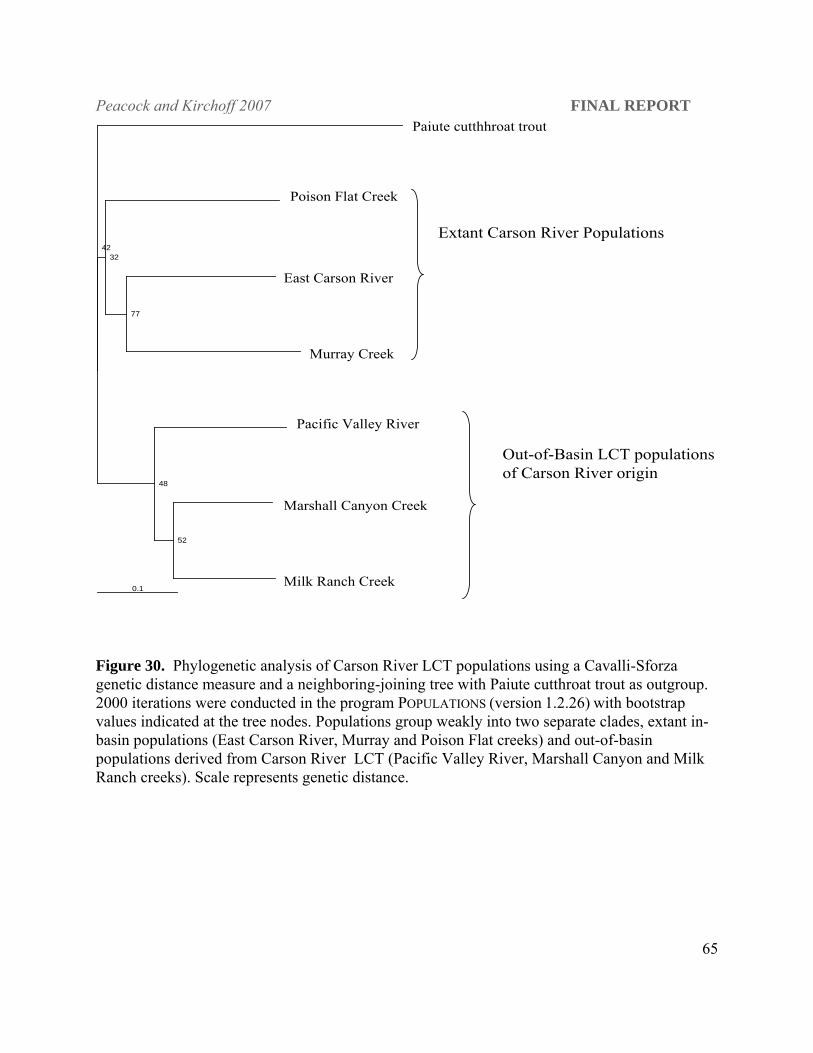
Peacock and Kirchoff 2007 FINAL REPORT
65
0.1
POP 3
POP 1
POP 2
77
32
POP 4
POP 5
POP 6
52
48
42
East Carson River
Murray Creek
Poison Flat Creek
Pacific Valley River
Marshall Canyon Creek
Milk Ranch Creek
Paiute cutthhroat trout
Extant Carson River Populations
Out-of-Basin LCT populations of Carson River origin
Figure 30. Phylogenetic analysis of Carson River LCT populations using a Cavalli-Sforza genetic distance measure and a neighboring-joining tree with Paiute cutthroat trout as outgroup. 2000 iterations were conducted in the program POPULATIONS (version 1.2.26) with bootstrap values indicated at the tree nodes. Populations group weakly into two separate clades, extant in-basin populations (East Carson River, Murray and Poison Flat creeks) and out-of-basin populations derived from Carson River LCT (Pacific Valley River, Marshall Canyon and Milk Ranch creeks). Scale represents genetic distance.
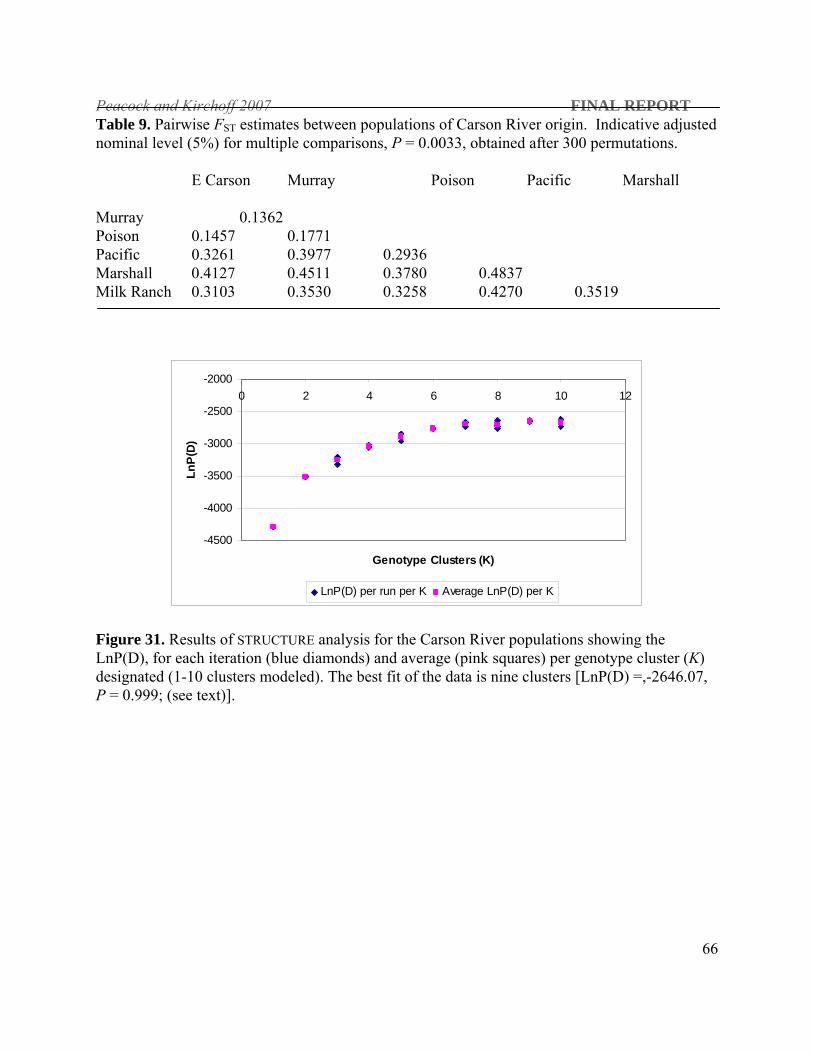
Peacock and Kirchoff 2007 FINAL REPORT Table 9. Pairwise FST estimates between populations of Carson River origin. Indicative adjusted nominal level (5%) for multiple comparisons, P = 0.0033, obtained after 300 permutations.
E Carson Murray Poison Pacific Marshall
Murray 0.1362 Poison 0.1457 0.1771 Pacific 0.3261 0.3977 0.2936 Marshall 0.4127 0.4511 0.3780 0.4837 Milk Ranch 0.3103 0.3530 0.3258 0.4270 0.3519
-4500
-4000
-3500
-3000
-2500
-20000 2 4 6 8 10
Genotype Clusters (K)
LnP(
D)
12
LnP(D) per run per K Average LnP(D) per K
Figure 31. Results of STRUCTURE analysis for the Carson River populations showing the LnP(D), for each iteration (blue diamonds) and average (pink squares) per genotype cluster (K) designated (1-10 clusters modeled). The best fit of the data is nine clusters [LnP(D) =,-2646.07, P = 0.999; (see text)].
66
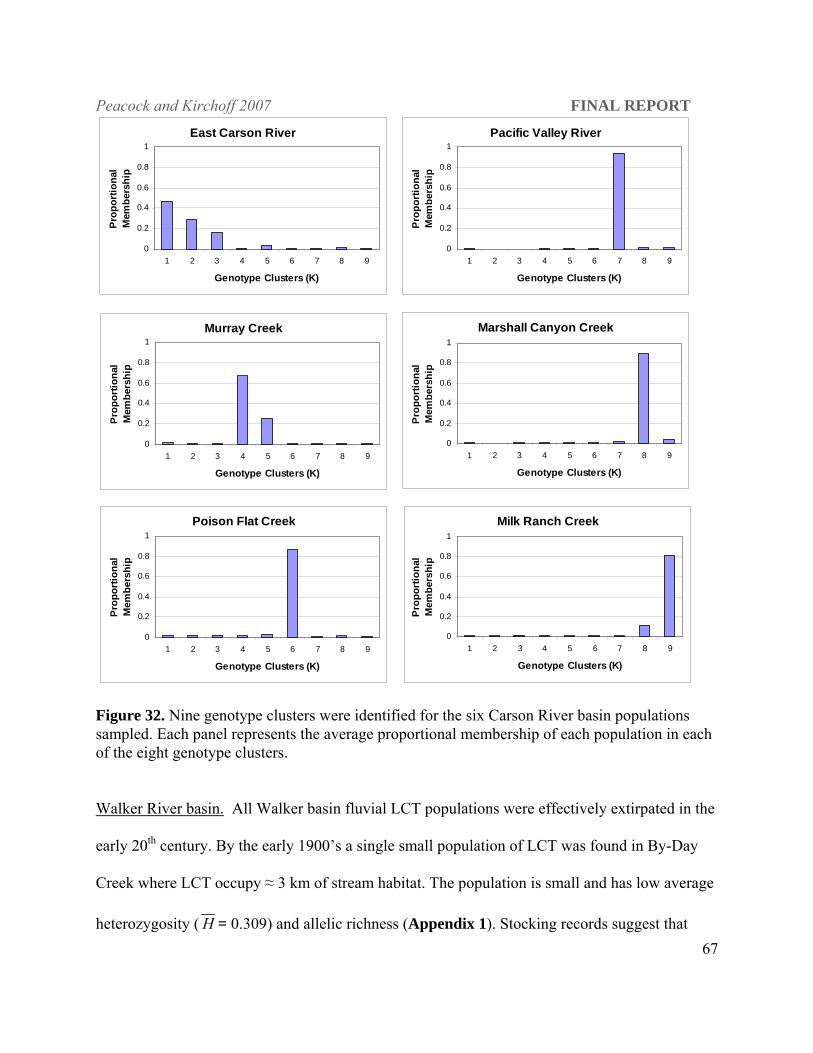
Peacock and Kirchoff 2007 FINAL REPORT
67
East Carson River
0
0.2
0.4
0.6
0.8
1
1 2 3 4 5 6 7 8 9
Genotype Clusters (K)
Prop
ortio
nal
Mem
bers
hip
Murray Creek
0
0.2
0.4
0.6
0.8
1
1 2 3 4 5 6 7 8 9
Genotype Clusters (K)
Prop
ortio
nal
Mem
bers
hip
Poison Flat Creek
0
0.2
0.4
0.6
0.8
1
1 2 3 4 5 6 7 8 9
Genotype Clusters (K)
Prop
ortio
nal
Mem
bers
hipPacific Valley River
0
0.2
0.4
0.6
0.8
1
1 2 3 4 5 6 7 8 9
Genotype Clusters (K)
Prop
ortio
nal
Mem
bers
hip
Marshall Canyon Creek
0
0.2
0.4
0.6
0.8
1
1 2 3 4 5 6 7 8 9
Genotype Clusters (K)
Prop
ortio
nal
Mem
bers
hip
Milk Ranch Creek
0
0.2
0.4
0.6
0.8
1
1 2 3 4 5 6 7 8 9
Genotype Clusters (K)
Prop
ortio
nal
Mem
bers
hip
Figure 32. Nine genotype clusters were identified for the six Carson River basin populations sampled. Each panel represents the average proportional membership of each population in each of the eight genotype clusters.
Walker River basin. All Walker basin fluvial LCT populations were effectively extirpated in the
early 20th century. By the early 1900’s a single small population of LCT was found in By-Day
Creek where LCT occupy ≈ 3 km of stream habitat. The population is small and has low average
heterozygosity ( H = 0.309) and allelic richness (Appendix 1). Stocking records suggest that
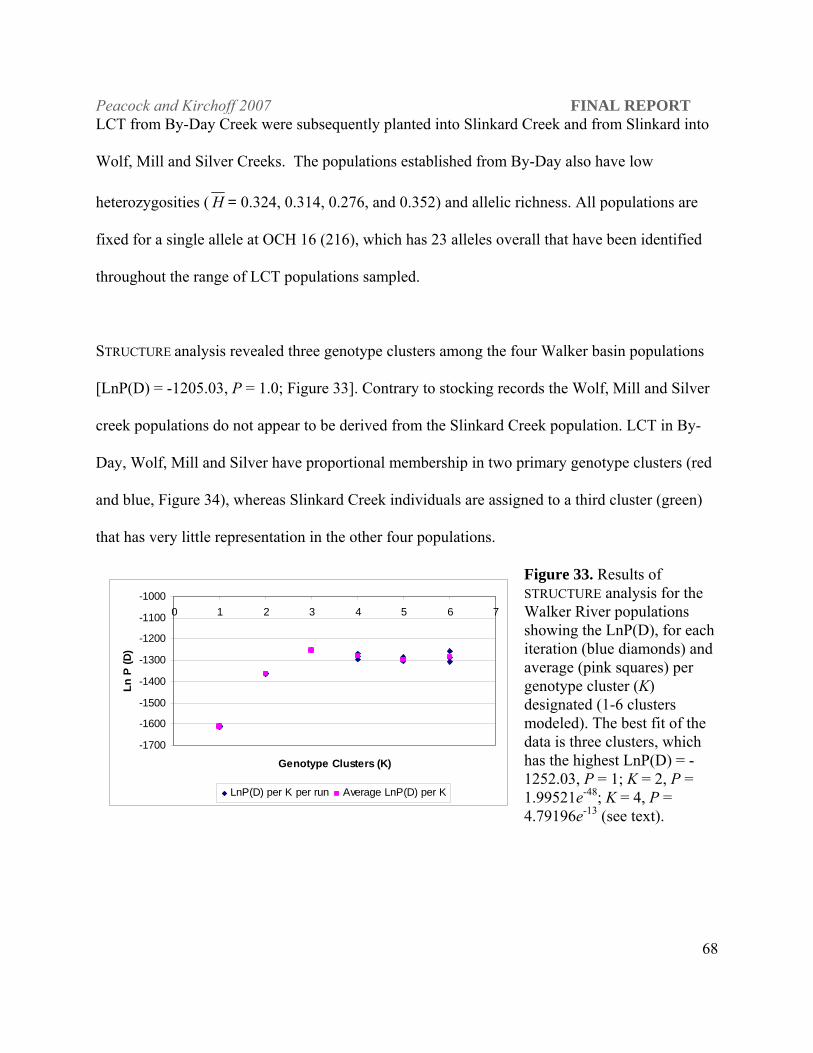
Peacock and Kirchoff 2007 FINAL REPORT
68
LCT from By-Day Creek were subsequently planted into Slinkard Creek and from Slinkard into
Wolf, Mill and Silver Creeks. The populations established from By-Day also have low
heterozygosities ( H = 0.324, 0.314, 0.276, and 0.352) and allelic richness. All populations are
fixed for a single allele at OCH 16 (216), which has 23 alleles overall that have been identified
throughout the range of LCT populations sampled.
STRUCTURE analysis revealed three genotype clusters among the four Walker basin populations
[LnP(D) = -1205.03, P = 1.0; Figure 33]. Contrary to stocking records the Wolf, Mill and Silver
creek populations do not appear to be derived from the Slinkard Creek population. LCT in By-
Day, Wolf, Mill and Silver have proportional membership in two primary genotype clusters (red
and blue, Figure 34), whereas Slinkard Creek individuals are assigned to a third cluster (green)
that has very little representation in the other four populations.
Figure 33. Results of STRUCTURE analysis for the Walker River populations showing the LnP(D), for each iteration (blue diamonds) and average (pink squares) per genotype cluster (K) designated (1-6 clusters modeled). The best fit of the data is three clusters, which has the highest LnP(D) = -1252.03, P = 1; K = 2, P = 1.99521e-48; K = 4, P = 4.79196e-13 (see text).
-1700
-1600
-1500
-1400
-1300
-1200
-1100
-10000 1 2 3 4 5 6 7
Genotype Clusters (K)
Ln P
(D)
LnP(D) per K per run Average LnP(D) per K
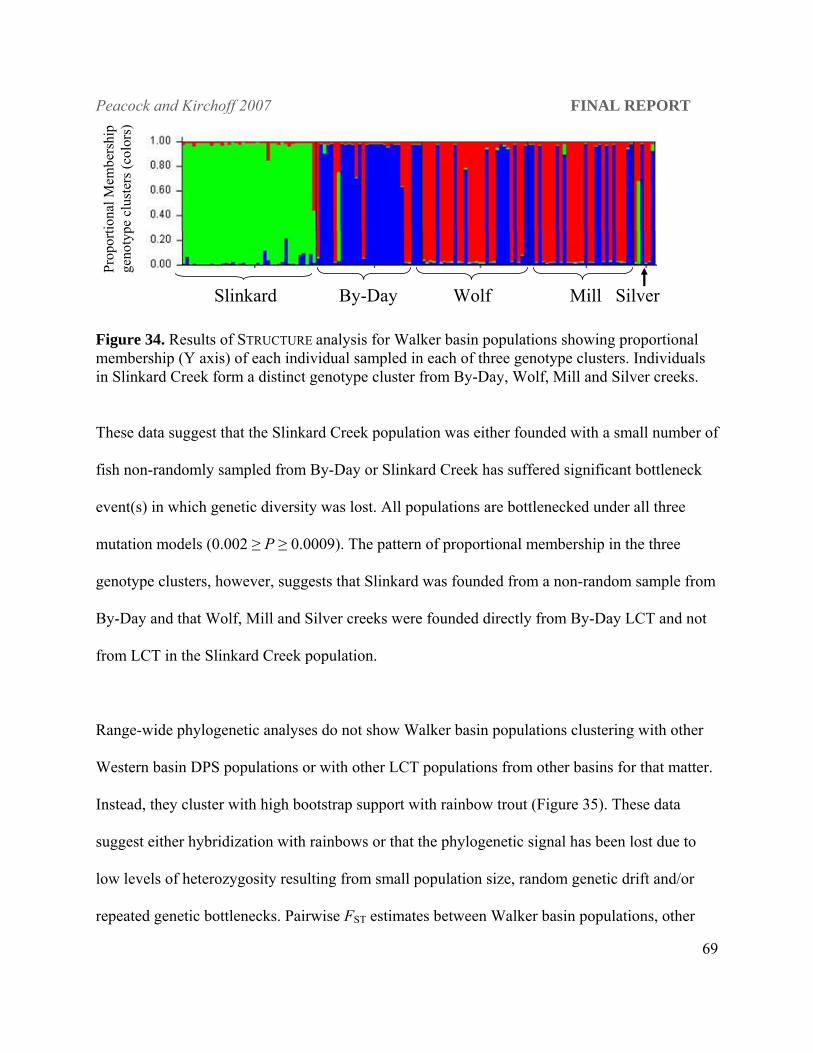
Peacock and Kirchoff 2007 FINAL REPORT
69
Slinkard By-Day Wolf Mill Silver
Prop
ortio
nal M
embe
rshi
p ge
noty
pe c
lust
ers (
colo
rs)
Figure 34. Results of STRUCTURE analysis for Walker basin populations showing proportional membership (Y axis) of each individual sampled in each of three genotype clusters. Individuals in Slinkard Creek form a distinct genotype cluster from By-Day, Wolf, Mill and Silver creeks.
These data suggest that the Slinkard Creek population was either founded with a small number of
fish non-randomly sampled from By-Day or Slinkard Creek has suffered significant bottleneck
event(s) in which genetic diversity was lost. All populations are bottlenecked under all three
mutation models (0.002 ≥ P ≥ 0.0009). The pattern of proportional membership in the three
genotype clusters, however, suggests that Slinkard was founded from a non-random sample from
By-Day and that Wolf, Mill and Silver creeks were founded directly from By-Day LCT and not
from LCT in the Slinkard Creek population.
Range-wide phylogenetic analyses do not show Walker basin populations clustering with other
Western basin DPS populations or with other LCT populations from other basins for that matter.
Instead, they cluster with high bootstrap support with rainbow trout (Figure 35). These data
suggest either hybridization with rainbows or that the phylogenetic signal has been lost due to
low levels of heterozygosity resulting from small population size, random genetic drift and/or
repeated genetic bottlenecks. Pairwise FST estimates between Walker basin populations, other
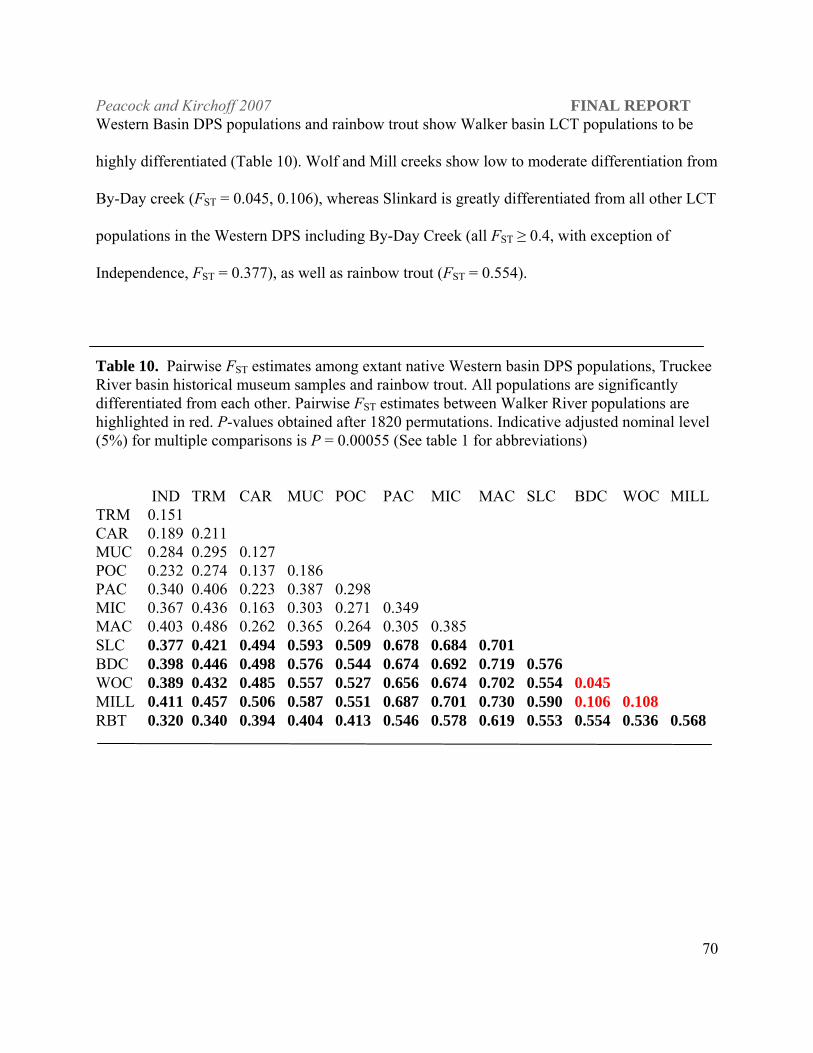
Peacock and Kirchoff 2007 FINAL REPORT
70
Western Basin DPS populations and rainbow trout show Walker basin LCT populations to be
highly differentiated (Table 10). Wolf and Mill creeks show low to moderate differentiation from
By-Day creek (FST = 0.045, 0.106), whereas Slinkard is greatly differentiated from all other LCT
populations in the Western DPS including By-Day Creek (all FST ≥ 0.4, with exception of
Independence, FST = 0.377), as well as rainbow trout (FST = 0.554).
Table 10. Pairwise FST estimates among extant native Western basin DPS populations, Truckee River basin historical museum samples and rainbow trout. All populations are significantly differentiated from each other. Pairwise FST estimates between Walker River populations are highlighted in red. P-values obtained after 1820 permutations. Indicative adjusted nominal level (5%) for multiple comparisons is P = 0.00055 (See table 1 for abbreviations)
IND TRM CAR MUC POC PAC MIC MAC SLC BDC WOC MILL TRM 0.151 CAR 0.189 0.211 MUC 0.284 0.295 0.127 POC 0.232 0.274 0.137 0.186 PAC 0.340 0.406 0.223 0.387 0.298 MIC 0.367 0.436 0.163 0.303 0.271 0.349 MAC 0.403 0.486 0.262 0.365 0.264 0.305 0.385 SLC 0.377 0.421 0.494 0.593 0.509 0.678 0.684 0.701 BDC 0.398 0.446 0.498 0.576 0.544 0.674 0.692 0.719 0.576 WOC 0.389 0.432 0.485 0.557 0.527 0.656 0.674 0.702 0.554 0.045 MILL 0.411 0.457 0.506 0.587 0.551 0.687 0.701 0.730 0.590 0.106 0.108 RBT 0.320 0.340 0.394 0.404 0.413 0.546 0.578 0.619 0.553 0.554 0.536 0.568
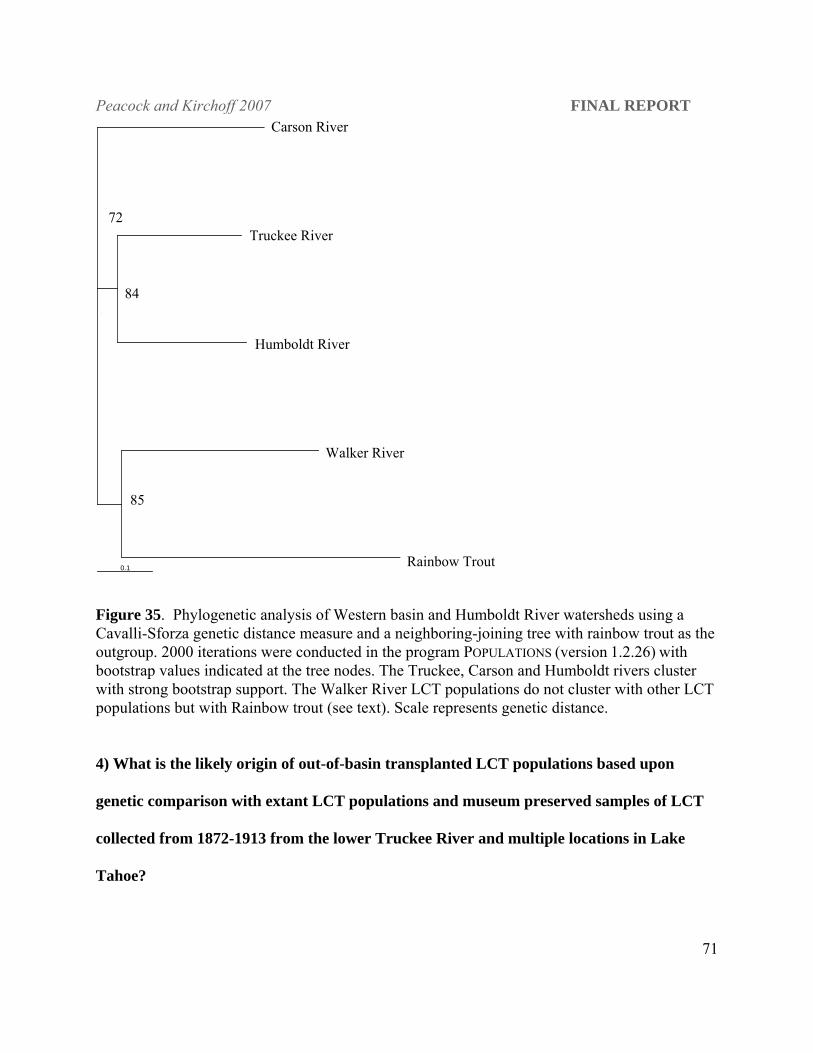
Peacock and Kirchoff 2007 FINAL REPORT
71
0.1
POP 2
POP 1
POP 4
84
POP 3
POP 5
85
72
Truckee River
Carson River
Humboldt River
Walker River
Rainbow Trout
84
72
85
Figure 35. Phylogenetic analysis of Western basin and Humboldt River watersheds using a Cavalli-Sforza genetic distance measure and a neighboring-joining tree with rainbow trout as the outgroup. 2000 iterations were conducted in the program POPULATIONS (version 1.2.26) with bootstrap values indicated at the tree nodes. The Truckee, Carson and Humboldt rivers cluster with strong bootstrap support. The Walker River LCT populations do not cluster with other LCT populations but with Rainbow trout (see text). Scale represents genetic distance.
4) What is the likely origin of out-of-basin transplanted LCT populations based upon
genetic comparison with extant LCT populations and museum preserved samples of LCT
collected from 1872-1913 from the lower Truckee River and multiple locations in Lake
Tahoe?

Peacock and Kirchoff 2007 FINAL REPORT
72
Hickman and Behnke (1979) suggested morphological resemblances indicate a “probable
Pyramid Lake” origin for the LCT population in Morrison Creek, Utah. Based upon this
analysis, LCT from Morrison Creek were used to start a brood stock for hatchery production of
this strain to be used in Truckee River basin LCT recovery activities. Morrison Creek LCT were
also subsequently planted into neighboring Bettridge Creek. Population level phylogenetic
analysis support a Truckee River basin origin for the Pilot Peak LCT (samples from Morrison,
Bettridge and Pilot Peak hatchery broodstock) which cluster with the Truckee River basin
museum samples with strong bootstrap support (71%, Figure 36). Independence Lake LCT,
however, do not cluster with Truckee River basin museum samples and are distal to all other
LCT populations of Western basin origin. Overall the population-level phylogeny for the
Western basin DPS remains very unresolved, despite a number unambiguous relationships:
Poison Flat Creek clusters with other Carson River populations with strong bootstrap support
(80%, Figure 36), Slinkard Creek clusters with the other Walker River populations (92%,), and
Pyramid Lake clusters with Summit Lake (89%), which reflects the Summit Lake origin of the
Pyramid Lake brood stock. Pyramid and Summit lake populations cluster weakly with Carson
River populations as Carson River LCT also contributed to the brook stock for the Pyramid Lake
population. Macklin Creek LCT (of putative Lake Tahoe origin), cluster with strong bootstrap
support (89%) with Willow-Whitehorse LCT populations in Oregon. The origin of Willow-
Whitehorse LCT, however, remains unresolved. O’Harrel Creek LCT (of putative Walker basin
origin) clusters weakly with the out-of-basin Carson River populations (29%), which suggests a
possible Carson River origin.
Because so few in situ populations exist in the Western basin DPS, establishing evolutionary
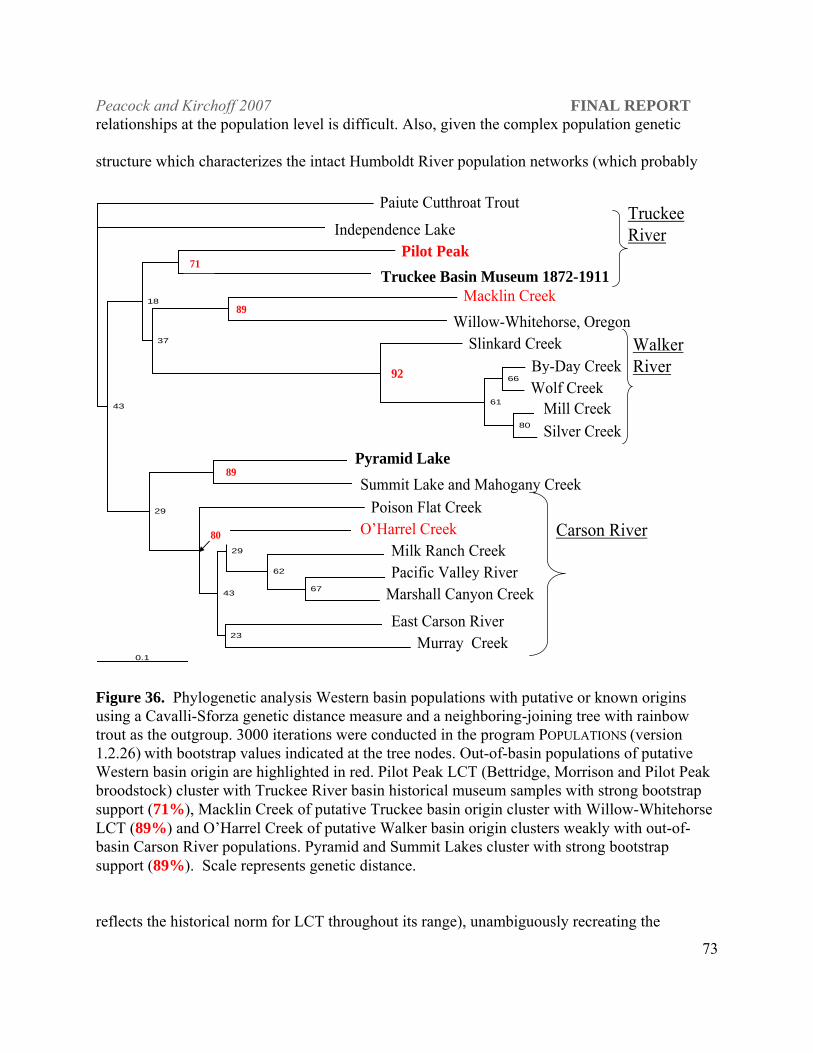
Peacock and Kirchoff 2007 FINAL REPORT
73
relationships at the population level is difficult. Also, given the complex population genetic
structure which characterizes the intact Humboldt River population networks (which probably
0.1
POP 20
POP 2
POP 1
POP 371
POP 4
POP 1989
POP 12
POP 13
POP 1466
POP 15
POP 1680
61
92
37
18
POP 17
POP 1899
POP 7
POP 11
POP 9
POP 8
POP 1067
62
29
POP 5
POP 623
43
80
29
43
Paiute Cutthroat Trout
Independence Lake Pilot Peak
Truckee Basin Museum 1872-1911Macklin Creek
Willow-Whitehorse, Oregon
East Carson RiverMurray Creek
Poison Flat Creek
Pacific Valley River Milk Ranch Creek
O’Harrel Creek
Marshall Canyon Creek
Slinkard CreekBy-Day CreekWolf Creek
Mill CreekSilver Creek
Summit Lake and Mahogany CreekPyramid Lake
Carson River
WalkerRiver
Truckee River
92
89
71
89
80
Figure 36. Phylogenetic analysis Western basin populations with putative or known origins using a Cavalli-Sforza genetic distance measure and a neighboring-joining tree with rainbow trout as the outgroup. 3000 iterations were conducted in the program POPULATIONS (version 1.2.26) with bootstrap values indicated at the tree nodes. Out-of-basin populations of putative Western basin origin are highlighted in red. Pilot Peak LCT (Bettridge, Morrison and Pilot Peak broodstock) cluster with Truckee River basin historical museum samples with strong bootstrap support (71%), Macklin Creek of putative Truckee basin origin cluster with Willow-Whitehorse LCT (89%) and O’Harrel Creek of putative Walker basin origin clusters weakly with out-of-basin Carson River populations. Pyramid and Summit Lakes cluster with strong bootstrap support (89%). Scale represents genetic distance.
reflects the historical norm for LCT throughout its range), unambiguously recreating the

Peacock and Kirchoff 2007 FINAL REPORT
74
historical relationships among populations in the Western basin that have been highly impacted
by anthropogenic disturbance is difficult. Extant Western basin populations and out-of-basin
populations of Western basin origin tend to be small, isolated, and show evidence of genetic
bottlenecks (see previous sections). Truckee River basin populations (Pilot Peak and
Independence Lake), however, do retain high levels of heterozygosity similar to historical levels
seen in the Truckee basin museum samples (Pilot Peak H = 0.487, Independence Lake H =
0.668, and Truckee basin museum H = 0.644), but as with populations in the Carson and Walker
basins, Truckee River populations show evidence of genetic bottlenecks (Wilcoxon Sign Rank
test: Bettridge Creek, IAM and TPM, P < 0.05; Morrison Creek, IAM P = 0.0009 and TPM P =
0.01; Pilot Peak broodstock, IAM P = 0.01, TPM P = 0.04; Independence Lake, IAM P = 0.002).
The out-of-basin populations in Edwards and O’Harrel creek also show evidence of bottlenecks
(IAM and TPM P = 0.0009; IAM P = 0.0005, respectively), whereas Macklin Creek is not
bottlenecked and Willow-Whitehorse LCT are bottlenecked under IAM only (P = 0.04).
A watershed based phylogenetic analysis is more informative (Figure 37). The out-of-basin
populations (Macklin, Edwards, and O’Harrel creeks), which do not cluster definitively with any
single population in the population-level analysis, show clear relationships with individual
watersheds (Figure 37). Macklin Creek clusters with the Willow-Whitehorse watershed (88%
bootstrap support), O’Harrel Creek with Carson River (100% bootstrap support), and Edwards
Creek with the Reese River (82% bootstrap support). Pyramid and Summit lakes cluster with the
Carson River (93% bootstrap support), reflecting the mixed stock ancestry of the original
Pyramid Lake broodstock. All LCT populations with the exception of the Walker River
Peacock and Kirchoff 2007 FINAL REPORT
75
populations form a single evolutionary clade which then clusters with the Willow-Whitehorse-
Macklin Creek LCT under strong bootstrap support (74%).
The watershed phylogenetic tree suggests the following: (1) Willow-Whitehorse and Macklin
Creek LCT are distinct from all other LCT populations, (2) Paiute cutthroat trout are
evolutionarily closely related to LCT (and Carson River LCT in particular), and (3) Walker
River populations, through small population size, isolation and genetic bottlenecks and possible
hybridization with rainbow trout have lost their phylogenetic signal. Within the primary LCT
evolutionary clade, relationships among watersheds within and among DPSs remain unresolved,
which may reflect both the non-equilibrium population dynamics inherent in LCT populations as
well as loss of genetic signal through anthropogenic disturbance.
5) Is there historical evidence for population genetic structure among the now extinct LCT
populations from within the Lake Tahoe-Truckee River basin based upon genetic analyses
of museum preserved samples collected from multiple locations within Lake Tahoe and the
lower Truckee River?
High average heterozygosity ( H = 0.644) and allelic richness (Table 11) of the Truckee River
basin historical samples, as well as inclusion of multiple locations in Lake Tahoe and lower
Truckee River increases the probability that past population dynamics can be resolved. Indeed,
population genetic structure was evident within native Truckee River basin LCT both historical
and extant populations. Collection date for the historical, museum-preserved samples of the
Peacock and Kirchoff 2007 FINAL REPORT
76
LCT strain indigenous to the Lake Tahoe and the Truckee River watershed obtained for this
study ranged from 1872-1913. Despite this ~40 year collection period the population genetic
structure revealed with the Bayesian clustering analysis was consistent over time (Figure 38).
Three genotype clusters were identified as the best fit of the data [LnP(D) = -647.36, P = 0.999].
Collection dates covered the entire range from 1872-1913 for the individuals assigned to the
“green” cluster. Two of these individual were collected in Cascade Creek located at the southern
end of Lake Tahoe. It is likely that all fish in the green cluster were collected from this general
area. Individuals assigned primarily to the “red” cluster appear to have been collected either in
Lake Tahoe near Mt. Tallac at the southern end of the Lake or from streams draining into Lake
Tahoe from Mt. Tallac. Individuals from the lower Truckee River and Pyramid Lake also assign
primarily to the red cluster. Specific collection location data within Lake Tahoe is unavailable
for the majority of individuals that assign primarily to the blue cluster. These data suggest: (1)
population genetic structure within the historic LCT population in Lake Tahoe and the Truckee
River watershed and (2) connectivity and gene flow among LCT populations found in Pyramid
Lake, Truckee River and Lake Tahoe.
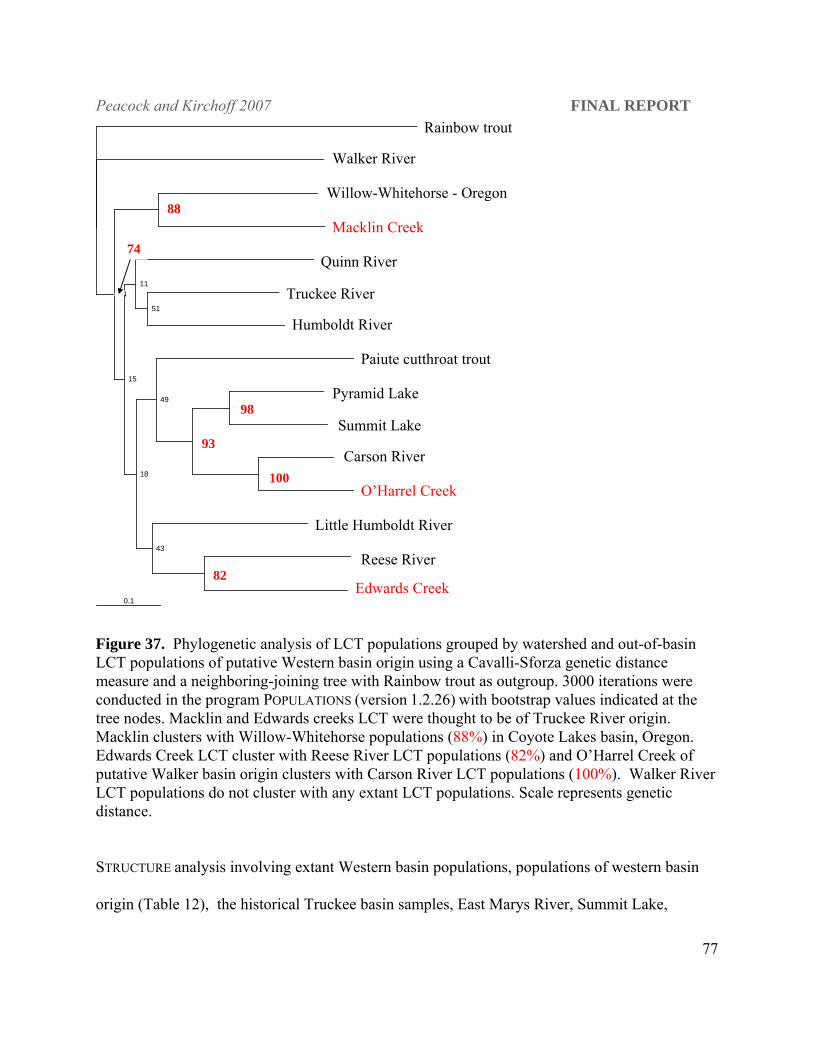
Peacock and Kirchoff 2007 FINAL REPORT
77
0.1
POP 13
POP 6
POP 11
POP 14
88
POP 10
POP 1
POP 7
51
11
POP 12
POP 2
POP 3
98
POP 4
POP 5
100
94
49
POP 8
POP 9
POP 15
82
43
18
15
74
Edwards Creek
Macklin Creek
Rainbow trout
Truckee River
Pyramid Lake
Summit Lake
Carson River
Humboldt River
Walker River
Willow-Whitehorse - Oregon
Little Humboldt River
Reese River
Quinn River
Paiute cutthroat trout
88
98
93
82
74
O’Harrel Creek100
Figure 37. Phylogenetic analysis of LCT populations grouped by watershed and out-of-basin LCT populations of putative Western basin origin using a Cavalli-Sforza genetic distance measure and a neighboring-joining tree with Rainbow trout as outgroup. 3000 iterations were conducted in the program POPULATIONS (version 1.2.26) with bootstrap values indicated at the tree nodes. Macklin and Edwards creeks LCT were thought to be of Truckee River origin. Macklin clusters with Willow-Whitehorse populations (88%) in Coyote Lakes basin, Oregon. Edwards Creek LCT cluster with Reese River LCT populations (82%) and O’Harrel Creek of putative Walker basin origin clusters with Carson River LCT populations (100%). Walker River LCT populations do not cluster with any extant LCT populations. Scale represents genetic distance. STRUCTURE analysis involving extant Western basin populations, populations of western basin
origin (Table 12), the historical Truckee basin samples, East Marys River, Summit Lake,
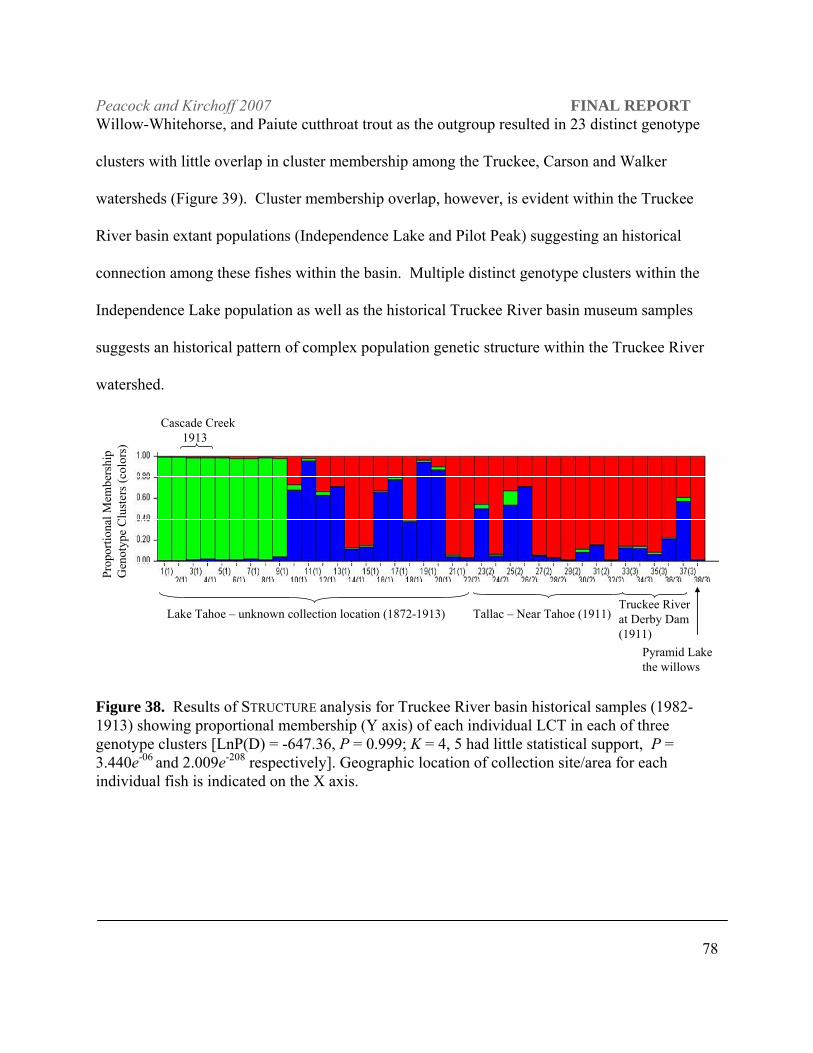
Peacock and Kirchoff 2007 FINAL REPORT
78
Willow-Whitehorse, and Paiute cutthroat trout as the outgroup resulted in 23 distinct genotype
clusters with little overlap in cluster membership among the Truckee, Carson and Walker
watersheds (Figure 39). Cluster membership overlap, however, is evident within the Truckee
River basin extant populations (Independence Lake and Pilot Peak) suggesting an historical
connection among these fishes within the basin. Multiple distinct genotype clusters within the
Independence Lake population as well as the historical Truckee River basin museum samples
suggests an historical pattern of complex population genetic structure within the Truckee River
watershed.
Prop
ortio
nal M
embe
rshi
pG
enot
ype
Clu
ster
s (co
lors
)
Lake Tahoe – unknown collection location (1872-1913) Tallac – Near Tahoe (1911)Truckee Riverat Derby Dam(1911)
Pyramid Lakethe willows
Cascade Creek1913
Figure 38. Results of STRUCTURE analysis for Truckee River basin historical samples (1982-1913) showing proportional membership (Y axis) of each individual LCT in each of three genotype clusters [LnP(D) = -647.36, P = 0.999; K = 4, 5 had little statistical support, P = 3.440e-06 and 2.009e-208 respectively]. Geographic location of collection site/area for each individual fish is indicated on the X axis.
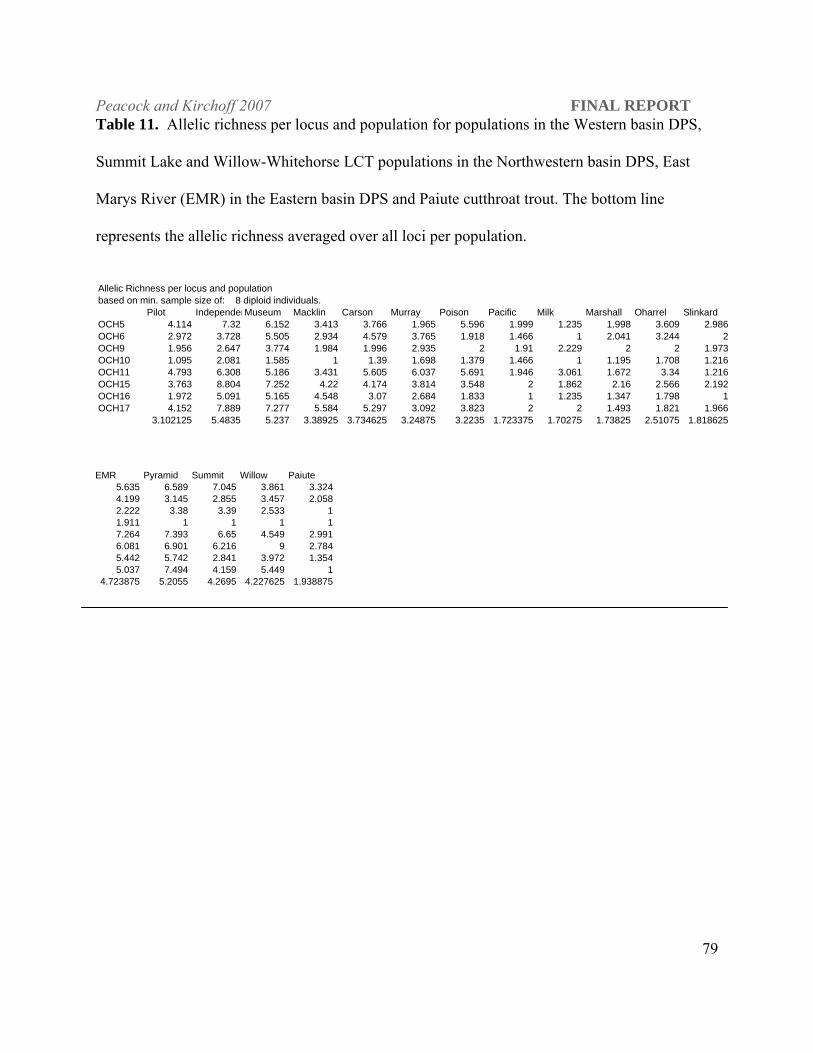
Peacock and Kirchoff 2007 FINAL REPORT
79
Table 11. Allelic richness per locus and population for populations in the Western basin DPS,
Summit Lake and Willow-Whitehorse LCT populations in the Northwestern basin DPS, East
Marys River (EMR) in the Eastern basin DPS and Paiute cutthroat trout. The bottom line
represents the allelic richness averaged over all loci per population.
Allelic Richness per locus and populationbased on min. sample size of: 8 diploid individuals.
Pilot IndependenMuseum Macklin Carson Murray Poison Pacific Milk Marshall Oharrel SlinkardOCH5 4.114 7.32 6.152 3.413 3.766 1.965 5.596 1.999 1.235 1.998 3.609 2.986OCH6 2.972 3.728 5.505 2.934 4.579 3.765 1.918 1.466 1 2.041 3.244 2OCH9 1.956 2.647 3.774 1.984 1.996 2.935 2 1.91 2.229 2 2 1.973OCH10 1.095 2.081 1.585 1 1.39 1.698 1.379 1.466 1 1.195 1.708 1.216OCH11 4.793 6.308 5.186 3.431 5.605 6.037 5.691 1.946 3.061 1.672 3.34 1.216OCH15 3.763 8.804 7.252 4.22 4.174 3.814 3.548 2 1.862 2.16 2.566 2.192OCH16 1.972 5.091 5.165 4.548 3.07 2.684 1.833 1 1.235 1.347 1.798 1OCH17 4.152 7.889 7.277 5.584 5.297 3.092 3.823 2 2 1.493 1.821 1.966
3.102125 5.4835 5.237 3.38925 3.734625 3.24875 3.2235 1.723375 1.70275 1.73825 2.51075 1.818625
EMR Pyramid Summit Willow Paiute5.635 6.589 7.045 3.861 3.3244.199 3.145 2.855 3.457 2.0582.222 3.38 3.39 2.533 11.911 1 1 17.264 7.393 6.65 4.549 2.9916.081 6.901 6.216 9 2.7845.442 5.742 2.841 3.972 1.3545.037 7.494 4.159 5.449 1
4.723875 5.2055 4.2695 4.227625 1.938875
1
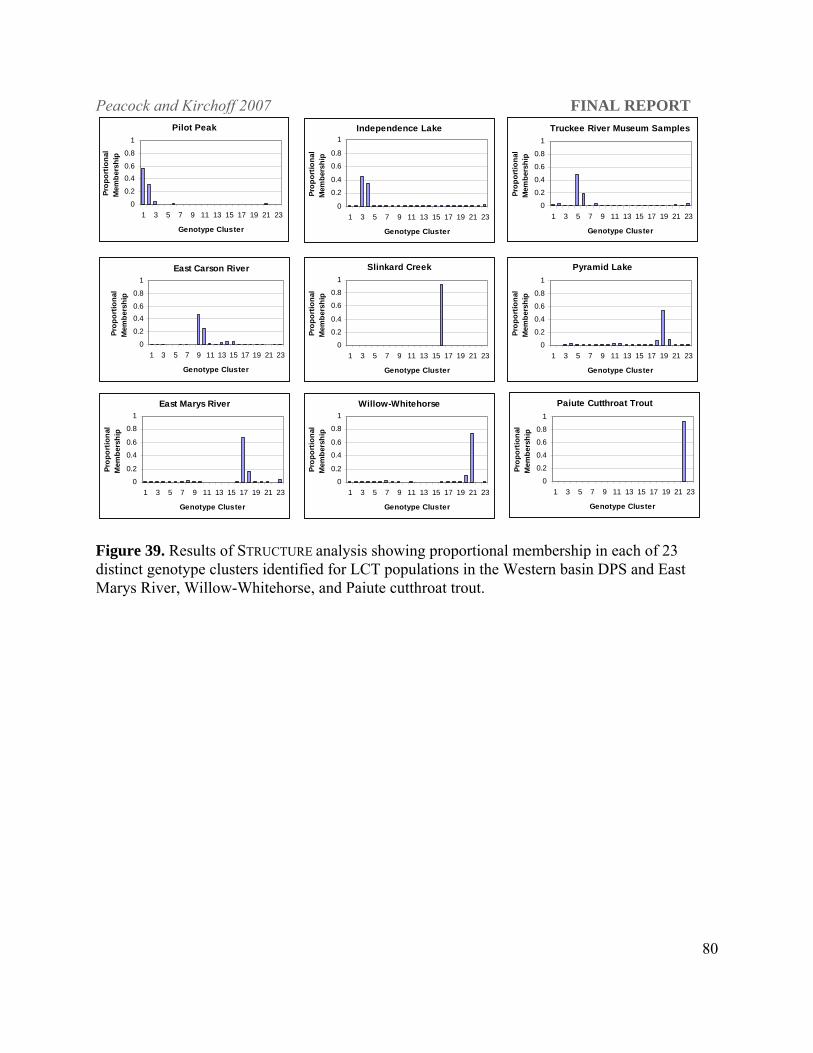
Peacock and Kirchoff 2007 FINAL REPORT
80
Truckee River Museum Samples
0
0.2
0.4
0.6
0.8
1
1 3 5 7 9 11 13 15 17 19 21 23
Genotype Cluster
Prop
ortio
nal
Mem
bers
hip
Pilot Peak
0
0.2
0.40.6
0.8
1
1 3 5 7 9 11 13 15 17 19 21 23
Genotype Cluster
Prop
ortio
nal
Mem
bers
hip
Independence Lake
0
0.2
0.4
0.6
0.8
1
1 3 5 7 9 11 13 15 17 19 21 23
Genotype Cluster
Prop
ortio
nal
Mem
bers
hip
East Carson River
0
0.2
0.40.6
0.8
1
1 3 5 7 9 11 13 15 17 19 21 23
Genotype Cluster
Prop
ortio
nal
Mem
bers
hip
Slinkard Creek
0
0.2
0.4
0.6
0.8
1
1 3 5 7 9 11 13 15 17 19 21 23
Genotype Cluster
Prop
ortio
nal
Mem
bers
hip
East Marys River
0
0.2
0.4
0.6
0.8
1
1 3 5 7 9 11 13 15 17 19 21 23
Genotype Cluster
Prop
ortio
nal
Mem
bers
hip
Pyramid Lake
0
0.2
0.4
0.6
0.8
1
1 3 5 7 9 11 13 15 17 19 21 23
Genotype Cluster
Prop
ortio
nal
Mem
bers
hip
Willow-Whitehorse
0
0.2
0.4
0.6
0.8
1
1 3 5 7 9 11 13 15 17 19 21 23
Genotype Cluster
Prop
ortio
nal
Mem
bers
hip
Paiute Cutthroat Trout
0
0.2
0.4
0.6
0.8
1
1 3 5 7 9 11 13 15 17 19 21 23
Genotype ClusterPr
opor
tiona
l M
embe
rshi
p
Figure 39. Results of STRUCTURE analysis showing proportional membership in each of 23 distinct genotype clusters identified for LCT populations in the Western basin DPS and East Marys River, Willow-Whitehorse, and Paiute cutthroat trout.
Peacock and Kirchoff 2007 FINAL REPORT
81
Table 12. Populations included in STRUCTURE analysis of Western basin DPS (See Figure 36). Truckee River basin
Pilot Peak (Bettridge, Morrison and Pilot Peak broodstock) Independence (Independence and Heenan Lakes) Truckee Basin Historical samples Pyramid Lake
Carson River East Carson River Murray Creek Poison Flat Creek Pacific Valley River Milk Ranch Creek Marshall Canyon Creek O’Harrel Creek
Walker River Slinkard Humboldt River East Marys River Summit Lake Willow-Whitehorse Paiute Cutthroat trout
DISCUSSION AND MANAGEMENT IMPLICATIONS
6) How can the level and pattern of genetic diversity within extant populations inform
priority ranking for recovery activities?
Hierarchical genetic analysis of extant Lahontan cutthroat trout populations informs the recovery
process by providing information on population dynamics at various spatial and temporal scales
(Slatkin 1985; Dunham et al. 1998; Davies et al. 1999; Dunham et al. 1999b; Manel et al. 2003).
On a range wide basis, microsatellite data and phylogenetic analyses support the
designation of three Distinct Population Segments for Lahontan cutthroat trout. Significant
Peacock and Kirchoff 2007 FINAL REPORT
82
genetic differentiation, in addition to morphological and meristic differences among LCT in each
respective DPS, suggest these populations form evolutionarily significant units replete with
adaptations specific to their native habitats (Waples 1995; Rosenfeld and Hatfield 2006). This
differentiation among DPSs warrants the development of recovery strategies on a DPS basis.
Historically, LCT were found in large interconnected stream and/or stream and lake systems
throughout their range (Coffin and Cowan 1995). Population dynamics in intact interconnected
stream systems provide our only insight into what is likely the historical norm for this
subspecies. Genetic patterns observed in these remaining interconnected stream systems can
provide a predictive framework with which to reconstruct population dynamics in now
fragmented watersheds throughout the range of LCT. Prior research on this subspecies indicates
that habitat quality (e.g., temperature; Dunham et al. 1999a) and diversity (e.g., habitats to
support all age classes and life history strategies; Ray et al. 2000; Neville et al. 2006) as well as
watershed area (Dunham et al. 1997; Dunham et al. 2002) are important factors in long term
persistence of LCT populations.
Metapopulation dynamics have been predicted for many inland salmonid species but few
definitive data have been collected to test this hypothesis (Rieman and Dunham 2000).
Independent extinction and colonization probabilities among demographically independent
subpopulations, represent two major assumptions of metapopulation theory (Hanski 1999).
Characterization of LCT population dynamics in intact, interconnected streams systems in the
eastern Lahontan basin (Marys River and Maggie Creek) using microsatellite genetic markers,

Peacock and Kirchoff 2007 FINAL REPORT
83
reveals population genetic structure at multiple spatial scales within watersheds (this study,
Neville et al. 2006). Patterns of genetic variation in these watersheds further indicate complex
dynamics involving habitat diversity and emerging life history strategies (Neville et al. 2006).
The observed population genetic structure, together with observed extirpation and
recolonization events, and evidence of genetic bottlenecks among interconnected tributary
subpopulations within the Marys River and Maggie Creek basins, support a
metapopulation (or more generally a networked population) dynamic for LCT (Ray et al.
2000; Rieman and Dunham 2000; Neville et al. 2006). Such dynamics can be viewed as a
natural risk spreading strategy for salmonids (Cooper and Mangel 1999) in highly variable
environments such as desert aquatic ecosystems. Indeed, many inland salmonid species exhibit
complex population dynamics on varied landscapes (Gresswell et al. 1994; Rieman and
McIntyre 1995; Dunham and Rieman 1999; Rieman and Dunham 2000; Harig and Fausch 2002;
Cegelski et al. 2006).
Similar patterns of population genetic structure as seen in LCT populations found in
interconnected habitat are observed in the isolated tributaries of the North Fork Humboldt River,
which were still connected in the early 20th century. Pairwise FST and Bayesian genotype cluster
analyses of tributary populations both within and among watersheds that drain directly into the
main stem Humboldt River (Marys River, North Fork Humboldt River, Maggie and Frazer
creeks) suggest low to moderate levels of genetic differentiation and a geographic pattern of
isolation-by-distance among watersheds. Populations in tributaries which drain into the Reese
and Little Humboldt rivers are more geographically isolated from the main stem Humboldt
Peacock and Kirchoff 2007 FINAL REPORT
84
River, and pairwise FST analysis shows these populations to be greatly differentiated from each
other (FST > 0.25) and from the other Humboldt River populations. These data also support a
pattern of isolation-by-distance within the larger Humboldt River drainage as well as
contemporary isolation of populations within the Reese and Little Humboldt rivers. Genotype
clustering analysis revealed population genetic structure within some of these isolated tributary
populations (Indian, Mohawk and Tierney creeks). These data suggest intact habitat diversity
sufficient to support multiple distinct genotype clusters. However, small population size,
evidence of genetic bottlenecks and physical isolation undoubtedly increases extirpation risk for
these populations that have no opportunities for natural recolonization.
Long-term recovery activities of LCT populations in the Eastern basin DPS should involve
habitat recovery – in terms of both habitat quality and interconnectedness in order to
facilitate restoration of the historic population dynamic in these watersheds. Since genetic
patterns reveal long-term movement dynamics among LCT populations across a large and varied
aquatic landscape, achieving long term persistence of LCT populations in small isolated habitats
is highly unlikely, especially given recent extirpations of isolated populations in both the
Humboldt and Quinn River basins (Elliot et al. 1997; Sevon et al. 1999). Essentially all historic
populations found in the southern Santa Rosa Range, western Montana Mountains, Jackson
Mountains, Calico Mountains and Granite Range have been lost due to fragmentation and
subsequent isolation.
LCT populations in the Quinn River basin are small, isolated and few in number. Of the 11

Peacock and Kirchoff 2007 FINAL REPORT
85
extant LCT populations listed in the LCT Recovery Plan (Coffin and Cowan 1995), eight are
identified as having the best potential for recovery. In terms of genetic resources, of these eight it
has been determined that Sage and Indian creek populations in the McDermitt Creek drainage
are introgressed with rainbow trout (Peacock and Kirchoff 2004), Riser and Corral creeks were
established with Line Canyon Creek LCT, and Washburn and Crowley creeks have very small
populations, no within tributary population genetic structure, and very low levels of
heterozygosity. Pairwise FST analysis shows that the pure LCT populations sampled (Line
Canyon, 3 Mile, Washburn and Crowley creeks) are greatly differentiated from each other (FST ≥
0.19). Line Canyon and 3 Mile creek LCT populations have the highest levels of heterozygosity
among the Quinn River populations sampled, and 3 Mile has the largest population size. Both 3
Mile and Line Canyon creek populations also have genetic structure with multiple genotype
clusters identified per population. FST analysis suggests the pure LCT populations sampled are
contemporaneously very disjunct and have been isolated for a considerable period. It is unlikely
that gene flow among these populations was ever very frequent, given the current FST estimates,
even when the streams were connected via the Quinn River. However, small population size,
repeated genetic bottlenecks and current population isolation can inflate estimates of genetic
differentiation due to the resulting non-equilibrium dynamics (Whitlock and McCauley 1990).
Even so, intermittent gene flow is important in maintenance of genetic variation and long-term
population persistence (Slatkin 1985; Fahrig and Paloheimo 1988; Peacock 1997; Peacock and
Smith 1997). If dispersal corridors are present, recolonization and long-term metapopulation
dynamics are possible. The data clearly suggest that the temporal scale of such a dynamic in the
Quinn River basin functioned over a much longer time frame historically than that seen in the
Peacock and Kirchoff 2007 FINAL REPORT
86
Humboldt River.
The northwestern DPS team has initiated recovery activities in the interconnected McDermitt
Creek stream system which includes Line Canyon Creek. This has involved assessing levels of
hybridization and building barriers to prevent further encroachment of non-native rainbow trout,
with the ultimate aim of removing non-native or hybridized populations, reconnecting streams,
and either transplanting or allowing natural colonization of pure LCT from Line Canyon and
Riser and Corral creeks, to facilitate emergence of a metapopulation or networked population
dynamic. There is little opportunity to provide dispersal corridors among 3 Mile,
Washburn and Crowley creeks at present; however, increases in both the quality of
existing habitat and kilometers of occupiable habitat should be the priority. Preventing
further losses of genetic variation should be of the highest priority. These populations
should be monitored to assess additional losses of genetic variation in the short term as well
as increases in population size and emergence of population genetic structure with
increases in habitat quantity and quality in the long term.
The Willow-Whitehorse LCT populations are of unknown genetic origin. Phylogenetic analysis
shows they are distinct genetically from all other LCT populations. Willow-Whitehorse
populations are moderately differentiated from Foreman Creek in the Humboldt River, but
greatly differentiated from Foreman creek neighboring populations, Gance Creek and North Fork
Humboldt, and significantly differentiated from all Quinn River populations. Given unknown
founder population size, and ongoing effects of population isolation of the majority of extant
Peacock and Kirchoff 2007 FINAL REPORT
87
LCT populations, it is not possible with this analysis to establish the origin of Willow-
Whitehorse LCT, but it is unlikely they are of Quinn River origin.
The status of native LCT in the Western basin DPS is the most tenuous. There are no extant
fluvial populations of LCT native to the Truckee River basin. A population was founded with
Independence Lake LCT in the upper Truckee River, but non-native brook trout threaten long
term persistence of this population. Independence Lake and the out-of-basin Pilot Peak strain are
the only extant native Truckee basin LCT. Pilot Peak LCT have the strongest phylogenetic
relationship to historical, museum preserved LCT of known Lake-Tahoe-Truckee basin
origin prior to extirpation in the 1940s. The Independence Lake LCT do not show a strong
phylogenetic relationship with either Pilot Peak or Truckee River basin historical samples or any
other western basin populations. However, the population-level phylogenetic tree of western
basin LCT populations is largely unresolved. This is likely the result of a combination of factors
including historic genetic differentiation within basins, contemporary loss of most populations in
these basins, isolation of existing populations and the concomitant loss of genetic diversity
through small population size and potentially multiple genetic bottleneck events.
The Carson River has currently five extant fluvial populations within the basin (Coffin and
Cowan 1995) and a number of out-of-basin populations of Carson River origin. All populations
are significantly differentiated from one another and the out-of-basin populations have very low
levels of heterozygosity. Heterozygosities of native populations within the Carson basin,
however, are high and comparable to larger Eastern basin populations. Habitat restoration that
expands the kilometers of occupiable habitat in extant in-basin stream populations (East Carson

Peacock and Kirchoff 2007 FINAL REPORT
88
River, Murray and Poison Flat creeks) would facilitate population expansion and maintenance of
the genetic variation present in these populations. Securing additional habitat should be the long
term objective for this basin with the aim of creating a networked stream system(s).
Extant Walker basin populations were founded from LCT in By-Day Creek, a small, isolated
population of unknown origin. It is unknown if By-Day Creek is a remnant LCT population from
when the basin was largely occupied or if LCT were planted in these waters sometime in the 20th
century from other extant Walker basin populations. The current fluvial LCT populations in the
Walker River basin are genetically very depauperate. Loss of genetic diversity through repeated
founder events and/or genetic bottlenecks has resulted in low phylogenetic signal and an
inability to reconstruct the evolutionary history of these populations not only with regard to other
LCT populations in the Western basin DPS but throughout the extant range. Low levels of
genetic diversity and inability to identify the evolutionary origin of these fish precludes
creating a broodstock from these populations for recovery activities in the Walker basin.
Where possible, restoration efforts should focus on expansion of stream habitat for these
populations to prevent further losses of genetic variation. As the gene pool in the source
population, By-Day Creek has low levels of heterozygosity and moving these fish to additional
isolated locations could lead to additional losses of genetic variation through founder effects.
Slinkard Creek shows evidence of non-random sampling of individuals from By-Day Creek to
create a founder population.
In accordance with the DPS/ESU approach restoration and/or the re-creation of self-
Peacock and Kirchoff 2007 FINAL REPORT
89
sustaining populations should involve LCT native to their respective DPS and their
subbasin if possible. In the case of the Walker River basin in the Western basin DPS there
is no appropriate native stock of LCT available to re-establish a native fishery that would
likely exhibit attributes of the historic population. The Truckee and Walker river basins are
unique among basins within the historic range of LCT due to the large lacustrine habitats found
in these watersheds. The populations that were native to the these lakes have been extirpated for
the past ~70 years and habitat degradation, non-native salmonids and water diversions make
reestablishing naturally reproducing populations of native fish challenging. Phylogenetic
analysis identified Pilot Peak LCT as Truckee River basin in origin. Bayesian genotype
clustering analysis of Truckee River basin museum samples is illustrative, as genetic structure is
evident within these historic samples collected from Lake Tahoe, lower Truckee River and
Pyramid Lake. However, gene flow between fish collected in the Truckee River at Derby Dam
and Lake Tahoe was also evident with shared membership in distinct genotype clusters. This
historic signature of population genetic structure suggests a networked population dynamic
similar to that seen in the large fluvial systems extant in the Eastern basin DPS.
Pilot Peak LCT have high levels of heterozgosity and allelic richness and retain the genetic
signature of their source population. As such this strain likely retains any adaptations
specific to lacustrine life history and represents the best chance for recreating native
networked populations within the Lake Tahoe-Truckee River and Walker River
watersheds in Western basin DPS.
Peacock and Kirchoff 2007 FINAL REPORT
90
RECOMMENDATIONS
• Restoration activities range-wide should focus on recovery of interconnected stream
networks in each DPS.
• Due to genetic distinctiveness of LCT populations within each of the major river systems
recovery activities should use fish native to each DPS.
• Pilot Peak hatchery stock represents the historical gene pool of extirpated LCT from the
Lake Tahoe and Truckee River watersheds. These fish should be used in
recovery/restoration activities within this watershed to: (1) preserve the genetic legacy of
the western basin DPS LCT populations and (2) maximize the probability of successful
reintroductions by employing the strain native to these waters.
• The extant Walker River basin populations are all derived from a single small isolated
population, By-Day Creek. As a result of this small founder population, which has very
low levels of heterozygosity, all of these populations are genetically depauperate.
Therefore it is not advisable to create a hatchery broodstock with this strain for recovery
purposes.
• The extant populations found within the Carson River watershed have significantly
higher levels of genetic variability than the outplanted populations in the Mokelumne
River in California. Therefore the in situ populations should be used for recovery
activities in the expansion of occupied habitat in the Carson River watershed.
Peacock and Kirchoff 2007 FINAL REPORT
91
LITERATURE CITED
Allendorf, F. W., and L. W. Seeb. 2000. Concordance of genetic divergence among sockeye
salmon populations at allozyme, nuclear DNA, and mitochondrial DNA markers. Evolution 54:
640–651.
Beerli, P. 2002. MIGRATE 1.6: Documentation and program, part of LAMARC. Revised
August 7, 2002. Distributed over the Internet,
http://evolution.genetics.washington.edu/lamarc.html.
Behnke, R. J. 1992. Native Trout of Western North America. American Fisheries Society
Monograph 6. 275 pp.
Cegelski, C. C., M. R. Campbell, K. A. Meyer, and M. S. Powell. 2006. Multiscale genetic
structure of Yellowstone cutthroat trout in the upper Snake River basin. Transactions of the
American Fisheries Society 135: 711-726.
Coffin, P. D., and W. F. Cowan. 1995. Lahontan cutthroat trout (Oncorhynchus clark henshawi)
recovery plan. U. S. Fish and Wildlife Service, Region I, Portland, Oregon.
Cooper, A. B., and M. Mangel. 1999. The dangers of ignoring metapopulation structure for the
conservation of salmonids. Fisheries Bulletin 97: 213-226.
Peacock and Kirchoff 2007 FINAL REPORT
92
Cornuet, J. M., and G. Luikart. 1996. Description and power analysis of two tests for detecting
recent population bottlenecks from allele frequency data. Genetics 144: 2001-2014.
Cornuet, J. M., S. Piry, G. Luikart, A. Estoup, and M. Solignac. 1999. New methods employing
multilocus genotypes to select or exclude populations as origins of individuals. Genetics 153:
1989–2000.
Davies, N., F. X. Villablanca, and G. K. Roderick. 1999. Determining the source of individuals:
multilocus genotyping in nonequilibrium population genetics. Trends in Ecology and Evolution
14: 17–21.
Di Rienzo, A., P. Donnelly, C. Toomajian, B. Sisk, A. Hill, M. L. Petzl-Erler, K. Haines, and D.
H. Barch. 1998. Heterogeneity of microsatellite mutations within and between loci, and
implications for human demographic histories. Genetics 148: 1269-1284.
Di Rienzo, A., A. C. Peterson, J. C. Garza, A. M. Valdes, and M. Slatkin. 1994. Mutational
processes of simple-sequence repeat loci in human populations. Proceedings of the National
Academy of Sciences USA 91: 3166-3170.
Dickerson, B. R., and G. L. Vinyard. 1999. Effects of high chronic temperatures and diel
temperature cycles on the survival and growth of Lahontan cutthroat trout. Transactions of the
American Fisheries Society 128: 516-521.
Peacock and Kirchoff 2007 FINAL REPORT
93
Dunham, J. B., G. L. Vinyard, and B. E. Rieman. 1997. Habitat fragmentation and extinction risk
of Lahontan cutthroat trout. North American Journal of Fisheries Management 17: 1126-1133.
Dunham, J. B., G. L. Vinyard, and J. L. Nielsen. 1998. Evaluating the genetic identity of Pilot
Peak cutthroat trout in relation to hatchery broodstock development at the Lahontan National
Fish Hatchery and recovery of Lahontan cutthroat trout in the Truckee River basin. Final report
to U.S. Fish and Wildlife Service, Region 1, Reno, Nevada, NV. 16pp.
Dunham, J. B., and B. E. Rieman. 1999. Metapopulation structure of bull trout: Influences of
physical, biotic, and geometrical landscape characteristics. Ecological Applications 9: 642-655.
Dunham, J. B., M. M. Peacock, B. E. Rieman, R. E. Schroeter, and G. L. Vinyard. 1999a. Local
and geographic variability in the distribution of stream-living Lahontan cutthroat trout.
Transactions of the American Fisheries Society 128: 875-889.
Dunham, J., M. Peacock, C. R. Tracy, J. Nielsen, and G. Vinyard. 1999b. Assessing extinction
risk: Integrating genetic information. Conservation Ecology (online) 3(1): 2. Available at URL
http://www.consecol.org/vol3/iss1/art2
Peacock and Kirchoff 2007 FINAL REPORT
94
Dunham, J. B., B. S. Cade, and J. W. Terrell. 2002. Limitations to analyzing the effects of
limiting factors: influence of spatial and temporal variation on regression quantile models fish
abundance in streams. Transactions of American Fisheries Society 131: 86-98.
Dunham, J. B., K. A.Young, R. E. Gresswell, and B. E. Rieman. 2003. Effects of fire on fish
populations: landscape perspectives on persistence of native fishes and nonnative fish invasions.
Forest Ecology Management 178: 183–196.
Elliott, J., R. L. Haskins, and G. Weller. 1997. Lahontan cutthroat trout species management plan
for the upper Humboldt River drainage basin. Report to Nevada Division of Wildlife, Reno,
Nevada.
Estoup, A., F. Rousset, Y. Michalakis, J. M. Cornuet, M. Adriamanga, and R. Guyomard. 1998.
Comparative analysis of microsatellite and allozyme markers: a case study investigating
microgeographic differentiation in brown trout (Salmo trutta). Molecular Ecology 7:339-353.
Fahrig, L., and J. Paloheimo. 1988. Effect of spatial arrangement of habitat patches on local
population size. Ecology 69: 468–475.
Gall, G. A. E., and E. J. Loudenslager. 1981. Biochemical genetics and systematics of Nevada
trout populations. Final Report to Nevada Department of Wildlife, 53pp.
Peacock and Kirchoff 2007 FINAL REPORT
95
Garza, J. C., and E. G. Williamson. 2001. Detection of reduction in population size using data
from microsatellite loci. Molecular Ecology 10: 305–318.
Goudet, J. 2001. FSTAT, a program to estimate and test gene diversities and fixation indices
(version 2.9.3). Available from http://www.unil.ch/izea/softwares/fstat.html.
Gresswell, R. E., W. J. Liss, And G. L. Larson. 1994. Life-history organization of Yellowstone
cutthroat trout (Oncorhynchus clarki bouvieri) in Yellowstone Lake. Canadian Journal of
Fisheries and Aquatic Sciences 51: 298-309 (Supplement 1)
Gresswell, R. E., W. J. Liss, G. L. Larson and P. J. Bartlein. 1997. Influence of basin-scale
physical variables on life history characteristics of cutthroat trout in Yellowstone Lake. North
American Journal of Fisheries Management 17: 1046-1064.
Hanski, I. 1999. Metapopulation Ecology. Oxford University Press, London.
Harig, A. L., and K. D. Fausch. 2002. Minimum habitat requirements for establishing
translocated cutthroat trout populations. Ecological Applications 12: 535-551.
Harig, A. L., K. D. Fausch, and M. K. Young. 2000. Factors influencing success of greenback
cutthroat trout translocations. North American Journal of Fisheries Management 20: 994-1004.

Peacock and Kirchoff 2007 FINAL REPORT
96
Harig, A. L., W. T. Colyer, and J. McGurrin. 2004. Reconnecting fragmented Lahontan cutthroat
trout habitats: Restoration activities in the Maggie Creek basin, northeastern Nevada, 2001
2003. Trout Unlimited, Arlington, Virginia.
Hartl, D. L., and A. G. Clark. 1997. Principles of Population Genetics. 3rd edition, Sinauer
Associates, Sunderland, Massachusetts.
Healey, M. C., and A. Prince. 1995. Scales of variation in life history tactics of Pacific salmon
and the conservation of phenotype and genotype. Pp. 176-184 in J. L. Nielsen, editor, Evolution
and the aquatic ecosystem: defining unique units in population conservation. American Fisheries
Society, Special Publication 17, Bethesda, MD.
Hickman, T. J. and R. J. Behnke. 1979. Probable discovery of the original Pyramid Lake
cutthroat trout. The Progressive Fish-Culturist 41: 135-137.
De Innocentiis, S., L. Sola, S. Cataudella, amd P. Bentzen. 2001. Allozyme and microsatellite
loci provide discordant estimates of population differentiation in the endangered dusky grouper
(Epinephelus marginatus) within the Mediterranean Sea. Molecular Ecology 10: 2163-2175.
Kruglyak, S., R. T. Durrett, M. D. Schug, and C. F. Aquadro. 1998. Equilibrium distributions of
microsatellite repeat length resulting from a balance between slippage events and point
mutations. Proceedings of the National Academy of Sciences USA 95: 10774-10778.
Peacock and Kirchoff 2007 FINAL REPORT
97
Loudenslager, E. J., and G. A. E. Gall. 1980. Geographic patterns of protein variation and
subspeciation in cutthroat trout, Salmo clarki. Systematic Zoology 29: 27-42.
Luikart, G., J. M. Cornuet, and F. W. Allendorf. 1999. Temporal changes in allele frequencies
provide estimates of population bottleneck size. Conservation Biology 13: 523-530.
Manel, S., M. K. Schwartz, G. Luikart, P. and Taberlet. 2003. Landscape genetics: combining
landscape ecology and population genetics. Trends in Ecology and Evolution 18: 189–197.
Maruyama, T., and P. A. Fuerst. Population bottlenecks and nonequilibrium models in
population genetics. 2. Number of alleles in a small population that was formed by a recent
bottleneck. Genetics 111: 675-689.
Moritz, C. 1994. Applications of mitochondrial DNA analysis in conservation: a critical review.
Molecular Ecology 3: 401–411.
Neville, H. M., J. B. Dunham and M. M. Peacock. 2006. Landscape attributes and life history
variability shape genetic structure of trout populations in a stream network. Landscape Ecology
21: 901–916.
Neville-Arsenault, H. 2003. Genetic assessment of complex dynamics of interior salmonid
Peacock and Kirchoff 2007 FINAL REPORT
98
metapopulation. Doctoral dissertation. University of Nevada, Reno.
Nielsen, J. L., and G. K. Sage. 2002. Population genetic structure in Lahontan cutthroat trout.
Transactions of the American Fisheries Society 131: 376–388.
Ohta, T., and M. Kimura. 1973. The model of mutation appropriate to estimate the number of
electrophoretically detectable alleles in a genetic population. Genetic Research 22:201-204.
Paetkau, D., R. Slade, and M. Burden. 2004. Genetic assignment methods for the direct, real
time estimation of migration rate: a simulation-based exploration of accuracy and power.
Molecular Ecology 13: 55-65.
Paetkau, D., W. Calvert, and I. Stirling. 1995. Microsatellite analysis of population-structure in
Canadian polar bears. Molecular Ecology 4: 347-354.
Peacock, M. M. 1997. Determining natal dispersal patterns in a population of North American
pikas (Ochotona princeps) using direct mark-resight and indirect genetic methods. Behavioral
Ecology 8: 373-412.
Peacock, M. M., H. Neville, and V. Kirchoff. 2004. Ten species specific microsatellite loci for
Lahontan cutthroat trout, Oncorhynchus clarki henshawi. Molecular Ecology Notes 4: 557–559.
Peacock and Kirchoff 2007 FINAL REPORT
99
Peacock, M. M., A. L. Harig, W. T. Colyer and V. S. Kirchoff. In review. Persistence of desert
trout populations: clustering methods reveal a metapopulation dynamic at multiple spatial scales.
Transactions of the American Fisheries Society.
Peacock, M. M., and A. T. Smith. 1997. The effect of habitat fragmentation on dispersal, mating
behavior and genetic variation in a pika (Ochotona princeps) metapopulation. Oecologia 112:
524-533.
Peacock, M. M., and V. Kirchoff. 2004. Assessing the conservation value of hybridized cutthroat
trout populations in the Quinn River drainage, Nevada. Transactions of the American Fisheries
Society 133: 309–325.
Peacock, M. M., C. Ray, and J. B. Dunham. 1999. Population viability study of great basin
Lahontan cutthroat trout (Oncorhynchus clarki henshawi) stream populations. Interim Report for
Cooperative Agreement FSW 14-48-0001-95646.
Piry, S., A. Alapetite, J. M. Cornuet, D. Paetkau. L. Baudouin, and A. Estoup. 2004.
GeneClass2: A software for genetic assignment and first-generation migrant detection. Journal of
Heredity 95: 536-539.
Pritchard, J.K., M. Stephens, and P. Donnelly. 2000. Inference of population structure using
multilocus genotype data. Genetics 155: 945–959.
Peacock and Kirchoff 2007 FINAL REPORT
100
Rannala, B., and J. L. Mountain. 1997. Detecting immigration by using multilocus genotypes.
Proceedings of the National Academy of Sciences USA 94: 9197-9201.
Ray, C., M. M. Peacock, and J. B. Dunham. 2000. Population structure and persistence of
Lahontan cutthroat trout: results from a comparative study of isolated and networked streams.
Interim Report to U.S. Fish and Wildlife Service for Cooperative Agreement FWS 14-48-0001
95646, Reno, Nevada.
Ren, Z. P., J. Sallstrom, C. Sundstrom, et al. Recovering DNA and optimizing PCR conditions
from microdissected formalin-fixed and paraffin-embedded materials Pathobiology 68: 215-217.
Rieman, B. E., and J. D. McIntyre. 1995. Occurrence of bull trout in naturally fragmented
habitat patches of varied size. Transactions of the American Fisheries Society 124: 285-296.
Rieman, B. E., and J. B. Dunham. 2000. Metapopulations and salmonids: A synthesis of life
history patterns and empirical observations. Ecology of Freshwater Fish 9: 51-64.
Rosenfeld, J. S., and T. Hatfield. 2006. Information needs for assessing critical habitat of
freshwater fish. Canadian Journal of Fisheries and Aquatic Sciences 63: 683-698.
Sevon, M., J. French, J. Curran, and R. Phenix. 1999. Lahontan cutthroat trout species
Peacock and Kirchoff 2007 FINAL REPORT
101
management plan for the Quinn River/Black Rock basins and North Fork Little Humboldt River
sub-basin. Nevada Division of Wildlife, Federal Aid Project F-20-27 Job 113-P.
Slatkin, M. 1985. Gene flow in natural populations. Annual Review of Ecology and Systematics
16: 393–430.
Taylor, E. B. 1991. A review of local adaptation in Salmonidae, with particular reference to
Pacific and Atlantic salmon. Aquaculture 98: 185-207.
Valdes, A. M., M. Slatkin, and N. B. Freimer. 1993. Allele frequencies at microsatellite loci: the
stepwise mutation model revisited. Genetics 133: 737-749.
Waples, R. S. 1995. Evolutionarily significant units and the conservation of biological diversity
under the Endangered Species Act. Pages 8–27 in J. L. Nielsen, editor. Evolution and the aquatic
ecosystem: defining unique units in population conservation. American Fisheries Society,
Symposium 17, Bethesda, Maryland.
Waser, P. M., and C. Stroebeck. 1998. Genetic signatures of interpopulation dispersal. Trends
in Ecology and Evolution 13: 43-44.
Whitlock, M. C., and D. E. McCauley. 1990. Some population genetic consequences of colony
formation and extinction – genetic correlations within founding groups. Evolution 44: 1717-
1724.
Peacock and Kirchoff 2007 FINAL REPORT
102
Williams, R. N., D. K. Shiozawa, and R. P. Evans. 1992. Mitochondrial DNA analysis of Nevada
cutthroat trout populations, 25 August 1992. Boise State University Evolutionary Genetics
Laboratory Report 91–5, Boise State University, Boise, Idaho.
Williams, R. N., R. P. Evans, and D. K. Shiozawa. 1998. Genetic analysis of indigenous
cutthroat trout populations from northern Nevada. Clear Creek Genetics Lab Report 98–1 to
Nevada Department of Wildlife, Reno.
Wright, S. 1969. Evolution and the Genetics of Populations, Vol 2. Chicago: University of
Chicago Press, Chicago.

Peacock and Kirchoff 2007
FINAL REPORT
103

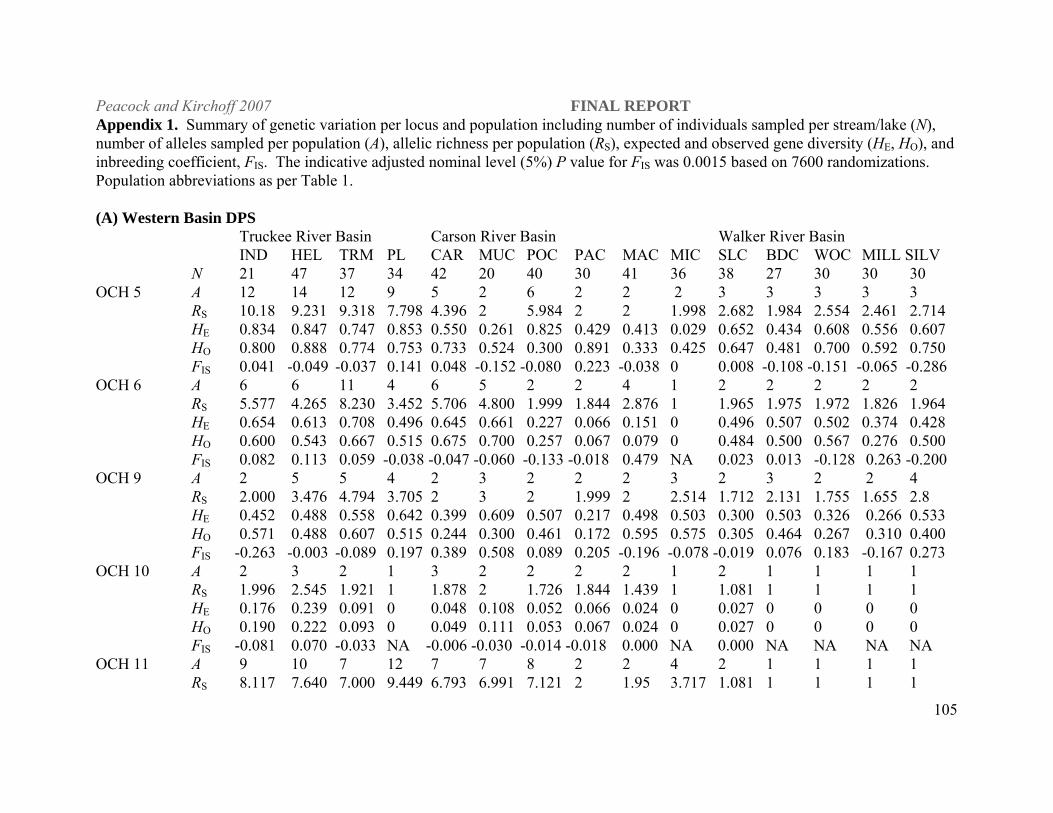
Peacock and Kirchoff 2007 FINAL REPORT
105
Appendix 1. Summary of genetic variation per locus and population including number of individuals sampled per stream/lake (N), number of alleles sampled per population (A), allelic richness per population (RS), expected and observed gene diversity (HE, HO), and inbreeding coefficient, FIS. The indicative adjusted nominal level (5%) P value for FIS was 0.0015 based on 7600 randomizations. Population abbreviations as per Table 1. (A) Western Basin DPS
Truckee River Basin Carson River Basin Walker River Basin IND HEL TRM PL CAR MUC POC PAC MAC MIC SLC BDC WOC MILL SILV N 21 47 37 34 42 20 40 30 41 36 38 27 30 30 30 OCH 5 A 12 14 12 9 5 2 6 2 2 2 3 3 3 3 3 RS 10.18 9.231 9.318 7.798 4.396 2 5.984 2 2 1.998 2.682 1.984 2.554 2.461 2.714 HE 0.834 0.847 0.747 0.853 0.550 0.261 0.825 0.429 0.413 0.029 0.652 0.434 0.608 0.556 0.607 HO 0.800 0.888 0.774 0.753 0.733 0.524 0.300 0.891 0.333 0.425 0.647 0.481 0.700 0.592 0.750 FIS 0.041 -0.049 -0.037 0.141 0.048 -0.152 -0.080 0.223 -0.038 0 0.008 -0.108 -0.151 -0.065 -0.286 OCH 6 A 6 6 11 4 6 5 2 2 4 1 2 2 2 2 2 RS 5.577 4.265 8.230 3.452 5.706 4.800 1.999 1.844 2.876 1 1.965 1.975 1.972 1.826 1.964 HE 0.654 0.613 0.708 0.496 0.645 0.661 0.227 0.066 0.151 0 0.496 0.507 0.502 0.374 0.428 HO 0.600 0.543 0.667 0.515 0.675 0.700 0.257 0.067 0.079 0 0.484 0.500 0.567 0.276 0.500 FIS 0.082 0.113 0.059 -0.038 -0.047 -0.060 -0.133 -0.018 0.479 NA 0.023 0.013 -0.128 0.263 -0.200 OCH 9 A 2 5 5 4 2 3 2 2 2 3 2 3 2 2 4 RS 2.000 3.476 4.794 3.705 2 3 2 1.999 2 2.514 1.712 2.131 1.755 1.655 2.8 HE 0.452 0.488 0.558 0.642 0.399 0.609 0.507 0.217 0.498 0.503 0.300 0.503 0.326 0.266 0.533 HO 0.571 0.488 0.607 0.515 0.244 0.300 0.461 0.172 0.595 0.575 0.305 0.464 0.267 0.310 0.400 FIS -0.263 -0.003 -0.089 0.197 0.389 0.508 0.089 0.205 -0.196 -0.078 -0.019 0.076 0.183 -0.167 0.273 OCH 10 A 2 3 2 1 3 2 2 2 2 1 2 1 1 1 1 RS 1.996 2.545 1.921 1 1.878 2 1.726 1.844 1.439 1 1.081 1 1 1 1 HE 0.176 0.239 0.091 0 0.048 0.108 0.052 0.066 0.024 0 0.027 0 0 0 0 HO 0.190 0.222 0.093 0 0.049 0.111 0.053 0.067 0.024 0 0.027 0 0 0 0 FIS -0.081 0.070 -0.033 NA -0.006 -0.030 -0.014 -0.018 0.000 NA 0.000 NA NA NA NA OCH 11 A 9 10 7 12 7 7 8 2 2 4 2 1 1 1 1 RS 8.117 7.640 7.000 9.449 6.793 6.991 7.121 2 1.95 3.717 1.081 1 1 1 1
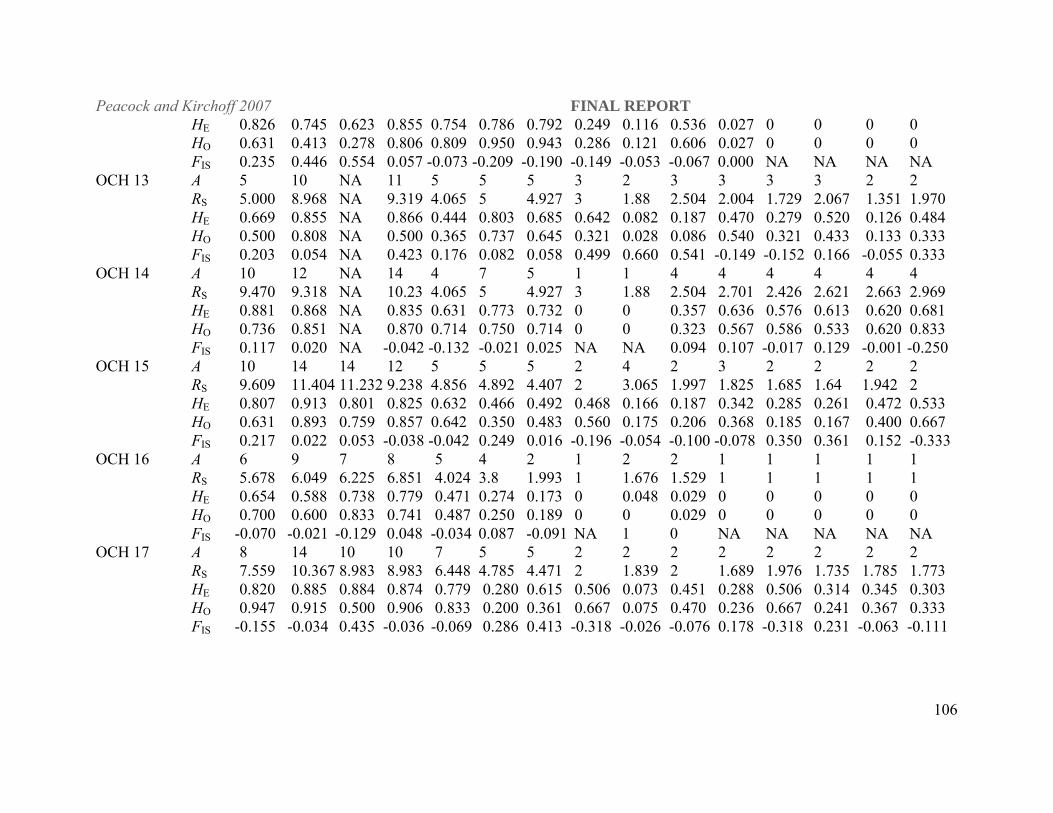
Peacock and Kirchoff 2007 FINAL REPORT
106
HE 0.826 0.745 0.623 0.855 0.754 0.786 0.792 0.249 0.116 0.536 0.027 0 0 0 0 HO 0.631 0.413 0.278 0.806 0.809 0.950 0.943 0.286 0.121 0.606 0.027 0 0 0 0 FIS 0.235 0.446 0.554 0.057 -0.073 -0.209 -0.190 -0.149 -0.053 -0.067 0.000 NA NA NA NA OCH 13 A 5 10 NA 11 5 5 5 3 2 3 3 3 3 2 2 RS 5.000 8.968 NA 9.319 4.065 5 4.927 3 1.88 2.504 2.004 1.729 2.067 1.351 1.970 HE 0.669 0.855 NA 0.866 0.444 0.803 0.685 0.642 0.082 0.187 0.470 0.279 0.520 0.126 0.484 HO 0.500 0.808 NA 0.500 0.365 0.737 0.645 0.321 0.028 0.086 0.540 0.321 0.433 0.133 0.333 FIS 0.203 0.054 NA 0.423 0.176 0.082 0.058 0.499 0.660 0.541 -0.149 -0.152 0.166 -0.055 0.333 OCH 14 A 10 12 NA 14 4 7 5 1 1 4 4 4 4 4 4 RS 9.470 9.318 NA 10.23 4.065 5 4.927 3 1.88 2.504 2.701 2.426 2.621 2.663 2.969 HE 0.881 0.868 NA 0.835 0.631 0.773 0.732 0 0 0.357 0.636 0.576 0.613 0.620 0.681 HO 0.736 0.851 NA 0.870 0.714 0.750 0.714 0 0 0.323 0.567 0.586 0.533 0.620 0.833 FIS 0.117 0.020 NA -0.042 -0.132 -0.021 0.025 NA NA 0.094 0.107 -0.017 0.129 -0.001 -0.250 OCH 15 A 10 14 14 12 5 5 5 2 4 2 3 2 2 2 2 RS 9.609 11.404 11.232 9.238 4.856 4.892 4.407 2 3.065 1.997 1.825 1.685 1.64 1.942 2 HE 0.807 0.913 0.801 0.825 0.632 0.466 0.492 0.468 0.166 0.187 0.342 0.285 0.261 0.472 0.533 HO 0.631 0.893 0.759 0.857 0.642 0.350 0.483 0.560 0.175 0.206 0.368 0.185 0.167 0.400 0.667 FIS 0.217 0.022 0.053 -0.038 -0.042 0.249 0.016 -0.196 -0.054 -0.100 -0.078 0.350 0.361 0.152 -0.333 OCH 16 A 6 9 7 8 5 4 2 1 2 2 1 1 1 1 1 RS 5.678 6.049 6.225 6.851 4.024 3.8 1.993 1 1.676 1.529 1 1 1 1 1 HE 0.654 0.588 0.738 0.779 0.471 0.274 0.173 0 0.048 0.029 0 0 0 0 0 HO 0.700 0.600 0.833 0.741 0.487 0.250 0.189 0 0 0.029 0 0 0 0 0 FIS -0.070 -0.021 -0.129 0.048 -0.034 0.087 -0.091 NA 1 0 NA NA NA NA NA OCH 17 A 8 14 10 10 7 5 5 2 2 2 2 2 2 2 2 RS 7.559 10.367 8.983 8.983 6.448 4.785 4.471 2 1.839 2 1.689 1.976 1.735 1.785 1.773 HE 0.820 0.885 0.884 0.874 0.779 0.280 0.615 0.506 0.073 0.451 0.288 0.506 0.314 0.345 0.303 HO 0.947 0.915 0.500 0.906 0.833 0.200 0.361 0.667 0.075 0.470 0.236 0.667 0.241 0.367 0.333 FIS -0.155 -0.034 0.435 -0.036 -0.069 0.286 0.413 -0.318 -0.026 -0.076 0.178 -0.318 0.231 -0.063 -0.111
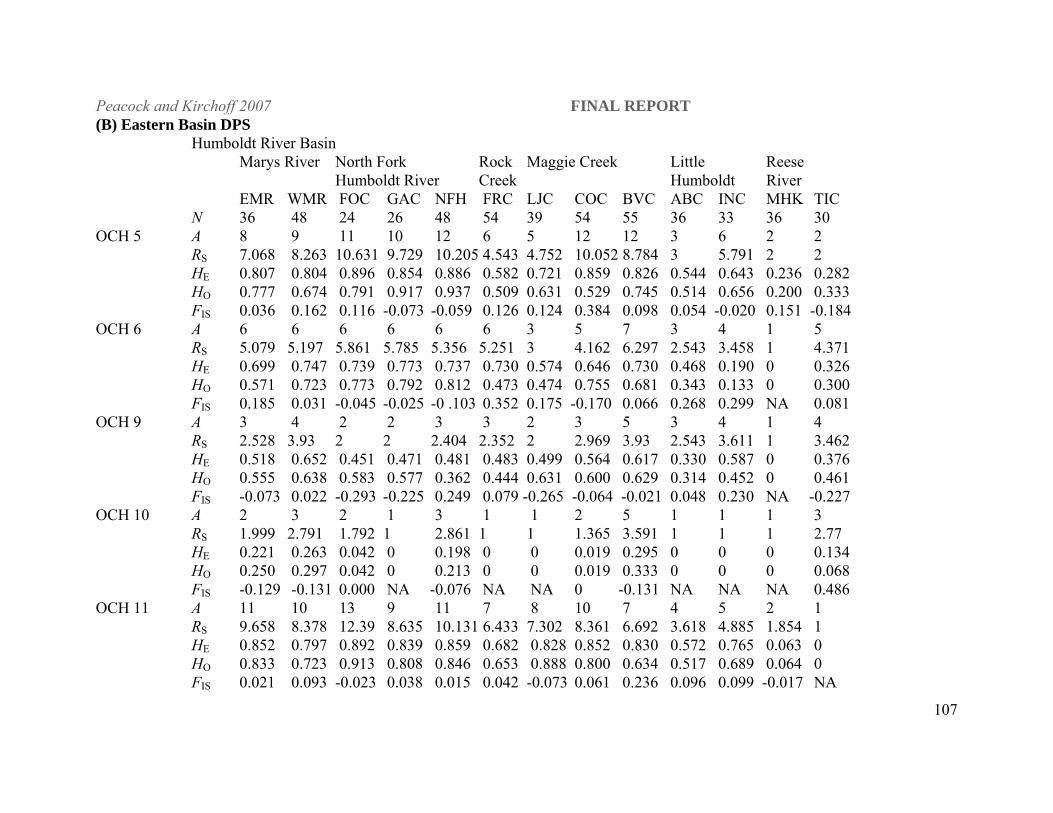
Peacock and Kirchoff 2007 FINAL REPORT
107
(B) Eastern Basin DPS Humboldt River Basin
Marys River North Fork Rock Maggie Creek Little Reese Humboldt River Creek Humboldt River
EMR WMR FOC GAC NFH FRC LJC COC BVC ABC INC MHK TIC N 36 48 24 26 48 54 39 54 55 36 33 36 30 OCH 5 A 8 9 11 10 12 6 5 12 12 3 6 2 2 RS 7.068 8.263 10.631 9.729 10.205 4.543 4.752 10.052 8.784 3 5.791 2 2 HE 0.807 0.804 0.896 0.854 0.886 0.582 0.721 0.859 0.826 0.544 0.643 0.236 0.282 HO 0.777 0.674 0.791 0.917 0.937 0.509 0.631 0.529 0.745 0.514 0.656 0.200 0.333 FIS 0.036 0.162 0.116 -0.073 -0.059 0.126 0.124 0.384 0.098 0.054 -0.020 0.151 -0.184 OCH 6 A 6 6 6 6 6 6 3 5 7 3 4 1 5 RS 5.079 5.197 5.861 5.785 5.356 5.251 3 4.162 6.297 2.543 3.458 1 4.371 HE 0.699 0.747 0.739 0.773 0.737 0.730 0.574 0.646 0.730 0.468 0.190 0 0.326 HO 0.571 0.723 0.773 0.792 0.812 0.473 0.474 0.755 0.681 0.343 0.133 0 0.300 FIS 0.185 0.031 -0.045 -0.025 -0 .103 0.352 0.175 -0.170 0.066 0.268 0.299 NA 0.081 OCH 9 A 3 4 2 2 3 3 2 3 5 3 4 1 4 RS 2.528 3.93 2 2 2.404 2.352 2 2.969 3.93 2.543 3.611 1 3.462 HE 0.518 0.652 0.451 0.471 0.481 0.483 0.499 0.564 0.617 0.330 0.587 0 0.376 HO 0.555 0.638 0.583 0.577 0.362 0.444 0.631 0.600 0.629 0.314 0.452 0 0.461 FIS -0.073 0.022 -0.293 -0.225 0.249 0.079 -0.265 -0.064 -0.021 0.048 0.230 NA -0.227 OCH 10 A 2 3 2 1 3 1 1 2 5 1 1 1 3 RS 1.999 2.791 1.792 1 2.861 1 1 1.365 3.591 1 1 1 2.77 HE 0.221 0.263 0.042 0 0.198 0 0 0.019 0.295 0 0 0 0.134 HO 0.250 0.297 0.042 0 0.213 0 0 0.019 0.333 0 0 0 0.068 FIS -0.129 -0.131 0.000 NA -0.076 NA NA 0 -0.131 NA NA NA 0.486 OCH 11 A 11 10 13 9 11 7 8 10 7 4 5 2 1 RS 9.658 8.378 12.39 8.635 10.131 6.433 7.302 8.361 6.692 3.618 4.885 1.854 1 HE 0.852 0.797 0.892 0.839 0.859 0.682 0.828 0.852 0.830 0.572 0.765 0.063 0 HO 0.833 0.723 0.913 0.808 0.846 0.653 0.888 0.800 0.634 0.517 0.689 0.064 0 FIS 0.021 0.093 -0.023 0.038 0.015 0.042 -0.073 0.061 0.236 0.096 0.099 -0.017 NA
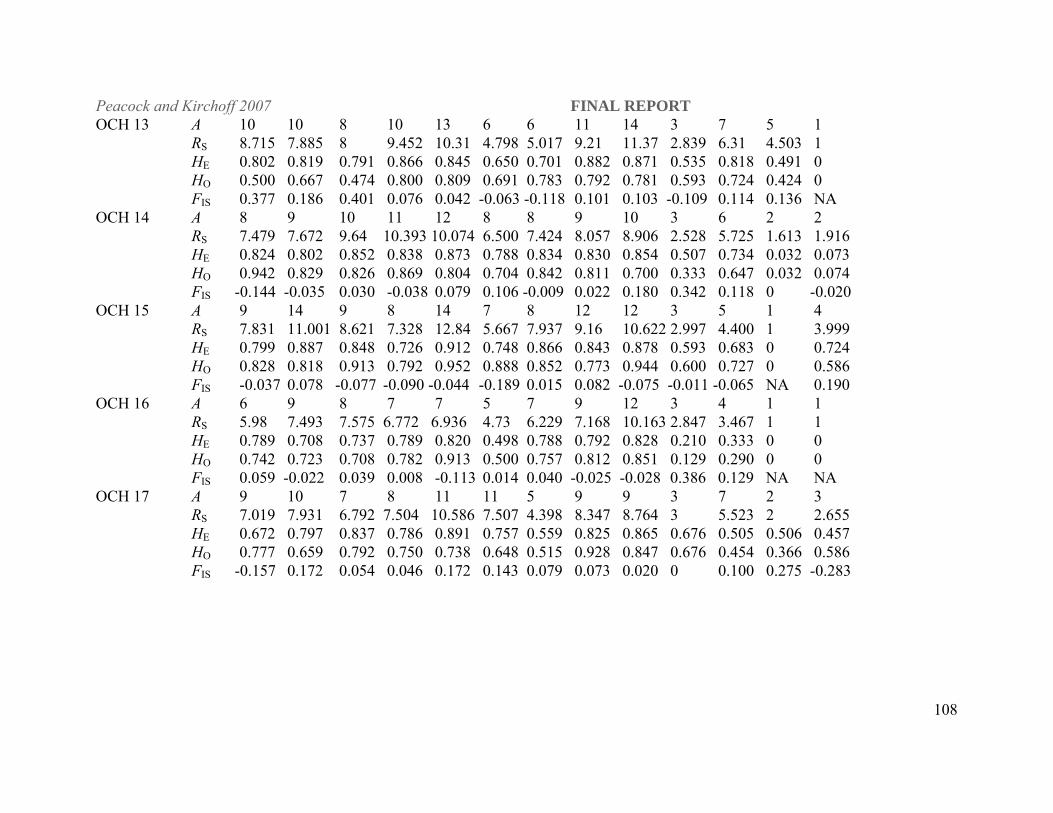
Peacock and Kirchoff 2007 FINAL REPORT
108
OCH 13 A 10 10 8 10 13 6 6 11 14 3 7 5 1 RS 8.715 7.885 8 9.452 10.31 4.798 5.017 9.21 11.37 2.839 6.31 4.503 1 HE 0.802 0.819 0.791 0.866 0.845 0.650 0.701 0.882 0.871 0.535 0.818 0.491 0 HO 0.500 0.667 0.474 0.800 0.809 0.691 0.783 0.792 0.781 0.593 0.724 0.424 0 FIS 0.377 0.186 0.401 0.076 0.042 -0.063 -0.118 0.101 0.103 -0.109 0.114 0.136 NA OCH 14 A 8 9 10 11 12 8 8 9 10 3 6 2 2 RS 7.479 7.672 9.64 10.393 10.074 6.500 7.424 8.057 8.906 2.528 5.725 1.613 1.916 HE 0.824 0.802 0.852 0.838 0.873 0.788 0.834 0.830 0.854 0.507 0.734 0.032 0.073 HO 0.942 0.829 0.826 0.869 0.804 0.704 0.842 0.811 0.700 0.333 0.647 0.032 0.074 FIS -0.144 -0.035 0.030 -0.038 0.079 0.106 -0.009 0.022 0.180 0.342 0.118 0 -0.020 OCH 15 A 9 14 9 8 14 7 8 12 12 3 5 1 4 RS 7.831 11.001 8.621 7.328 12.84 5.667 7.937 9.16 10.622 2.997 4.400 1 3.999 HE 0.799 0.887 0.848 0.726 0.912 0.748 0.866 0.843 0.878 0.593 0.683 0 0.724 HO 0.828 0.818 0.913 0.792 0.952 0.888 0.852 0.773 0.944 0.600 0.727 0 0.586 FIS -0.037 0.078 -0.077 -0.090 -0.044 -0.189 0.015 0.082 -0.075 -0.011 -0.065 NA 0.190 OCH 16 A 6 9 8 7 7 5 7 9 12 3 4 1 1 RS 5.98 7.493 7.575 6.772 6.936 4.73 6.229 7.168 10.163 2.847 3.467 1 1 HE 0.789 0.708 0.737 0.789 0.820 0.498 0.788 0.792 0.828 0.210 0.333 0 0 HO 0.742 0.723 0.708 0.782 0.913 0.500 0.757 0.812 0.851 0.129 0.290 0 0 FIS 0.059 -0.022 0.039 0.008 -0.113 0.014 0.040 -0.025 -0.028 0.386 0.129 NA NA OCH 17 A 9 10 7 8 11 11 5 9 9 3 7 2 3 RS 7.019 7.931 6.792 7.504 10.586 7.507 4.398 8.347 8.764 3 5.523 2 2.655 HE 0.672 0.797 0.837 0.786 0.891 0.757 0.559 0.825 0.865 0.676 0.505 0.506 0.457 HO 0.777 0.659 0.792 0.750 0.738 0.648 0.515 0.928 0.847 0.676 0.454 0.366 0.586 FIS -0.157 0.172 0.054 0.046 0.172 0.143 0.079 0.073 0.020 0 0.100 0.275 -0.283
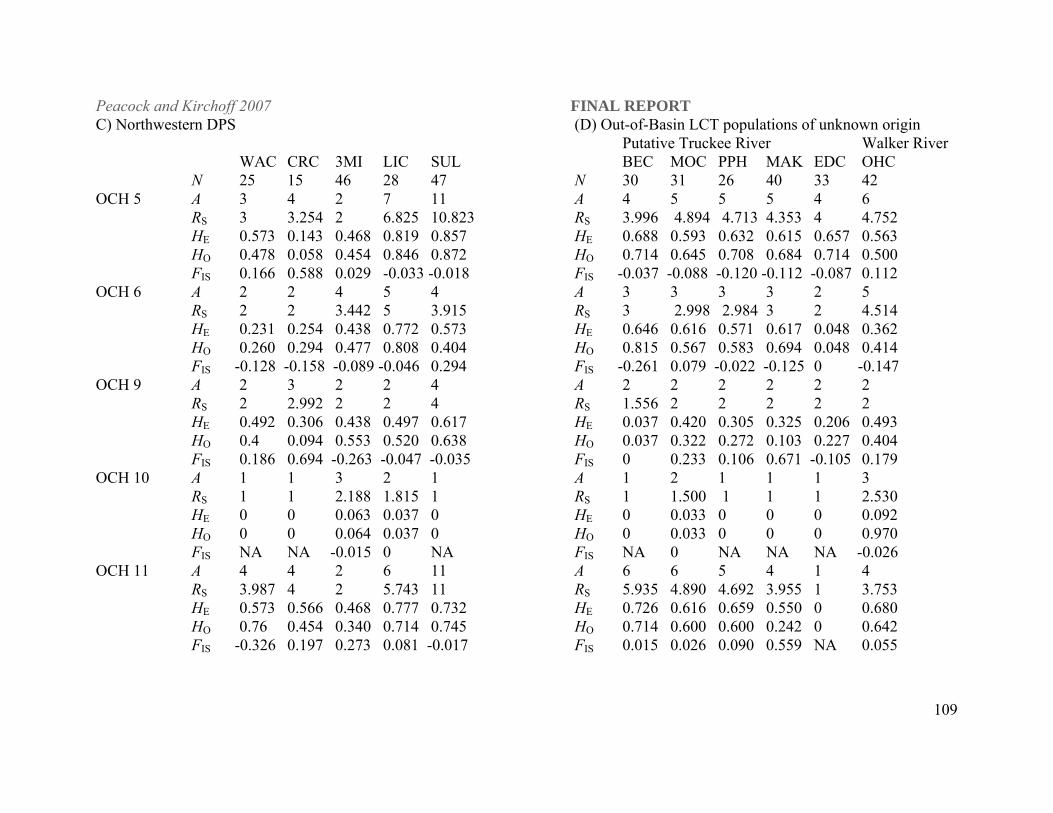
Peacock and Kirchoff 2007 FINAL REPORT
109
C) Northwestern DPS (D) Out-of-Basin LCT populations of unknown origin Putative Truckee River Walker River WAC CRC 3MI LIC SUL BEC MOC PPH MAK EDC OHC N 25 15 46 28 47 N 30 31 26 40 33 42 OCH 5 A 3 4 2 7 11 A 4 5 5 5 4 6 RS 3 3.254 2 6.825 10.823 RS 3.996 4.894 4.713 4.353 4 4.752 HE 0.573 0.143 0.468 0.819 0.857 HE 0.688 0.593 0.632 0.615 0.657 0.563 HO 0.478 0.058 0.454 0.846 0.872 HO 0.714 0.645 0.708 0.684 0.714 0.500 FIS 0.166 0.588 0.029 -0.033 -0.018 FIS -0.037 -0.088 -0.120 -0.112 -0.087 0.112 OCH 6 A 2 2 4 5 4 A 3 3 3 3 2 5 RS 2 2 3.442 5 3.915 RS 3 2.998 2.984 3 2 4.514 HE 0.231 0.254 0.438 0.772 0.573 HE 0.646 0.616 0.571 0.617 0.048 0.362 HO 0.260 0.294 0.477 0.808 0.404 HO 0.815 0.567 0.583 0.694 0.048 0.414 FIS -0.128 -0.158 -0.089 -0.046 0.294 FIS -0.261 0.079 -0.022 -0.125 0 -0.147 OCH 9 A 2 3 2 2 4 A 2 2 2 2 2 2 RS 2 2.992 2 2 4 RS 1.556 2 2 2 2 2 HE 0.492 0.306 0.438 0.497 0.617 HE 0.037 0.420 0.305 0.325 0.206 0.493 HO 0.4 0.094 0.553 0.520 0.638 HO 0.037 0.322 0.272 0.103 0.227 0.404 FIS 0.186 0.694 -0.263 -0.047 -0.035 FIS 0 0.233 0.106 0.671 -0.105 0.179 OCH 10 A 1 1 3 2 1 A 1 2 1 1 1 3 RS 1 1 2.188 1.815 1 RS 1 1.500 1 1 1 2.530 HE 0 0 0.063 0.037 0 HE 0 0.033 0 0 0 0.092 HO 0 0 0.064 0.037 0 HO 0 0.033 0 0 0 0.970 FIS NA NA -0.015 0 NA FIS NA 0 NA NA NA -0.026 OCH 11 A 4 4 2 6 11 A 6 6 5 4 1 4 RS 3.987 4 2 5.743 11 RS 5.935 4.890 4.692 3.955 1 3.753 HE 0.573 0.566 0.468 0.777 0.732 HE 0.726 0.616 0.659 0.550 0 0.680 HO 0.76 0.454 0.340 0.714 0.745 HO 0.714 0.600 0.600 0.242 0 0.642 FIS -0.326 0.197 0.273 0.081 -0.017 FIS 0.015 0.026 0.090 0.559 NA 0.055
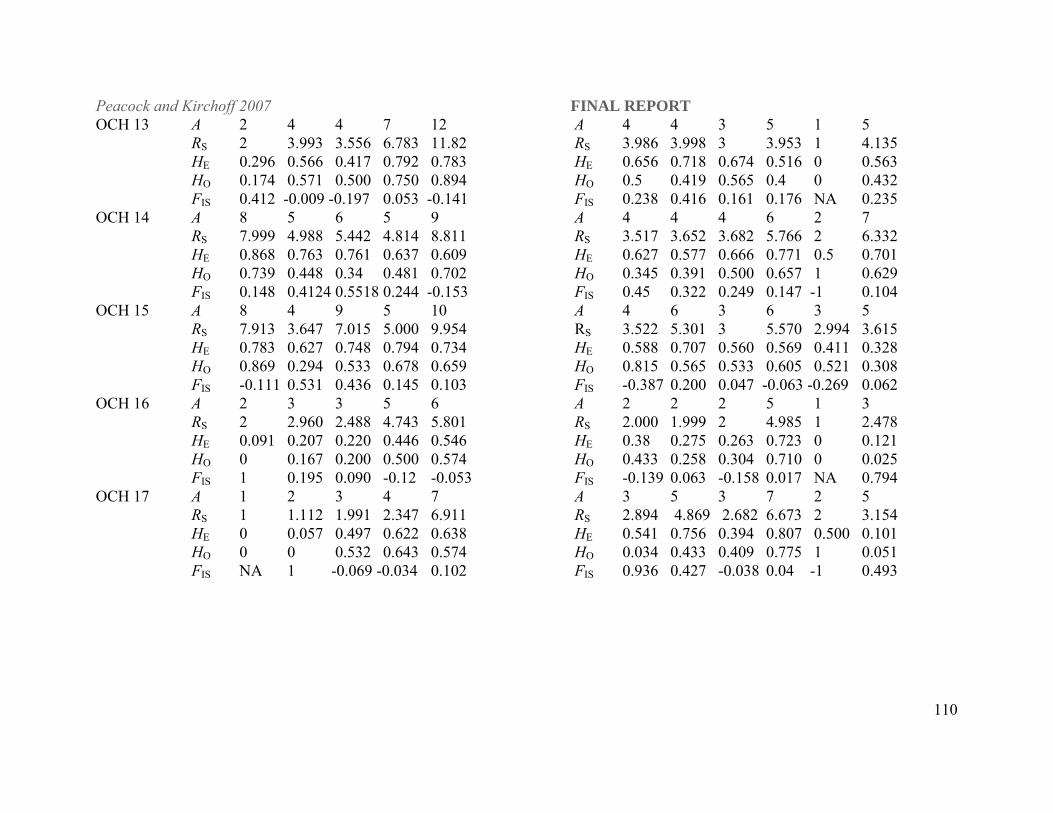
Peacock and Kirchoff 2007 FINAL REPORT
110
OCH 13 A 2 4 4 7 12 A 4 4 3 5 1 5 RS 2 3.993 3.556 6.783 11.82 RS 3.986 3.998 3 3.953 1 4.135 HE 0.296 0.566 0.417 0.792 0.783 HE 0.656 0.718 0.674 0.516 0 0.563 HO 0.174 0.571 0.500 0.750 0.894 HO 0.5 0.419 0.565 0.4 0 0.432 FIS 0.412 -0.009 -0.197 0.053 -0.141 FIS 0.238 0.416 0.161 0.176 NA 0.235 OCH 14 A 8 5 6 5 9 A 4 4 4 6 2 7 RS 7.999 4.988 5.442 4.814 8.811 RS 3.517 3.652 3.682 5.766 2 6.332 HE 0.868 0.763 0.761 0.637 0.609 HE 0.627 0.577 0.666 0.771 0.5 0.701 HO 0.739 0.448 0.34 0.481 0.702 HO 0.345 0.391 0.500 0.657 1 0.629 FIS 0.148 0.4124 0.5518 0.244 -0.153 FIS 0.45 0.322 0.249 0.147 -1 0.104 OCH 15 A 8 4 9 5 10 A 4 6 3 6 3 5 RS 7.913 3.647 7.015 5.000 9.954 RS 3.522 5.301 3 5.570 2.994 3.615 HE 0.783 0.627 0.748 0.794 0.734 HE 0.588 0.707 0.560 0.569 0.411 0.328 HO 0.869 0.294 0.533 0.678 0.659 HO 0.815 0.565 0.533 0.605 0.521 0.308 FIS -0.111 0.531 0.436 0.145 0.103 FIS -0.387 0.200 0.047 -0.063 -0.269 0.062 OCH 16 A 2 3 3 5 6 A 2 2 2 5 1 3 RS 2 2.960 2.488 4.743 5.801 RS 2.000 1.999 2 4.985 1 2.478 HE 0.091 0.207 0.220 0.446 0.546 HE 0.38 0.275 0.263 0.723 0 0.121 HO 0 0.167 0.200 0.500 0.574 HO 0.433 0.258 0.304 0.710 0 0.025 FIS 1 0.195 0.090 -0.12 -0.053 FIS -0.139 0.063 -0.158 0.017 NA 0.794 OCH 17 A 1 2 3 4 7 A 3 5 3 7 2 5 RS 1 1.112 1.991 2.347 6.911 RS 2.894 4.869 2.682 6.673 2 3.154 HE 0 0.057 0.497 0.622 0.638 HE 0.541 0.756 0.394 0.807 0.500 0.101 HO 0 0 0.532 0.643 0.574 HO 0.034 0.433 0.409 0.775 1 0.051 FIS NA 1 -0.069 -0.034 0.102 FIS 0.936 0.427 -0.038 0.04 -1 0.493

Peacock and Kirchoff 2007 FINAL REPORT
111
(E) Paiute cutthroat trout and Rainbow trout PAIUTE RBT N 48 6 OCH 5 A 5 4 OCH 13 A 5 16 RS 4.745 2.402 RS 5 3.651 HE 0.642 0.633 HE 0.759 0.939 HO 0.617 0.667 HO 0.613 0.847 FIS 0.039 -0.053 FIS 0.194 0.09 OCH 6 A 3 14 OCH 14 A 2 NA RS 2.872 3.399 RS 2 NA HE 0.228 0.889 HE 0.285 NA HO 0.17 0.967 HO 0.297 NA FIS 0.254 -0.087 FIS -0.044 NA OCH 9 A 1 9 OCH 15 A 5 12 RS 1 3.189 RS 4.928 3.238 HE 0 0.851 HE 0.286 0.858 HO 0 0.7 HO 0.272 0.722 FIS NA 0.177 FIS 0.047 0.1 OCH 10 A 1 3 OCH 16 A 2 17 RS 1 1.354 RS 2 3.636 HE 0 0.175 HE 0.049 0.942 HO 0 0.185 HO 0 0.714 FIS NA -0.057 FIS 1 0.241 OCH 11 A 3 1 OCH 17 A 1 10 RS 3 1 RS 1 3.18 HE 0.663 0 HE 0 0.841 HO 0.325 0 HO 0 0.454 FIS 0.509 NA FIS NA 0.466