LCA Study of the Product Group Personal Computers in...
86
LCA Study (Version 1.2), EU Ecolabels for Personal Computers, March 1998 Atlantic Consulting and IPU 1 LCA Study of the Product Group Personal Computers in the EU Ecolabel Scheme March 1998 Table of Contents 1. SUMMARY .................................................................................................................................................................... 4 1.1. Structure of this LCA Report, Nomenclature .......................................................................................................... 4 1.2. Inventory Analysis................................................................................................................................................... 5 1.3. Impact Assessment .................................................................................................................................................. 5 1.4. Improvement Assessment ........................................................................................................................................ 5 1.5. Validation ................................................................................................................................................................ 5 1.6. Implications for Criteria .......................................................................................................................................... 6 2. GOAL, SCOPE and METHODOLOGY......................................................................................................................... 6 2.1. Guidance for this Study ........................................................................................................................................... 6 2.2. Goal of this LCA ..................................................................................................................................................... 7 2.3. Sources of Data ....................................................................................................................................................... 7 2.4. Scope of this LCA ................................................................................................................................................... 8 2.4.1. System Boundaries .......................................................................................................................................... 8 2.4.2. Functional Unit .............................................................................................................................................. 20 2.5. LCA Methodology ................................................................................................................................................ 20 2.5.1. Allocation ...................................................................................................................................................... 20 2.5.2. Impact Assessment ........................................................................................................................................ 21 3. LIFE CYCLE INVENTORY ........................................................................................................................................ 27 3.1. Definition of the Generic PC ................................................................................................................................. 27 3.2. Description of Life Cycle Stages ........................................................................................................................... 32 3.2.1. Production of Raw Materials ......................................................................................................................... 32 3.2.2. Manufacturing ............................................................................................................................................... 32 3.2.3. Distribution.................................................................................................................................................... 32 3.2.4. Use................................................................................................................................................................. 33 3.2.5. Disposal ......................................................................................................................................................... 33 3.2.6. Energy and Transport .................................................................................................................................... 33 3.3. LCI for the personal computer .............................................................................................................................. 34 4. IMPACT ASSESSMENT ............................................................................................................................................. 37 4.1. The PC System ...................................................................................................................................................... 37 4.2. Control Unit .......................................................................................................................................................... 39 4.3. Keyboard ............................................................................................................................................................... 41 4.4. Monitor.................................................................................................................................................................. 42 4.5. Relative Contributions, Three Elements ................................................................................................................ 43 5. IMPROVEMENT ASSESSMENT ............................................................................................................................... 46 5.1. Definition of Design Options ................................................................................................................................ 46 5.1.1. Monitor Energy Consumption Reduced. ....................................................................................................... 46 5.1.2. Extension of Use-Life .................................................................................................................................... 46 5.1.3. Control-Unit Energy Consumption Reduced ................................................................................................. 46 5.1.4. Best Possible Dismantling/Recycling Scenario. ............................................................................................ 47 5.1.5. No Brominated Flame Retardants in Large Plastic Parts ............................................................................... 48 5.1.6. Recycled Plastic for Large Plastic Parts ........................................................................................................ 48 5.1.7. All Packaging Materials Are Recycled.......................................................................................................... 48 5.1.8. Lead-Free Solder ........................................................................................................................................... 48 5.2. Effects of the Design Options................................................................................................................................ 48 5.2.1. Monitor Energy Consumption Reduced ........................................................................................................ 50 5.2.2. Extension of Use-Life .................................................................................................................................... 50 5.2.3. Control-Unit Energy Consumption Reduced ................................................................................................. 50 5.2.4. Best Possible Dismantling/Recycling Scenario ............................................................................................. 50 5.2.5. No Brominated Flame Retardants in Large Plastic Parts ............................................................................... 50 5.2.6. Recycled Plastic for Large Plastic Parts ........................................................................................................ 51 5.2.7. All Packaging Materials Are Recycled .......................................................................................................... 51 5.2.8. Lead-Free Solder ........................................................................................................................................... 51 6. VALIDATION.............................................................................................................................................................. 53
Transcript of LCA Study of the Product Group Personal Computers in...

LCA Study (Version 1.2), EU Ecolabels for Personal Computers, March 1998Atlantic Consulting and IPU
1
LCA Study of the Product Group Personal Computersin the EU Ecolabel Scheme
March 1998
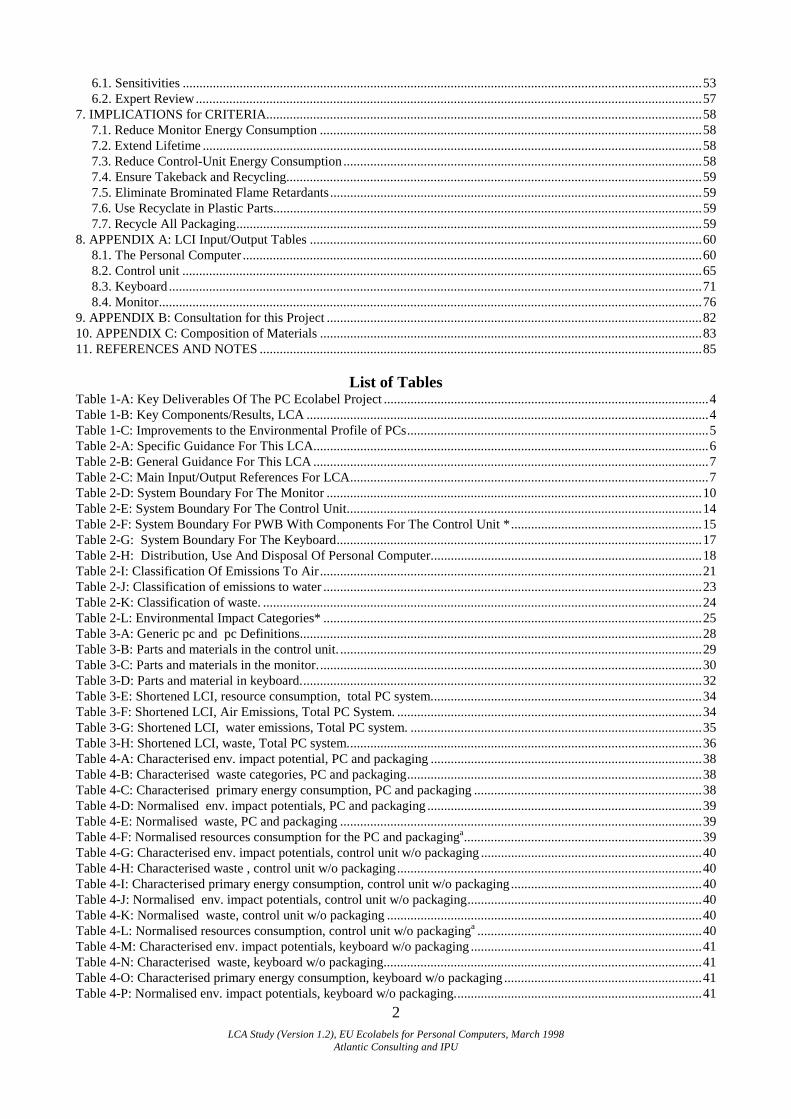
Table of Contents1. SUMMARY....................................................................................................................................................................4
1.1. Structure of this LCA Report, Nomenclature ..........................................................................................................41.2. Inventory Analysis...................................................................................................................................................51.3. Impact Assessment ..................................................................................................................................................51.4. Improvement Assessment........................................................................................................................................51.5. Validation................................................................................................................................................................51.6. Implications for Criteria ..........................................................................................................................................6
2. GOAL, SCOPE and METHODOLOGY.........................................................................................................................62.1. Guidance for this Study...........................................................................................................................................62.2. Goal of this LCA .....................................................................................................................................................72.3. Sources of Data .......................................................................................................................................................72.4. Scope of this LCA ...................................................................................................................................................8
2.4.1. System Boundaries ..........................................................................................................................................82.4.2. Functional Unit ..............................................................................................................................................20
2.5. LCA Methodology ................................................................................................................................................202.5.1. Allocation ......................................................................................................................................................202.5.2. Impact Assessment ........................................................................................................................................21
3. LIFE CYCLE INVENTORY........................................................................................................................................273.1. Definition of the Generic PC.................................................................................................................................273.2. Description of Life Cycle Stages...........................................................................................................................32
3.2.1. Production of Raw Materials .........................................................................................................................323.2.2. Manufacturing ...............................................................................................................................................323.2.3. Distribution....................................................................................................................................................323.2.4. Use.................................................................................................................................................................333.2.5. Disposal .........................................................................................................................................................333.2.6. Energy and Transport ....................................................................................................................................33
3.3. LCI for the personal computer ..............................................................................................................................344. IMPACT ASSESSMENT .............................................................................................................................................37
4.1. The PC System......................................................................................................................................................374.2. Control Unit ..........................................................................................................................................................394.3. Keyboard ...............................................................................................................................................................414.4. Monitor..................................................................................................................................................................424.5. Relative Contributions, Three Elements................................................................................................................43
5. IMPROVEMENT ASSESSMENT...............................................................................................................................465.1. Definition of Design Options ................................................................................................................................46
5.1.1. Monitor Energy Consumption Reduced. .......................................................................................................465.1.2. Extension of Use-Life....................................................................................................................................465.1.3. Control-Unit Energy Consumption Reduced .................................................................................................465.1.4. Best Possible Dismantling/Recycling Scenario. ............................................................................................475.1.5. No Brominated Flame Retardants in Large Plastic Parts...............................................................................485.1.6. Recycled Plastic for Large Plastic Parts ........................................................................................................485.1.7. All Packaging Materials Are Recycled..........................................................................................................485.1.8. Lead-Free Solder ...........................................................................................................................................48
5.2. Effects of the Design Options................................................................................................................................485.2.1. Monitor Energy Consumption Reduced ........................................................................................................505.2.2. Extension of Use-Life....................................................................................................................................505.2.3. Control-Unit Energy Consumption Reduced .................................................................................................505.2.4. Best Possible Dismantling/Recycling Scenario .............................................................................................505.2.5. No Brominated Flame Retardants in Large Plastic Parts...............................................................................505.2.6. Recycled Plastic for Large Plastic Parts ........................................................................................................515.2.7. All Packaging Materials Are Recycled..........................................................................................................515.2.8. Lead-Free Solder ...........................................................................................................................................51
6. VALIDATION..............................................................................................................................................................53
LCA Study (Version 1.2), EU Ecolabels for Personal Computers, March 1998Atlantic Consulting and IPU
2
6.1. Sensitivities ...........................................................................................................................................................536.2. Expert Review.......................................................................................................................................................57
7. IMPLICATIONS for CRITERIA..................................................................................................................................587.1. Reduce Monitor Energy Consumption ..................................................................................................................587.2. Extend Lifetime .....................................................................................................................................................587.3. Reduce Control-Unit Energy Consumption ...........................................................................................................587.4. Ensure Takeback and Recycling............................................................................................................................597.5. Eliminate Brominated Flame Retardants...............................................................................................................597.6. Use Recyclate in Plastic Parts................................................................................................................................597.7. Recycle All Packaging...........................................................................................................................................59
8. APPENDIX A: LCI Input/Output Tables .....................................................................................................................608.1. The Personal Computer .........................................................................................................................................608.2. Control unit ...........................................................................................................................................................658.3. Keyboard ...............................................................................................................................................................718.4. Monitor..................................................................................................................................................................76
9. APPENDIX B: Consultation for this Project ................................................................................................................8210. APPENDIX C: Composition of Materials ..................................................................................................................8311. REFERENCES AND NOTES ....................................................................................................................................85
List of TablesTable 1-A: Key Deliverables Of The PC Ecolabel Project .................................................................................................4Table 1-B: Key Components/Results, LCA ........................................................................................................................4Table 1-C: Improvements to the Environmental Profile of PCs..........................................................................................5Table 2-A: Specific Guidance For This LCA......................................................................................................................6Table 2-B: General Guidance For This LCA ......................................................................................................................7Table 2-C: Main Input/Output References For LCA...........................................................................................................7Table 2-D: System Boundary For The Monitor ................................................................................................................10Table 2-E: System Boundary For The Control Unit..........................................................................................................14Table 2-F: System Boundary For PWB With Components For The Control Unit *.........................................................15Table 2-G: System Boundary For The Keyboard.............................................................................................................17Table 2-H: Distribution, Use And Disposal Of Personal Computer.................................................................................18Table 2-I: Classification Of Emissions To Air..................................................................................................................21Table 2-J: Classification of emissions to water .................................................................................................................23Table 2-K: Classification of waste. ...................................................................................................................................24Table 2-L: Environmental Impact Categories* .................................................................................................................25Table 3-A: Generic pc and pc Definitions........................................................................................................................28Table 3-B: Parts and materials in the control unit. ............................................................................................................29Table 3-C: Parts and materials in the monitor...................................................................................................................30Table 3-D: Parts and material in keyboard........................................................................................................................32Table 3-E: Shortened LCI, resource consumption, total PC system.................................................................................34Table 3-F: Shortened LCI, Air Emissions, Total PC System. ...........................................................................................34Table 3-G: Shortened LCI, water emissions, Total PC system. .......................................................................................35Table 3-H: Shortened LCI, waste, Total PC system..........................................................................................................36Table 4-A: Characterised env. impact potential, PC and packaging .................................................................................38Table 4-B: Characterised waste categories, PC and packaging........................................................................................38Table 4-C: Characterised primary energy consumption, PC and packaging ....................................................................38Table 4-D: Normalised env. impact potentials, PC and packaging ..................................................................................39Table 4-E: Normalised waste, PC and packaging ............................................................................................................39Table 4-F: Normalised resources consumption for the PC and packaginga.......................................................................39Table 4-G: Characterised env. impact potentials, control unit w/o packaging ..................................................................40Table 4-H: Characterised waste , control unit w/o packaging...........................................................................................40Table 4-I: Characterised primary energy consumption, control unit w/o packaging.........................................................40Table 4-J: Normalised env. impact potentials, control unit w/o packaging......................................................................40Table 4-K: Normalised waste, control unit w/o packaging ..............................................................................................40Table 4-L: Normalised resources consumption, control unit w/o packaginga ...................................................................40Table 4-M: Characterised env. impact potentials, keyboard w/o packaging .....................................................................41Table 4-N: Characterised waste, keyboard w/o packaging...............................................................................................41Table 4-O: Characterised primary energy consumption, keyboard w/o packaging ...........................................................41Table 4-P: Normalised env. impact potentials, keyboard w/o packaging..........................................................................41

LCA Study (Version 1.2), EU Ecolabels for Personal Computers, March 1998Atlantic Consulting and IPU
3
Table 4-Q: Normalised waste , keyboard w/o packaging.................................................................................................42Table 4-R: Normalised resources consumption, keyboard w/o packaginga.......................................................................42Table 4-S: Characterised env. impact potentials, monitor w/o packaging.........................................................................42Table 4-T: Characterised waste, monitor w/o packaging .................................................................................................42Table 4-U: Characterised primary energy consumption, monitor w/o packaging .............................................................43Table 4-V: Normalised env. impact potentials, monitor w/o packaging ...........................................................................43Table 4-W: Normalised waste, monitor w/o packaging ....................................................................................................43Table 4-X: Normalised resources consumption, monitor w/o packaginga.........................................................................43Table 4-Y: Contributions to Env. Impact, PC by Element ................................................................................................44Table 4-Z: Contributions to Waste, PC by Element..........................................................................................................44Table 4-AA: Energy consumption, PC by Element...........................................................................................................44Table 4-BB: Resource Consumption, PC by Element.......................................................................................................44Table 5-A: Design options Compared to base casea..........................................................................................................49Table 6-A: Main Contributors to Environmental Impact and Resource Consumptions ....................................................54Table 8-A: resource consumption, personal computer ......................................................................................................60Table 8-B: Air Emissions, Personal Computer .................................................................................................................61Table 8-C: water emissions, Personal Computer...............................................................................................................63Table 8-D: waste, personal computer................................................................................................................................64Table 8-E: Resource Consumption, Control Unit w/o Packaging .....................................................................................65Table 8-F: Air Emissions, Control Unit w/o Packaging....................................................................................................66Table 8-G: Water Emissions, Control Unit w/o Packaging...............................................................................................68Table 8-H: Waste, Control Unit w/o Packaging................................................................................................................70Table 8-I: Resource Consumption, Keyboard w/o Packaging...........................................................................................71Table 8-J: Air Emissions, Keyboard w/o Packaging .........................................................................................................72Table 8-K: Water Emissions, Keyboard w/o Packaging ...................................................................................................74Table 8-L: Waste, Keyboard w/o Ppackaging...................................................................................................................75Table 8-M: Resource Consumption, Monitor w/o Packaging ...........................................................................................76Table 8-N: Air Emissions, Monitor w/o Packaging ..........................................................................................................77Table 8-O: Water Emissions, Monitor w/o Packaging......................................................................................................79Table 8-P: Waste, Monitor w/o Packaging .......................................................................................................................80Table 9-A: Industry Interests That Have Been Consulted.................................................................................................82Table 10-A: electrolytic capacitors, choking coils and transformers [27].........................................................................83Table 10-B: CRT glass, funnel and panel [32]..................................................................................................................83Table 10-C: Printed Wiring Board (FR4) [28]..................................................................................................................84Table 10-D: Printed Wiring Board (FR4) with Components ............................................................................................84

LCA Study (Version 1.2), EU Ecolabels for Personal Computers, March 1998Atlantic Consulting and IPU
4
1. SUMMARYAtlantic Consulting and IPU were engaged in mid-December, 1996, by the Ecolabel Unit of theEuropean Commission, DG XI.E.4, to study the product group personal computers (PCs), with aview to possible establishment of an ecolabel for the group. The study consists of three main tasks,shown with their objectives and target delivery dates in Table 1-A. A feasibility report1 and amarket study2 have been presented already. This document is a draft report of the LCA study.
TABLE 1-A: KEY DELIVERABLES OF THE PC ECOLABEL PROJECT
Task Objective - Key Questions Target Delivery DateFeasibilityAssessment
On what basis should the project proceed? May 1997
Market Study Product group, functional unit, fitness for use,definition of LC system, disposal assumptions
July-August 1997
LCA Key eco-impacts Dec 97-Jan 98Criteria What should be the criteria by which products
qualify for an EU Ecolabel?Feb 98
1.1. Structure of this LCA Report, NomenclatureThis document reports on an LCA study of PCs, according to the terms of reference described inTechnical Annex XI.E.4/96/0056 of the Commission's call for tenders and on pp 12-14 ofAtlantic/IPU's tender for the project, which was distributed to the PC ad hoc working group on 21January, 1997. This report's provisional structure was presented to the Commission in a series ofprogress reports.
This summary, Chapter 1, describes the key results from this phase of the study, according to itscomponents3 (Table 1-B):
TABLE 1-B: KEY COMPONENTS/RESULTS, LCA
Component ResultInventory Analysis Definition of generic PC and LCIImpact Assessment Dominant stage in life-cycle is useImprovement Assessment Energy reduction and life-extension are significant improvementsValidation Sensitivities validate a robust analysisImplications for Criteria Energy reduction and life-extension, possible takeback and hazard reduction
Subsequent chapters of this report present the methodology and the analysis behind the results:• Chapter 2 outlines the goal, scope and methodology used in the study.• Chapter 3 describes the system and its life-cycle inventory (LCI).• Chapter 4 categorises and characterises the LCI as potential environmental impacts.• Chapter 5 examines ways that the potential impacts, or burdens, can be reduced• Chapter 6 examines the robustness of the analysis presented in the preceding chapters• Chapter 7 discusses the implications of the above for ecological ecolabel criteria

LCA Study (Version 1.2), EU Ecolabels for Personal Computers, March 1998Atlantic Consulting and IPU
5
Some of the detail of the study is presented in Appendices. Appendix A presents detailedinput/output data from the LCI. Appendix B summarises the consultation undertaken for the study.Appendix C presents assumptions regarding materials composition.
The following sections 1.2 to 1.6 summarise the study. For further background and updates on thisproject and related projects, readers are referred to the Electronic Ecolabel Forum, found on theWWW at http://www.ecosite.co.uk/eef/
1.2. Inventory AnalysisA generic PC and its life cycle stages have been defined (sections 3.1 and 3.2) and a detailed lifecycle inventory is presented in Appendix A.
1.3. Impact AssessmentAs the detail in Chapter 4 shows, the major effect of the PC is in its use. This stage dominatesemissions, energy consumption and even waste generation. The only effect for which the use stageis overshadowed is resource consumption, which is dominated by the materials production stage.
1.4. Improvement AssessmentAs is shown in Chapter 5, a number of possible improvements have been modelled and their lifecycle profiles compared to the base case. The possible improvements turn out to be of two types(Table 1-C):
TABLE 1-C: IMPROVEMENTS TO THE ENVIRONMENTAL PROFILE OF PCS4
SignificantReduce monitor energy consumptionExtend lifetimeReduce control-unit energy consumptionEnsure takeback and recyclingEliminate brominated flame retardants
Less SignificantUse recyclate in plastic partsRecycle all packagingUse lead-free solder
A key improvement is energy consumption in use; reductions here will have a significant effect onthe overall environmental impact of the PC life cycle. Extension of the PC’s lifetime and recyclingof its metal and plastic components through efficient takeback arrangements will cut resourceconsumption of the life cycle, another significant improvement. Avoiding brominated flameretardants will avoid potential problems of exposure in the use and disposal phases of the life cycle.
1.5. ValidationSensitivity analyses of the findings suggest that the data deficiencies of the inventory do notinfluence the conclusions of the improvement analysis. The work was done - and the report ispresented - in a transparent manner. A number of comments were received by the project team;some have been made available to the AHWG. The project team has tried to make use of andrespond to all comments.

LCA Study (Version 1.2), EU Ecolabels for Personal Computers, March 1998Atlantic Consulting and IPU
6
1.6. Implications for CriteriaAs implications go, Table 1-C speaks for itself rather clearly. Indeed, a previous version of thistable was modified after extensive discussion in an Ad Hoc Working Group (AHWG) meeting of 13February, 1998. It is believed that the table, as currently presented, represents the findings of theAHWG.
2. GOAL, SCOPE and METHODOLOGYLCA is an accounting technique adapted to the environment. It first sums up the pollutants emittedand resources consumed in delivering, using and disposing of a product or service. This is knownas the life cycle inventory, or LCI. It then estimates the potential impact of those pollutants andresources on the natural and human environment. This is known as the impact assessment. TheLCI and impact assessment are the core elements of most LCAs.
The goal, scope and methodology of this life cycle assessment (LCA) are presented in this chapter.In the next chapter, Chapter 3, a life-cycle inventory (LCI) is presented and discussed. Insubsequent chapters, this LCI is assessed and validated, and its implications for ecolabel criteria areconsidered.
The rigour of this study is meant to be appropriate to the two questions being addressed, i.e.: Whatare the key eco-impacts of PCs? and What ecolabel criteria will minimise these in qualifyingproducts? The rigour with which any subordinate question shall be addressed will depend on: (1)its significance to the main question; (2) the degree to which plausible answers to the questiondiffer; and (3) the availability of data.
This study has been conducted according to a number of official guidelines - these are described insection 2.1 below. In the subsequent three sections, 2.2-2.4, the goal, scope and methodology of thestudy are described.
2.1. Guidance for this StudyThe LCA has been guided by three types of sources. The first are those very specific to this projectand to the use of LCA in EU ecolabelling (Table 2-A).
TABLE 2-A: SPECIFIC GUIDANCE FOR THIS LCA
Document Author DateStudy of the Product Group Personal Computers in theEU Ecolabel Scheme (Tender for the Project) 5
Atlantic/IPU July 1996
Technical Annex. Annex to the Call for Tenders forthis PC Ecolabel project
EU mid 1996
Procedural guidelines for the establishment of productgroups and ecological criteria6
EU June 1994
Guidelines for the Application of Life-CycleAssessment in the EU Ecolabelling Programme [3]
Groupe desSages
Sept 1994
Research Needs in Life-Cycle Assessment for the EUEcolabelling Programme
Groupe desSages
July 1995
Practical Guidelines for Life Cycle assessment for theEU ecolabelling programme [24]
Groupe desSages
Nov 1996
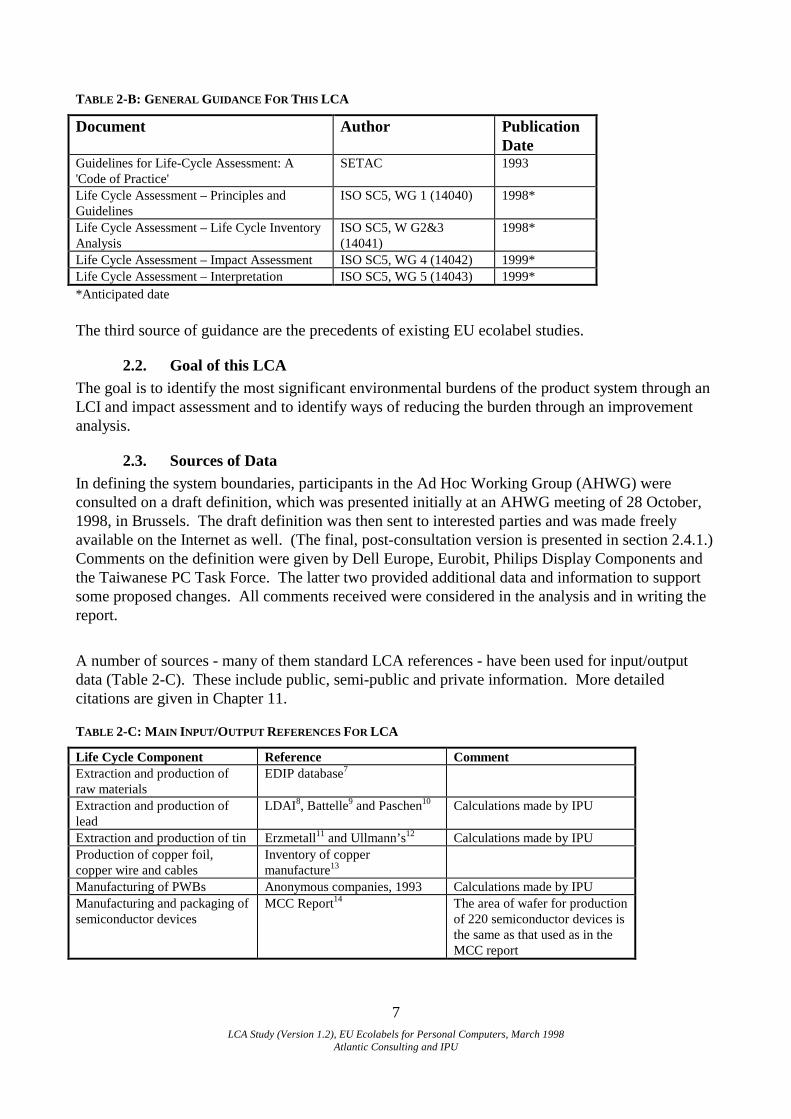
The second source is more general guidance, found in SETAC and ISO documents mentioned in theTechnical Annex (Table 2-B).
LCA Study (Version 1.2), EU Ecolabels for Personal Computers, March 1998Atlantic Consulting and IPU
7
TABLE 2-B: GENERAL GUIDANCE FOR THIS LCA
Document Author PublicationDate
Guidelines for Life-Cycle Assessment: A'Code of Practice'
SETAC 1993
Life Cycle Assessment – Principles andGuidelines
ISO SC5, WG 1 (14040) 1998*
Life Cycle Assessment – Life Cycle InventoryAnalysis
ISO SC5, W G2&3(14041)
1998*
Life Cycle Assessment – Impact Assessment ISO SC5, WG 4 (14042) 1999*Life Cycle Assessment – Interpretation ISO SC5, WG 5 (14043) 1999**Anticipated date
The third source of guidance are the precedents of existing EU ecolabel studies.
2.2. Goal of this LCAThe goal is to identify the most significant environmental burdens of the product system through anLCI and impact assessment and to identify ways of reducing the burden through an improvementanalysis.
2.3. Sources of DataIn defining the system boundaries, participants in the Ad Hoc Working Group (AHWG) wereconsulted on a draft definition, which was presented initially at an AHWG meeting of 28 October,1998, in Brussels. The draft definition was then sent to interested parties and was made freelyavailable on the Internet as well. (The final, post-consultation version is presented in section 2.4.1.)Comments on the definition were given by Dell Europe, Eurobit, Philips Display Components andthe Taiwanese PC Task Force. The latter two provided additional data and information to supportsome proposed changes. All comments received were considered in the analysis and in writing thereport.
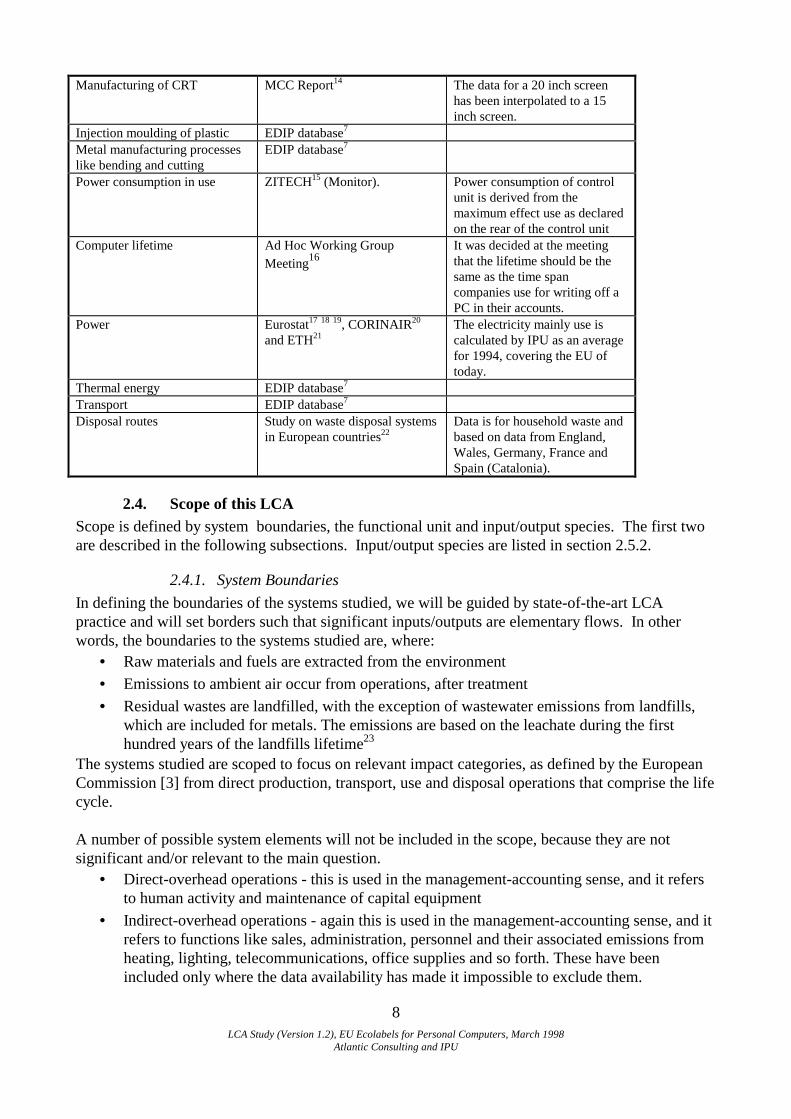
A number of sources - many of them standard LCA references - have been used for input/outputdata (Table 2-C). These include public, semi-public and private information. More detailedcitations are given in Chapter 11.
TABLE 2-C: MAIN INPUT/OUTPUT REFERENCES FOR LCA
Life Cycle Component Reference CommentExtraction and production ofraw materials
EDIP database7
Extraction and production oflead
LDAI8, Battelle9 and Paschen10 Calculations made by IPU
Extraction and production of tin Erzmetall11 and Ullmann’s12 Calculations made by IPUProduction of copper foil,copper wire and cables
Inventory of coppermanufacture13
Manufacturing of PWBs Anonymous companies, 1993 Calculations made by IPUManufacturing and packaging ofsemiconductor devices
MCC Report14 The area of wafer for productionof 220 semiconductor devices isthe same as that used as in theMCC report
LCA Study (Version 1.2), EU Ecolabels for Personal Computers, March 1998Atlantic Consulting and IPU
8
Manufacturing of CRT MCC Report14 The data for a 20 inch screenhas been interpolated to a 15inch screen.
Injection moulding of plastic EDIP database7
Metal manufacturing processeslike bending and cutting
EDIP database7
Power consumption in use ZITECH15 (Monitor). Power consumption of controlunit is derived from themaximum effect use as declaredon the rear of the control unit
Computer lifetime Ad Hoc Working GroupMeeting16
It was decided at the meetingthat the lifetime should be thesame as the time spancompanies use for writing off aPC in their accounts.
Power Eurostat17 18 19, CORINAIR20
and ETH21The electricity mainly use iscalculated by IPU as an averagefor 1994, covering the EU oftoday.
Thermal energy EDIP database7
Transport EDIP database7
Disposal routes Study on waste disposal systemsin European countries22
Data is for household waste andbased on data from England,Wales, Germany, France andSpain (Catalonia).
2.4. Scope of this LCAScope is defined by system boundaries, the functional unit and input/output species. The first twoare described in the following subsections. Input/output species are listed in section 2.5.2.
2.4.1. System BoundariesIn defining the boundaries of the systems studied, we will be guided by state-of-the-art LCApractice and will set borders such that significant inputs/outputs are elementary flows. In otherwords, the boundaries to the systems studied are, where:
• Raw materials and fuels are extracted from the environment• Emissions to ambient air occur from operations, after treatment• Residual wastes are landfilled, with the exception of wastewater emissions from landfills,
which are included for metals. The emissions are based on the leachate during the firsthundred years of the landfills lifetime23
The systems studied are scoped to focus on relevant impact categories, as defined by the EuropeanCommission [3] from direct production, transport, use and disposal operations that comprise the lifecycle. A number of possible system elements will not be included in the scope, because they are notsignificant and/or relevant to the main question.
• Direct-overhead operations - this is used in the management-accounting sense, and it refersto human activity and maintenance of capital equipment
• Indirect-overhead operations - again this is used in the management-accounting sense, and itrefers to functions like sales, administration, personnel and their associated emissions fromheating, lighting, telecommunications, office supplies and so forth. These have beenincluded only where the data availability has made it impossible to exclude them.
LCA Study (Version 1.2), EU Ecolabels for Personal Computers, March 1998Atlantic Consulting and IPU
9
• Provision of capital goods and financial resources
Many inventories apply so-called 'cut-off' rules, whereby those individual inputs that constitute verysmall percentages of total inputs to the system are ignored. Usually this percentage is defined bymass, and the typical cut-off limit is 5%, i.e. streams representing less than 5% of the system's inputmass are excluded. The Groupe des Sages warns against using cut-off rules [3, p 9]indiscriminately.
In this study, no cut-off rules have been applied intentionally, i.e. an attempt has been made torepresent the entirety of the system. For some inputs where emissions/energy data are unavailable, aproxy has been used, usually the closest analogous process for which data are available. In thesecases, qualitative consideration has been given to potential burdens created by production of theinput.
Tables 2-C to 2-F present the system boundaries for the life cycle stages: extraction of rawmaterials, production at suppliers and manufacturing. The boundaries for the monitor, control unitand keyboard are shown separately. In each of the tables the first column shows the relevant partand the next four columns the materials that enter into that part. If the column Back to earthcontains a '+' symbol, the life cycle inventory includes all processes back to the extraction of the rawmaterials for that material. The remaining columns present the system boundaries for thoseproduction processes that the materials undergo and the ancillary materials used in these. If thecolumn Included in model contains a '+' symbol, the process or the production of ancillary materialis included in the inventory. The system boundaries for the life cycle stages: distribution, use anddisposal are shown in Table 2-G for the personal computer as a whole.

LCA Study (Version 1.2), EU Ecolabels for Personal Computers, March 1998Atlantic Consulting and IPU
10
TABLE 2-D: SYSTEM BOUNDARY FOR THE MONITOR
Part Material Unit Amount Backtoearth
Production process unit Amount Included inmodel
Ancillary material unit Amount Included inmodel
Monitor Assembly -Cabinet
ABSocta-/deca-PBDE
gg
2000500
+-
Injection moulding ABS kg 2.5 +
CablesCopperPVCPS
ggg
20231424
+++
Wire productionCopper wire drawing
kgkg
0.2890.202
++
Foot/-socketABS g 500 +
Injection moulding ABS kg 0.50 +
CRT Applying shrinking bandTestingElectrically heating of cathodeEvacuating the tubeJoining electronic gun and bulbBulb joining by curing frit
+c
+c
+c
+c
+c
+c

LCA Study (Version 1.2), EU Ecolabels for Personal Computers, March 1998Atlantic Consulting and IPU
11
Part Material Unit Amount Backtoearth
Production process unit Amount Included inmodel
Ancillary material unit Amount Included inmodel
Panel and funnelglass + frit glass
Zinc sulphateY2O2S
Calcium carbonateSandSodium carbonateKaolinMagnesium oxideLead oxideZinc sulphateFerriteTitanium dioxideSrOK2OBaOZrO2Sb2O3
gg
gggggggggggggg
21
15835307374054574336.62193774883424625
+-
++-+-++++f
-----
Applying frit glass on funnelConductive coating of funnel inner sideEvaporating aluminium layer on panelinner sideLacquering panel inner sideApplying luminescent phosphor
Contrast enhancing coating of panelCreating dot pattern on panel inner side
Grinding and polishingPressing of panel and funnelGlass production kg 6.13
---
--
--
--+c
AquadagAluminium
LacquerPolyvinyl alcohol slurry
Grille dagPolyvinyl alcoholphotoresistWater
--
--
--
-
Shadow mask
Stainless steela g 41 +
Shaping in pressEtching
Patterning and developingCoating with resist
--
--
Ferric chloride etchingsolution
Casein type resist
-
-Frame
Steel g 425 +
Oven blackenedWelding together with Shadow maskStampingCutting
----
Inner shield Steel g 87 + Stretch forming -Mount Stainless steela g 37 +Deflection Yoke
CopperFe2O3PWBg
ggg
308309199
+++
AssemblyCopper wire drawing kg 0.308
-+

LCA Study (Version 1.2), EU Ecolabels for Personal Computers, March 1998Atlantic Consulting and IPU
12
Part Material Unit Amount Backtoearth
Production process unit Amount Included inmodel
Ancillary material unit Amount Included inmodel
Shrinking bandStainless steel g 0.268 +
Electronic gun
SteelBorosilicate glassNickel tubes
Tungsten wire
---
-
AssemblyHydrogen firing of metals
Coating
Coating
--
-
-
Barium carbonateStrontium carbonateCalcium carbonateAluminium oxide
-
---
PWB withcomponentsh
Wave soldering
Assembly
m2 0.0312 +
-
LeadTinFluxN2
gggg
3.285.580.251.56
++b
--
PWB
E-glassEpoxyTBBPACopper
gggg
63.243.928.615.8
+--+
PWB production
PWB laminate production
Glass fabricGlass fibre
Copper foil
m2
m2
kgkg
kg
0.0355
0.0366
0.06320.0632
0.012
+
+
-+b
+
CopperLead/tin solderTinEpoxy paintDowanolH2O2H2SO4HNO3AcetoneWater
H2SO4Cooling agent/lubricantLubricating oilNaOH
gggggggggkg
gggg
9.044.930.3277.560.45735.136.93.444.322.2
0.0220.0210.0140.024
++d
+b
------+
--++

LCA Study (Version 1.2), EU Ecolabels for Personal Computers, March 1998Atlantic Consulting and IPU
13
Part Material Unit Amount Backtoearth
Production process unit Amount Included inmodel
Ancillary material unit Amount Included inmodel
Components
CopperIronLeadNickelZincAluminiumSilverGoldCadmiumChromiumBePdEpoxy withTBBPASilicon oxide,glass and ceramics
ggggggggggggg
g
81.927.06.26.62.416.80.380.30.0020.20.050.07106
235
++++++---+---
+
Packaging and productioni ofsemiconductorsWafer productionPassive components production
number
15 +c
--
Deionized waterWater
kgkg
578147
+e
+
Electrolyticcapacitors Aluminium
CopperPhenolic resinpaperPS
ggg
g
481212
48
++-
+
Assembly -
Choking coil andtransformers PVC
CopperFerrite
ggg
4848144
+++
Assembly
Copper wire drawing kg 0.048
-
+
Packaging CardboardPS
gg
1520250
++
Notes:aNickel rich steel assumed to be similar to stainless steel, bOnly energy consumption included, cOnly energy and water consumption, waste water and waste amounts included.dOnly consumption of lead and tin and the extraction of these, eEnergy consumption is for pumping water, fOnly resource consumptiongMaterials and processes included in PWB with components two rows below.hIncluding the PWB with components from the part: Deflection Yoke.iWafer processing can consist of over 400 process steps. Patterns are generated using photosensitive lithography processes for isolation, gate definition, contacts (oxide-removal), creation ofinterconnections and overcoating (bonding pads).

LCA Study (Version 1.2), EU Ecolabels for Personal Computers, March 1998Atlantic Consulting and IPU
14
TABLE 2-E: SYSTEM BOUNDARY FOR THE CONTROL UNIT
Part Material Unit Amount Back toearth
Production process unit Amount Included inmodel
Ancillary material unit Amount Includedin model
Control unit Assembly -Motherboard +Graphite cardPWB withcomponentsa
g 740 +
Cooling body Aluminium g 10 +Hard disk Assembly -Cover Aluminium g 60 +Casing Aluminium g 205 + Casting -Hard disk plate
Aluminiumb g 85 +
Surface treatmentSputtering of protective layerSputtering of magnetic recording layerSputtering of chromiumPolishing and lappingChemically platingDiamond turningAnnealing at 300°C
--------
Perfluorinated oil
Cobalt-based alloyChromium
Ni-P
-
--
-
PWB withcomponentsa
g 60 +
Floppy drive Assembly -Mechanical part Steel
PSgg
86.5130
++
Galvanising m2 0.022 +g Zinc g 23.5 +
Cover Aluminium g 70 +PWB withcomponentsa
g 30 +
Power supply Assembling -Cabinet Steel g 397 + Galvanising m2 0.101 +g Zinc g 108 +Ventilator +socket
PS g 100 +
PWB withcomponentsa
g 100 +
Electrolyticcapacitors Aluminium
CopperPhenolic resinpaperPS
ggg
g
1855
18
++-
+
Assembling -
Choking coil andtransformers PVC
CopperFerrite
ggg
222266
+++
Assembling
Copper wire drawing kg 0.022
-
+

LCA Study (Version 1.2), EU Ecolabels for Personal Computers, March 1998Atlantic Consulting and IPU
15
Part Material Unit Amount Back toearth
Production process unit Amount Included inmodel
Ancillary material unit Amount Includedin model
Cooling body Aluminium g 30 +Cable and plug Copper
PVCPS
g
gg
71
11821
+
++
Wire productionCopper wire drawing
kgkg
0.1010.071
++
Cabinet Assembly -Metal frame +hard disk socket +cover
Steel g 5050 +
Coating
CuttingBendingStretch formingElectroplating
m2
mmmm2
0.4095
23.48.28
0.729
+
+c
+c
-+
Epoxy powderPhosphating agentsDegreasing agentsWater
HClNaCNZincWaterCleaning agentCrO3HNO3NaOHDegreasing agentsDry-acid-solution
gggkg
gggkggggggg
665.22.51.7
0.011522.640.118.80.00250.05250.20418.279.513.9
-+++
--++---+--
Front ABSd g 210 + Injection moulding ABS kg 0.21 -Cables
CopperPVCPSPEe
gggg
2042162020
++++
Wire productionCopper wire drawing
kgkg
0.2910.204
++
Packaging CardboardPP
gg
2190160
++ Laminating with air bubbles -
Notes:aSee table 2-E, b96% aluminium and 4% magnesium, cOnly energy consumption included. dShould have been PPO, but no information of production of PPO, eShould have been POF, but noinformation of production of POF. fOnly resource consumption, gOnly energy and zinc consumption.
TABLE 2-F: SYSTEM BOUNDARY FOR PWB WITH COMPONENTS FOR THE CONTROL UNIT *Part Material unit Amount Back to
earthProduction process unit Amount Include
d inmodel
Ancillary material unit Amount Includedin model

LCA Study (Version 1.2), EU Ecolabels for Personal Computers, March 1998Atlantic Consulting and IPU
16
Part Material unit Amount Back toearth
Production process unit Amount Included inmodel
Ancillary material unit Amount Includedin model
PWB withcomponents
Wave soldering
Assembly
m2 0.1164 +
-
LeadTinFluxN2
gggg
12.220.80.935.82
++a
--
PWB
E-glassEpoxyTBBPACopper
gggg
23616310758.6
+--+
PWB production
PWB laminate production
Glass fabricGlass fibre
Copper foil
m2
m2
kgkg
kg
0.1322
0.1365
0.2360.236
0.045
+
+
-+a
+
CopperLead/tin solderTinEpoxy paintDowanolH2O2H2SO4HNO3AcetoneWater
H2SO4Cooling agent/lubricantLubricating oilNaOH
gggggggggkg
gggg
33.718.41.2228.21.7013113712.816.18.2
0.0220.0210.0140.024
++b
+a
------+
--++
Components
CopperIronLeadNickelZincAluminiumSilverGoldCadmiumChromiumBePdEpoxy withTBBPASilicon oxide,glass and ceramics
ggggggggggggg
g
118429.5103.7260.590.50.0040.30.080.170
255
++++++---+---
+
Packaging and productionc ofsemiconductorWafer productionPassive components production
number
45 +d
--
Deionized waterWater
kgkg
1734441
+e
+
Notes: *(as a total: 1 m2 weighs 7.99 kg with components)

LCA Study (Version 1.2), EU Ecolabels for Personal Computers, March 1998Atlantic Consulting and IPU
17
aOnly energy consumption included, bOnly consumption of lead and tin and the extraction of these.cWafer processing can consist of over 400 process steps. The processes are patterned using photosensitive lithography process. There are masks for isolation, polysilicon (gate definition), oxide-removal (contacts), metal (interconnections) and overcoat (bonding pads), dOnly energy and water consumption, waste water and waste amounts included.eEnergy consumption assumed to be the same as for pumping water.
TABLE 2-G: SYSTEM BOUNDARY FOR THE KEYBOARD
Part Material unit Amount Back toearth
Production process unit Amount Included inmodel
Ancillary material unit Amount Includedin model
Keyboard Assembly -Cover ABS g 150 + Injection moulding ABS kg 0.150 +Base ABS g 230 + Injection moulding ABS kg 0.230 +Base shielding Steel g + Electroplating m2 0.0698 + HCl
NaCNZincWaterCleaning agentCrO3HNO3NaOHDegreasing agentsDry-acid-solution
gggkggggggg
0.00112.163.841.80.00020.00500.01951.757.611.33
--++---+--
Keys ABS g 390 + Injection moulding ABS kg 0.390 +Key foil No information -Cable and plug PVC
Coppergg
37.132.9
++
Wire productionCopper wire drawing
kgkg
0.0470.0329
++
PWB
E-glassEpoxyTBBPACopper
gggg
17.512.17.94.34
+--+
PWB production
PWB laminate production
Glass fabricGlass fibres
Copper foil
m2
m2
kgkg
kg
0.0098
0.0101
0.01750.0175
0.0033
+
+
-+b
+
CopperLead/tin solderTinEpoxy paintDowanolH2O2H2SO4HNO3AcetoneWater
H2SO4Cooling agent/lubricantLubricating oilNaOH
gggggggggkg
gggg
2.571.360.092.090.139.7110.20.841.190.61
0.0020.0020.0010.002
++b
+a
------+
--++

LCA Study (Version 1.2), EU Ecolabels for Personal Computers, March 1998Atlantic Consulting and IPU
18
Part Material unit Amount Back toearth
Production process unit Amount Included inmodel
Ancillary material unit Amount Includedin model
Components CopperEpoxy withTBBPASilicon oxide,Glass andceramics
gg
g
8.095.22
18.9
+-
+
Packaging Cardboard g 300 +Note:aOnly energy consumption included, bOnly consumption of lead and tin and the extraction of these.
TABLE 2-H: DISTRIBUTION, USE AND DISPOSAL OF PERSONAL COMPUTER.Part Geographic area Material/suba
ssemblyPercentages
Process unit Amount Includedin model
Ancillary material unit Amount Included inmodel
Whole PC European Union PC 100 TransportUse
kgkmyears
137043
++
Diesel kg 0.28 +
Whole PC European Union PC 63 Landfilling(flame retardant PBDE)d
kgkg
21.1660.50
+-
Whole PC European Union PC 22 Incineration
(Phenolic resin paper)d
(flame retardant PBDE)d
(PPO)d
(POF)d
(Tin)d
(Silver)d
(Gold)d
(Beryllium)d
(Palladium)d
kg
kgkgkgkgkgkgkgkgkg
20.99
0.0170.500.2100.0200.03110.000980.000870.000140.00019
+
---------
Ca(OH)2Water
kgkg
0.3695.10
++
Whole PC European Union PC 15 Recycling metals(Silver)d
(Gold)d
Landfilling(flame retardant PBDE)d
kgkgkgkgkg
8.9490.000980.0008711.5090.50
+--+-
Steel 15 Recycling iron: melting androlling of steel
kg 7.02b + OxygenCalcium monoxideCoke, metallurgicalArgonOven slag
kgkgkgkgkg
0.250.250.0540.00060.067
+++++
Aluminium 15 Recycling aluminium: meltingand casting
kg 0.501b + Calcium fluoridePotassium chlorideSodium chlorideCalcium hydroxide
kgkgkgkg
0.00110.0170.0380.0022
--++
LCA Study (Version 1.2), EU Ecolabels for Personal Computers, March 1998Atlantic Consulting and IPU
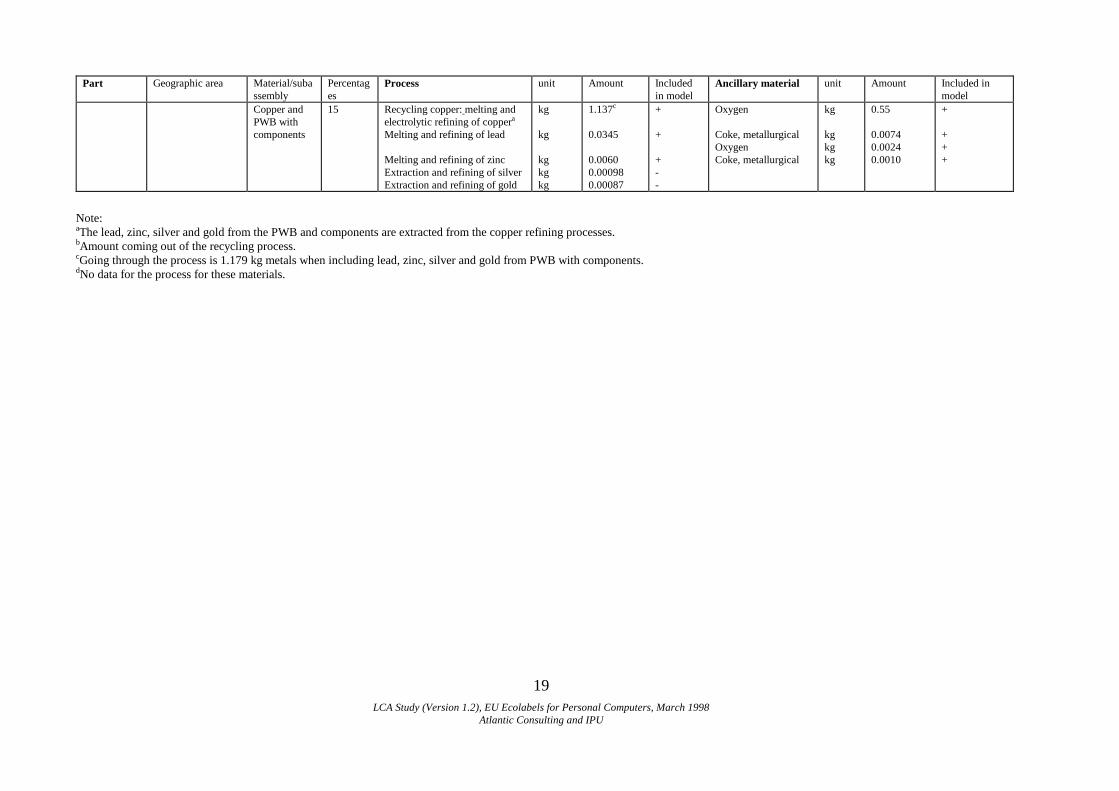
19
Part Geographic area Material/subassembly
Percentages
Process unit Amount Includedin model
Ancillary material unit Amount Included inmodel
Copper andPWB withcomponents
15 Recycling copper: melting andelectrolytic refining of coppera
Melting and refining of lead
Melting and refining of zincExtraction and refining of silverExtraction and refining of gold
kg
kg
kgkgkg
1.137c
0.0345
0.00600.000980.00087
+
+
+--
Oxygen
Coke, metallurgicalOxygenCoke, metallurgical
kg
kgkgkg
0.55
0.00740.00240.0010
+
+++
Note:aThe lead, zinc, silver and gold from the PWB and components are extracted from the copper refining processes.bAmount coming out of the recycling process.cGoing through the process is 1.179 kg metals when including lead, zinc, silver and gold from PWB with components.dNo data for the process for these materials.

LCA Study (Version 1.2), EU Ecolabels for Personal Computers, March 1998Atlantic Consulting and IPU
20
2.4.2. Functional UnitAs has been noted in previous reports [1, 2], the functional unit comprises threeelements: a control unit, a monitor and a keyboard. These can be analysed together orseparately.
2.5. LCA MethodologyThe LCA has been done in accordance with SETAC methodology as currentlyunderstood. The main methodological guidance for LCA is with regard to allocationand impact assessment.
2.5.1. AllocationAllocation in LCA is similar to allocation in economics. In compiling an inventory,debits or credits are distributed between the outputs of a unit process. In economicsthe debits and credits are financial costs, measured in some monetary currency; inLCA the debits and credits are environmental, measured in the currencies of emissionsand resources.
In general, the best solution to allocation is to avoid it in the first place. This can bedone either through subdividing processes with multiple outputs or by expanding thesystem. In cases where allocation cannot be avoided, it has been based on a physicalcausality or a socio-economic causality. Joint processes for which allocation isnecessary are: extraction and production of virgin material, landfilling andincineration of the product/material.
For most unit operations in the system, the generally accepted convention of allocatingresource consumptions and emissions according to the proportional mass of theeconomically useful products has been applied. For instance, if a process's output is40 kg of A, 40 kg of B and 20 kg of waste, A and B each are credited with half of theemissions.
Used or off-spec materials will be treated as economically useful outputs if they arerecovered by commercial organisations for profit. Steel scrap, for example, is tradedwidely in free markets and has a well-established commercial value.
For recycling of materials the recycling process is ascribed to the product which issent for recycling while the other impacts from the life cycle of the recycled materialare allocated between current and future users of the material according to the EDIPmethod [25], also referred to as the IPU/CIT/VIGON method24. This method appliesmaterial grade as allocation criteria. Mathematically speaking, in the systems' closedloops we will consider virgin material to be recycled as many times as is common inpractice, and then the impacts of all the material's lifetimes will be allocated equallyover each functional unit of use. Materials made of plastic or cardboard thus losesome of their quality, when recycled. Fibres in cardboard become shorter each time itis recycled. In general, cardboard can be recycled only six times before the fibres aretoo short and must be discarded. The loss of quality is 'paid' by the product that is sentto recycling.
LCA Study (Version 1.2), EU Ecolabels for Personal Computers, March 1998Atlantic Consulting and IPU
21
If the PC uses 1 kg of virgin cardboard and 0.63 kg is sent to landfill, 0.22 kg forincineration and 0.15 kg for recycling, the PC 'pays' for the production of 1 kg virgincardboard and the recycling of the 0.15 kg cardboard, but is given credit for materialgrade of the cardboard which is recycled. The loss in material grade by recycling ofcardboard is 0.17 [25], and hence the product is given credit for the production of (1-0.17) x 0.15 kg virgin cardboard. Similarly the grade loss for recycling of ABS is 0.20and this factor is assumed valid for all recycled plastics.
Allocation is avoided for metals sent for recycling by expanding the system. Duringrecycling the amount of steel output from the recycling process is smaller than theamount of steel input since some of the metal is lost as waste. This loss is ascribed tothe product sending the metal for recycling.
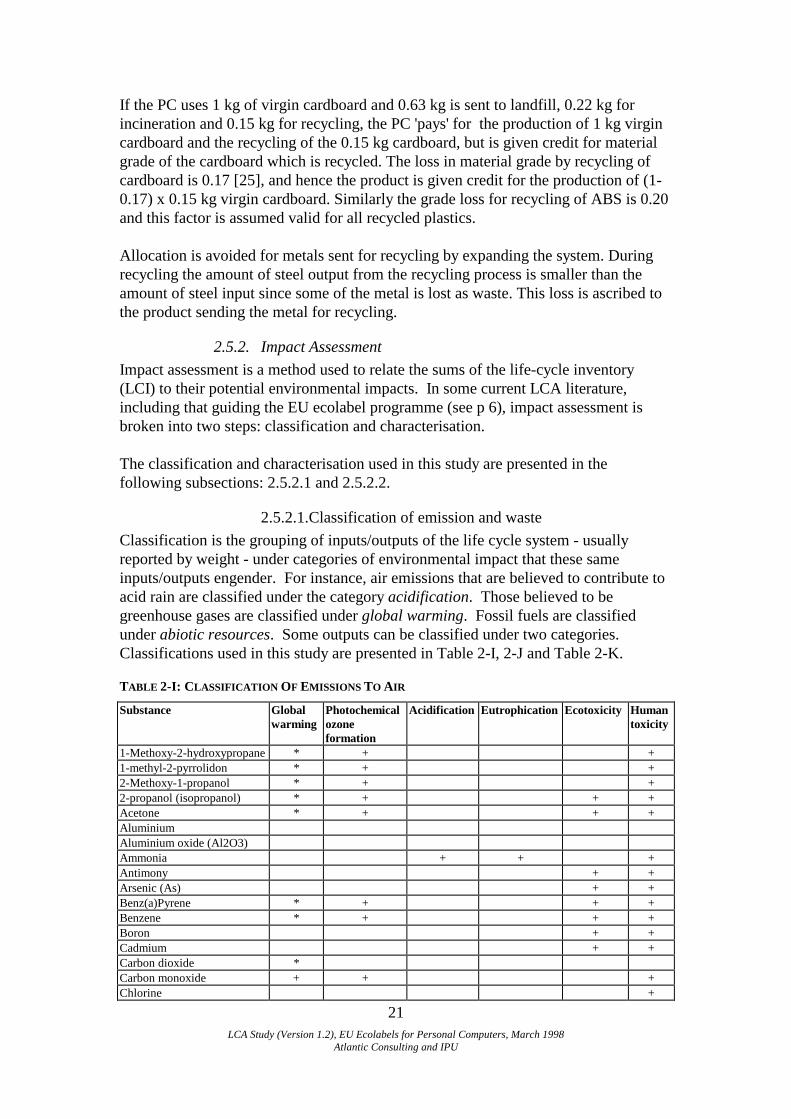
2.5.2. Impact AssessmentImpact assessment is a method used to relate the sums of the life-cycle inventory(LCI) to their potential environmental impacts. In some current LCA literature,including that guiding the EU ecolabel programme (see p 6), impact assessment isbroken into two steps: classification and characterisation.
The classification and characterisation used in this study are presented in thefollowing subsections: 2.5.2.1 and 2.5.2.2.
2.5.2.1. Classification of emission and wasteClassification is the grouping of inputs/outputs of the life cycle system - usuallyreported by weight - under categories of environmental impact that these sameinputs/outputs engender. For instance, air emissions that are believed to contribute toacid rain are classified under the category acidification. Those believed to begreenhouse gases are classified under global warming. Fossil fuels are classifiedunder abiotic resources. Some outputs can be classified under two categories.Classifications used in this study are presented in Table 2-I, 2-J and Table 2-K.
TABLE 2-I: CLASSIFICATION OF EMISSIONS TO AIR
Substance Globalwarming
Photochemicalozoneformation
Acidification Eutrophication Ecotoxicity Humantoxicity
1-Methoxy-2-hydroxypropane * + +1-methyl-2-pyrrolidon * + +2-Methoxy-1-propanol * + +2-propanol (isopropanol) * + + +Acetone * + + +AluminiumAluminium oxide (Al2O3)Ammonia + + +Antimony + +Arsenic (As) + +Benz(a)Pyrene * + + +Benzene * + + +Boron + +Cadmium + +Carbon dioxide *Carbon monoxide + + +Chlorine +

LCA Study (Version 1.2), EU Ecolabels for Personal Computers, March 1998Atlantic Consulting and IPU
22
Chromium + +Chromium (III) + +Cobalt + +Copper + +Cyanide (CN-) + + +Dioxin + +Fluoride (F-) + +Hydrocarbons * + +Hydrogen bromide + +Hydrogen chloride + +Hydrogen fluoride (HF) + +Hydrogen sulphide + +Iron +Lead + +Magnesium +Manganese + +Mercury + +Methane + +Molybdenum + +N,N-Dimethyl formamide * + +Nickel + +NitrogenNitrogen oxides (NOx) + + +Nitrous oxide + + +NMVOC, aircraft engines * + + +NMVOC, base load el * + +NMVOC, diesel engines * + +NMVOC, natural gas heating * + +NMVOC, oil heating * + +NMVOC, painting processes * + +NMVOC, petrol engines * + +NMVOC, power plants + + +Non-methane volatile organiccompounds (NMVOC)
* + +
Polycyclic aromatichydrocarbons (PAH)
* + +
Radioactivity + +Selenium + +Strontium + +Styrene * + +Sulphur dioxide + +Thallium + +Thorium + +Tin + +Toluene * + + +Total P +Unspecified aldehydes * + + +Unspecified chlorinated org.comp.
* + +
Unspecified fluoridesUnspecified heavy metals + +Unspecified iron oxidesUnspecified metalsUnspecified methylstyrene * + +Unspecified n-alkanes * +Unspecified org. compounds * +Unspecified oxidesUnspecified particlesUnspecified saltUnspecified substance

LCA Study (Version 1.2), EU Ecolabels for Personal Computers, March 1998Atlantic Consulting and IPU
23
Uranium + +Vanadium + +VOC, coal heating + + +VOC, diesel engines + + +VOC, natural gas heating + + +VOC, oil heating * + +Volatile organic compounds(VOC)
* + +
Zinc + +* Global warming only for substances of petrochemical origin, + means contribution to that category
TABLE 2-J: CLASSIFICATION OF EMISSIONS TO WATER
Substance Globalwarming
Photochemicalozone formation
Acidification Eutrophication Ecotoxicity Humantoxicity
Aluminium +Ammonia + + +Ammonium-N (NH4+-N) + +Arsenic (As) + +Biological oxygen demand(BOD)Cadmium + +CalciumChemical oxygen demand(COD)Chlorate (ClO3-) +Chloride (Cl-)Chromium + +Chromium(III) + +Copper + +Dissolved organic carbon(DOC)
*
Ethylene diamine tetra-aceticacid (EDTA)
* +
Fluoride (F-)Formaldehyde * (+) +Halogenated organiccompounds (AOX)
* + +
Hydrocarbons * (+)Hydrogen chloride +Hydrogen cyanide + + + +Hydrogen ions (H+) +Hydrogen bromide +Iron +Lead + +Manganese +Mercury + +Nickel + +Nitrate-N (NO3--N) +Phenol * + +Phosphate (PO4---) +Polycyclic aromatichydrocarbons (PAH)
* + +
Radioactivity + +Selenium + +Silicate ionSodium ion (Na+)Strontium + +SulphateSuspended solids (SS)Total N +
LCA Study (Version 1.2), EU Ecolabels for Personal Computers, March 1998Atlantic Consulting and IPU
24
Total organic carbon (TOC) *Total P +Unspecified anionicdetergent
* +
Unspecified chlorinated org.comp.
* +
Unspecified coolingagent/lubricantUnspecified dissolved matterUnspecified iron oxidesUnspecified metalsUnspecified N +Unspecified non-ionicdetergent
+
Unspecified oil *Unspecified org. compounds *Unspecified oxidesUnspecified saltUnspecified substanceWaterZinc +* Global warming only for substances of petrochemical origin, + means contribution to that category
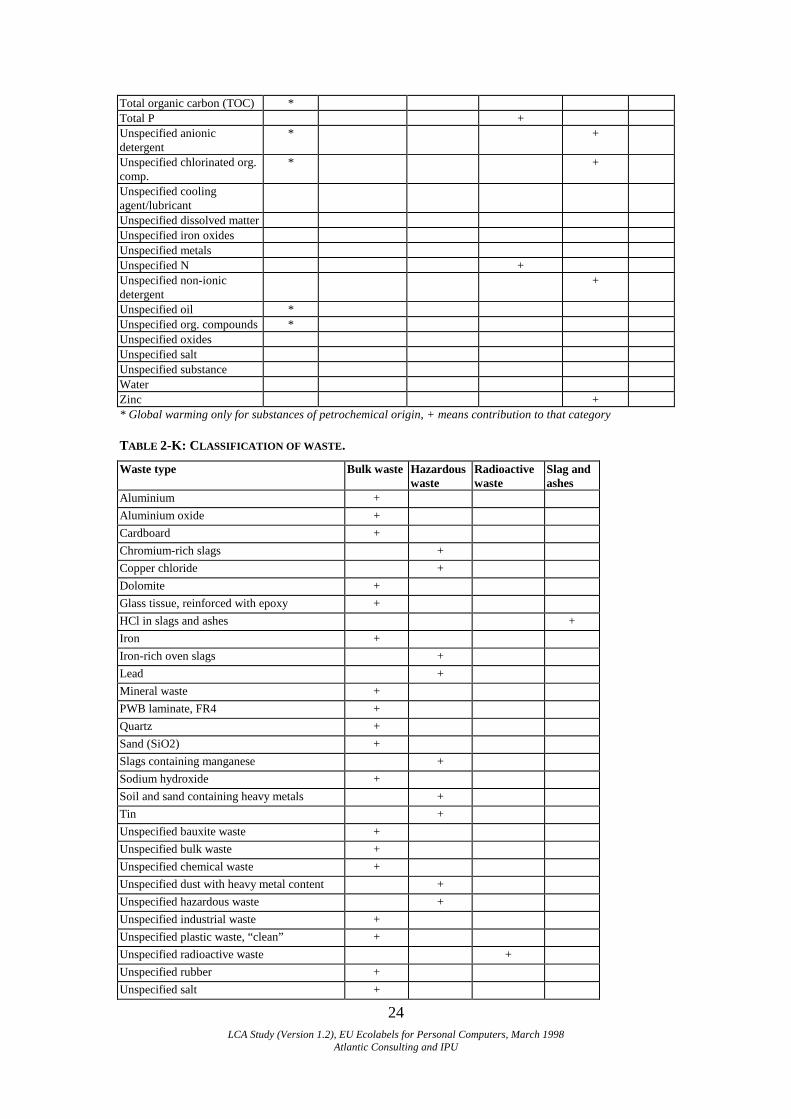
TABLE 2-K: CLASSIFICATION OF WASTE.
Waste type Bulk waste Hazardouswaste
Radioactivewaste
Slag andashes
Aluminium +Aluminium oxide +Cardboard +Chromium-rich slags +Copper chloride +Dolomite +Glass tissue, reinforced with epoxy +HCl in slags and ashes +Iron +Iron-rich oven slags +Lead +Mineral waste +PWB laminate, FR4 +Quartz +Sand (SiO2) +Slags containing manganese +Sodium hydroxide +Soil and sand containing heavy metals +Tin +Unspecified bauxite waste +Unspecified bulk waste +Unspecified chemical waste +Unspecified dust with heavy metal content +Unspecified hazardous waste +Unspecified industrial waste +Unspecified plastic waste, “clean” +Unspecified radioactive waste +Unspecified rubber +Unspecified salt +

LCA Study (Version 1.2), EU Ecolabels for Personal Computers, March 1998Atlantic Consulting and IPU
25
Unspecified slags and ashes +Unspecified slags and ashes from incineration +Unspecified slags and ashes, energy +Unspecified slags from ovenUnspecified sludge +Unspecified sludge with heavy metal content +Unspecified waste +Unspecified waste from steel production +Unspecified waste from steel production +Zinc-rich dust +* Global warming only for substances of petrochemical origin, + means contribution to that category
2.5.2.2. CharacterisationCharacterisation is the aggregation of inputs/outputs in a category into a singleindicator that is meant to reflect the sum environmental burden for that category.Aggregation is done on the basis of common units that are agreed to represent anequivalent burden to the environment; these are known as 'equivalence factors.'Equivalence has been agreed only for a few categories or even sub-categories, such asheating value for most fuels and global warming potentials for most air emissions.
The possible categories to be included are presented in Table 2-L. These includethose prescribed by the Commission [3, 25], adapted for use in this study.
TABLE 2-L: ENVIRONMENTAL IMPACT CATEGORIES*
Classification Category Examples ofSpecies Included
Equivalence Factor forCharacterisation
Comment
Input RelatedAbiotic resources Fossil fuels,
mineralsWeight and heating valuewhen relevant
Fuels are split intorenewable andnon-renewable.
Biotic Resources Incomplete datasetLand Incomplete dataset
Output RelatedGlobal warming CO2 ,CO, CH4 100-year GWP, as
defined by IPCC, withCO2 as the reference
Depletion of stratospheric ozone CFCs, Halons,HCFCs and otherchloro/bromocompounds
ODP as defined by theWMO, with CFC-11 asthe reference
Human toxicity Heavy metals m3 air, water or soil The amount of air,water or soilneeded for dilutionto no effect level
Eco-toxicity Heavy metals m3 air, water or soil The amount of air,water or soilneeded for dilutionto no effect level
Photo-oxidant formation Volatile organiccompounds
POCP as defined byUNECE, with C2H4 as thereference (Weight)

LCA Study (Version 1.2), EU Ecolabels for Personal Computers, March 1998Atlantic Consulting and IPU
26
Acidification SO2 , NOx , HCl Acid content with SO2 asreference (Max.- and min.scenario)
Eutrophication NO3- , NOx , PO4,3- Nitrogen and phosphate
content, with NO3- as
reference (Scenario-based approach)
*Presented in the same order as in Reference 24. In cases where EDIP26 and reference 24 do not usethe same equivalence factor, factors from reference 24 are shown in brackets.
Waste is classified according to different treatment technologies into four categories:bulk waste, hazardous waste, radioactive waste and slag and ashes. Bulk waste is thewaste deposited in landfills for household waste. Hazardous waste is toxic wastewhich is deposited in special landfills or incinerated in special hazardous wasteincineration plants. Radioactive waste only comes from production of power atnuclear power plants. Slag and ashes come from incineration of bulk waste and fromconventional power plants (combustion of mainly coal).
The current state of life cycle inventory analysis and the available data bases is suchthat while consumption of energy and resources is well covered, data are still veryincomplete for the emissions of most environmentally hazardous substances. Due tolack of data for these types of emissions from the large majority of processes of thelife cycle, the impact potentials that have been calculated for the different forms ofhuman toxicity and eco-toxicity represent only an unknown (but probably small)fraction of the total contribution from the life cycle to these impact categories.Because these results may be misleading, they are not presented for these impactcategories in Chapter 4.
Characterisation of the results has been followed by normalisation, where the impactcategories are related to a common scale, i.e. society’s contribution to the differentimpact categories [outlined in Groupe des Sages, Ref 3, p 6]. IPU has developed anormalisation method, known as EDIP, in which the product’s impacts are expressedrelative to the current annual impacts from an average citizen. The unit of thenormalised impact potentials is person equivalent, PE, or more frequently milli-personequivalent, mPE [25]. Tables of normalised results are presented after each set ofcharacterised results in Chapter 4.

LCA Study (Version 1.2), EU Ecolabels for Personal Computers, March 1998Atlantic Consulting and IPU
27
3. LIFE CYCLE INVENTORYAccording to the goal, scope and methodology outlined in the preceding chapter, alife-cycle inventory of a personal computer has been compiled by the project team.This chapter contains a summary of the pollutants emitted and resources consumed indelivering, using and disposing of a personal computer.
To generate the inventory, a generic PC was defined and its life-cycle was described,using a variety of data sources. This definition and description are presented insections 3.1 and 3.2.
As are most LCIs, this one is dense and broad, hence it is difficult, even forexperienced analysts, to draw conclusions from simple inspection of it. Therefore, theLCI is presented as an appendix to the report (Chapter 8, p 60), and the inventoryanalysis centres on classified, characterised inventory, which is discussed in the nextchapter. The improvement assessment, presented in the chapter after that, examineshow the key impacts may be reduced.
3.1. Definition of the Generic PCA generic personal computer which represents the market of today is the product inthe baseline life cycle assessment (LCA). The generic computer consists of:
Motherboard PCI with Intel 430TX chipset, 200 MHz CPU and cooler512 KB Pipeline Burst Cache RAM16 MB EDO RAM, 72-pin, 60 nsPCI Graphics adapter, 4 MB RAMEnhanced IDE HDD/FDD controller 2S/1P port, high speed3,228 MB Enhanced IDE hard disk, 10 ms3 ½” floppy drive, 1.44 MBPower supplyMini tower cabinetCD-ROM drive
15" SVGA colour monitor, low radiation, 1280 x 1024, 0.28 mm dp
Keyboard, 105 keys (Windows 95)
Mouse
This definition is based on various data sources, including Soldera27, Pedersen28,Zachariassen29, discussions with industry experts, literature reviews and previousprojects conducted by IPU. Soldera27 was most fruitful. His study examined aDECLPv+ 4100DX4 with a PCBXBV-PC monitor, a Keyboard with 102 keys and aMouse. The technical data for the generic personal computer and the Soldera’spersonal computer are shown in Table 3-A.

LCA Study (Version 1.2), EU Ecolabels for Personal Computers, March 1998Atlantic Consulting and IPU
28
The personal computer consists of four main parts: monitor; keyboard; mouse; andcontrol unit. The different subparts and their content of materials are shown in thenext tables except for the mouse and the CD-ROM drive of the control unit, where noinformation has been found. The content of some subparts are shown in Appendix C -electrolytic capacitors plus choking coils and transformers, CRT glass and printedwiring boards with components.
The composition of the printed wiring boards with components is assumed to be thesame for all printed wiring boards used in the different parts of the personal computerexcept for electrolytic capacitors, choking coils and transformers, which are accountedfor as separate parts. The composition of the printed wiring boards with components isgiven as total amounts of the different substances, not looking at the singlecomponents. The composition, given as weight % (shown in Appendix C), is based onPedersen28. The epoxy resin used as base material for the circuit board contains aflame retardant: Tetrabromo bisphenol A (TBBPA)30. The FR4 laminate contains 17wt% TBBPA30. The epoxy in the components contains approximately 2%, whichcorrespond to roughly 90 g TBBPA per m2 printed wiring board30.
TABLE 3-A: GENERIC PC AND PC DEFINITIONS
Generic computer DECLPv+ 4100DX4
Motherboard PCI with Intel 430TX chipset, 200 MHzCPU and cooler
Motherboard PCI with Intel SL-enhancedProcessor (CPU) 486 DX4, 100 MHz
512 KB Pipeline Burst Cache RAM 128 KB Cache RAM
16 MB EDO RAM, 72-pin, 60 ns 8 MB RAM
PCI Graphics adapter, 2 MB RAM S3 805, 1 MB RAM
Enhanced IDE HDD/FDD controller 2S/1P port, highspeed
IDE HDD/FDD controller 2S/1P port
3,228 MB Enhanced IDE hard disk, 10 ms 340 MB IDE hard disk 3.5", 14 ms
3½” floppy drive, 1.44 MB 3½” floppy drive, 1.44 MB
Power Supply ASTEC power supply
Mini tower cabinet Desk top cabinet
15" SVGA colour monitor, low radiation, 1280 x1024, 0.28 mm dp
15" SVGA, radiation MPR II, 1024 x 786, 0.28mm dp
Keyboard, 105 keys (Windows 95) Keyboard 102 keys
Mouse no information
Table 3-B shows the different parts and materials of the control unit. One part is themotherboard and associated units consisting of:- Motherboard PCI with Intel SL-enhanced Processor (CPU) 486 DX4, 100 MHz- 128 KB Cache RAM- 8 MB RAM- S3 805, 1 MB RAM- IDE HDD/FDD controller 2S/1P port
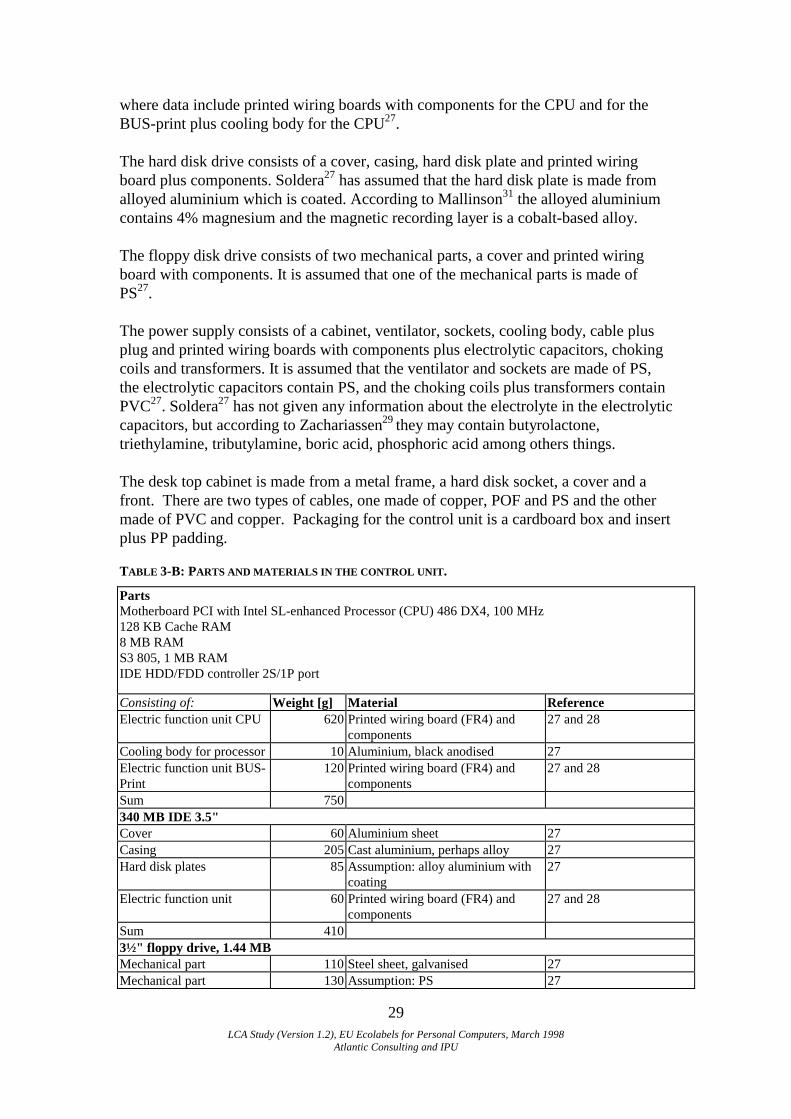
LCA Study (Version 1.2), EU Ecolabels for Personal Computers, March 1998Atlantic Consulting and IPU
29
where data include printed wiring boards with components for the CPU and for theBUS-print plus cooling body for the CPU27.
The hard disk drive consists of a cover, casing, hard disk plate and printed wiringboard plus components. Soldera27 has assumed that the hard disk plate is made fromalloyed aluminium which is coated. According to Mallinson31 the alloyed aluminiumcontains 4% magnesium and the magnetic recording layer is a cobalt-based alloy.
The floppy disk drive consists of two mechanical parts, a cover and printed wiringboard with components. It is assumed that one of the mechanical parts is made ofPS27.
The power supply consists of a cabinet, ventilator, sockets, cooling body, cable plusplug and printed wiring boards with components plus electrolytic capacitors, chokingcoils and transformers. It is assumed that the ventilator and sockets are made of PS,the electrolytic capacitors contain PS, and the choking coils plus transformers containPVC27. Soldera27 has not given any information about the electrolyte in the electrolyticcapacitors, but according to Zachariassen29 they may contain butyrolactone,triethylamine, tributylamine, boric acid, phosphoric acid among others things.
The desk top cabinet is made from a metal frame, a hard disk socket, a cover and afront. There are two types of cables, one made of copper, POF and PS and the othermade of PVC and copper. Packaging for the control unit is a cardboard box and insertplus PP padding.
TABLE 3-B: PARTS AND MATERIALS IN THE CONTROL UNIT.
PartsMotherboard PCI with Intel SL-enhanced Processor (CPU) 486 DX4, 100 MHz128 KB Cache RAM8 MB RAMS3 805, 1 MB RAMIDE HDD/FDD controller 2S/1P port
Consisting of: Weight [g] Material ReferenceElectric function unit CPU 620 Printed wiring board (FR4) and
components27 and 28
Cooling body for processor 10 Aluminium, black anodised 27Electric function unit BUS-Print
120 Printed wiring board (FR4) andcomponents
27 and 28
Sum 750340 MB IDE 3.5"Cover 60 Aluminium sheet 27Casing 205 Cast aluminium, perhaps alloy 27Hard disk plates 85 Assumption: alloy aluminium with
coating27
Electric function unit 60 Printed wiring board (FR4) andcomponents
27 and 28
Sum 4103½" floppy drive, 1.44 MBMechanical part 110 Steel sheet, galvanised 27Mechanical part 130 Assumption: PS 27

LCA Study (Version 1.2), EU Ecolabels for Personal Computers, March 1998Atlantic Consulting and IPU
30
Cover 70 Aluminium sheet, bright 27Electric function unit 30 Printed wiring board (FR4) and
components27 and 28
Sum 340ASTEC power supplyCabinet 505 Steel sheet, galvanised 27Ventilator, sockets 100 Assumption: PS 27Electric function unit 100 Printed wiring board (FR4) and
components27 and 28
Electrolytic capacitors 45 Al, Cu, Phenolic resin paper and PS 27Choking coils andTransformers
110 PVC, Lacquer insulated Cu + Ferrite 27
Cooling body 30 Aluminium, bright 27Cable and plug 210 Copper, PVC and PS 27Sum 1100Desk top cabinetMetal frame 2680 Steel profile, electroplated 27Hard disk socket 250 Steel profile, electroplated 27Cover 2180 Steel sheet 27Front 210 PPO 27Sum 5320CablesFlat band cable 100 Copper, POF and PS 27Mains cables (two), (TT-cable)
360 Copper and PVC 27
Sum 460Packaging for Control unitBox 1780 Cardboard 27Insert 410 Cardboard 27Padding 160 PP, foam 27Sum 2350Total without packaging 8380Total with packaging 10730
Table 3-C shows the different parts and materials of the monitor. These are a cabinetmade of flame retarded ABS, foot plus socket made of a mix of ABS and PC, CRTwith electronic gun, cables and printed wiring boards with components, electrolyticcapacitors, choking coils and transformers27.
According to The Taiwanese PC Task Force32 the CRT consist of panel and funnelglass, shadow mask, frame, inner shield, mount, deflection yoke and a shrinking bandfor protection. The electronic gun consist of 300 and 400 serie steel, borosilicate glasspillar, hollow nickel tubes and tungsten wire33. The composition of the CRT glass isgiven in Appendix C. According to Hedemalm30 the flame retardant used in monitorcover is deca- or octa-bromdiphenylether in a concentration of 20% in the plastics.
The packaging for the monitor is made of a cardboard box and PS padding27.
TABLE 3-C: PARTS AND MATERIALS IN THE MONITOR.
Parts Weight [g] Material References

LCA Study (Version 1.2), EU Ecolabels for Personal Computers, March 1998Atlantic Consulting and IPU
31
15" , 1024 x 786, 0.28 mm dpCabinet 2500 ABS with flame retardant 27Monitor cable 300 Copper and PVC 27Foot/socket 500 ABS mixed with PC 27Panel glass 3850 Glass 32Funnel glass 2250 Glass 32Shadow mask 41 Nickel rich steel 32Frame 425 Steel 32Inner shield 87 Steel 32Mount 37 Nickel rich steel 32Deflection Yoke 816 Copper, Fe2O3 and PWB 32Shrinking band 268 Stainless steel 32Frit Glass 30 Glass 32Electronic gun No
information300 and 400 serie steel, Borosilicateglass pillar, Nickel tubes andTungsten wire
33
Electric function unit 402 Printed wiring board (FR4) andcomponents
27 and 28
Electrolytic capacitors 120 Al, Cu, Phenolic resin paper and PS 27
Choking coils andTransformers
240 PVC, Lacquer insulated Cu +Ferrite
27
Cable 240 PS, PVC and Copper 27Sum 12106Packaging for monitorBox 1520 Cardboard 27Padding 250 PS 27Sum 1770Total with packaging 13876
Table 3-D shows the different parts and materials of the keyboard. The cover, baseand keys are made of ABS, the base shielding of steel sheet and then there is a cablewith plugs and printed wiring board with components. The key foil is not included inSoldera's report27. According to Hedemalm30 the keyboard only contains a fewcomponents, so it is assumed to have the same composition as FR4 laminate. Anestimate is made by assuming that the laminate consist of copper, epoxy resin andglass in the same proportions as for the printed wiring boards with components. Thisallows the three materials together to sum up to 100 wt%. The packaging for thekeyboard is a cardboard box27.

LCA Study (Version 1.2), EU Ecolabels for Personal Computers, March 1998Atlantic Consulting and IPU
32
TABLE 3-D: PARTS AND MATERIAL IN KEYBOARD.
Parts Weight [g] Material ReferenceKeyboard, 102 keysCover 150 ABS 27Base 230 ABS 27Base shielding 280 Steel sheet, electroplated 27Electric function unit 60 Printed wiring board (FR4) and few
components27 and 28, but modified, soit only consist of copper,epoxy with TBBPA andglass/silicon oxide
Cable and plug 70 Copper 47% and PVC 53% (signalcable)
27
Key foil Negligible No information 27Keys 390 ABS 27Sum 1180Packaging for keyboardBox 300 Cardboard 27Sum 300Total with packaging 1480
3.2. Description of Life Cycle StagesA primary concept of LCA is that life cycles are collections of stages. In theory, aninfinite number of stages might be defined. In practice, 4-6 stages usually are defined.In this study the life cycle is defined as five stages: production of raw materials,manufacturing, distribution, use and disposal. Transport will be considered withineach stage.
3.2.1. Production of Raw MaterialsThe extraction and refining of raw materials like oil, natural gas, iron and othermetals are included here. So are extraction of raw materials for production of e.g.glass. The production of some materials like glass, glass fibre, and glass textile,copper foil, and laminates for printed wiring boards are also included in the rawmaterial stage.
3.2.2. ManufacturingThe manufacturing includes all processes for manufacturing the PC, like metal coatingprocesses such as electroplating, injection moulding of plastics, production of theCRT (including the glass production, but excluding the extraction of the raw materialsfor the glass), production of the printed wiring board (from laminate) andsemiconductors, wave soldering etc.
3.2.3. DistributionThe PC is transported from an European PC manufacturer to the salesroom with atruck larger than 16 tons. From the salesroom to the office it is transported by van.The driving distance for the truck is 500 km and for the van 25 km.

LCA Study (Version 1.2), EU Ecolabels for Personal Computers, March 1998Atlantic Consulting and IPU
33
3.2.4. UsePower consumption for the monitor is 100 Watts15 and 60 Watts for control unit,which includes power consumption of the keyboard. The base case PC has no energysaving facilities and therefore consumes 160 Watts when turned on.
The lifetime of the PC is set to 3 years16. This time span is the one companies use forwriting off a PC in their accounts. After 3 years in an office the first user of the PC islikely to get a new computer. Then the PC is either thrown out or passed on to anotheruser in the office or given to a employee and used at home. Only the first “life” of thePC is considered in this LCA. After 3 years, the PC is disposed. The PC is estimatedto be turned on for 8 hours per day, 230 days per year. Altogether it runs for 5520hours during its lifetime.
3.2.5. DisposalDisposal routes of general household waste in England and Wales, Germany, Franceand Spain (only Catalonia)22 have been used to estimate PC disposal routes.According to this scenario, 63% of the PCs are sent to landfills, 22% to incinerationand 15% to recycling. The same pattern is assumed for the packaging.
PCs sent to landfills are assumed to be disposed of in landfills for household waste(bulk waste). Emissions to waste water from the leachates of metals within the firsthundred years are taken into account23. Emissions of methane from decomposition ofcardboard in landfills are included34. The emissions of methane depend on thefacilities for collection of landfill gas which varies from country to country within theEU. A model developed by IPU for methane emissions, based on actual emissionsfrom landfills, has been used.
Inventory of the incineration of PCs is based on data for incineration plants withenvironmental protection systems representing an average Danish situation. The plantshave a 75% heat recovery assumed to be used for district heating. The recoveredenergy is included as primary energy.
Representing an average recycling situation in the EU countries the metals and thePWB with components is assumed sent to secondary metal works where steel,aluminium, copper, lead, zinc, silver and gold are reclaimed. The recovery is 97% forsteel, 95% for aluminium and 100% for the other metals. Metals not mentioned aboveare lost in the recovery process. The epoxy and TBBPA are lost in the secondarycopper work. The glass/silicon oxide from the PWB is landfilled as hazardous waste.All other parts of the computer are landfilled.
3.2.6. Energy and TransportEnergy production and transportation processes in the life cycle of the PC have beenmodelled using generic European data for electricity generation, combustion processesand different forms of transportation7.

LCA Study (Version 1.2), EU Ecolabels for Personal Computers, March 1998Atlantic Consulting and IPU
34
3.3. LCI for the personal computerThe detailed results of the LCI are presented in Appendix A. A shortened version ofthe results is shown in the subsequent 4 tables.
TABLE 3-E: SHORTENED LCI, RESOURCE CONSUMPTION, TOTAL PC SYSTEM.
Resources Unit Materialproduction
Manuf. Distrib. Use Disposal Credit forrecycling
Total
Aluminium g 5.74E+02 2.88E+00 2.22E-02 1.74E-01 2.21E-02 -7.57E+01 5.02E+02Calcium carbonate g 1.72E+03 2.83E+00 5.90E-02 3.06E-01 2.06E+02 -1.99E+02 1.73E+03Chromium g 4.25E+01 4.25E+01Copper g 1.16E+03 4.52E+01 -1.69E+02 1.04E+03Crude oil g 7.62E+03 8.41E+03 2.86E+02 2.51E+04 1.05E+02 -4.19E+02 3.88E+04Ground water g 1.64E-01 2.49E+06 2.61E-01 3.87E-03 1.45E+03 -1.17E-05 2.49E+06Hard coal, cleaned g 3.90E+03 6.64E+01 1.36E+00 9.92E+00 1.11E+01 -5.78E+02 3.41E+03Hard coal, uncleaned g 4.25E+03 2.69E+04 2.51E-02 1.40E+05 2.95E+02 -5.29E+02 1.71E+05Iron g 6.90E+03 1.35E+01 2.33E-02 1.81E-01 1.84E-01 -1.07E+03 5.85E+03Lead g 5.11E+02 2.46E+01 -5.17E+00 5.31E+02Lignite g 1.42E+03 1.82E+04 3.59E-05 1.11E+05 9.20E+01 -1.79E+02 1.31E+05Manganese g 4.75E+01 8.70E-02 1.39E-04 1.01E-03 3.44E-05 -6.90E+00 4.07E+01Natural gas g 5.54E+03 1.67E+04 1.71E+01 1.78E+04 1.03E+02 -2.39E+02 4.00E+04Nickel g 3.48E+01 3.48E+01Quartz g 3.86E+03 2.26E-02 3.17E-06 -1.83E+00 3.85E+03Reservoir water g 4.12E+06 9.72E+06 3.48E+02 5.80E+07 5.63E+04 -4.93E+05 7.14E+07Sodium chloride g 6.93E+02 1.19E+02 3.88E-02 3.05E-01 5.76E+00 -1.68E+01 8.02E+02Straw, dry matter g 1.05E+02 1.05E+02Surface water g 1.38E+00 5.08E+04 5.33E-03 7.90E-05 2.95E+01 -1.65E-01 5.09E+04Tin g 4.36E+01 4.36E+01Unspecified fuel MJ 2.29E+01 8.35E-01 -2.98E-02 1.72E-03 -3.25E+01 -3.33E+00 -1.22E+01Uranium g 1.35E-01 1.68E+00 7.21E-06 1.02E+01 8.67E-03 -1.22E-02 1.20E+01Wood, soft, drymatter
g 6.66E+03 6.04E+00 -6.86E+02 5.98E+03
Zinc g 2.59E+01 1.75E+02 -9.00E-01 2.00E+02
TABLE 3-F: SHORTENED LCI, AIR EMISSIONS, TOTAL PC SYSTEM.
Air Emissions Unit Materialproduction
Manuf. Distrib. Use Disposal Credit forrecycling
Total
1-Methoxy-2-hydroxypropane
g 5.23E-01 2.26E+00 2.79E+00
2-propanol(isopropanol)
g 6.00E+00 6.00E+00
Acetone g 3.66E+00 3.66E+00Benz(a)Pyrene g 3.20E-08 3.31E-06 2.04E-05 1.68E-08 -2.14E-11 2.37E-05Benzene g 2.05E-03 2.12E-01 1.30E+00 1.08E-03 -1.37E-06 1.52E+00Boron g 6.82E-03 7.07E-01 4.34E+00 3.58E-03 -4.57E-06 5.06E+00Carbon dioxide g 5.00E+04 1.25E+05 9.36E+02 4.12E+05 4.85E+03 -5.18E+03 5.87E+05Carbon monoxide g 1.83E+02 9.02E+01 3.80E+00 3.34E+02 1.54E+01 -2.51E+01 6.02E+02Copper g 1.42E-03 1.14E-02 3.93E-09 6.61E-02 2.49E-01 -1.73E-04 3.28E-01Dioxin g 1.38E-06 1.79E-08 9.79E-12 1.10E-07 5.50E-08 -1.16E-13 1.57E-06Hydrocarbons g 1.23E+02 4.54E+01 8.04E-01 1.24E+01 6.80E-01 -3.64E+00 1.79E+02Hydrogen bromide g 1.83E+00 1.83E+00Hydrogen chloride g 6.33E-01 3.65E+00 1.39E-03 2.15E+01 1.56E+01 -4.08E-02 4.14E+01Hydrogen fluoride(HF)
g 9.36E-03 6.29E-02 3.87E-01 3.83E-04 -1.96E-05 4.59E-01
Hydrogen sulphide g 9.36E-01 2.62E-03 4.62E-03 2.90E-05 -1.52E-01 7.92E-01Lead g 1.24E-02 2.58E-02 1.86E-09 5.48E-02 1.58E-02 -3.63E-03 1.05E-01Magnesium g 2.02E-03 2.09E-01 1.29E+00 1.06E-03 -1.35E-06 1.50E+00Manganese g 1.08E+00 5.52E-03 2.20E-02 1.84E-05 -1.57E-01 9.53E-01Methane g 3.12E+01 2.24E+02 5.88E-02 1.19E+03 2.40E+00 -3.85E+00 1.44E+03

LCA Study (Version 1.2), EU Ecolabels for Personal Computers, March 1998Atlantic Consulting and IPU
35
Nickel g 2.08E-02 6.05E-02 9.08E-10 3.62E-01 8.37E-04 -2.58E-03 4.42E-01Nitrogen oxides(NOx)
g 2.44E+02 3.80E+02 1.20E+01 1.17E+03 1.27E+01 -1.59E+01 1.81E+03
Nitrous oxide g 8.22E-01 7.95E+00 3.72E-02 1.56E+01 5.78E-02 -1.10E-01 2.43E+01Non-methane volatileorganic compounds(NMVOC)
g 7.47E+00 3.97E+01 1.97E+00 2.03E+02 5.49E+00 -8.83E-01 2.56E+02
Polycyclic aromatichydrocarbons (PAH)
g 2.85E-02 2.95E-03 2.48E-11 1.76E-02 1.55E-05 -3.76E-03 4.54E-02
Radioactivity KBQ 1.40E+03 1.45E+05 8.89E+05 7.33E+02 -9.35E-01 1.04E+06Sulphur dioxide g 2.88E+02 6.01E+02 1.60E+00 3.29E+03 7.10E+00 -2.27E+01 4.17E+03Thallium g 1.92E-07 1.99E-05 1.23E-04 1.01E-07 -1.29E-10 1.43E-04Toluene g 5.09E-04 5.27E-02 3.24E-01 2.67E-04 -3.41E-07 3.78E-01Unspecified particles g 3.85E+01 4.94E+01 1.24E+00 2.29E+02 6.28E-01 -3.55E+00 3.15E+02Uranium g 1.07E-06 1.11E-04 6.82E-04 5.62E-07 -7.17E-10 7.94E-04Vanadium g 6.46E-02 1.93E-01 3.18E-08 1.13E+00 2.78E-03 -8.02E-03 1.38E+00Volatile organiccompounds (VOC)
g 3.15E+00 1.08E+01 1.58E-06 3.09E+00 8.23E-02 -1.43E-01 1.70E+01
Zinc g 5.81E-03 2.31E-02 1.93E-08 1.17E-01 2.55E-04 -7.51E-04 1.45E-01
TABLE 3-G: SHORTENED LCI, WATER EMISSIONS, TOTAL PC SYSTEM.
Water emissions Unit Materialproduction
Manuf. Distrib. Use Disposal Credit forrecycling
Total
Ammonium-N(NH4+-N)
g 1.70E-01 2.08E-01 2.22E-04 1.24E+00 1.19E-03 -1.15E-02 1.61E+00
Biological oxygendemand (BOD)
g 4.61E-01 1.99E-02 1.39E-03 1.09E-02 3.97E-04 -6.78E-03 4.87E-01
Cadmium g 1.06E-02 1.40E-03 1.25E-03 1.59E-03 -1.53E-03 1.33E-02Chemical oxygendemand (COD)
g 3.47E+01 4.52E+00 2.77E-03 2.18E-02 2.02E-01 -3.33E+00 3.61E+01
Chlorate (ClO3-) g 1.99E-03 2.06E-01 1.27E+00 1.04E-03 -1.33E-06 1.48E+00Copper g 7.67E-02 1.29E-01 5.92E-02 -1.12E-02 2.53E-01Ethylene diaminetetraacetic acid(EDTA)
g 9.74E+00 1.53E+00 1.13E+01
Fluoride (F-) g 8.84E-03 1.53E+00 4.39E-08 5.14E-01 8.30E-04 -1.07E-03 2.05E+00Formaldehyde g 7.89E-01 7.89E-01Hydrocarbons g 1.46E+00 2.14E-01 5.55E-03 7.92E-02 2.41E-03 -4.55E-02 1.71E+00Hydrogen chloride g 2.23E+01 2.23E+01Hydrogen ions (H+) g 7.67E-01 1.18E+00 8.32E-03 6.54E-02 8.68E-03 -2.84E-02 2.00E+00Hydrogenbromide g 1.10E+00 1.10E+00Iron g 6.14E+00 2.89E+01 8.67E-08 1.78E+02 6.13E-01 -9.19E-01 2.13E+02Lead g 3.62E-03 4.43E-03 9.39E-03 1.57E-03 -5.85E-04 1.84E-02Manganese g 2.44E-03 1.72E-02 1.46E-08 8.54E-02 1.76E-04 -3.04E-04 1.05E-01Nickel g 1.22E-01 3.15E-03 1.46E-09 1.62E-02 5.32E-02 -1.99E-02 1.74E-01Nitrate-N (NO3--N) g 2.42E-02 1.08E-03 6.93E-05 6.62E-04 4.57E-05 -3.49E-04 2.57E-02Phosphate (PO4---) g 2.36E-02 1.56E+00 6.26E-02 5.16E-05 -2.69E-04 1.64E+00Polycyclic aromatichydrocarbons (PAH)
g 1.14E-02 -1.50E-03 9.88E-03
Radioactivity KBQ 4.63E-02 4.80E+00 2.95E+01 2.43E-02 -3.10E-05 3.44E+01Strontium g 1.20E-02 8.16E-02 7.32E-08 4.27E-01 8.57E-04 -1.50E-03 5.20E-01Suspended solids (SS) g 4.60E+00 1.69E+00 1.66E-02 1.40E+00 1.28E-02 -1.23E-01 7.60E+00Total N g 3.65E-03 3.78E-01 2.32E+00 1.92E-03 -2.44E-06 2.71E+00Total P g 3.71E-02 3.71E-02Unspecified anionicdetergent
g 7.24E-01 7.24E-01
Unspecified coolingagent/lubricant
g 4.90E-04 1.40E-02 7.90E-05 -7.20E-05 1.45E-02
Unspecified N g 5.88E-02 3.98E-03 2.77E-04 2.18E-03 7.95E-05 -1.16E-03 6.42E-02Unspecified oil g 7.12E-01 4.36E+00 5.80E-08 2.12E+01 2.30E-02 -2.26E-02 2.63E+01

LCA Study (Version 1.2), EU Ecolabels for Personal Computers, March 1998Atlantic Consulting and IPU
36
Unspecified salt g 5.23E+00 6.49E+01 1.59E-06 3.97E+02 3.37E-01 -6.56E-01 4.67E+02Zinc g 7.25E-02 8.37E-02 1.46E-09 3.64E-01 9.05E-03 -1.07E-02 5.19E-01
TABLE 3-H: SHORTENED LCI, WASTE, TOTAL PC SYSTEM.
Waste Unit Materialproduction
Manuf. Distrib. Use Disposal Credit forrecycling
Total
Cardboard kg 2.53E+00 2.53E+00Chromium-rich slags kg 8.88E-02 8.88E-02HCl in slag and ashes kg 5.72E-02 5.72E-02Iron-rich oven slag kg 1.07E+00 1.98E-03 1.27E-01 -1.61E-01 1.04E+00Lead kg 3.69E-03 3.69E-03Sodium hydroxide kg 4.44E-03 3.12E+00 -5.86E-4 3.12E+00Tin kg 6.20E-03 6.20E-03Unspecified bauxitwaste
kg 6.09E-01 -8.04E-02 5.29E-01
Unspecified bulkwaste
kg 1.56E+00 8.66E+00 8.32E-06 4.49E+01 1.52E+01 -1.63E-01 7.01E+01
Unspecified dust withheavy metal content
kg 9.34E-03 3.71E-03 1.31E-02
Unspecifiedhazardous waste
kg 1.06E-02 2.10E+00 1.70E-12 6.11E+00 5.04E-03 -1.11E-05 8.22E+00
Unspecifiedindustrial waste
kg 1.41E-01 1.50E+01 8.60E-05 4.77E+01 3.93E-02 -8.78E-03 6.28E+01
Unspecified plasticwaste ”clean”
kg 2.58E-01 2.58E-01
Unspecifiedradioactive waste
kg 3.13E-04 4.94E-03 1.47E-1 3.02E-02 2.56E-05 -3.56E-05 3.54E-02
Unspecified slag andashes
kg 4.42E-01 1.89E+00 7.39E-04 1.02E+01 2.20E+01 -5.71E-02 1.47E+01
Unspecified slugdewith heavy metalcontent
kg 2.54E-02 2.42E-03 2.78E-02
Zinc-rich dust kg 1.48E-02 1.48E-02

LCA Study (Version 1.2), EU Ecolabels for Personal Computers, March 1998Atlantic Consulting and IPU
37
4. IMPACT ASSESSMENTIn this chapter, the results of the classified, characterised inventory are presented anddiscussed. All emissions and waste types are classified according to the impactcategories presented in Chapter 2. Quantitative results of the impact assessment forthe total PC system are shown and commented on in sub-section 4.1 as characterisedimpact potentials and the normalised impact and resource profiles. The impactassessment is also performed for each of the three elements individually, the controlunit, the monitor and the keyboard and the results shown in sections 4.2, 4.3 and 4.4.The relative contributions of the three elements are discussed in section 4.5.
Units used in reporting results aregrammes of material gmegajoules of energy MJmilliperson equivalents mPE (see 2.5.2.2)
The underlying inventory is presented as an appendix to the report (Chapter 8, p 60).The improvement assessment that is based on the impact assessment is presented inthe next chapter, where it is examined how the key impacts may be reduced.
4.1. The PC SystemTable 4-A to Table 4-C show the characterised emissions and energy consumptionsfor the PC including packaging. Tables 4-D to 4-F show the normalised data for thepersonal computer. Results are given for each stage in the life cycle.
The characterised data for global warming shows that the largest contributions comefrom the use stage where they are caused by the electricity consumption during use.The second largest contributor is the manufacture stage, but it is nearly three timeslower than the contribution from use. In the manufacturing stage the main contributorto the environmental impact is energy consumption, mainly from electricityconsumption, but also from thermal energy and transport. A small contribution alsocomes from emission of CO2 from the production of the CRT glass.
The credit for recycling represents the impacts from material production that are saveddue to the recovery of the material through the 15% recycling. The contribution fromthe disposal stage is half the size of the contribution from the material productionstage. Again for the material production stage the emissions, which contribute toglobal warming mainly come from energy consumption (electricity, thermal energyand transport). The main contributor in the disposal stage is the emission of methanefrom landfilling of cardboard, while the emission of CO2 from incineration of plasticshas a small impact. The transport processes of the distribution stage cause a very lowcontribution to the global warming impact potential for the PC.
The main contributor to acidification, nutrient enrichment and photochemical ozoneformation is also the use stage followed by manufacturing, materials production,disposal and distribution. Again, the distribution stage has a very low impact. Also forthese three environmental impacts the main contributions are caused by the energy

LCA Study (Version 1.2), EU Ecolabels for Personal Computers, March 1998Atlantic Consulting and IPU
38
consumption. The disposal of cardboard in landfills gives a large part of thecontribution to the photochemical ozone formation for the disposal stage.
TABLE 4-A: CHARACTERISED ENV. IMPACT POTENTIAL, PC AND PACKAGING
Environmentalimpact categories
Unit Materialproduction
Manuf. Distrib. Use Disposal Credit forrecycling
Total
Global warming g CO2-eqv 5.18E+04 1.33E+05 9.59E+02 4.47E+05 2.23E+04 -5.37E+03 6.50E+05Acidification g SO2-eqv 4.85E+02 9.08E+02 1.03E+01 4.14E+03 4.96E+01 -3.50E+01 5.55E+03Nutrient enrichment g NO3-eqv 3.32E+02 5.55E+02 1.64E+01 1.65E+03 1.73E+01 -2.18E+01 2.55E+03Photochemical ozone(high NOx)
g C2H4-eqv
1.20E+01 2.86E+01 1.30E+00 1.23E+02 5.60E+00 -1.34E+00 1.69E+02
Also for the waste categories the use stage is the main contributor followed bymanufacture stage. Looking at bulk waste and slag and ashes in table 4-B disposal hasa higher contribution than material production while the opposite is the case forhazardous waste and radioactive waste.
The main contributor to waste generation is energy consumption, but for bulk wastelandfilling of the PC is the main part of the disposal stage. Disposal of the PC byincineration is the main contributor to the slag and ashes for the disposal stage.Hazardous waste mainly comes from the energy production, but also the extraction ofraw materials and the manufacturing processes contributes to this waste stream.Radioactive waste only comes from electricity consumption.
TABLE 4-B: CHARACTERISED WASTE CATEGORIES, PC AND PACKAGING
Waste categories Unit Materialproduction
Manuf. Distrib. Use Disposal Credit forrecycling
Total
Bulk waste g 3.45E+03 2.68E+04 3.59E+00 9.25E+04 1.81E+04 -4.13E+02 1.40E+05Hazardous waste g 1.21E+03 2.13E+03 1.70E-09 6.11E+03 1.68E+02 -1.66E+02 9.45E+03Radioactive waste g 3.13E-01 4.94E+00 1.47E-08 3.02E+01 2.56E-02 -3.56E-02 3.54E+01Slag and ashes g 4.41E+02 1.89E+03 7.39E-01 1.02E+04 2.29E+03 -5.71E+01 1.48E+04
TABLE 4-C: CHARACTERISED PRIMARY ENERGY CONSUMPTION, PC AND PACKAGING
Energy Unit Materialproduction
Manuf. Distrib. Use Disposal Credit forrecycling
Total
Primary energy,materials
MJ 2.77E+02 1.19E-01 4.16E-02 4.32E-01 -4.13E+00 -8.69E+00 2.65E+02
Primary energy,processes
MJ 7.63E+02 2.59E+03 1.30E+01 1.02E+04 -1.07E+01 -7.52E+01 1.34E+04
The magnitudes of the potential for global warming and acidification is of the samesize in table 4-D. Whereas for nutrient enrichment and photochemical ozoneformation they are a factor lower. Per year the contribution to global warming from aPC is equivalent to 2% of one person's contribution. This is quite high consideringthat this one person also has to heat his house and workplace, prepare food, drive hiscar, watch television and so on.
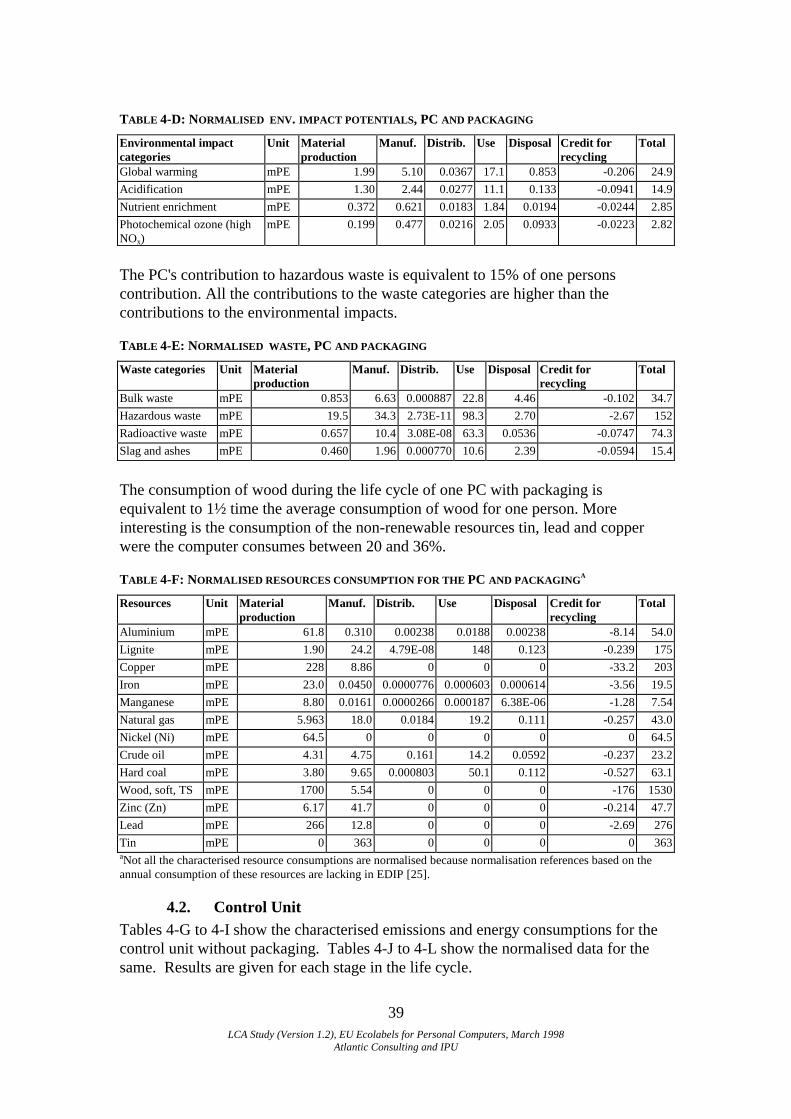
LCA Study (Version 1.2), EU Ecolabels for Personal Computers, March 1998Atlantic Consulting and IPU
39
TABLE 4-D: NORMALISED ENV. IMPACT POTENTIALS, PC AND PACKAGING
Environmental impactcategories
Unit Materialproduction
Manuf. Distrib. Use Disposal Credit forrecycling
Total
Global warming mPE 1.99 5.10 0.0367 17.1 0.853 -0.206 24.9Acidification mPE 1.30 2.44 0.0277 11.1 0.133 -0.0941 14.9Nutrient enrichment mPE 0.372 0.621 0.0183 1.84 0.0194 -0.0244 2.85Photochemical ozone (highNOx)
mPE 0.199 0.477 0.0216 2.05 0.0933 -0.0223 2.82
The PC's contribution to hazardous waste is equivalent to 15% of one personscontribution. All the contributions to the waste categories are higher than thecontributions to the environmental impacts.
TABLE 4-E: NORMALISED WASTE, PC AND PACKAGING
Waste categories Unit Materialproduction
Manuf. Distrib. Use Disposal Credit forrecycling
Total
Bulk waste mPE 0.853 6.63 0.000887 22.8 4.46 -0.102 34.7Hazardous waste mPE 19.5 34.3 2.73E-11 98.3 2.70 -2.67 152Radioactive waste mPE 0.657 10.4 3.08E-08 63.3 0.0536 -0.0747 74.3Slag and ashes mPE 0.460 1.96 0.000770 10.6 2.39 -0.0594 15.4
The consumption of wood during the life cycle of one PC with packaging isequivalent to 1½ time the average consumption of wood for one person. Moreinteresting is the consumption of the non-renewable resources tin, lead and copperwere the computer consumes between 20 and 36%.
TABLE 4-F: NORMALISED RESOURCES CONSUMPTION FOR THE PC AND PACKAGINGA
Resources Unit Materialproduction
Manuf. Distrib. Use Disposal Credit forrecycling
Total
Aluminium mPE 61.8 0.310 0.00238 0.0188 0.00238 -8.14 54.0Lignite mPE 1.90 24.2 4.79E-08 148 0.123 -0.239 175Copper mPE 228 8.86 0 0 0 -33.2 203Iron mPE 23.0 0.0450 0.0000776 0.000603 0.000614 -3.56 19.5Manganese mPE 8.80 0.0161 0.0000266 0.000187 6.38E-06 -1.28 7.54Natural gas mPE 5.963 18.0 0.0184 19.2 0.111 -0.257 43.0Nickel (Ni) mPE 64.5 0 0 0 0 0 64.5Crude oil mPE 4.31 4.75 0.161 14.2 0.0592 -0.237 23.2Hard coal mPE 3.80 9.65 0.000803 50.1 0.112 -0.527 63.1Wood, soft, TS mPE 1700 5.54 0 0 0 -176 1530Zinc (Zn) mPE 6.17 41.7 0 0 0 -0.214 47.7Lead mPE 266 12.8 0 0 0 -2.69 276Tin mPE 0 363 0 0 0 0 363aNot all the characterised resource consumptions are normalised because normalisation references based on theannual consumption of these resources are lacking in EDIP [25].
4.2. Control UnitTables 4-G to 4-I show the characterised emissions and energy consumptions for thecontrol unit without packaging. Tables 4-J to 4-L show the normalised data for thesame. Results are given for each stage in the life cycle.

LCA Study (Version 1.2), EU Ecolabels for Personal Computers, March 1998Atlantic Consulting and IPU
40
The figures in table 4-G very much follow the same pattern as described for the totalPC system. There are some small changes: the disposal stage has a much lowercontribution to the global warming and photochemical ozone formation, because thepackaging is not included.
TABLE 4-G: CHARACTERISED ENV. IMPACT POTENTIALS, CONTROL UNIT W/O PACKAGING
Environmentalimpact categories
Unit Materialproduction
Manuf. Distrib. Use Disposal Credit forrecycling
Total
Global warming g CO2-eqv 2.98E+04 5.32E+04 3.09E+02 1.68E+05 1.34E+03 -3.69E+03 2.49E+05Acidification g SO2-eqv 2.15E+02 4.70E+02 3.31E+00 1.55E+03 2.29E+01 -1.85E+01 2.24E+03Nutrient enrichment g NO3-eqv 1.53E+02 2.45E+02 5.25E+00 6.17E+02 6.51E+00 -1.20E+01 1.01E+03Photochemical ozone(high NOx)
g C2H4-eqv
8.11E+00 1.55E+01 4.20E-01 4.62E+01 1.97E-01 -9.43E-01 6.95E+01
TABLE 4-H: CHARACTERISED WASTE , CONTROL UNIT W/O PACKAGING
Energy Unit Materialproduction
Manuf. Distrib. Use Disposal Credit forrecycling
Total
Primary energy,materials
MJ 3.35E+01 6.47E-02 1.34E-02 1.62E-01 2.05E-03 -1.38E-06 3.37E+01
Primary energy,processes
MJ 3.93E+02 1.13E+05 4.17E+00 3.81E+03 1.03E+01 -4.64E+01 5.30E+03
TABLE 4-I: CHARACTERISED PRIMARY ENERGY CONSUMPTION, CONTROL UNIT W/O PACKAGING
Energy Unit Materialproduction
Manuf. Distrib. Use Disposal Credit forrecycling
Total
Primary energy,materials
MJ 3.35E+01 6.47E-02 1.34E-02 1.62E-01 2.05E-03 -1.38E-06 3.37E+01
Primary energy,processes
MJ 3.48E+03 2.69E+05 4.17E+00 1.00E+06 1.77E+03 -4.81E+01 1.28E+06
The control unit contributes to the global warming with 1% of one person'scontributions.
TABLE 4-J: NORMALISED ENV. IMPACT POTENTIALS, CONTROL UNIT W/O PACKAGING
Environmental impactcategories
Unit Materialproduction
Manuf. Distrib. Use Disposal Credit forrecycling
Total
Global warming mPE 1.14 2.04 0.0118 6.43 0.0512 -0.142 9.53Acidification mPE 0.577 1.26 0.00889 4.17 0.0616 -0.0498 6.03Nutrient enrichment mPE 0.171 0.274 0.00588 0.690 0.00728 -0.0135 1.14Photochemical ozone (highNOx)
mPE 0.135 0.258 0.00700 0.769 0.00329 -0.0157 1.16
TABLE 4-K: NORMALISED WASTE, CONTROL UNIT W/O PACKAGING
Waste categories Unit Materialproduction
Manuf. Distrib. Use Disposal Credit forrecycling
Total
Bulk waste mPE 0.584 4.29 0.000285 8.57 1.38 -0.0743 14.7Hazardous waste mPE 14.1 23.2 1.06E-11 36.9 2.16 -2.11 74.3Radioactive waste mPE 0.392 6.43 1.19E-08 23.7 0.0424 -0.0463 30.5Slag and ashes mPE 0.305 1.12 0.000248 3.99 0.587 -0.0412 5.96
TABLE 4-L: NORMALISED RESOURCES CONSUMPTION, CONTROL UNIT W/O PACKAGINGA

LCA Study (Version 1.2), EU Ecolabels for Personal Computers, March 1998Atlantic Consulting and IPU
41
Resources Unit Materialproduction
Manuf. Distrib. Use Disposal Credit forrecycling
Total
Aluminium mPE 54.6 0.0188 0.000767 0.00703 0.00157 -7.39 47.3Lignite mPE 1.57 15.0 1.85E-08 55.7 0.0981 -0.199 72.2Copper mPE 89.4 6.60 0 0 0 -12.8 83.2Iron mPE 18.9 0.0406 0.0000250 0.000226 0.000483 -2.82 16.1Manganese mPE 6.71 0.0145 8.26E-06 7.03E-05 3.26E-06 -1.01 5.71Natural gas mPE 1.84 2.13 0.00592 7.19 0.0827 -0.151 11.1Nickel (Ni) mPE 19.0 0 0 0 0 0 19.0Crude oil mPE 1.55 2.47 0.0519 5.32 0.0302 -0.129 9.29Hard coal mPE 2.77 5.33 0.000258 18.8 0.0425 -0.390 26.5Wood, soft, TS mPE 57.9 4.51 0 0 0 0 62.4Zinc (Zn) mPE 0.886 40.8 0 0 0 -0.125 41.6Lead mPE 5.00 9.91 0 0 0 -1.65 13.3Tin mPE 0 280 0 0 0 0 280aNot all the characterised resource consumptions are normalised because information on the yearly consumption ofthese resources are lacking in EDIP [25].
4.3. KeyboardTables 4-M to 4-O show the characterised emissions and energy consumptions for thekeyboard without packaging. Tables 4-P to 4-R show the normalised data for thesame. Results are given for each stage in the life cycle.
TABLE 4-M: CHARACTERISED ENV. IMPACT POTENTIALS, KEYBOARD W/O PACKAGING
Environmentalimpact categories
Unit Materialproduction
Manuf. Distrib. Use Disposal Credit forrecycling
Total
Global warming g CO2-eqv 3.21E+03 2.96E+03 4.35E+01 0.00E+00 6.07E+02 -1.55E+02 6.66E+03Acidification g SO2-eqv 3.17E+01 2.28E+01 4.66E-01 0.00E+00 2.24E+00 -7.17E-01 5.64E+01Nutrient enrichment g NO3-eqv 2.23E+01 1.81E+01 7.41E-01 0.00E+00 6.96E-01 -5.25E-01 4.13E+01Photochemical ozone(high NOx)
g C2H4-eqv
3.98E-01 5.09E-01 5.92E-02 0.00E+00 6.54E-02 -3.91E-02 9.93E-01
TABLE 4-N: CHARACTERISED WASTE, KEYBOARD W/O PACKAGING
Waste categories Unit Materialproduction
Manuf. Distrib. Use Disposal Credit forrecycling
Total
Bulk waste g 1.17E+02 4.14E+02 1.63E-01 0.00E+00 8.75E+02 -9.59E+00 1.40E+03Hazardous waste g 4.29E+01 2.02E+01 9.28E-11 0.00E+00 6.46E+00 -6.28E+00 6.33E+01Radioactive waste g 1.05E-02 2.99E-02 8.03E-10 0.00E+00 9.66E-04 -1.11E-03 4.03E-02Slag and ashes g 9.05E+00 6.04E+01 3.36E-02 0.00E+00 2.67E+01 -1.15E+00 9.50E+01
TABLE 4-O: CHARACTERISED PRIMARY ENERGY CONSUMPTION, KEYBOARD W/O PACKAGING
Energy Unit Materialproduction
Manuf. Distrib. Use Disposal Credit forrecycling
Total
Primary energy,materials
MJ 3.91E+01 2.85E-03 1.89E-03 0.00E+00 2.31E-04 -5.55E-08 3.91E+01
Primary energy,processes
MJ 4.39E+01 3.64E+01 5.88E-01 0.00E+00 -4.09E+00 -1.91E+00 7.49E+01
TABLE 4-P: NORMALISED ENV. IMPACT POTENTIALS, KEYBOARD W/O PACKAGING.
Environmental impactcategories
Unit Materialproduction
Manuf. Distrib. Use Disposal Credit forrecycling
Total

LCA Study (Version 1.2), EU Ecolabels for Personal Computers, March 1998Atlantic Consulting and IPU
42
Global warming mPE 0.123 0.113 0.00167 0 0.0233 -0.00593 0.255Acidification mPE 0.0852 0.0612 0.00125 0 0.00603 -0.00193 0.152Nutrient enrichment mPE 0.0249 0.0202 0.000828 0 0.000779 -0.000590 0.0462Photochemical ozone (highNOx)
mPE 0.00664 0.00848 0.000986 0 0.00109 -0.000650 0.0165
TABLE 4-Q: NORMALISED WASTE , KEYBOARD W/O PACKAGING
Environmental impactcategories
Unit Materialproduction
Manuf. Distrib. Use Disposal Credit forrecycling
Total
Bulk waste mPE 0.0289 0.102 0.0000402 0 0.216 -0.00237 0.345Hazardous waste mPE 0.691 0.325 1.50E-12 0 0.104 -0.101 1.02Radioactive waste mPE 0.0220 0.0627 1.68E-09 0 0.00202 -0.00232 0.0844Slag and ashes mPE 0.00943 0.0629 0.0000350 0 0.0278 -0.00120 0.0990
TABLE 4-R: NORMALISED RESOURCES CONSUMPTION, KEYBOARD W/O PACKAGINGA
Environmental impactcategories
Unit Materialproduction
Manuf. Distrib. Use Disposal Credit forrecycling
Total
Aluminium mPE 0.0175 0.00163 0.000108 0 0.0000875 -0.000200 0.0191Lignite mPE 0.0442 0.143 2.62E-09 0 0.00466 -0.00466 0.187Copper mPE 8.55 0.490 0 0 0 -1.09 7.95Iron mPE 0.911 0.0000441 3.52E-06 0 0.0000236 -0.135 0.776Manganese mPE 0.327 0.0000143 1.17E-06 0 1.73E-07 -0.0484 0.278Natural gas mPE 0.812 0.0426 0.000835 0 0.00425 -0.00723 0.853Nickel (Ni) mPE 0 0 0 0 0 0 0Crude oil mPE 0.454 0.104 0.00733 0 0.00197 -0.00516 0.562Hard coal mPE 0.144 0.408 0.0000365 0 0.00208 -0.0170 0.537Wood, soft, TS mPE 4.60 0.0574 0 0 0 0 4.65Zinc (Zn) mPE 0 0.915 0 0 0 0 0.914Lead mPE 0 0.263 0 0 0 -0.0203 0.243Tin mPE 0 7.92 0 0 0 0 7.92aNot all the characterised resource consumptions are normalised because information on the yearly consumption ofthese resources are lacking in EDIP [25].
4.4. MonitorTables 4-S to 4-U show the characterised emissions and energy consumptions for themonitor without packaging. Tables 4-V to 4-X show the normalised data for thesame. Results are given for each stage in the life cycle.
TABLE 4-S: CHARACTERISED ENV. IMPACT POTENTIALS, MONITOR W/O PACKAGING
Environmentalimpact categories
Unit Materialproduction
Manuf. Distrib. Use Disposal Credit forrecycling
Total
Global warming g CO2-eqv 1.64E+04 7.69E+04 4.46E+02 2.80E+05 2.52E+03 -1.25E+03 3.75E+05Acidification g SO2-eqv 1.73E+02 4.15E+02 4.78E+00 2.59E+03 2.18E+01 -8.16E+00 3.19E+03Nutrient enrichment g NO3-eqv 1.26E+02 2.92E+02 7.60E+00 1.03E+03 6.93E+00 -5.86E+00 1.46E+03Photochemical (highNOx)
g C2H4-eqv
2.99E+00 1.26E+01 6.07E-01 7.69E+01 2.92E-01 -3.26E-01 9.31E+01
TABLE 4-T: CHARACTERISED WASTE, MONITOR W/O PACKAGING
Waste categories Unit Materialproduction
Manuf. Distrib. Use Disposal Credit forrecycling
Total
Bulk waste g 8.19E+02 9.05E+03 1.67E+00 5.78E+04 8.74E+03 -8.57E+01 7.64E+04Hazardous waste g 2.89E+02 6.70E+02 9.48E-10 3.82E+03 2.72E+01 -2.82E+01 4.77E+03

LCA Study (Version 1.2), EU Ecolabels for Personal Computers, March 1998Atlantic Consulting and IPU
43
Radioactive waste g 1.05E-01 1.85E+00 8.20E-09 1.89E+01 4.40E-03 -1.12E-02 2.08E+01Slag and ashes g 9.90E+01 7.48E+02 3.44E-01 6.38E+03 1.67E+03 -1.18E+01 8.88E+03
TABLE 4-U: CHARACTERISED PRIMARY ENERGY CONSUMPTION, MONITOR W/O PACKAGING
Energy Unit Materialproduction
Manuf. Distrib. Use Disposal Credit forrecycling
Total
Primary energy,materials
MJ 1.27E+02 5.12E-02 1.93E-02 2.70E-01 2.28E-03 -8.75E-07 1.27E+02
Primary energy,processes
MJ 2.33E+02 1.42E+03 6.02E+00 6.34E+03 -1.07E+01 -1.66E+01 7.98E+03
TABLE 4-V: NORMALISED ENV. IMPACT POTENTIALS, MONITOR W/O PACKAGING
Environmental impactcategories
Unit Materialproduction
Manuf. Distrib. Use Disposal Credit forrecycling
Total
Global warming mPE 0.628 2.94 0.0171 10.7 0.0964 -0.0479 14.4Acidification mPE 0.464 1.12 0.0129 6.95 0.0587 -0.0219 8.58Nutrient enrichment mPE 0.141 0.327 0.00850 1.15 0.00775 -0.00655 1.63Photochemical (high NOx) mPE 0.0499 0.210 0.0101 1.28 0.00487 -0.00543 1.55
TABLE 4-W: NORMALISED WASTE, MONITOR W/O PACKAGING
Waste categories Unit Materialproduction
Manuf. Distrib. Use Disposal Credit forrecycling
Total
Bulk waste mPE 0.202 2.23 0.000412 14.3 2.16 -0.0212 18.9Hazardous waste mPE 4.65 10.8 1.53E-11 61.4 0.438 -0.453 76.9Radioactive waste mPE 0.220 3.88 1.72E-08 39.5 0.00921 -0.0234 43.6Slag and ashes mPE 0.103 0.779 0.000358 6.65 1.73 -0.0123 9.25
TABLE 4-X: NORMALISED RESOURCES CONSUMPTION, MONITOR W/O PACKAGINGA
Resources Unit Materialproduction
Manuf. Distrib. Use Disposal Credit forrecycling
Total
Aluminium mPE 7.10 0.290 0.00111 0.0117 0.000604 -0.744 6.66Lignite mPE 0.253 9.09 2.67E-08 92.9 0.0198 -0.0308 102Copper mPE 130 1.77 0 0 0 -19.3 112Iron mPE 3.22 0.00442 0.0000361 0.000377 0.000105 -0.606 2.62Manganese mPE 1.77 0.00157 0.0000119 0.000117 2.14E-06 -0.217 1.55Natural gas mPE 2.92 15.8 0.00855 12.0 0.0221 -0.0531 30.7Nickel (Ni) mPE 45.6 0 0 0 0 0 45.6Crude oil mPE 1.85 2.18 0.0751 8.87 0.0208 -0.0525 12.9Hard coal mPE 0.852 3.91 0.000374 31.3 0.0115 -0.116 35.9Wood, soft, TS mPE 16.6 0.973 0 0 0 0 17.6Zinc (Zn) mPE 5.29 0 0 0 0 -0.0893 5.20Lead mPE 261 2.66 0 0 0 -1.02 2623Tin mPE 0 75.1 0 0 0 0 75.1aNot all the characterised resource consumptions are normalised because information on the yearly consumption ofthese resources are lacking in EDIP [25].
4.5. Relative Contributions, Three ElementsThe following tables show relative contributions of the three elements of the PC toenvironmental impact potential, waste generation and energy and resourceconsumptions. For environmental impact potential, waste generation and energy, themain contribution comes from the monitor followed by the control unit. Consumptionof resources (Table 4-BB) gives a more diffuse picture, but for all resources the main

LCA Study (Version 1.2), EU Ecolabels for Personal Computers, March 1998Atlantic Consulting and IPU
44
consumer is either the control unit or the monitor, except for wood and unspecifiedfuel, where packaging is the main consumer.
TABLE 4-Y: CONTRIBUTIONS TO ENV. IMPACT, PC BY ELEMENT
Environmental impactcategories
Controlunit
Keyboard Monitor Packaging Total
Global warming 38% 1% 58% 3% 100%Acidification 40% 1% 57% 1% 100%Nutrient enrichment 40% 2% 57% 1% 100%Photochemical (high NOx) 41% 1% 55% 3% 100%
TABLE 4-Z: CONTRIBUTIONS TO WASTE, PC BY ELEMENT
Waste categories Controlunit
Keyboard Monitor Packaging Total
Bulk waste 43% 1% 54% 2% 100%Hazardous waste 49% 1% 51% 0% 100%Radioactive waste 41% 0% 59% 0% 100%Slag and ashes 39% 1% 60% 0% 100%
TABLE 4-AA: ENERGY CONSUMPTION, PC BY ELEMENT
Energy Controlunit
Keyboard Monitor Packaging Total
Primary energy, material 13% 15% 48% 25% 100%Primary energy, processes 41% 0% 59% 0% 100%
TABLE 4-BB: RESOURCE CONSUMPTION, PC BY ELEMENT
Resources Controlunit
Keyboard Monitor Packaging Total
Aluminium 88% 0% 12% 0% 100%Calcium carbonate 65% 3% 28% 4% 100%Chromium 1% 0% 99% 0% 100%Clay 26% 2% 72% 0% 100%Copper 41% 4% 55% 0% 100%Crude oil 40% 2% 56% 2% 100%Ground water 75% 0% 25% 0% 100%Hard coal 42% 1% 57% 0% 100%Iron 83% 4% 13% 0% 100%Lead 5% 0% 95% 0% 100%Lignite 41% 0% 59% 0% 100%Manganese 76% 4% 21% 0% 100%Natural gas 26% 2% 71% 1% 100%Nickel 29% 0% 71% 0% 100%Quartz 5% 0% 95% 0% 100%Reservoir water 41% 0% 59% 0% 100%Sodium chloride 53% 5% 35% 7% 100%Surface water 75% 0% 25% 0% 100%Tin 77% 2% 21% 0% 100%Unspecified biomass 63% 1% 19% 18% 100%Unspecified fuel -63% 32% 38% 94% 100%Unspecified water 57% 1% 26% 15% 100%Uranium 41% 0% 59% 0% 100%

LCA Study (Version 1.2), EU Ecolabels for Personal Computers, March 1998Atlantic Consulting and IPU
45
Wood, soft, dry matter 4% 0% 1% 94% 100%Zinc 87% 2% 11% 0% 100%

LCA Study (Version 1.2), EU Ecolabels for Personal Computers, March 1998Atlantic Consulting and IPU
46
5. IMPROVEMENT ASSESSMENTThe aim of the improvement assessment is to identify ways in which the mainenvironmental impacts of a PC can be reduced. This has been done using theprinciples of design-for-environment [1, 2], i.e. by examining the effect of variousdesign options on the environmental profile presented in the previous chapter. Thedesign options examined are presented in section 5.1, and their effects are presented insection 5.2.
5.1. Definition of Design OptionsDesign options were identified from a survey of the technical literature and similarstudies, discussions with stakeholders [1, 2] and inspection of the LCA.
5.1.1. Monitor Energy Consumption Reduced.It is assumed that the monitor energy requirement for a 15 inch screen representingthis design option is 100 watts in operational mode, 30 watts in stand-by mode and 8watts in sleep mode35. It is further assumed that the monitor enters stand-by modeafter 15 minutes and sleep mode after additional 15 minutes. Obviously, theimprovement obtained through implementation of this design option depends stronglyon the users activity at keyboard and mouse. If the PC is in continuous use throughoutthe day, the monitor may only enter stand-by mode a few times (e.g. during breaksassuming that it is not turned off then) and never enter sleep mode.
The testing of different use scenarios has substantiated this point. In the modellingdiscussed below it is assumed that during an 8 hours workday the monitor is in activemode for 3.75 hours, in stand-by mode for 2 hours and in sleep mode for 2.25 hours. Itis further assumed that only the use stage of the computer is influenced by this designoption.
5.1.2. Extension of Use-LifeThe use-life of stationary PCs may be extended for an additional use-period of threeyears by upgrading of equipment. This is done through exchange of motherboard andby inserting a larger hard disk. The life cycle assessment of this design option isbased on a comparison of:
• A base case PC which is used for 3 years, after which its motherboard and harddisk are upgraded, and then it is used for another three years.
• A base case PC, which is used for 3 years and disposed. A new base case PCis bought at that point and used for another 3 years.
5.1.3. Control-Unit Energy Consumption ReducedIt is assumed that the energy requirement for a control unit representing this designoption is 60 watts in operational mode and 30 watts in stand-by, corresponding to the1997 US EPA Energy Star requirements35. It is further assumed that the control unitenters stand-by mode after 15 minutes. As for the monitor in design option 1, the

LCA Study (Version 1.2), EU Ecolabels for Personal Computers, March 1998Atlantic Consulting and IPU
47
improvement obtained through implementation of this design option will dependstrongly on the use-pattern for the PC.
In the modelling discussed below it is assumed that during an 8 hours workday thecontrol unit is in active mode for 3.75 hours and in stand-by mode for 4.25 hours. Thisscenario corresponds to that for the monitor under design option 1.
5.1.4. Best Possible Dismantling/Recycling Scenario.In contrast to the average contemporary disposal scenario in Europe (in the LCA studyassumed to be 63% landfill, 22% incineration and 15% recycling (only metals)) thebest possible, full dismantling and recycling scenario involves:
• removal of all metal-rich components, including printed wiring boards, fromall parts of the product, is possible with the use of common tools
• removal of plastic parts weighing more than 25 grams, from all parts of theproduct, is possible with the use of common tools
• removal of the CRT from the monitor is possible with the use of commontools
• no hazardous components such as capacitors with PCB, batteries with heavymetals and others are present in the product
In the life cycle assessment of this design option, the potential environmentalimprovement is found for the optimal disposal that would be possible with knowndisposal and recycling technology of a PC fulfilling the listed requirements bycomparison with the environmental profile of the base case.
According to Legarth36 the currently best recycling /dismantling scenario involvesdismantling of the PCs into six fractions: PWBs, metals, cables, plastics, CRTs andhazardous components which are treated as follows:.
• metals and plastics without brominated flame retardants are recycled.
• CRTs are disassembled, the metal is recycled, panel glass is recycled andfunnel glass is landfilled as hazardous waste.
• cables are treated mechanically whereupon copper is recycled and PVC orother plastic isolators are landfilled (74%) or incinerated (26%).
• hazardous components such as mercury switches and electrolytic capacitorsare deposited as hazardous waste.
• the main part of the PWB is sent to secondary copper works after removal ofelectrolytic capacitors36.
Recycling the PWBs in secondary copper works gives emissions to air from thecombustion of epoxy, TBBPA and PVC (from the transformers). The glass fibres aredeposited as hazardous waste.

LCA Study (Version 1.2), EU Ecolabels for Personal Computers, March 1998Atlantic Consulting and IPU
48
5.1.5. No Brominated Flame Retardants in Large Plastic PartsDue to the complexity of the impact categories eco-toxicity and human toxicity, and theextremely high number of potentially contributing substances, the emission inventory formost processes is insufficient in this respect. This is also the case for the inventory forthe base case PC. Even for the processes and materials which are among the bestdocumented and it means that it is impossible to quantify the relative improvements forthese impact categories by implementation of this design option. However, a qualitativediscussion is possible - this is found in section 5.2.5.
5.1.6. Recycled Plastic for Large Plastic PartsIn the modelling of this design option, it is assumed that all plastic parts larger than 25grams that do not contain polybrominated flame retardants are manufactured fromrecycled ABS or PS (i.e. recycling assumes the plastic is regranulated but not melted,therefore re-addition of flame retardant is impossible). The monitor cabinet, by far thelargest plastic part of the PC, therefore is not included in this design option. The partsconcerned are the monitor foot/socket, the cabinet front of control unit, the keyboardcover and base and the plastic part in the floppy drive.
Allocation for the recycling process for plastic is based on an assumed averagetechnical utility value for the plastic of 0.8, reflecting that it has been used once andhas an average potential for five use situations. The plastic parts are disposed usingthe average scenario of 63% landfill, 22% incineration and 15% recycling (metals).
5.1.7. All Packaging Materials Are Recycled.In the modelling of this design option recycling of all the packaging materials isassumed using current recycling technology. Compared to the life cycle of the basecase the model includes only changes in the disposal stage.
5.1.8. Lead-Free SolderThe use of lead/tin solder causes emissions of lead from production and use of thesolder and from disposal of the product containing the electronics. In the modelling ofthe environmental effects of this design option the normal lead-tin solder (63%Sn /37%Pb) is replaced by a tin-copper solder (99.3%Sn / 0.7%Cu)37 that can be usedwith the existing soldering equipment38. Emissions of lead from the soldering anddisposal processes are removed and emissions of tin (and copper for the disposalprocess) increased accordingly. The energy consumption for the wave solderingprocess is assumed to be the same.
5.2. Effects of the Design OptionsTable 5-A presents the relative environmental impact potentials and consumption ofresources for the design options compared to the base case. The impacts andconsumptions are expressed as a percentage of the base case, except for Option 2,where it is compared to 2x the base case (see 5.1.2). A combination of Option 1 and 3is shown in the far-right column, because it is most likely that these options will beconducted jointly. Option 5 is not presented quantitatively, for reasons explained inthe text of section 5.1.5.

LCA Study (Version 1.2), EU Ecolabels for Personal Computers, March 1998Atlantic Consulting and IPU
49
TABLE 5-A: DESIGN OPTIONS COMPARED TO BASE CASEA
PC base-casecharacterised
PC base-caseNormalised
Option1
Option2
Option3
Option 4 Option6
Option7
Option8
Option1 and 3
Environmentalimpacts
mPE
Global warming 6.50E+05 2.49E+01 81.3% 88.5% 93.1% 93.4% 99.9% 97.3% 100.0% 74.5%Acidification 5.55E+03 1.49E+01 79.8% 91.4% 92.6% 97.5% 99.8% 99.3% 100.0% 72.4%Nutrientenrichment
2.55E+03 2.85E+00 82.5% 86.6% 93.6% 95.6% 99.8% 99.4% 100.1% 76.0%
Photochemicalozone (highNOx)
1.69E+02 2.82E+00 80.3% 90.9% 92.8% 93.1% 100.0% 97.0% 100.1% 73.0%
WastecategoriesBulk waste 1.40E+05 3.47E+01 82.1% 89.4% 93.4% 86.9% 100.0% 98.3% 100.0% 75.6%Hazardous waste 9.45E+03 1.52E+02 82.5% 89.6% 93.6% 162.6% 100.0% 100.0% 100.0% 76.1%Radioactivewaste
3.54E+01 7.43E+01 76.9% 96.7% 91.5% 99.8% 100.0% 100.0% 100.0% 68.4%
Slag and ashes 1.48E+04 1.54E+01 81.3% 89.0% 93.1% 83.5% 100.0% 100.3% 100.0% 74.4%EnergyPrimary energy,material
2.65E+02 100.0% 50.1% 100.0% 86.7% 95.4% 83.0% 100.0% 99.9%
Primary energy,process
1.34E+04 79.5% 91.9% 92.5% 98.1% 99.9% 99.8% 100.0% 72.0%
ResourcesAluminium 5.02E+02 2.51E-01 100.0% 83.2% 100.0% 26.9% 100.0% 100.0% 100.0% 100.0%Calciumcarbonate
1.73E+03 100.0% 55.6% 100.0% 56.7% 100.0% 97.0% 100.0% 100.0%
Chromium 4.25E+01 100.0% 50.4% 100.0% 100.0% 100.0% 100.0% 100.0% 100.0%Clay 7.15E+02 100.0% 61.1% 100.0% 72.7% 100.0% 100.0% 100.0% 100.0%Copper 1.04E+03 5.53E+00 100.0% 56.9% 100.0% 9.3% 100.0% 100.0% 100.0% 100.0%Crude oil 4.11E+04 5.35E-01 83.4% 85.7% 93.9% 94.4% 99.5% 98.8% 100.1% 77.4%Ground water 2.49E+06 100.0% 87.5% 100.0% 99.9% 100.0% 100.0% 100.0% 100.0%Hard coal 1.08E+05 3.60E-01 78.5% 93.8% 92.1% 96.0% 100.0% 100.4% 100.0% 70.6%Iron 5.85E+03 1.66E-01 100.0% 50.5% 100.0% 7.6% 100.0% 100.0% 100.0% 100.0%Lead 5.31E+02 1.33E+01 100.0% 52.1% 100.0% 95.5% 100.0% 100.0% 97.4% 100.0%Lignite 1.31E+05 4.36E-01 76.9% 96.8% 91.5% 99.3% 100.0% 100.0% 100.0% 68.4%Manganese 4.07E+01 9.10E-02 100.0% 50.4% 100.0% 14.4% 100.0% 100.0% 100.0% 100.0%Natural gas 4.00E+04 6.93E-02 87.9% 74.7% 95.6% 96.4% 99.4% 99.4% 100.0% 83.5%Nickel 3.48E+01 1.28E+00 100.0% 62.6% 100.0% 59.0% 100.0% 100.0% 100.0% 100.0%Quartz 3.85E+03 100.0% 51.9% 100.0% 38.3% 100.0% 100.0% 100.0% 100.0%Reservoir water 7.14E+04 78.0% 95.7% 91.9% 96.8% 100.0% 100.0% 100.0% 69.9%Sodium chloride 8.02E+02 100.0% 53.1% 100.0% 96.9% 99.7% 95.4% 100.0% 100.0%Surface water 5.09E+04 100.0% 87.5% 100.0% 99.9% 100.0% 100.0% 100.0% 100.0%Tin 4.36E+01 1.35E+01 100.0% 83.2% 100.0% 42.9% 100.0% 100.0% 134.9% 100.0%Unspecifiedbiomass
6.03E+02 98.9% 72.3% 99.6% 27.4% 100.0% 198.1% 100.3% 98.5%
Unspecified fuel -1.22E+01 100.0% 37.0% 100.0% -126.0% 100.0% 6.4% 100.6% 100.0%Unspecifiedwater
9.72E+05 100.0% 74.1% 100.0% 91.8% 99.8% 89.9% 100.1% 100.0%
Uranium 1.20E+01 77.0% 96.6% 91.5% 99.8% 100.0% 100.0% 100.0% 68.5%Wood, soft, drymatter
5.98E+03 4.58E+00 100.0% 51.7% 100.0% 111.5% 100.0% 34.9% 100.0% 100.0%
Zinc 2.00E+02 2.40E+00 100.0% 50.7% 100.0% 90.2% 100.0% 100.0% 100.0% 100.0%aNot all the characterised resource consumptions are normalised because information on the yearly consumption ofthese resources are lacking in EDIP [25]

LCA Study (Version 1.2), EU Ecolabels for Personal Computers, March 1998Atlantic Consulting and IPU
50
5.2.1. Monitor Energy Consumption ReducedTable 5-A shows reductions of 20% in the life cycle process energy consumption for thisoption as compared to the base case. This reflects reductions in the consumption ofenergy carriers and in the environmental impacts that are primarily associated with thecombustion processes used in generating the electricity for the use of the PC: globalwarming, acidification, photochemical ozone formation and to some extent nutrientenrichment.
5.2.2. Extension of Use-LifeAs seen from Table 5-A, introduction of this design option results in improvements of10-15% for all environmental impact categories and 15-50% for all resources except theenergy carriers (lignite, hard coal, uranium and reservoir water) which are primarilyconsumed during the use stage.
5.2.3. Control-Unit Energy Consumption ReducedTable 5-A shows reductions in energy consumption of nearly 10% for this designoption as compared to the base case. This improvement reflects reductions of theconsumption of energy carriers and in the energy-related environmental impacts. Thepattern is similar to that seen for reduction of the monitor energy consumption underdesign option 1, but the improvement of design option 3 is only about half that ofoption 1.
5.2.4. Best Possible Dismantling/Recycling ScenarioCompared to the base case this design option gives a modest improvement for nearly allenvironmental impacts and larger reductions (around 15%) for generation of bulk waste,slag and ashes. The quantity of hazardous waste, however, is increased about 60%. Thisis because recycling processes generate problem waste and because ABS that containsbrominated flame-retardants is treated as hazardous waste.
For most of the metals used in structural elements and wiring within the PC there aresubstantial reductions in resource loss, but for crude oil - the resource behind the plasticcomponents - there is only a reduction of a few percent. Because of impurities in someof the large plastic parts39 and because plastic used to insulate is not usually recycled,only around 40% of the plastic in the PC is recycled. Furthermore, the major function ofcrude oil in the life cycle of a PC is as an energy carrier for electricity generation.
The material-bound energy is reduced by nearly 15% while the process-energy is largelyunchanged. Compared to what is saved, it thus does not cost additional energy to recyclethe materials.
5.2.5. No Brominated Flame Retardants in Large Plastic PartsBrominated flame retardants of the PBDE (polybrominated diphenyl ether) and TBBPA(tetrabromo bisphenol A) type have been identified as potential environmentallyhazardous compounds. Although toxicological knowledge about most of the substancesis scarce, several have been shown to have:- strong potential for bio-accumulation- hormone-mimicking effect mechanisms

LCA Study (Version 1.2), EU Ecolabels for Personal Computers, March 1998Atlantic Consulting and IPU
51
- high environmental persistence
Recent studies have revealed their presence in blood samples of office workers. Thereare other potential sources of exposure, but the use as flame retardants in officeequipment is suspected to be a primary cause40.
Upon incineration, in the disposal stage, the rather high content of brominatedcompounds serves as one of the main sources of bromine in the waste41 42 43. Theincineration process will lead to a certain emission of polychlorinated dioxin compoundsand the closely related polybrominated compounds44 45. The brominated compoundsexert toxicity mechanisms similar to the chlorinated dioxins, which are consideredamong the most toxic compounds generated by human activities [44] 46. The formationof compounds with dioxin-like toxicity by incineration of PCs increases substantiallywith the presence of large quantities of bromine in the product [44, 46].
5.2.6. Recycled Plastic for Large Plastic PartsTable 5-A reveals insignificant improvements in all environmental impacts (0.2% atmost) and resource consumptions (up to 0.6% for some of the resources used in plasticproduction) by using recycled materials in the larger non-flame retarded plastic parts ofthe PC. Even if the monitor cabinet were also manufactured from recycled plastic thiswould not increase these improvements by more than a factor two (from insignificanceto insignificance). The reason for the weak effect, even on the resource consumption, isthat those types of resources which are used for plastic production are also used asenergy carriers for electricity production - in much larger quantities.
5.2.7. All Packaging Materials Are RecycledRecycling all the packaging materials gives no or only very small improvements (a fewtenths of a percent) in all environmental impact categories except global warming andphotochemical ozone formation where appreciable contributions are caused by methaneemissions from landfilling of cardboard packaging materials. As seen from Table 5-Aeven the generation of bulk waste is reduced by a mere 1-2% through recycling of allpackaging. There is a major reduction of the material-bound energy primarily caused bysaving of nearly 70% of the soft wood used in the life cycle (for cardboard and paper).
5.2.8. Lead-Free SolderTable 5-A shows no positive effects on any environmental impact category. Even for theecotoxicity and human toxicity impact categories, only the contribution to humantoxicity via air is reduced and that by a mere few percent (data not shown). This shouldbe seen on the background that:
• specific emissions of lead from manufacturing and use of lead-tin solder andfrom the disposal of the lead-soldered products are included in the inventory ata reasonably certain level
• as in almost all LCIs, the emissions of chemicals in the life cycle withpotential contributions to the human toxicity and ecotoxicity is veryincomplete (see section 2.5.2.2). Therefore the life cycle contribution to these

LCA Study (Version 1.2), EU Ecolabels for Personal Computers, March 1998Atlantic Consulting and IPU
52
impact categories surely is underestimated, meaning that the improvement oflead-free solder will be relatively smaller than that calculated here.
LCA Study (Version 1.2), EU Ecolabels for Personal Computers, March 1998Atlantic Consulting and IPU
53
6. VALIDATIONTo test the robustness of the analysis, a sensitivity analysis of key parameters wasconducted and some of the input data was reviewed by experts.
6.1. SensitivitiesSome uncertainty is inherent to LCA, because of the imprecision of available data andthe diversity of practice. Not all uncertainties can be checked, and it is impossible toput confidence limits on LCAs as they are currently done; nonetheless, sensitivitiescan be identified and varied to test the robustness of the analysis. The aim is to seewhether changing key assumptions within their range of plausibility or improvingquality of key process and material data may influence the conclusions drawn from theanalysis.
The key assumptions are judged to be: weight of PC components, lifetime of the PC,usage energy and time of the PC and the mix of waste disposal routes.
Key processes are identified from the results of the life cycle assessment as thoseprocesses that contribute most strongly to the different environmental impactcategories or resource consumptions. The key processes with their relative shares inthe total impact from the life cycle are shown for each of the impact categories inTable 6-A below.

LCA Study (Version 1.2), EU Ecolabels for Personal Computers, March 1998Atlantic Consulting and IPU
54
Table 6-A: Main Contributors to Environmental Impact and Resource Consumptions(Relative share in total given as percentages)
Environmental impactpotentials
Contributing processes
Use CRT ElectronicComponents
Global Warming 68% use 8% CRT production 8% Active electroniccomponent
2% Packaging, disposal 2% Steel, cabinet
Acidification 74% useNutrient Enrichment 64% usePhotochemical ozone(high NOx)
70% use
Human tox, water 76% use 9% Stainless steel, CRT 8% Active electroniccomponent
Human tox, air 67% use 7% Active electroniccomponent
5% materials, cabinet 3% CRT production
Human tox, soil 83% use 9% Active electroniccomponent
Ecotox, water, chronic 47% use 18% materials,motherboard
6% Print laminate,monitor
5% Active electroniccomponent
3% Copper, monitor 3% Print production,motherboard
3% materials,power supply
2%Stainlesssteel,monitor
Ecotox, water, acute 68% use 5% materials, controlunit
5% Active electroniccomponent
4% Copper, monitor 3% Print production,motherboard
2% CRT production,electricity
2% Printproduction,monitor
Ecotox, soil 60% Printlaminate,motherboard
20% Print laminate,monitor
8% Print laminate,power supply
Bulk waste 66% use 15% Active electroniccomponent
5% Landfilling,monitor
2% CRT production,electricity
2% Landfilling,cabinet
2% Landfilling,remaining Control unit
2% Landfilling,packaging
Hazardous waste 64% use 16% Active electroniccomponent
8% materials, cabinet 2% CRT production,electricity
2% Print production,motherboard
2% Stainless steel,CRT
Radioactive waste 85% use 9% Active electroniccomponent
Slag and ashes 69% use 11% Incineration,monitor
8% Active electroniccomponent
4% Incineration, controlunit

LCA Study (Version 1.2), EU Ecolabels for Personal Computers, March 1998Atlantic Consulting and IPU
55
Copper use 55% materials,monitor
16% materials, cables 9% materials,motherboard
9% materials, powersupply
Nickel use 52% Stainless steel,CRT
23% Nickel,motherboard
19% Nickel, monitor
Zinc use 54% Galvanising,power supply
20% Electroplating,cabinet
12% Galvanising,floppy drive
10% CRT glass
Lead use 92% CRT glassTin use 40% Wave
soldering,motherboard
21% Print production,motherboard
13% Wave soldering,monitor
7% Print production,monitor
5% Wave soldering,power supply
3% Print production,power supply
2% Printproduction, harddisk

LCA Study (Version 1.2), EU Ecolabels for Personal Computers, March 1998Atlantic Consulting and IPU
56
As explained earlier, it has not been possible, due to lack of inventory data, to assesscontributions to the chemical-related impact categories ecotoxicity and human toxicityin the environment. The rest of the impact categories (global warming, photochemicalozone formation, acidification, and nutrient enrichment) are - at least whenconsidering the life cycle of a PC - mainly energy related. So is the production ofmost of the waste, caused by mining of energy carriers and generation of wasteproducts at the power plants. For all of them, the predominant process of the PC lifecycle is the use stage of the PC, contributing around 70%. The same picture is seen forthe energy carriers like oil, coal and natural gas (not shown). The rest of these impactpotentials originate in a number of processes that each give only minor contributions.Therefore the assumption about the power consumption of the PC during use is by farthe most important for the result for these impact categories and resources. This isconfirmed in the analysis of the design options involving reducing the energyconsumption of the monitor and the control unit in Section V where the change causedby lower energy consumption in the use stage is investigated.
As seen in Table 6-A, some minor contributions to the environmental impactpotentials come from the production of active electronic components and theproduction of CRT. Data for the processes are based on the MCC estimates14, and asthis report states, semiconductors processing ought to be improving. Assuming this isthe case and that the energy consumption for the wafer processes is reduced by 50%,while the yield has risen 20 %, contributions from the production of active electroniccomponents falls to 4% of the total for global warming. For bulk waste thecontributions decreases from 15% to 10%.
Even if energy consumption for production of active electronic components and themonitor is reduced by 50%, total global warming of the PC will fall only 9%.
The lifetime of the PC is a key assumption. For the base case it is set at three years,but if it is changed, all the impacts related to the use stage will change accordingly.Contributions from the other stages of the life cycle will not change and therefore theirrelative importance decreases.
Another suspected key assumption - the weight of the PC components - is found tohave very little influence on the total results since their main impacts are on theimpact categories and resources that are also related to the energy consumption of thePC. Even substantial changes in the weight of the components will thus not be able toinfluence the outcome of the assessment.
The assumed disposal scenario is somewhat uncertain in particular regarding thefraction of the PC that is recycled, which is probably overestimated. Changing thisfraction will influence the consumption of the metal resources accordingly.
For some parts of the life cycle it has not been possible to find data for the processes.This is frequently the case for the use of ancillary materials and the emissions ofhazardous substances. Results for the impact categories related to eco-toxicity andhuman toxicity are very incomplete, thus they have not been reported. For a few

LCA Study (Version 1.2), EU Ecolabels for Personal Computers, March 1998Atlantic Consulting and IPU
57
processes it has not been possible to find data on energy and resource consumption.Of the major parts, this is the case for the hard disk, the mouse and the CD-ROMdrive of the control unit. From the relative significance of other parts built fromsimilar materials, this is judged not to influence the result for the energy-relatedimpact categories or resources.
In summary, the data deficiencies of the inventory are not judged to influence theconclusions based on the life cycle assessment regarding the relative effects of thedifferent design options.
6.2. Expert ReviewThe definition of the generic PC and the design options were distributed to the AdHoc Working Group and made available to interested parties via the Internet. Anumber of comments were received by the project team; some have been madeavailable to the AHWG. Some comments were of a philosophical nature and somewere more specific. The project team has tried to make use of and respond to all thecomments.

LCA Study (Version 1.2), EU Ecolabels for Personal Computers, March 1998Atlantic Consulting and IPU
58
7. IMPLICATIONS for CRITERIAAccording to this project's terms of reference, criteria are to be proposed after theAHWG convenes to discuss this LCA report. Therefore, at this point, only theimplications for criteria will be discussed. As expected, these flow from theimprovement assessment of Chapter 4.5.
7.1. Reduce Monitor Energy ConsumptionEnergy consumption of the monitor holds very strong improvement potential.
A crucial issue is the length of the transition period, before the monitor enters thedifferent stand-by and sleep modes. Both the Energy Star requirements and the NordicSwan criteria operate with an interval within which it can be adjusted by the user. Itmight be an idea to require that the transitional period be set at something like fiveminutes when the PC is delivered. Information might be given on-screen about theimportance of this parameter in overall environmental impact of the PC to influenceusers to operate with short transitional periods. This could encourage that the energy-saving possibilities actually are used.
In the Nordic Swan criteria there is a differentiation between screen sizes, allowinghigher energy consumptions for larger screens. Depending on the weight given to themonitor’s energy consumption (and the possible use of hurdles) this may be necessary toallow PC’s with screens larger than 15 inches to obtain a label.
7.2. Extend LifetimeThis clearly improves the environmental profile of the PC. However, given the modularconstruction of today’s PCs, there is hardly a desktop on the market that does not inprinciple allow its lifetime to be extended through exchange of motherboard and otherkey items. Criteria setting might focus on the reason why PCs are not upgraded inpractice, which could be attributed to:
• changes in the physical design of cabinet and other parts that prevent amotherboard and hard disk made three years on to fit into the cabinet
• the price of a new motherboard and hard disk is so high, compared to the priceof a new PC, that upgrading is not attractive
• three years from purchase the internal communication structure of the PC mayhave changed so much that the new motherboard cannot be connected properlyto the rest of the PC.
7.3. Reduce Control-Unit Energy ConsumptionEnergy consumption of the control-unit is not as critical as that of the monitor, but isnonetheless significant. The improvement potentials by simultaneous implementation ofdesign options 1 and 3 are also shown in Table 5-A.
LCA Study (Version 1.2), EU Ecolabels for Personal Computers, March 1998Atlantic Consulting and IPU
59
7.4. Ensure Takeback and RecyclingThere is improvement from this option, although less significant than that of the firstthree. There is some energy reduction, and resource consumption of metals falls aswell. Possible criteria could be guaranteed takeback and design for recycling.
7.5. Eliminate Brominated Flame RetardantsAs explained in sections 5.1.5 and 5.2.5, it has not been possible to perform aquantitative assessment of the environmental improvement potentials by this designoption. However, the brominated compounds used as flame retardants clearly areproblematic from an environmental and toxicological perspective, and the justification isquestionable for their long-term presence in most PCs, so there is little doubt that thisdesign option should be debated as an ecolabel criterion. A criterion might be inspiredby the strategies for eliminating the brominated flame retardants through the followingoptions (ranked): (1) Design the product (or maybe change the legislation) to make theuse of flame retardants redundant; (2) Use plastics that are in themselves poorlyinflammable (e.g. polycarbonate); (3) Use composite materials based on polycarbonate;or (4) Use other types of flame retardants (e.g. phosphate esters, which seem lessenvironmentally problematic).
7.6. Use Recyclate in Plastic PartsThis design option will not cause major reductions in the overall environmental impactof the PC. Nonetheless, it may be chosen as an area for criteria (1) to help create orexpand a market for recycled plastics and/or (2) to support the electronic takebackmeasures being initiated by DG XI.
7.7. Recycle All PackagingApart from these resource savings the improvements are so small that they do notparticularly merit the attention caused by setting labelling criteria for the packaging. Onthe other hand, historically there is a strong focus on packaging that warrant criteria inthis area. In this case, the criterion should be based on the use of recycled materials forproducing the packaging. In practice, all packaging materials used for PCs can berecycled today, but the actual recycling of the materials is beyond the control of theproducer. Allowing bonus points for the use of recycled materials might help creating orexpanding the market for these materials (particularly expanded PS). The life cycleperspectives of such a requirement have not been calculated but it will probably be ofthe same order of magnitude as the scenario discussed for recycling of all packagingmaterials.

LCA Study (Version 1.2), EU Ecolabels for Personal Computers, March 1998Atlantic Consulting and IPU
60
8. APPENDIX A: LCI Input/Output TablesLCI input/outputs are presented in four parts: for the entire PC, in section 8.1; thecontrol unit, in 8.2; the keyboard, in 8.3 and the monitor, in 8.4.
8.1. The Personal Computer
TABLE 8-A: RESOURCE CONSUMPTION, PERSONAL COMPUTER
Resources Unit Materialproduction
Manuf. Distrib. Use Disposal Credit forrecycling
Total
Aluminium g 5.74E+02 2.88E+00 2.22E-02 1.74E-01 2.21E-02 -7.57E+01 5.02E+02Calcium carbonate g 1.72E+03 2.83E+00 5.90E-02 3.06E-01 2.06E+02 -1.99E+02 1.73E+03Chromium g 4.25E+01 4.25E+01Clay g 7.15E+02 1.19E-01 8.32E-03 6.54E-02 2.38E-03 -1.15E-02 7.15E+02Copper g 1.16E+03 4.52E+01 -1.69E+02 1.04E+03Crude oil, fuel g 5.01E+03 8.41E+03 2.85E+02 2.51E+04 1.05E+02 -3.85E+02 3.85E+04Crude oil, rawmaterial
g 2.61E+03 1.14E+00 9.79E-01 1.45E-02 1.18E-01 -3.43E+01 2.58E+03
Ground water g 1.64E-01 2.49E+06 2.61E-01 3.87E-03 1.45E+03 -1.17E-05 2.49E+06Hard coal, cleaned,fuel
g 3.90E+03 6.64E+01 1.36E+00 9.92E+00 1.11E+01 -5.78E+02 3.41E+03
Hard coal,uncleaned, fuel
g 4.25E+03 2.69E+04 2.51E-02 1.40E+05 2.95E+02 -5.29E+02 1.71E+05
Iron g 6.90E+03 1.35E+01 2.33E-02 1.81E-01 1.84E-01 -1.07E+03 5.85E+03Lead g 5.11E+02 2.46E+01 -5.17E+00 5.31E+02Lignite, fuel g 1.42E+03 1.82E+04 3.59E-05 1.11E+05 9.20E+01 -1.79E+02 1.31E+05Manganese g 4.75E+01 8.70E-02 1.39E-04 1.01E-03 3.44E-05 -6.90E+00 4.07E+01Natural gas, fuel g 3.32E+03 1.67E+04 1.71E+01 1.78E+04 1.03E+02 -2.22E+02 3.78E+04Natural gas, rawmaterial
g 2.22E+03 -1.73E+01 2.20E+03
Nickel g 3.48E+01 3.48E+01Quartz g 3.86E+03 2.26E-02 3.17E-06 -1.83E+00 3.85E+03Reservoir water g 4.12E+06 9.72E+06 3.48E+02 5.80E+07 5.63E+04 -4.93E+05 7.14E+07Sodium chloride g 6.93E+02 1.19E+02 3.88E-02 3.05E-01 5.76E+00 -1.68E+01 8.02E+02Straw, dry matter,fuel
g 1.05E+02 1.05E+02
Surface water g 1.38E+00 5.08E+04 5.33E-03 7.90E-05 2.95E+01 -1.65E-01 5.09E+04Tin g 4.36E+01 4.36E+01Titanium dioxide g 1.90E+01 1.90E+01Unspecifiedbiomass, dry matter,fuel
g 5.07E+02 2.99E+01 5.52E-05 8.25E-07 8.01E-01 -6.68E+01 4.71E+02
Unspecifiedbiomass, dry matter,raw material
g 3.76E-02 3.90E+00 2.40E+01 1.98E-02 -2.52E-05 2.79E+01
Unspecified fuel MJ 2.29E+01 8.35E-01 -2.98E-02 1.72E-03 -3.25E+01 -3.33E+00 -1.22E+01Unspecified minerals g 1.52E+01 1.52E+01Unspecifiedresources
g 4.36E+01 7.36E-02 1.03E-05 -5.97E+00 3.77E+01
Unspecified water kg 2.17E+04 2.25E+06 1.38E+07 1.14E+04 -1.45E+01 1.61E+07Unspecified water g 3.37E+05 6.67E+05 5.82E+01 4.58E+02 1.19E+03 -3.45E+04 9.72E+05Uranium g 1.35E-01 1.68E+00 7.21E-06 1.02E+01 8.67E-03 -1.22E-02 1.20E+01Wood, soft, drymatter, fuel
g 3.44E+03 6.04E+00 -3.37E+02 3.11E+03

LCA Study (Version 1.2), EU Ecolabels for Personal Computers, March 1998Atlantic Consulting and IPU
61
Wood, soft, drymatter, raw material
g 3.22E+03 -3.49E+02 2.87E+03
Zinc g 2.59E+01 1.75E+02 -9.00E-01 2.00E+02
TABLE 8-B: AIR EMISSIONS, PERSONAL COMPUTER
Air Emissions Unit Materialproduction
Manuf. Distrib. Use Disposal Credit forrecycling
Total
1-Methoxy-2-hydroxypropane
g 5.23E-01 2.26E+00 2.79E+00
1-methyl-2-pyrrolidon
g 2.04E-03 2.04E-03
2-Methoxy-1-propanol
g 4.58E-02 4.58E-02
2-propanol(isopropanol)
g 6.00E+00 6.00E+00
Acetone g 3.66E+00 3.66E+00Aluminium g 1.25E-02 1.25E-02Aluminium oxide(Al2O3)
g 1.65E-01 1.65E-01
Ammonia g 9.97E-04 1.12E-02 3.26E-03 1.83E-02 4.45E-04 -3.40E-05 3.42E-02Antimony g 8.65E-06 8.97E-04 5.52E-03 4.55E-06 -5.80E-09 6.43E-03Arsenic (As) g 9.59E-04 2.57E-03 6.28E-10 1.48E-02 2.10E-05 -1.26E-04 1.83E-02Benz(a)Pyrene g 3.20E-08 3.31E-06 2.04E-05 1.68E-08 -2.14E-11 2.37E-05Benzene g 2.05E-03 2.12E-01 1.30E+00 1.08E-03 -1.37E-06 1.52E+00Boron g 6.82E-03 7.07E-01 4.34E+00 3.58E-03 -4.57E-06 5.06E+00Cadmium g 2.08E-04 1.47E-03 6.45E-11 7.59E-03 2.24E-05 -1.93E-05 9.27E-03Carbon dioxide g 5.00E+04 1.25E+05 9.36E+02 4.12E+05 4.85E+03 -5.18E+03 5.87E+05Carbon monoxide g 1.83E+02 9.02E+01 3.80E+00 3.34E+02 1.54E+01 -2.51E+01 6.02E+02Chlorine g 1.51E-03 1.51E-03Chromium g 4.86E-04 2.05E-04 1.18E-09 2.69E-05 1.22E-03 -6.64E-05 1.87E-03Chromium (III) g 3.99E-05 4.13E-03 2.54E-02 2.09E-05 -2.67E-08 2.96E-02Cobalt g 1.69E-05 1.75E-03 1.08E-02 8.88E-06 -1.13E-08 1.25E-02Copper g 1.42E-03 1.14E-02 3.93E-09 6.61E-02 2.49E-01 -1.73E-04 3.28E-01Cyanide (CN-) g 9.70E-06 1.01E-03 6.18E-03 5.10E-06 -6.50E-09 7.20E-03Dioxin g 1.38E-06 1.79E-08 9.79E-12 1.10E-07 5.50E-08 -1.16E-13 1.57E-06Fluoride (F-) g 3.99E-02 8.06E-05 5.60E-07 -6.54E-03 3.34E-02Hydrocarbons g 1.23E+02 4.54E+01 8.04E-01 1.24E+01 6.80E-01 -3.64E+00 1.79E+02Hydrogen bromide g 1.83E+00 1.83E+00Hydrogen chloride g 6.33E-01 3.65E+00 1.39E-03 2.15E+01 1.56E+01 -4.08E-02 4.14E+01Hydrogen fluoride(HF)
g 9.36E-03 6.29E-02 3.87E-01 3.83E-04 -1.96E-05 4.59E-01
Hydrogen sulphide g 9.36E-01 2.62E-03 4.62E-03 2.90E-05 -1.52E-01 7.92E-01Iron g 1.61E-01 1.61E-01Lead g 1.24E-02 2.58E-02 1.86E-09 5.48E-02 1.58E-02 -3.63E-03 1.05E-01Magnesium g 2.02E-03 2.09E-01 1.29E+00 1.06E-03 -1.35E-06 1.50E+00Manganese g 1.08E+00 5.52E-03 2.20E-02 1.84E-05 -1.57E-01 9.53E-01Mercury g 2.86E-04 3.93E-03 5.86E-10 2.35E-02 2.35E-05 -2.67E-05 2.77E-02Methane g 3.12E+01 2.24E+02 5.88E-02 1.19E+03 2.40E+00 -3.85E+00 1.44E+03Molybdenum g 9.49E-06 9.84E-04 6.05E-03 4.99E-06 -6.36E-09 7.04E-03N,N-Dimethylformamide
g 1.83E-02 1.83E-02
Nickel g 2.08E-02 6.05E-02 9.08E-10 3.62E-01 8.37E-04 -2.58E-03 4.42E-01Nitrogen g 7.38E+00 7.38E+00

LCA Study (Version 1.2), EU Ecolabels for Personal Computers, March 1998Atlantic Consulting and IPU
62
Nitrogen oxides(NOx)
g 2.44E+02 3.80E+02 1.20E+01 1.17E+03 1.27E+01 -1.59E+01 1.81E+03
Nitrous oxide g 8.22E-01 7.95E+00 3.72E-02 1.56E+01 5.78E-02 -1.10E-01 2.43E+01NMVOC, aircraftengines
g 4.74E-01 4.74E-01
NMVOC, base loadel
g 1.41E-02 1.46E+00 9.00E+00 7.42E-03 -9.46E-06 1.05E+01
NMVOC, dieselengines
g 6.52E+00 6.82E+00 1.97E+00 6.55E+00 2.90E-01 -8.12E-01 2.13E+01
NMVOC, oil heating g 2.91E-01 3.02E+01 1.86E+02 1.53E-01 -1.95E-04 2.16E+02NMVOC, paintingprocesses
g 3.28E-01 4.23E-03 3.32E-01
NMVOC, petrolengines
g 4.11E-02 1.72E-03 4.50E-08 8.02E-10 4.59E-04 -1.52E-03 4.17E-02
NMVOC, powerplants
g 6.03E-01 1.66E-01 7.92E-07 1.18E-08 5.77E-03 -7.91E-02 6.95E-01
NMVOC, naturalgas heating
g 2.15E-03 2.23E-01 1.37E+00 1.13E-03 -1.44E-06 1.60E+00
Non-methanevolatile organiccompounds(NMVOC)
g 5.03E+00 5.03E+00
Polycyclic aromatichydrocarbons (PAH)
g 2.85E-02 2.95E-03 2.48E-11 1.76E-02 1.55E-05 -3.76E-03 4.54E-02
Radioactivity KBQ 1.40E+03 1.45E+05 8.89E+05 7.33E+02 -9.35E-01 1.04E+06Selenium g 4.51E-04 1.16E-02 5.48E-09 6.62E-02 8.81E-05 -4.67E-05 7.82E-02Strontium g 7.04E-05 7.30E-03 4.49E-02 3.70E-05 -4.72E-08 5.23E-02Styrene g 2.04E-02 2.04E-02Sulphur dioxide g 2.88E+02 6.01E+02 1.60E+00 3.29E+03 7.10E+00 -2.27E+01 4.17E+03Thallium g 1.92E-07 1.99E-05 1.23E-04 1.01E-07 -1.29E-10 1.43E-04Thorium g 1.11E-06 1.16E-04 7.10E-04 5.85E-07 -7.46E-10 8.27E-04Tin g 1.56E-06 7.54E-03 9.94E-04 8.20E-07 -1.05E-09 8.54E-03Toluene g 5.09E-04 5.27E-02 3.24E-01 2.67E-04 -3.41E-07 3.78E-01Total P g 4.54E-05 4.71E-03 2.90E-02 2.39E-05 -3.04E-08 3.37E-02Unspecifiedaldehydes
g 1.50E-04 6.54E-04 1.06E-08 2.69E-03 1.10E-04 -1.51E-05 3.59E-03
Unspecifiedchlorinated org.comp.
g 5.44E-01 5.44E-01
Unspecifiedfluorides
g 4.67E-01 -6.16E-02 4.05E-01
Unspecified heavymetals
g 2.53E-04 4.07E-04 5.88E-13 1.05E-14 8.28E-05 -8.28E-05 6.60E-04
Unspecified ironoxides
g 4.26E-02 4.26E-02
Unspecified metals g 3.30E-02 3.98E-03 2.77E-04 2.18E-03 7.95E-05 -1.06E-03 3.85E-02Unspecifiedmethylstyrene
g 4.15E-03 4.15E-03
Unspecified n-alkanes
g 1.62E-02 1.62E-02
Unspecified org.compounds
g 3.87E-03 1.31E-03 2.13E-08 5.39E-03 2.20E-04 -3.02E-05 1.08E-02
Unspecified oxides g 5.71E-02 5.71E-02Unspecified particles g 3.85E+01 4.94E+01 1.24E+00 2.29E+02 6.28E-01 -3.55E+00 3.15E+02Unspecified salt g 1.65E-01 1.65E-01Unspecifiedsubstance
g 2.71E-03 2.71E-03
Uranium g 1.07E-06 1.11E-04 6.82E-04 5.62E-07 -7.17E-10 7.94E-04

LCA Study (Version 1.2), EU Ecolabels for Personal Computers, March 1998Atlantic Consulting and IPU
63
Vanadium g 6.46E-02 1.93E-01 3.18E-08 1.13E+00 2.78E-03 -8.02E-03 1.38E+00VOC, coal heating g 6.02E-03 2.62E-02 4.25E-07 1.08E-01 4.40E-03 -6.04E-04 1.44E-01VOC, diesel engines g 1.65E+00 6.01E-01 6.83E-07 2.98E+00 7.78E-03 -1.71E-02 5.22E+00VOC, natural gasheating
g 6.37E-01 1.02E+01 4.71E-07 8.40E-09 6.06E-02 -9.16E-02 1.08E+01
VOC, oil heating g 2.66E-01 6.83E-03 9.56E-03 -3.41E-02 2.48E-01Volatile organiccompounds (VOC)
g 5.90E-01 1.10E-02 6.01E-01
Zinc g 5.81E-03 2.31E-02 1.93E-08 1.17E-01 2.55E-04 -7.51E-04 1.45E-01
TABLE 8-C: WATER EMISSIONS, PERSONAL COMPUTER
Water emissions Unit Materialproduction
Manuf. Distrib. Use Disposal Credit forrecycling
Total
Aluminium g 2.41E-03 1.63E-02 1.46E-08 8.54E-02 1.71E-04 -2.99E-04 1.04E-01Ammonia g 5.67E-04 1.62E-02 9.16E-05 -8.34E-05 1.68E-02Ammonium-N(NH4+-N)
g 1.70E-01 2.08E-01 2.22E-04 1.24E+00 1.19E-03 -1.15E-02 1.61E+00
Arsenic (As) g 2.11E-02 1.23E-03 2.58E-03 3.16E-03 -3.05E-03 2.50E-02Biological oxygendemand (BOD)
g 4.61E-01 1.99E-02 1.39E-03 1.09E-02 3.97E-04 -6.78E-03 4.87E-01
Cadmium g 1.06E-02 1.40E-03 1.25E-03 1.59E-03 -1.53E-03 1.33E-02Calcium g 1.41E-01 5.42E-03 2.11E-02 -2.03E-02 1.47E-01Chemical oxygendemand (COD)
g 3.47E+01 4.52E+00 2.77E-03 2.18E-02 2.02E-01 -3.33E+00 3.61E+01
Chlorate (ClO3-) g 1.99E-03 2.06E-01 1.27E+00 1.04E-03 -1.33E-06 1.48E+00Chloride (Cl-) g 7.13E+01 3.47E+02 2.99E-03 1.91E+03 3.58E+00 -4.77E+00 2.33E+03Chromium g 1.13E-01 2.29E-04 2.52E-04 -1.86E-02 9.50E-02Chromium(III) g 3.41E-05 3.18E-03 1.87E-02 1.62E-05 -7.13E-07 2.19E-02Copper g 7.67E-02 1.29E-01 5.92E-02 -1.12E-02 2.53E-01Dissolved organiccarbon (DOC)
g 1.01E+00 5.13E-01 3.31E-08 5.62E-10 3.15E-03 -1.77E-02 1.51E+00
Ethylene diaminetetraacetic acid(EDTA)
g 9.74E+00 1.53E+00 1.13E+01
Fluoride (F-) g 8.84E-03 1.53E+00 4.39E-08 5.14E-01 8.30E-04 -1.07E-03 2.05E+00Formaldehyde g 7.89E-01 7.89E-01Halogenated organiccompounds (AOX)
g 1.20E-02 -1.30E-03 1.07E-02
Hydrocarbons g 1.46E+00 2.14E-01 5.55E-03 7.92E-02 2.41E-03 -4.55E-02 1.71E+00Hydrogen chloride g 2.23E+01 2.23E+01Hydrogen cyanide g 1.06E-02 1.06E-02Hydrogen ions (H+) g 7.67E-01 1.18E+00 8.32E-03 6.54E-02 8.68E-03 -2.84E-02 2.00E+00Hydrogenbromide g 1.10E+00 1.10E+00Iron g 6.14E+00 2.89E+01 8.67E-08 1.78E+02 6.13E-01 -9.19E-01 2.13E+02Lead g 3.62E-03 4.43E-03 9.39E-03 1.57E-03 -5.85E-04 1.84E-02Manganese g 2.44E-03 1.72E-02 1.46E-08 8.54E-02 1.76E-04 -3.04E-04 1.05E-01Mercury g 4.05E-07 1.15E-05 6.50E-08 -5.95E-08 1.19E-05Nickel g 1.22E-01 3.15E-03 1.46E-09 1.62E-02 5.32E-02 -1.99E-02 1.74E-01Nitrate-N (NO3--N) g 2.42E-02 1.08E-03 6.93E-05 6.62E-04 4.57E-05 -3.49E-04 2.57E-02Phenol g 1.25E-03 1.28E-02 8.27E-10 1.41E-11 7.87E-05 -1.73E-04 1.40E-02Phosphate (PO4---) g 2.36E-02 1.56E+00 6.26E-02 5.16E-05 -2.69E-04 1.64E+00Polycyclic aromatichydrocarbons (PAH)
g 1.14E-02 -1.50E-03 9.88E-03
Radioactivity KBQ 4.63E-02 4.80E+00 2.95E+01 2.43E-02 -3.10E-05 3.44E+01Selenium g 2.34E-04 9.04E-06 3.51E-05 -3.38E-05 2.45E-04

LCA Study (Version 1.2), EU Ecolabels for Personal Computers, March 1998Atlantic Consulting and IPU
64
Silicate ion g 4.80E+00 4.80E+00Sodium ion (Na+) g 3.34E+00 3.83E+00 2.40E-01 -2.32E-01 7.18E+00Strontium g 1.20E-02 8.16E-02 7.32E-08 4.27E-01 8.57E-04 -1.50E-03 5.20E-01Sulphate g 1.73E+01 1.93E+02 3.56E-03 1.16E+03 1.04E+00 -1.67E+00 1.37E+03Suspended solids(SS)
g 4.60E+00 1.69E+00 1.66E-02 1.40E+00 1.28E-02 -1.23E-01 7.60E+00
Total N g 3.65E-03 3.78E-01 2.32E+00 1.92E-03 -2.44E-06 2.71E+00Total organic carbon(TOC)
g 2.69E-04 7.71E-03 4.35E-05 -3.96E-05 7.98E-03
Total P g 3.71E-02 3.71E-02Unspecified anionicdetergent
g 7.24E-01 7.24E-01
Unspecifiedchlorinated org.comp.
g 7.55E-03 7.55E-03
Unspecified coolingagent/lubricant
g 4.90E-04 1.40E-02 7.90E-05 -7.20E-05 1.45E-02
Unspecifieddissolved matter
g 9.65E+00 1.74E+01 1.47E-05 8.54E+01 9.03E-01 -1.02E+00 1.12E+02
Unspecified ironoxides
g 5.43E+00 1.10E-02 1.54E-06 -8.90E-01 4.55E+00
Unspecified metals g 2.88E+00 1.48E-01 1.39E-03 1.09E-02 1.18E-03 -4.04E-02 3.00E+00Unspecified N g 5.88E-02 3.98E-03 2.77E-04 2.18E-03 7.95E-05 -1.16E-03 6.42E-02Unspecified oil g 7.12E-01 4.36E+00 5.80E-08 2.12E+01 2.30E-02 -2.26E-02 2.63E+01Unspecified org.compounds
g 2.21E-01 2.61E+00 1.60E+01 1.32E-02 -4.82E-03 1.89E+01
Unspecified oxides g 4.51E+00 9.12E-03 1.28E-06 -7.40E-01 3.78E+00Unspecified salt g 5.23E+00 6.49E+01 1.59E-06 3.97E+02 3.37E-01 -6.56E-01 4.67E+02Unspecifiedsubstance
g 3.15E-01 4.90E+00 1.67E-08 2.49E-10 4.46E-02 -4.55E-02 5.21E+00
Unspecifiednonionic detergents
g 8.79E-02 8.79E-02
Water g 1.57E+05 3.17E+06 2.42E-02 3.59E-04 1.34E+02 -1.70E+04 3.31E+06Zinc g 7.25E-02 8.37E-02 1.46E-09 3.64E-01 9.05E-03 -1.07E-02 5.19E-01
TABLE 8-D: WASTE, PERSONAL COMPUTER.
Waste Unit Materialproduction
Manuf. Distrib. Use Disposal Credit forrecycling
Total
Aluminium g 3.38E-01 3.38E-01Aluminium oxide g 3.16E+00 3.16E+00Cardboard kg 2.53E+00 2.53E+00Chromium-rich slags kg 8.88E-02 8.88E-02Copper chloride kg 1.83E-04 1.83E-04Dolomite g 5.81E+00 1.66E+02 9.39E-01 -8.55E-01 1.72E+02Glass tissue,reinforced withepoxy
kg 1.83E-03 1.83E-03
HCl in slag andashes
kg 5.72E-02 5.72E-02
Iron g 5.03E-01 5.03E-01Iron-rich oven slag kg 1.07E+00 1.98E-03 1.27E-01 -1.61E-01 1.04E+00Lead kg 3.69E-03 3.69E-03Mineral waste kg 8.20E-03 8.92E-03 6.10E-04 4.45E-03 1.11E-04 -8.53E-04 2.14E-02PWB laminate, FR4 kg 3.66E-02 5.89E-02 9.55E-02Quartz g 3.93E+00 3.51E-03 4.92E-07 -2.84E-01 3.65E+00Sand (SiO2) g 1.59E+01 -2.10E+00 1.38E+01

LCA Study (Version 1.2), EU Ecolabels for Personal Computers, March 1998Atlantic Consulting and IPU
65
Slag containingmanganese
kg 3.25E-02 5.81E-05 8.16E-09 -4.72E-03 2.78E-02
Sodium hydroxide kg 3.12E+00 3.12E+00Sodium hydroxide g 4.44E+00 -5.86E-01 3.85E+00Soil and sandcontaining heavymetals
kg 5.25E-03 5.25E-03
Tin kg 6.20E-03 6.20E-03Unspecified wastefrom steelproduction(hazardous)
kg 9.59E-03 9.59E-03
Unspecifiedchemical waste
kg 8.06E-02 6.59E-04 4.71E-05 3.44E-04 7.71E-06 -3.94E-04 8.13E-02
Unspecified bauxitewaste
kg 6.09E-01 -8.04E-02 5.29E-01
Unspecified bulkwaste
kg 1.56E+00 8.66E+00 8.32E-06 4.49E+01 1.52E+01 -1.63E-01 7.01E+01
Unspecified dustwith heavy metalcontent
kg 9.34E-03 3.71E-03 1.31E-02
Unspecifiedhazardous waste
kg 1.06E-02 2.10E+00 1.70E-12 6.11E+00 5.04E-03 -1.11E-05 8.22E+00
Unspecifiedindustrial waste
kg 1.41E-01 1.50E+01 8.60E-05 4.77E+01 3.93E-02 -8.78E-03 6.28E+01
Unspecified plasticwaste ”clean”
kg 2.58E-01 2.58E-01
Unspecifiedradioactive waste
g 3.13E-01 4.94E+00 1.47E-08 3.02E+01 2.56E-02 -3.56E-02 3.54E+01
Unspecified rubber kg 4.26E-04 4.12E-03 2.84E-03 5.23E-05 3.69E-04 -1.57E-07 7.81E-03Unspecified salt g 8.41E+00 8.41E+00Unspecified slag andashes
kg 1.42E-03 3.93E-02 2.42E-01 1.99E-04 -1.25E-04 2.83E-01
Unspecified slag andashes fromincineration
kg 3.21E-02 5.26E-05 4.51E-05 6.68E-07 2.22E+00 -3.48E-03 2.25E+00
Unspecified slag andashes, energy
kg 4.08E-01 1.85E+00 6.94E-04 9.97E+00 1.68E-02 -5.35E-02 1.22E+01
Unspecified slagsfrom oven
kg 1.19E-03 4.64E-02 -1.58E-04 4.75E-02
Unspecified sludge kg 1.83E-05 2.50E-02 2.42E-09 1.16E-02 2.30E-05 -1.22E-08 3.67E-02Unspecified slugdewith heavy metalcontent
kg 2.54E-02 2.42E-03 2.78E-02
Unspecified waste kg 1.20E-01 3.93E-02 -1.30E-02 1.47E-01Unspecified wastefrom steelproduction (nonhazardous)
kg 8.96E-01 1.81E-03 1.73E-03 -1.47E-01 7.52E-01
Zinc-rich dust kg 1.48E-02 1.48E-02
8.2. Control unit
TABLE 8-E: RESOURCE CONSUMPTION, CONTROL UNIT W/O PACKAGING
Resources Unit Materialproduction
Manufacture
Distribution
Use Disposal Credit forrecycling
Total
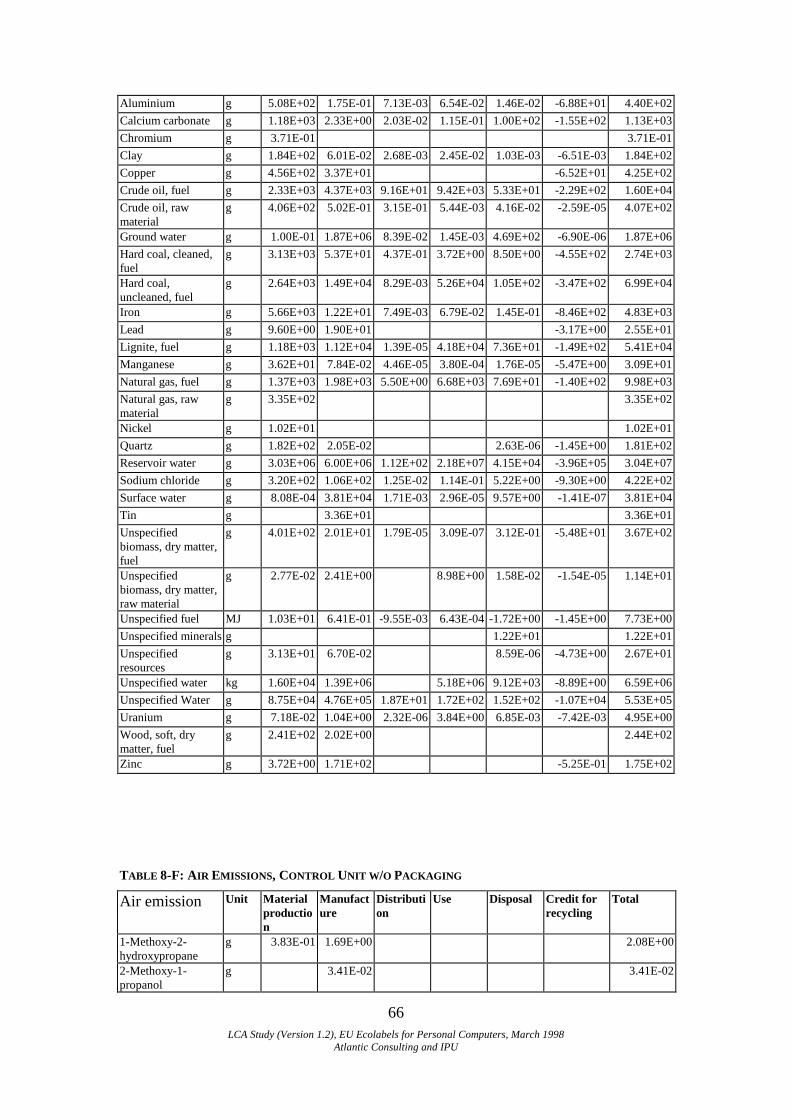
LCA Study (Version 1.2), EU Ecolabels for Personal Computers, March 1998Atlantic Consulting and IPU
66
Aluminium g 5.08E+02 1.75E-01 7.13E-03 6.54E-02 1.46E-02 -6.88E+01 4.40E+02Calcium carbonate g 1.18E+03 2.33E+00 2.03E-02 1.15E-01 1.00E+02 -1.55E+02 1.13E+03Chromium g 3.71E-01 3.71E-01Clay g 1.84E+02 6.01E-02 2.68E-03 2.45E-02 1.03E-03 -6.51E-03 1.84E+02Copper g 4.56E+02 3.37E+01 -6.52E+01 4.25E+02Crude oil, fuel g 2.33E+03 4.37E+03 9.16E+01 9.42E+03 5.33E+01 -2.29E+02 1.60E+04Crude oil, rawmaterial
g 4.06E+02 5.02E-01 3.15E-01 5.44E-03 4.16E-02 -2.59E-05 4.07E+02
Ground water g 1.00E-01 1.87E+06 8.39E-02 1.45E-03 4.69E+02 -6.90E-06 1.87E+06Hard coal, cleaned,fuel
g 3.13E+03 5.37E+01 4.37E-01 3.72E+00 8.50E+00 -4.55E+02 2.74E+03
Hard coal,uncleaned, fuel
g 2.64E+03 1.49E+04 8.29E-03 5.26E+04 1.05E+02 -3.47E+02 6.99E+04
Iron g 5.66E+03 1.22E+01 7.49E-03 6.79E-02 1.45E-01 -8.46E+02 4.83E+03Lead g 9.60E+00 1.90E+01 -3.17E+00 2.55E+01Lignite, fuel g 1.18E+03 1.12E+04 1.39E-05 4.18E+04 7.36E+01 -1.49E+02 5.41E+04Manganese g 3.62E+01 7.84E-02 4.46E-05 3.80E-04 1.76E-05 -5.47E+00 3.09E+01Natural gas, fuel g 1.37E+03 1.98E+03 5.50E+00 6.68E+03 7.69E+01 -1.40E+02 9.98E+03Natural gas, rawmaterial
g 3.35E+02 3.35E+02
Nickel g 1.02E+01 1.02E+01Quartz g 1.82E+02 2.05E-02 2.63E-06 -1.45E+00 1.81E+02Reservoir water g 3.03E+06 6.00E+06 1.12E+02 2.18E+07 4.15E+04 -3.96E+05 3.04E+07Sodium chloride g 3.20E+02 1.06E+02 1.25E-02 1.14E-01 5.22E+00 -9.30E+00 4.22E+02Surface water g 8.08E-04 3.81E+04 1.71E-03 2.96E-05 9.57E+00 -1.41E-07 3.81E+04Tin g 3.36E+01 3.36E+01Unspecifiedbiomass, dry matter,fuel
g 4.01E+02 2.01E+01 1.79E-05 3.09E-07 3.12E-01 -5.48E+01 3.67E+02
Unspecifiedbiomass, dry matter,raw material
g 2.77E-02 2.41E+00 8.98E+00 1.58E-02 -1.54E-05 1.14E+01
Unspecified fuel MJ 1.03E+01 6.41E-01 -9.55E-03 6.43E-04 -1.72E+00 -1.45E+00 7.73E+00Unspecified minerals g 1.22E+01 1.22E+01Unspecifiedresources
g 3.13E+01 6.70E-02 8.59E-06 -4.73E+00 2.67E+01
Unspecified water kg 1.60E+04 1.39E+06 5.18E+06 9.12E+03 -8.89E+00 6.59E+06Unspecified Water g 8.75E+04 4.76E+05 1.87E+01 1.72E+02 1.52E+02 -1.07E+04 5.53E+05Uranium g 7.18E-02 1.04E+00 2.32E-06 3.84E+00 6.85E-03 -7.42E-03 4.95E+00Wood, soft, drymatter, fuel
g 2.41E+02 2.02E+00 2.44E+02
Zinc g 3.72E+00 1.71E+02 -5.25E-01 1.75E+02
TABLE 8-F: AIR EMISSIONS, CONTROL UNIT W/O PACKAGING
Air emission Unit Materialproduction
Manufacture
Distribution
Use Disposal Credit forrecycling
Total
1-Methoxy-2-hydroxypropane
g 3.83E-01 1.69E+00 2.08E+00
2-Methoxy-1-propanol
g 3.41E-02 3.41E-02

LCA Study (Version 1.2), EU Ecolabels for Personal Computers, March 1998Atlantic Consulting and IPU
67
2-propanol(isopropanol)
g 4.47E+00 4.47E+00
Acetone g 2.73E+00 2.73E+00Aluminium g 1.11E-02 1.11E-02Aluminium oxide(Al2O3)
g 1.50E-01 1.50E-01
Ammonia g 2.83E-04 5.21E-03 1.05E-03 6.87E-03 1.54E-04 -2.17E-05 1.35E-02Antimony g 6.39E-06 5.55E-04 2.07E-03 3.64E-06 -3.55E-09 2.63E-03Arsenic (As) g 6.44E-04 1.58E-03 2.17E-10 5.57E-03 1.38E-05 -8.80E-05 7.72E-03Benz(a)Pyrene g 2.36E-08 2.05E-06 7.64E-06 1.34E-08 -1.31E-11 9.72E-06Benzene g 1.51E-03 1.31E-01 4.89E-01 8.61E-04 -8.40E-07 6.23E-01Boron g 5.03E-03 4.37E-01 1.63E+00 2.87E-03 -2.80E-06 2.07E+00Cadmium g 1.04E-04 9.63E-04 2.23E-11 2.85E-03 1.47E-05 -1.33E-05 3.91E-03Carbon dioxide g 2.87E+04 4.94E+04 3.01E+02 1.55E+05 1.30E+03 -3.56E+03 2.31E+05Carbon monoxide g 1.45E+02 4.11E+01 1.23E+00 1.25E+02 1.89E+00 -1.97E+01 2.95E+02Chlorine g 7.12E-04 7.12E-04Chromium g 3.38E-04 5.56E-05 3.87E-10 1.01E-05 7.44E-04 -4.76E-05 1.10E-03Chromium (III) g 2.94E-05 2.55E-03 9.53E-03 1.68E-05 -1.63E-08 1.21E-02Cobalt g 1.25E-05 1.08E-03 4.04E-03 7.11E-06 -6.93E-09 5.14E-03Copper g 9.23E-04 6.81E-03 1.28E-09 2.48E-02 9.57E-02 -1.17E-04 1.28E-01Cyanide (CN-) g 7.16E-06 6.22E-04 2.32E-03 4.08E-06 -3.98E-09 2.95E-03Dioxin g 1.29E-10 1.10E-08 3.15E-12 4.11E-08 1.79E-08 -7.08E-14 7.02E-08Fluoride (F-) g 3.44E-02 7.34E-05 4.48E-07 -5.18E-03 2.92E-02Hydrocarbons g 2.71E+01 6.92E+00 2.59E-01 4.64E+00 3.69E-01 -9.65E-01 3.83E+01Hydrogen bromide g 1.34E+00 1.34E+00Hydrogen chloride g 3.32E-01 2.17E+00 4.46E-04 8.07E+00 7.39E+00 -3.02E-02 1.79E+01Hydrogen fluoride(HF)
g 1.26E-03 3.89E-02 1.45E-01 3.14E-04 -2.49E-07 1.85E-01
Hydrogen sulphide g 7.95E-01 2.16E-03 1.73E-03 2.32E-05 -1.20E-01 6.79E-01Iron g 1.28E-01 1.28E-01Lead g 7.62E-03 1.84E-02 6.13E-10 2.06E-02 9.55E-03 -2.24E-03 5.39E-02Magnesium g 1.49E-03 1.29E-01 4.82E-01 8.49E-04 -8.28E-07 6.14E-01Manganese g 8.25E-01 3.98E-03 8.26E-03 1.48E-05 -1.25E-01 7.13E-01Mercury g 1.62E-04 2.39E-03 1.91E-10 8.83E-03 1.70E-05 -1.91E-05 1.14E-02Methane g 1.89E+01 1.25E+02 1.87E-02 4.46E+02 8.42E-01 -2.46E+00 5.89E+02Molybdenum g 7.01E-06 6.08E-04 2.27E-03 3.99E-06 -3.89E-09 2.89E-03N,N-Dimethylformamide
g 1.36E-02 1.36E-02
Nickel g 1.27E-02 3.77E-02 3.15E-10 1.36E-01 5.45E-04 -1.61E-03 1.85E-01Nitrogen g 5.82E+00 5.82E+00Nitrogen oxides(NOx)
g 1.12E+02 1.65E+02 3.86E+00 4.40E+02 4.73E+00 -8.73E+00 7.17E+02
Nitrous oxide g 5.80E-01 1.66E+00 1.20E-02 5.85E+00 3.89E-02 -8.05E-02 8.06E+00NMVOC, aircraftengines
g 2.42E-01 2.42E-01
NMVOC, base loadel
g 1.04E-02 9.05E-01 3.38E+00 5.94E-03 -5.79E-06 4.30E+00
NMVOC, dieselengines
g 3.34E+00 3.20E+00 6.38E-01 2.46E+00 8.92E-02 -4.71E-01 9.25E+00
NMVOC, naturalgas heating
g 1.59E-03 1.38E-01 5.14E-01 9.05E-04 -8.82E-07 6.54E-01
NMVOC, oil heating g 2.15E-01 1.87E+01 6.96E+01 1.23E-01 -1.20E-04 8.86E+01NMVOC, paintingprocesses
g 3.28E-01 4.23E-03 3.32E-01
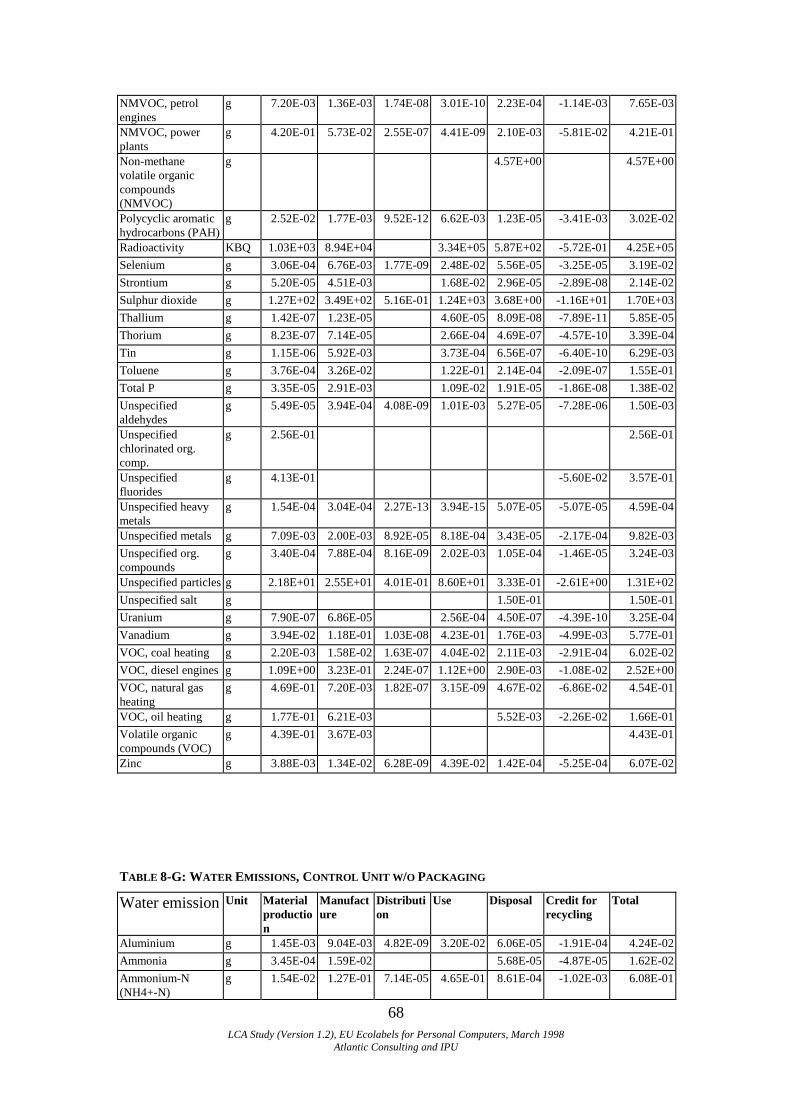
LCA Study (Version 1.2), EU Ecolabels for Personal Computers, March 1998Atlantic Consulting and IPU
68
NMVOC, petrolengines
g 7.20E-03 1.36E-03 1.74E-08 3.01E-10 2.23E-04 -1.14E-03 7.65E-03
NMVOC, powerplants
g 4.20E-01 5.73E-02 2.55E-07 4.41E-09 2.10E-03 -5.81E-02 4.21E-01
Non-methanevolatile organiccompounds(NMVOC)
g 4.57E+00 4.57E+00
Polycyclic aromatichydrocarbons (PAH)
g 2.52E-02 1.77E-03 9.52E-12 6.62E-03 1.23E-05 -3.41E-03 3.02E-02
Radioactivity KBQ 1.03E+03 8.94E+04 3.34E+05 5.87E+02 -5.72E-01 4.25E+05Selenium g 3.06E-04 6.76E-03 1.77E-09 2.48E-02 5.56E-05 -3.25E-05 3.19E-02Strontium g 5.20E-05 4.51E-03 1.68E-02 2.96E-05 -2.89E-08 2.14E-02Sulphur dioxide g 1.27E+02 3.49E+02 5.16E-01 1.24E+03 3.68E+00 -1.16E+01 1.70E+03Thallium g 1.42E-07 1.23E-05 4.60E-05 8.09E-08 -7.89E-11 5.85E-05Thorium g 8.23E-07 7.14E-05 2.66E-04 4.69E-07 -4.57E-10 3.39E-04Tin g 1.15E-06 5.92E-03 3.73E-04 6.56E-07 -6.40E-10 6.29E-03Toluene g 3.76E-04 3.26E-02 1.22E-01 2.14E-04 -2.09E-07 1.55E-01Total P g 3.35E-05 2.91E-03 1.09E-02 1.91E-05 -1.86E-08 1.38E-02Unspecifiedaldehydes
g 5.49E-05 3.94E-04 4.08E-09 1.01E-03 5.27E-05 -7.28E-06 1.50E-03
Unspecifiedchlorinated org.comp.
g 2.56E-01 2.56E-01
Unspecifiedfluorides
g 4.13E-01 -5.60E-02 3.57E-01
Unspecified heavymetals
g 1.54E-04 3.04E-04 2.27E-13 3.94E-15 5.07E-05 -5.07E-05 4.59E-04
Unspecified metals g 7.09E-03 2.00E-03 8.92E-05 8.18E-04 3.43E-05 -2.17E-04 9.82E-03Unspecified org.compounds
g 3.40E-04 7.88E-04 8.16E-09 2.02E-03 1.05E-04 -1.46E-05 3.24E-03
Unspecified particles g 2.18E+01 2.55E+01 4.01E-01 8.60E+01 3.33E-01 -2.61E+00 1.31E+02Unspecified salt g 1.50E-01 1.50E-01Uranium g 7.90E-07 6.86E-05 2.56E-04 4.50E-07 -4.39E-10 3.25E-04Vanadium g 3.94E-02 1.18E-01 1.03E-08 4.23E-01 1.76E-03 -4.99E-03 5.77E-01VOC, coal heating g 2.20E-03 1.58E-02 1.63E-07 4.04E-02 2.11E-03 -2.91E-04 6.02E-02VOC, diesel engines g 1.09E+00 3.23E-01 2.24E-07 1.12E+00 2.90E-03 -1.08E-02 2.52E+00VOC, natural gasheating
g 4.69E-01 7.20E-03 1.82E-07 3.15E-09 4.67E-02 -6.86E-02 4.54E-01
VOC, oil heating g 1.77E-01 6.21E-03 5.52E-03 -2.26E-02 1.66E-01Volatile organiccompounds (VOC)
g 4.39E-01 3.67E-03 4.43E-01
Zinc g 3.88E-03 1.34E-02 6.28E-09 4.39E-02 1.42E-04 -5.25E-04 6.07E-02
TABLE 8-G: WATER EMISSIONS, CONTROL UNIT W/O PACKAGING
Water emission Unit Materialproduction
Manufacture
Distribution
Use Disposal Credit forrecycling
Total
Aluminium g 1.45E-03 9.04E-03 4.82E-09 3.20E-02 6.06E-05 -1.91E-04 4.24E-02Ammonia g 3.45E-04 1.59E-02 5.68E-05 -4.87E-05 1.62E-02Ammonium-N(NH4+-N)
g 1.54E-02 1.27E-01 7.14E-05 4.65E-01 8.61E-04 -1.02E-03 6.08E-01

LCA Study (Version 1.2), EU Ecolabels for Personal Computers, March 1998Atlantic Consulting and IPU
69
Arsenic (As) g 8.35E-03 8.65E-04 9.69E-04 1.24E-03 -1.17E-03 1.03E-02Biological oxygendemand (BOD)
g 8.46E-02 1.00E-02 4.46E-04 4.09E-03 1.72E-04 -1.21E-03 9.82E-02
Cadmium g 4.19E-03 1.20E-03 4.70E-04 6.28E-04 -5.89E-04 5.90E-03Calcium g 5.57E-02 4.04E-03 8.29E-03 -7.83E-03 6.02E-02Chemical oxygendemand (COD)
g 1.70E+00 4.39E+00 8.92E-04 8.18E-03 8.51E-02 -8.22E-02 6.11E+00
Chlorate (ClO3-) g 1.47E-03 1.27E-01 4.75E-01 8.36E-04 -8.15E-07 6.05E-01Chloride (Cl-) g 3.76E+01 1.99E+02 9.62E-04 7.17E+02 1.46E+00 -2.95E+00 9.53E+02Chromium g 9.74E-02 2.08E-04 1.58E-04 -1.47E-02 8.31E-02Chromium(III) g 2.45E-05 2.02E-03 7.01E-03 1.28E-05 -4.16E-07 9.07E-03Copper g 3.28E-02 9.58E-02 2.34E-02 -4.66E-03 1.47E-01Dissolved organiccarbon (DOC)
g 4.11E-01 2.94E-03 1.22E-08 2.11E-10 2.38E-03 -4.93E-03 4.11E-01
Ethylene diaminetetraacetic acid(EDTA)
g 7.26E+00 1.53E+00 8.79E+00
Fluoride (F-) g 5.55E-03 1.37E+00 1.45E-08 1.93E-01 4.16E-04 -6.95E-04 1.56E+00Formaldehyde g 5.88E-01 5.88E-01Hydrocarbons g 3.13E-01 4.45E-02 1.78E-03 2.97E-02 1.30E-03 -1.53E-02 3.75E-01Hydrogen chloride g 1.05E+01 1.05E+01Hydrogen cyanide g 9.67E-03 9.67E-03Hydrogen ions (H+) g 2.46E-01 1.00E-01 2.68E-03 2.45E-02 5.79E-03 -1.61E-02 3.63E-01Hydrogenbromide g 3.92E-01 3.92E-01Iron g 5.19E+00 1.79E+01 3.19E-08 6.66E+01 4.87E-01 -7.38E-01 8.95E+01Lead g 2.98E-03 3.78E-03 3.52E-03 1.03E-03 -4.46E-04 1.09E-02Manganese g 1.47E-03 9.93E-03 4.82E-09 3.20E-02 6.38E-05 -1.93E-04 4.33E-02Mercury g 2.46E-07 1.13E-05 4.04E-08 -3.48E-08 1.15E-05Nickel g 1.05E-01 1.92E-03 4.82E-10 6.09E-03 3.23E-02 -1.58E-02 1.29E-01Nitrate-N (NO3--N) g 2.53E-03 5.67E-04 2.23E-05 2.48E-04 2.28E-05 -1.58E-04 3.23E-03Phenol g 8.25E-04 7.35E-05 3.05E-10 5.27E-12 5.95E-05 -1.20E-04 8.38E-04Phosphate (PO4---) g 1.34E-03 1.42E+00 2.35E-02 4.13E-05 -4.03E-08 1.44E+00Polycyclic aromatichydrocarbons (PAH)
g 1.01E-02 -1.36E-03 8.72E-03
Radioactivity KBQ 3.42E-02 2.97E+00 1.11E+01 1.95E-02 -1.90E-05 1.41E+01Selenium g 9.28E-05 6.73E-06 1.38E-05 -1.30E-05 1.00E-04Silicate ion g 4.38E+00 4.38E+00Sodium ion (Na+) g 1.45E+00 3.48E+00 9.46E-02 -8.94E-02 4.94E+00Strontium g 7.27E-03 4.52E-02 2.41E-08 1.60E-01 3.03E-04 -9.53E-04 2.12E-01Sulphate g 1.11E+01 1.20E+02 1.14E-03 4.33E+02 7.83E-01 -1.18E+00 5.64E+02Suspended solids(SS)
g 1.73E+00 4.40E-01 5.35E-03 5.26E-01 7.32E-03 -6.49E-02 2.65E+00
Total N g 2.69E-03 2.34E-01 8.72E-01 1.53E-03 -1.50E-06 1.11E+00Total organic carbon(TOC)
g 1.64E-04 7.54E-03 2.70E-05 -2.31E-05 7.71E-03
Total P g 3.71E-02 3.71E-02Unspecified anionicdetergent
g 6.61E-01 6.61E-01
Unspecifiedchlorinated org.comp.
g 3.56E-03 3.56E-03
Unspecified coolingagent/lubricant
g 2.98E-04 1.37E-02 4.90E-05 -4.20E-05 1.40E-02
Unspecifieddissolved matter
g 3.84E+00 9.18E+00 4.84E-06 3.20E+01 3.50E-01 -4.67E-01 4.49E+01

LCA Study (Version 1.2), EU Ecolabels for Personal Computers, March 1998Atlantic Consulting and IPU
70
Unspecified ironoxides
g 4.67E+00 9.99E-03 1.28E-06 -7.05E-01 3.98E+00
Unspecified metals g 5.30E-01 1.08E-02 4.46E-04 4.09E-03 7.66E-04 -2.28E-03 5.44E-01Unspecified N g 1.13E-02 2.00E-03 8.92E-05 8.18E-04 3.43E-05 -2.17E-04 1.41E-02Unspecifiednonionic detergents
g 8.79E-02 8.79E-02
Unspecified oil g 1.86E-01 2.15E+00 2.14E-08 7.94E+00 1.81E-02 -8.61E-03 1.03E+01Unspecified org.compounds
g 2.78E-02 1.61E+00 6.02E+00 1.06E-02 -1.03E-05 7.67E+00
Unspecified oxides g 3.88E+00 8.31E-03 1.06E-06 -5.86E-01 3.31E+00Unspecified salt g 4.26E+00 4.00E+01 5.31E-07 1.49E+02 2.62E-01 -5.41E-01 1.93E+02Unspecifiedsubstance
g 1.65E-01 4.79E+00 5.40E-09 9.34E-11 2.38E-02 -2.33E-02 4.95E+00
Water g 5.97E+02 2.35E+06 7.78E-03 1.35E-04 4.35E+01 -6.40E-07 2.35E+06Zinc g 3.76E-02 5.89E-02 4.82E-10 1.37E-01 3.85E-03 -5.38E-03 2.31E-01
TABLE 8-H: WASTE, CONTROL UNIT W/O PACKAGING
Waste Unit Materialproduction
Manufacture
Distribution
Use Disposal Credit forrecycling
Total
Aluminium g 3.07E-01 3.07E-01Aluminium oxide g 2.87E+00 2.87E+00Chromium-rich slags kg 1.22E-03 1.22E-03Copper chloride kg 1.36E-04 1.36E-04Dolomite g 3.53E+00 1.63E+02 5.82E-01 -4.99E-01 1.66E+02Glass tissue,reinforced withepoxy
kg 1.36E-03 1.36E-03
HCl in slag andashes
kg 2.70E-02 2.70E-02
Iron g 4.57E-01 4.57E-01Iron-rich oven slag kg 8.45E-01 1.81E-03 1.01E-01 -1.27E-01 8.21E-01Lead kg 2.91E-03 2.91E-03Mineral waste kg 3.07E-03 4.48E-03 1.96E-04 1.67E-03 3.84E-05 -3.11E-04 9.15E-03PWB laminate, FR4 kg 2.73E-02 5.42E-02 8.15E-02Quartz g 1.49E+00 3.19E-03 4.09E-07 -2.25E-01 1.27E+00Sand (SiO2) g 1.41E+01 -1.91E+00 1.22E+01Slags containingmanganese
kg 2.48E-02 5.30E-05 6.79E-09 -3.73E-03 2.11E-02
Sodium hydroxide kg 2.34E+00 2.34E+00Sodium hydroxide g 3.93E+00 -5.32E-01 3.40E+00Soil and sandcontaining heavymetals
kg 4.20E-03 4.20E-03
Tin kg 4.89E-03 4.89E-03Unspecified bauxitwaste
kg 5.39E-01 -7.30E-02 4.66E-01
Unspecified bulkwaste
kg 8.90E-01 4.76E+00 2.76E-06 1.68E+01 5.51E+00 -1.04E-01 2.79E+01
Unspecifiedchemical waste
kg 2.12E-02 3.27E-04 1.52E-05 1.29E-04 2.63E-06 -1.40E-05 2.16E-02
Unspecified dustwith heavy metalcontent
kg 3.00E-03 3.00E-03
Unspecifiedhazardous waste
kg 7.53E-03 1.41E+00 6.56E-13 2.29E+00 4.03E-03 -6.47E-06 3.71E+00

LCA Study (Version 1.2), EU Ecolabels for Personal Computers, March 1998Atlantic Consulting and IPU
71
Unspecifiedindustrial waste
kg 1.09E-01 1.02E+01 2.77E-05 1.79E+01 3.15E-02 -7.40E-03 2.82E+01
Unspecifiedradioactive waste
g 1.87E-01 3.06E+00 5.67E-09 1.13E+01 2.02E-02 -2.21E-02 1.46E+01
Unspecified rubber kg 2.53E-05 1.81E-03 9.12E-04 1.96E-05 1.24E-04 -9.32E-08 2.89E-03Unspecified salt g 7.64E+00 7.64E+00Unspecified slag andashes
kg 2.80E-04 2.43E-02 9.06E-02 1.59E-04 -1.56E-07 1.15E-01
Unspecified slag andashes fromincineration
kg 6.83E-06 2.31E-05 1.45E-05 2.50E-07 5.27E-01 -1.19E-09 5.27E-01
Unspecified slag andashes, energy
kg 2.92E-01 1.05E+00 2.23E-04 3.74E+00 9.75E-03 -3.96E-02 5.05E+00
Unspecified slagsfrom oven
kg 1.06E-03 3.71E-02 -1.43E-04 3.80E-02
Unspecified sludge kg 1.35E-05 1.85E-02 7.78E-10 4.36E-03 1.20E-05 -7.49E-09 2.29E-02Unspecified slugdewith heavy metalcontent
kg 2.33E-02 1.93E-03 2.53E-02
Unspecified wastefrom steelproduction(hazardous)
kg 7.66E-03 7.66E-03
Unspecified wastefrom steelproduction (nonhazardous)
kg 7.71E-01 1.65E-03 1.38E-03 -1.16E-01 6.58E-01
Zinc-rich dust kg 1.18E-02 1.18E-02
8.3. Keyboard
TABLE 8-I: RESOURCE CONSUMPTION, KEYBOARD W/O PACKAGING.
Resources Unit Materialproduction
Manufacture
Distribution
Use Disposal Credit forrecycling
Total
Aluminium g 1.62E-01 1.51E-02 1.01E-03 8.14E-04 -1.86E-03 1.77E-01Calcium carbonate g 5.66E+01 2.36E-02 2.86E-03 8.92E+00 -6.89E+00 5.86E+01Clay g 1.37E+01 4.75E-03 3.78E-04 7.62E-05 -2.58E-04 1.37E+01Copper g 4.36E+01 2.50E+00 -5.57E+00 4.06E+01Crude oil, fuel g 3.55E+02 1.85E+02 1.29E+01 3.48E+00 -9.13E+00 5.47E+02Crude oil, rawmaterial
g 4.48E+02 5.74E-02 4.45E-02 5.13E-03 -1.23E-06 4.48E+02
Ground water g 7.44E-03 1.53E-02 1.19E-02 6.73E+01 -3.27E-07 6.73E+01Hard coal, cleaned.fuel
g 1.85E+02 1.73E+00 6.17E-02 3.83E-01 -2.18E+01 1.65E+02
Hard coal,uncleaned, fuel
g 9.94E+01 1.14E+03 1.17E-03 5.19E+00 -1.19E+01 1.23E+03
Iron g 2.73E+02 1.32E-02 1.06E-03 7.07E-03 -4.05E+01 2.33E+02Lead g 5.05E-01 -3.90E-02 4.66E-01Lignite, fuel g 3.31E+01 1.07E+02 1.96E-06 3.49E+00 -3.50E+00 1.40E+02Manganese g 1.76E+00 7.72E-05 6.29E-06 9.37E-07 -2.62E-01 1.50E+00Natural gas, fuel g 3.42E+02 3.97E+01 7.77E-01 3.95E+00 -6.73E+00 3.80E+02Natural gas, rawmaterial
g 4.13E+02 4.13E+02
Quartz g 1.33E+01 -6.94E-02 1.32E+01Reservoir water g 7.65E+04 8.90E+04 1.58E+01 2.13E+03 -3.84E+03 1.64E+05Sodium chloride g 3.24E+01 9.87E+00 1.76E-03 1.27E-03 -2.96E-03 4.23E+01
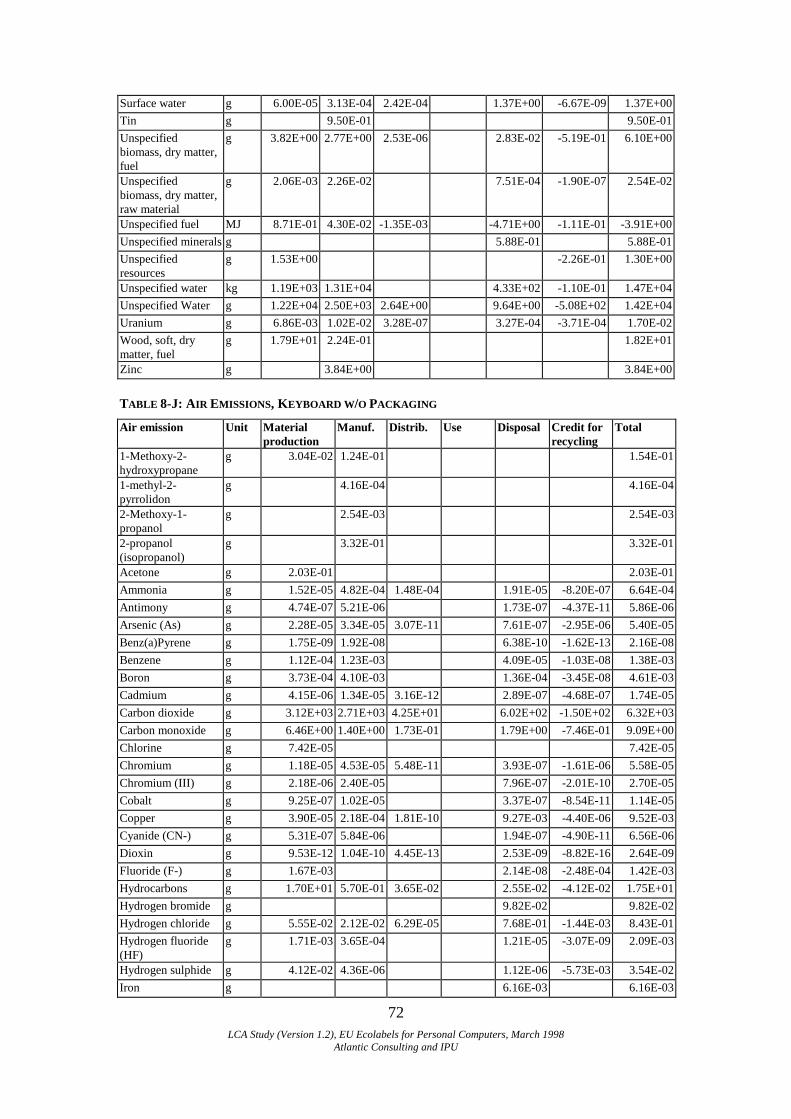
LCA Study (Version 1.2), EU Ecolabels for Personal Computers, March 1998Atlantic Consulting and IPU
72
Surface water g 6.00E-05 3.13E-04 2.42E-04 1.37E+00 -6.67E-09 1.37E+00Tin g 9.50E-01 9.50E-01Unspecifiedbiomass, dry matter,fuel
g 3.82E+00 2.77E+00 2.53E-06 2.83E-02 -5.19E-01 6.10E+00
Unspecifiedbiomass, dry matter,raw material
g 2.06E-03 2.26E-02 7.51E-04 -1.90E-07 2.54E-02
Unspecified fuel MJ 8.71E-01 4.30E-02 -1.35E-03 -4.71E+00 -1.11E-01 -3.91E+00Unspecified minerals g 5.88E-01 5.88E-01Unspecifiedresources
g 1.53E+00 -2.26E-01 1.30E+00
Unspecified water kg 1.19E+03 1.31E+04 4.33E+02 -1.10E-01 1.47E+04Unspecified Water g 1.22E+04 2.50E+03 2.64E+00 9.64E+00 -5.08E+02 1.42E+04Uranium g 6.86E-03 1.02E-02 3.28E-07 3.27E-04 -3.71E-04 1.70E-02Wood, soft, drymatter, fuel
g 1.79E+01 2.24E-01 1.82E+01
Zinc g 3.84E+00 3.84E+00
TABLE 8-J: AIR EMISSIONS, KEYBOARD W/O PACKAGING
Air emission Unit Materialproduction
Manuf. Distrib. Use Disposal Credit forrecycling
Total
1-Methoxy-2-hydroxypropane
g 3.04E-02 1.24E-01 1.54E-01
1-methyl-2-pyrrolidon
g 4.16E-04 4.16E-04
2-Methoxy-1-propanol
g 2.54E-03 2.54E-03
2-propanol(isopropanol)
g 3.32E-01 3.32E-01
Acetone g 2.03E-01 2.03E-01Ammonia g 1.52E-05 4.82E-04 1.48E-04 1.91E-05 -8.20E-07 6.64E-04Antimony g 4.74E-07 5.21E-06 1.73E-07 -4.37E-11 5.86E-06Arsenic (As) g 2.28E-05 3.34E-05 3.07E-11 7.61E-07 -2.95E-06 5.40E-05Benz(a)Pyrene g 1.75E-09 1.92E-08 6.38E-10 -1.62E-13 2.16E-08Benzene g 1.12E-04 1.23E-03 4.09E-05 -1.03E-08 1.38E-03Boron g 3.73E-04 4.10E-03 1.36E-04 -3.45E-08 4.61E-03Cadmium g 4.15E-06 1.34E-05 3.16E-12 2.89E-07 -4.68E-07 1.74E-05Carbon dioxide g 3.12E+03 2.71E+03 4.25E+01 6.02E+02 -1.50E+02 6.32E+03Carbon monoxide g 6.46E+00 1.40E+00 1.73E-01 1.79E+00 -7.46E-01 9.09E+00Chlorine g 7.42E-05 7.42E-05Chromium g 1.18E-05 4.53E-05 5.48E-11 3.93E-07 -1.61E-06 5.58E-05Chromium (III) g 2.18E-06 2.40E-05 7.96E-07 -2.01E-10 2.70E-05Cobalt g 9.25E-07 1.02E-05 3.37E-07 -8.54E-11 1.14E-05Copper g 3.90E-05 2.18E-04 1.81E-10 9.27E-03 -4.40E-06 9.52E-03Cyanide (CN-) g 5.31E-07 5.84E-06 1.94E-07 -4.90E-11 6.56E-06Dioxin g 9.53E-12 1.04E-10 4.45E-13 2.53E-09 -8.82E-16 2.64E-09Fluoride (F-) g 1.67E-03 2.14E-08 -2.48E-04 1.42E-03Hydrocarbons g 1.70E+01 5.70E-01 3.65E-02 2.55E-02 -4.12E-02 1.75E+01Hydrogen bromide g 9.82E-02 9.82E-02Hydrogen chloride g 5.55E-02 2.12E-02 6.29E-05 7.68E-01 -1.44E-03 8.43E-01Hydrogen fluoride(HF)
g 1.71E-03 3.65E-04 1.21E-05 -3.07E-09 2.09E-03
Hydrogen sulphide g 4.12E-02 4.36E-06 1.12E-06 -5.73E-03 3.54E-02Iron g 6.16E-03 6.16E-03

LCA Study (Version 1.2), EU Ecolabels for Personal Computers, March 1998Atlantic Consulting and IPU
73
Lead g 6.48E-05 4.56E-04 8.67E-11 1.23E-04 -3.30E-05 6.11E-04Magnesium g 1.11E-04 1.21E-03 4.03E-05 -1.02E-08 1.36E-03Manganese g 4.02E-02 2.08E-05 6.90E-07 -5.96E-03 3.42E-02Mercury g 6.56E-06 4.49E-05 2.70E-11 9.12E-07 -6.39E-07 5.18E-05Methane g 7.80E-01 8.84E+00 2.64E-03 4.02E-02 -9.25E-02 9.57E+00Molybdenum g 5.19E-07 5.71E-06 1.90E-07 -4.80E-11 6.42E-06N.N-Dimethylformamide
g 1.01E-03 1.01E-03
Nickel g 7.17E-04 4.15E-04 4.46E-11 2.26E-05 -8.38E-05 1.07E-03Nitrogen oxides(NOx)
g 1.63E+01 1.22E+01 5.45E-01 5.10E-01 -3.82E-01 2.91E+01
Nitrous oxide g 2.30E-02 7.77E-02 1.69E-03 2.30E-03 -3.05E-03 1.02E-01NMVOC, aircraftengines
g 1.41E-02 1.41E-02
NMVOC, base loadel
g 7.73E-04 8.50E-03 2.82E-04 -7.14E-08 9.56E-03
NMVOC, dieselengines
g 1.83E-01 3.18E-01 9.00E-02 1.24E-02 -2.42E-02 5.79E-01
NMVOC, naturalgas heating
g 1.18E-04 1.30E-03 4.30E-05 -1.09E-08 1.46E-03
NMVOC, oil heating g 1.60E-02 1.75E-01 5.82E-03 -1.47E-06 1.97E-01NMVOC, petrolengines
g 3.25E-04 3.52E-05 2.46E-09 1.99E-05 -4.74E-05 3.33E-04
NMVOC, powerplants
g 8.98E-03 3.37E-02 3.61E-08 2.44E-04 -1.22E-03 4.17E-02
Polycyclic aromatichydrocarbons (PAH)
g 2.05E-06 1.67E-05 1.35E-12 5.86E-07 -6.89E-08 1.93E-05
Radioactivity KBQ 7.64E+01 8.40E+02 2.79E+01 -7.05E-03 9.44E+02Selenium g 1.34E-05 2.85E-04 2.50E-10 3.58E-06 -1.08E-06 3.00E-04Strontium g 3.86E-06 4.24E-05 1.41E-06 -3.56E-10 4.77E-05Styrene g 4.16E-03 4.16E-03Sulphur dioxide g 1.70E+01 1.39E+01 7.28E-02 2.37E-01 -4.14E-01 3.08E+01Thallium g 1.05E-08 1.16E-07 3.84E-09 -9.72E-13 1.30E-07Thorium g 6.10E-08 6.71E-07 2.23E-08 -5.63E-12 7.54E-07Tin g 8.54E-08 9.39E-07 3.12E-08 -7.89E-12 1.06E-06Toluene g 2.79E-05 3.06E-04 1.02E-05 -2.57E-09 3.44E-04Total P g 2.49E-06 2.73E-05 9.07E-07 -2.30E-10 3.07E-05Unspecifiedaldehydes
g 2.63E-06 2.56E-05 5.77E-10 4.59E-06 -3.20E-07 3.25E-05
Unspecifiedchlorinated org.comp.
g 2.67E-02 2.67E-02
Unspecified heavymetals
g 2.93E-08 8.08E-06 3.22E-14 6.27E-07 -6.28E-07 8.11E-06
Unspecified metals g 4.39E-03 1.58E-04 1.26E-05 2.54E-06 -8.61E-06 4.55E-03Unspecifiedmethylstyrene
g 8.47E-04 8.47E-04
Unspecified n-alkanes
g 3.31E-03 3.31E-03
Unspecified org.compounds
g 8.44E-04 5.11E-05 1.15E-09 9.17E-06 -6.40E-07 9.03E-04
Unspecified particles g 2.52E+00 1.27E+00 5.66E-02 2.50E-02 -6.81E-02 3.81E+00Unspecifiedsubstance
g 5.54E-04 5.54E-04
Uranium g 5.86E-08 6.44E-07 2.14E-08 -5.41E-12 7.24E-07Vanadium g 2.23E-03 2.49E-03 1.46E-09 7.84E-05 -2.61E-04 4.54E-03VOC, coal heating g 1.05E-04 1.02E-03 2.31E-08 1.83E-04 -1.28E-05 1.30E-03

LCA Study (Version 1.2), EU Ecolabels for Personal Computers, March 1998Atlantic Consulting and IPU
74
VOC, diesel engines g 5.13E-02 3.16E-02 3.17E-08 1.64E-04 -4.41E-04 8.26E-02VOC, natural gasheating
g 2.34E-02 7.18E-04 2.57E-08 2.36E-03 -3.32E-03 2.32E-02
VOC, oil heating g 9.78E-03 2.96E-04 1.95E-04 -1.16E-03 9.11E-03Volatile organiccompounds (VOC)
g 3.26E-02 4.07E-04 3.30E-02
Zinc g 1.44E-04 8.91E-04 8.89E-10 9.79E-06 -1.82E-05 1.03E-03
TABLE 8-K: WATER EMISSIONS, KEYBOARD W/O PACKAGING
Water emission Unit Materialproduction
Manufacture
Distribution
Use Disposal Credit forrecycling
Total
Aluminium g 6.03E-05 6.97E-04 6.83E-10 2.86E-06 -7.21E-06 7.53E-04Ammonia g 3.56E-04 3.56E-04Ammonium-N(NH4+-N)
g 1.72E-02 1.82E-03 1.01E-05 4.18E-05 -4.75E-05 1.91E-02
Arsenic (As) g 7.96E-04 4.75E-05 1.00E-04 -1.00E-04 8.43E-04Biological oxygendemand (BOD)
g 7.64E-02 7.92E-04 6.29E-05 1.27E-05 -4.89E-05 7.72E-02
Cadmium g 3.98E-04 4.10E-05 5.01E-05 -5.01E-05 4.39E-04Calcium g 5.30E-03 3.00E-04 6.68E-04 -6.68E-04 5.60E-03Chemical oxygendemand (COD)
g 7.79E-01 1.00E-01 1.26E-04 5.62E-03 -5.68E-03 8.80E-01
Chlorate (ClO3-) g 1.09E-04 1.20E-03 3.97E-05 -1.00E-08 1.34E-03Chloride (Cl-) g 2.93E+00 1.08E+01 1.36E-04 7.32E-02 -1.18E-01 1.37E+01Chromium g 4.74E-03 -7.03E-04 4.04E-03Chromium(III) g 1.61E-06 2.12E-05 5.86E-07 -1.48E-10 2.34E-05Copper g 2.92E-03 7.11E-03 7.43E-04 -3.72E-04 1.04E-02Dissolved organiccarbon (DOC)
g 6.23E-02 4.96E-04 1.72E-09 1.22E-04 -2.34E-04 6.26E-02
Ethylene diaminetetraacetic acid(EDTA)
g 5.39E-01 5.39E-01
Fluoride (F-) g 2.03E-04 1.27E-01 2.05E-09 1.67E-05 -2.16E-05 1.27E-01Formaldehyde g 4.37E-02 4.37E-02Hydrocarbons g 2.22E-01 3.32E-03 2.52E-04 8.25E-05 -6.99E-04 2.25E-01Hydrogen chloride g 1.09E+00 1.09E+00Hydrogen cyanide g 9.26E-04 9.26E-04Hydrogen ions (H+) g 9.89E-02 9.02E-03 3.78E-04 3.21E-04 -7.26E-04 1.08E-01Hydrogenbromide g 1.42E-01 1.42E-01Iron g 2.15E-01 1.72E-01 4.51E-09 2.34E-02 -2.96E-02 3.81E-01Lead g 1.47E-04 7.27E-05 1.12E-05 -2.14E-05 2.09E-04Manganese g 6.03E-05 7.17E-04 6.83E-10 2.86E-06 -7.21E-06 7.73E-04Mercury g 6.10E-11 2.53E-07 -9.05E-12 2.53E-07Nickel g 5.09E-03 7.80E-05 6.83E-11 2.75E-06 -7.55E-04 4.42E-03Nitrate-N (NO3--N) g 5.09E-03 4.25E-05 3.15E-06 1.14E-06 -7.51E-06 5.13E-03Phenol g 4.18E-05 1.24E-05 4.31E-11 3.05E-06 -5.85E-06 5.14E-05Phosphate (PO4---) g 5.04E-03 1.35E-01 1.96E-06 -4.97E-10 1.40E-01Radioactivity KBQ 2.54E-03 2.79E-02 9.25E-04 -2.34E-07 3.13E-02Selenium g 8.84E-06 5.00E-07 1.11E-06 -1.11E-06 9.34E-06Silicate ion g 4.19E-01 4.19E-01Sodium ion (Na+) g 1.46E-01 3.33E-01 7.62E-03 -7.62E-03 4.79E-01Strontium g 3.01E-04 3.49E-03 3.41E-09 1.43E-05 -3.61E-05 3.76E-03Sulphate g 5.53E-01 1.50E+00 1.62E-04 3.69E-02 -4.17E-02 2.05E+00

LCA Study (Version 1.2), EU Ecolabels for Personal Computers, March 1998Atlantic Consulting and IPU
75
Suspended solids(SS)
g 4.28E-01 2.46E-02 7.55E-04 4.04E-04 -7.07E-04 4.53E-01
Total N g 2.00E-04 2.20E-03 7.29E-05 -1.84E-08 2.47E-03Total organic carbon(TOC)
g 1.69E-04 1.69E-04
Unspecified anionicdetergent
g 6.32E-02 6.32E-02
Unspecifiedchlorinated org.comp.
g 3.71E-04 3.71E-04
Unspecified coolingagent/lubricant
g 3.07E-04 3.07E-04
Unspecifieddissolved matter
g 6.49E-01 7.07E-01 6.85E-07 2.61E-02 -3.05E-02 1.35E+00
Unspecified ironoxides
g 2.27E-01 -3.37E-02 1.94E-01
Unspecified metals g 4.78E-01 9.15E-04 6.29E-05 4.32E-05 -1.02E-04 4.79E-01Unspecified N g 9.42E-03 1.58E-04 1.26E-05 2.54E-06 -8.61E-06 9.58E-03Unspecified oil g 9.89E-02 2.09E-02 3.02E-09 8.78E-04 -4.20E-04 1.20E-01Unspecified org.compounds
g 3.83E-02 1.52E-02 5.03E-04 -1.27E-07 5.39E-02
Unspecified oxides g 1.89E-01 -2.81E-02 1.61E-01Unspecified salt g 1.22E-01 4.43E-01 7.51E-08 1.25E-02 -1.30E-02 5.64E-01Unspecifiedsubstance
g 5.12E-03 1.08E-01 7.64E-10 5.42E-04 -6.53E-04 1.13E-01
Water g 4.43E+01 2.59E+01 1.10E-03 6.24E+00 -3.03E-08 7.65E+01Zinc g 2.81E-03 1.99E-03 6.83E-11 2.63E-04 -3.67E-04 4.69E-03
TABLE 8-L: WASTE, KEYBOARD W/O PPACKAGING
Waste Unit Materialproduction
Manufacture
Distribution
Use Disposal Credit forrecycling
Total
Copper chloride kg 1.01E-05 1.01E-05Dolomite g 3.65E+00 3.65E+00Glass tissue,reinforced withepoxy
kg 1.01E-04 1.01E-04
HCl in slag andashes
kg 2.81E-03 2.81E-03
Iron-rich oven slag kg 4.11E-02 4.90E-03 -6.10E-03 3.99E-02Mineral waste kg 1.16E-04 3.87E-04 2.77E-05 4.57E-06 -1.02E-05 5.25E-04PWB laminate, FR4 kg 2.03E-03 1.31E-03 3.34E-03Quartz g 7.27E-02 -1.08E-02 6.19E-02Slags containingmanganese
kg 1.21E-03 -1.79E-04 1.03E-03
Soil and sandcontaining heavymetals
kg 2.03E-04 2.03E-04
Unspecified bulkwaste
kg 6.02E-02 3.67E-01 3.91E-07 8.71E-01 -3.96E-03 1.29E+00
Unspecifiedchemical waste
kg 1.24E-02 2.65E-05 2.14E-06 3.21E-07 -2.84E-07 1.25E-02
Unspecified dustwith heavy metalcontent
kg 1.31E-04 1.31E-04
Unspecifiedhazardous waste
kg 5.94E-04 1.81E-02 9.28E-14 1.91E-04 -1.77E-07 1.89E-02

LCA Study (Version 1.2), EU Ecolabels for Personal Computers, March 1998Atlantic Consulting and IPU
76
Unspecifiedindustrial waste
kg 4.47E-03 4.51E-02 3.90E-06 1.50E-03 -5.25E-05 5.10E-02
Unspecifiedradioactive waste
g 1.05E-02 2.99E-02 8.03E-10 9.66E-04 -1.11E-03 4.03E-02
Unspecified rubber kg 1.89E-06 2.07E-04 1.29E-04 1.64E-05 -4.41E-09 3.54E-04Unspecified slag andashes
kg 2.08E-05 2.28E-04 7.58E-06 -1.92E-09 2.57E-04
Unspecified slag andashes fromincineration
kg 5.07E-07 2.64E-06 2.05E-06 2.32E-02 -5.64E-11 2.32E-02
Unspecified slag andashes, energy
kg 9.03E-03 6.01E-02 3.15E-05 6.89E-04 -1.15E-03 6.87E-02
Unspecified slagsfrom oven
kg 1.79E-03 1.79E-03
Unspecified sludge kg 1.00E-06 1.10E-05 1.10E-10 9.89E-07 -9.23E-11 1.30E-05Unspecified slugdewith heavy metalcontent
kg 2.11E-03 9.34E-05 2.20E-03
Unspecified wastefrom steelproduction(hazardous)
kg 3.70E-04 3.70E-04
Unspecified wastefrom steelproduction (nonhazardous)
kg 3.75E-02 6.68E-05 -5.57E-03 3.20E-02
Zinc-rich dust kg 5.72E-04 5.72E-04
8.4. Monitor
TABLE 8-M: RESOURCE CONSUMPTION, MONITOR W/O PACKAGING
Resources Unit Materialproduction
Manufacture
Distribution
Use Disposal Credit forrecycling
Total
Aluminium g 6.61E+01 2.69E+00 1.03E-02 1.09E-01 5.62E-03 -6.92E+00 6.20E+01Calcium carbonate g 4.34E+02 4.69E-01 2.93E-02 1.91E-01 7.36E+01 -3.21E+01 4.76E+02Chromium g 4.21E+01 4.21E+01Clay g 5.17E+02 5.46E-02 3.87E-03 4.09E-02 9.61E-04 -2.66E-03 5.17E+02Copper g 6.62E+02 9.04E+00 -9.84E+01 5.72E+02Crude oil, fuel g 1.81E+03 3.85E+03 1.33E+02 1.57E+04 3.68E+01 -9.29E+01 2.14E+04Crude oil, rawmaterial
g 1.47E+03 5.85E-01 4.55E-01 9.07E-03 5.23E-02 -1.65E-05 1.47E+03
Ground water g 2.65E-02 6.23E+05 1.21E-01 2.42E-03 6.60E+02 -4.41E-06 6.23E+05Hard coal, cleaned.fuel
g 5.72E+02 1.10E+01 6.32E-01 6.20E+00 2.19E+00 -9.84E+01 4.94E+02
Hard coal,uncleaned, fuel
g 1.45E+03 1.09E+04 1.20E-02 8.77E+04 2.85E+01 -1.63E+02 1.00E+05
Iron g 9.67E+02 1.33E+00 1.08E-02 1.13E-01 3.14E-02 -1.82E+02 7.87E+02Lead g 5.02E+02 5.11E+00 -1.97E+00 5.05E+02Lignite, fuel g 1.90E+02 6.82E+03 2.01E-05 6.97E+04 1.49E+01 -2.31E+01 7.67E+04Manganese g 9.54E+00 8.48E-03 6.45E-05 6.33E-04 1.16E-05 -1.17E+00 8.37E+00Natural gas, fuel g 1.39E+03 1.47E+04 7.96E+00 1.11E+04 2.06E+01 -4.94E+01 2.72E+04Natural gas, rawmaterial
g 1.33E+03 1.33E+03
Nickel g 2.46E+01 2.46E+01Quartz g 3.66E+03 2.01E-03 5.35E-07 -3.11E-01 3.66E+03Reservoir water g 9.80E+05 3.63E+06 1.62E+02 3.62E+07 1.20E+04 -8.92E+04 4.08E+07

LCA Study (Version 1.2), EU Ecolabels for Personal Computers, March 1998Atlantic Consulting and IPU
77
Sodium chloride g 2.80E+02 4.08E+00 1.81E-02 1.91E-01 5.31E-01 -9.53E-01 2.84E+02Surface water g 2.09E-04 1.27E+04 2.47E-03 4.94E-05 1.35E+01 -9.00E-08 1.27E+04Tin g 9.02E+00 9.02E+00Titanium dioxide g 1.90E+01 1.90E+01Unspecifiedbiomass, dry matter,fuel
g 1.00E+02 6.94E+00 2.58E-05 5.16E-07 4.07E-01 -1.13E+01 9.63E+01
Unspecifiedbiomass, dry matter,raw material
g 7.77E-03 1.47E+00 1.50E+01 3.19E-03 -9.57E-06 1.64E+01
Unspecified fuel MJ 1.17E+01 1.51E-01 -1.38E-02 1.07E-03 -1.47E+01 -1.76E+00 -4.60E+00Unspecified minerals g 2.47E+00 2.47E+00Unspecifiedresources
g 1.07E+01 6.56E-03 1.74E-06 -1.02E+00 9.70E+00
Unspecified water kg 4.48E+03 8.45E+05 8.63E+06 1.84E+03 -5.52E+00 9.48E+06Unspecified Water g 7.11E+04 1.89E+05 2.71E+01 2.86E+02 1.80E+02 -5.18E+03 2.55E+05Uranium g 5.07E-02 6.27E-01 3.36E-06 6.40E+00 1.49E-03 -3.75E-03 7.07E+00Wood, soft, drymatter, fuel
g 6.48E+01 3.80E+00 6.86E+01
Zinc g 2.22E+01 -3.75E-01 2.18E+01
TABLE 8-N: AIR EMISSIONS, MONITOR W/O PACKAGING
Air emission Unit Materialproduction
Manufacture
Distribution
Use Disposal Credit forrecycling
Total
1-Methoxy-2-hydroxypropane
g 1.10E-01 4.47E-01 5.57E-01
1-methyl-2-pyrrolidon
g 1.62E-03 1.62E-03
2-Methoxy-1-propanol
g 9.16E-03 9.16E-03
2-propanol(isopropanol)
g 1.20E+00 1.20E+00
Acetone g 7.32E-01 7.32E-01Aluminium g 1.43E-03 1.43E-03Aluminium oxide(Al2O3)
g 1.51E-02 1.51E-02
Ammonia g 2.54E-04 5.54E-03 1.52E-03 1.15E-02 1.92E-04 -1.11E-05 1.89E-02Antimony g 1.79E-06 3.38E-04 3.45E-03 7.35E-07 -2.20E-09 3.79E-03Arsenic (As) g 2.69E-04 9.55E-04 3.13E-10 9.28E-03 5.69E-06 -3.19E-05 1.05E-02Benz(a)Pyrene g 6.61E-09 1.25E-06 1.27E-05 2.71E-09 -8.14E-12 1.40E-05Benzene g 4.24E-04 7.98E-02 8.15E-01 1.74E-04 -5.21E-07 8.96E-01Boron g 1.41E-03 2.66E-01 2.72E+00 5.79E-04 -1.74E-06 2.98E+00Cadmium g 9.46E-05 4.95E-04 3.22E-11 4.74E-03 7.35E-06 -4.98E-06 5.33E-03Carbon dioxide g 1.58E+04 7.24E+04 4.35E+02 2.58E+05 2.49E+03 -1.20E+03 3.47E+05Carbon monoxide g 2.93E+01 4.77E+01 1.77E+00 2.09E+02 6.58E+00 -4.39E+00 2.90E+02Chlorine g 7.24E-04 7.24E-04Chromium g 1.32E-04 1.04E-04 5.59E-10 1.68E-05 4.77E-04 -1.67E-05 7.13E-04Chromium (III) g 8.25E-06 1.55E-03 1.59E-02 3.38E-06 -1.02E-08 1.74E-02Cobalt g 3.50E-06 6.59E-04 6.73E-03 1.43E-06 -4.30E-09 7.39E-03Copper g 3.97E-04 4.39E-03 1.85E-09 4.13E-02 1.44E-01 -4.40E-05 1.90E-01Cyanide (CN-) g 2.01E-06 3.78E-04 3.86E-03 8.23E-07 -2.47E-09 4.25E-03Dioxin g 1.38E-06 6.72E-09 4.55E-12 6.86E-08 2.52E-08 -4.40E-14 1.48E-06Fluoride (F-) g 3.85E-03 7.19E-06 9.10E-08 -1.11E-03 2.75E-03Hydrocarbons g 6.01E+01 3.80E+01 3.74E-01 7.74E+00 2.18E-01 -3.82E-01 1.06E+02

LCA Study (Version 1.2), EU Ecolabels for Personal Computers, March 1998Atlantic Consulting and IPU
78
Hydrogen bromide g 3.91E-01 3.91E-01Hydrogen chloride g 2.27E-01 1.45E+00 6.45E-04 1.35E+01 7.49E+00 -6.90E-03 2.26E+01Hydrogen fluoride(HF)
g 6.24E-03 2.37E-02 2.42E-01 5.74E-05 -1.54E-07 2.72E-01
Hydrogen sulphide g 9.67E-02 4.49E-04 2.89E-03 4.71E-06 -2.57E-02 7.44E-02Iron g 2.64E-02 2.64E-02Lead g 4.61E-03 6.90E-03 8.86E-10 3.43E-02 6.13E-03 -1.35E-03 5.05E-02Magnesium g 4.17E-04 7.87E-02 8.04E-01 1.71E-04 -5.14E-07 8.83E-01Manganese g 2.17E-01 1.52E-03 1.38E-02 2.98E-06 -2.67E-02 2.06E-01Mercury g 1.14E-04 1.49E-03 2.76E-10 1.47E-02 4.91E-06 -6.55E-06 1.63E-02Methane g 1.11E+01 8.99E+01 2.71E-02 7.43E+02 2.10E-01 -1.24E+00 8.43E+02Molybdenum g 1.96E-06 3.70E-04 3.78E-03 8.05E-07 -2.42E-09 4.15E-03N.N-Dimethylformamide
g 3.66E-03 3.66E-03
Nickel g 5.90E-03 2.23E-02 4.55E-10 2.27E-01 2.68E-04 -7.13E-04 2.54E-01Nitrogen g 1.56E+00 1.56E+00Nitrogen oxides(NOx)
g 9.23E+01 2.03E+02 5.59E+00 7.34E+02 5.10E+00 -4.29E+00 1.04E+03
Nitrous oxide g 1.87E-01 6.21E+00 1.73E-02 9.74E+00 1.40E-02 -2.30E-02 1.61E+01NMVOC, aircraftengines
g 2.17E-01 2.17E-01
NMVOC, base loadel
g 2.92E-03 5.51E-01 5.63E+00 1.20E-03 -3.60E-06 6.18E+00
NMVOC, dieselengines
g 2.38E+00 3.31E+00 9.23E-01 4.09E+00 1.25E-01 -2.83E-01 1.05E+01
NMVOC, naturalgas heating
g 4.45E-04 8.39E-02 8.57E-01 1.83E-04 -5.48E-07 9.41E-01
NMVOC, oil heating g 6.03E-02 1.14E+01 1.16E+02 2.47E-02 -7.42E-05 1.28E+02NMVOC, petrolengines
g 3.34E-02 3.23E-04 2.51E-08 5.01E-10 1.64E-04 -3.26E-04 3.36E-02
NMVOC, powerplants
g 1.67E-01 7.53E-02 3.69E-07 7.36E-09 2.67E-03 -1.91E-02 2.26E-01
Non-methanevolatile organiccompounds(NMVOC)
g 4.59E-01 4.59E-01
Polycyclic aromatichydrocarbons (PAH)
g 3.30E-03 1.16E-03 1.38E-11 1.10E-02 2.64E-06 -3.43E-04 1.51E-02
Radioactivity KBQ 2.89E+02 5.44E+04 5.56E+05 1.18E+02 -3.55E-01 6.11E+05Selenium g 1.25E-04 4.53E-03 2.55E-09 4.14E-02 2.36E-05 -1.24E-05 4.60E-02Strontium g 1.46E-05 2.75E-03 2.81E-02 5.98E-06 -1.79E-08 3.08E-02Styrene g 1.62E-02 1.62E-02Sulphur dioxide g 9.57E+01 2.38E+02 7.46E-01 2.06E+03 2.23E+00 -4.91E+00 2.39E+03Thallium g 3.98E-08 7.50E-06 7.66E-05 1.63E-08 -4.90E-11 8.42E-05Thorium g 2.31E-07 4.35E-05 4.44E-04 9.46E-08 -2.84E-10 4.88E-04Tin g 3.23E-07 1.62E-03 6.22E-04 1.32E-07 -3.97E-10 2.24E-03Toluene g 1.05E-04 1.98E-02 2.03E-01 4.32E-05 -1.30E-07 2.23E-01Total P g 9.40E-06 1.77E-03 1.81E-02 3.86E-06 -1.16E-08 1.99E-02Unspecifiedaldehydes
g 6.47E-05 2.35E-04 5.89E-09 1.68E-03 3.76E-05 -4.44E-06 2.02E-03
Unspecifiedchlorinated org.comp.
g 2.61E-01 2.61E-01
Unspecifiedfluorides
g 5.33E-02 -5.62E-03 4.77E-02
Unspecified heavymetals
g 9.87E-05 9.44E-05 3.29E-13 6.56E-15 3.15E-05 -3.15E-05 1.93E-04

LCA Study (Version 1.2), EU Ecolabels for Personal Computers, March 1998Atlantic Consulting and IPU
79
Unspecified ironoxides
g 4.26E-02 4.26E-02
Unspecified metals g 1.52E-02 1.82E-03 1.29E-04 1.36E-03 3.20E-05 -8.87E-05 1.85E-02Unspecifiedmethylstyrene
g 3.30E-03 3.30E-03
Unspecified n-alkanes
g 1.29E-02 1.29E-02
Unspecified org.compounds
g 2.63E-03 4.70E-04 1.18E-08 3.37E-03 7.52E-05 -8.87E-06 6.53E-03
Unspecified oxides g 5.71E-02 5.71E-02Unspecified particles g 1.20E+01 2.26E+01 5.80E-01 1.43E+02 1.99E-01 -6.34E-01 1.78E+02Unspecified salt g 1.51E-02 1.51E-02Unspecifiedsubstance
g 2.16E-03 2.16E-03
Uranium g 2.21E-07 4.17E-05 4.26E-04 9.08E-08 -2.73E-10 4.68E-04Vanadium g 1.85E-02 7.22E-02 1.49E-08 7.05E-01 9.14E-04 -2.23E-03 7.95E-01VOC, coal heating g 2.59E-03 9.40E-03 2.36E-07 6.73E-02 1.51E-03 -1.77E-04 8.07E-02VOC, diesel engines g 5.11E-01 2.46E-01 3.23E-07 1.86E+00 1.31E-03 -5.38E-03 2.61E+00VOC, natural gasheating
g 1.07E-01 1.02E+01 2.63E-07 5.25E-09 1.10E-02 -1.51E-02 1.03E+01
VOC, oil heating g 5.57E-02 3.22E-04 3.85E-03 -7.49E-03 5.23E-02Volatile organiccompounds (VOC)
g 1.18E-01 6.91E-03 1.25E-01
Zinc g 1.62E-03 8.84E-03 9.08E-09 7.32E-02 8.40E-05 -1.89E-04 8.35E-02
TABLE 8-O: WATER EMISSIONS, MONITOR W/O PACKAGING
Water emission Unit Materialproduction
Manufacture
Distribution
Use Disposal Credit forrecycling
Total
Aluminium g 8.60E-04 6.58E-03 6.97E-09 5.34E-02 1.50E-05 -9.72E-05 6.07E-02Ammonia g 2.23E-04 3.48E-05 -3.48E-05 2.23E-04Ammonium-N(NH4+-N)
g 5.54E-02 7.84E-02 1.03E-04 7.76E-01 2.07E-04 -4.99E-04 9.09E-01
Arsenic (As) g 1.20E-02 3.21E-04 1.61E-03 1.82E-03 -1.77E-03 1.39E-02Biological oxygendemand (BOD)
g 2.58E-01 9.10E-03 6.45E-04 6.81E-03 1.60E-04 -4.72E-04 2.74E-01
Cadmium g 5.98E-03 1.58E-04 7.83E-04 9.11E-04 -8.87E-04 6.95E-03Calcium g 7.96E-02 1.09E-03 1.21E-02 -1.18E-02 8.10E-02Chemical oxygendemand (COD)
g 3.33E+00 2.73E-02 1.29E-03 1.36E-02 1.11E-01 -1.09E-01 3.38E+00
Chlorate (ClO3-) g 4.11E-04 7.75E-02 7.92E-01 1.69E-04 -5.06E-07 8.70E-01Chloride (Cl-) g 3.00E+01 1.37E+02 1.39E-03 1.20E+03 4.99E-01 -1.62E+00 1.36E+03Chromium g 1.09E-02 2.04E-05 9.45E-05 -3.15E-03 7.89E-03Chromium(III) g 7.92E-06 1.14E-03 1.17E-02 2.78E-06 -2.96E-07 1.28E-02Copper g 4.10E-02 2.57E-02 3.51E-02 -6.15E-03 9.56E-02Dissolved organiccarbon (DOC)
g 4.49E-01 5.10E-01 1.76E-08 3.51E-10 6.12E-04 -1.67E-03 9.57E-01
Ethylene diaminetetraacetic acid(EDTA)
g 1.95E+00 1.95E+00
Fluoride (F-) g 2.98E-03 3.56E-02 2.09E-08 3.22E-01 1.18E-04 -3.38E-04 3.60E-01Formaldehyde g 1.58E-01 1.58E-01Hydrocarbons g 7.10E-01 1.66E-01 2.58E-03 4.95E-02 7.98E-04 -4.29E-03 9.25E-01Hydrogen chloride g 1.07E+01 1.07E+01Hydrogen ions (H+) g 3.73E-01 1.07E+00 3.87E-03 4.09E-02 2.18E-03 -5.98E-03 1.49E+00Hydrogenbromide g 5.63E-01 5.63E-01

LCA Study (Version 1.2), EU Ecolabels for Personal Computers, March 1998Atlantic Consulting and IPU
80
Iron g 6.96E-01 1.09E+01 4.60E-08 1.11E+02 1.03E-01 -1.47E-01 1.23E+02Lead g 4.91E-04 5.77E-04 5.87E-03 5.25E-04 -1.17E-04 7.35E-03Manganese g 8.72E-04 6.58E-03 6.97E-09 5.34E-02 1.70E-05 -9.92E-05 6.07E-02Mercury g 1.58E-07 2.62E-13 2.47E-08 -2.47E-08 1.58E-07Nickel g 1.20E-02 1.16E-03 6.97E-10 1.02E-02 2.08E-02 -3.42E-03 4.08E-02Nitrate-N (NO3--N) g 1.56E-02 4.74E-04 3.22E-05 4.14E-04 1.77E-05 -6.92E-05 1.65E-02Phenol g 3.26E-04 1.27E-02 4.40E-10 8.78E-12 1.53E-05 -4.14E-05 1.30E-02Phosphate (PO4---) g 1.50E-02 3.83E-03 3.91E-02 8.34E-06 -2.50E-08 5.80E-02Polycyclic aromatichydrocarbons (PAH)
g 1.30E-03 -1.37E-04 1.16E-03
Radioactivity KBQ 9.58E-03 1.81E+00 1.84E+01 3.93E-03 -1.18E-05 2.03E+01Selenium g 1.33E-04 1.81E-06 2.02E-05 -1.97E-05 1.35E-04Sodium ion (Na+) g 1.74E+00 1.24E-02 1.38E-01 -1.35E-01 1.76E+00Strontium g 4.30E-03 3.29E-02 3.49E-08 2.67E-01 7.50E-05 -4.86E-04 3.04E-01Sulphate g 5.23E+00 7.15E+01 1.65E-03 7.22E+02 1.72E-01 -4.05E-01 7.99E+02Suspended solids(SS)
g 2.05E+00 1.23E+00 7.74E-03 8.77E-01 3.05E-03 -1.18E-02 4.15E+00
Total N g 7.55E-04 1.42E-01 1.45E+00 3.10E-04 -9.29E-07 1.60E+00Total organic carbon(TOC)
g 1.06E-04 1.65E-05 -1.65E-05 1.06E-04
Unspecifiedchlorinated org.comp.
g 3.62E-03 3.62E-03
Unspecified coolingagent/lubricant
g 1.92E-04 3.00E-05 -3.00E-05 1.92E-04
Unspecifieddissolved matter
g 4.98E+00 7.51E+00 6.99E-06 5.34E+01 4.33E-01 -5.06E-01 6.58E+01
Unspecified ironoxides
g 5.24E-01 9.78E-04 2.60E-07 -1.51E-01 3.74E-01
Unspecified metals g 1.56E+00 1.36E-01 6.45E-04 6.81E-03 3.13E-04 -8.58E-04 1.70E+00Unspecified N g 3.09E-02 1.82E-03 1.29E-04 1.36E-03 3.20E-05 -8.87E-05 3.42E-02Unspecified oil g 3.39E-01 2.19E+00 3.09E-08 1.32E+01 3.89E-03 -3.02E-03 1.58E+01Unspecified org.compounds
g 1.15E-01 9.82E-01 1.00E+01 2.14E-03 -6.41E-06 1.11E+01
Unspecified oxides g 4.36E-01 8.13E-04 2.16E-07 -1.26E-01 3.11E-01Unspecified salt g 7.49E-01 2.44E+01 7.67E-07 2.48E+02 5.32E-02 -9.06E-02 2.73E+02Unspecifiedsubstance
g 1.44E-01 2.74E-03 7.80E-09 1.56E-10 2.03E-02 -2.15E-02 1.46E-01
Water g 1.60E+02 8.22E+05 1.12E-02 2.24E-04 6.12E+01 -4.09E-07 8.22E+05Zinc g 3.21E-02 2.28E-02 6.97E-10 2.28E-01 4.92E-03 -4.99E-03 2.82E-01
TABLE 8-P: WASTE, MONITOR W/O PACKAGING
Waste Unit Materialproduction
Manufacture
Distribution
Use Disposal Credit forrecycling
Total
Aluminium g 3.09E-02 3.09E-02Aluminium oxide g 2.89E-01 2.89E-01Chromium-rich slags kg 8.76E-02 8.76E-02Copper chloride kg 3.66E-05 3.66E-05Dolomite g 2.28E+00 3.56E-01 -3.56E-01 2.28E+00Glass tissue,reinforced withepoxy
kg 3.66E-04 3.66E-04
HCl in slag andashes
kg 2.74E-02 2.74E-02
Iron g 4.59E-02 4.59E-02
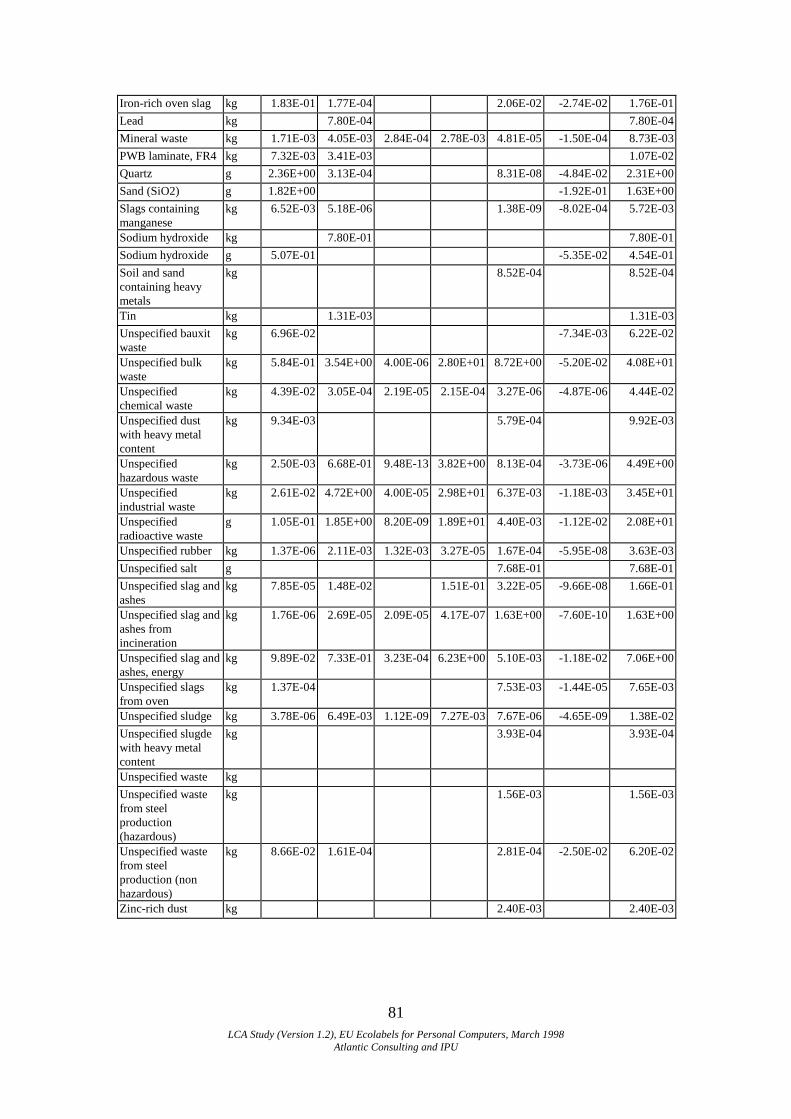
LCA Study (Version 1.2), EU Ecolabels for Personal Computers, March 1998Atlantic Consulting and IPU
81
Iron-rich oven slag kg 1.83E-01 1.77E-04 2.06E-02 -2.74E-02 1.76E-01Lead kg 7.80E-04 7.80E-04Mineral waste kg 1.71E-03 4.05E-03 2.84E-04 2.78E-03 4.81E-05 -1.50E-04 8.73E-03PWB laminate, FR4 kg 7.32E-03 3.41E-03 1.07E-02Quartz g 2.36E+00 3.13E-04 8.31E-08 -4.84E-02 2.31E+00Sand (SiO2) g 1.82E+00 -1.92E-01 1.63E+00Slags containingmanganese
kg 6.52E-03 5.18E-06 1.38E-09 -8.02E-04 5.72E-03
Sodium hydroxide kg 7.80E-01 7.80E-01Sodium hydroxide g 5.07E-01 -5.35E-02 4.54E-01Soil and sandcontaining heavymetals
kg 8.52E-04 8.52E-04
Tin kg 1.31E-03 1.31E-03Unspecified bauxitwaste
kg 6.96E-02 -7.34E-03 6.22E-02
Unspecified bulkwaste
kg 5.84E-01 3.54E+00 4.00E-06 2.80E+01 8.72E+00 -5.20E-02 4.08E+01
Unspecifiedchemical waste
kg 4.39E-02 3.05E-04 2.19E-05 2.15E-04 3.27E-06 -4.87E-06 4.44E-02
Unspecified dustwith heavy metalcontent
kg 9.34E-03 5.79E-04 9.92E-03
Unspecifiedhazardous waste
kg 2.50E-03 6.68E-01 9.48E-13 3.82E+00 8.13E-04 -3.73E-06 4.49E+00
Unspecifiedindustrial waste
kg 2.61E-02 4.72E+00 4.00E-05 2.98E+01 6.37E-03 -1.18E-03 3.45E+01
Unspecifiedradioactive waste
g 1.05E-01 1.85E+00 8.20E-09 1.89E+01 4.40E-03 -1.12E-02 2.08E+01
Unspecified rubber kg 1.37E-06 2.11E-03 1.32E-03 3.27E-05 1.67E-04 -5.95E-08 3.63E-03Unspecified salt g 7.68E-01 7.68E-01Unspecified slag andashes
kg 7.85E-05 1.48E-02 1.51E-01 3.22E-05 -9.66E-08 1.66E-01
Unspecified slag andashes fromincineration
kg 1.76E-06 2.69E-05 2.09E-05 4.17E-07 1.63E+00 -7.60E-10 1.63E+00
Unspecified slag andashes, energy
kg 9.89E-02 7.33E-01 3.23E-04 6.23E+00 5.10E-03 -1.18E-02 7.06E+00
Unspecified slagsfrom oven
kg 1.37E-04 7.53E-03 -1.44E-05 7.65E-03
Unspecified sludge kg 3.78E-06 6.49E-03 1.12E-09 7.27E-03 7.67E-06 -4.65E-09 1.38E-02Unspecified slugdewith heavy metalcontent
kg 3.93E-04 3.93E-04
Unspecified waste kgUnspecified wastefrom steelproduction(hazardous)
kg 1.56E-03 1.56E-03
Unspecified wastefrom steelproduction (nonhazardous)
kg 8.66E-02 1.61E-04 2.81E-04 -2.50E-02 6.20E-02
Zinc-rich dust kg 2.40E-03 2.40E-03

LCA Study (Version 1.2), EU Ecolabels for Personal Computers, March 1998Atlantic Consulting and IPU
82
9. APPENDIX B: Consultation for this ProjectThe project team has endeavoured to make this ecolabel exercise as transparent aspossible through both direct and indirect consultation with interested parties. This hasbeen done through conventional means: telephone conversations, face-to-facemeetings, distribution of paper reports and discussion at ad hoc working groupmeetings. It also has been done through a website (which has logged over 2000visitors) and by e-mailing reports to interested inquirers.
Significant contacts have been made among sellers, ecolabel authorities, buyers andgreen groups. The main industry interests are divided into primary sellers (consultedmore than secondary), secondary sellers and suppliers/other (Table 11-A). Theseinclude manufacturers and retailers. Consultations with other groups than just thosereported have been made, and numerous players in the PC and related industries havefollowed the project website.
TABLE 9-A: INDUSTRY INTERESTS THAT HAVE BEEN CONSULTED
SellersPrimary Secondary Suppliers/OthersApple Acer DataquestCompaq ARS EurobitDell AT&T EurobromEurocommerce Digital Federation of the Electronics IndustryHewlett Packard LG Electronics IDCIBM Lucent IT Industry CouncilICL/Fujitsu MCC Personal Computer AssociationPC World NEC SITOSiemens-Nixdorf Panasonic Taiwan Computer AssociationSony Texas InstrumentsToshiba Vobis
All of the EU ecolabel authorities have been consulted during this project. Inprinciple and in practice, these groups represent their constituencies, i.e. sellers,buyers and green groups. The most in-depth conversations have been with thoseauthorities that have a PC ecolabel already, i.e. the Blue Angel in Germany and theNordic Swan (discussions with Finnish, Norwegian and Swedish officials, including avisit to Sweden). Personal visits and discussions also have been carried out with TCO(Sweden) and EDF (Taiwan), both of which have ecolabels for PCs.
Four leading green groups have been in contact with the study team: BUND, EEB,Greenpeace and the Swedish Society for the Conservation of Nature.

LCA Study (Version 1.2), EU Ecolabels for Personal Computers, March 1998Atlantic Consulting and IPU
83
10. APPENDIX C: Composition of Materials
TABLE 10-A: ELECTROLYTIC CAPACITORS, CHOKING COILS AND TRANSFORMERS [27]
Electrolytic capacitators wt% MaterialCasing 40% aluminiumMechanical part 40% PSConductor 10% CopperInsulation 10% Phenolic resin paperChoking coils and Transformers wt% MaterialCoil body 20% PVCWindings 20% Copper, lacquer insulationCore 60% Ferrite
TABLE 10-B: CRT GLASS, FUNNEL AND PANEL [32]
Compound Funnel glass Panel glassSiO2 51.4% 61.50%SrO 9.80%Na2O 6.00% 7.70%K2O 8.50% 7.70%BaO 0.30% 8.70%PbO 23.90% 0%Al2O3 3.70% 2.00%CaO 4.00% 0%ZrO2 0% 1.20%MgO 2.00% 0%TiO2 / CeO2 0% 0.50% / 0.30%Sb2O3 0.20% 0.35%Fe2O3 0% 0.05%ZnO 0% 0.50%

LCA Study (Version 1.2), EU Ecolabels for Personal Computers, March 1998Atlantic Consulting and IPU
84
TABLE 10-C: PRINTED WIRING BOARD (FR4) [28]
Materials Cu Sn Fe Pb Ni Zn Al Ag Au Cd Cr Be Pd Epoxyresina
Glass/Siliconoxide
Total
Amounts 14.30% 2.00% 4.50% 2.20% 1.10% 0.40% 2.80% 0.06% 0.06% 0.00% 0.04% 0.01% 0.01% 24.80% 47.60% 99.88%
aThe Epoxy resin contains a flame retardant: Tetra bromo bisphenol A (TBBPA) [30]
TABLE 10-D: PRINTED WIRING BOARD (FR4) WITH COMPONENTS
Materials Cu Sn Fe Pb Ni Zn Al Ag Au Cd Cr Be Pd Epoxyresina
Glass/Siliconoxide
Total
Amounts47 12.80% 6.00% 3.90% 2.90% 1.30% 1.00% 0.56% 0.02% 0.02% 0.01% 0.04% 70.00% 1.50% 100.05%
Amounts48 7.00% 1.00% 6.00% 3.00% 2.00% 23.00% 49.00% 91.00%
Amounts49 20.00% 1.00% 23.00% 5.00% 4.00% 0.10% 0.01% 23.00% 23.00% 99.11%
Amounts[50]
0.80% 1.50% 0.70% 7.30% 24.30% 34.60%
Amounts[28]
14.30% 2.00% 4.50% 2.20% 1.10% 0.40% 2.80% 0.06% 0.06% 0.0004%
0.04% 0.01% 0.01% 24.80% 47.60% 99.88%
aThe Epoxy resin contains a flame retardant: Tetra bromo bisphenol A (TBBPA)50
LCA Study (Version 1.2), EU Ecolabels for Personal Computers, March 1998Atlantic Consulting and IPU
85
11. REFERENCES AND NOTES 1 Atlantic Consulting, May, 1997. Creating an EU Ecolabel for Personal Computers. A FeasibilityStudy of the Product Group Personal Computers in the EU Ecolabel Scheme. DG XI.E.4, EuropeanCommission, Brussels.2 Atlantic Consulting, November, 1997. Market Study of the Product Group Personal Computers.Version 3.21. DG XI.E.4, European Commission, Brussels.3 Groupe des Sages, 1st report for the European Commission, Sept 1994. Guidelines for theApplication of Life Cycle Assessment in the EU Eco-Label Award Scheme. DG XI.E.4, EuropeanCommission, Brussels.4 Modified in accordance with the discussion of the Ad Hoc Working Group meeting in Brussels, 13February 1998.5 Atlantic Consulting, July 1996. Study of the Product Group Personal Computers in the EU EcolabelScheme. A Tender for DG XI. Atlantic Consulting, London.6 European Commission, June 1994. Procedural Guidelines for the Establishment of Product Groupsand Ecological Criteria. DG XI, Brussels.7 Frees N and Pedersen M A, (1996). UMIP enhedsprocesdatabase (EDIP unit process database).Danish Environmental Protection Agency. Copenhagen. (in Danish).8 Lead Development Association International: Correspondence with Dr. D.N. Wilson, July 1997.9 Energy Use Patterns in Metallurgical and Non-metallic Mineral Processing, PB-245 759, PB-246 357,Battelle Columbus Laboratories, Columbus, Ohio, 1975.10 Schöll E and Paschen, P (1989). Energieverbrauch in der Bleimetallurgie – teil 1 (EnergyConsumption in Lead Metallurgy – part 1). BHM, vol. 134, heft 11, 1989, pp. 363-370.Energieverbrauch in der Bleimetallurgie – teil 2. BHM, vol. 135, heft 3, 1990, pp.57-62. (In German)11 Wuth W (1981). Energiverbrauch zur Herstellung von NE-Metallen (Energy Consumption forProduction of Non-ferrous Metals). Erzmetall 34 (1981) no 7/8 p. 375-380. (in German)12 Ullmann’s Encyclopaedia of Industrial Chemistry (1986) 5th edn. Weinheim, Germany, VCH.13 Bruch, Gohlke, Kögler, Krüger, Reuter, Röpenack, Rombach, Rombach and Winkler, May, 1995.Sachbilanz einer Ôkobilanz der Kupfererzeugung und –verarbeitung ( ) (in German). Part 2. Metall,volumen 49 no 5.14 MCC 1993. Environmental Consciousness: A Strategic Competitive Issue for the Electronics andComputer Industry. Comprehensive Report: Analysis and Synthesis, Task Force Reports andAppendices. Microelectronics and Computer Technology Corporation. Austin, Texas. March 1993.15 ZITECH (1996). User’s guide. 15” Color Monitor. Model: ZITECH PRO 15.16 Decided at the meeting of the Ad Hoc Working Group for EU Ecolabels of Personal Computers,Brussels, 28 October 1997.17 Eurostat (1997). Energy Balances18 Eurostat (1997). Energy Yearly Statistics, 1995.19 Eurostat (1997). Environment Statistics, 1996.20 CORINAIR (1997). European Air Emissions for 1994. European Environment Agency.21 ETH (1996). Ökoinventare für Energiesysteme (Environmental Life-Cycle Inventories of Energysystems). Laboratorium für Energiesysteme, Zürich (In German).22 Ottosen, Moe and Wernblad. 1996. Affaldsstruktur i 6 EU-lande – Håndtering og udbud. (WasteStructure in 6 EU countries – Handling and supply) (in Danish). Environmental report no 343, DanishEnvironmental Protection Agency. Denmark. 23 Finnveden, G. (1996). Solid waste treatment within the framework of life cycle assessment. Metals inmunicipal solid waste landfills. International Journal of LCA. 1 (2) 74-78.24 Ekvall, Finnveden and Ronning, June 1994. Data Quality/Collection/Calculation. Technical Report6: Allocation, Version 4. Nordic Council of Ministers, Copenhagen.25 Groupe des Sages, 3rd report for the European Commission, Nov 1996. Practical Guidelines for LifeCycle assessment for the EU ecolabelling programme. DG XI.E.4, European Commission, Brussels.26 Wenzel, H., Hauschild, M. and Alting, L. (1997). Environmental assessment of products. Volume 1:Methodology, tools, and case studies in product development. Chapman and Hall, United Kingdom.27 Soldera. 1995. Öko-computer - Vergleich eines Öko-PC mit einem herkömmlichen PC anhandLebenszyklusanalysen LCA (Eco Computer - Comparison of an Eco-PC with a Traditional PC on theBasis of Life Cycle Analysis LCA). Gebenstorf, Schweiz. (In German).

LCA Study (Version 1.2), EU Ecolabels for Personal Computers, March 1998Atlantic Consulting and IPU
86
28 Pedersen 1993. Elektronik affald (Electronic waste), Masters Thesis, Department of Chemistry,Technical University of Denmark, (in Danish).29 Zachariassen and Roensberg. 1995. Electronics and the Environment - A Guide to the Selection ofComponents. Environmental report no. 289. Danish Environmental Protection Agency. Denmark.30 Hedemalm, Carlsson and Palm (1993): A Survey of the Contents of Materials and HazardousSubstances in Electric and Electronic Products. Institut for Verkstadsteknisk Forskning, Sweden.31 Mallinson J C. (1993). The foundations of Magnetic Recording. Sec. Edition. Academic Press. SanDiego. Chapter 3. p.35-37.32 Taiwanese PC Task Force, 1997.33 Philips Components. 1997. Principle of the Colour Picture Tube. Philips Electronics N.V. Eindhoven.The Netherlands.34 Nielsen P H, Exner S, Jörgensen A-M and Hauschild M (in preparation). Product specific emissionsfrom municipal solid Waste landfills, 2. Presentation and verification of the computer tool LCA-LAND.35 US EPA Energy Star Office Equipment. (1995). Memorandum of Understanding (MOU) forsuppliers of personal computers and monitors. Version 2.0. US Environmental protection agency.36 Legarth, J B. (1997). Recycling of Electronic Scrap. Department of Manufacturing Engineering.Process and Production Engineering. The Technical University of Denmark. Lyngby. Denmark.37 Stefan Trautner, (1997) FAPS, Germany. Private communication.38 Trumble B. (1997). Printed Circuit Assembly with No Lead Solder Assembly Process. Proceedingsof the 1997 IEEE International Symposium on Electronics and the Environment. Piscataway, NJ.39 This is more a market problem than a technical one. Recyclers prefer plastic that has a minimum ofadditives; many simply refuse to accept material with certain additives.40 Jørgensen, L. (1997): Flame retardants in the blood - a new environmental problem. Journal of theDanish Engineering Society, (28/29) pp. 4-5, Copenhagen.41 Öberg, T., Waarman, K. and Bergström, J. (1987): Brominated Aromatics from Combustion.Chemosphere 16(10-12)pp. 2451-2465. Pergamon Journals Ltd., United Kingdom.42 Öberg, T. and Bergström, J. (1990): Bromine and Waste Incineration - An Environmental Risk? pp.339-342 in Hutzinger, O. and Fiedler, H. (eds.): Organohalogen Compounds, Vol. 2: Dioxin ‘90 -EPRI-SEMINAR. Ecoinforma Press, Bayreuth, Germany.43 Öberg, T. (1994): The Flame Retardants Project. Brominated Aromatics from Waste Handling andRecycling Processes. National Chemicals Inspectorate, Sweden.44 Mennear, J.H. and Lee, C.C. (1994): Polybrominated dibenzo-p-dioxins and dibenzofurans:Literature review and health assessment. Environmental Health Perspectives (102/Suppl. 1) 265-274.45 Luijk, R., Wever, H., Olie, K. Govers, H.A.J. and Boon, J.J. (1991): The Influence of the PolymerMatrix on the Formation of Polybrominated dibenze-p-dioxins (PBDDs) and polybrominateddibenzofurans (PBDFs). Chemosphere 23(8-10)pp. 1173-1183. Pergamon Journals Ltd., UnitedKingdom.46 Zacharewski, T., Harris, M., Safe, S., Thoma, H. and Hutzinger, O. (1988): Application of the invityro aryl hydrocarbon hydroxylase induction assay for determining ‘2,3,7,8-tetrachlorodibenzo-p-dioxin equivalents’: Pyrolyzed brominated flame retardants. Toxicology 51 (2-3)pp. 177-189.47 Salami B. and Seiz S. (1992): Anorganische Zusammensetzung von Computereinzelteilen, BUWAL.48 Brodersen K. et al. (1992): International Conference on the Recycling of Metals, Düsseldorf, ASMInternational, p.45-5149 Olsen K. O. and Christensen T.E. (1992): Skrotning af elektroniske apparater (Scraping of electronicequipment), Work report no. 18. Danish Environmental Protection Agency, Denmark (in Danish).50 Nordi H. (1992): Projekt Elektronikavfall, Miljøkompassen AB, Sverige