Lawrence Livermore National Laboratory Livermore, CA · Liquid Hydrogen Infrastructure Analysis...
28
Liquid Hydrogen Infrastructure Analysis Guillaume Petitpas, A.J. Simon Lawrence Livermore National Laboratory Livermore, CA DOE Hydrogen and Fuel Cells Annual Merit Review, Washington D.C. June 6 th , 2017 “This presentation does not contain any proprietary, confidential, or otherwise restricted information” Project ID#: PD135 LLNL-PRES-727907
Transcript of Lawrence Livermore National Laboratory Livermore, CA · Liquid Hydrogen Infrastructure Analysis...
Liquid Hydrogen Infrastructure Analysis
Guillaume Petitpas, A.J. SimonLawrence Livermore National Laboratory
Livermore, CA
DOE Hydrogen and Fuel Cells Annual Merit Review, Washington D.C.June 6th, 2017
“This presentation does not contain any proprietary, confidential, or otherwise restricted information”
Project ID#: PD135
LLNL-PRES-727907
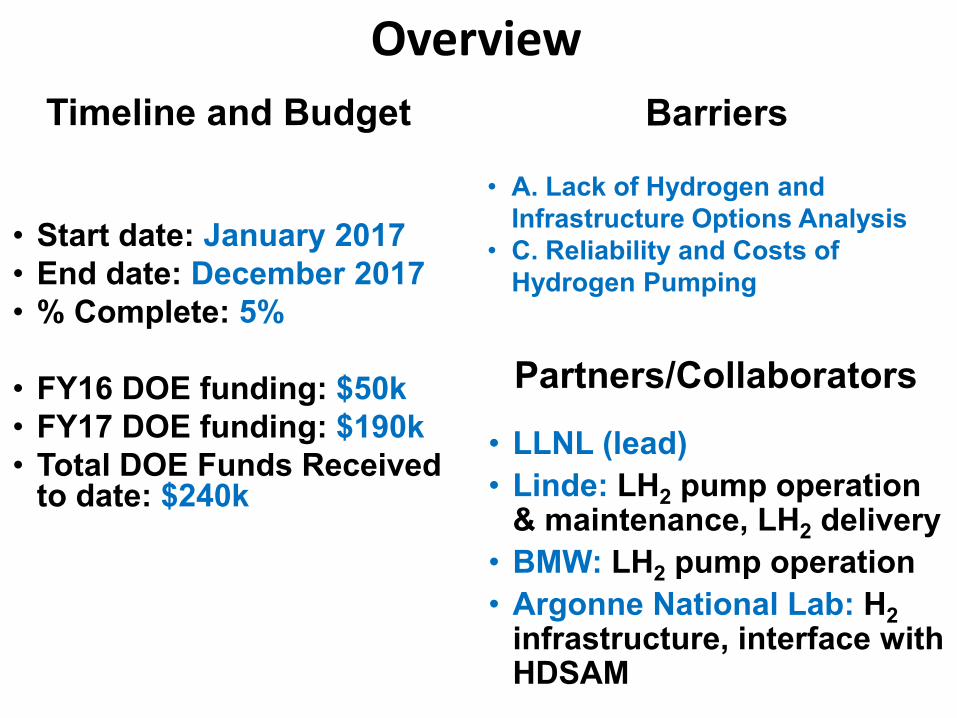
• Start date: January 2017• End date: December 2017• % Complete: 5%
• FY16 DOE funding: $50k• FY17 DOE funding: $190k• Total DOE Funds Received
to date: $240k
Timeline and Budget Barriers
• LLNL (lead)• Linde: LH2 pump operation
& maintenance, LH2 delivery• BMW: LH2 pump operation• Argonne National Lab: H2
infrastructure, interface with HDSAM
Partners/Collaborators
• A. Lack of Hydrogen and Infrastructure Options Analysis
• C. Reliability and Costs of Hydrogen Pumping
Overview
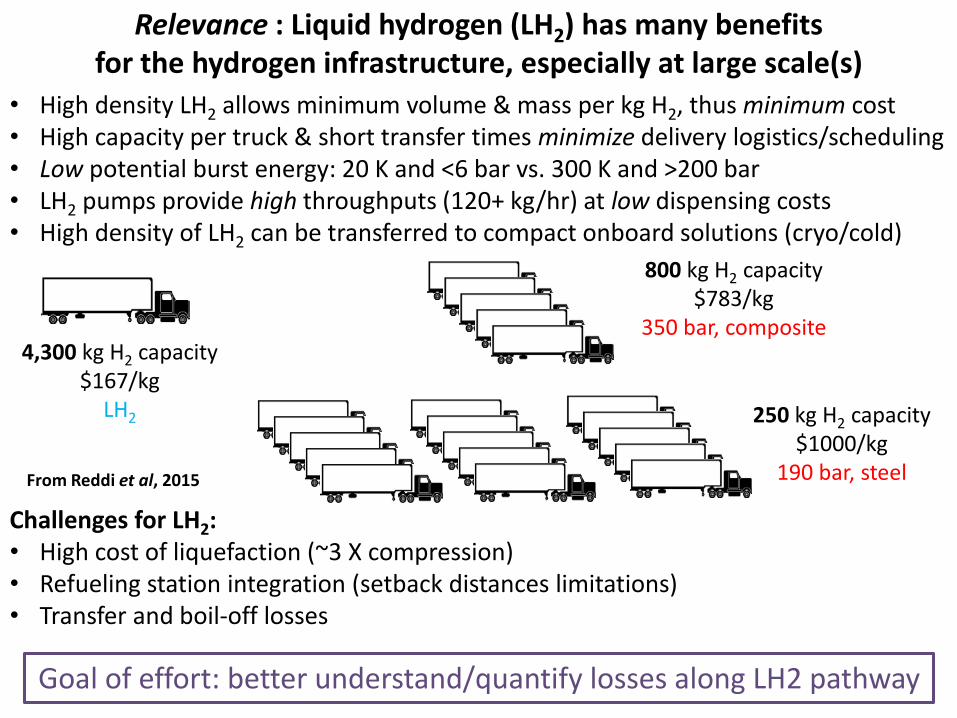
• High density LH2 allows minimum volume & mass per kg H2, thus minimum cost• High capacity per truck & short transfer times minimize delivery logistics/scheduling• Low potential burst energy: 20 K and <6 bar vs. 300 K and >200 bar• LH2 pumps provide high throughputs (120+ kg/hr) at low dispensing costs• High density of LH2 can be transferred to compact onboard solutions (cryo/cold)
Challenges for LH2:• High cost of liquefaction (~3 X compression)• Refueling station integration (setback distances limitations)• Transfer and boil-off losses
Relevance : Liquid hydrogen (LH2) has many benefits for the hydrogen infrastructure, especially at large scale(s)
Goal of effort: better understand/quantify losses along LH2 pathway
4,300 kg H2 capacity$167/kg
LH2
800 kg H2 capacity$783/kg
350 bar, composite
250 kg H2 capacity$1000/kg
190 bar, steelFrom Reddi et al, 2015
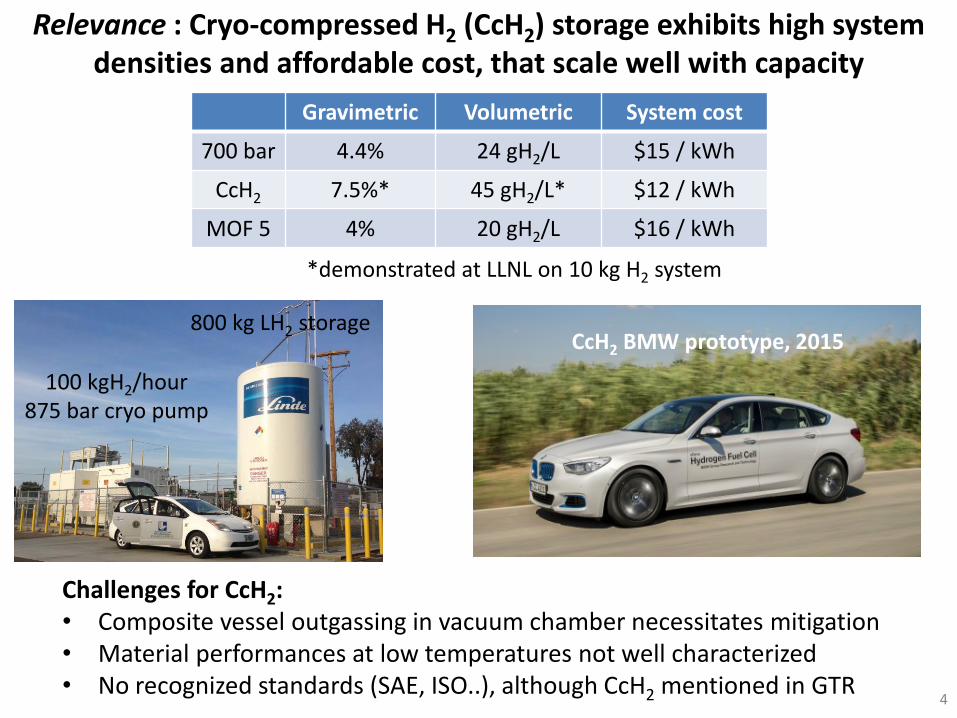
Relevance : Cryo-compressed H2 (CcH2) storage exhibits high system densities and affordable cost, that scale well with capacity
Challenges for CcH2:• Composite vessel outgassing in vacuum chamber necessitates mitigation• Material performances at low temperatures not well characterized • No recognized standards (SAE, ISO..), although CcH2 mentioned in GTR
100 kgH2/hour875 bar cryo pump
800 kg LH2 storage
Gravimetric Volumetric System cost
700 bar 4.4% 24 gH2/L $15 / kWh
CcH2 7.5%* 45 gH2/L* $12 / kWh
MOF 5 4% 20 gH2/L $16 / kWh
*demonstrated at LLNL on 10 kg H2 system
CcH2 BMW prototype, 2015
4
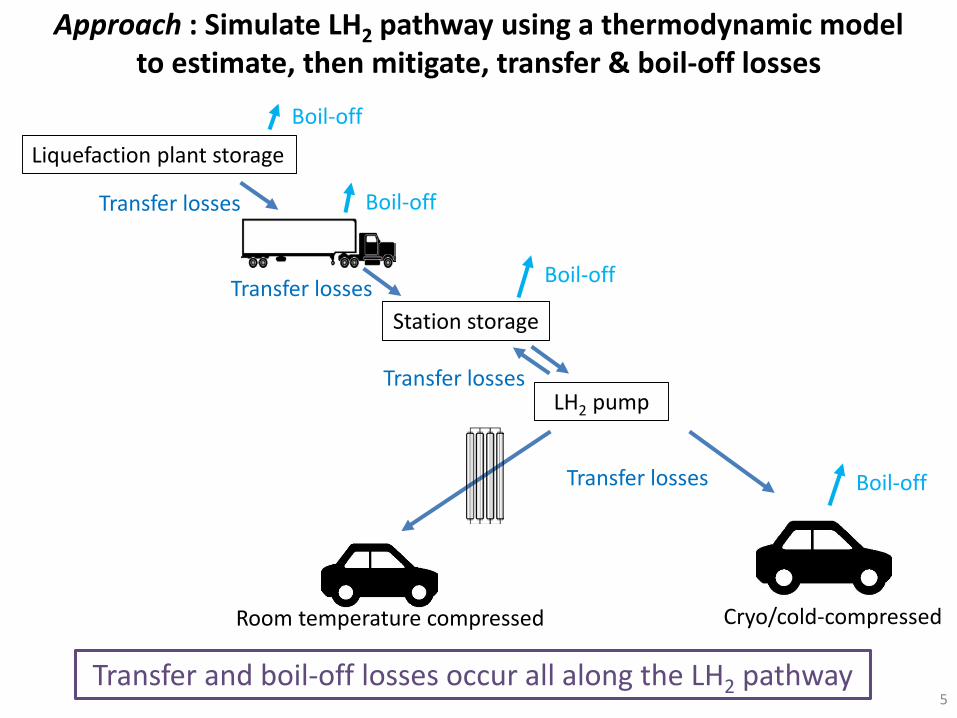
Approach : Simulate LH2 pathway using a thermodynamic model to estimate, then mitigate, transfer & boil-off losses
Transfer and boil-off losses occur all along the LH2 pathway
Liquefaction plant storage
Station storage
LH2 pump
Room temperature compressed Cryo/cold-compressed
Boil-off
Boil-off
Boil-off
Boil-off
Transfer losses
Transfer losses
Transfer losses
Transfer losses
5
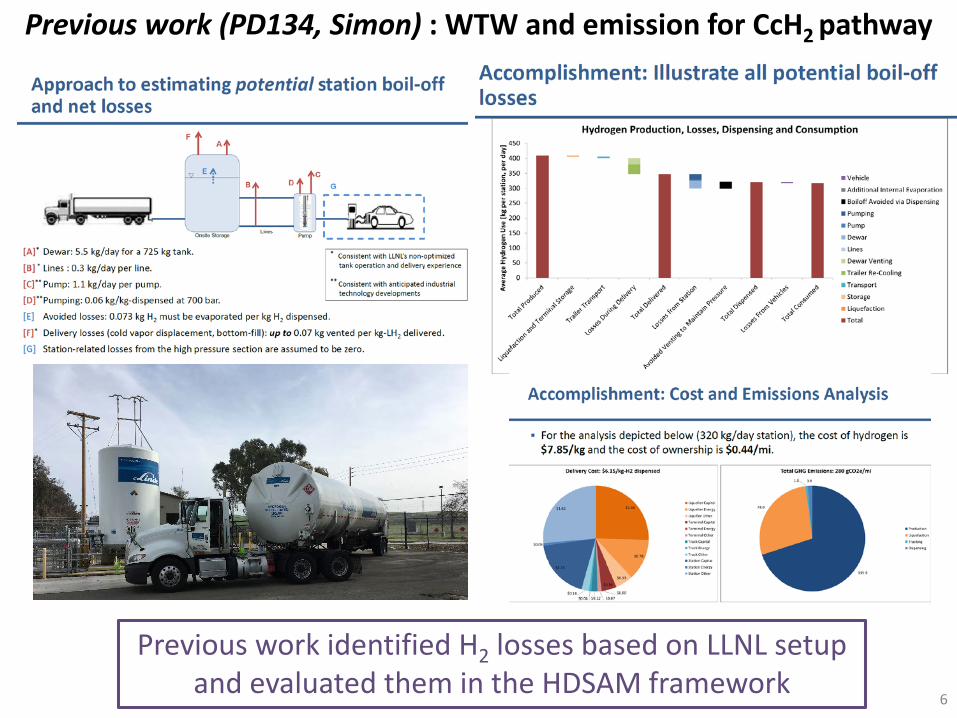
Previous work (PD134, Simon) : WTW and emission for CcH2 pathway
Previous work identified H2 losses based on LLNL setup and evaluated them in the HDSAM framework
6
Modeling entire LH2 pathway enables quantitative understanding
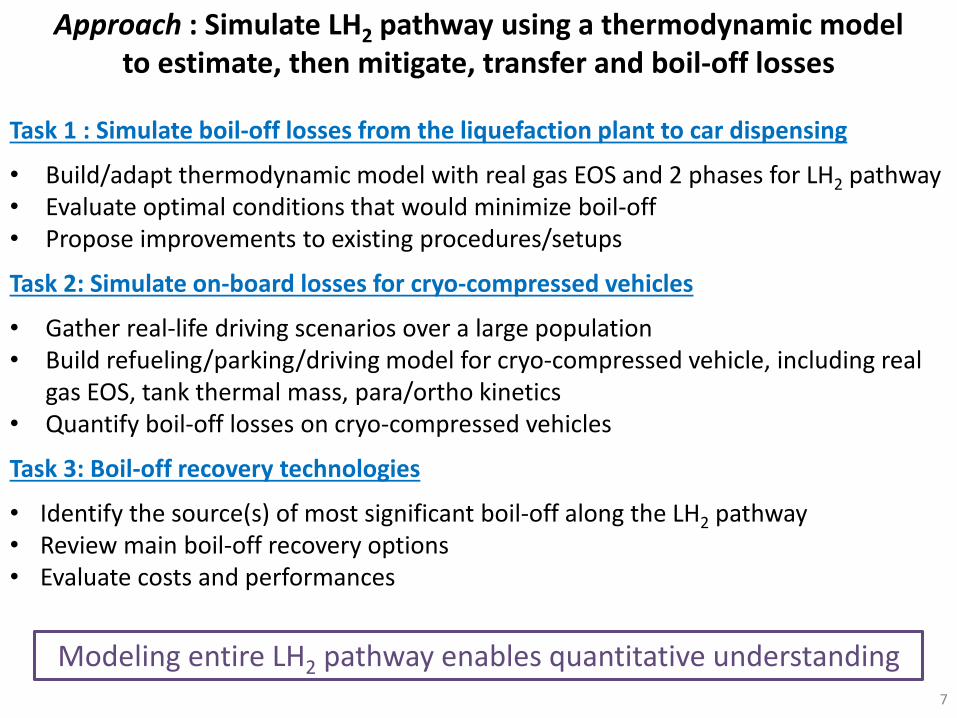
Task 1 : Simulate boil-off losses from the liquefaction plant to car dispensing
• Build/adapt thermodynamic model with real gas EOS and 2 phases for LH2 pathway • Evaluate optimal conditions that would minimize boil-off• Propose improvements to existing procedures/setups
Task 2: Simulate on-board losses for cryo-compressed vehicles
• Gather real-life driving scenarios over a large population• Build refueling/parking/driving model for cryo-compressed vehicle, including real
gas EOS, tank thermal mass, para/ortho kinetics• Quantify boil-off losses on cryo-compressed vehicles
Task 3: Boil-off recovery technologies
• Identify the source(s) of most significant boil-off along the LH2 pathway• Review main boil-off recovery options• Evaluate costs and performances
Approach : Simulate LH2 pathway using a thermodynamic model to estimate, then mitigate, transfer and boil-off losses
7
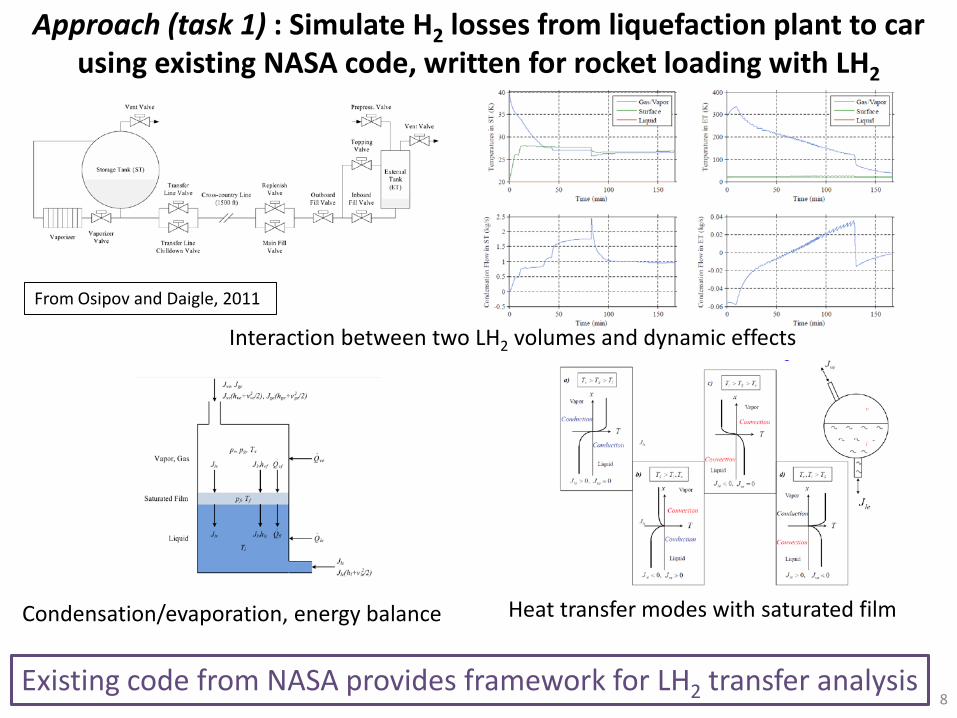
Approach (task 1) : Simulate H2 losses from liquefaction plant to car using existing NASA code, written for rocket loading with LH2
Existing code from NASA provides framework for LH2 transfer analysis
Heat transfer modes with saturated film
Interaction between two LH2 volumes and dynamic effects
Condensation/evaporation, energy balance
From Osipov and Daigle, 2011
8
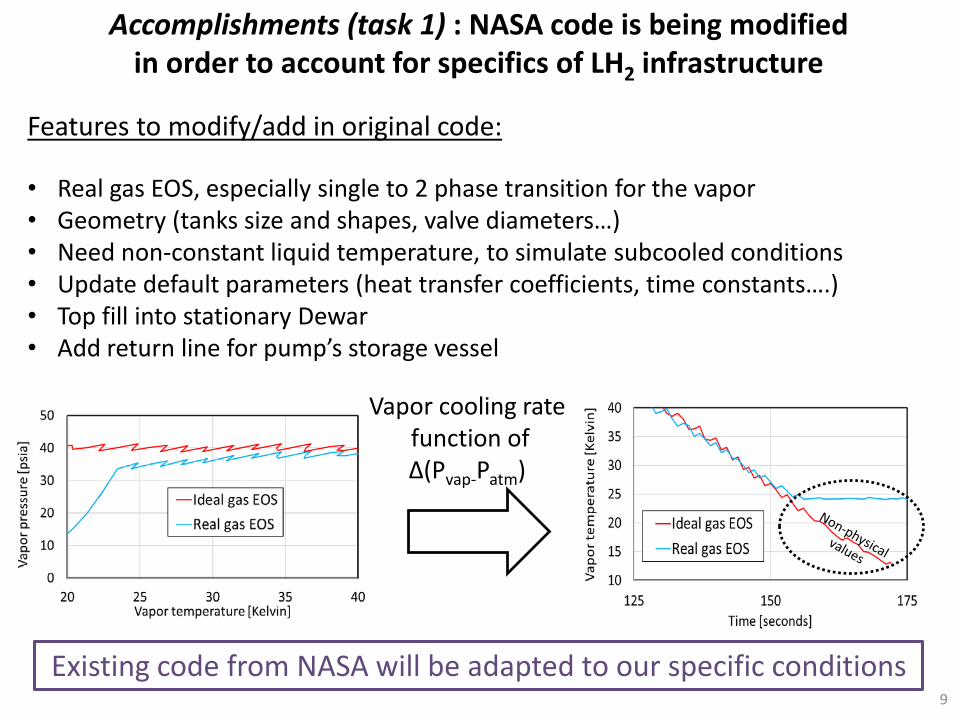
Accomplishments (task 1) : NASA code is being modified in order to account for specifics of LH2 infrastructure
Existing code from NASA will be adapted to our specific conditions
Features to modify/add in original code:
• Real gas EOS, especially single to 2 phase transition for the vapor• Geometry (tanks size and shapes, valve diameters…)• Need non-constant liquid temperature, to simulate subcooled conditions• Update default parameters (heat transfer coefficients, time constants….)• Top fill into stationary Dewar• Add return line for pump’s storage vessel
Vapor cooling ratefunction ofΔ(Pvap-Patm)
9
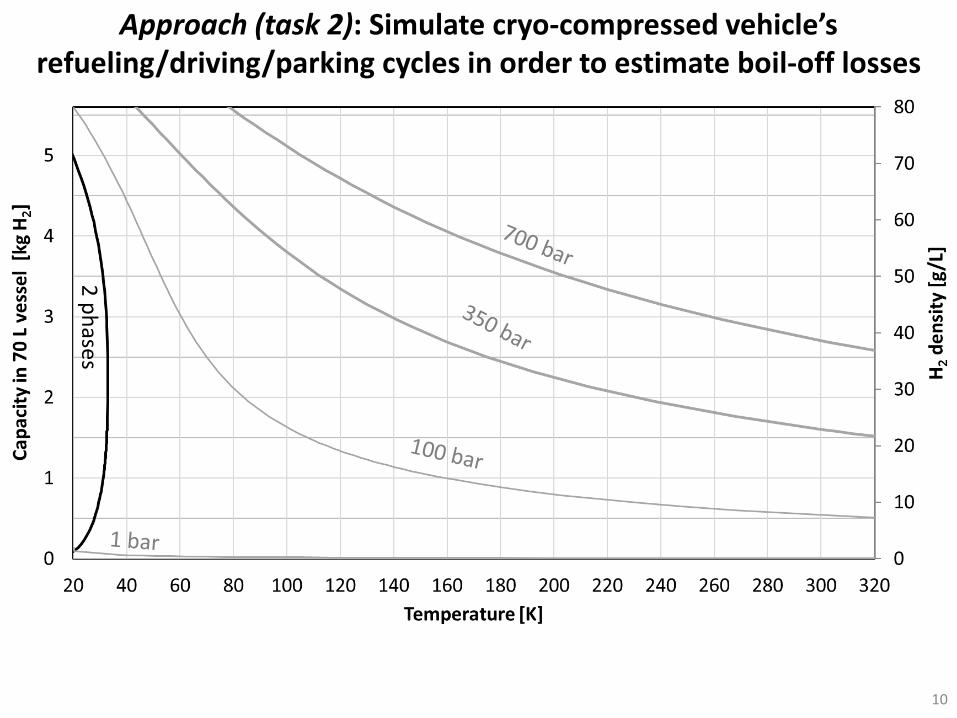
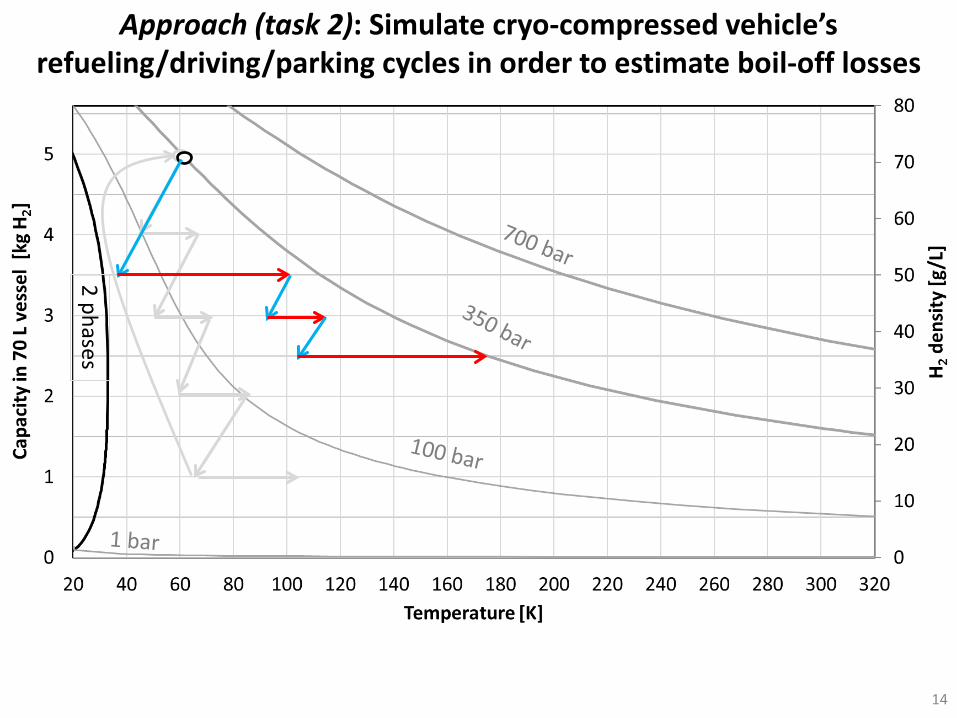
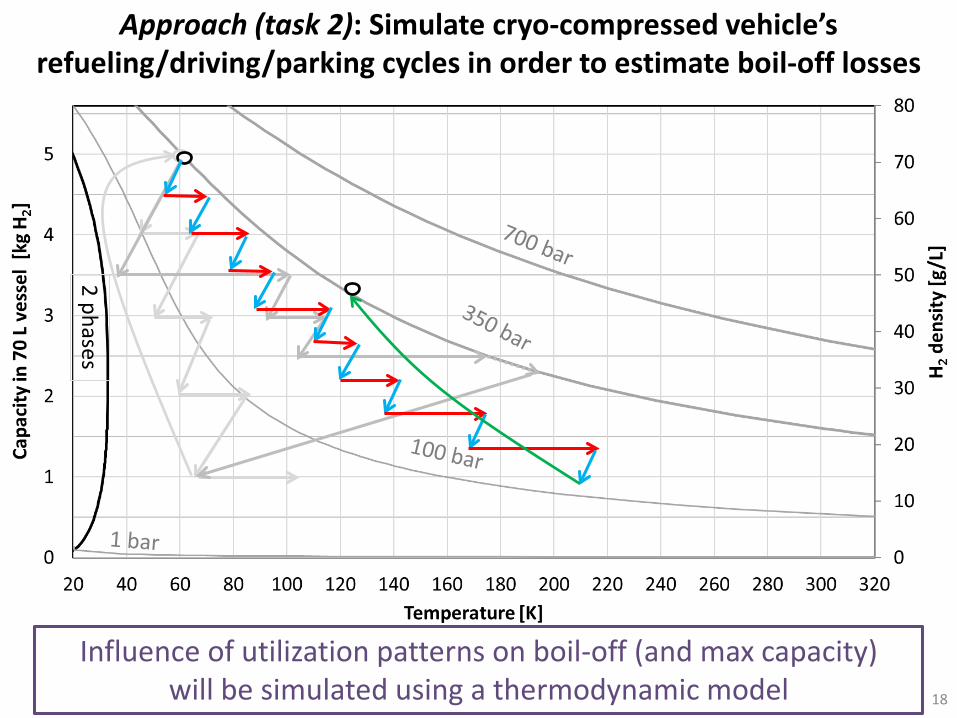
Approach (task 2): Simulate cryo-compressed vehicle’s refueling/driving/parking cycles in order to estimate boil-off losses
2 phases
10
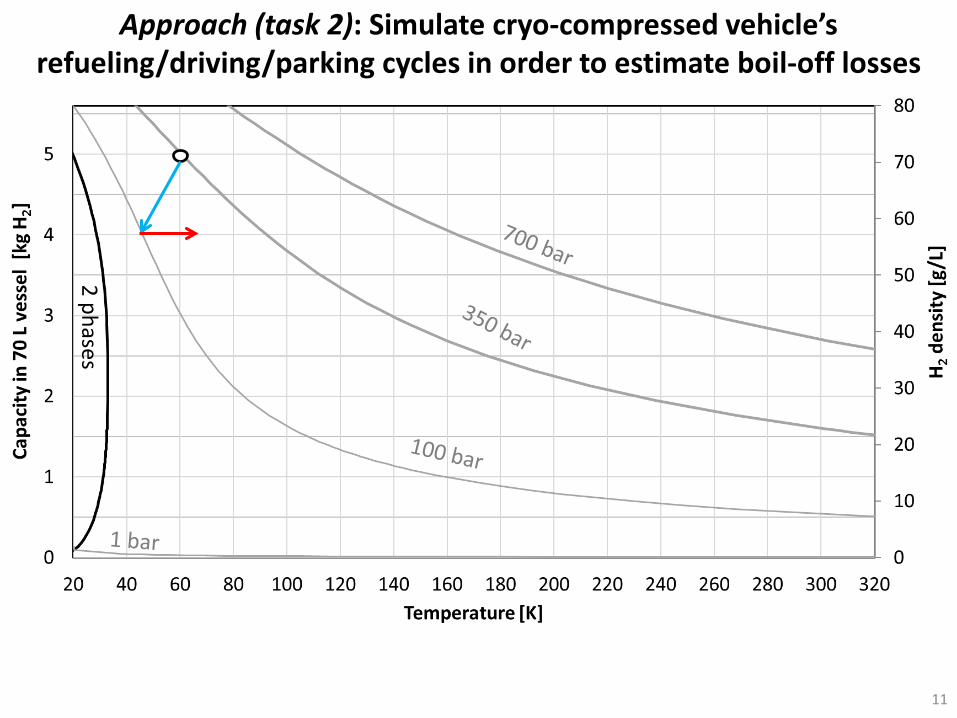
Approach (task 2): Simulate cryo-compressed vehicle’s refueling/driving/parking cycles in order to estimate boil-off losses
2 phases
11
Approach (task 2): Simulate cryo-compressed vehicle’s refueling/driving/parking cycles in order to estimate boil-off losses
2 phases
12

Approach (task 2): Simulate cryo-compressed vehicle’s refueling/driving/parking cycles in order to estimate boil-off losses
2 phases
13
Approach (task 2): Simulate cryo-compressed vehicle’s refueling/driving/parking cycles in order to estimate boil-off losses
2 phases
14
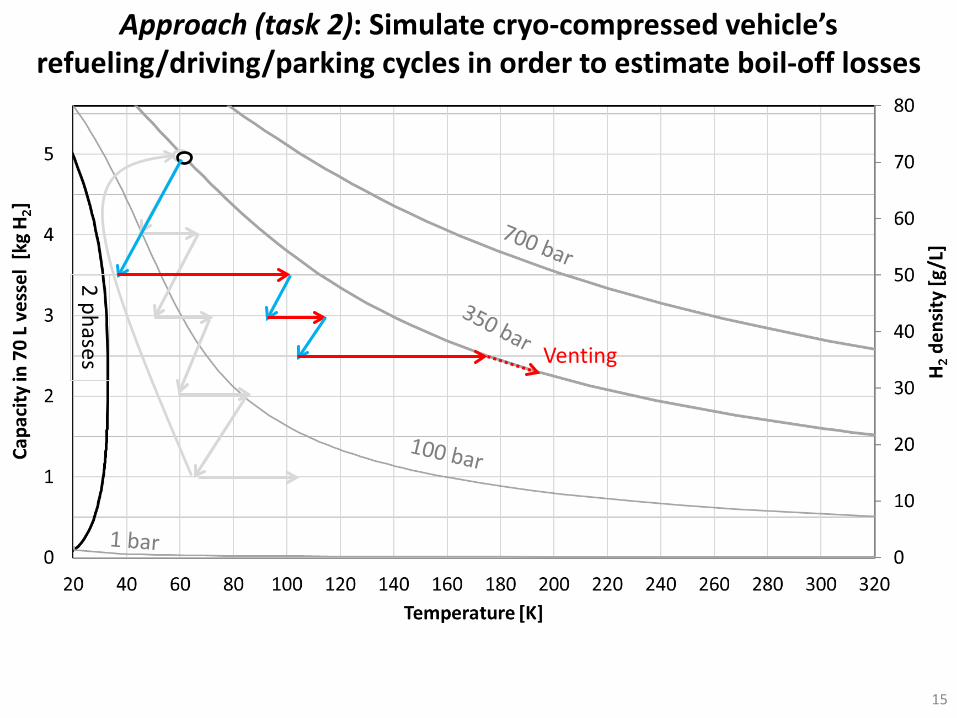
Approach (task 2): Simulate cryo-compressed vehicle’s refueling/driving/parking cycles in order to estimate boil-off losses
2 phases Venting
15
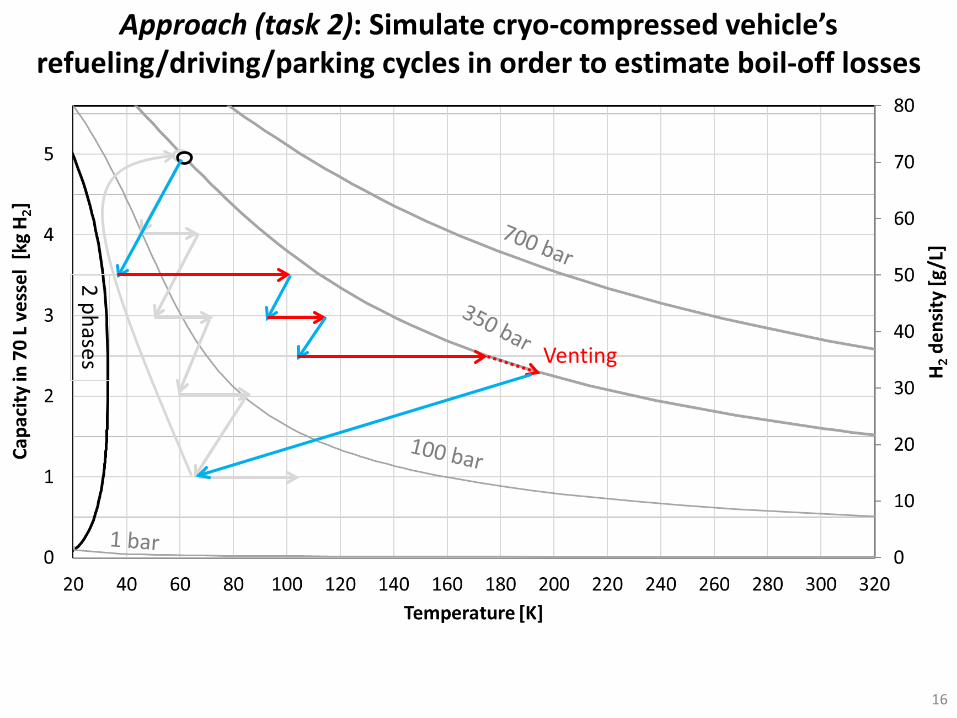
Approach (task 2): Simulate cryo-compressed vehicle’s refueling/driving/parking cycles in order to estimate boil-off losses
2 phases Venting
16
Approach (task 2): Simulate cryo-compressed vehicle’s refueling/driving/parking cycles in order to estimate boil-off losses
2 phases
17
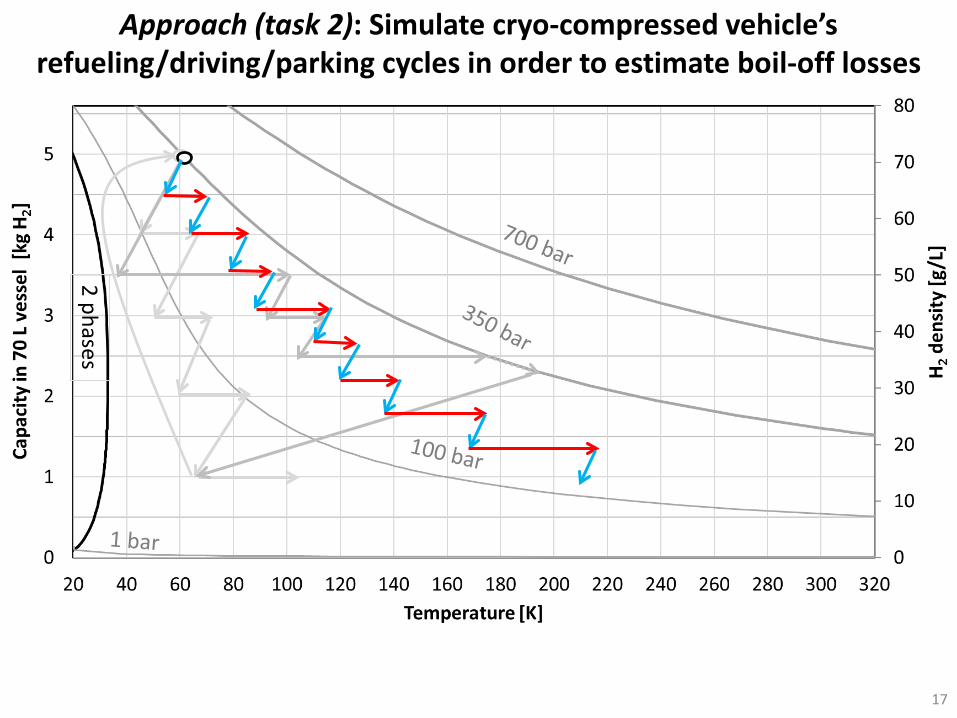
Approach (task 2): Simulate cryo-compressed vehicle’s refueling/driving/parking cycles in order to estimate boil-off losses
Influence of utilization patterns on boil-off (and max capacity)will be simulated using a thermodynamic model
2 phases
18
Approach (task 2): Simulate cryo-compressed vehicle’s refueling/driving/parking cycles in order to estimate boil-off losses
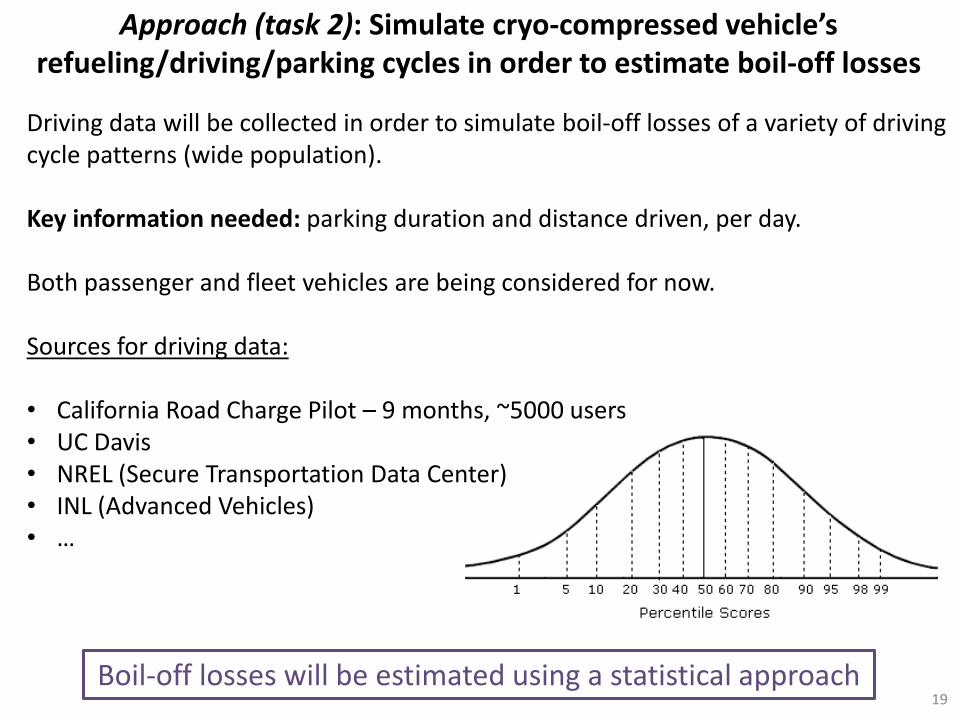
Boil-off losses will be estimated using a statistical approach
Driving data will be collected in order to simulate boil-off losses of a variety of driving cycle patterns (wide population).
Key information needed: parking duration and distance driven, per day.
Both passenger and fleet vehicles are being considered for now.
Sources for driving data:
• California Road Charge Pilot – 9 months, ~5000 users• UC Davis• NREL (Secure Transportation Data Center)• INL (Advanced Vehicles)• …
19
Approach (task 3) : Identify boil-off recovery technologies/processes that could reduce/eliminate H2 losses along LH2 pathway
Different approaches will be analyzed based on flow rates, T and P
Wealth of technologies have been studied by NASA (ZBO concepts).
Possible main sources of losses:
- Trailer depressurization after delivery (50-70 psi to atm)Mitigation: trailer “shake-down”, low entropy LH2 pump…
- Station DewarMitigation : low footprint compressor (electro-chemical, metal hydride cryo-cooler), fuel cell…
- Pump Dewar:Mitigation: bottom return recirculation into main Dewar…
- Vehicle:Mitigation: charge batterie(s), run A/C…
20
AMR 2016 feedbacks from reviewers (PD134, CcH2 pathway analysis)Project is estimating 'potential' boil-off, not necessarily estimating 'actual' boil-off?Last year’s effort was focused on identifying boil-off losses at the CcH2 station and integrate those results onto HDSAM. FY17 effort is aimed at quantifying those losses.
Not clear if initial description of cryo-compressed is 350 bar or 700 bar. Pressure is not believed to have strong impact at the station level. Both 350 bar (BMW) and 700 bar (LLNL) options are actually investigated through dedicated programs. FY17 effort will address 350 bar only.
Why are "losses from vehicles" after dispensing included in overall boil-off loses? Those losses are being paid by the customer, so they should be included in total boil-off budget.
Consider assessment of mitigation strategies for boil-off (in addition of what was presented in reviewer only slides). FY17 effort will address this.
Use of the HDSAM to perform analysis was selected because it was "directed by the program" according to the presenter. It seems, however, that this approach is backwards, and instead a complete analysis of the pathway should inform building the HDSAM model. We have an on-going relationship with ANL and changes to HDSAM can be made if needed.
Cryocompressed does not seem to be a realistic future pathway. Only a single OEM is on-board, collaborating. It is unclear why DOE funds are being allocated to this pathway. Cryo-compressed has many benefits, especially at large scale (large demand and large vehicle capacity). Although not considered for short term H2 deployment (like some other DOE funded technologies…), cryo-compressed technology should be fully understood so that it is mature if/when limitations on current technologies are reached. 21
Collaborations with Industry Leaders
• Linde: Very cooperative, sharing detailed information throughout pumpdevelopment, construction, and installation. Interpreting and sharing datafrom multiple pumps, and on LH2 deliveries.
22
• Verify that LH2 pathway code behaves as expected
− Challenge: Although the code looks appropriate to estimate losses during LH2transfer, a few modifications need to be made (2 phase EOS, top fill, subcooled…)
− Solution: The code is being studied intensively and upgraded. We should know soon enough whether the code is appropriate.
• Obtain park/drive/fill cycle patterns
− Challenge: We need to obtain parking duration and distance driven, per day, of a wide statically representative population, over a long period (week to month to year). As of now, we have not been able to secure the adequate source of data.
− Solutions : On-going discussions with Cal Road Charge Pilot, reached out to UC Davis (STEPS, Dr. Nicholas). Hopeful sets of data from EV effort may be available.
Critical challenges are being addressed early in the project
Risks/Challenges for FY17 milestones, Future work
23
Relevance LH2 has great benefits for large scale(s) hydrogen deployment (cost, logistics, safety..), better understanding of losses is necessary
Approach Simulate losses mechanisms along the LH2 pathway (transfer and boil-off : liquefaction plant -> trailer -> station Dewar -> pump -> cryo-compressed car), using real gas EOS and 2 phases, including statistical approach for variety of park/drive/fill scenarios
FY17 Progress Project just started (3 months)Simulation framework is being modifiedDriving scenarios are being collected
Future work Verify thermodynamics codes (pathway + park/drive/fill)Run typical casesPropose mitigating procedures/technologies
Summary: LLNL will develop and exercise models to simulate boil-off losses from plant to car for LH2 pathway, propose mitigation solutions
24

Technical back-up slides
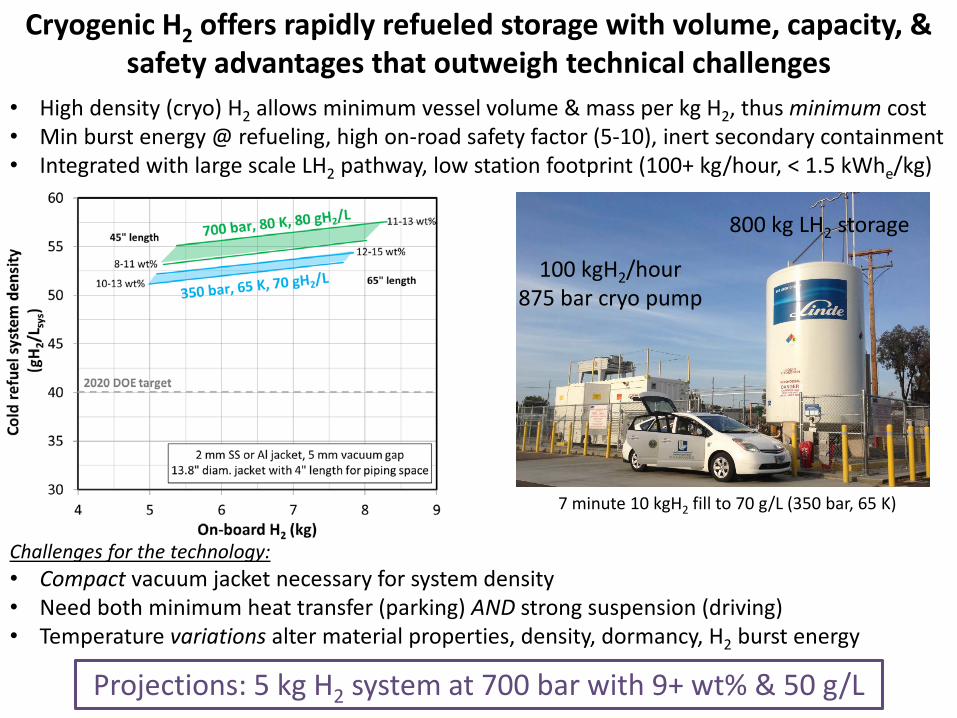
• High density (cryo) H2 allows minimum vessel volume & mass per kg H2, thus minimum cost • Min burst energy @ refueling, high on-road safety factor (5-10), inert secondary containment• Integrated with large scale LH2 pathway, low station footprint (100+ kg/hour, < 1.5 kWhe/kg)
Challenges for the technology:• Compact vacuum jacket necessary for system density• Need both minimum heat transfer (parking) AND strong suspension (driving)• Temperature variations alter material properties, density, dormancy, H2 burst energy
Cryogenic H2 offers rapidly refueled storage with volume, capacity, & safety advantages that outweigh technical challenges
Projections: 5 kg H2 system at 700 bar with 9+ wt% & 50 g/L
100 kgH2/hour875 bar cryo pump
7 minute 10 kgH2 fill to 70 g/L (350 bar, 65 K)
800 kg LH2 storage
Technical challenges for cryo-compressed H2 storage
Cryogenic durability of Type III composite pressure vessels, especially for the liner, is unknown
₋ Other project addressing this by building & cycle testing specifically designed Type III vessels.₋ Cryogenic durability is aided by improved material properties at low temperatures:
Metal: Increased yield and ultimate stress. Fiber: increased stiffness.
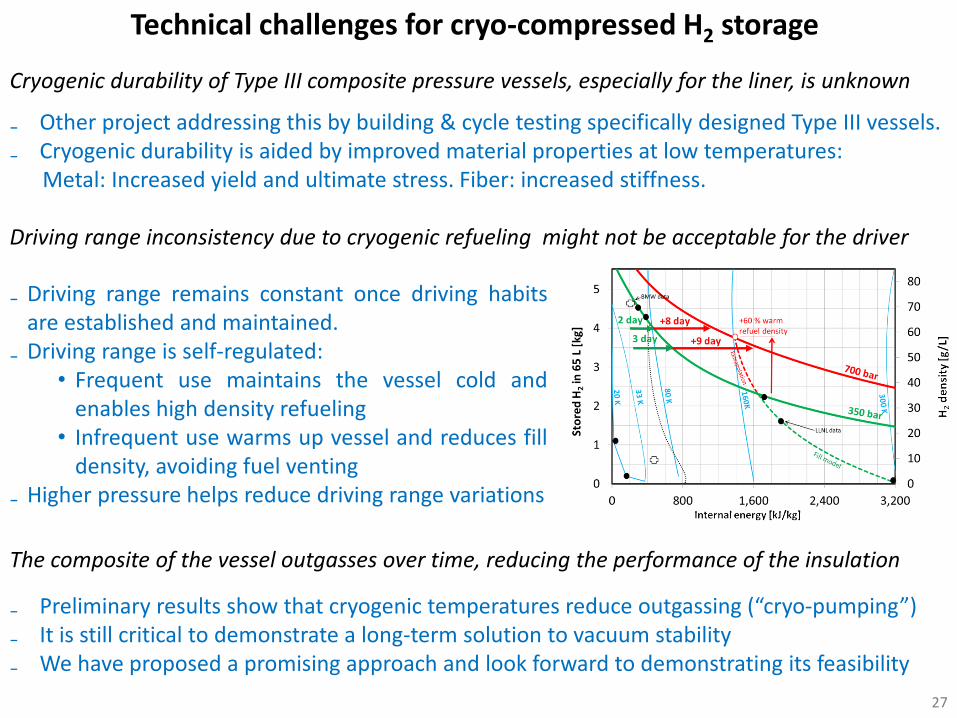
Driving range inconsistency due to cryogenic refueling might not be acceptable for the driver
The composite of the vessel outgasses over time, reducing the performance of the insulation
₋ Preliminary results show that cryogenic temperatures reduce outgassing (“cryo-pumping”)₋ It is still critical to demonstrate a long-term solution to vacuum stability₋ We have proposed a promising approach and look forward to demonstrating its feasibility
27
₋ Driving range remains constant once driving habitsare established and maintained.
₋ Driving range is self-regulated:• Frequent use maintains the vessel cold and
enables high density refueling• Infrequent use warms up vessel and reduces fill
density, avoiding fuel venting₋ Higher pressure helps reduce driving range variations
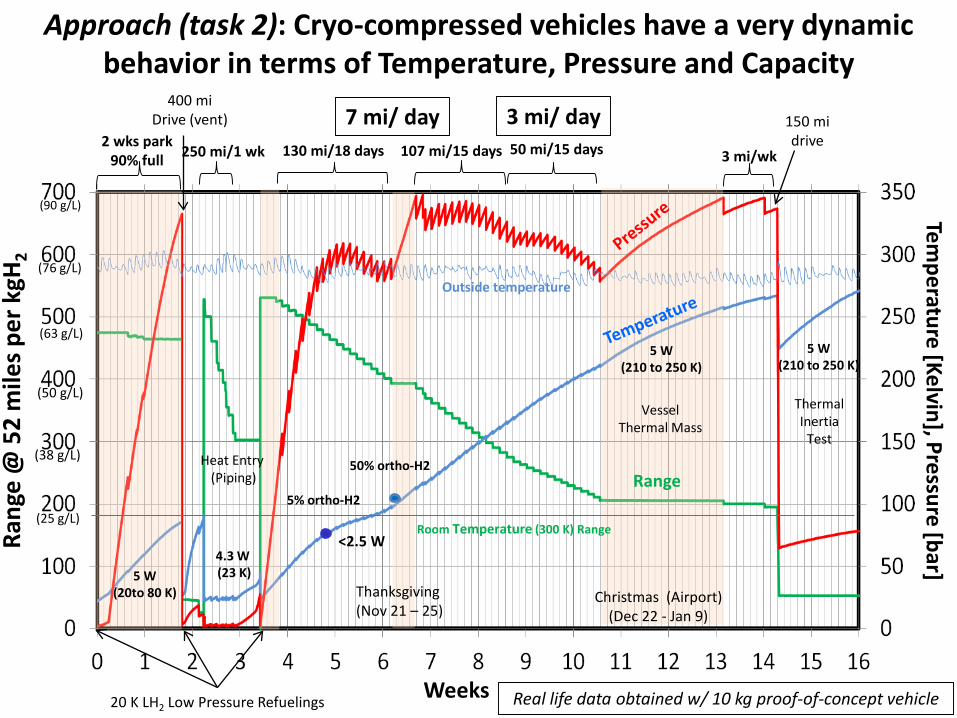
2 wks park90% full
400 miDrive (vent)
250 mi/1 wk
20 K LH2 Low Pressure Refuelings
(90 g/L)
(76 g/L)
(50 g/L)
130 mi/18 days
Thanksgiving (Nov 21 – 25)
107 mi/15 days 50 mi/15 days
Christmas (Airport)(Dec 22 - Jan 9)
150 midrive
3 mi/wk
Room Temperature (300 K) Range
Outside temperature
Weeks
Temperature [Kelvin], Pressure [bar]
Rang
e @
52
mile
s per
kgH
2
(25 g/L)
(38 g/L)
Range50% ortho-H2
5% ortho-H2
4.3 W (23 K)5 W
(20to 80 K)
5 W(210 to 250 K)
5 W(210 to 250 K)
Thermal Inertia
Test
VesselThermal Mass
Heat Entry (Piping)
<2.5 W
(63 g/L)
Approach (task 2): Cryo-compressed vehicles have a very dynamic behavior in terms of Temperature, Pressure and Capacity
7 mi/ day 3 mi/ day
Real life data obtained w/ 10 kg proof-of-concept vehicle