
Laurence Booth Sean Cleary. LEARNING OBJECTIVES Financial Statement Analysis and Forecasting 4...
50
Laurence Booth Sean Cleary
-
Upload
sharlene-king -
Category
Documents
-
view
217 -
download
0
Transcript of Laurence Booth Sean Cleary. LEARNING OBJECTIVES Financial Statement Analysis and Forecasting 4...

Laurence Booth
Sean Cleary

LEARNING OBJECTIVESLEARNING OBJECTIVES
Financial Statement Analysis and Forecasting44.1 Identify the issues that need to be considered in applying
consistent financial analysis.4.2 Explain why return on equity is one of the key financial
ratios used for assessing a firm’s performance, and how it can be used to provide information about three areas of a firm’s operations.
4.3 Describe, calculate and evaluate the key ratios relating to financial leverage.
4.4 Describe, calculate and evaluate the key ratios relating to financial efficiency.
4.5 Describe, calculate and evaluate the key ratios relating to financial productivity. (continued)

LEARNING OBJECTIVESLEARNING OBJECTIVES
Financial Statement Analysis and Forecasting4
4.6 Describe, calculate and evaluate the key ratios relating to financial liquidity.
4.7 Describe, calculate and evaluate the key ratios relating to the valuation of a company.
4.8 Explain why financial forecasting is critical for both management and external parties, and explain how to prepare financial forecasts using the percentage of sales method.
4.9 Explain how external financing requirements are related to sales growth, profitability, dividend payouts, and sustainable growth rates.
4.10 Apply financial forecasting to a real company.

4© John Wiley & Sons Canada, Ltd.
4.1 CONSISTENT FINANCIAL ANALYSIS
• Consistent financial analysis across companies, industries and countries is important
• Analysts must understand the challenges to comparability and attempt to ascertain the financial health of the organizations they study, understanding the limitations inherent in financial accounting practice
Booth • Cleary – 3rd Edition

5© John Wiley & Sons Canada, Ltd.
4.2 A FRAMEWORK FOR FINANCIAL ANALYSIS• Financial statement analysis studies, absolute numbers,
comparative statements and ratios to:– Ascertain trends in the financial statements– Identify areas of strength and concern
• The DuPont System gives a framework for the analysis of financial statements through the decomposition of the return on equity (ROE) ratio as shown in Figure 4-1:
Booth • Cleary – 3rd Edition

6© John Wiley & Sons Canada, Ltd.
• ROE is a function of:– Leverage, or the use of debt– Efficiency, the ability of a firm to control costs in relationship to
sales– Productivity, the degree to which a firm can generate sales in
relationship to the assets employed• ROE is not a pure ratio because it involves dividing an income
statement item (a flow) by a balance sheet (or stock) item, as in equations 4-1 and 4-7:
• Instead of using ending shareholders’ equity, many argue that average shareholders’ equity over the period should be used because shareholders’ equity changes over the year as income is earned and retained earnings grow
Booth • Cleary – 3rd Edition
SE
TA
TA
Sales
Sales
NI
SE
NIROE
Equity rs'Shareholde
IncomeNet
4.2 A FRAMEWORK FOR FINANCIAL ANALYSIS

7© John Wiley & Sons Canada, Ltd.
• Return on assets (ROA) shows the ratio of income to assets used to produce the income, and it can be further decomposed as the product of the net profit margin and sales to total assets ratio:
• Multiplying ROA by leverage (total assets divided by shareholders’ equity), we obtain ROE
• The DuPont system provides a good starting point for any financial analysis because:– It shows that financial strength comes from many sources:
profitability, asset utilization and leverage– It reinforces the concept that good financial analysis requires looking
at each ratio in the context of the others– It shows that it is important to look at a sample of ratios from each
major category to identify areas of strength and weaknessBooth • Cleary – 3rd Edition
TA
Sales
Sales
NI
TA
NIROA
4.2 A FRAMEWORK FOR FINANCIAL ANALYSIS

8© John Wiley & Sons Canada, Ltd.
• Tables 4-1 and 4-2 show an ROE analysis for Tim Hortons:
Booth • Cleary – 3rd Edition
4.2 A FRAMEWORK FOR FINANCIAL ANALYSIS

9© John Wiley & Sons Canada, Ltd.
• Table 4-3 shows an ROE analysis for two of Tim Hortons’ competitors: McDonald’s and Starbucks
• A ratio, by itself, is just a number; to judge if a ratio is “good” or “bad,” we must compare it for the same company over time (trend analysis), or to other companies in the same industry (industry analysis):
Booth • Cleary – 3rd Edition
4.2 A FRAMEWORK FOR FINANCIAL ANALYSIS

10© John Wiley & Sons Canada, Ltd.
• Financial leverage occurs when a firm uses sources of financing that carry a fixed cost, such as long-term debt, and uses this to generate greater returns to shareholders
• Leverage means magnification of both profits and losses
Booth • Cleary – 3rd Edition
4.2 A FRAMEWORK FOR FINANCIAL ANALYSIS

11© John Wiley & Sons Canada, Ltd.
4.3 LEVERAGE RATIOS
• Stock ratios indicate the amount of debt outstanding at a particular time– Leverage ratio– Debt ratio– Debt-equity ratio
• The debt ratio is a stock ratio that indicates the proportion of total assets financed by debt as at the balance sheet date; as in Equation 4-8:
Booth • Cleary – 3rd Edition
TA
TL
Assets Total
sLiabilitie Total RatioDebt

12© John Wiley & Sons Canada, Ltd.
• The debt-equity (D/E) ratio is a stock ratio that indicates the proportion that total debt represents in relationship to the shareholders’ equity (both common stock and retained earnings) at the balance sheet date; as in Equation 4-9:
• The times interest earned (TIE) ratio is an income statement (flow) ratio that indicates the number of times the firm’s pre-tax income (EBIT, earnings before interest and taxes) exceeds its fixed financial obligations to its lenders; as in Equation 4-10:
Booth • Cleary – 3rd Edition
SE
D
Equity rs'Shareholde
Debt Total RatioEquity -Debt
Expense Interest (TIE) EarnedInterest Times
EBIT
4.3 LEVERAGE RATIOS

13© John Wiley & Sons Canada, Ltd.
• The cash flow to debt ratio measures how long it would take to pay off a firm’s debt using cash flow from operations; as in Equation 4-11:
Booth • Cleary – 3rd Edition
Debt Total
Operations from FlowCash RatioDebt toFlowCash
4.3 LEVERAGE RATIOS

14© John Wiley & Sons Canada, Ltd.
• Table 4-4 shows Tim Hortons’ leverage ratios• Tim Hortons’ leverage ratios show that the amount of debt as a
percentage of total financing increased slightly during 2011, and the coverage ratio declined very slightly
• Comparing Tim Hortons with McDonald’s and Starbucks, we can see that Tim Hortons had a much lower percentage of debt financing than McDonald’s, and its coverage ratios were much better
Booth • Cleary – 3rd Edition
4.3 LEVERAGE RATIOS

15© John Wiley & Sons Canada, Ltd.
4.4 EFFICIENCY RATIOS
• Efficiency ratios measure how efficiently a dollar of sales is turned into profits; these include:– Degree of total leverage– Break-even point– Gross profit margin– Operating margin
• Efficiency ratios give insight into a firm’s cost structure and can help analysts determine if problems exist with either variable or fixed costs, or both
Booth • Cleary – 3rd Edition

16© John Wiley & Sons Canada, Ltd.
• Degree of total leverage (DTL) is an income statement ratio that measures the exposure of profits to changes in sales, as in Equation 4-12:
• The greater the DTL, the greater the leverage effect• The break-even point estimates the unit volume that must be produced
and sold in order for the firm to cover all costs, both fixed and variable, as in Equation 4-13:
• The break-even point tends to increase as the use of fixed costs increases
Booth • Cleary – 3rd Edition
EBT
CM
Taxes Before Earnings
Marginon Contributi Leverage Total of Degree
CM
FC
Marginon Contributi
Costs Fixed Point EvenBreak
4.4 EFFICIENCY RATIOS

17© John Wiley & Sons Canada, Ltd.
• Gross profit margin demonstrates the proportion of sales that are available to cover fixed (period) costs and financing expenses after variable costs have been paid, as in Equation 4-14:
• A declining gross profit margin raises concerns about the firm’s ability to control variable costs, such as direct materials and labour
• The operating margin measures the cumulative effect of both variable and period costs on the ability of the firm to turn sales into operating profits to cover interest, taxes, depreciation and amortization (EBITDA), as in Equation 4-15:
Booth • Cleary – 3rd Edition
vRe
COSvRe
Revenue
Sales ofCost - Revenue Margin Profit Gross
vRe
OI
Revenue
Income Operating Margin Operating
4.4 EFFICIENCY RATIOS

18© John Wiley & Sons Canada, Ltd.
• Table 4-6 shows Tim Hortons’ efficiency ratios• Tim Hortons maintained steady profitability, but lower gross
profit margins than McDonald’s and Starbucks• However, Tim Hortons maintained operating profit margins
and net profit margins that were higher than Starbucks’, but lower than McDonald’s.
• Table 4-6 shows that Tim Hortons has displayed consistent, strong profitability over the 2008–11 period
Booth • Cleary – 3rd Edition
4.4 EFFICIENCY RATIOS

19© John Wiley & Sons Canada, Ltd.
4.5 PRODUCTIVITY RATIOS
• Productivity ratios measure the firm’s ability to generate sales from its assets; these include:– Receivables turnover– Average collection period (ACP)– Inventory turnover– Average days sales in inventory (ADSI)– Fixed asset turnover
• Excessive investment in assets with little or no increase in sales reduces the rate of return on both assets (ROA) and equity (ROE)
Booth • Cleary – 3rd Edition

20© John Wiley & Sons Canada, Ltd.
• Receivables turnover measures the sales generated by every dollar of receivables, as in Equation 4-16:
• Average collection period (ACP) estimates the number of days it takes for a firm to collect on its accounts receivable, as in Equation 4-17:
• Example: If ACP is 40 days, and the firm’s credit policy is net 30, clearly customers are not paying according the to firm’s policies and there may be concerns about the quality of customer’s credit and what might happen if economic conditions deteriorate
Booth • Cleary – 3rd Edition
AR
vRe
Receivable Accounts
Revenue Turnover sReceivable
Turnover Receivable
365
SalesCredit Daily Average
Receivable Accounts Period Collection Average
4.5 PRODUCTIVITY RATIOS

21© John Wiley & Sons Canada, Ltd.
• Inventory turnover measures the number of times ending inventory was “turned over” or sold during the year, as in equations 4-18 and 4-19:
• When cost of goods sold is not publicly available, the inventory turnover ratio can be estimated using sales instead, as in Equation 4-19
• Using sales instead of cost of good sold is not ideal, because while cost of goods sold is based on inventoried cost, sales includes a profit margin that may not be comparable to other firms
Booth • Cleary – 3rd Edition
Inventory
Rev OR
Inventory
Sold Goods ofCost Turnover Inventory
4.5 PRODUCTIVITY RATIOS

22© John Wiley & Sons Canada, Ltd.
Inventory turnover (continued)
• This is a ratio that involves both stock and flow values and is strongly a function of ending inventory
• Managers often try to improve this ratio as they approach year end through inventory reduction strategies (e.g., cash and carry sales, inventory clearance, etc.)
• year end through inventory reduction strategies (e.g., cash and carry sales, inventory clearance, etc.)
Booth • Cleary – 3rd Edition
4.5 PRODUCTIVITY RATIOS

23© John Wiley & Sons Canada, Ltd.
• Average Days Sales in Inventory (ADSI) estimates the number of days of sales tied up in inventory, based on ending inventory values, as in Equation 4-20:
• Fixed asset turnover estimates the number of dollars of sales produced by each dollar of net fixed assets, as in Equation 4-21:
Booth • Cleary – 3rd Edition
TurnoverInventory
365
SalesDaily Average
Inventory (ADSI)Inventory in Sales Days Average
Assets FixedNet
Sales Turnover Asset Fixed
4.5 PRODUCTIVITY RATIOS

24© John Wiley & Sons Canada, Ltd.
• Table 4-7 shows Tim Hortons’ productivity ratios:
Booth • Cleary – 3rd Edition
4.5 PRODUCTIVITY RATIOS

25© John Wiley & Sons Canada, Ltd.
4.6 LIQUIDITY RATIOS
• Liquidity ratios measure the ability of the firm to meet its financial obligations as they mature using liquid (i.e., cash and near cash) resources; these include:– Working capital– Current– Quick (acid test)
• The working capital ratio measures the proportion of total assets invested in current assets, as in Equation 4-22
• The working capital ratio demonstrates a firm’s capital intensity and corporate liquidity
Booth • Cleary – 3rd Edition
TA
CA
Assets Total
AssetsCurrent Capital Working

26© John Wiley & Sons Canada, Ltd.
• The current ratio measures the number of dollars of current assets for each dollar of current liabilities, as in Equation 4-23:
• The current ratio estimates the capacity of the firm to meet its financial obligations as they mature
• The quick ratio or acid test ratio recognizes that inventories and other current assets may be less liquid and, in some cases, when liquidated quickly, can result in cash flows that are less than book value
• Therefore, the quick ratio gives a clearer indication of the firm’s ability to meet its maturing financial obligations out of very liquid current assets, as in Equation 4-24:
Booth • Cleary – 3rd Edition
CL
CA
sLiabilitieCurrent
AssetsCurrent ratioCurrent
CL
ARMSC
sLiabilitieCurrent
Receivable Accounts Securites Marketable Cash ratioQuick
4.6 LIQUIDITY RATIOS

27© John Wiley & Sons Canada, Ltd.
• Table 4-8 shows Tim Hortons’ liquidity ratios• For 2011 Tim Hortons’ quick ratio is less than 1, which indicates that
the company could not pay off all of its current liabilities from its “quick” (i.e., most liquid) assets
• Tim Hortons’ current ratios were higher than McDonald’s and Starbucks’ over the entire period, except for 2008 when McDonalds had a higher ratio, and in 2011 when Starbucks’ was higher.
• However, Tim Hortons’ quick ratios were generally below those for McDonald’s, but above those for Starbucks with the exception of 2011
Booth • Cleary – 3rd Edition
4.6 LIQUIDITY RATIOS

28© John Wiley & Sons Canada, Ltd.
• Estimating Net Realizable Values– When firms are financially strained and no longer a going
concern, book (accounting) values become less valid– Instead, net liquidation values can be estimated by
discounting asset values based on their degree of liquidity– Liquid assts are valued at close to or the same as book
value– Illiquid assets are discounted from book value based on
their degree of liquidity– Liabilities are stated in nominal terms, because it takes
those dollars to satisfy debt obligations– Preferred stock value is based on residual values, if any
residual remains after liquidation
Booth • Cleary – 3rd Edition
4.6 LIQUIDITY RATIOS

29© John Wiley & Sons Canada, Ltd.
4.7 VALUATION RATIOS• Valuation ratios are used to assess how the market is
valuing the firm (i.e., its share price) in relation to its assets, earnings, profits and dividends; these include:– Equity book value per share (BVPS)– Dividend yield– Dividend payout– Trailing Price-earnings (P/E)– Forward P/E– Market-to-book– Earnings before interest, taxes, depreciation and
amortization (EBITDA) multipleBooth • Cleary – 3rd Edition

30© John Wiley & Sons Canada, Ltd.
• Book value per share (BVPS) expresses shareholders’ equity on a per share basis, as in Equation 4-25:
• Dividend yield expresses the dividend payout as a proportion of the current share price, as in Equation 4-26:
• The dividend yield can be compared to the yield on other investment instruments, such as bonds or the stocks of other dividend-paying companies
Booth • Cleary – 3rd Edition
Shares ofNumber
Equity rs'Shareholde SharePer ValueBook
P
DPS
SharePer Price
SharePer Dividend Yield Dividend
4.7 VALUATION RATIOS

31© John Wiley & Sons Canada, Ltd.
• The price-earnings (P/E) ratio is an earnings multiple based on the most recent earnings, as in Equation 4-28:
• The price-earnings (P/E) ratio is often used to estimate the value of a stock• Example: A stock trading at a P/E multiple of 10 will take 10 years at
current earnings to recover its price• The forward P/E ratio is an earnings multiple based on forecast earnings
per share and is often used to estimate the value of a stock for companies with rapid growth in EPS, as in Equation 4-29:
• Low P/E shares are regarded as value stocks• High P/E shares are regarded as growth stocks
Booth • Cleary – 3rd Edition
EPS
P
SharePer Earnings
Price Share P/E
EEPS
P
SharePer Earnings Estimated
Price Share P/E Forward
4.7 VALUATION RATIOS

32© John Wiley & Sons Canada, Ltd.
• The market-to-book ratio estimates the dollars of share price per dollar of book value per share, as in Equation 4-30:
• Given historical cost accounting as the basis for BVPS, the degree to which market value per share exceeds BVPS indicates the value that has been added to the company by management
• The EBITDA multiple expresses total enterprise value (TEV) for each dollar of operating income, or earnings before interest, taxes, depreciation and amortization (EBITDA), as in Equation 4-31:
• Total enterprise value is an estimate of the market value of the firm, i.e., the market value of both its equity and its debt
Booth • Cleary – 3rd Edition
BVPS
P
SharePer ValueBook
Price Share book -to-Market
EBITDA
TEV Multiple EBITDA
4.7 VALUATION RATIOS

33© John Wiley & Sons Canada, Ltd.
• Table 4-10 shows valuation ratios for Tim Hortons• Tim Hortons’ 2011 dividend yield of 1.38 percent is slightly
higher than its 2010 value, but is lower than McDonald’s yield of 2.7 percent, but above Starbucks’ ratio of 1.01 percent.
Booth • Cleary – 3rd Edition
4.7 VALUATION RATIOS

34© John Wiley & Sons Canada, Ltd.
4.8 FINANCIAL FORECASTING• Financial managers must produce forecasts of the results of business plans
in order to:– Determine if the plans will require additional external financing– Determine if the plans will produce surplus cash resources that could
be distributed to shareholders as dividends– Assess financial forecasts to determine if plans are feasible; if poor
results are forecast, management has the opportunity to amend plans in an attempt to produce better results before resources and committed
• The basis for all financial forecasts is the sales forecast and the most recent balance sheet values are the starting point
• Pro forma (forecast) balance sheets are projected, assuming some relationship with projected sales as a constant percentage of sales
• Current liabilities are usually assumed to rise and fall in a constant percentage with sales, and are called spontaneous liabilities because they change without negotiation with creditors
Booth • Cleary – 3rd Edition

35© John Wiley & Sons Canada, Ltd.
• The percentage of sales method involves the following steps:1. Determine the financial policy variables in which you are interested2. Set all the non-financial policy variables as a percentage of sales3. Extrapolate the balance sheet based on a percentage of sales4. Estimate future retained earnings5. Modify and re-iterate until the forecast makes sense
• This process most often results in a balance sheet that does not balance, so a “plug” (or balancing) amount is the external funds required, or the surplus funds forecast
Booth • Cleary – 3rd Edition
4.8 FINANCIAL FORECASTINGThe Percentage of Sales Method

36© John Wiley & Sons Canada, Ltd.Booth • Cleary – 3rd Edition
4.8 FINANCIAL FORECASTINGThe Percentage of Sales Method

37© John Wiley & Sons Canada, Ltd.
• The prior pro forma balance sheet was developed using very naïve assumptions:– Policy variables held constant– Asset growth in all accounts held at
the same percentage of sales– Spontaneous liabilities increased at a
constant percentage of sales• One improvement is to realize that the
firm’s equity will grow by the amount of retained earnings
• Note that in Table 4-13 retained earnings is net income (6) less dividends (3). Assuming the firm holds this percentage constant, we can project an increase in equity on the balance sheet as 50% of the 5% profit margin or 2.5% of sales.
Booth • Cleary – 3rd Edition
4.8 FINANCIAL FORECASTINGThe Percentage of Sales Method

38© John Wiley & Sons Canada, Ltd.Booth • Cleary – 3rd Edition
4.8 FINANCIAL FORECASTINGThe Percentage of Sales Method

39© John Wiley & Sons Canada, Ltd.
• Further improvements to the pro forma balance sheet include:– Recognizing that cash balances may not have to rise
as a constant percentage of sales– Cash balances are required for a variety of reasons: to
support transactions, as a safety cushion against unforeseen cash needs, and as a speculative balance to take advantage of unforeseen opportunities
– Even at low levels of sales, cash balances are required– As sales increase, additional cash on hand may be
required, but at a decreasing percentage of salesBooth • Cleary – 3rd Edition
4.8 FINANCIAL FORECASTINGThe Percentage of Sales Method

40© John Wiley & Sons Canada, Ltd.
• Figure 4-3 illustrates the difference between a simple percentage of sales forecast, and perhaps a more realistic forecast that includes a base amount (constant) and a decreasing percentage of sales
Booth • Cleary – 3rd Edition
4.8 FINANCIAL FORECASTINGThe Percentage of Sales Method

41© John Wiley & Sons Canada, Ltd.
• Further improvements to the pro forma balance sheet include re-examining asset growth assumptions:– Refinement of the cash forecast– Realization that EFR can be offset by marketable securities that can be
easily liquidated to finance growth needs– Re-examination of assumptions of accounts receivable growth and
whether we want to change credit policies in the context of the forecast macroeconomic and competitive environment
– Re-examination of inventory management policies taking into account the macroeconomic and competitive environment
– Realization that increases in net fixed assets is “lumpy” and not continuously incremental; if the firm has excess capacity, it may not need to invest any further in fixed assets until it is forecast to exceed that capacity
• Additional improvements also include re-examining assumptions about growth in spontaneous liabilities
Booth • Cleary – 3rd Edition
4.8 FINANCIAL FORECASTINGThe Percentage of Sales Method

42© John Wiley & Sons Canada, Ltd.Booth • Cleary – 3rd Edition
4.8 FINANCIAL FORECASTINGThe Percentage of Sales Method

43© John Wiley & Sons Canada, Ltd.
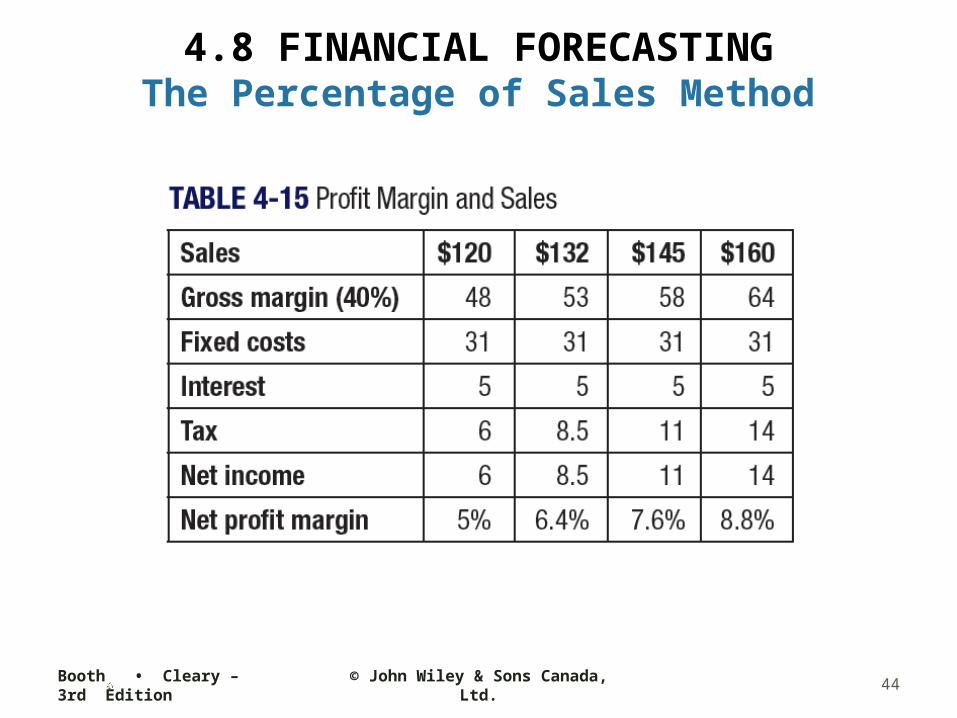
• Given assumptions about capacity, and there being no need for further expansion in plant and equipment to support anticipated sales growth, we can re-examine our assumptions about the cost structure of the firm
• Figure 4-16 (next slide) shows the effects of these changes on the pro forma income statement
• Variable costs (direct materials and direct labour) will likely grow in proportion to sales
• Fixed costs, however, should remain fixed; by modifying the income statement for this change in assumptions, we see the net result of this is an increase in forecast net income
• Most firms do not follow a constant dividend payout ratio, but hold dividends constant over multiple years; we will assume $3 dividends will be paid for the next three years
Booth • Cleary – 3rd Edition
4.8 FINANCIAL FORECASTINGThe Percentage of Sales Method
44© John Wiley & Sons Canada, Ltd.Booth • Cleary – 3rd Edition
4.8 FINANCIAL FORECASTINGThe Percentage of Sales Method

45© John Wiley & Sons Canada, Ltd.
• Given our modified income statement and assumptions regarding net profit and cash dividends, we can prepare a final revised balance sheet
• The balance sheet now shows we forecast significant surplus cash resources and must make some decisions about their management: should they be invested in marketable securities or paid as dividends?
Booth • Cleary – 3rd Edition
4.8 FINANCIAL FORECASTINGThe Percentage of Sales Method

46© John Wiley & Sons Canada, Ltd.
4.9 FORMULA FORECASTING• We can express the foregoing percentage of sales method of
forecasting using equations rather than spreadsheets• Equation 4-32 shows the external financing requirements
(EFR): EFR = a × S × g – b × PM × (1 + g) × S• where:
a = the treasurer’s financial policy variable, the total invested capital or net assets of the firm as a percentage of its salesg = sales growth rateS = current period salesS × g = next period salesa × S × g = incremental capital requiredPM = profit margin on salesB = payout ratio1 – b = retention or plowback ratio
Booth • Cleary – 3rd Edition

47© John Wiley & Sons Canada, Ltd.
• External financing requirements can also be expressed as a linear function of the sales growth rate (g) by dividing both sides of Equation 4-32 by the current sales level to obtain Equation 4-33:
• Equation 4-33 is plotted in Figure 4-4; the sustainable growth rate (g*) occurs where the blue line intersects the horizontal axis
Booth • Cleary – 3rd Edition
gPMbaPMbS
EFR)(
4.9 FORMULA FORECASTING

48© John Wiley & Sons Canada, Ltd.
• The sustainable growth rate (g*) is the sales growth rate at which the firm neither generates nor needs external financing; it can sustain its own rate of growth through the reinvestment of its own profits. Equation 4-34 gives the sustainable growth rate:
• When g > g*, EFR > 0 (external financing will be required)• When g = g*, EFR = 0 (the firm can finance its own growth
with retained earnings)• When g < g*, EFR < 0 (the firm will have surplus funds
available after financing its planned growth)
Booth • Cleary – 3rd Edition
PMba
PMbg
*
4.9 FORMULA FORECASTING

© John Wiley & Sons Canada, Ltd.
WEB LINKS
Wiley Weekly Finance Updates site (weekly news updates): http://wileyfinanceupdates.ca/
Textbook Companion Website (resources for students and instructors): www.wiley.com/go/boothcanada
Booth • Cleary – 3rd Edition 49

Copyright © 2013 John Wiley & Sons Canada, Ltd. All rights reserved. Reproduction or translation of this work beyond that permitted by Access Copyright (the Canadian copyright licensing agency) is unlawful. Requests for further information should be addressed to the Permissions Department, John Wiley & Sons Canada, Ltd. The purchaser may make back-up copies for his or her own use only and not for distribution or resale. The author and the publisher assume no responsibility for errors, omissions, or damages caused by the use of these files or programs or from the use of the information contained herein.
COPYRIGHTCopyright © 2013 John Wiley & Sons Canada, Ltd. All rights reserved. Reproduction or translation of this work beyond that permitted by Access Copyright (the Canadian copyright licensing agency) is unlawful. Requests for further information should be addressed to the Permissions Department, John Wiley & Sons Canada, Ltd. The purchaser may make back-up copies for his or her own use only and not for distribution or resale. The author and the publisher assume no responsibility for errors, omissions, or damages caused by the use of these files or programs or from the use of the information contained herein.
COPYRIGHT


![[PPT]Chapter 1 - An Introduction to Finance · Web viewINTRODUCTION TO CORPORATE FINANCE Laurence Booth • W. Sean Cleary Prepared by Ken Hartviksen Lecture Agenda Learning Objectives](https://static.fdocuments.net/doc/165x107/5aa3fc217f8b9a7c1a8b8635/pptchapter-1-an-introduction-to-finance-viewintroduction-to-corporate-finance.jpg)
![[PPT]Introduction to Corporate Finance - John Wiley & Sons · Web viewINTRODUCTION TO CORPORATE FINANCE Laurence Booth • W. Sean Cleary Prepared by Ken Hartviksen Lecture Agenda](https://static.fdocuments.net/doc/165x107/5ac332217f8b9a12608b9edb/pptintroduction-to-corporate-finance-john-wiley-sons-viewintroduction-to-corporate.jpg)


