Laura J. Kornish1 Leeds School of Business University of...
32
Are User Reviews Systematically Manipulated? Evidence from the Helpfulness Ratings Laura J. Kornish 1 Leeds School of Business University of Colorado at Boulder Boulder, CO 80309-0419 [email protected] December 15, 2009 1 I gratefully acknowledge assistance and suggestions from John Butler, David Godes, Kelly Herd, Kai Larsen, Gary McClelland, Karl Ulrich, and the participants at the 2009 Marketing Science Conference in Ann Arbor.
Transcript of Laura J. Kornish1 Leeds School of Business University of...
Are User Reviews Systematically Manipulated? Evidence from the Helpfulness Ratings
Laura J. Kornish1
Leeds School of Business
University of Colorado at Boulder
Boulder, CO 80309-0419
December 15, 2009
1 I gratefully acknowledge assistance and suggestions from John Butler, David Godes, Kelly Herd, Kai Larsen, Gary McClelland, Karl Ulrich, and the participants at the 2009 Marketing Science Conference in Ann Arbor.
1
Are User Reviews Systematically Manipulated? Evidence from the Helpfulness Ratings
Abstract
There is a lot of evidence that people place great weight on online user reviews. And yet there are
many reports of mischief in reviews, such as the January 2009 incident with a Belkin manager
publicly offering sixty-five cents for positive reviews of their products. Is the high level of trust
warranted when there are so many motives and opportunities for manipulating reviews? That question
motivates this work. We propose a way to quantify the extent of manipulation in online user reviews.
Our approach is based on the idea that the combination of the review data and the helpfulness ratings
of the reviews that many sites now offer (the answers to the “was this review helpful to you?”
question, what we call “metareview data”) provides clues to manipulative behavior. If a highly
motivated segment of the reviewing population has an agenda to push for a product, then they would
use both the reviews to express their views and the helpfulness ratings to reinforce those views:
someone promoting a product would write a favorable review, mark other favorable reviews as
helpful, and mark unfavorable reviews as unhelpful. That double voting leaves an identifiable trail in
the data. We argue that such trails are circumstantial evidence of manipulation, and therefore call into
question the credibility of the review data itself. Our findings are based on five data sets: elliptical
trainers from Amazon (76 products, with 1,378 reviews in total, and 9,548 helpfulness votes),
computer accessories from Amazon (370 products, 3,599 reviews, 16,495 votes), snack products from
Amazon (1,201 products, 7,319 reviews, 11,742 votes), iPhone applications from the iTunes store
(100 products, 7,509 reviews, 14,842 votes), and companies from Vanno, a company reputation
website (586 companies, 7,636 submissions, 281,047 votes). In all of our data sets, we find that
manipulation clearly is not the dominant mode of behavior. However, in the Amazon and iTunes data
sets, we see that while manipulation is not dominant, it is still prevalent. Using our “minimum
distance” approach, the models that predict manipulation are the best match for as low as 20% (for the
elliptical trainers) and as high as 47% (for the snack products). The computer accessories and iTunes
apps are in between. The Vanno data set shows almost no evidence of manipulation, at less than 1%.
2
Introduction
Word of mouth has long been recognized as a powerful force in influencing buying behavior. In the
last decade, it has increasingly taken place on the Internet, among strangers. There is mounting
evidence from industry surveys that people consider online information sources highly credible. For
example, 99% of respondents in a survey said they found consumer-generated online user reviews
credible or somewhat credible (Deloitte & Touche USA, 2007). Another report finds that 83.8% of
people said they would trust user reviews over a critic (Marketing Sherpa, 2007). In an aptly-titled
report “When Did We Start Trusting Strangers?” we see that consumer reviews on retail sites are the
fifth most trusted source out of thirty-two (Universal McCann, 2008). The top four sources all are
recommendations from someone the respondent knows personally. Lightspeed Research finds that
over 70% of respondents will be dissuaded from purchase by reading three or fewer negative reviews
(Lightspeed Research, 2008). These industry reports paint a picture of a high level of trust.
And yet, there are countless ways that this trust can be violated. Mayzlin (2006) concludes that the
anonymity of the web makes it a breeding ground for “promotional chat,” positive statements about
products planted by people with a vested interest. There is no shortage of anecdotes to illustrate
Mayzlin’s conclusions. For example, In January 2009, a marketing manager from Belkin, a company
that sells computer peripherals, was caught soliciting fabricated reviews. The Belkin manager posted
messages on Amazon’s Mechanical Turk bulletin board offering people sixty-five cents for positive
reviews of his products. He noted in his posting that one need not be familiar with the product in
question. Furthermore, he asks people to mark other reviews as unhelpful (InformationWeek, 2008).
Belkin is not alone. The company DeLonghi stirred up a controversy when the communications
manager was caught writing glowing reviews about twelve of their products, including multiple high-
end espresso machines (Pilon, 2009). The publisher Elsevier was the subject of an exposé in which
they offered people $25 gift cards for positive reviews of textbooks (Northrup, 2009). At
resellerratings.com, members were greeted with this warning in May 2009: “Important! Please create
a unique password for ResellerRatings. Unscruplous retailers have logged in to edit a user’s reviews
without permission when the user used the same username & password here as they did at the
merchant’s site.” The iPhone developer Molinker was banned from selling over one thousand
3
applications in the App Store due to evidence of fake reviews (telegraph.co.uk, 2009). These
anecdotes give a glimpse of the potential for mischief in online user reviews.
How can the trust and the manipulation co-exist? This paradox—the high level of trust in online
reviews and the “everybody’s doing it” sentiment around manipulation—motivates this work. One
explanation could be that even if many firms have organized efforts to create promotional chat, those
rumbles are not enough to drown out the roar of “unbiased,” or at least unaffiliated, consumers who,
presumably, make up the bulk of activity on review sites. Mayzlin’s (2006) conclusion supports the
coexistence of trust and manipulation. She finds that “[o]nline advice is biased but still persuasive.”
This means that even counting the planted comments from promotional chat, higher quality products
will still have better overall reviews. Supporting that theory, Chevalier and Mayzlin (2006),
Dellarocas et al. (2008), and Moe (2009) show a positive relationship between user reviews and sales
of products. The findings in Hennig-Thurau et al. (2004) also support the idea that online reviews can
be credible. Those authors catalog the varied motives people have in generating content online, most
of which do not obviously appear manipulative. These motives include strong feelings about a
product, altruism, a desire to appear as an expert, a desire to help the company, and a desire to
retaliate against the company.
In this paper, we attempt to tackle the question of just how big a problem is manipulation in online
user reviews. We feel that this is an important question, and it is probably one with no definitive
answer, but we have a new approach that we believe sheds some light on the question. To do that, we
test whether people’s natural theories about how review sites might be gamed are, in fact, realized.
We articulate those theories by asking how overtly manipulative reviewers would behave. That
behavior implies suspicious patterns; we look for those patterns in data that is widely available on
user review sites.
Our approach is based on the idea that the combination of the review data and the helpfulness ratings
of the reviews that many sites now offer (the answers to the “was this review helpful to you?”
question, what we call “metareview data”) provides clues to manipulative behavior. If a highly
motivated segment of the reviewing population has an agenda to push for a product, then they would
use both the reviews to express their views and the helpfulness ratings to reinforce those views:
someone promoting a product would write a favorable review, mark other favorable reviews as
4
helpful, and mark unfavorable reviews as unhelpful. That double voting leaves an identifiable trail in
the data. We argue that such trails are circumstantial evidence of manipulation, and therefore call into
question the credibility of the review data itself.
Our findings show a range in prevalence of double voting patterns across the websites we study. The
company reputation website vanno.com exhibits virtually no evidence of it; in several categories in
Amazon and in the iTunes App store, we find it exists, but is definitely not the dominant mode of
behavior.
Audiences
This research has several audiences: the results are relevant to marketing managers, consumers,
review site hosts, and regulators.
Using our approach, a marketing manager for a product sold online can analyze readily available data
to make an informed judgment about how cutthroat the reviewing environment is in the category.
That is, they can determine the extent to which “everyone else” in their category is aggressively
chatting promotionally or destructively. If there does not seem to be significant manipulation, they
can avoid a reviewing arms race. If there does, managers may respond by encouraging their most
satisfied customers to write reviews or by raising the issue with online retailers or review site hosts.
In the introduction, we cite evidence that consumers rely on and trust online reviews. Some
consumers are savvy and approach reviews with skepticism. For them, we provide estimates about
how pervasive manipulative behavior appears to be on some popular sites. Other consumers need to
be made aware of the existence and extent of manipulation of reviews. We hope our results will
stimulate their persuasion knowledge (Friestad and Wright, 1994; Campbell and Kirmani, 2000) in
reading reviews.
Many websites that host user reviews (e.g., Amazon, walmart.com, TripAdvisor, CitySearch and
Yelp) make serious efforts to detect manipulative behavior in real time. For example, many of these
sites disallow multiple reviews or multiple votes on the same review from a single account. The
proposed metrics in this paper provide a big picture view and can detect patterns of manipulation that
are not caught with the real-time monitoring.
5
The Federal Trade Commission (FTC) has recently revised the endorsement guidelines (FTC, 2009;
Bustillo and Zimmerman, 2009; Schatz and Bustillo, 2009; Yao, 2009). The new guidelines clarify
the conditions under which an endorsement is considered sponsored and therefore must be disclosed.
These modernized guidelines specifically discuss how online chat on blogs (and, presumably, user
reviews) must adhere to the rules for disclosure.
Double voting = manipulation? Manipulation = fraud?
Before we move on to presenting our data and analysis, we stop to consider the question of what we
mean by manipulation. We suggest that there are some clear-cut cases of it, such as the Belkin
manager’s behavior, but there are other cases that are not as clear. Is encouraging customers to write
reviews manipulation? What about pinpointing specific customers you know are highly satisfied?
What if you pay them to write reviews? What about encouraging employees and friends to write good
reviews? Is that manipulation? As the Wall Street Journal reports, “There’s a new business model in
which the customers play an unaccustomed role—as investors….The customers then help promote the
product by posting messages on the Web” (Ordanini, 2009). Is this OK?
We raise these questions to make the point that measuring the extent of manipulation is confounded
by the difficulty in defining what manipulation is. And, even if we could define it, it would be
virtually impossible to certify cases of it with bulletproof evidence (e.g., smoking guns like the Belkin
bulletin board posts, which rarely exist). We feel that these inherent difficulties lend support to our
approach of detecting double voting pattern as a signature of manipulation, providing circumstantial
evidence that the reviewing population is purposely pushing their agendas.
Data, Theories of Behavior, and Models
Data structure
Our basic approach is as follows: for each product in a data set, compare the actual metareview
(helpfulness votes) distributions to each of several models (i.e., predicted distributions), based on
plausible theories of behavior. To carry out this approach, we collected review distributions and
metareview distributions for sets of products.
6
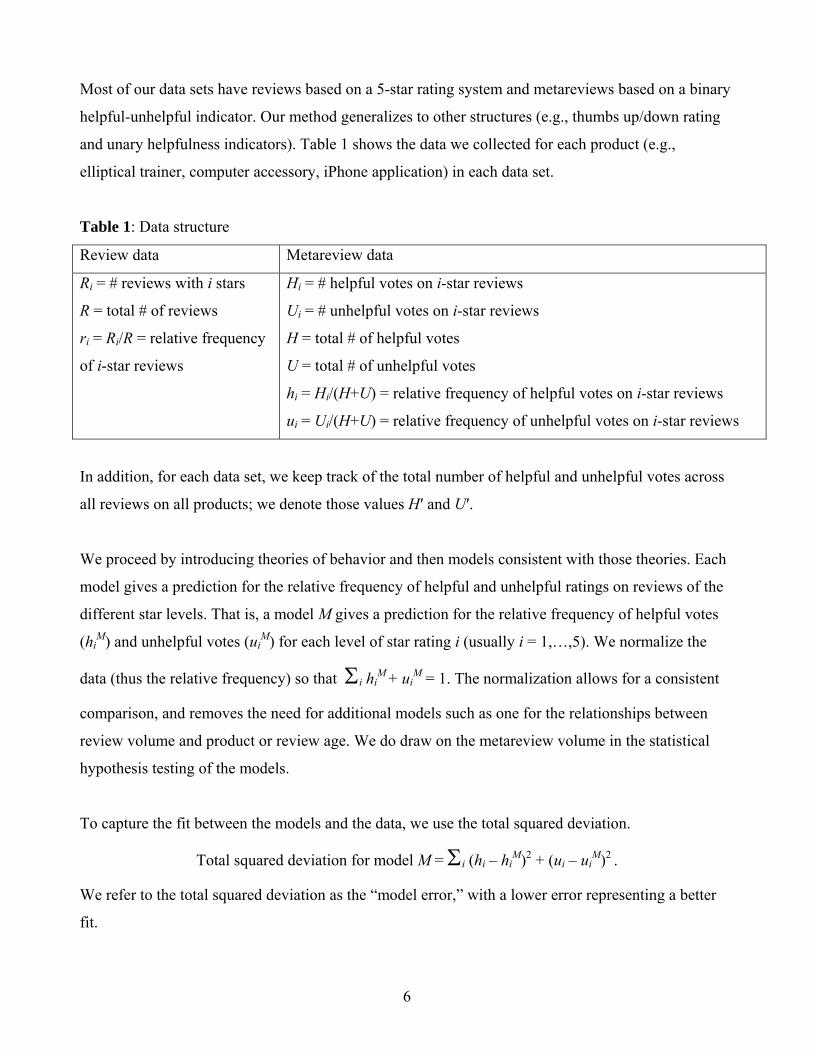
Most of our data sets have reviews based on a 5-star rating system and metareviews based on a binary
helpful-unhelpful indicator. Our method generalizes to other structures (e.g., thumbs up/down rating
and unary helpfulness indicators). Table 1 shows the data we collected for each product (e.g.,
elliptical trainer, computer accessory, iPhone application) in each data set.
Table 1: Data structure
Review data Metareview data
Ri = # reviews with i stars
R = total # of reviews
ri = Ri/R = relative frequency
of i-star reviews
Hi = # helpful votes on i-star reviews
Ui = # unhelpful votes on i-star reviews
H = total # of helpful votes
U = total # of unhelpful votes
hi = Hi/(H+U) = relative frequency of helpful votes on i-star reviews
ui = Ui/(H+U) = relative frequency of unhelpful votes on i-star reviews
In addition, for each data set, we keep track of the total number of helpful and unhelpful votes across
all reviews on all products; we denote those values H′ and U′.
We proceed by introducing theories of behavior and then models consistent with those theories. Each
model gives a prediction for the relative frequency of helpful and unhelpful ratings on reviews of the
different star levels. That is, a model M gives a prediction for the relative frequency of helpful votes
(hiM) and unhelpful votes (ui
M) for each level of star rating i (usually i = 1,…,5). We normalize the
data (thus the relative frequency) so that Σi hiM + ui
M = 1. The normalization allows for a consistent
comparison, and removes the need for additional models such as one for the relationships between
review volume and product or review age. We do draw on the metareview volume in the statistical
hypothesis testing of the models.
To capture the fit between the models and the data, we use the total squared deviation.
Total squared deviation for model M = Σi (hi – hiM)2 + (ui – ui
M)2 .
We refer to the total squared deviation as the “model error,” with a lower error representing a better
fit.
7
Data sources
Most of the data used in this analysis were collected from publicly available sources on Amazon and
iTunes; the company Vanno provided us their data directly. The data sources are described below.
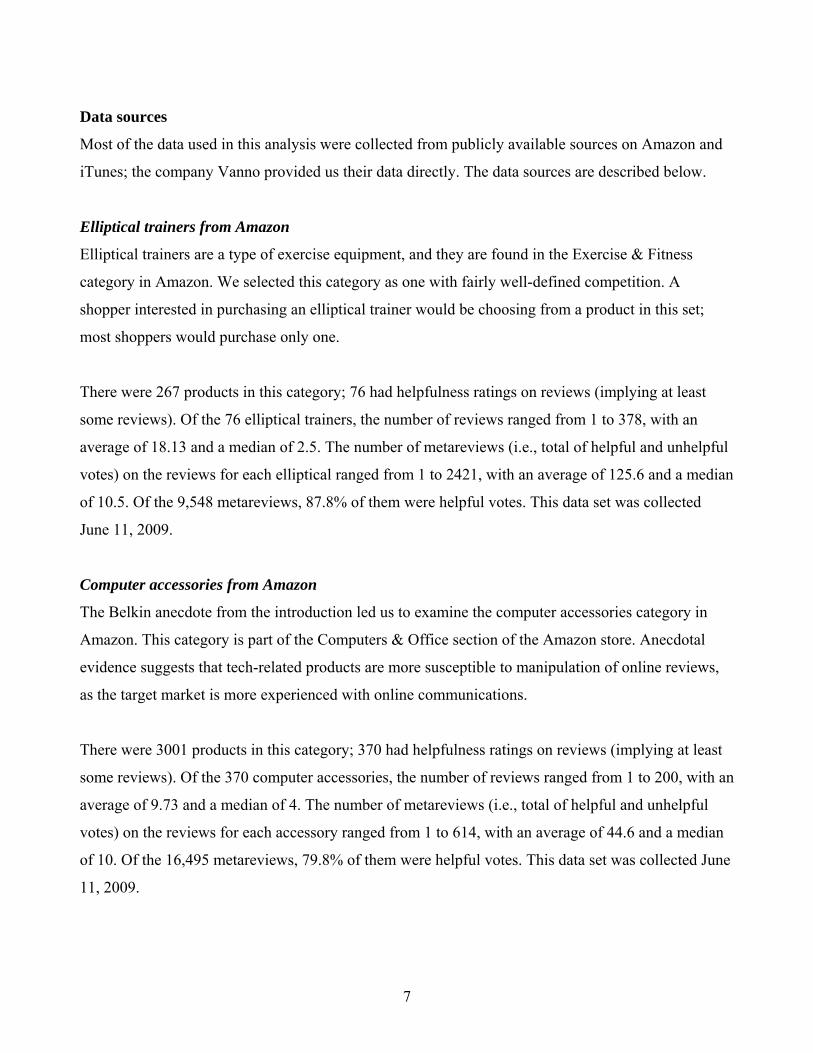
Elliptical trainers from Amazon
Elliptical trainers are a type of exercise equipment, and they are found in the Exercise & Fitness
category in Amazon. We selected this category as one with fairly well-defined competition. A
shopper interested in purchasing an elliptical trainer would be choosing from a product in this set;
most shoppers would purchase only one.
There were 267 products in this category; 76 had helpfulness ratings on reviews (implying at least
some reviews). Of the 76 elliptical trainers, the number of reviews ranged from 1 to 378, with an
average of 18.13 and a median of 2.5. The number of metareviews (i.e., total of helpful and unhelpful
votes) on the reviews for each elliptical ranged from 1 to 2421, with an average of 125.6 and a median
of 10.5. Of the 9,548 metareviews, 87.8% of them were helpful votes. This data set was collected
June 11, 2009.
Computer accessories from Amazon
The Belkin anecdote from the introduction led us to examine the computer accessories category in
Amazon. This category is part of the Computers & Office section of the Amazon store. Anecdotal
evidence suggests that tech-related products are more susceptible to manipulation of online reviews,
as the target market is more experienced with online communications.
There were 3001 products in this category; 370 had helpfulness ratings on reviews (implying at least
some reviews). Of the 370 computer accessories, the number of reviews ranged from 1 to 200, with an
average of 9.73 and a median of 4. The number of metareviews (i.e., total of helpful and unhelpful
votes) on the reviews for each accessory ranged from 1 to 614, with an average of 44.6 and a median
of 10. Of the 16,495 metareviews, 79.8% of them were helpful votes. This data set was collected June
11, 2009.
8
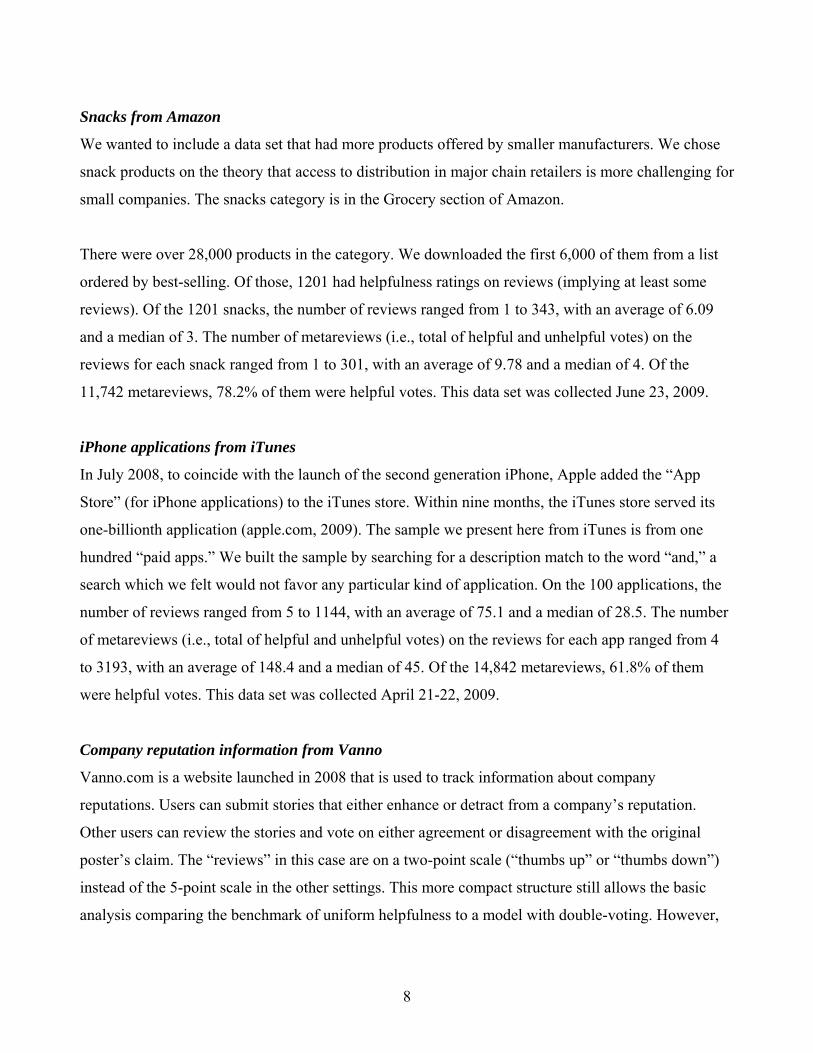
Snacks from Amazon
We wanted to include a data set that had more products offered by smaller manufacturers. We chose
snack products on the theory that access to distribution in major chain retailers is more challenging for
small companies. The snacks category is in the Grocery section of Amazon.
There were over 28,000 products in the category. We downloaded the first 6,000 of them from a list
ordered by best-selling. Of those, 1201 had helpfulness ratings on reviews (implying at least some
reviews). Of the 1201 snacks, the number of reviews ranged from 1 to 343, with an average of 6.09
and a median of 3. The number of metareviews (i.e., total of helpful and unhelpful votes) on the
reviews for each snack ranged from 1 to 301, with an average of 9.78 and a median of 4. Of the
11,742 metareviews, 78.2% of them were helpful votes. This data set was collected June 23, 2009.
iPhone applications from iTunes
In July 2008, to coincide with the launch of the second generation iPhone, Apple added the “App
Store” (for iPhone applications) to the iTunes store. Within nine months, the iTunes store served its
one-billionth application (apple.com, 2009). The sample we present here from iTunes is from one
hundred “paid apps.” We built the sample by searching for a description match to the word “and,” a
search which we felt would not favor any particular kind of application. On the 100 applications, the
number of reviews ranged from 5 to 1144, with an average of 75.1 and a median of 28.5. The number
of metareviews (i.e., total of helpful and unhelpful votes) on the reviews for each app ranged from 4
to 3193, with an average of 148.4 and a median of 45. Of the 14,842 metareviews, 61.8% of them
were helpful votes. This data set was collected April 21-22, 2009.
Company reputation information from Vanno
Vanno.com is a website launched in 2008 that is used to track information about company
reputations. Users can submit stories that either enhance or detract from a company’s reputation.
Other users can review the stories and vote on either agreement or disagreement with the original
poster’s claim. The “reviews” in this case are on a two-point scale (“thumbs up” or “thumbs down”)
instead of the 5-point scale in the other settings. This more compact structure still allows the basic
analysis comparing the benchmark of uniform helpfulness to a model with double-voting. However,
9
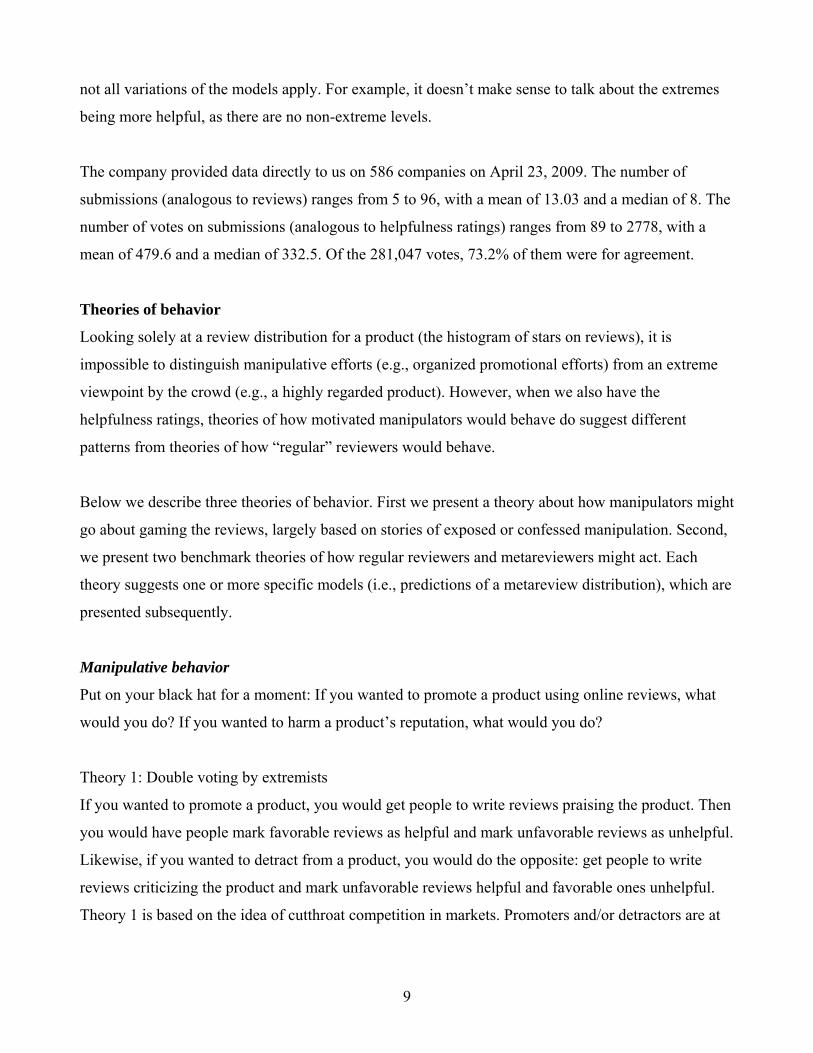
not all variations of the models apply. For example, it doesn’t make sense to talk about the extremes
being more helpful, as there are no non-extreme levels.
The company provided data directly to us on 586 companies on April 23, 2009. The number of
submissions (analogous to reviews) ranges from 5 to 96, with a mean of 13.03 and a median of 8. The
number of votes on submissions (analogous to helpfulness ratings) ranges from 89 to 2778, with a
mean of 479.6 and a median of 332.5. Of the 281,047 votes, 73.2% of them were for agreement.
Theories of behavior
Looking solely at a review distribution for a product (the histogram of stars on reviews), it is
impossible to distinguish manipulative efforts (e.g., organized promotional efforts) from an extreme
viewpoint by the crowd (e.g., a highly regarded product). However, when we also have the
helpfulness ratings, theories of how motivated manipulators would behave do suggest different
patterns from theories of how “regular” reviewers would behave.
Below we describe three theories of behavior. First we present a theory about how manipulators might
go about gaming the reviews, largely based on stories of exposed or confessed manipulation. Second,
we present two benchmark theories of how regular reviewers and metareviewers might act. Each
theory suggests one or more specific models (i.e., predictions of a metareview distribution), which are
presented subsequently.
Manipulative behavior
Put on your black hat for a moment: If you wanted to promote a product using online reviews, what
would you do? If you wanted to harm a product’s reputation, what would you do?
Theory 1: Double voting by extremists
If you wanted to promote a product, you would get people to write reviews praising the product. Then
you would have people mark favorable reviews as helpful and mark unfavorable reviews as unhelpful.
Likewise, if you wanted to detract from a product, you would do the opposite: get people to write
reviews criticizing the product and mark unfavorable reviews helpful and favorable ones unhelpful.
Theory 1 is based on the idea of cutthroat competition in markets. Promoters and/or detractors are at
10
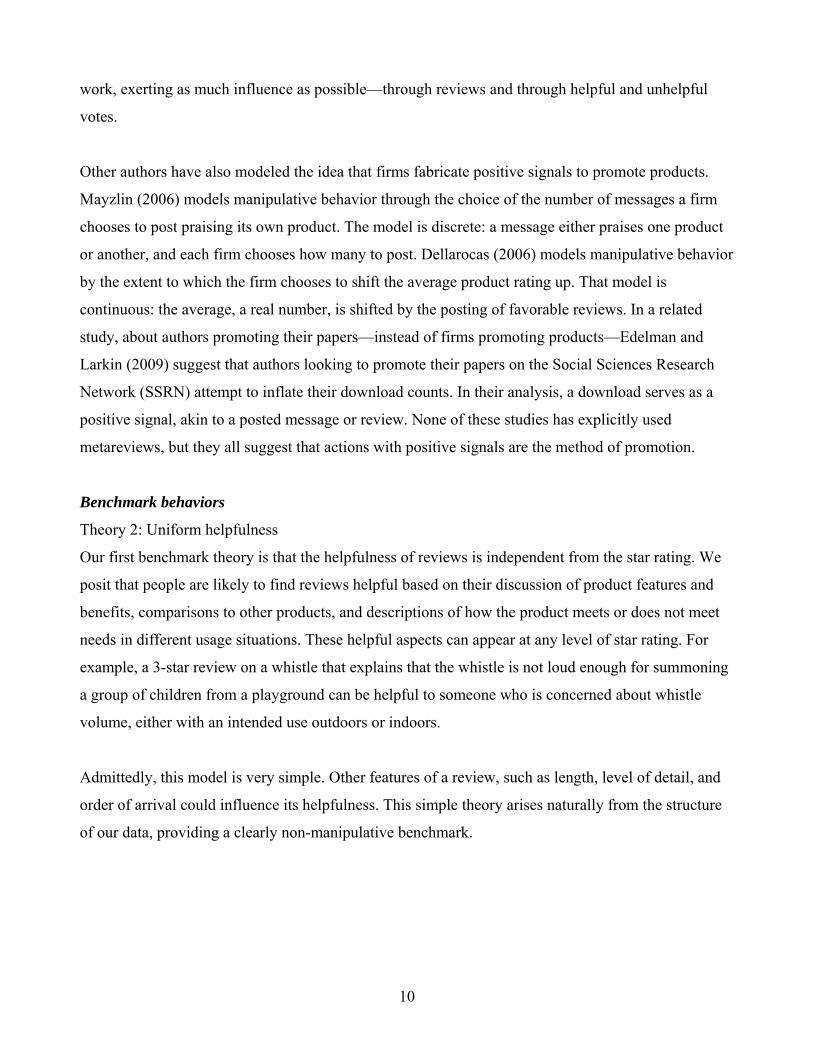
work, exerting as much influence as possible—through reviews and through helpful and unhelpful
votes.
Other authors have also modeled the idea that firms fabricate positive signals to promote products.
Mayzlin (2006) models manipulative behavior through the choice of the number of messages a firm
chooses to post praising its own product. The model is discrete: a message either praises one product
or another, and each firm chooses how many to post. Dellarocas (2006) models manipulative behavior
by the extent to which the firm chooses to shift the average product rating up. That model is
continuous: the average, a real number, is shifted by the posting of favorable reviews. In a related
study, about authors promoting their papers—instead of firms promoting products—Edelman and
Larkin (2009) suggest that authors looking to promote their papers on the Social Sciences Research
Network (SSRN) attempt to inflate their download counts. In their analysis, a download serves as a
positive signal, akin to a posted message or review. None of these studies has explicitly used
metareviews, but they all suggest that actions with positive signals are the method of promotion.
Benchmark behaviors
Theory 2: Uniform helpfulness
Our first benchmark theory is that the helpfulness of reviews is independent from the star rating. We
posit that people are likely to find reviews helpful based on their discussion of product features and
benefits, comparisons to other products, and descriptions of how the product meets or does not meet
needs in different usage situations. These helpful aspects can appear at any level of star rating. For
example, a 3-star review on a whistle that explains that the whistle is not loud enough for summoning
a group of children from a playground can be helpful to someone who is concerned about whistle
volume, either with an intended use outdoors or indoors.
Admittedly, this model is very simple. Other features of a review, such as length, level of detail, and
order of arrival could influence its helpfulness. This simple theory arises naturally from the structure
of our data, providing a clearly non-manipulative benchmark.
11
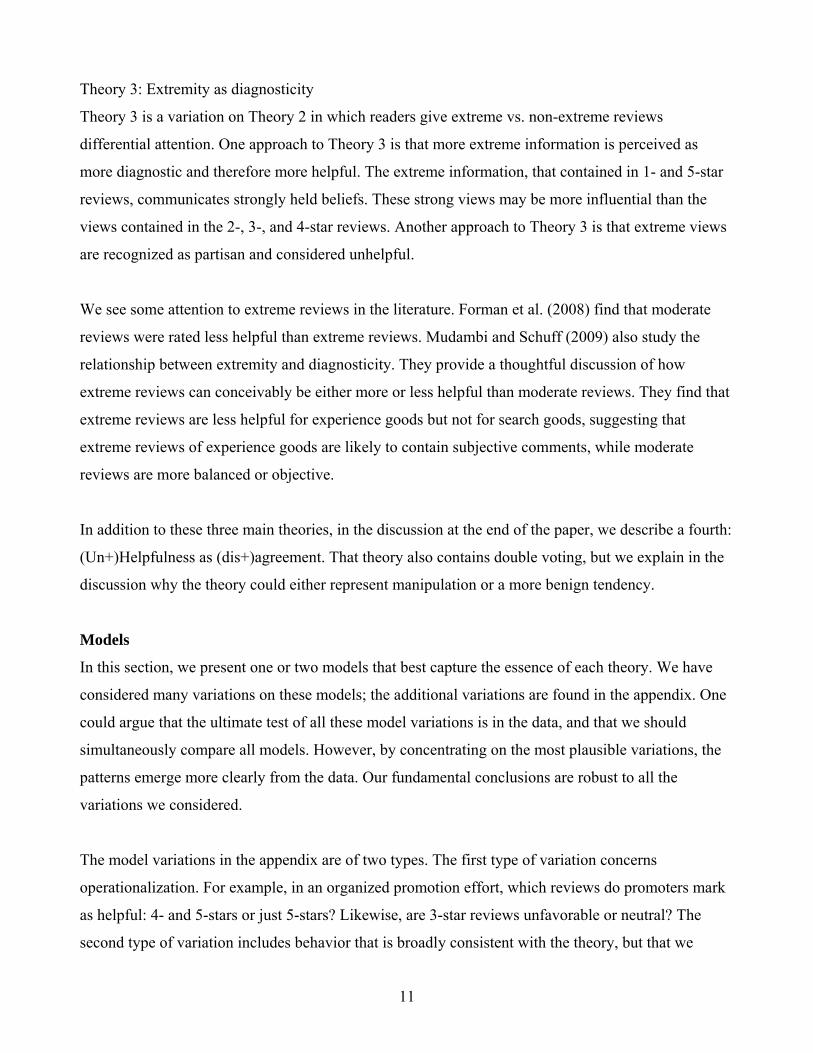
Theory 3: Extremity as diagnosticity
Theory 3 is a variation on Theory 2 in which readers give extreme vs. non-extreme reviews
differential attention. One approach to Theory 3 is that more extreme information is perceived as
more diagnostic and therefore more helpful. The extreme information, that contained in 1- and 5-star
reviews, communicates strongly held beliefs. These strong views may be more influential than the
views contained in the 2-, 3-, and 4-star reviews. Another approach to Theory 3 is that extreme views
are recognized as partisan and considered unhelpful.
We see some attention to extreme reviews in the literature. Forman et al. (2008) find that moderate
reviews were rated less helpful than extreme reviews. Mudambi and Schuff (2009) also study the
relationship between extremity and diagnosticity. They provide a thoughtful discussion of how
extreme reviews can conceivably be either more or less helpful than moderate reviews. They find that
extreme reviews are less helpful for experience goods but not for search goods, suggesting that
extreme reviews of experience goods are likely to contain subjective comments, while moderate
reviews are more balanced or objective.
In addition to these three main theories, in the discussion at the end of the paper, we describe a fourth:
(Un+)Helpfulness as (dis+)agreement. That theory also contains double voting, but we explain in the
discussion why the theory could either represent manipulation or a more benign tendency.
Models
In this section, we present one or two models that best capture the essence of each theory. We have
considered many variations on these models; the additional variations are found in the appendix. One
could argue that the ultimate test of all these model variations is in the data, and that we should
simultaneously compare all models. However, by concentrating on the most plausible variations, the
patterns emerge more clearly from the data. Our fundamental conclusions are robust to all the
variations we considered.
The model variations in the appendix are of two types. The first type of variation concerns
operationalization. For example, in an organized promotion effort, which reviews do promoters mark
as helpful: 4- and 5-stars or just 5-stars? Likewise, are 3-star reviews unfavorable or neutral? The
second type of variation includes behavior that is broadly consistent with the theory, but that we

12
found less plausible. For example, the “Detraction Only” model is consistent with Theory 1 (double
voting by extremists), but implies that the producers of the product wouldn’t respond with promotion.
We found that story less plausible. (And, the data support our skepticism.)
Below we present the four models that best matched the theories: two for Theory 1 and one each for
Theories 2 and 3. Each model is a prediction about the normalized metareview distribution, a
distribution with ten points: relative frequencies for helpful and unhelpful votes for each of the five
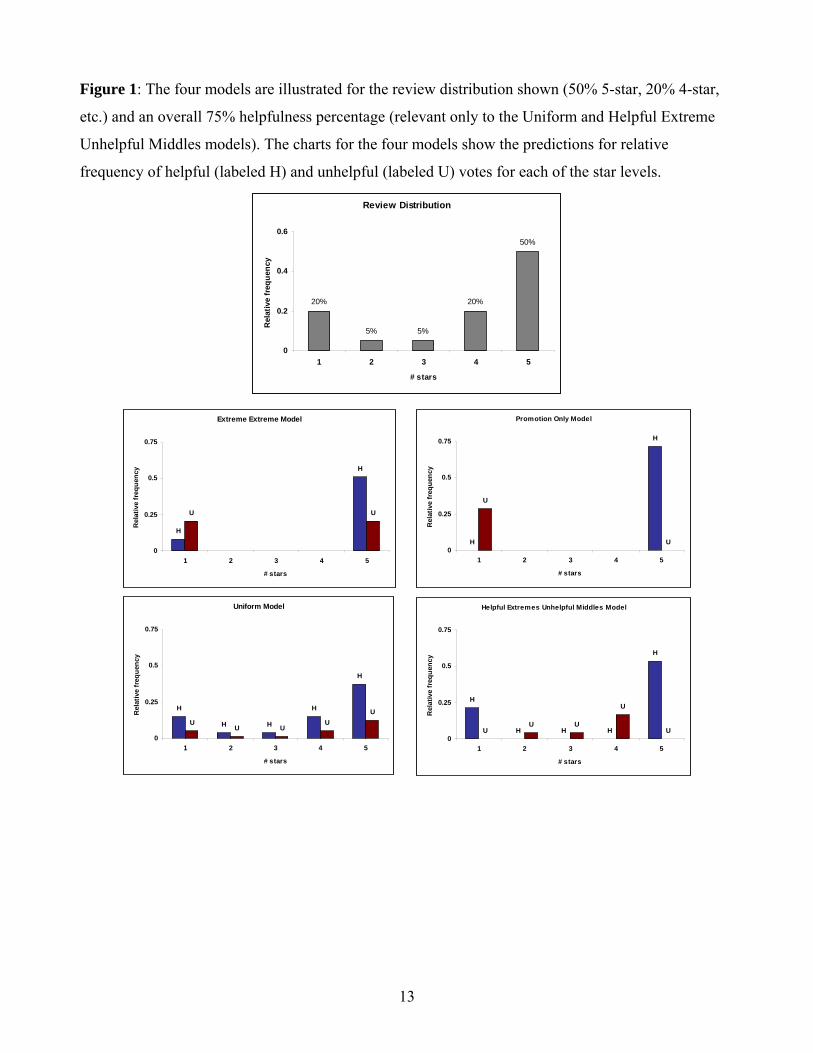
star levels. Figure 1 shows a comparison of the four models for a numerical example. The first panel
of Figure 1 contains an example distribution on the star ratings for reviews; the subsequent panels
illustrate each of the four models.
13
Figure 1: The four models are illustrated for the review distribution shown (50% 5-star, 20% 4-star,
etc.) and an overall 75% helpfulness percentage (relevant only to the Uniform and Helpful Extreme
Unhelpful Middles models). The charts for the four models show the predictions for relative
frequency of helpful (labeled H) and unhelpful (labeled U) votes for each of the star levels.
Review Distribution
20%
5% 5%
20%
50%
0
0.2
0.4
0.6
1 2 3 4 5
# stars
Rel
ativ
e fr
eque
ncy
Extreme Extreme Model
H
H
U U
0
0.25
0.5
0.75
1 2 3 4 5
# stars
Rel
ativ
e fr
eque
ncy
Promotion Only Model
H
H
U
U0
0.25
0.5
0.75
1 2 3 4 5
# stars
Rel
ativ
e fr
eque
ncy
Uniform Model
H
H H
H
H
UU U
UU
0
0.25
0.5
0.75
1 2 3 4 5
# stars
Rel
ativ
e fr
eque
ncy
Helpful Extremes Unhelpful Middles Model
H
H H H
H
UU U
U
U0
0.25
0.5
0.75
1 2 3 4 5
# stars
Rel
ativ
e fr
eque
ncy
14
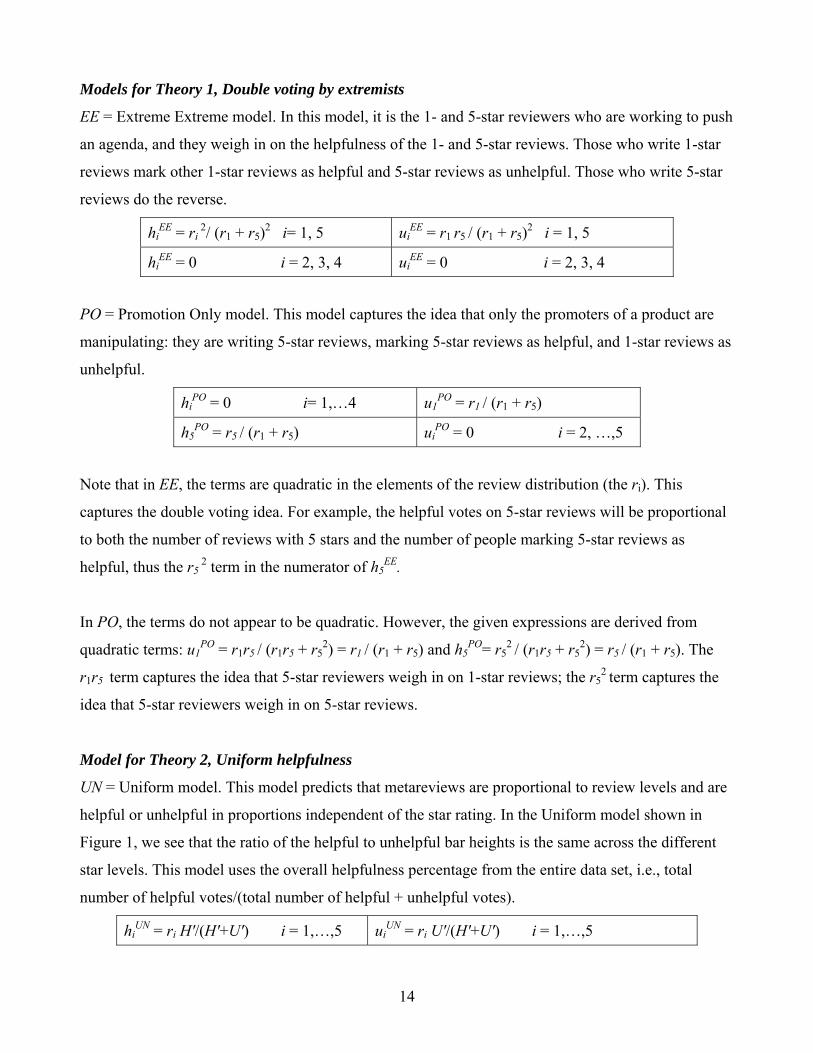
Models for Theory 1, Double voting by extremists
EE = Extreme Extreme model. In this model, it is the 1- and 5-star reviewers who are working to push
an agenda, and they weigh in on the helpfulness of the 1- and 5-star reviews. Those who write 1-star
reviews mark other 1-star reviews as helpful and 5-star reviews as unhelpful. Those who write 5-star
reviews do the reverse.
hiEE = ri
2/ (r1 + r5)2 i= 1, 5 uiEE = r1 r5 / (r1 + r5)2 i = 1, 5
hiEE = 0 i = 2, 3, 4 ui
EE = 0 i = 2, 3, 4
PO = Promotion Only model. This model captures the idea that only the promoters of a product are
manipulating: they are writing 5-star reviews, marking 5-star reviews as helpful, and 1-star reviews as
unhelpful.
hiPO = 0 i= 1,…4 u1
PO = r1 / (r1 + r5)
h5PO = r5 / (r1 + r5) ui
PO = 0 i = 2, …,5
Note that in EE, the terms are quadratic in the elements of the review distribution (the ri). This
captures the double voting idea. For example, the helpful votes on 5-star reviews will be proportional
to both the number of reviews with 5 stars and the number of people marking 5-star reviews as
helpful, thus the r5 2 term in the numerator of h5
EE.
In PO, the terms do not appear to be quadratic. However, the given expressions are derived from
quadratic terms: u1PO = r1r5 / (r1r5 + r5
2) = r1 / (r1 + r5) and h5PO= r5
2 / (r1r5 + r5
2) = r5 / (r1 + r5). The
r1r5 term captures the idea that 5-star reviewers weigh in on 1-star reviews; the r52 term captures the
idea that 5-star reviewers weigh in on 5-star reviews.
Model for Theory 2, Uniform helpfulness
UN = Uniform model. This model predicts that metareviews are proportional to review levels and are
helpful or unhelpful in proportions independent of the star rating. In the Uniform model shown in
Figure 1, we see that the ratio of the helpful to unhelpful bar heights is the same across the different
star levels. This model uses the overall helpfulness percentage from the entire data set, i.e., total
number of helpful votes/(total number of helpful + unhelpful votes).
hiUN = ri H′/(H′+U′) i = 1,…,5 ui
UN = ri U′/(H′+U′) i = 1,…,5
15
We also considered a version of this model (UNS, “Uniform Specific”) in which the helpfulness
percentage is calculated for each product. However, using the specific ratio for each product doesn’t
highlight the situation in which all the reviews for a particular product are 5-stars and all the
metareviews are helpful. That situation, which could certainly be the result of a promotional
campaign, would show up as a perfect fit to the UNS model, i.e., a model error of zero. The perfect fit
would happen because for that product, with only helpful votes on reviews, H/(H+U) = 1, and with
only 5-star ratings, r5 = 1, so UNS would (correctly) predict that h5UNS = 1.
Across our data sets, about three-quarters of the metareview votes are helpful (the helpfulness or
agreement percentages range from 61.8% to 87.8%). This range of proportions is consistent with
other studies of the ratio of positive to negative word-of-mouth. For example, East et al. (2007) find a
3-to-1 ratio of positive comments to negative across a wide variety of categories.
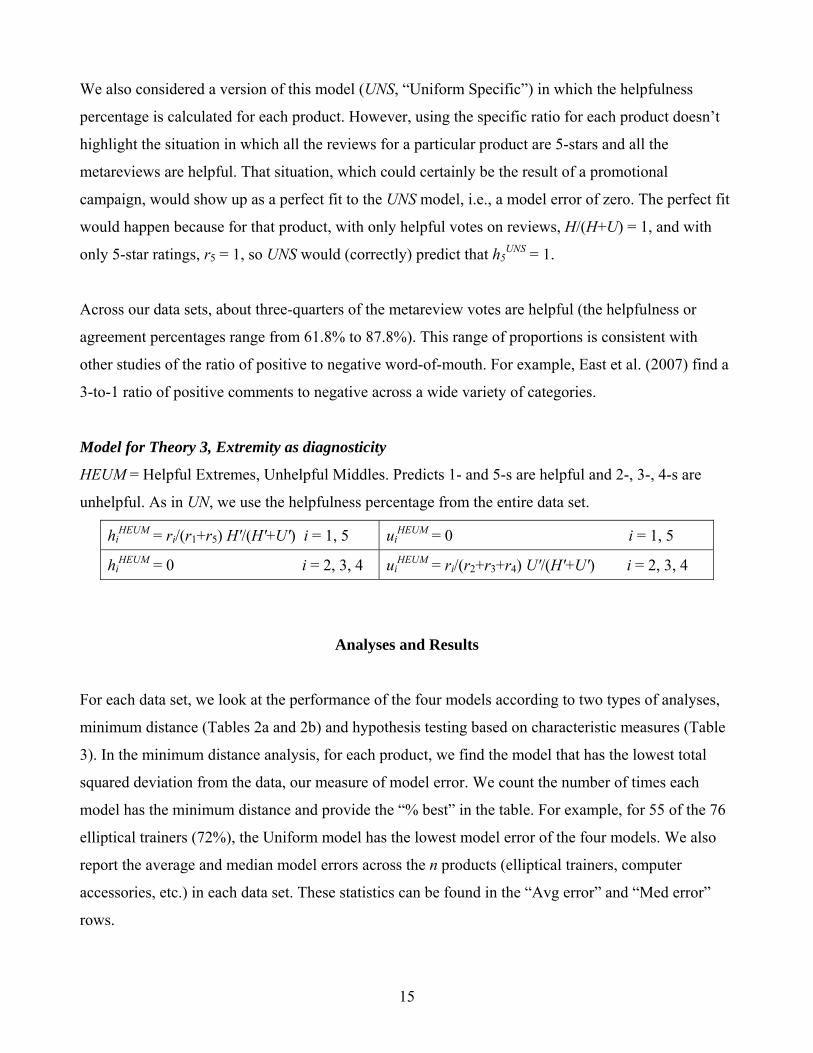
Model for Theory 3, Extremity as diagnosticity
HEUM = Helpful Extremes, Unhelpful Middles. Predicts 1- and 5-s are helpful and 2-, 3-, 4-s are
unhelpful. As in UN, we use the helpfulness percentage from the entire data set.
hiHEUM = ri/(r1+r5) H′/(H′+U′) i = 1, 5 ui
HEUM = 0 i = 1, 5
hiHEUM = 0 i = 2, 3, 4 ui
HEUM = ri/(r2+r3+r4) U′/(H′+U′) i = 2, 3, 4
Analyses and Results
For each data set, we look at the performance of the four models according to two types of analyses,
minimum distance (Tables 2a and 2b) and hypothesis testing based on characteristic measures (Table
3). In the minimum distance analysis, for each product, we find the model that has the lowest total
squared deviation from the data, our measure of model error. We count the number of times each
model has the minimum distance and provide the “% best” in the table. For example, for 55 of the 76
elliptical trainers (72%), the Uniform model has the lowest model error of the four models. We also
report the average and median model errors across the n products (elliptical trainers, computer
accessories, etc.) in each data set. These statistics can be found in the “Avg error” and “Med error”
rows.
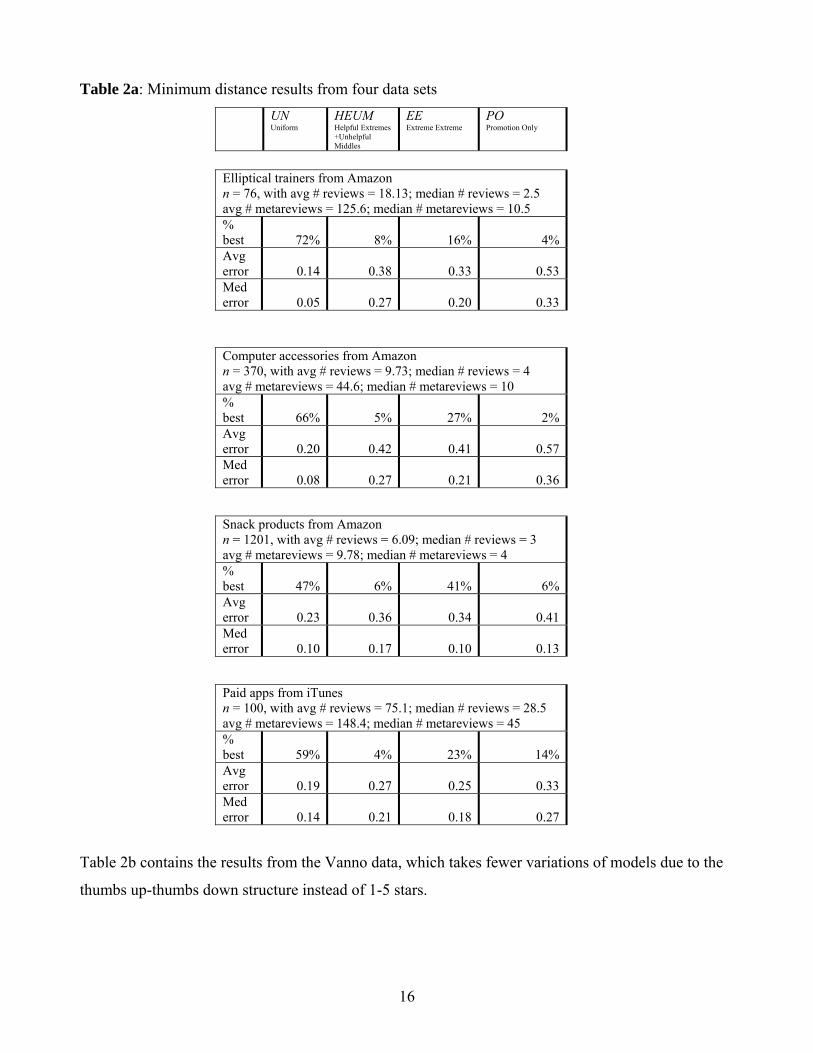
16
Table 2a: Minimum distance results from four data sets UN
Uniform HEUM Helpful Extremes +Unhelpful Middles
EE Extreme Extreme
PO Promotion Only
Elliptical trainers from Amazon n = 76, with avg # reviews = 18.13; median # reviews = 2.5 avg # metareviews = 125.6; median # metareviews = 10.5 % best 72% 8% 16% 4%Avg error 0.14 0.38 0.33 0.53Med error 0.05 0.27 0.20 0.33
Computer accessories from Amazon n = 370, with avg # reviews = 9.73; median # reviews = 4 avg # metareviews = 44.6; median # metareviews = 10 % best 66% 5% 27% 2%Avg error 0.20 0.42 0.41 0.57Med error 0.08 0.27 0.21 0.36
Snack products from Amazon n = 1201, with avg # reviews = 6.09; median # reviews = 3 avg # metareviews = 9.78; median # metareviews = 4 % best 47% 6% 41% 6%Avg error 0.23 0.36 0.34 0.41Med error 0.10 0.17 0.10 0.13
Paid apps from iTunes n = 100, with avg # reviews = 75.1; median # reviews = 28.5 avg # metareviews = 148.4; median # metareviews = 45 % best 59% 4% 23% 14%Avg error 0.19 0.27 0.25 0.33Med error 0.14 0.21 0.18 0.27
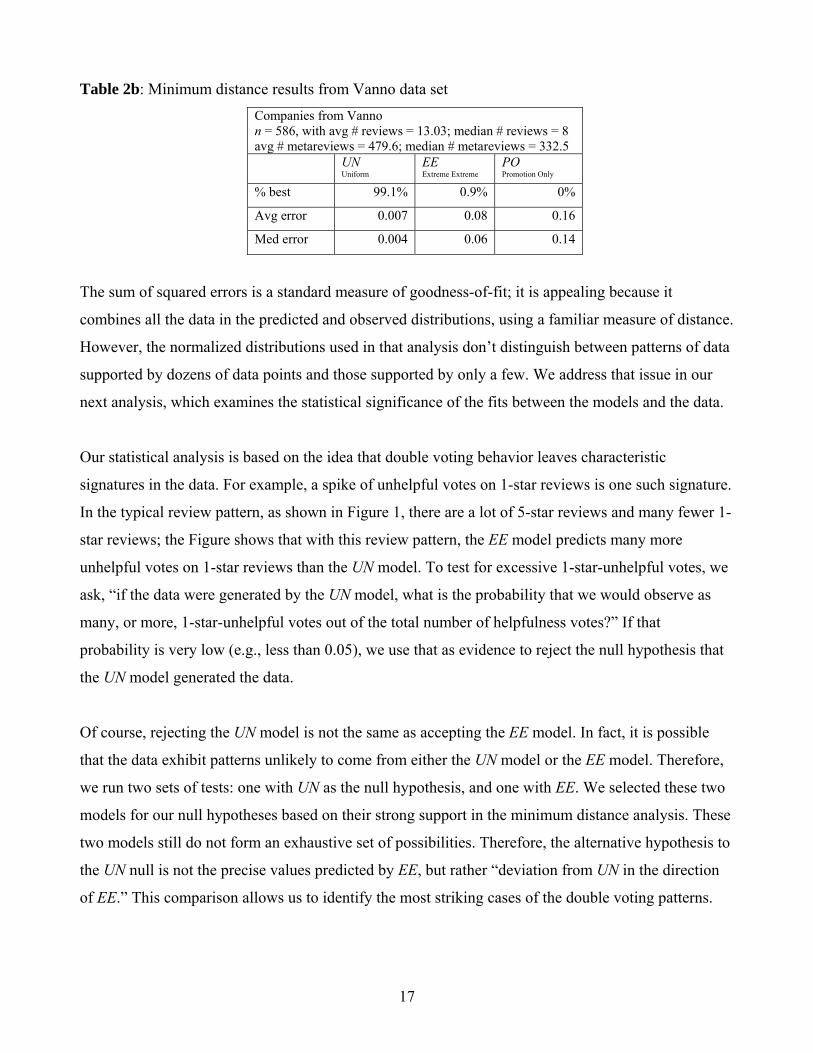
Table 2b contains the results from the Vanno data, which takes fewer variations of models due to the
thumbs up-thumbs down structure instead of 1-5 stars.
17
Table 2b: Minimum distance results from Vanno data set Companies from Vanno n = 586, with avg # reviews = 13.03; median # reviews = 8 avg # metareviews = 479.6; median # metareviews = 332.5 UN
Uniform EE Extreme Extreme PO
Promotion Only % best 99.1% 0.9% 0%
Avg error 0.007 0.08 0.16
Med error 0.004 0.06 0.14
The sum of squared errors is a standard measure of goodness-of-fit; it is appealing because it
combines all the data in the predicted and observed distributions, using a familiar measure of distance.
However, the normalized distributions used in that analysis don’t distinguish between patterns of data
supported by dozens of data points and those supported by only a few. We address that issue in our
next analysis, which examines the statistical significance of the fits between the models and the data.
Our statistical analysis is based on the idea that double voting behavior leaves characteristic
signatures in the data. For example, a spike of unhelpful votes on 1-star reviews is one such signature.
In the typical review pattern, as shown in Figure 1, there are a lot of 5-star reviews and many fewer 1-
star reviews; the Figure shows that with this review pattern, the EE model predicts many more
unhelpful votes on 1-star reviews than the UN model. To test for excessive 1-star-unhelpful votes, we
ask, “if the data were generated by the UN model, what is the probability that we would observe as
many, or more, 1-star-unhelpful votes out of the total number of helpfulness votes?” If that
probability is very low (e.g., less than 0.05), we use that as evidence to reject the null hypothesis that
the UN model generated the data.
Of course, rejecting the UN model is not the same as accepting the EE model. In fact, it is possible
that the data exhibit patterns unlikely to come from either the UN model or the EE model. Therefore,
we run two sets of tests: one with UN as the null hypothesis, and one with EE. We selected these two
models for our null hypotheses based on their strong support in the minimum distance analysis. These
two models still do not form an exhaustive set of possibilities. Therefore, the alternative hypothesis to
the UN null is not the precise values predicted by EE, but rather “deviation from UN in the direction
of EE.” This comparison allows us to identify the most striking cases of the double voting patterns.
18
For each product in each data set, we ask a set of questions about probabilities of specific measures
(the characteristic signatures). There are a large number of options in selecting specific measures for
each hypothesis. We felt the following measures best captured the essential features of the
distributions. For the UN hypothesis, we examine the total votes on the moderate reviews (2-3-and-4-
stars) as well as both the helpful and unhelpful votes on extreme reviews (1-and-5-stars). For the EE
hypothesis, there is no predicted activity in the middle of the distribution, so we just examine the
extremes. We comment on the robustness of the findings to our choice of specific measures in the
next section.
Our hypotheses and the specific questions that form the tests are below. The tests for each hypothesis
are run on each product.
Hypothesis 1: The Uniform model generated the data.
To test this hypothesis, we ask the following five questions:
(1) What is the probability that we would observe as many, or fewer, helpful and unhelpful votes
on 2-3-and-4-star reviews out of the total number of helpfulness votes?
(2) If EEUN uu 11 ≤ [ EEUN uu 11 > ], what is the probability that we would observe as many, or more
[or fewer], 1-star-unhelpful votes out of the total number of helpfulness votes?
(3) If EEUN hh 11 ≤ [ EEUN hh 11 > ], what is the probability that we would observe as many, or more
[or fewer], 1-star-helpful votes out of the total number of helpfulness votes?
(4) If EEUN uu 55 ≤ [ EEUN uu 55 > ], what is the probability that we would observe as many, or more
[or fewer], 5-star-unhelpful votes out of the total number of helpfulness votes?
(5) If EEUN hh 55 ≤ [ EEUN hh 55 > ], what is the probability that we would observe as many, or more
[or fewer], 5-star-helpful votes out of the total number of helpfulness votes?
Hypothesis 2: The Extreme Extreme model generated the data.
To test this hypothesis, we ask four questions, one each about helpful and unhelpful votes on 1-
and 5-star reviews. The questions are analogous to questions (2)-(5) of Hypothesis 1.
For each of the specific questions posed, we look for a 0.05 or lower probability that the hypothesized
model (UN or EE) produced the observed measures. We reject a hypothesized model for a product if
19
half or more of the possible measures have 05.0≤p . (A test is not possible if there are no reviews at
the star level. For example, if there are no 1-star reviews for a product, then we cannot conduct a test
on the number of unhelpful votes on the 1-star reviews.)
We acknowledge that the specific measures for each hypothesis are not independent. However,
because the data distributions have 10 points, any one measure is not fully dependent on a single other
measure, either. In other words, the different measures have some information overlap with each other
but some new contribution too. A more holistic approach, such as an exact test on the full multinomial
distribution, would explicitly account for the dependency. However, in that approach, the
interpretation of the tails of the test (i.e., the observed level or more extreme) is not as clear.
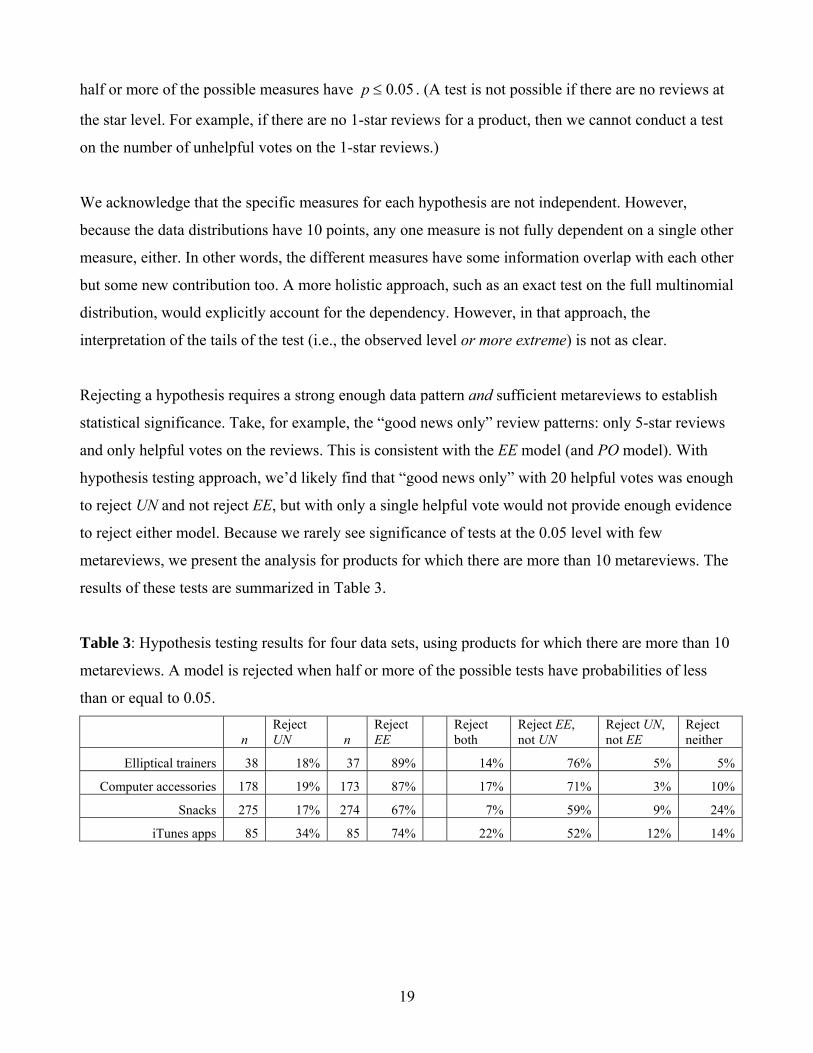
Rejecting a hypothesis requires a strong enough data pattern and sufficient metareviews to establish
statistical significance. Take, for example, the “good news only” review patterns: only 5-star reviews
and only helpful votes on the reviews. This is consistent with the EE model (and PO model). With
hypothesis testing approach, we’d likely find that “good news only” with 20 helpful votes was enough
to reject UN and not reject EE, but with only a single helpful vote would not provide enough evidence
to reject either model. Because we rarely see significance of tests at the 0.05 level with few
metareviews, we present the analysis for products for which there are more than 10 metareviews. The
results of these tests are summarized in Table 3.
Table 3: Hypothesis testing results for four data sets, using products for which there are more than 10
metareviews. A model is rejected when half or more of the possible tests have probabilities of less
than or equal to 0.05.
n Reject UN n
Reject EE
Reject both
Reject EE, not UN
Reject UN, not EE
Reject neither
Elliptical trainers 38 18% 37 89% 14% 76% 5% 5%
Computer accessories 178 19% 173 87% 17% 71% 3% 10%
Snacks 275 17% 274 67% 7% 59% 9% 24%
iTunes apps 85 34% 85 74% 22% 52% 12% 14%
20
Discussion of Results
Our first conclusion from our results is that we can reject double voting as the dominant mode of
behavior in the settings we observed. From the minimum distance analysis presented in Tables 2a and
2b, the Uniform model is the best fit in each data set. It has the lowest average model error, the lowest
median error, and is the best fit for the plurality of products in each data set. We saw the same general
patterns when we used the “Uniform Specific” (UNS) model which uses the ratio of helpful to
unhelpful votes specific to the set of reviews for each product (instead of across the whole data set, as
in UN): the uniform model still has lowest average and median error and fits best in the most cases.
In the Vanno data set, the error levels are much lower compared to the other data sets. This is not
terribly surprising, as the metareview distributions for Vanno have only four, instead of ten, points.
The sum of squared deviations that we use for overall model error is therefore likely to be smaller. In
the 586 companies, only 5 of them have the manipulative model as a better fit. In at least one of those
five cases, it is clear that a submitted story was mislabeled with a thumbs down when it should have
been a thumbs up (i.e., a positive story is rated as thumbs down). That led to many “disagree” votes
with for that story, suggestive of the EE pattern, in which there tend to be a lot of unhelpful (or
disagree, for Vanno) votes on negative stories.
The hypothesis testing also provides support for the UN model. In the four data sets analyzed, UN is
rejected less frequently (18% to 34% of the time, across data sets) than EE (67% to 89%). Further, the
“Reject EE, not UN” column shows the percentage of products where the analysis favors the UN
model. This column is higher than the “Reject UN, not EE” column in all four data sets. These
relationships are robust across all the variations in the sets of questions we examined for each
hypothesis.
Our second conclusion is that, while the double voting patterns, EE and PO, don’t dominate the data,
they do, in fact, occur. From the minimum distance analysis, in the Amazon and iTunes samples, the
prevalence ranges from 20%-47%. The Extreme Extreme (EE) model, in which promoters and
detractors use helpful and unhelpful votes to reinforce their views, has more support than Promotion
Only (PO). In the iTunes data, EE has the second lowest mean and median error of the four models,
and it has the second highest count for “best model,” being the best model nearly a quarter of the
21
time. Of course, we can’t conclude from these data that money is changing hands for reviews. But, the
patterns of partisanship, characteristic of motivated manipulators, are evident.
The minimum distance analysis shows that EE is the best fit for 16% to 41% of the products in each
data set. In the hypothesis testing, the percentage of the products for which UN is rejected and EE is
not is much lower: 3% to 12% across the data sets. Why this discrepancy? In the minimum distance
analysis, every product is classified according to its best fit. With hypothesis testing, we allow for the
possibilities that neither model is a good fit and that both are good fits, reducing the cases that are
classified as an exclusive good fit for either model. The hypothesis testing approach also classifies
fewer products as EE because the “good news only” pattern (only 5-star reviews and only helpful
votes) is overrepresented among the low-volume-of-metareviews products. A suggestive data pattern
exists in these cases, but there is insufficient data for statistical significance.
In addition to the hypothesis tests based on the four specific measures described, we also tested the
sum of squared errors (SSE) measure. For each product, we ran a simulation for both the UN and EE
null hypotheses, taking draws equal to the actual number of metareviews on each of the 500 trials.
This test had a lower rejection rate for both models, so it was less useful in distinguishing which
products better matched which model.
The quantity of metareviews for each product affects the statistical results. But quantity matters in
another way: it is possible that more reviewing activity itself reduces the incidence of manipulation.
In The Anatomy of Buzz Revisited, Rosen writes, “[A] restaurant owner…(or his competitor) may post
reviews online. In the war against manipulation, a rating system has several weapons. Perhaps the
most powerful one is the number of participants….Once [it] reaches a certain number of people, it
becomes almost impossible to manipulate the outcome” (Rosen, 2009, pp. 30-31).
If the reviewing and metareviewing volume is very low, that would suggest that large-scale
manipulative efforts are not underway. In the extreme, there can’t be manipulation if there are no
reviews. An intense manipulative campaign could generate a lot of review and metareview volume.
However, if the reviewing or voting volume is very high absent a manipulative campaign, additional
reviews or votes might not have much of an effect, so the reward to organized promotional efforts
would be low. The net effect on the relationship between manipulation and volume is not obvious.
22
This relationship between volume and manipulation complicates the interpretation of the hypothesis
tests. Although we need a minimum level of metareviews to establish statistical significance, the
prevalence of manipulation may vary by the quantity of data itself. By Rosen’s logic, with more
metareviewing activity, the double voting patterns should be less apparent. We find some evidence for
that in the data, but do not find that the phenomenon disappears with ample metareviewing activity.
In addition to the analyses reported here, we also looked extensively at the Positive and Negative
agreement model (PN), in which both 4-star and 5-star reviews, and not just 5-star, are used to
promote, and both 1-and-2-stars are used to detract. (This model is one of the variations on Theory 1
listed in the appendix.) The basic conclusions, that double voting patterns exist, but are in the
minority, persist.
Limitations and Future Research
Data structure
Our data collection included aggregate and normalized review and metareview distributions. While
these data are sufficient to inform our theories, we suspect there are interesting patterns in a richer
data set of review information. Godes and Silva (2009) study the dynamics of the arrivals of reviews.
In a similar vein, we believe it would be instructive to analyze metareviewing sequences for
suspicious patterns. For example, short delay between the submission of a 1-star review and the
review being marked as unhelpful would be consistent with manipulative promotion behavior if a
promoter vigilantly responds to negative word of mouth.
There are other considerations that may be important. For example, helpful and unhelpful votes are
more likely to be made when such a vote moves a review to the first page of reviews (when ordered
by helpfulness). If a bad review is already considered the least helpful, even motivated manipulators
may not rate it as unhelpful. Considerations like that will affect the relative proportions of helpful and
unhelpful votes.
23
Anonymity of the helpfulness ratings
On most review sites, the helpfulness ratings are anonymous. That is, the site says that “2 out of 3
people found this review helpful,” but it doesn’t tell you who those people are. (We found one
exception: mouthshut.com, a multi-category product review site based in India.) Forman et al. (2008)
find a positive relationship between a reviewer’s identity disclosure and the helpfulness ratings of
their reviews. Should the helpfulness ratings themselves also be identifiable? The Forman work
suggests that identity disclosure is a good thing. However, we also suggest that identity disclosure
facilitates explicit contractual agreements (e.g., a 5-cent payment for every helpful rating on a positive
review), which could increase manipulation.
What is helpfulness?
More work can be done to understand what people mean when they answer the “Was this review
helpful to you?” question. The concept of helpfulness is related to how and when people are using
reviews. Mudambi and Schuff (2009) define a helpful review as one that “facilitates the consumer’s
purchase decision process.” In a February 2008 survey by PowerReviews, 53% of people responded
that they read reviews “When I’m trying to decide between two or three products,” and 28% of people
read them “After I narrow it down to one product and I want to confirm that it is the right one to buy”
(Freedman, 2008). However, both Mudambi and Schuff’s definition and the PowerReviews study
neglect the possibility that reviews are being read post-purchase. A plausible story is that a buyer goes
back to write a review and reads existing reviews in the process. Clickstream data from a review site
could inform the empirical question of when people are reading and rating reviews. Review sites
might consider giving that information about the helpfulness ratings, that is, saying how many helpful
and unhelpful votes came from people who made a purchase. Sites such as drugstore.com and
diapers.com are increasing the amount of information available about reviewers (Fowler, 2009); they
could do the same with the metareviewers.
One reason this timing information could be relevant is that for the post-purchase metareviewers, the
helpfulness rating seems more likely to signify agreement with the review. This notion of helpfulness
as agreement raises another theory of behavior in addition to ones we presented earlier in the paper.
24
Theory 4: (Un+)Helpfulness as (dis+)agreement
People interpret helpfulness as agreement and unhelpfulness as disagreement. This is variation on the
double voting in Theory 1 (double voting by extremists), but with all segments of the opinion
spectrum, and not just the extreme 1- and 5-star groups, reinforcing their opinion in the metareviews.
Several models consistent with this theory are included in the appendix. This theory raises the
question of whether this agreement voting is necessarily a conscious manipulative plan or whether it
is an unconscious tendency. We found the Extreme Extreme model from Theory 1 more plausible
than the family of agreement models from Theory 4 because it seems unlikely that someone looking
to maximize influence (i.e., manipulate) would be giving 4-star reviews. If agreement arises through
benign behavior, there is likely to be less metareviewing and therefore weaker patterns in the data,
compared to deliberate manipulative efforts.
Conclusion
Surowiecki (2005) lays out the conditions for “the crowd to be wise”: diversity, independence, and
decentralization. Organized promotional chat efforts violate all three of these conditions. We have
proposed ways to detect those violations and provided estimates of how prevalent they are. Our work
builds on the existing theoretical work about the credibility (e.g., Mayzlin, 2006) and strategic use
(e.g., Chen and Xie, 2008) of online user reviews by firms. We provide a theory- and data- driven
answer to the question of how widespread and impactful manipulative behavior is on user review
sites. Further, our methods are computationally straightforward and employ readily available data.
Avery et al. (1999) write about “The Market for Evaluations.” Their focus is on honest reviews—they
don’t consider manipulative motives. They explore why reviews, as a public good, might be
underprovided. Even though they don’t analyze the shady side of reviewing, their results provide an
additional reason for people to be concerned about the extent of manipulation: even if unbiased
people outweigh biased operators, the biased ones have a stronger incentive to act. Our focus in the
current work has been to shed light on how big a problem that imbalance is. Our conclusion is that it
is not an overwhelming problem, but it is one worth paying attention to.
25
References
apple.com (2009) “Over 1 billion downloads in just nine months,”
http://www.apple.com/itunes/billion-app-countdown/, accessed May 27, 2009.
Avery, Christopher, Paul Resnick and Richard Zeckhauser (1999) “The Market for Evaluations.”
American Economic Review, 89(3) 564-584.
Bustillo, Miguel and Ann Zimmerman (2009) “Paid to Pitch: Product Reviews By Bloggers Draw
Scrutiny.” The Wall Street Journal, April 23, 2009, B9.
Campbell, Margaret C. and Amna Kirmani (2000) “Consumers' Use of Persuasion Knowledge: The
Effects of Accessibility and Cognitive Capacity on Perceptions of an Influence Agent.” Journal of
Consumer Research, 27(1) 69-83.
Chen, Yubo and Jinhong Xie (2008) “Online Consumer Review: Word-of-Mouth as a New Element
of Marketing Communication Mix.” Management Science, 54(3) 477-491.
Chevalier, Judith A. and Dina Mayzlin (2006) “The Effect of Word of Mouth on Sales: Online Book
Reviews.” Journal of Marketing Research, 43(3) 345-354.
Dellarocas, Chrysanthos (2006) “Strategic Manipulation of Internet Opinion Forums: Implications for
Consumers and Firms.” Management Science, 52(10) 1577-1593.
Dellarocas, Chrysanthos, Xiaoquan Zhang and Neveen F. Awad (2008). “Exploring the Value of
Online Product Reviews in Forecasting Sales: The Case of Motion Pictures,” Journal of Interactive
Marketing, forthcoming.
Deloitte & Touche USA (2007) “Consumer Survey: Market Transparency.” September 2007.
26
East, Robert, Kathy Hammond and Malcolm Wright (2007) “The relative incidence of positive and
negative word of mouth: A multi-category study.” International Journal of Research in Marketing.
24(2) 175-184.
Edelman, Benjamin and Ian Larkin (2009) “Demographics, Career Concerns or Social Comparison:
Who Games SSRN Download Counts?” HBS Working Paper 09-096.
Forman, Chris, Anindya Ghose and Batia Wiesenfeld (2008) “Examining the Relationship Between
Reviews and Sales: The Role of Reviewer Identity Disclosure in Electronic Markets.” Information
Systems Research, 19(3) 291-313.
Fowler, Geoffrey A. “What Do You Think? Companies are learning to make the most out of
customers’ online reviews of their products.” The Wall Street Journal, October 12, 2009, R6.
Freedman, Lauren (2008) “Merchant and Customer Perspectives on Customer Reviews and User-
Generated Content.” PowerReviews, February 2008.
Friestad, Marian and Peter Wright (1994) “The Persuasion Knowledge Model: How People Cope with
Persuasion Attempts.” Journal of Consumer Research, 21(1) 1-31.
FTC (2009), “Guides Concerning the Use of Endorsements and Testimonials in Advertising,”
http://www.ftc.gov/os/2009/10/091005revisedendorsementguides.pdf, (accessed December 15, 2009),
October 5, 2009.
Godes, David and Jose Camoes Silva (2009) “The Dynamics of Online Opinion.” Working Paper.
Hennig-Thurau, Thorsten, Kevin P. Gwinner, Gianfranco Walsh, and Dwayne D. Gremler (2004)
“Electronic Word-of-Mouth via Consumer-Opinion Platforms: What Motivates Consumers to
Articulate Themselves on the Internet?” Journal of Interactive Marketing, 18(1), 38-52.
27
InformationWeek (2009)
http://www.informationweek.com/blog/main/archives/2009/01/belkin_cops_to.html, (accessed
August 5, 2009), January 19, 2009.
Lightspeed Research (2008) “Reviews and Reviewing Executive Summary.” July, 2008.
Mayzlin, Dina (2006) “Promotional Chat on the Internet.” Marketing Science, 25(2) 155-163.
Marketing Sherpa (2007) quoted on http://www.bazaarvoice.com/industryStats.html, (accessed May
27, 2009), July 2007.
Moe, Wendy W. (2009) “How Much Does a Good Product Rating Help a Bad Product? Modeling the
Role of Product Quality in the Relationship between Online Consumer Ratings and Sales.” Working
Paper.
Mudambi, Susan M. and David Schuff (2009) “What Makes a Helpful Online Review? A Study of
Customer Reviews on Amazon.com.” Working Paper.
Northrup, Laura (2009) “Academic Publisher Pays Professors For Shill Amazon Reviews,” The
Consumerist Blog, http://consumerist.com/5313215/academic-publisher-pays-professors-for-shill-
amazon-reviews, (accessed July 31, 2009), July 13, 2009.
Ordanini, Andrea (2009) “Crowd Funding: Customers as Investors.” The Wall Street Journal, March
23, 2009, R3.
Pilon, Mary (2009) “A Fake Amazon Reviewer Confesses,” WSJ Blog,
http://blogs.wsj.com/wallet/2009/07/09/delonghis-strange-brew-tracking-down-fake-amazon-raves/,
(accessed July 31, 2009), July 9, 2009.
Rosen, Emanuel (2009) The Anatomy of Buzz Revisted. Doubleday. New York.
28
Schatz, Amy and Miguel Bustillo (2009) “U.S. Seeks to Restrict Gift Giving to Bloggers.” The Wall
Street Journal, October 6, 2009, A1.
Surowiecki, James (2005). The Wisdom of Crowds. Random House. New York.
telegraph.co.uk (2009) “Apple bans prolific developer from App Store,”
http://www.telegraph.co.uk/technology/apple/6770510/Apple-bans-prolific-developer-from-App-
Store.html, (accessed December 15, 2009), December 9, 2009.
Universal-McCann (2008) “When Did We Start Trusting Strangers? How the internet turned us all
into influencers.” September, 2008.
Yao, Deborah (2009) “Can you trust that online review? FTC prepares to crack down on bloggers
compensated for posts.” Chicago Tribune. June 21, 2009.

29
Appendix: Model Variations
Additional Model Variations for Theory 1
E = Extreme model. Only 1- and 5-star reviewers metareview, splitting the range so 1-stars find 1-3
helpful and 4-5 unhelpful, and vice versa.
hiE = ri r1 / (r1+r5) i = 1, 2, 3 ui
E = ri r5 / (r1 + r5) i = 1, 2, 3
hiE = ri r5/ (r1+r5) i = 4, 5 ui
E = ri r1 / (r1 + r5) i = 4, 5
E2 = Extreme 2 model. This is a variation on E in which the ranges of agreement are 1-2 and 4-5. The
3-star reviews do not attract metareviews.
hiE2 = ri r1 / ((r1+r5)(1-r3)) i = 1, 2 ui
E2 = ri r5 /((r1+r5)(1-r3)) i = 1, 2
h3E2= 0 u3
E2= 0
hiE2 = ri r5/ ((r1+r5)(1-r3)) i = 4, 5 ui
E2 = ri r1 /((r1+r5)(1-r3)) i = 4, 5
PN = Positive-Negative model. In this model, all the reviewers, except for the 3-star reviewers,
metareview. They cast their helpfulness votes using the ranges of agreement of 1-2 and 4-5.
hiPN = ri (r1+r2)/(1- r3)2 i = 1, 2 ui
PN = ri (r4 + r5)/(1- r3)2 i = 1, 2
h3PN= 0 u3
PN= 0
hiPN = ri (r4 + r5) /(1- r3)2 i = 4, 5 ui
PN = ri (r1+r2) /(1- r3)2 i = 4, 5
DO = Detraction Only model. This model is the opposite of Promotion Only. It’s as if the 1-star
reviewers mark 1-star reviews as helpful and 5-star reviews as unhelpful. 1s helpful and 5s unhelpful.
h1DO = r1 / (r1 + r5) ui
DO = 0 i= 1,…,4
hiDO = 0 i= 2,…5 u5
DO = r5 / (r1 + r5)
EAH = Extreme Agreement on Helpfulness model. This model captures the idea that people with
extreme viewpoints (1- and 5-star) use helpful ratings (and not unhelpful ones) to express agreement.
People with extreme negative views say 1-2-and-3-star reviews are helpful; people with extreme
positive views say 4-and-5-star reviews are helpful.
hiEAH = ri r1 /(r1 (r1 + r2 +r3) + r5 (r4 + r5)) i= 1, 2, 3 ui
EAH = 0 i = 1, …,5
hiEAH = ri r5 /(r1 (r1 + r2 +r3) + r5 (r4 + r5)) i= 4, 5

30
EAH2 = Extreme Agreement on Helpfulness 2 model. This is a variation on EAH with buckets of 1-2
and 4-5.
hiEAH2 = ri r1 /(r1 (r1 + r2) + r5 (r4 + r5)) i= 1, 2, ui
EAH = 0 i = 1, …,5
hiEAH2 = 0 i= 3
hiEAH2 = ri r5 /(r1 (r1 + r2) + r5 (r4 + r5)) i= 4, 5
EEAH = Extreme Extreme Agreement on Helpfulness model. This model is similar to EE, but without
the unhelpfulness ratings.
hiEEAH = ri
2/ (r12 + r5
2) i = 1, 5 u1EEAH = 0 i = 1,…,5
h5EEAH = 0 i = 2, 3, 4
Additional Model Variation for Theory 2
UNS = Uniform Specific model. Predicts that metareviews are proportional to review levels and are
equally likely to be helpful or unhelpful independent of the star rating, with the helpfulness
percentage specific to the product.
hiUNS = ri H/(H+U) ui
UNS = ri U/(H+U)
Additional Model Variations for Theory 3
HE = Helpful Extremes model. Predicts 1- and 5-star reviews will be helpful, in relative proportion to
their frequency.
hiHE = ri /( r1 + r5) i = 1, 5 ui
HE = 0 i = 1, …, 5
hiHE = 0 i = 2, 3, 4
UE = Unhelpful Extremes model. Predicts 1- and 5-star reviews are unhelpful (possibly because they
are recognized as partisan).
hiUE = 0 i = 1,…, 5 ui
UE = ri /( r1 + r5) i = 1, 5
uiUE = 0 i =2, 3, 4
HEUMS = Helpful Extremes, Unhelpful Middles. Predicts 1- and 5-s are helpful and 2-, 3-, 4-s are
unhelpful, with the helpfulness percentage specific to the product.
31
h1HEUMS =r1/(r1+r5) H/(H+U) u1
HEUMS = 0
h2HEUMS = 0 u2
HEUMS = r2/(r2+r3+r4) U/(H+U)
h3HEUMS = 0 u3
HEUMS = r3/(r2+r3+r4) U/(H+U)
h4HEUMS = 0 u4
HEUMS = r4/(r2+r3+r4) U/(H+U)
h5HEUMS = r5/(r1+r5) H/(H+U) u5
HEUMS = 0
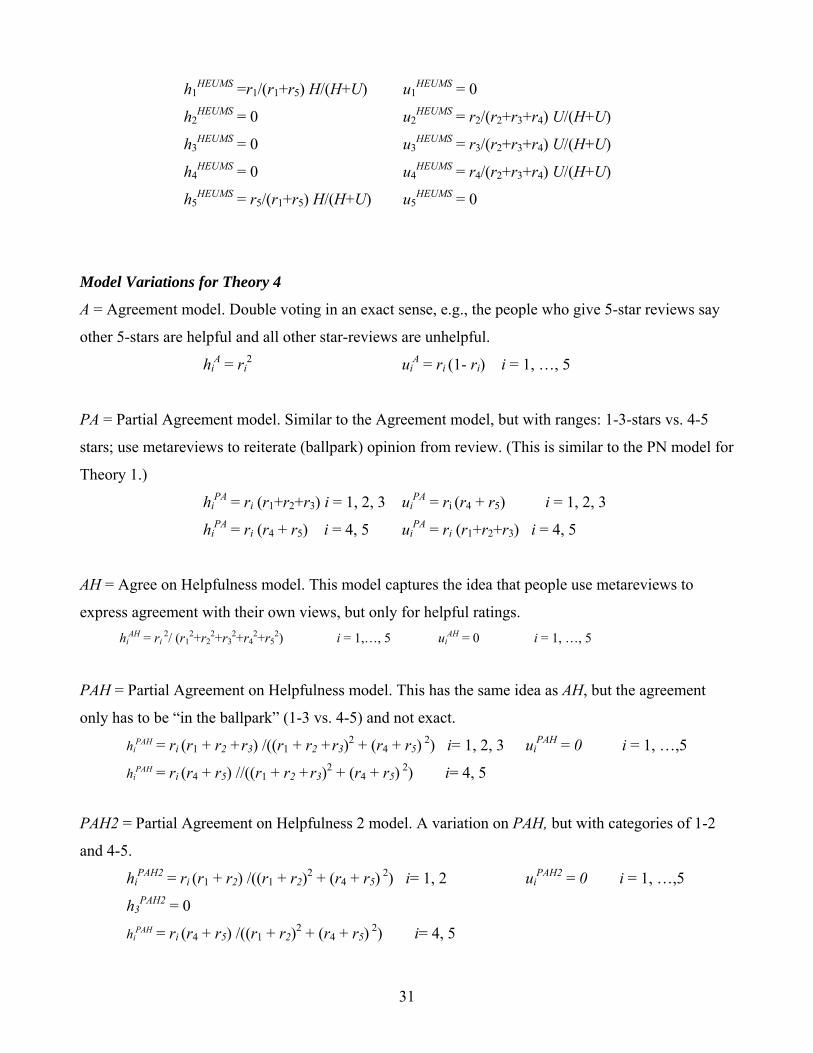
Model Variations for Theory 4
A = Agreement model. Double voting in an exact sense, e.g., the people who give 5-star reviews say
other 5-stars are helpful and all other star-reviews are unhelpful.
hiA = ri
2 uiA = ri (1- ri) i = 1, …, 5
PA = Partial Agreement model. Similar to the Agreement model, but with ranges: 1-3-stars vs. 4-5
stars; use metareviews to reiterate (ballpark) opinion from review. (This is similar to the PN model for
Theory 1.)
hiPA = ri (r1+r2+r3) i = 1, 2, 3 ui
PA = ri (r4 + r5) i = 1, 2, 3
hiPA = ri (r4 + r5) i = 4, 5 ui
PA = ri (r1+r2+r3) i = 4, 5
AH = Agree on Helpfulness model. This model captures the idea that people use metareviews to
express agreement with their own views, but only for helpful ratings. hi
AH = ri 2/ (r1
2+r22+r3
2+r42+r5
2) i = 1,…, 5 uiAH = 0 i = 1, …, 5
PAH = Partial Agreement on Helpfulness model. This has the same idea as AH, but the agreement
only has to be “in the ballpark” (1-3 vs. 4-5) and not exact.
hiPAH = ri (r1 + r2 +r3) /((r1 + r2 +r3)2 + (r4 + r5) 2) i= 1, 2, 3 ui
PAH = 0 i = 1, …,5
hiPAH = ri (r4 + r5) //((r1 + r2 +r3)2 + (r4 + r5) 2) i= 4, 5
PAH2 = Partial Agreement on Helpfulness 2 model. A variation on PAH, but with categories of 1-2
and 4-5.
hiPAH2 = ri (r1 + r2) /((r1 + r2)2 + (r4 + r5) 2) i= 1, 2 ui
PAH2 = 0 i = 1, …,5
h3PAH2 = 0
hiPAH = ri (r4 + r5) /((r1 + r2)2 + (r4 + r5) 2) i= 4, 5


