Alberto Cozzi Ripensare la risurrezione e/o annunciare il ...

© OECD/IEA 2016 © OECD/IEA 2016
Laura CozziMilan, 2 December 2016

© OECD/IEA 2016
Key points of orientation:
Middle East share in global oil production in 2016 at highest level for 40 years
Transformation in gas markets deepening with a 30% rise in LNG
Additions of renewable capacity in the power sector higher in 2015 than coal, gas, oil and nuclear combined
Energy sector in the spotlight as the Paris Agreement enters into force
Billions remain without basic energy services
There is no single story about the future of global energy; policies will determine where we go from here
The global energy context today
© OECD/IEA 2016
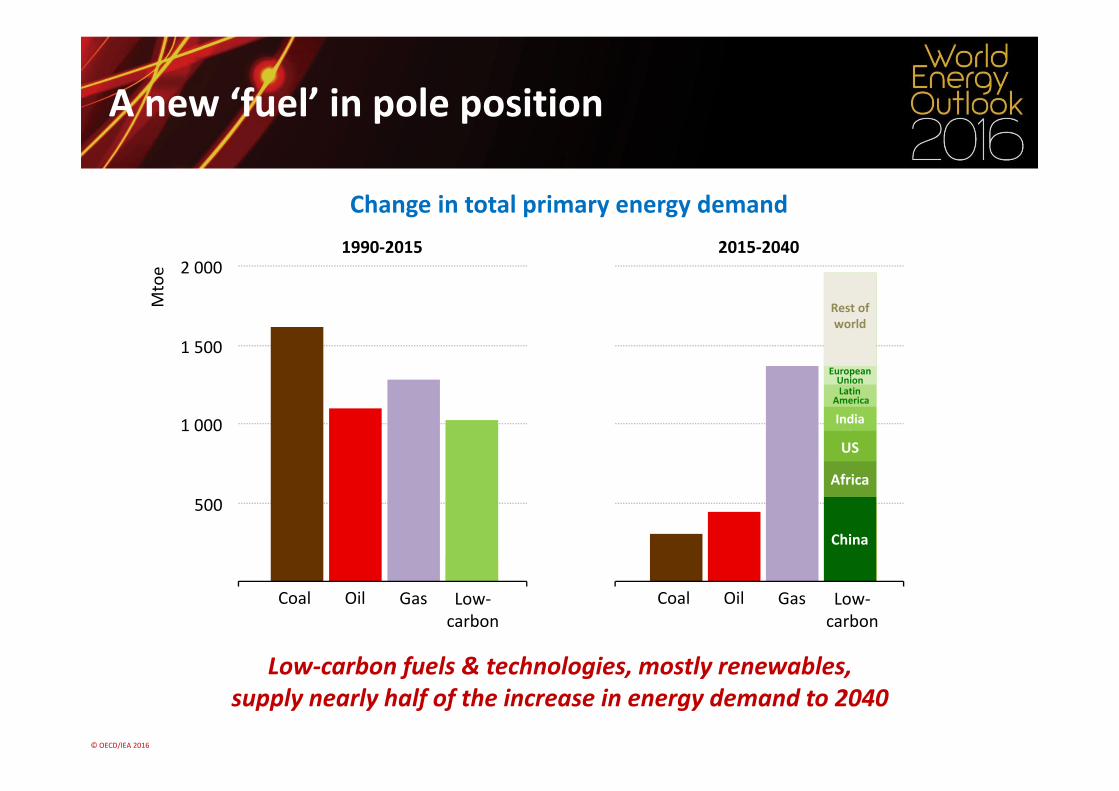
Change in total primary energy demand
Low‐carbon fuels & technologies, mostly renewables, supply nearly half of the increase in energy demand to 2040
Low‐carbon
Oil GasCoal
A new ‘fuel’ in pole position
500
1 000
1 500
2 0001990‐2015 2015‐2040
Mtoe
Low‐carbon
Oil GasCoal
Nuclear
Nuclear
Rene
wab
les
Rene
wab
les
Rest of world
EuropeanUnionLatin
America
India
US
Africa
China
© OECD/IEA 2016
1 000
2 000
3 000
4 000
TWh
1 500
3 000
4 500
6 000
TWh
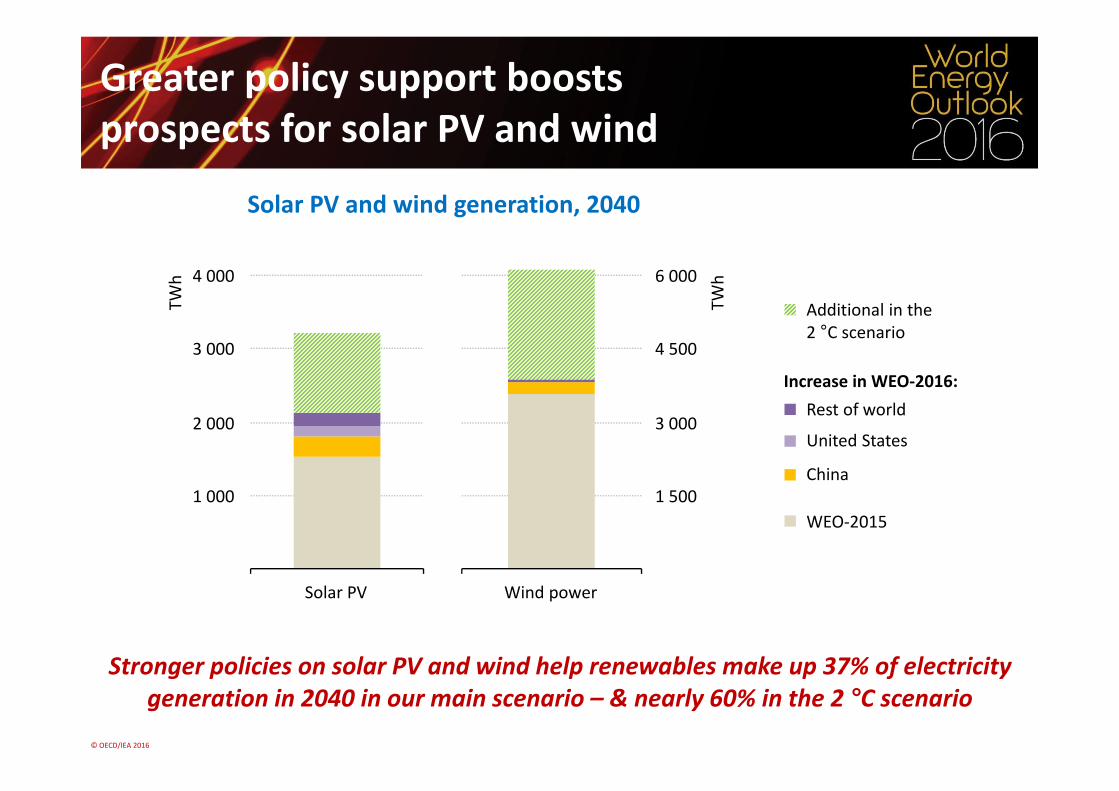
Greater policy support boostsprospects for solar PV and wind
Solar PV and wind generation, 2040
Stronger policies on solar PV and wind help renewables make up 37% of electricity generation in 2040 in our main scenario – & nearly 60% in the 2 °C scenario
Additional in the2 °C scenario
Rest of world
United States
China
WEO‐2015
Increase in WEO‐2016:
Solar PV Wind power
© OECD/IEA 2016
10% 20% 30% 40%Share of wind generation
2%
6%
8%
10%
Share of so
lar P
V gene
ratio
n
4%
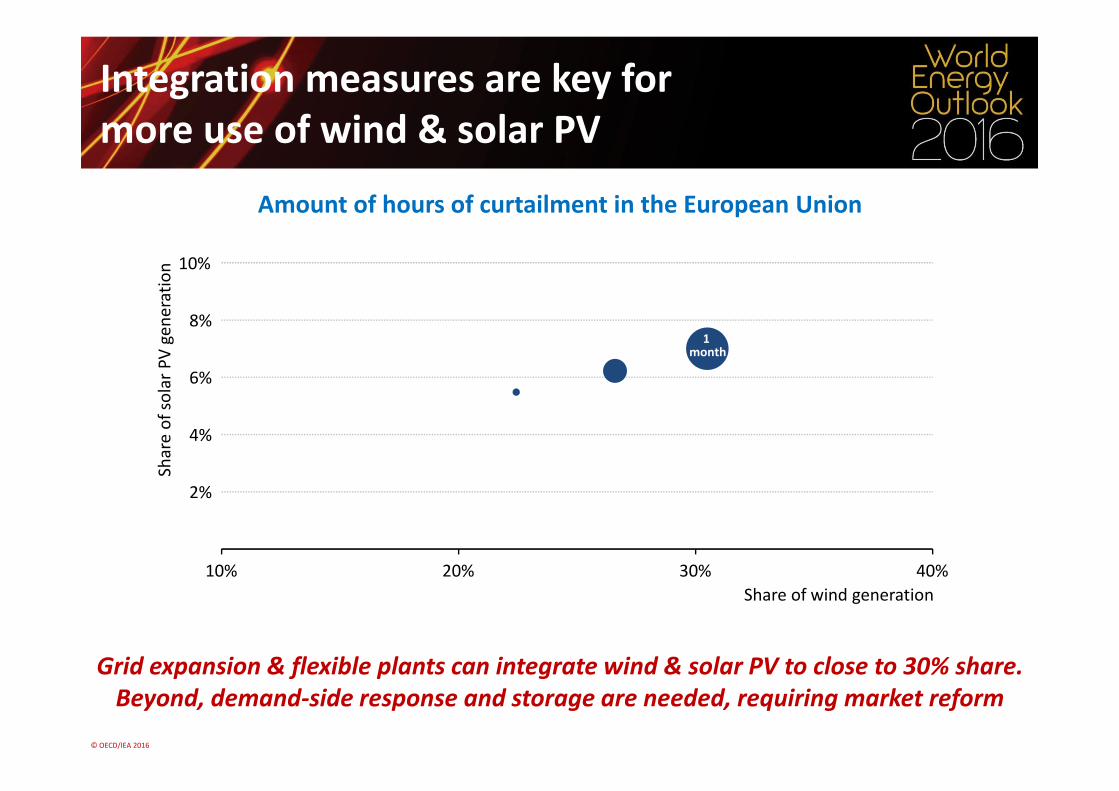
Amount of hours of curtailment in the European Union
Grid expansion & flexible plants can integrate wind & solar PV to close to 30% share.Beyond, demand‐side response and storage are needed, requiring market reform
Integration measures are key for more use of wind & solar PV
4 months1
month
© OECD/IEA 2016
‐3
0
3
6mb/d
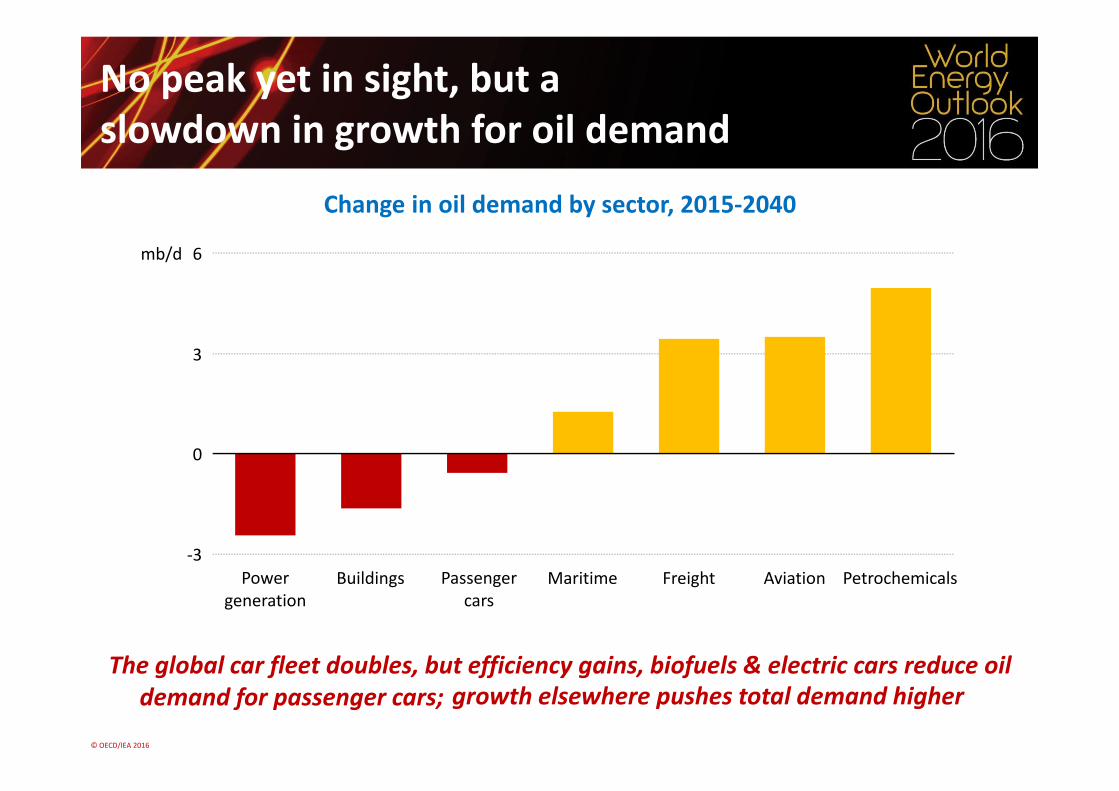
The global car fleet doubles, but efficiency gains, biofuels & electric cars reduce oil
Change in oil demand by sector, 2015‐2040
No peak yet in sight, but a slowdown in growth for oil demand
Powergeneration
Buildings Passengercars
Maritime Freight Aviation Petrochemicals
demand for passenger cars; growth elsewhere pushes total demand higher

© OECD/IEA 2016
A wave of LNG spurs a second natural gas revolution
Share of LNG in global long‐distance gas trade
Contractual terms and pricing arrangements are all being tested as new LNG from Australia, the US & others collides into an already well‐supplied market
2014685 bcm
20401 150 bcm
2000525 bcm
LNG53%PipelinePipeline LNG
42%Pipeline
LNG26%

© OECD/IEA 2016
A suite of tools to address energy security
Net gas imports in the European Union
The energy transition provides instruments to address traditional energy security concerns, while shifting attention to electricity supply
100
200
300
400
500
600
2014 2025 2040
bcm
Switch to renewablesEfficiency improvements
Gas net‐import
Reduction in net gas imports due to:
Of which increase in net gas imports due to:Change in gas productionfrom 2014

© OECD/IEA 2016
Energy security remains a major concern; potential vulnerabilities are growing, so too is the range of tools available to address them
New oil market dynamics & subdued upstream investment are ushering in a period of greater market volatility
A wave of LNG is the catalyst for a second natural gas revolution, with far‐reaching implications for gas pricing & contracts
Expiration of gas contracts in Europe opens up possibilities to diversify supply
Energy Union is an excellent framework: its impact on energy security depends on how it is implemented
Conclusions

© OECD/IEA 2016 © OECD/IEA 2016
www.worldenergyoutlook.org@IEA @IEABirol