Latvia's Internal Adjustment and Lessons for Europe
26
Latvia’s internal adjustment and lessons for Europe May 24, 2012 Ilmārs Rimšēvičs Governor of the Bank of Latvia
-
Upload
global-interdependence-center -
Category
Documents
-
view
224 -
download
3
description
Ilmars Remsevics presentation at "Economies of Baltic Sea Regions and Their Capital Markets: A Sustainable Recovery?"
Transcript of Latvia's Internal Adjustment and Lessons for Europe

Latvia’s internal adjustment and
lessons for Europe
May 24, 2012
Ilmārs Rimšēvičs
Governor of the Bank of Latvia

Presentation outline
Setting the scene: some
developments before the crisis
How Latvia came through the
recent crisis?
What are the lessons learned and
implications for Europe?

Latvia’s economy was on a fast track during 2004-2007
However, if driving fast, one has to make sure
that the pace is sustainable
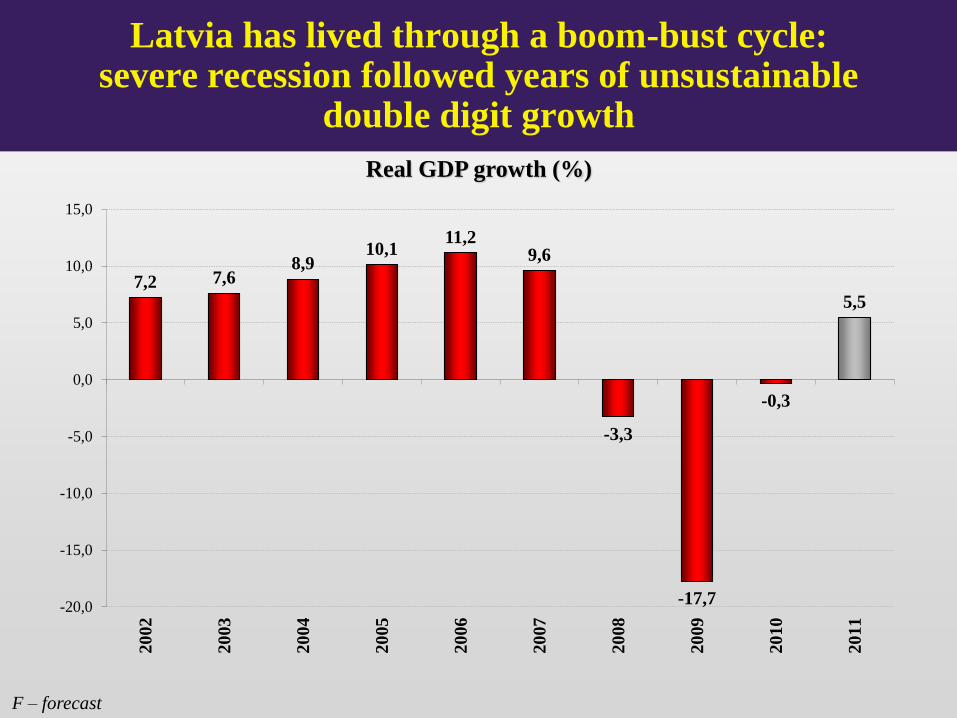
Latvia has lived through a boom-bust cycle: severe recession followed years of unsustainable
double digit growth
Real GDP growth (%)
F – forecast
7,2 7,6 8,9
10,1 11,2
9,6
-3,3
-17,7
-0,3
5,5
-20,0
-15,0
-10,0
-5,0
0,0
5,0
10,0
15,0
20
02
20
03
20
04
20
05
20
06
20
07
20
08
20
09
20
10
20
11

Over the past boom Latvia was running enormous underlying fiscal gap
General Government budget balance (ESA’95), % of GDP
Source: Eurostat, F - BoL staff estimation
-0,4 -0,5 -0,4 -4,2 -9,8 -8,2 -3,5 -1,9
-18,6
-14,1
-5,6
-2,7 -3,3
-6,4
-8,5 -7,5
-5,5
-2,2
-0,8
-20
-18
-16
-14
-12
-10
-8
-6
-4
-2
0
2005 2006 2007 2008 2009 2010 2011 2012F
Consolidation effort Actual (targeted) balance
Fiscal gap Structural budget balance

Many suggested devaluation as a
way out of the crisis.
Why devaluation was not an
appropriate solution?
To be or not to be, was the question
in 2008

Latvia lost market access already at the outset of the recent crisis and the fiscal gap had to be closed quickly
by massive consolidation
Breakdown of budget consolidation measures, % of GDP
Source: Ministry of Finance; Bank of Latvia staff calculations

How Latvia managed to accomplish what initially was claimed being impossible?
Speed

A speedy consolidation can be compared to a timely
pruning an apple-tree – you earlier and richer harvest

How Latvia managed to accomplish what initially was claimed being impossible?
Ownership

How Latvia managed to accomplish what initially was claimed being impossible?
Commitment

How Latvia managed to accomplish what initially was claimed being impossible?
Solidarity

Latvia has regained its competitiveness: wage-productivity gap has been closed
Real hourly wage and labour productivity per hour (seasonally adjusted), 2005 Q1 = 100
80
90
100
110
120
130
140
150
200
4 Q
1
Q3
200
5 Q
1
Q3
200
6 Q
1
Q3
200
7 Q
1
Q3
200
8 Q
1
Q3
200
9 Q
1
Q3
201
0 Q
1
Q3
201
1 Q
1
Q3
Labour productivity Real wage
Source: CSB; Bank of Latvia staff calculations

Despite loud ex-ante warnings of protracted recession risks under internal adjustment scenario,
a strong “V” shaped recovery followed
Real GDP growth, %
5,5
-20
-15
-10
-5
0
5
10
15
2006 2007 2008 2009 2010 2011
Source: CSB; F – Bank of Latvia forecast

Indeed, Latvia and other Baltic countries have clearly benefited from getting through the internal adjustment at
an early stage
GDP growth in 2011, % y-o-y
Source: Eurostat
-8,0
-6,0
-4,0
-2,0
0,0
2,0
4,0
6,0
8,0
Est
on
ia
Lit
hu
an
ia
La
tvia
Po
lan
d
Sw
ed
en
Slo
vak
ia
Au
stri
a
Ger
ma
ny
Fin
lan
d
Ro
ma
nia
Ma
lta
Bel
giu
m
Bu
lgaria
Cze
ch R
epu
bli
c
Fran
ce
Hu
ng
ary
Net
her
lan
ds
Lu
xem
bo
urg
Den
ma
rk
Un
ited
Kin
gd
om
Irel
an
d
Sp
ain
Cy
pru
s
Ita
ly
Slo
ven
ia
Po
rtu
gal
Gre
ece

Despite problems in many European countries, GDP growth even accelerated in Latvia (the fastest
growing economy in Europe at the beginning of 2012)
GDP growth in Latvia, % y-o-y
Source: CSB;
+6.8%
0,0
1,0
2,0
3,0
4,0
5,0
6,0
7,0
8,0
2011 I II III IV 2012 I

Exports already well above the pre-crisis peak level;
Latvia ranges among the export leaders in Europe
85
72 71 71
55 53
44 44 43 43 42 38 35 34 34 33 33 32 31 30 29 29
26 23 21
10
2
0
10
20
30
40
50
60
70
80
90
Est
on
ia
Bu
lga
ria
La
tvia
Lit
hu
an
ia
Ro
ma
nia
Gre
ece
Cze
ch R
epu
bli
c
Ma
lta
Sw
ed
en
Cy
pru
s
Slo
vak
ia
Po
lan
d
Hu
ng
ary
Un
ited
Kin
gd
om
Po
rtu
gal
Slo
ven
ia
Net
her
lan
ds
Ger
ma
ny
Sp
ain
Au
stri
a
Bel
giu
m
Italy
Fin
lan
d
Fran
ce
Den
ma
rk
Irel
an
d
Lu
xem
bo
urg
Merchandise export revenue growth (2011 over 2009, %)
Source: Eurostat

General government gross debt, % of GDP
Source: Eurostat, F -Bank of Latvia forecast
Latvia has managed to stabilize debt at moderate level and to avoid initially expected debt explosion
19,8
36,7
44,7 42,6 43,4
0
5
10
15
20
25
30
35
40
45
50
2008 2009 2010 2011 2012F

Lessons
What are the lessons
learned?

This crisis has shown that
MORE is LESS and LESS is MORE

"One doesn't die from debt, one dies from not being able to borrow"
0
50
100
150
200
Gre
ece*
Irel
and
Ital
y
Po
rtu
gal US
Bel
giu
m
Fra
nce UK
EU
27
Ger
man
y
Sp
ain
Hu
ngar
y
Au
stri
a
Mal
ta
Cy
pru
s
Net
her
lan
ds
Po
lan
d
Slo
ven
ia
Fin
lan
d
Slo
vak
ia
Lat
via
Den
mar
k
Cze
ch R
ep.
Lit
hu
ania
Ro
man
ia
Sw
eden
Lux
embo
urg
Bu
lgar
ia
Est
on
ia
2005
General government gross debt, % of GDP
Rogoff & Reinhart
debt thresholds
for advanced and
emerging economies
Source: AMECO

"One doesn't die from debt, one dies from not being able to borrow"
0
50
100
150
200
Gre
ece*
Irel
and
Ital
y
Po
rtu
gal US
Bel
giu
m
Fra
nce UK
EU
27
Ger
man
y
Sp
ain
Hu
ngar
y
Au
stri
a
Mal
ta
Cy
pru
s
Net
her
lan
ds
Po
lan
d
Slo
ven
ia
Fin
lan
d
Slo
vak
ia
Lat
via
Den
mar
k
Cze
ch R
ep.
Lit
hu
ania
Ro
man
ia
Sw
eden
Lux
embo
urg
Bu
lgar
ia
Est
on
ia
2010
General government gross debt, % of GDP
Rogoff & Reinhart
debt thresholds
for advanced and
emerging economies
Source: AMECO

"One doesn't die from debt, one dies from not being able to borrow"
0
50
100
150
200
Gre
ece*
Irel
and
Ital
y
Po
rtu
gal US
Bel
giu
m
Fra
nce UK
EU
27
Ger
man
y
Sp
ain
Hu
ngar
y
Au
stri
a
Mal
ta
Cy
pru
s
Net
her
lan
ds
Po
lan
d
Slo
ven
ia
Fin
lan
d
Slo
vak
ia
Lat
via
Den
mar
k
Cze
ch R
ep.
Lit
hu
ania
Ro
man
ia
Sw
eden
Lux
embo
urg
Bu
lgar
ia
Est
on
ia
2013
General government gross debt, % of GDP
Rogoff & Reinhart
debt thresholds
for advanced and
emerging economies
Source: AMECO

Most Euro area countries suffering from high debt are still running large budget deficits
General government gross debt General government budget deficit
2000 2005 2010 2013 2000 2005 2010 2013
Greece* 104.4 101.2 144.9 198.5 -3.8 -5.6 -10.8 -6.8
Ireland 37.5 27.2 94.9 121.1 4.7 1.7 -31.3 -7.8
Italy 108.5 105.4 118.4 118.7 -0.9 -4.5 -4.5 -1.1
Portugal 48.5 62.8 93.3 112.1 -2.9 -5.9 -9.8 -3.2
Belgium 107.8 92.0 96.2 100.3 -0.1 -2.8 -4.2 -4.6
France 57.4 66.7 82.3 91.7 -1.5 -3.0 -7.1 -5.1
EU27 61.9 62.9 80.3 84.9 0.5 -2.5 -6.6 -3.2
Germany 60.2 68.6 83.2 79.9 1.1 -3.3 -4.3 -0.7
Spain 59.3 43.0 61.0 78.0 -1.0 1.3 -9.3 -5.3
Austria 66.2 64.2 71.8 73.7 -1.8 -1.8 -4.4 -2.9
Malta 55.0 69.7 69.0 71.5 -5.8 -2.9 -3.6 -3.6
Cyprus 59.6 69.4 61.5 70.9 -2.3 -2.4 -5.3 -4.7
Netherlands 53.8 51.8 62.9 66.0 2.0 -0.3 -5.0 -2.7
Slovenia 26.3 26.7 38.8 54.6 -3.7 -1.5 -5.8 -5.7
Finland 43.8 41.7 48.3 53.5 6.8 2.5 -2.8 -0.8
Slovakia 50.3 34.2 41.0 51.1 -12.3 -2.8 -7.7 -5.2
Luxembourg 6.2 6.1 19.1 20.3 6.0 0.0 -1.1 -0.9
Estonia 5.1 4.6 6.7 6.1 -0.2 1.6 0.3 -0.8
Euro area fiscal indicators, % of GDP
Source: AMECO

Latvia’s example shows that Speed, Ownership,
Commitment and Solidarity works
-20
-15
-10
-5
0
5
10
200
8 I II III
IV
200
9 I II III
IV
201
0 I II III
IV
201
1 I II III
IV
201
2 I
First large consolidation
implemented by Dombrovskis
government
Talks about
consolidation
and inability to
deliver
Real GDP growth, % y-o-y
Source: CSB