Latin America shines: Is it for real this time? - BBVA Research · Static conceptStatic concept...
32
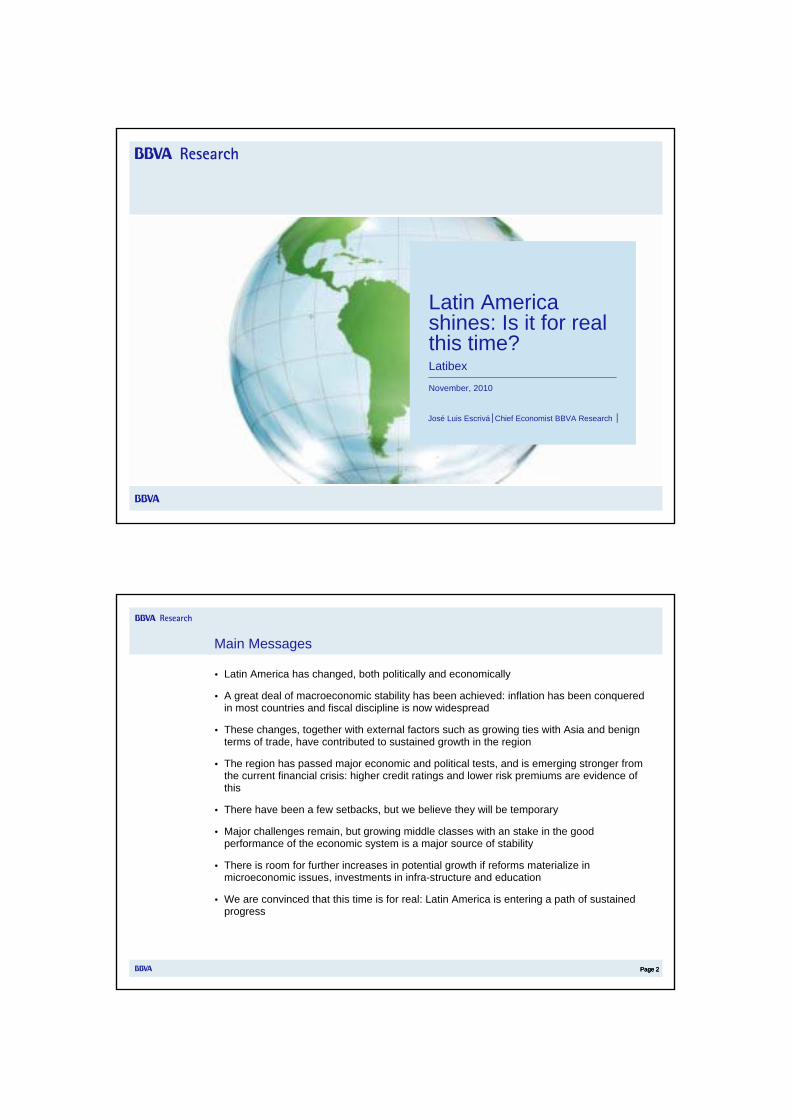
Latin America shines: Is it for real this time? Latibex November, 2010 José Luis Escrivá│Chief Economist BBVA Research │ Page 2 Page 2 Page 2 Main Messages • Latin America has changed, both politically and economically • A great deal of macroeconomic stability has been achieved: inflation has been conquered in most countries and fiscal discipline is now widespread • These changes, together with external factors such as growing ties with Asia and benign terms of trade, have contributed to sustained growth in the region • The region has passed major economic and political tests, and is emerging stronger from the current financial crisis: higher credit ratings and lower risk premiums are evidence of this • There have been a few setbacks, but we believe they will be temporary • Major challenges remain, but growing middle classes with an stake in the good performance of the economic system is a major source of stability • There is room for further increases in potential growth if reforms materialize in microeconomic issues, investments in infra-structure and education • We are convinced that this time is for real: Latin America is entering a path of sustained progress
Transcript of Latin America shines: Is it for real this time? - BBVA Research · Static conceptStatic concept...
Latin America shines: Is it for real this time?Latibex
November, 2010
José Luis Escrivá│Chief Economist BBVA Research │
Page 2Page 2Page 2
Main Messages
• Latin America has changed, both politically and economically
• A great deal of macroeconomic stability has been achieved: inflation has been conquered in most countries and fiscal discipline is now widespread
• These changes, together with external factors such as growing ties with Asia and benign terms of trade, have contributed to sustained growth in the region
• The region has passed major economic and political tests, and is emerging stronger from the current financial crisis: higher credit ratings and lower risk premiums are evidence of this
• There have been a few setbacks, but we believe they will be temporary
• Major challenges remain, but growing middle classes with an stake in the good performance of the economic system is a major source of stability
• There is room for further increases in potential growth if reforms materialize in microeconomic issues, investments in infra-structure and education
• We are convinced that this time is for real: Latin America is entering a path of sustained progress
Page 3
Index
Latin America
shines: Is it for real this
time?Latibex
Section I
Global OutlookSection II Latin America breaks with the past
Section III Latin America passes the “stress test”
Section IV A bright future, if the right road is taken
Section V
Latin America: Investment possibility
Page 4
Section I
Global Outlook
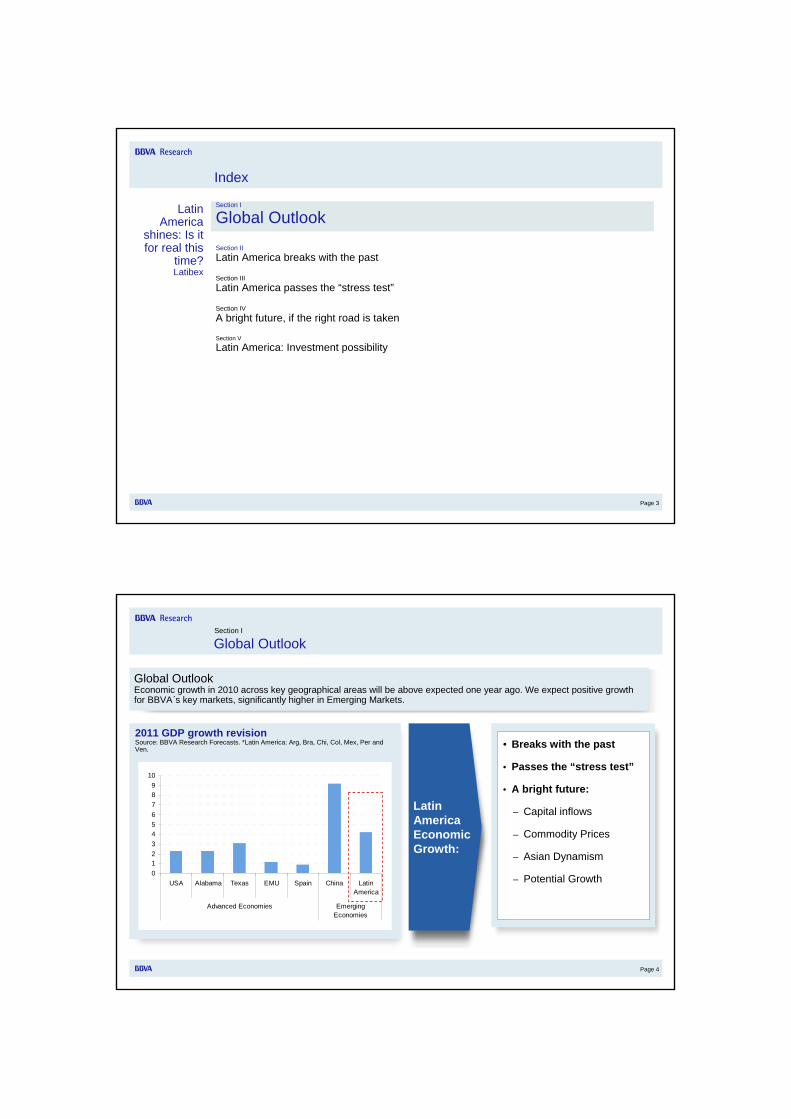
Global OutlookEconomic growth in 2010 across key geographical areas will be above expected one year ago. We expect positive growth for BBVA´s key markets, significantly higher in Emerging Markets.
2011 GDP growth revision Source: BBVA Research Forecasts. *Latin America: Arg, Bra, Chi, Col, Mex, Per and Ven.
Latin America Economic Growth:
• Breaks with the past
• Passes the “stress test”
• A bright future:
– Capital inflows
– Commodity Prices
– Asian Dynamism
– Potential Growth0123456789
10
USA Alabama Texas EMU Spain China LatinAmerica
Advanced Economies EmergingEconomies
Page 5
Note: 45 Emerging Markets– Argentina, Bahrain, Bangladesh, Brazil, Bulgaria, Chile, China, Colombia, Czech Rep., Egypt, Estonia, Hungary, India, Indonesia, Iran, Jordan, Korea, Kuwait, Latvia, Lithuania, Malaysia, Mauritius, Mexico, Morocco, Nigeria, Oman, Pakistan, Peru, Philippines, Poland, Qatar, Romania, Russia, Slovak Rep., South Africa, Sri Lanka, Sudan, Taiwan, Thailand, Tunisia, Turkey, Ukraine, UAE, Venezuela, Vietnam.
Section I
Global Outlook
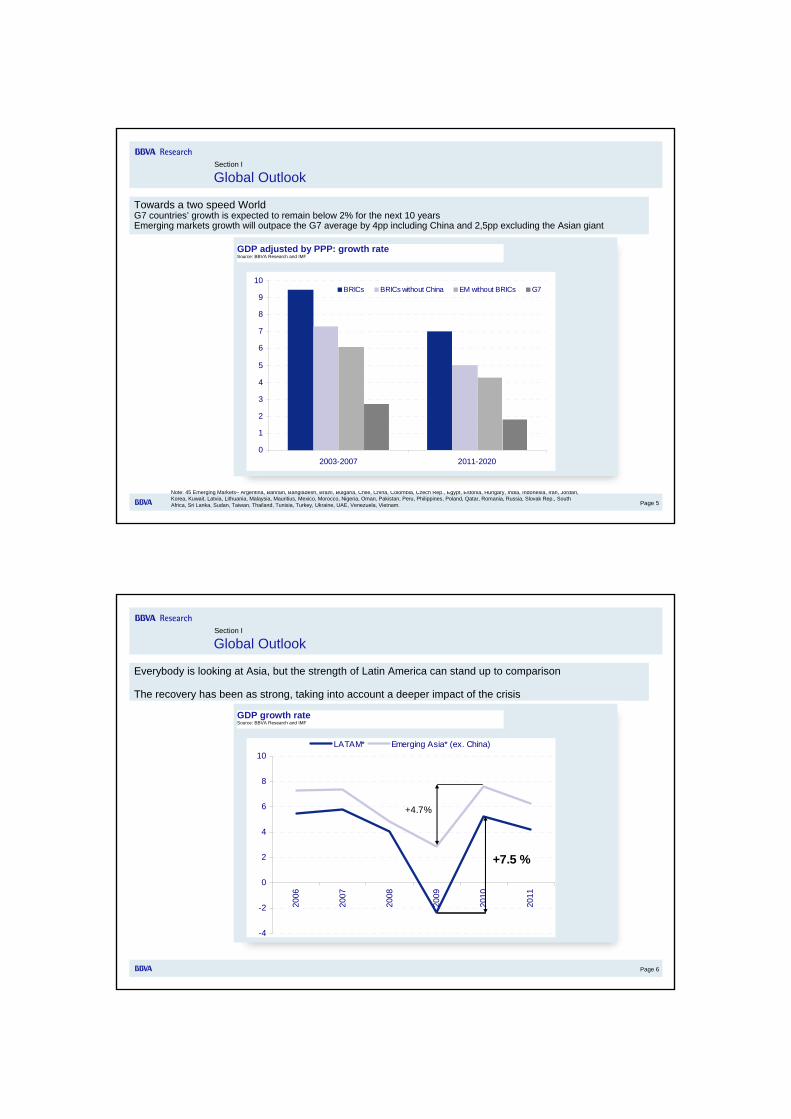
Towards a two speed WorldG7 countries’ growth is expected to remain below 2% for the next 10 yearsEmerging markets growth will outpace the G7 average by 4pp including China and 2,5pp excluding the Asian giant
GDP adjusted by PPP: growth rateSource: BBVA Research and IMF
0
1
2
3
4
5
6
7
8
9
10
2003-2007 2011-2020
BRICs BRICs without China EM without BRICs G7
Page 6
Section I
Global Outlook
Everybody is looking at Asia, but the strength of Latin America can stand up to comparison
The recovery has been as strong, taking into account a deeper impact of the crisis
GDP growth rateSource: BBVA Research and IMF
-4
-2
0
2
4
6
8
10
2006
2007
2008
2009
2010
2011
LATAM* Emerging Asia* (ex. China)
+7.5 %
+4.7%
Page 7
Section I
Global Outlook
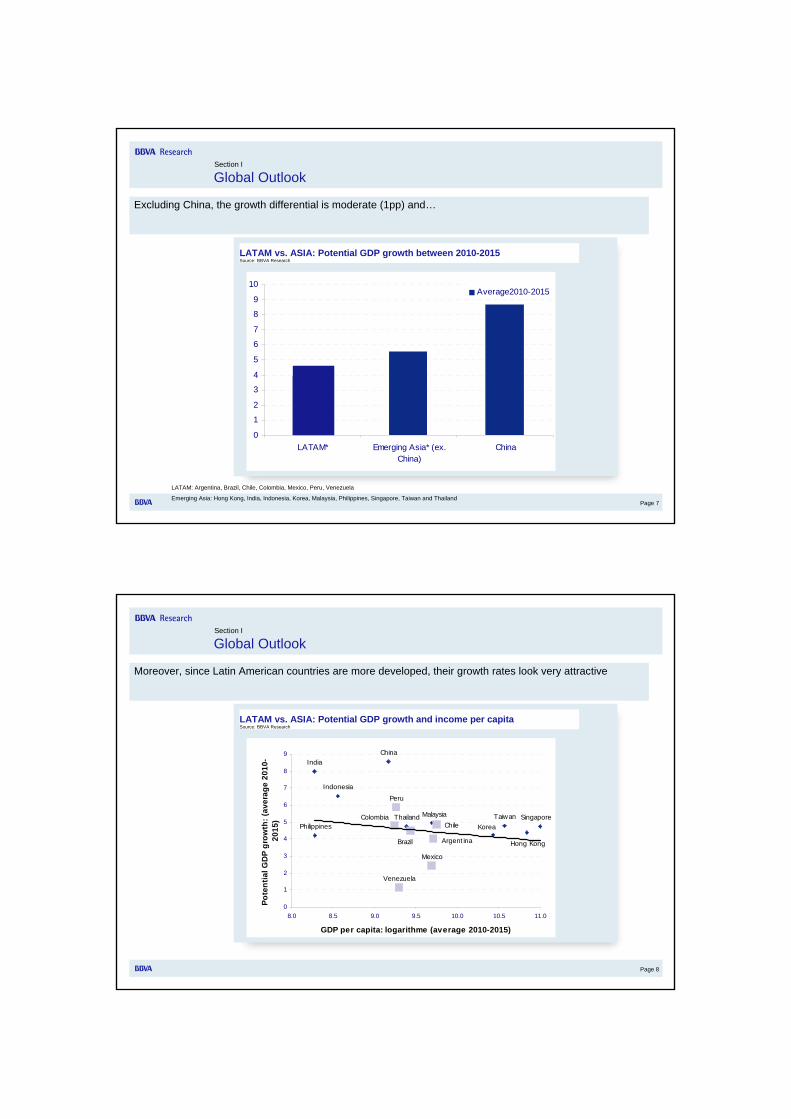
Excluding China, the growth differential is moderate (1pp) and…
0
1
2
3
4
5
6
7
8
9
10
LATAM* Emerging Asia* (ex.China)
China
Average2010-2015
LATAM vs. ASIA: Potential GDP growth between 2010-2015Source: BBVA Research
LATAM: Argentina, Brazil, Chile, Colombia, Mexico, Peru, Venezuela
Emerging Asia: Hong Kong, India, Indonesia, Korea, Malaysia, Philippines, Singapore, Taiwan and Thailand
Page 8
Section I
Global Outlook
Moreover, since Latin American countries are more developed, their growth rates look very attractive
LATAM vs. ASIA: Potential GDP growth and income per capitaSource: BBVA Research
Mexico
Brazil Argentina
ChileColombia
Peru
Venezuela
Hong Kong
India
Indonesia
Korea
Malaysia
PhilippinesSingaporeTaiwanThailand
China
0
1
2
3
4
5
6
7
8
9
8.0 8.5 9.0 9.5 10.0 10.5 11.0
GDP per capita: logarithme (average 2010-2015)
Pote
ntia
l GD
P gr
owth
: (av
erag
e 20
10-
2015
)

Page 9
Based on absolute sizeBased on absolute size Based on absolute growthBased on absolute growth
Allows no anticipation: too much inertia
Bigger does not necessarily determine market potential
Too long horizon: at least 20-25 years
Anticipation: dynamic concept
Large enough size plus…
Shorter horizon: next 10 years
BRICs (GS)BRICs (GS) BBVA EAGLEs definitionBBVA EAGLEs definition
Static conceptStatic concept Dynamic conceptDynamic concept
No clear cut-offNo clear cut-off Defined Cut-off: the G6Defined Cut-off: the G6
Why four countries? Subjective Flexible number of countries: “Club admission” depends on performance
BBVA EAGLEs is the set of countries whose contribution to World GDP growth is expected to be larger than that of the average G6 economy
BBVA EAGLEs is the set of countries whose contribution to World GDP growth is expected to be larger than that of the average G6 economy
Fast enough growth
Section I
Global Outlook
Page 10
Section I
Global Outlook
BBVA EAGLEs : Latin America compares with Asia in terms of its role for global growth in this decade1) Latin American EAGLEs similar to Asian (ex China-India)2) Latin American NEST countries close to Asian. Andinos region would make it into EAGLE status
0.0
0.2
0.4
0.6
0.8
1.0
1.2
Indonesia Korea Taiwan Brazil Mexico
Contributions to World GDP growth: 2010-2020Source: BBVA Research
EAGLE countries
Asian EAGLES
2,2% of world growth
Latin America EAGLES
1,7% of world growth
0.0
0.2
0.4
0.6
0.8
1.0
1.2
THAI MAL VIET BANG PHILL COL ARG PER Andinos
Asian NEST
1,3% of world growth
Latam NEST+Chile
0.8% of world growth
NEST countries

Page 11
Section I
Global Outlook
High liquidity and low interest rates, at least for a whileWhile the long-term benchmark rate in USA is at record low levels due to high and rising liquidity to revive lending in the Advanced Economies, Latin America (as most Emerging Markets) has seen risk premiums fall, creating very favorable financial conditions and pressures for their currencies to appreciate
Benchmark Rate US Treasury Bond (10 Y)Source: BBVA Research Forecasts.
Spread CDS Latin America vs. Germany. Source: BBVA Research Forecasts. *Latin America: Bra, Chi, Col, Mex and Per.
0.0
0.5
1.0
1.5
2.0
2.5
3.0
3.5
4.0
4.5
5.0
Average 2004-2008 Now
0
20
40
60
80
100
120
140
160
180
Average 2004-2008 Now
Page 12
Index
Latin America
shines: Is it for real this
time?Latibex
Section IGlobal Outlook
Section II
Latin America breaks with the pastSection III Latin America passes the “stress test”
Section IV A bright future, if the right road is taken
Section VLatin America: Investment possibility

Page 13
Section II
Latin America breaks with the past
LatAm, GDP per capita, relative performance to US, decade average. 70’s=100Source: BBVA Research
Latam is beginning to close the Income Gap after decades of disappointmentThe financial crisis has not stopped the convergence process. In the past, recessions meant long periods of divergence
LatAm, GDP per capita, relative performance to US, crisis(*) comparison. (*) US recession in terms of GDP pc. Source: BBVA Research
90
95
100
105
110
-2 -1 0 1 2 3 4Years since the Crisis
90
95
100
105
110
Current, 2008 Average, 1980-1991-2002
0
20
40
60
80
100
120
70's 80's 90's 00's 10's (2010-12)0
20
40
60
80
100
120
Page 14
Section II
Latin America breaks with the past
While taming inflation in the late 90s, the region made sustained progress in external and public solvency over the years
LatAm, External DebtAs % of the GDPSource: BBVA Research
LatAm, External and Fiscal Balance. As % of the GDPSource: BBVA Research
LatAm, InflationCPI, %, yearly averageSource: BBVA Research
0
50
100
150
200
250
300
350
80's 90's 00's 10's (2010-12)0
50
100
150
200
250
300
350
0
5
10
15
20
25
30
35
40
45
50
80's 90's 00's 10's (2010-12)0
5
10
15
20
25
30
35
40
45
50
-16
-14
-12
-10
-8
-6
-4
-2
0
2
80's 90's 00's 10's (2010-12)-16
-14
-12
-10
-8
-6
-4
-2
0
2
Current Account Balance Fiscal Balance

Page 15
Section II
Latin America breaks with the past
LatAm, Political FreedomFreedom House Index, % of free countriesSource: BBVA Research with Freedom House data
LatAm, Economic reformsSource: BBVA Research based on IADB and ECLAC data
0%
10%
20%
30%
40%
50%
60%
70%
75 80 90 00 100%
10%
20%
30%
40%
50%
60%
70%
Free
0.00
0.10
0.20
0.30
0.40
0.50
0.60
0.70
0.80
0.90
1.00
Trade Financial Lib. Privatization Tax Code Fin. Openning1970 1980 1990 2000
Economic change has come along with institutional progress
Page 16
Section II
Latin America breaks with the past
The banking systems have been able to speed up credit supply, to cut NPL losses and to preserve high capital to assets levels
LatAm, Bank Capital to Assets %Source: BBVA Research, GSFR
LatAm, NPL %Source: BBVA Research, GSFR
LatAm, Credit As % of the GDPSource: BBVA Research, GSFR. 2010 Forecast.
02468
101214161820
Arge
ntin
a
Braz
il
Chi
le
Col
ombi
a
Mex
ico
Peru
Vene
zuel
a
2003 2009
0
2
4
6
8
10
12
14
16
Arge
ntin
a
Braz
il
Chi
le
Col
ombi
a
Mex
ico
Peru
Vene
zuel
a
2003 2009
0%
10%
20%
30%
40%
50%
60%
70%
80%
90%
Arge
ntin
a
Braz
il
Chi
le
Col
ombi
a
Mex
ico
Perú
Vene
zuel
a
2003 2010

Page 17
Index
Latin America
shines: Is it for real this
time?Latibex
Section IGlobal Outlook
Section II Latin America breaks with the past
Section III
Latin America passes the “stress test”Section IV A bright future, if the right road is taken
Section VLatin America: Investment possibility
Page 18
The second test, the “Election cycle”
Section III
The region has passed a demanding sequence of tests since the 90s
Rob
ustn
ess
test
s
The first test, a hike in interest rates in the US
´
The current“twin test”
The region made substantial economic and institutional reforms, but also enjoyed a benign favorable environment in the second half of the 00sBut the region also confronted – and passed -severe tests, including the global financial crisis of 08
Early 2000’s Mid 2000’s Late 2000’s
The third test, global financial turbulences
The fourth test, commodity prices and global recession

Page 19
Response to an increase on global interest rates: decoupling based on enhanced financial soundness
Section III
First test: increase on global interest rates
Spread EMBI Latam vs. US 3 month interest rateSource: JP Morgan, Datastream and BBVA Research
Spread EMBI Latam vs. US 3 month interest rateSource: JP Morgan, Datastream and BBVA Research
3.0
3.5
4.0
4.5
5.0
5.5
6.0
6.5
7.0
Jan-
92M
ar-9
2M
ay-9
2Ju
l-92
Sep-
92N
ov-9
2Ja
n-93
Mar
-93
May
-93
Jul-9
3Se
p-93
Nov
-93
Jan-
94M
ar-9
4M
ay-9
4Ju
l-94
Sep-
94N
ov-9
4Ja
n-95
Mar
-95
May
-95
Jul-9
5Se
p-95
Nov
-95 400
600
800
1000
1200
1400
1600
1800
2000
US 3 month interest rate Spread Embi+ Latam (right axis)
0.0
0.5
1.0
1.5
2.0
2.5
3.0
3.5
4.0
4.5
Jan-
02M
ar-0
2M
ay-0
2Ju
l-02
Sep-
02N
ov-0
2Ja
n-03
Mar
-03
May
-03
Jul-0
3Se
p-03
Nov
-03
Jan-
04M
ar-0
4M
ay-0
4Ju
l-04
Sep-
04N
ov-0
4Ja
n-05
Mar
-05
May
-05
Jul-0
5Se
p-05
Nov
-05 0
200
400
600
800
1000
1200
1400
1600
US 3 month interest rate Spread Embi+ Latam (right axis)
1994 2004
Page 20
Uncertainty during Electoral Periods Embi spread Latin America, bpsSource: JP Morgan and BBVA Research
Presidential elections are losing their negative impact on risk premium they used to have in the past
Section III
Second test: the “Election cycle”
Sovereign spreads in Latin America (EMBI+, bps)
0
200
400
600
800
1000
1200
1400
1600
1800
2000
sep-
92
jun-
93
mar
-94
dic-
94
sep-
95
jun-
96
mar
-97
dic-
97
sep-
98
jun-
99
mar
-00
dic-
00
sep-
01
jun-
02
mar
-03
dic-
03
sep-
04
jun-
05
mar
-06
dic-
06
sep-
07
jun-
08
mar
-09
dic-
09
sep-
10
Lehman Brothers Crisis
Mexico andBrasil's elections
Brasil'selections
Currentelections
Page 21
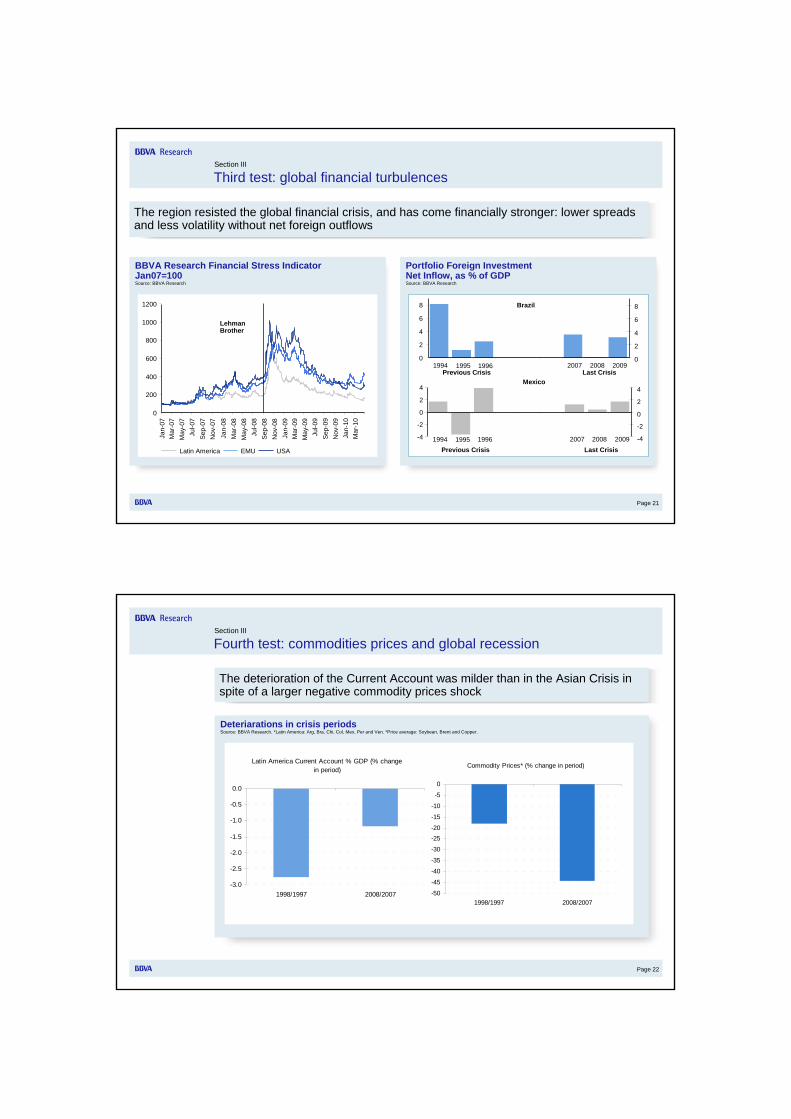
BBVA Research Financial Stress IndicatorJan07=100Source: BBVA Research
Portfolio Foreign InvestmentNet Inflow, as % of GDPSource: BBVA Research
The region resisted the global financial crisis, and has come financially stronger: lower spreads and less volatility without net foreign outflows
Section III
Third test: global financial turbulences
0
200
400
600
800
1000
1200
Jan-
07M
ar-0
7M
ay-0
7Ju
l-07
Sep-
07N
ov-0
7Ja
n-08
Mar
-08
May
-08
Jul-0
8Se
p-08
Nov
-08
Jan-
09M
ar-0
9M
ay-0
9Ju
l-09
Sep-
09N
ov-0
9Ja
n-10
Mar
-10
Latin America EMU USA
LehmanBrother
Mexico
-4
-2
0
2
4
1994 1995 1996 2007 2008 2009 -4
-2
0
2
4
Previous Crisis Last Crisis
Brazil
0
2
4
6
8
1994 1995 1996 2007 2008 20090
2
4
6
8
Previous Crisis Last Crisis
Page 22
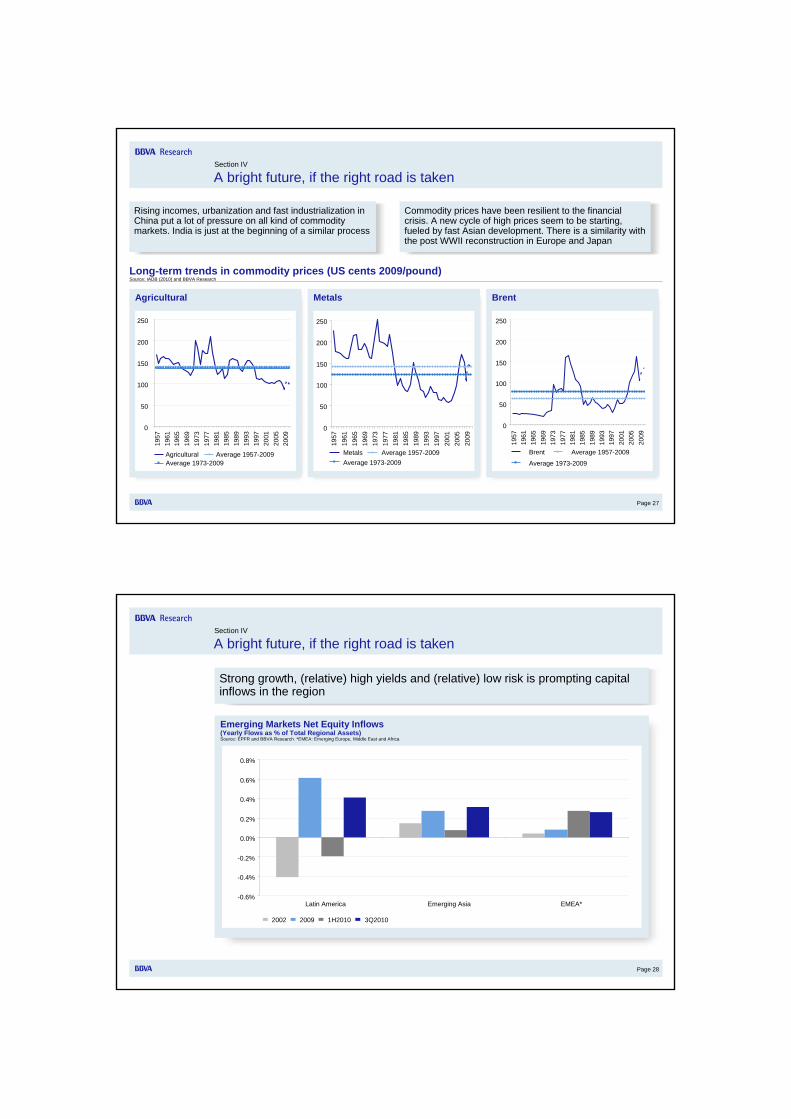
Deteriarations in crisis periods Source: BBVA Research. *Latin America: Arg, Bra, Chi, Col, Mex, Per and Ven. *Price average: Soybean, Brent and Copper.
Section III
Fourth test: commodities prices and global recession
The deterioration of the Current Account was milder than in the Asian Crisis in spite of a larger negative commodity prices shock
Latin America Current Account % GDP (% change in period)
-3.0
-2.5
-2.0
-1.5
-1.0
-0.5
0.0
1998/1997 2008/2007
Commodity Prices* (% change in period)
-50
-45
-40
-35
-30
-25-20
-15
-10
-5
0
1998/1997 2008/2007

Page 23
Interest Rate changes during crises (2002 compared to 2009)Source: BBVA Research
LatAm, Fiscal Stimulus as % of the GDPSource: BBVA Research
In this cycle fiscal and monetary policies were expansionary, marking a major break with previous cycles when financial constraints did not allowed them
Section III
New resilience allows countercyclical policies
-800
-600
-400
-200
0
200
400
600
800
Brazil Chile Colombia Mexico Peru
May02-Apr03 Jan09-current
0.0%
0.5%
1.0%
1.5%
2.0%
2.5%
3.0%
3.5%
Brazil Chile Colombia Mexico Peru
Temporary Permanent
0.0%
0.5%
1.0%
1.5%
2.0%
2.5%
3.0%
3.5%
Page 24
Index
Latin America
shines: Is it for real this
time?Latibex
Section IGlobal Outlook
Section II Latin America breaks with the past
Section III Latin America passes the “stress test”
Section IV
A bright future, if the right road is takenSection VLatin America: Investment possibility
Page 25
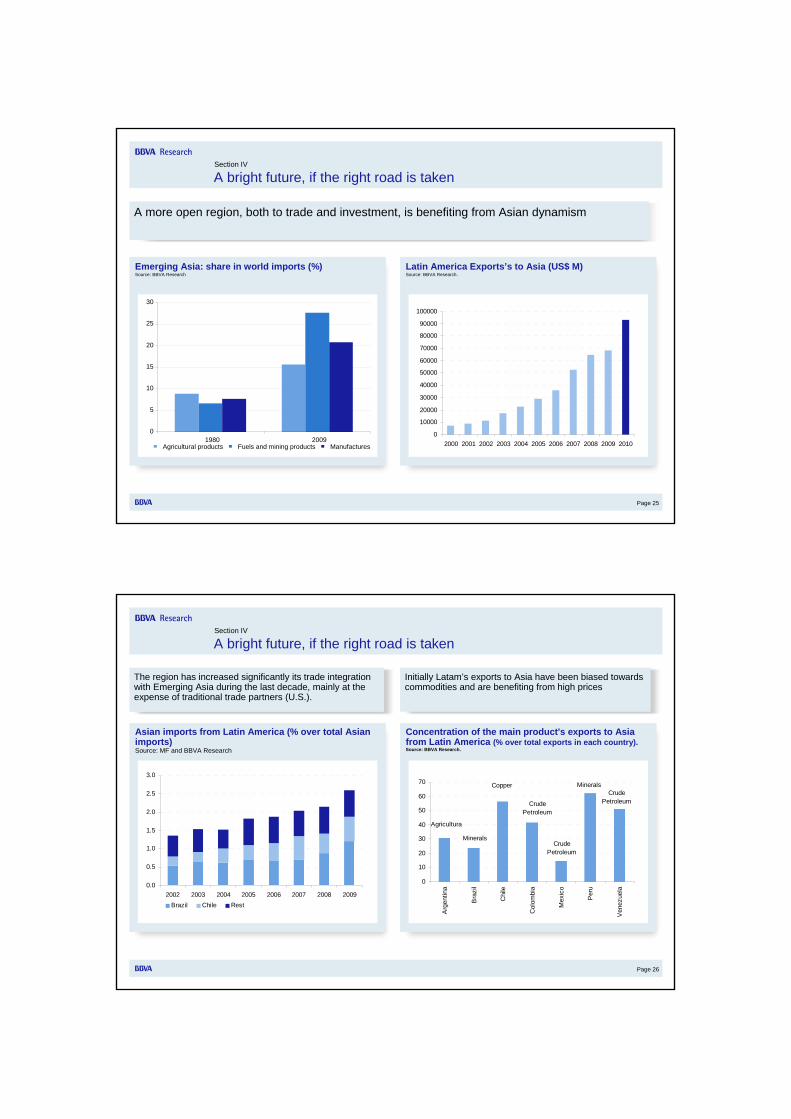
Emerging Asia: share in world imports (%)Source: BBVA Research
Latin America Exports’s to Asia (US$ M)Source: BBVA Research.
A more open region, both to trade and investment, is benefiting from Asian dynamism
Section IV
A bright future, if the right road is taken
0
10000
20000
30000
40000
50000
60000
70000
80000
90000
100000
2000 2001 2002 2003 2004 2005 2006 2007 2008 2009 2010
0
5
10
15
20
25
30
1980 2009Agricultural products Fuels and mining products Manufactures
Page 26
Asian imports from Latin America (% over total Asian imports)Source: MF and BBVA Research
Concentration of the main product's exports to Asia from Latin America (% over total exports in each country). Source: BBVA Research.
The region has increased significantly its trade integration with Emerging Asia during the last decade, mainly at the expense of traditional trade partners (U.S.).
Section IV
A bright future, if the right road is taken
Initially Latam’s exports to Asia have been biased towards commodities and are benefiting from high prices
0.0
0.5
1.0
1.5
2.0
2.5
3.0
2002 2003 2004 2005 2006 2007 2008 2009Brazil Chile Rest
0
10
20
30
40
50
60
70
Arg
entin
a
Bra
zil
Chi
le
Col
ombi
a
Mex
ico
Per
u
Ven
ezue
la
Minerals
Minerals
Agricultura
Copper
Crude Petroleum
Crude Petroleum
Crude Petroleum
Page 27
Rising incomes, urbanization and fast industrialization in China put a lot of pressure on all kind of commodity markets. India is just at the beginning of a similar process
Section IV
A bright future, if the right road is taken
Commodity prices have been resilient to the financial crisis. A new cycle of high prices seem to be starting, fueled by fast Asian development. There is a similarity with the post WWII reconstruction in Europe and Japan
Long-term trends in commodity prices (US cents 2009/pound)Source: IADB (2010) and BBVA Research
Agricultural Metals Brent
0
50
100
150
200
250
1957
1961
1965
1969
1973
1977
1981
1985
1989
1993
1997
2001
2005
2009
Agricultural Average 1957-2009Average 1973-2009
0
50
100
150
200
250
1957
1961
1965
1969
1973
1977
1981
1985
1989
1993
1997
2001
2005
2009
Metals Average 1957-2009Average 1973-2009
0
50
100
150
200
250
1957
1961
1965
1969
1973
1977
1981
1985
1989
1993
1997
2001
2005
2009
Brent Average 1957-2009
Average 1973-2009
Page 28
Strong growth, (relative) high yields and (relative) low risk is prompting capital inflows in the region
Emerging Markets Net Equity Inflows (Yearly Flows as % of Total Regional Assets)Source: EPFR and BBVA Research. *EMEA: Emerging Europe, Middle East and Africa
Section IV
A bright future, if the right road is taken
-0.6%
-0.4%
-0.2%
0.0%
0.2%
0.4%
0.6%
0.8%
Latin America Emerging Asia EMEA*
2002 2009 1H2010 3Q2010
Page 29
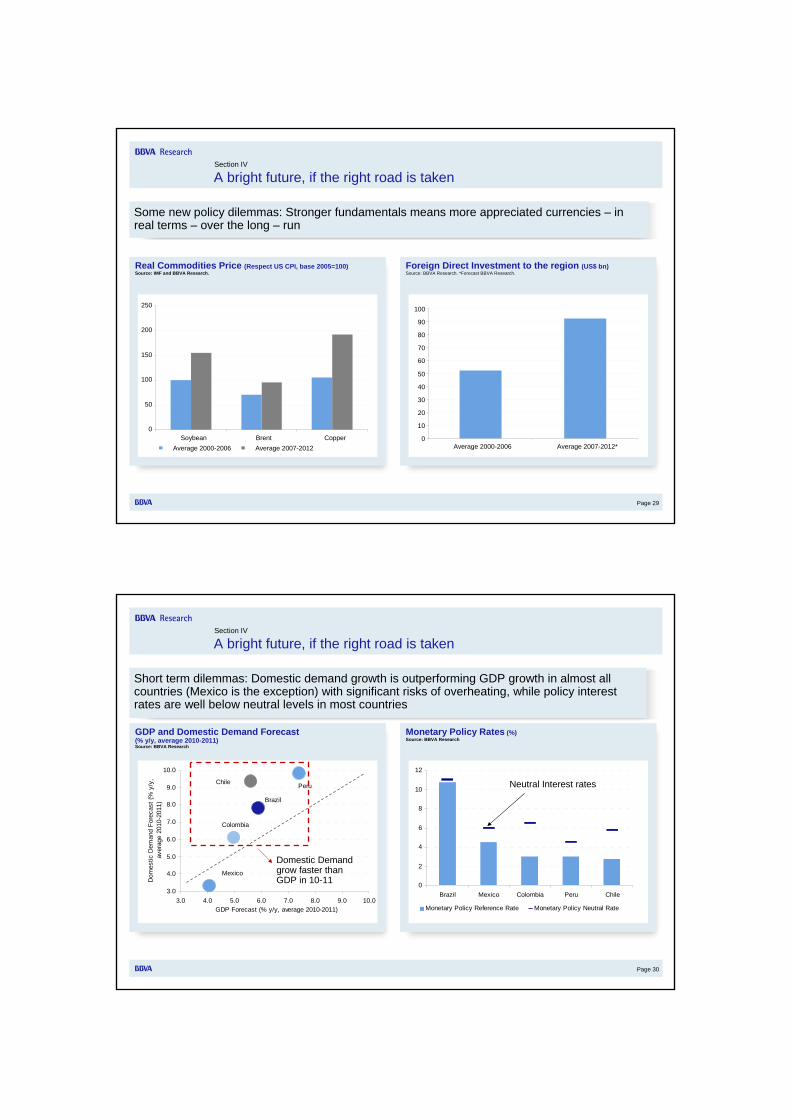
Real Commodities Price (Respect US CPI, base 2005=100)Source: IMF and BBVA Research.
Foreign Direct Investment to the region (US$ bn)Source: BBVA Research. *Forecast BBVA Research.
Section IV
A bright future, if the right road is taken
Some new policy dilemmas: Stronger fundamentals means more appreciated currencies – in real terms – over the long – run
0
50
100
150
200
250
Soybean Brent CopperAverage 2000-2006 Average 2007-2012
0
10
20
30
40
50
60
70
80
90
100
Average 2000-2006 Average 2007-2012*
Page 30
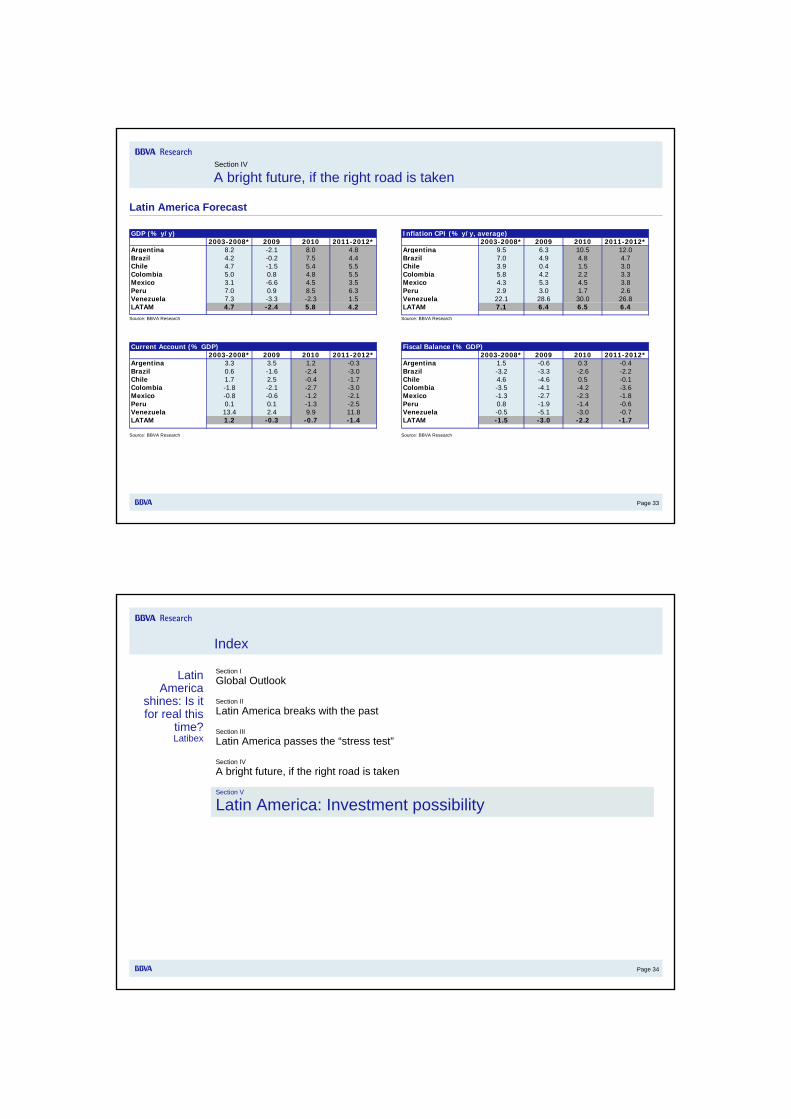
Monetary Policy Rates (%)Source: BBVA Research
0
2
4
6
8
10
12
Brazil Mexico Colombia Peru Chile
Monetary Policy Reference Rate Monetary Policy Neutral Rate
GDP and Domestic Demand Forecast(% y/y, average 2010-2011)Source: BBVA Research
3.0
4.0
5.0
6.0
7.0
8.0
9.0
10.0
3.0 4.0 5.0 6.0 7.0 8.0 9.0 10.0GDP Forecast (% y/y, average 2010-2011)
Dom
estic
Dem
and
Fore
cast
(% y
/y,
aver
age
2010
-201
1)
Mexico
Chile Peru
Brazil
Colombia
Section IV
A bright future, if the right road is taken
Short term dilemmas: Domestic demand growth is outperforming GDP growth in almost all countries (Mexico is the exception) with significant risks of overheating, while policy interest rates are well below neutral levels in most countries
Neutral Interest rates
Domestic Demand grow faster than GDP in 10-11

Page 31
Exchange Rate: Appreciations and InterventionsSource: BBVA Research. *Exchange intervention: International Reserves: net purchase between Jan08-Sep10 (% GDP). **Exchange variation: Appreciation/Depreciation in Real Effective Exchange Rate between Jan08-Sep10
Inflation (% y/y)Source: BBVA Research
Section IV
A bright future, if the right road is taken
Short term dilemmas: FX interventions have failed to prevent excessive appreciations in most countries, and policy makers are increasingly tilting towards capital controls. However, if these measures prove effective, there is a risk they will backfire through high inflation
-4.0
-2.0
0.0
2.0
4.0
6.0
8.0
10.0
Jan-
09
Mar
-09
May
-09
Jul-0
9
Sep
-09
Nov
-09
Jan-
10
Mar
-10
May
-10
Jul-1
0
Sep
-10
Brazil Mexico Colombia Peru Chile
-10.0
-5.0
0.0
5.0
10.0
15.0
20.0
25.0
0.0 2.0 4.0 6.0 8.0Exchange Interventions*
Exc
hang
e V
aria
tion*
*
Mexico
Chile
PeruBrazil
Colombia
App
reci
atio
nD
epre
ciat
ion
Page 32
Potential Output Growth (% yoy change)Source: BBVA Research. *Latin America: Arg, Bra, Chi, Col, Mex, Per and Ven.
0.0%1.0%2.0%3.0%4.0%5.0%6.0%7.0%8.0%9.0%
10.0%
1990
-20
09
2011
-20
15
1990
-20
09
2011
-20
15
1990
-20
09
2011
-20
15
1990
-20
09
2011
-20
15
USA EMU Latin America* China
Growth sources Source: BBVA Research. *Latin America: Arg, Bra, Chi, Col, Mex, Per and Ven.
Section IV
A bright future, if the right road is taken
There is room for further increases in potential growth in the case extra microeconomic reforms and more investments in infra-structure and education materialize
0%
2%
4%
6%
8%
10%
12%
1960-00 2008 1960-00 2008
China Latin America
Capital Employment TFP
Page 33
Section IV
A bright future, if the right road is taken
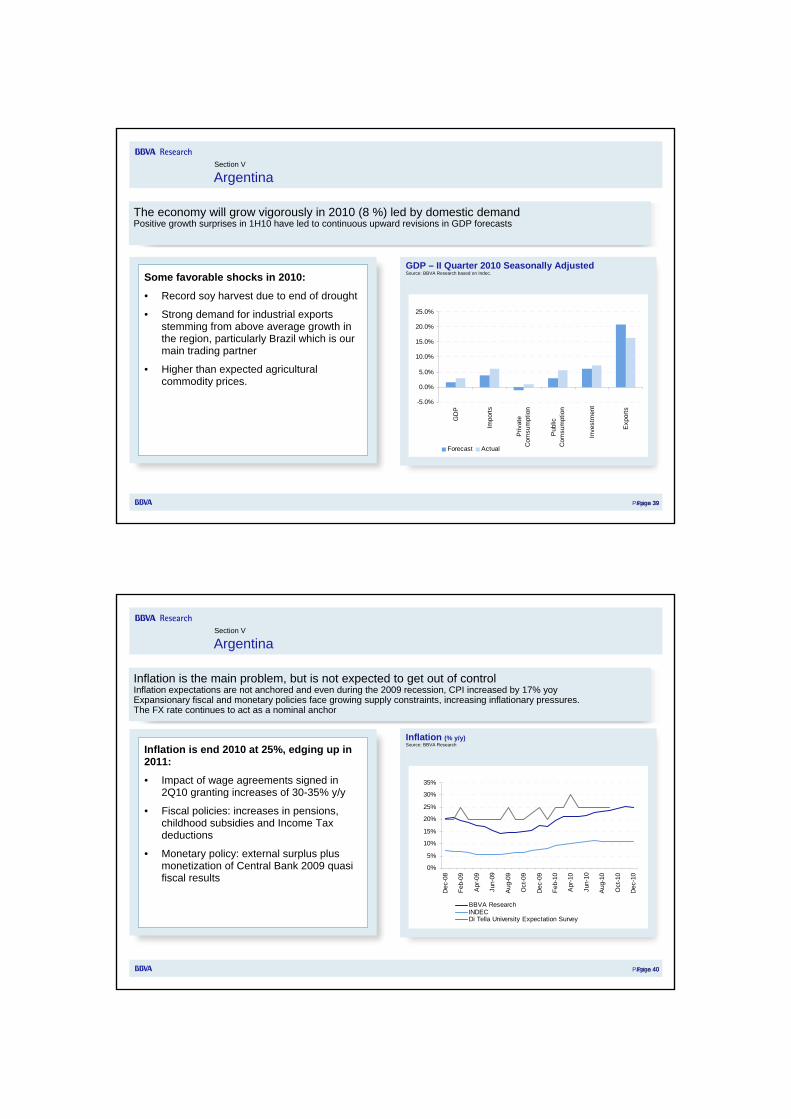
2003-2008* 2009 2010 2011-2012*Argentina 8.2 -2.1 8.0 4.8Brazil 4.2 -0.2 7.5 4.4Chile 4.7 -1.5 5.4 5.5Colombia 5.0 0.8 4.8 5.5Mexico 3.1 -6.6 4.5 3.5Peru 7.0 0.9 8.5 6.3Venezuela 7.3 -3.3 -2.3 1.5LATAM 4.7 -2.4 5.8 4.2
GDP (% y/y)2003-2008* 2009 2010 2011-2012*
Argentina 9.5 6.3 10.5 12.0Brazil 7.0 4.9 4.8 4.7Chile 3.9 0.4 1.5 3.0Colombia 5.8 4.2 2.2 3.3Mexico 4.3 5.3 4.5 3.8Peru 2.9 3.0 1.7 2.6Venezuela 22.1 28.6 30.0 26.8LATAM 7.1 6.4 6.5 6.4
Inflation CPI (% y/y, average)
2003-2008* 2009 2010 2011-2012*Argentina 3.3 3.5 1.2 -0.3Brazil 0.6 -1.6 -2.4 -3.0Chile 1.7 2.5 -0.4 -1.7Colombia -1.8 -2.1 -2.7 -3.0Mexico -0.8 -0.6 -1.2 -2.1Peru 0.1 0.1 -1.3 -2.5Venezuela 13.4 2.4 9.9 11.8LATAM 1.2 -0.3 -0.7 -1.4
Current Account (% GDP)
Latin America Forecast
Source: BBVA Research
Source: BBVA Research
Source: BBVA Research
Source: BBVA Research
2003-2008* 2009 2010 2011-2012*Argentina 1.5 -0.6 0.3 -0.4Brazil -3.2 -3.3 -2.6 -2.2Chile 4.6 -4.6 0.5 -0.1Colombia -3.5 -4.1 -4.2 -3.6Mexico -1.3 -2.7 -2.3 -1.8Peru 0.8 -1.9 -1.4 -0.6Venezuela -0.5 -5.1 -3.0 -0.7LATAM -1.5 -3.0 -2.2 -1.7
Fiscal Balance (% GDP)
Page 34
Index
Latin America
shines: Is it for real this
time?Latibex
Section IGlobal Outlook
Section II Latin America breaks with the past
Section III Latin America passes the “stress test”
Section IV A bright future, if the right road is taken
Section V
Latin America: Investment possibility

Page 35
The infrastructure Quality Gap Index* (IQGI)Source: World Economic Forum.
The infrastructure private investment attractiveness index (IPIAI)**Source: World Economic Forum.
Section V
Latin America: Investment possibilities
Investment's necessity in infrastructuresLatin American prove to be like very propitious for environment private investment in infrastructure and their challenge is mostly one of execution and innovation to deal with the specific complexities that each country faces
* This index assesses the quality gap in road, port, air transport and electricity infrastructure of a given country with respect to a control country, namely Germany, which was chosen in light of its world-class infrastructure development.
** which measures the institutions, factors and policies that attract private investment in infrastructure projects. See the detailed composition of the IPIAI. http://www.weforum.org/en/initiatives/gcp/InfrastructurePrivateInvestmentAttractivenessIndex/index.htm
0
2
4
6
8
10
12
14
16
18
Peru Venezuela Argentina Chile
Road Port Air transport Electricity
0
1
2
3
4
5
6
Chile Colombia Mexico Venezuela
Page 36
Foreign Direct Investment US$ bn(accumulated stock since 2005).Source: BBVA Research.
Financing need of Top ten investment projectsSource: BBVA Research
Section V
Latin America: Investment’s possibilities
Foreign Direct Investment in Natural ResourcesThe region will need in the short term financing, principally for the execution of projects based on natural resources
0
20
40
60
80
100
120
140
160
180
Brazil Mexico Chile Colombia Argentina Peru
FDI FDI to Natural Resources
0
10
20
30
40
Brazil Peru Chile Colombia
92
Energy and infraestructures
Energy
Metals
Metals and construction
Energy and metals
Energy
Food, energy and automotive

Page 37
Section V
Latin America: Investment’s possibilities
Diversity in the region (GDP and CPI forecast)Source: BBVA Research. *Price Stability: CPI 2010-2012 (spread % y/y average latam vs. average country). **Economic Growth: GDP 2010-2012 (spread % y/y average country vs. average latam) Bubble size: Total GDP based on purchasing-power-parity (PPP).
• The “two giants” (BRA, MEX)
• Medium Size Emerging South America: medium size countries combine good performance both in inflation and growth (CHL, COL, PER)
• The “heterodox”countries: most countries have achieved low inflation, but it remains a problem in ARG and VEN
But Latin America is not one entity: there is diversity in the region
-25.0
-20.0
-15.0
-10.0
-5.0
0.0
5.0
10.0
-6.0 -5.0 -4.0 -3.0 -2.0 -1.0 0.0 1.0 2.0Economic Growth**
Pric
e st
abili
ty*
CHL PERMEX
BRA
ARG
VEN
COL PAN
URU PAR
Maj
or p
rice'
s st
abilit
y
Major economic growth's stability
Page 38Page 38
Section V
Argentina
• The economy will grow strongly in 2010, in spite of a slowdown in 2H. Higher political uncertainty and lower growth are expected in 2011, which, together with less expansionary demand policies in 2012-13 will lead to the output gap closing towards 2014
• Positive growth surprises in 1H10: the recovery in confidence, low interest rates and exchange rate stability are boosting consumption. Better than expected investment performance.
• When faced with supply constraints, expansionary fiscal and monetary policies are increasing inflationary pressures. A credible anti-inflation plan is required to put a cap on 2 digit price increases.
• In spite of rising imports and real exchange rate appreciation, the current account is expected to remain in surplus until 2012
• Improving fiscal solvency, although doubts about 2011 financing and the possibility of tapping credit markets remain
• The banking system remains solid, but size is an issue
An economy at full speed
Page 39
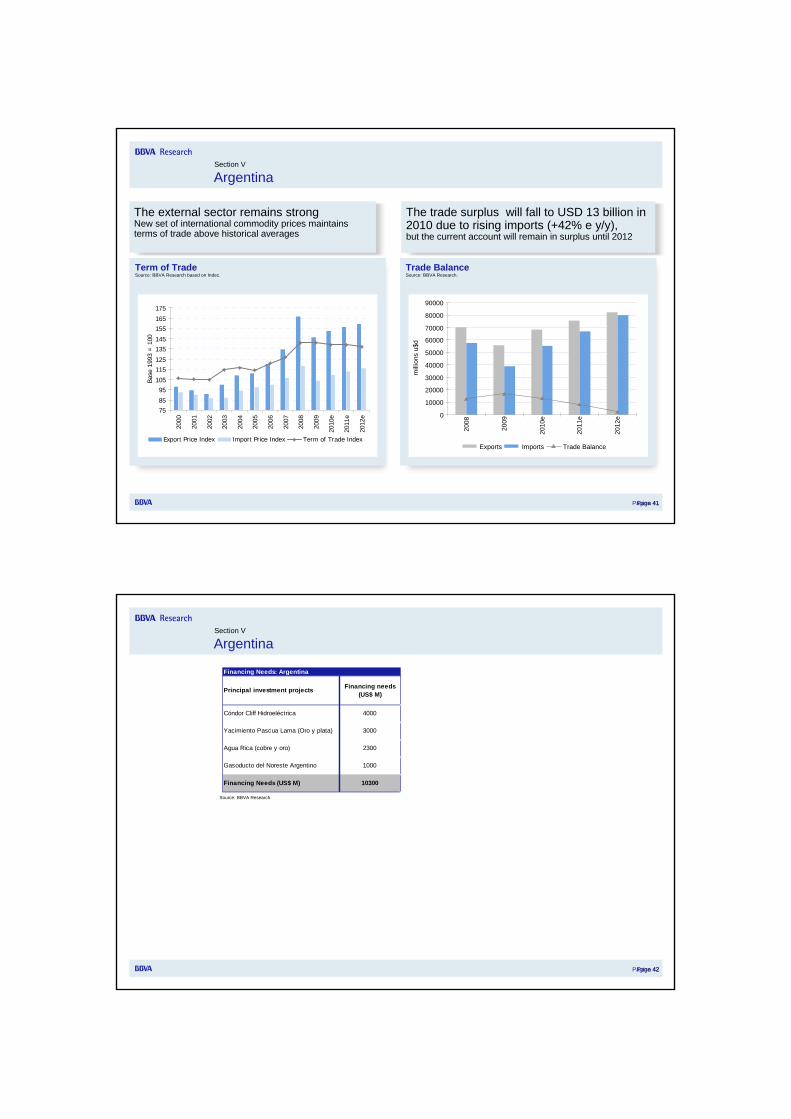
GDP – II Quarter 2010 Seasonally Adjusted Source: BBVA Research based on Indec.
Página 39
Section V
Argentina
The economy will grow vigorously in 2010 (8 %) led by domestic demandPositive growth surprises in 1H10 have led to continuous upward revisions in GDP forecasts
Some favorable shocks in 2010:
• Record soy harvest due to end of drought
• Strong demand for industrial exports stemming from above average growth in the region, particularly Brazil which is our main trading partner
• Higher than expected agricultural commodity prices.
-5.0%
0.0%
5.0%
10.0%
15.0%
20.0%
25.0%
GD
P
Impo
rts
Priv
ate
Com
sum
ptio
n
Pub
licC
omsu
mpt
ion
Inve
stm
ent
Exp
orts
Forecast Actual
Page 40
Inflation (% y/y) Source: BBVA Research
Section V
Argentina
Página 40
Inflation is the main problem, but is not expected to get out of controlInflation expectations are not anchored and even during the 2009 recession, CPI increased by 17% yoyExpansionary fiscal and monetary policies face growing supply constraints, increasing inflationary pressures.The FX rate continues to act as a nominal anchor
Inflation is end 2010 at 25%, edging up in 2011:
• Impact of wage agreements signed in 2Q10 granting increases of 30-35% y/y
• Fiscal policies: increases in pensions, childhood subsidies and Income Tax deductions
• Monetary policy: external surplus plus monetization of Central Bank 2009 quasi fiscal results
0%
5%
10%
15%
20%
25%
30%
35%
Dec
-08
Feb-
09
Apr
-09
Jun-
09
Aug
-09
Oct
-09
Dec
-09
Feb-
10
Apr
-10
Jun-
10
Aug
-10
Oct
-10
Dec
-10
BBVA ResearchINDECDi Tella University Expectation Survey
Page 41
Term of TradeSource: BBVA Research based on Indec.
Trade BalanceSource: BBVA Research.
Section V
Argentina
The external sector remains strong New set of international commodity prices maintains terms of trade above historical averages
The trade surplus will fall to USD 13 billion in 2010 due to rising imports (+42% e y/y), but the current account will remain in surplus until 2012
Página 41
7585
95105
115125
135145
155165
175
2000
2001
2002
2003
2004
2005
2006
2007
2008
2009
2010
e
2011
e
2012
e
Base
199
3 =
100
Export Price Index Import Price Index Term of Trade Index
0
10000
20000
30000
40000
50000
60000
70000
80000
90000
2008
2009
2010
e
2011
e
2012
e
mill
ions
u$d
Exports Imports Trade Balance
Page 42
Section V
Argentina
Página 42
Principal investment projects Financing needs (US$ M)
Cóndor Cliff Hidroeléctrica 4000
Yacimiento Pascua Lama (Oro y plata) 3000
Agua Rica (cobre y oro) 2300
Gasoducto del Noreste Argentino 1000
Financing Needs (US$ M) 10300
Financing Needs: Argentina
Source: BBVA Research.
Page 43
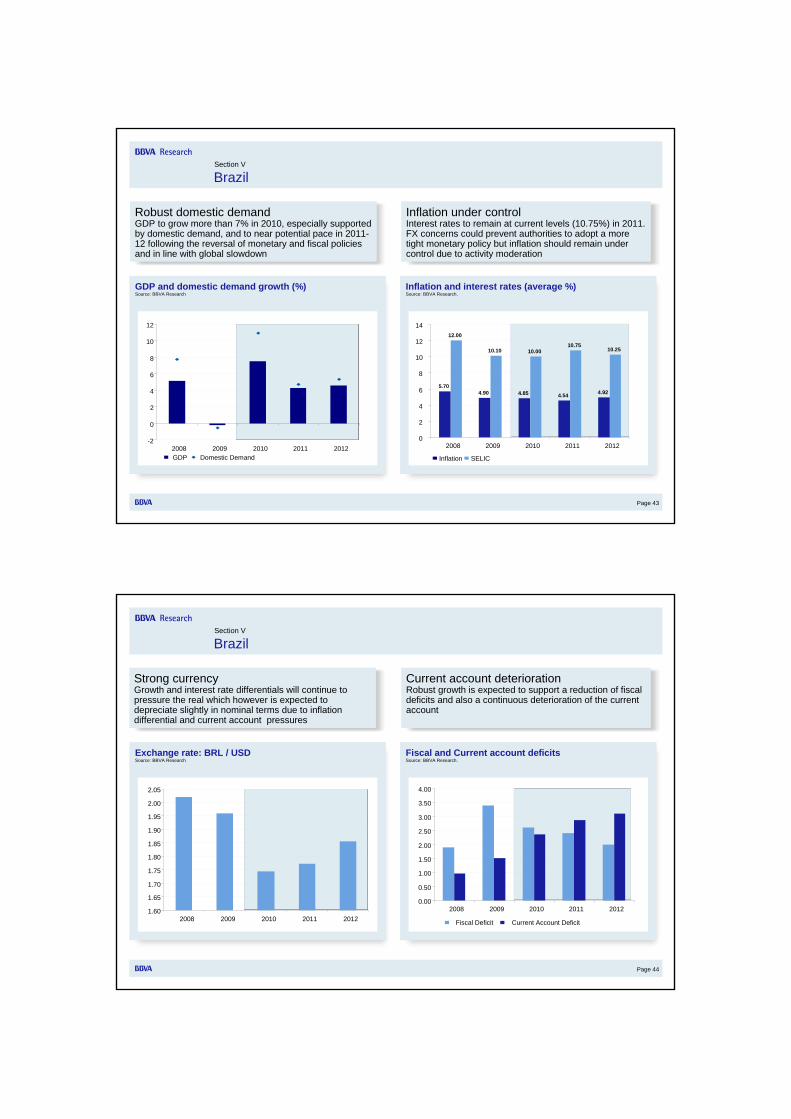
Inflation and interest rates (average %)Source: BBVA Research.
GDP and domestic demand growth (%)Source: BBVA Research
Section V
Brazil
Robust domestic demandGDP to grow more than 7% in 2010, especially supported by domestic demand, and to near potential pace in 2011-12 following the reversal of monetary and fiscal policies and in line with global slowdown
Inflation under controlInterest rates to remain at current levels (10.75%) in 2011. FX concerns could prevent authorities to adopt a more tight monetary policy but inflation should remain under control due to activity moderation
-2
0
2
4
6
8
10
12
2008 2009 2010 2011 2012GDP Domestic Demand
5.704.90 4.85 4.54 4.92
12.00
10.10 10.0010.75
10.25
0
2
4
6
8
10
12
14
2008 2009 2010 2011 2012
Inflation SELIC
Page 44
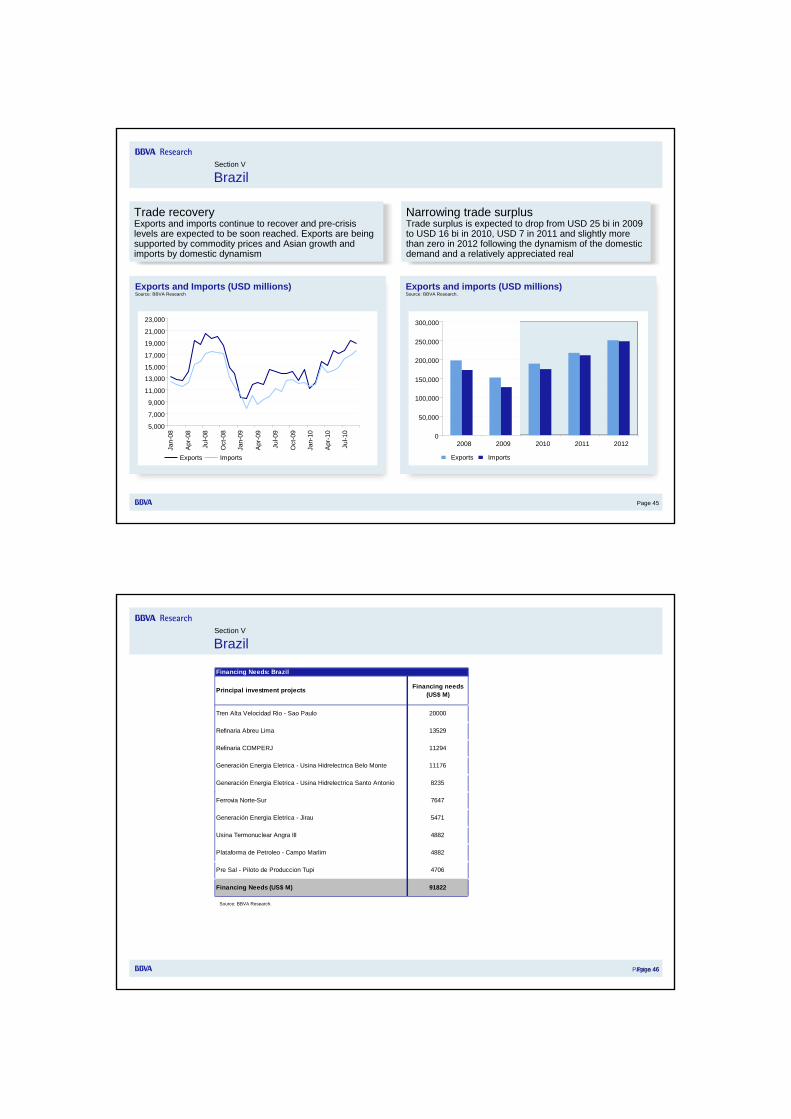
Fiscal and Current account deficitsSource: BBVA Research.
Exchange rate: BRL / USD Source: BBVA Research
Section V
Brazil
Strong currencyGrowth and interest rate differentials will continue to pressure the real which however is expected to depreciate slightly in nominal terms due to inflation differential and current account pressures
Current account deterioration Robust growth is expected to support a reduction of fiscal deficits and also a continuous deterioration of the current account
1.60
1.65
1.70
1.75
1.80
1.85
1.90
1.95
2.00
2.05
2008 2009 2010 2011 2012
0.00
0.50
1.00
1.50
2.00
2.50
3.00
3.50
4.00
2008 2009 2010 2011 2012
Fiscal Deficit Current Account Deficit
Page 45
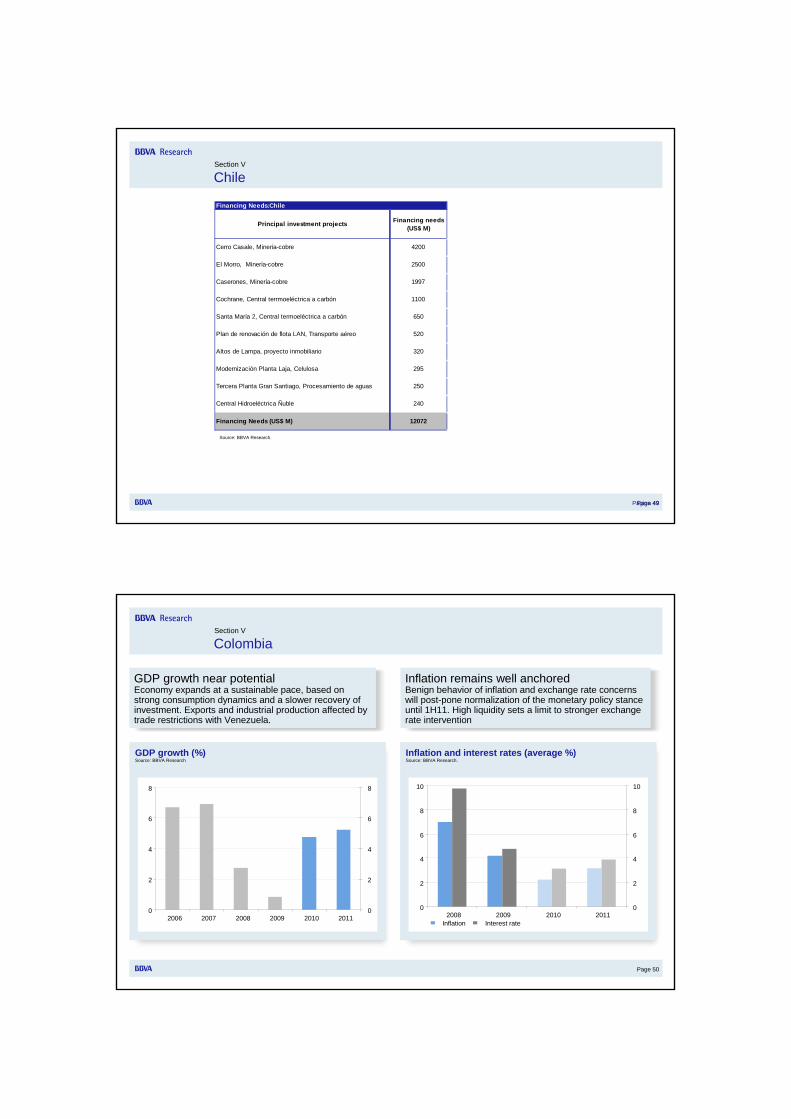
Exports and imports (USD millions)Source: BBVA Research.
Exports and Imports (USD millions)Source: BBVA Research
Section V
Brazil
Trade recoveryExports and imports continue to recover and pre-crisis levels are expected to be soon reached. Exports are being supported by commodity prices and Asian growth and imports by domestic dynamism
Narrowing trade surplusTrade surplus is expected to drop from USD 25 bi in 2009 to USD 16 bi in 2010, USD 7 in 2011 and slightly more than zero in 2012 following the dynamism of the domestic demand and a relatively appreciated real
5,000
7,000
9,000
11,000
13,000
15,000
17,000
19,000
21,000
23,000
Jan-
08
Apr-
08
Jul-0
8
Oct
-08
Jan-
09
Apr-
09
Jul-0
9
Oct
-09
Jan-
10
Apr-
10
Jul-1
0
Exports Imports
0
50,000
100,000
150,000
200,000
250,000
300,000
2008 2009 2010 2011 2012
Exports Imports
Page 46
Section V
Brazil
Página 46
Principal investment projects Financing needs (US$ M)
Tren Alta Velocidad Rio - Sao Paulo 20000
Refinaria Abreu Lima 13529
Refinaria COMPERJ 11294
Generación Energia Eletrica - Usina Hidrelectrica Belo Monte 11176
Generación Energia Eletrica - Usina Hidrelectrica Santo Antonio 8235
Ferrovia Norte-Sur 7647
Generación Energia Eletrica - Jirau 5471
Usina Termonuclear Angra III 4882
Plataforma de Petroleo - Campo Marlim 4882
Pre Sal - Piloto de Produccion Tupi 4706
Financing Needs (US$ M) 91822
Financing Needs: Brazil
Source: BBVA Research.

Page 47
GDP and domestic demand growth (%)Source: BBVA Research
Inflation and interest rates (average %)Source: BBVA Research.
Section V
Chile
Domestic demand growth moderatesGDP to grow 5,8% in 2011, especially supported by domestic demand but closing the gap between DD and GDP and converging to potential GDP growth in the mid term
Inflation back to targetInflation returns to the Central Bank's target, while the policy rate gradually increases, but exchange rate appreciation can determine stop ahead of schedule
-10.0
-5.0
0.0
5.0
10.0
15.0
2008
2009
2010
2011
2012
GDP Domestic Demand
0123456789
10
2008
2009
2010
2011
2012
Inflation TPM
Page 48
Exchange rate: CLP / USD Source: BBVA Research
Fiscal and Current account balanceSource: BBVA Research.
Section V
Chile
Exchange rate remains strongUntil 2011 exchange rate appreciated as a result of fundamentals (strong economic growth, fiscal expansion and high copper prices). Then real exchange rate remains constant
Solid fiscal and external outlook Transitory tax increases and high copper prices would keep fiscal balance under control. Moderate deterioration in the balance of payments as imports increase faster than exports
460470480490500510520530540550560570
2008
2009
2010
2011
2012
-6
-4
-2
0
2
4
6
2008
2009
2010
2011
2012
Fiscal Balance Current Account Balance
Page 49
Section V
Chile
Página 49
Principal investment projects Financing needs (US$ M)
Cerro Casale, Minería-cobre 4200
El Morro, Minería-cobre 2500
Caserones, Minería-cobre 1997
Cochrane, Central terrmoeléctrica a carbón 1100
Santa María 2, Central termoeléctrica a carbón 650
Plan de renovación de flota LAN, Transporte aéreo 520
Altos de Lampa, proyecto inmobiliario 320
Modernización Planta Laja, Celulosa 295
Tercera Planta Gran Santiago, Procesamiento de aguas 250
Central Hidroeléctrica Ñuble 240
Financing Needs (US$ M) 12072
Financing Needs:Chile
Source: BBVA Research.
Page 50
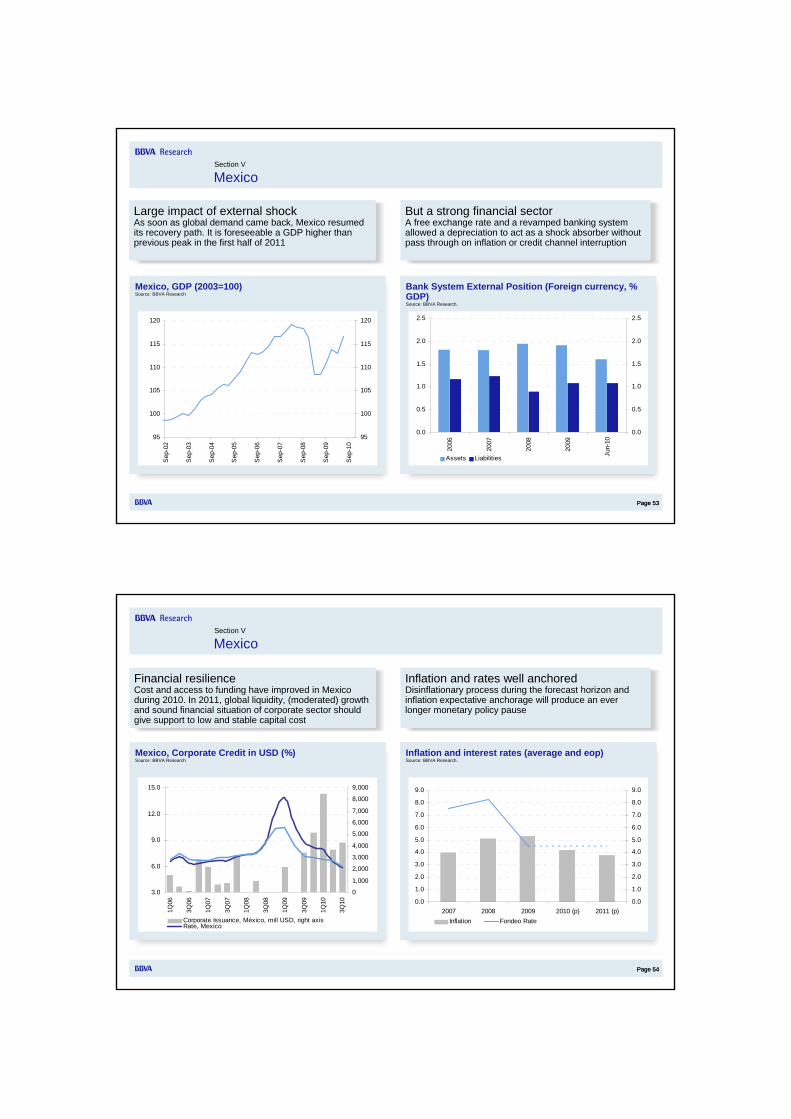
GDP growth (%)Source: BBVA Research
Inflation and interest rates (average %)Source: BBVA Research.
Section V
Colombia
GDP growth near potentialEconomy expands at a sustainable pace, based on strong consumption dynamics and a slower recovery of investment. Exports and industrial production affected by trade restrictions with Venezuela.
Inflation remains well anchoredBenign behavior of inflation and exchange rate concerns will post-pone normalization of the monetary policy stance until 1H11. High liquidity sets a limit to stronger exchange rate intervention
0
2
4
6
8
2006 2007 2008 2009 2010 20110
2
4
6
8
0
2
4
6
8
10
2008 2009 2010 20110
2
4
6
8
10
Inflation Interest rate

Page 51
Fiscal balance (% GDP)Source: BBVA Research
Current account deficits and FDI (% GDP)Source: BBVA Research.
Section V
Colombia
Fiscal deficit stabilizesFiscal deficit will improve slightly, from 4.2% of GDP to 4.0% in 2011, as increased public investment will put some pressures on expenditure. Approval of the fiscal rule essential for consolidation of fiscal sustainability
Current account deterioratesCurrent account deficit will continue to be financed mainly by foreign direct investment in the oil and mining sector
Structural reforms key to consolidate fiscal sustainability
-5
-4
-3
-2
-1
0
2006
2007
2008
2009
2010
2011 -5
-4
-3
-2
-1
0
0
1
2
3
4
5
2008 2009 2010 20110
1
2
3
4
5
FDI Current account
Page 52
Section V
Colombia
Principal investment projects Financing needs (US$ M)
Oleoducto Bicentenario 2520
Autopista de la Montaña 1800
Transversal de las americas 510
Sistema Ferreo Central y Tren del Carare 840
Hidroeléctrica Ituango 1800
Hidroeléctrica Sogamoso 840
Hidroeléctrica Porce IV 486.6
Planta de tratamiento de Aguas Residuales en Bello 348.9
Planta de tratamiento de Aguas Residuales en Canoas (Dos fases) 663
Diseño, fabricación, lanzamiento y validación de desempeño en órbita del sistema Satelital de Comunicaciones Sociales de Colombia SATCOL 164.4
Financing Needs (US$ M) 9972.9
Source: BBVA Research
Financing Needs
Page 53
Mexico, GDP (2003=100)Source: BBVA Research
Bank System External Position (Foreign currency, % GDP)Source: BBVA Research.
Section V
Mexico
Page 53
Large impact of external shock As soon as global demand came back, Mexico resumed its recovery path. It is foreseeable a GDP higher than previous peak in the first half of 2011
But a strong financial sectorA free exchange rate and a revamped banking system allowed a depreciation to act as a shock absorber without pass through on inflation or credit channel interruption
95
100
105
110
115
120
Sep
-02
Sep
-03
Sep
-04
Sep
-05
Sep
-06
Sep
-07
Sep
-08
Sep
-09
Sep
-10
95
100
105
110
115
120
0.0
0.5
1.0
1.5
2.0
2.5
2006
2007
2008
2009
Jun-
10
0.0
0.5
1.0
1.5
2.0
2.5
Assets Liabilities
Page 54
Mexico, Corporate Credit in USD (%)Source: BBVA Research
Inflation and interest rates (average and eop)Source: BBVA Research.
Section V
Mexico
Page 54
Financial resilienceCost and access to funding have improved in Mexico during 2010. In 2011, global liquidity, (moderated) growth and sound financial situation of corporate sector should give support to low and stable capital cost
Inflation and rates well anchoredDisinflationary process during the forecast horizon and inflation expectative anchorage will produce an ever longer monetary policy pause
3.0
6.0
9.0
12.0
15.0
1Q06
3Q06
1Q07
3Q07
1Q08
3Q08
1Q09
3Q09
1Q10
3Q10
0
1,000
2,000
3,000
4,000
5,000
6,000
7,000
8,000
9,000
Corporate Issuance, México, mill USD, right axisRate, Mexico
0.0
1.0
2.0
3.0
4.0
5.0
6.0
7.0
8.0
9.0
2007 2008 2009 2010 (p) 2011 (p)0.0
1.0
2.0
3.0
4.0
5.0
6.0
7.0
8.0
9.0
Inflation Fondeo Rate

Page 55
México: manufactures exports to USA(Change in sectoral shares & competitive advantages 1998-2000 vs 2007-2009)Source: BBVA Research
Mexico: Market Share (as % of total manufacture exports)Source: BBVA Research.
Section V
Mexico
Page 55
Mexican competitiveness …Mexican comparative advantage is not just a matter of price, instead there is a variety of differences in productivity among industries…
… has contributed to resilience of the Mexican market share in the US
0
5
10
15
20
25
2007 2008 2009 Jun-100
5
10
15
20
25
China Canada Mexico
-50
-40
-30
-20
-10
0
10
20
30
40
50
-3 -2 -1 0 1 2 3 4Change in Comparative Advantage Index
Cha
nge
in s
ecto
rals
hare
TransportationequipementGold
Tractors
Autoparts
Processing data machines
Telephones
Electric conductors
TV receivers
Page 56
Comparative Advantage Index:Transport EquipmentSource: BBVA Research
Comparative Advantage Index:Electricity AppliancesSource: BBVA Research
Comparative Advantage Index:TV ReceiversSource: BBVA Research
Section V
Mexico
Page 56
Mexican competitivenessVery diverse performance considering sector breakdown persist: those products in which the advantage revealed grows are those that have increased their penetration in the US market
* Basket includes the following countries: China, Taiwan, Tailandia, Corea del Sur, Malasia, Hong Kong, Singapur, Turquía, Filipinas, Indonesia, Hungría, Polonia and Portugal.
0
1
2
3
4
5
6
7
8
9
10
1989
1991
1993
1995
1997
1999
2001
2003
2005
2007
3Q08
0
1
2
3
4
5
6
7
8
9
10
Basket Brazil Mexico China
0
1
2
3
4
5
6
7
8
9
10
1989
1991
1993
1995
1997
1999
2001
2003
2005
2007
3Q08
0
1
2
3
4
5
6
7
8
9
10
Basket Brazil Mexico China
0.0
0.2
0.4
0.6
0.8
1.0
1.2
1.4
1.6
1.8
2.0
1989
1991
1993
1995
1997
1999
2001
2003
2005
2007
3Q08
0.0
0.2
0.4
0.6
0.8
1.0
1.2
1.4
1.6
1.8
2.0
Basket Brazil Mexico China
Page 57
Section V
Mexico
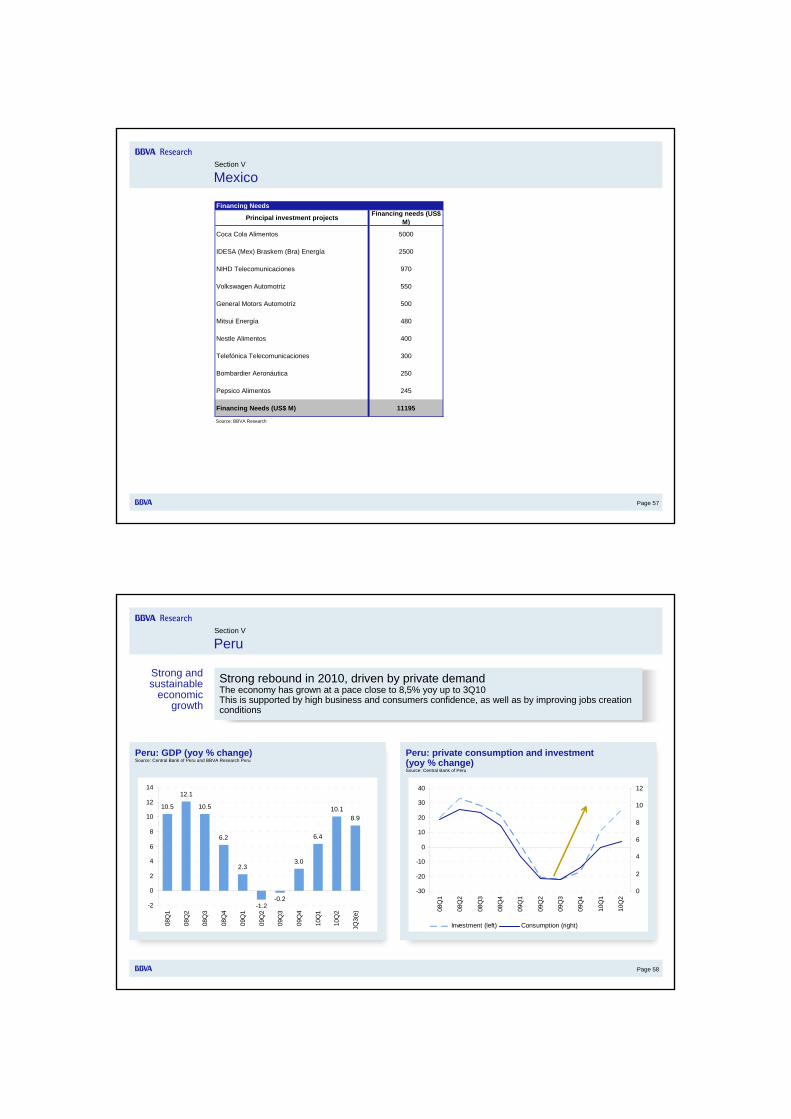
Principal investment projects Financing needs (US$ M)
Coca Cola Alimentos 5000
IDESA (Mex) Braskem (Bra) Energía 2500
NIHD Telecomunicaciones 970
Volkswagen Automotriz 550
General Motors Automotríz 500
Mitsui Energía 480
Nestle Alimentos 400
Telefónica Telecomunicaciones 300
Bombardier Aeronáutica 250
Pepsico Alimentos 245
Financing Needs (US$ M) 11195
Source: BBVA Research
Financing Needs
Page 58
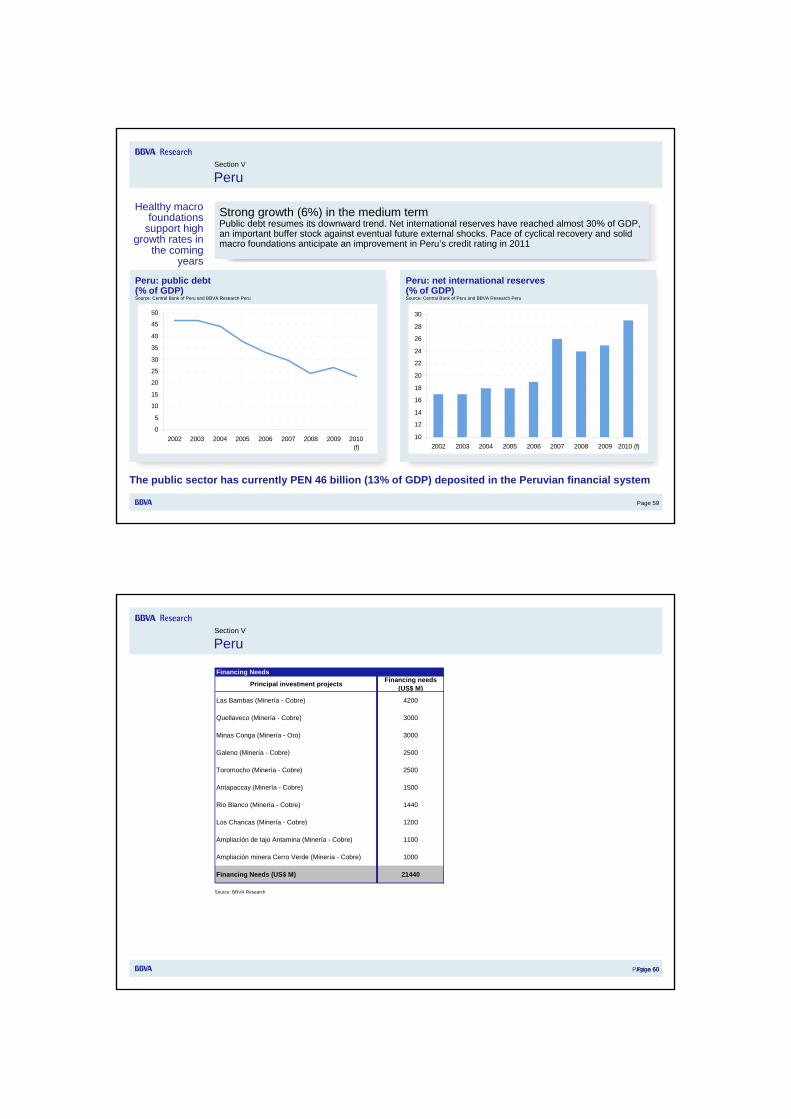
Peru: GDP (yoy % change)Source: Central Bank of Peru and BBVA Research Peru
Peru: private consumption and investment(yoy % change)Source: Central Bank of Peru
Section V
Peru
Strong rebound in 2010, driven by private demandThe economy has grown at a pace close to 8,5% yoy up to 3Q10This is supported by high business and consumers confidence, as well as by improving jobs creation conditions
Strong and sustainable
economic growth
-30
-20
-10
0
10
20
30
40
08Q
1
08Q
2
08Q
3
08Q
4
09Q
1
09Q
2
09Q
3
09Q
4
10Q
1
10Q
2
0
2
4
6
8
10
12
Investment (left) Consumption (right)
10.5
12.1
10.5
6.2
2.3
-1.2-0.2
3.0
6.4
10.18.9
-2
0
2
4
6
8
10
12
14
08Q
1
08Q
2
08Q
3
08Q
4
09Q
1
09Q
2
09Q
3
09Q
4
10Q
1
10Q
2
0Q3(
e)
Page 59
Peru: public debt(% of GDP) Source: Central Bank of Peru and BBVA Research Peru
Peru: net international reserves(% of GDP) Source: Central Bank of Peru and BBVA Research Peru
Section V
Peru
Strong growth (6%) in the medium termPublic debt resumes its downward trend. Net international reserves have reached almost 30% of GDP, an important buffer stock against eventual future external shocks. Pace of cyclical recovery and solid macro foundations anticipate an improvement in Peru’s credit rating in 2011
Healthy macro foundations
support high growth rates in
the coming years
The public sector has currently PEN 46 billion (13% of GDP) deposited in the Peruvian financial system
0
5
10
15
20
25
30
35
40
45
50
2002 2003 2004 2005 2006 2007 2008 2009 2010(f)
10
12
14
16
18
20
22
24
26
28
30
2002 2003 2004 2005 2006 2007 2008 2009 2010 (f)
Page 60
Section V
Peru
Página 60
Source: BBVA Research
Principal investment projects Financing needs (US$ M)
Las Bambas (Minería - Cobre) 4200
Quellaveco (Minería - Cobre) 3000
Minas Conga (Minería - Oro) 3000
Galeno (Minería - Cobre) 2500
Toromocho (Minería - Cobre) 2500
Antapaccay (Minería - Cobre) 1500
Rio Blanco (Minería - Cobre) 1440
Los Chancas (Minería - Cobre) 1200
Ampliación de tajo Antamina (Minería - Cobre) 1100
Ampliación minera Cerro Verde (Minería - Cobre) 1000
Financing Needs (US$ M) 21440
Financing Needs

Page 61
Section V
Venezuela
Page 61
• Although the economy contracted 1.9% y/y in Q2 10, the performance was better than expected. GDP result was helped by a much higher than anteceded public spending, driven by higher contribution of PDVSA, allowing an increase in FX supply to the economy. We revised up our GDP growth forecasts to -2.3% in 2010 from 3.8%
• Several leading indicators anticipate a recovery, as consequence of an easier exchange policy in the official markets (Cadivi, Sitme and bond issuances)
• FX constraint relaxed, a more active role of the government supplying FX to the 3 formal markets have alleviated FX shortages, allowing for an expansion of critical imports
Triggers and channels
Impacts
To watch
• Economy is bottoming out, thanks to better access to key imported inputs as well as to the gradual normalization of energy supplies
• Inflation stays put, thanks to improvements in imported goods supplies
• Concerns remain about the speed at which Public Sector outstanding debt is increasing. Exchange strategy supporting by USD bonds issuances and PDVSA cash flow needs have increased the total debt–to-GDP ratio from 18.8% in 2008 to nearly 26.3% by end-2010.
• Government capacity of holding this exchange strategy depends on PDVSA commitment in supplying dollar to the Central Bank
• Electric power supplies remain tight, due to the deterioration of existing capacity. This will remain a constraint for growth and economic recovery throughout 2011.
• We would not expect any departure from the current capital control/CADIVI framework; rather, modest efforts to rationalize the current system could be possible in the short run.
• A likely radical agenda (for example, more nationalizations) might be expected in the short term after Chavez´s popularity drop. This add elements to an extremely tough environment for local businesses.
Page 62
Section V
Venezuela
Página 62
4 3 2 1
PDVSA:– Lower preference oil exports
(2nd quarter) – Higher delivery of
petrodollars to BCV (2nd quarter)
– Growing oil taxes payments and social expenses (2nd quarter)
CADIVI – SITME:– Higher foreign currency sales
to private sector (2nd quarter)
– - More hard currency traded on SITME (mid-September)
FONDEN / Others:– Growing expenditures oriented
to solve power supply crisis– Intensive use of resources
accumulated on Chinese Fund– Long term financial agreement
with China should provide USD 20 billion
Central Government – Faster fiscal execution
(2nd quarter)
– Debt issuances and loans from multilaterals organisms (CAF)
Recovery begins
Road to the recovery
The main risk of this recovery is the government capacity to sustain an expansive public spending, given the adverse business environmentThe amount of PDVSA’s payments to BCV will be a key issue regarding international reserves available to support private importsThe higher concern about domestic issues could imply a reduction on preference oil supply to Petrocaribe and other countries in the region, given the growing oil supply to China according to long term financial agreement signed by Venezuela

Page 63
Section V
Venezuela
Source: BBVA Research
Principal investment projects Financing needs (US$ M)
Proyectos de recuperación secundaria Distrito Norte Oriente - Sector Petróleo y Gas 9737
Proyecto Gas Delta Caribe Oriental - Sector Petróleo y Gas 8811
Central Hidroelectrica Tocoma - Sector Eléctrico 3060
Complejo Criogénico de Occidente - Sector Petróleo y Gas 2659
Construcción Complejo Generador Termocentro - Sector Eléctrico 2187
Modernización Central Hidroeléctrica de Guri - Sector Eléctrico 2106
Construcción Planta Termoeléctrica A. J. Sucre - Sector Eléctrico 1472
Tercer puente sobre el Rio Orinoco - Sector Vialidad 1000
Modernización Planta Centro - Sector Eléctrico 978
Interconexión de transmisión de gas Centro Oriente-Occidente - Sector Petróleo y Gas 884
Financing Needs (US$ M) 32894
Financing Needs
Latin America shines: Is it for real this time?Latibex
November, 2010
José Luis Escrivá│Chief Economist BBVA Research │[email protected]