LATIN AMERICA and the Caribbean - UNESCO...
72
UNESCO Institute for Statistics LATIN AMERICA and the Caribbean regional report
Transcript of LATIN AMERICA and the Caribbean - UNESCO...
UNESCO Institute for Statistics
L A T I N A M E R I C Aand the Caribbean
regional report
Design : Maro Haas, Les Lilas
Graphs : Visit-Graph, Boulogne-Billancourt
Printing : Société Edition Provence, Nîmes
Photo credits : UNESCO/Yvonne TABBUSH
© UIS 2001
The designation employed and the presentation of material in thispublication do not imply the expression of any opinion whatsoeveron the part of the UNESCO Secretariat concerning the legal status ofany country, territory, city, or area, or of its authorities, or thedelimitations of its frontiers or boundaries.
FOREW
ORD
One of the key ways of meeting the challenges of the 21st century is toguarantee the benefits of education for all by ensuring that educationalsystems work in an equitable, efficient and effective manner. Educational
statistics and indicators, which monitor trends and facilitate the criticalassessment of policies, play a vital part in this process and they can providevaluable information for the formulation of sound policies. In this respect,governments are paying even greater attention to comparative policy analysis.Co-operation at the international level can help countries to identify ways inwhich access to education might be widened, the quality of educationalprovision might be improved and more attention paid to improving learningoutcomes. A comparative framework can also assist countries to manage theirteaching and learning processes more effectively. In a number of countries theseimperatives have resulted in renewed efforts to strengthen the collection andreporting of comparative education statistics and indicators.
A significant role of the UNESCO Institute for Statistics (UIS) is to assist MemberStates to collect, analyse and disseminate internationally-comparable educationindicators to inform these policy debates. Following its creation in 1999, the UIShas carried out far-reaching consultations with both national and internationalusers and producers of education statistics in order to identify information needsand to develop a strategy to meet these needs.
One part of this strategy has been the implementation of a re-designed datacollection instrument, called Survey 2000, which aims to build a set ofcomparable cross-national education indicators. A series of twelve regionalworkshops were organised and led by UIS to consult educational experts (bothstatisticians and policy makers) within Member States and to build bettersupport for this global effort. These workshops also aimed to raise awareness ofdata collection methodologies and tools, such as the International StandardClassification of Education (ISCED), to provide a common framework forharmonising national education data. The workshops provided regional fora forthe discussion of problems associated with data collection and management andthe exploration of possible solutions.
This report represents one of the first outcomes of this major effort. Not only arethe indicators cited in this report based on data provided by countries, but thetopics chosen also reflect some of the priority policy issues raised by nationalparticipants. The UNESCO Institute for Statistics would like to take thisopportunity to thank these participants and their colleagues for their conduct ofthis survey and also staff of the United Nations Statistics and PopulationDivisions, the Organisation for Economic Co-operation and Development and theWorld Bank for providing key supplementary data.
Denise Lievesley Director, UNESCO Institute for Statistics
Latin America and the Caribbean regional report [ Foreword
CON
TENTS
Introduction
Reader's Guide
1 Regional background
Economic, Social and Demographic Overview
Country Profiles• Interpreting the Country Profiles
• Country Profiles
6
8
11
11
151517
2 Access and participation bylevel of education
2.1- Pre-primary education (ISCED 0)and other early childhood
development programmes (Other ECD)• Pre-primary education (ISCED 0)
• Other early childhood developmentprogrammes (Other ECD)
2.2- Primary education (ISCED 1)
2.3- Secondary education (ISCED 2 and 3)and post-secondary non-tertiary
education (ISCED 4)• Secondary education (ISCED 2 and 3)
• Post-secondary non-tertiaryeducation (ISCED 4)
2.4- Tertiary education (ISCED 5 and 6)
3 Teaching staff
4 Education finance andexpenditure
Annex
Annex 1• Tables A1, A2, A3, A4
Annex 2• Definitions of indicators
Annex 3• Glossary
Annex 4• ISCED97
Acknowledgements
36
36
3638
39
44
4447
48
51
53
55
56
65
67
70
72
Latin America and the Caribbean regional report [ Contents
Introduction
The UNESCO Institute for Statistics initiatedSurvey 2000 as the first step in a long-termprocess in order to improve data quality and
standardise data collection in the field ofeducation. As part of the Survey 2000 exercise,two groups were formed in the Latin America andCaribbean region. One group was composed ofPortuguese and Spanish-speaking countries andthe other of English, Dutch and French-speakingcountries. Consequently, the Caribbean countriesCuba and the Dominican Republic joined the LatinAmerica group while Belize, Guyana, andSuriname from South and Central America joinedthe Caribbean group. Neither Martinique norGuadeloupe, which are linked constitutionallywith France nor Puerto Rico, which is linked withthe United States, were included.
For the purpose of this report the group ofcountries referred to as Latin America iscomposed of 19 republics: Argentina, Bolivia,Brazil, Chile, Colombia, Costa Rica, Cuba, theDominican Republic, Ecuador, El Salvador,Guatemala, Honduras, Mexico, Nicaragua,Panama, Paraguay, Peru, Uruguay and Venezuela.
Experts in education statistics from thesecountries participated in two regional workshopsheld in Cuba, in July 2000 and in Panama, inMarch 2001. These workshops provided anopportunity to improve the internationalclassification of the various national educationalprogrammes and to review the new statisticalquestionnaires in order to ensure their correctinterpretation. The workshops made it possible todiscuss the need for policy relevant informationthat may require the collection of other data orthe calculation of new indicators. Nationalrepresentatives also presented reports on theeducation issues which were considered to be ofthe highest priority in their country.
In conducting the Latin American regionalworkshops and in subsequent statistical capacity
6
50
40
30
20
10
0
INTR
ODU
CTIO
NLa
tin A
mer
ica
and
the
Carib
bean
regi
onal
repo
rtU
IS
Educationstatistics 2001
building efforts in the region the UIS has cooperated with the Summit of theAmericas Indicators (PRIE) Project. Close collaboration between the twoorganisations has added significantly to the planning and implementation ofthe UIS programme in the region.
Many of the issues identified during workshop presentations and discussionsare addressed in this first UIS report for Latin America. It presents informationfrom the first educational survey conducted by the UIS in the summer of 2000using data from countries participating in the Latin American workshop aswell as comparable data from other countries.
This report has four sections as follows:
Section 1 presents the main demographic, economic and socialaspects of the region, including information on selected socio-economic indicators. Country profiles present key data andindicators for each country.
Section 2 examines access and participation of pupils andstudents in each education level from early childhood educationto tertiary level programmes. Some other themes regardingeducation policy which were proposed by participants during theregional workshops are also examined.
Sections 3 and 4 briefly survey a set of indicators related toteaching staff and education finance, respectively.
An Annex, includes summary statistical tables that contain data and indicatorsused in the publication as well as definitions of indicators, a glossary of termsand a more detailed description of the International Standard Classification ofEducation (ISCED97).
Although this first report is limited in scope and content, it is published withthe knowledge that the countries participating in the UIS Latin AmericaRegional project along with the UIS and PRIE will continue to progress withthe development of indicators and associated analyses. It is hoped that theseefforts will help governments in the region implement improvements in theirnational systems and continue to develop education programmes that willhelp students of all ages achieve their full potential.
7
Latin America and the Caribbean regional report [ Introduction
INTRO
DUCTION
8
50
40
30
20
10
0
Read
er's
Gui
deLa
tin A
mer
ica
and
the
Carib
bean
regi
onal
repo
rtU
IS
Educationstatistics 2001
Reader's Guide
The data on pupils, students, teachers andeducation expenditure presented in thispublication are gathered mainly from official
national responses to questionnaires oneducation statistics from the UNESCO Institutefor Statistics (UIS) for the school and financialyears beginning in 1998, unless otherwisespecified. They are supplemented by demographicand economic statistics collected by otherinternational organisations including, inparticular, the United Nations Statistics andPopulation Divisions and the World Bank.
For some countries, education data were collectedvia surveys carried out in collaboration with otherinternational organisations. Data for Mexico werereported in the joint UIS/OECD/EUROSTAT (UOE)survey questionnaires completed by MemberStates of the Organisation for Economic Co-operation and Development (OECD). Data forArgentina, Brazil, Chile, Paraguay, Peru andUruguay were collected via the World Bankfunded World Education Indicators (WEI) projectadministered jointly by UIS and OECD. Theremaining countries in this region reported datain the UIS's own annual surveys on education, themost recent being Survey 2000.
While the three surveys (UOE, WEI and Survey2000) aim to collect broadly speaking the samecore set of statistics on education, there are somedifferences in coverage between the threesurveys. For example, neither the UOE nor WEIquestionnaires collect data on new entrants toprimary education with experience in earlychildhood development programmes, on pupils insecondary vocational education by field of study,or on teachers who are trained (certified) to teachin accordance with national standards. Inaddition, data on students enrolled in tertiaryeducation by field of study are not requested inthe WEI questionnaires. By contrast, the UOE andWEI surveys collect more details than Survey2000 on the working conditions of teachers.
9
Latin America and the Caribbean regional report [ Reader's Guide
All three surveys (UOE, WEI and Survey 2000) use concepts and definitions from the 1997 version ofthe International Standard Classification of Education (ISCED97).
ISCED97 is a framework for the compilation and presentation of internationally comparablestatistics and indicators on education. It is a multi-purpose system, designed for education policyanalysis and decision-making, whatever the structure of the national education system andwhatever the stage of economic development of a country. It can be utilised for statistics on manydifferent aspects of education such as pupil enrolment, human and financial resources invested ineducation or the educational attainment of the population. The basic concepts and definitions ofISCED97 have been designed to be universally valid and invariant to the particular circumstances ofa national education system.
The statistics in this report refer to both public and private education according to the levels ofeducation defined in ISCED97.
In principle, special needs education offered either in regular schools or in special schools is alsoincluded at the relevant ISCED97 levels. The data on teachers refer to both full-time and part-timeteaching staff with active teaching duties. School-based personnel who have no active teachingduties such as librarians, careers advisers or student counsellors, administrative staff, non-teachinghead teachers or principals, etc., are generally excluded.
For the purpose of assessing trends in the 1990s, and in so far as the data are comparable, thispublication also presents some indicators for 1990. For these data and in general for time series,please refer to the 1999 UNESCO Statistical Yearbook. Please note that the current report maycontain revised data that differ from those presented in previous publications including the 1999UNESCO Statistical Yearbook.
In tables and charts throughout the publication (unless they are ranked according to one of thestatistics or indicators presented) countries are listed in alphabetical order of their Spanish names.Thus, for example, Chile appears after Cuba rather than before as in English.
Where numbers and percentages have been rounded, totals and subtotals may not alwayscorrespond exactly to the sum of the elements of which they are composed.
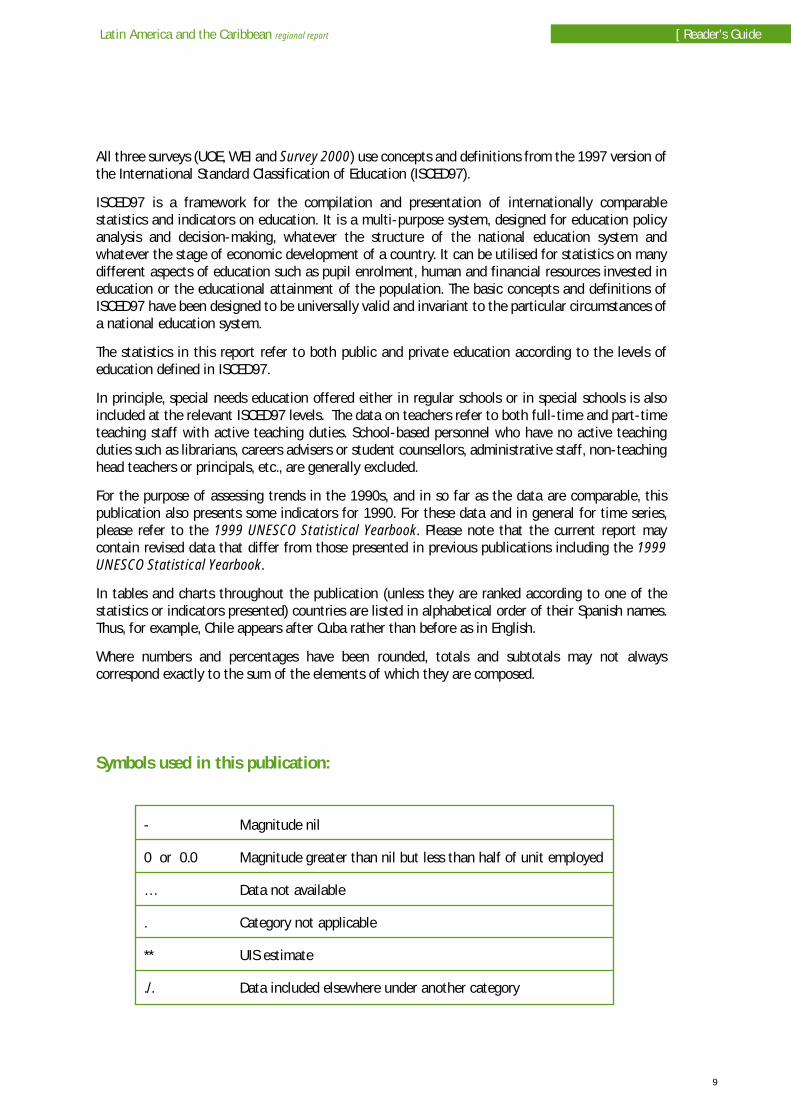
Symbols used in this publication:
- Magnitude nil
0 or 0.0 Magnitude greater than nil but less than half of unit employed
… Data not available
. Category not applicable
** UIS estimate
./. Data included elsewhere under another category
The term Latin America is generally takento refer to that group of countries withincontinental America and the Caribbean
whose inhabitants speak either Spanish orPortuguese; a convention which is followedhere. This review covers, then, the following19 republics: Argentina, Bolivia, Brazil, Chile,Colombia, Costa Rica, Cuba, the DominicanRepublic, Ecuador, El Salvador, Guatemala,Honduras, Mexico, Nicaragua, Panama,Paraguay, Peru, Uruguay and Venezuela. In allbut one of these countries, Brazil, the officialor principal language is Spanish; indigenouslanguages nevertheless remain important,particularly in rural areas. Some of the well-established indigenous populations wereexcluded from many of the education systemsuntil the middle of the 20th century. As theCochabamba Declaration1 makes clear, theministries of education in Latin Americaconsider it a priority that education beprovided in both official and indigenouslanguages.
The countries of this region have very variedpopulation sizes and age structures and differconsiderably not only in average incomelevels but also in the way that this income isshared within their societies (see Table A). Inthis introduction, we present a brief review ofthe region's recent economic development,outline the extent of human development andinequality, point to the opportunities andchallenges presented by the demographicsituation and highlight some of the keyeducation reform issues that these countriesare currently facing.
Economic, social andDemographic
Overview
10
50
40
30
20
10
0
Sect
ion
1- R
egio
nal b
ackg
roun
d La
tin A
mer
ica
and
the
Carib
bean
regi
onal
repo
rtU
IS
Educationstatistics 2001
1 Declaration of the VII Meeting of the Regional IntergovernmentalCommittee of the Major Project of Education (PROMEDLAC VII),Cochabamba, Bolivia, March 2001.
SECTION
1
Economic overview
Whereas during the 1960s and 1970s percapita Gross Domestic Product (GDP) in LatinAmerica expanded at annual average rates of2.5% and 3.5% respectively, the 1980s and1990s were decades of generalised economiccrisis with real income per head actuallyfalling in the 1980s (commonly referred to inthe region as "the lost decade") and onlyrising at an annual average rate of slightlyover 1% during the period 1990-1999.
The origin of these two decades of nearstagnant per capita growth is traceable to theeconomic buoyancy of the 1960s and 1970swhich led these economies to take onunsustainably high levels of foreign currencydenominated debt. Having been generallyfavourable in the 1970s, the prices of thecommodities on which these economies arelargely dependent (most notably agricultural
11
Latin America and the Caribbean regional report [ Section 1 - Regional background
and mineral resources) fell sharply as a resultof the world-wide recession in the followingdecade; this alongside rising real interestrates in the United States and western Europeas their governments sought to reduceinflation had the effect of increasing theservice payments on their debts whilst at thesame time reducing the income from which topay them. Only Colombia succeeded inavoiding defaulting or having its foreigndebts compulsorily rescheduled; all facedsevere fiscal problems. The immediate generalresponse to this latter problem was to resortto printing money thereby engenderinginflation, indeed in some cases, most notablyin Argentina and Brazil, hyperinflation. Realwages fell everywhere except in Colombiaand Chile.
In order to overcome inflation and to promotea return to a sustainable pattern of growth,all of these economies, including Cuba, have
Argentina
Bolivia
Brazil
Colombia
Costa Rica
Cuba
Chile
Ecuador
El Salvador
Guatemala
Honduras
Mexico
Nicaragua
Panama
Paraguay
Peru
Dominican Republic
Uruguay
Venezuela
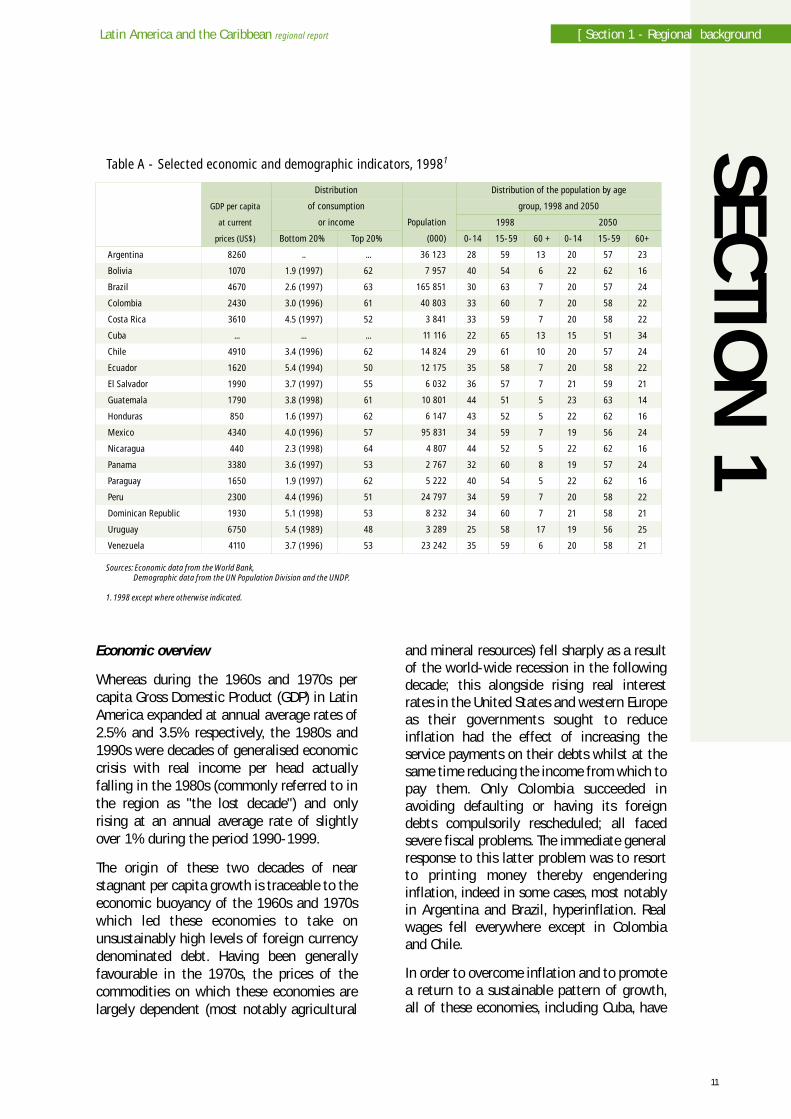
Table A - Selected economic and demographic indicators, 19981
8260
1070
4670
2430
3610
...
4910
1620
1990
1790
850
4340
440
3380
1650
2300
1930
6750
4110
Bottom 20%
..
1.9 (1997)
2.6 (1997)
3.0 (1996)
4.5 (1997)
...
3.4 (1996)
5.4 (1994)
3.7 (1997)
3.8 (1998)
1.6 (1997)
4.0 (1996)
2.3 (1998)
3.6 (1997)
1.9 (1997)
4.4 (1996)
5.1 (1998)
5.4 (1989)
3.7 (1996)
Top 20%
...
62
63
61
52
...
62
50
55
61
62
57
64
53
62
51
53
48
53
Population
(000)
36 123
7 957
165 851
40 803
3 841
11 116
14 824
12 175
6 032
10 801
6 147
95 831
4 807
2 767
5 222
24 797
8 232
3 289
23 242
0-14
28
40
30
33
33
22
29
35
36
44
43
34
44
32
40
34
34
25
35
1998
15-59
59
54
63
60
59
65
61
58
57
51
52
59
52
60
54
59
60
58
59
60 +
13
6
7
7
7
13
10
7
7
5
5
7
5
8
5
7
7
17
6
0-14
20
22
20
20
20
15
20
20
21
23
22
19
22
19
22
20
21
19
20
2050
15-59
57
62
57
58
58
51
57
58
59
63
62
56
62
57
62
58
58
56
58
60+
23
16
24
22
22
34
24
22
21
14
16
24
16
24
16
22
21
25
21
Sources: Economic data from the World Bank, Demographic data from the UN Population Division and the UNDP.
1. 1998 except where otherwise indicated.
GDP per capita
at current
prices (US$)
Distribution
of consumption
or income
Distribution of the population by age
group, 1998 and 2050

HDI ranking was higher indicating that theyhave been able to advance their humandevelopment goals beyond the levels achievedby their economic peers (for two, Ecuador andNicaragua, they were the same). In thisregard, Cuba was particularly successful, itsHDI ranking being 47 places higher; mentionshould also be made of the fact that thoughthe UN classifies none of the countries of theregion as high-income societies. Argentina,Chile, Colombia, Costa Rica, Mexico, Panama,Uruguay and Venezuela were all classified as"high human development nations".
These performances would have been muchbetter had the advances in health, whichcontinued through and despite the turbulent1980s and 1990s, been matched byimprovements in education. Even wheregovernments have maintained theircommitment to education and training andendeavoured to limit the extent of financialcutbacks, austerity measures have oftencompromised access or quality or equity,indeed, sometimes all three. At fewer thannine years the average amount of time spentin school by current cohorts of LatinAmerica's young is only a year and a halfmore than two decades ago. This averagelevel masks the considerable disparities thatobtain depending on the parents' income andwhether they live in a rural or urban area andis considerably below the twelve years judgedby the Economic Commission for LatinAmerica and the Caribbean as being theminimum amount of education necessary toearn a wage that will make it possible to riseabove poverty in the course of a person'sactive life. Given that on the basis of theUNDP's composite measure of human poverty,the Human Poverty Index (HPI), whichmeasures average deprivations in the basicdimensions of human development, poverty isestimated to affect more than 5% of thepopulation of all of the countries of thisregion with the exceptions of Argentina,Chile, Costa Rica, Cuba and Uruguay and over20% of the population in Bolivia, El Salvador,Guatemala, Honduras and Nicaragua this lackof progress is a source of some concern.
12
50
40
30
20
10
0
Sect
ion
1- R
egio
nal b
ackg
roun
d La
tin A
mer
ica
and
the
Carib
bean
regi
onal
repo
rtU
IS
Educationstatistics 2001
to varying degrees liberalised theireconomies. The essence of these reforms, theimplementation of which has in some casesbeen a source of considerable domesticcontroversy, consists in tighter fiscal andmonetary control, greater openness to foreigninvestment, the introduction of flexibility intolabour market regulations and theimplementation of large-scale privatisationprogrammes. The greater insertion of theseeconomies into the global marketplace hasresulted in significant changes in productionsystems and labour organisation. This,alongside the large-scale redundancies madein the public sector as part of theirrestructuring, has led to a considerable fall inlabour demand in the formal sector,particularly among the unskilled, therebyfurther accentuating the importance of theinformal sector.
Faced with difficulties in implementinginstitutional reforms and for the problemsthat they bring about, and a continuedvulnerability to external events, as evidencedby the economic shock that Mexico's 1994-95 devaluation caused to the rest of theregion and the recession that the Asianfinancial crisis prompted in 1998-99, theregion's overall economic performance, andwith it employment growth, has remainedweak.
Human development
Though their overall economic performancehas recently been weak, all of these countries,with the notable exception of Guatemala,have been successful in converting incomeinto human development. This can be seen bycomparing their rankings on the basis of theUnited Nations Development Programme's(UNDP) Human Development Index (HDI),which attempts to measure averageachievements in basic human development-including life expectancy, educationalattainment, and income - in one singlecomposite index, with their rankings by percapita GDP; for 10 of them their most recent
Inequalities in incomes and access toeducation
With the obvious exception of Cuba, a highlyunequal distribution of incomes is pervasiveto the whole region. Indeed, the region'seconomies count among their number somewith the most extreme distribution of incomein the world: Brazil, Colombia, Guatemala andParaguay being the most prominent. Theseinequalities in income are mirrored byinequalities in access to schooling,attendance and, when there, being in asufficiently receptive state to benefit fromthe teaching being offered. While primaryschool enrolment rates are high in mostcountries, attendance in early childhooddevelopment programmes, tertiary educationand, to a lesser degree, secondary education isstill dominated by those from the higher-income groups.
As the completion rates for primary schooleducation bear witness, the rural poor andindigenous populations are at an extremedisadvantage relative to other groups. This islinked to geographical isolation, their higherpropensity to engage their children in thefamily's income generating activities and thelack of schools offering bilingual education.On average, two out of every five children inrural areas (as compared to one in six in urbanareas) fail to finish primary school or are atleast two years behind when they finally doso. Moreover, though in the 1990s there wassignificant progress in raising the percentageof children who complete six years ofschooling, only in Chile, Honduras and Mexicodid the urban-rural disparity decrease.
Given that education is a key determinant ofa person's quality of life as well asproductivity and employability, the presentsituation whereby children's life chances areso heavily dependent on their parents' socio-economic status is one conducive tohereditary poverty. Indeed, rising relativewages for the most educated and most skilledare tending to exacerbate the alreadyextremely unequal distribution of income insome countries.
13
Latin America and the Caribbean regional report [ Section 1 - Regional background
Demographics
Though patterns vary from country to country,with corresponding variations in theimplications for their education systems, thepopulation of the region as a whole isgrowing at an average rate of approximately1.5% per annum. This will result in a stable-sized school-age population by 2010 and adecreasing percentage of young people in thepopulation over the first half of the 21stcentury. In the most prosperous countries ofthe region (Argentina, Chile, and Uruguay),the increase in the population aged 60 yearsand over is taking place at a rate similar tothat of OECD countries. Because at this stageof the transition process the rates ofdependency of children fall rapidly while theproportion of elderly remains low there is aunique opportunity to focus on the quality ofinstruction without necessarily having toincrease the education budget.
As well as presenting an opportunity toincrease incomes, boost savings andinvestment, and offer a better education towhat will be a smaller number of children inthe new generation, this period ofdecelerating population growth is alsohowever a time of great challenge as thisshrinking share of young workers is expectedto provide adequate care for the largerprevious generation. This calls for theextension of educational opportunities intheir fullest sense beyond basic schooling andthe rapid creation of employmentopportunities commensurate with theabilities of these new entrants to the labourmarket.
Education reform
Countries in the region are committed to themodernisation and reform of their educationsystems. Although much progress was madeduring the 1990s in devising effectiveeducation policy responses to the challengesof economic change, social equity, culturaldiversity and political democratisation, there
14
50
40
30
20
10
0
Sect
ion
1- R
egio
nal b
ackg
roun
d La
tin A
mer
ica
and
the
Carib
bean
regi
onal
repo
rtU
IS
Educationstatistics 2001
remains a lengthy agenda of educationalreform and improvement to tackle in theyears ahead. Levels of educationaldevelopment vary considerably across theregion. Some countries have yet to achieveuniversal primary school enrolment and asatisfactory level of retention, and in allcountries there is considerable room forprogress in improving access at the secondaryand higher levels.
The Cochabamba Declaration, adopted by theRegion's Ministers of Education at theSeventh Meeting of the RegionalIntergovernmental Committee of the MajorProject for Latin America and the Caribbean(PROMEDLAC VII), held in Cochabamba,Bolivia, in March 2001, stresses the needgenerally to improve the quality andefficiency of the region's education systems.Specific priorities emphasised by theDeclaration include:
improvement in the quality of teachingpractices, and the creation of adequatelearning environments for students;
strengthening the initial (pre-service) andin-service training of teachers, andimprovement in teachers' working conditionsincluding the provision of adequateremuneration (salaries) and enhancedopportunities for professional careerdevelopment;
adoption of social and economic measuresdesigned to overcome the exclusion ofpoor people from full participation ineducation;
recognition and respect for culturaldiversity, while at the same time ensuringthat individual, social or ethnic differencesare not transformed into inequality ofopportunity or other forms of discrimination.
Education being a fundamental humanright, governments have the responsibilityto strengthen public education systems;this in turn is a guarantor of effectivesocial democratisation;
increased managerial and pedagogicalautonomy for schools, including theprovision of adequate financial, humanand material resources especially for schoolslocated in areas of greatest poverty;
creation of flexible mechanisms designedto increase the participation of civilsociety in educational activities includingthe design, execution and assessment ofresearch on the impact of education policies;
increased priority for secondary educationin countries that have achieved full accessto primary education, while at the sametime ensuring effective transitions fromschool to work (employment) andencouraging new and flexible forms oflearning for adolescents and young peopleliving in poverty, especially those whohave abandoned formal schooling withouthaving had access to a quality education;
strengthening values of education in theface of the growing problems of juvenileviolence inside and outside of school, drugdependence, adolescent pregnancy orfatherhood, as well as the low level ofcitizenship participation of young people;
increased priority for early childhood careand education;
inc reased use o f in fo rmat ion andcommunication technologies in education,including exploitation of their potentialfor distance education and new learningnetworks.
Data sources
Area: Database from United Nations Internet site.
Demographic data: United Nations Population Division, 1998 revision.
GNP and GDP: World Bank, revision 2001.
Literacy: UNESCO Institute for Statistics, estimates and projections based on data compiled fromnational population censuses and revised in 2000.
Other education data: UNESCO Institute for Statistics and the Organisation for Economic Co-operation and Development, annual education surveys.
Explanatory notes
All statistics refer to the reference year unless stated otherwise.
General information
The area refers to the surface of each country, i.e., the total number of square kilometres, expressedin thousands.
The total population and the average annual growth rate refer to the total population in eachcountry for the year of reference, expressed in thousands, and to the average annual growth of thepopulation for 1995-2000, expressed as a percentage.
The infant mortality rate refers to the average annual number of deaths of infants under 1 year ofage per 1,000 live births in the period 1995 to 2000.
The estimated literacy rate refers to the number of literate adults expressed as a percentage of thetotal adult population aged 15 years and above. A person is considered literate if he/she can readand write with understanding a simple statement related to his/her daily life.
The national currency is the currency in circulation in each country in the reference year.
The GNP per capita is the Gross National Product expressed in current United States dollars dividedby the total population.
Public expenditure on education as a percentage of GDP is the total public expenditure on educationat every level of administration according to the constitution of the country, i.e. central, regionaland local authorities, expressed as a percentage of the Gross Domestic Product.
Interpreting theCountry Profiles
15
Latin America and the Caribbean regional report [ Section 1 - Regional background
Public expenditure on education as a percentage of total government expenditure is the total publicexpenditure on education at every level of administration according to the constitution of thecountry, i.e. central, regional and local authorities, expressed as a percentage of total governmentexpenditure on all sectors (including health, education, social services etc).
Graphs and tables
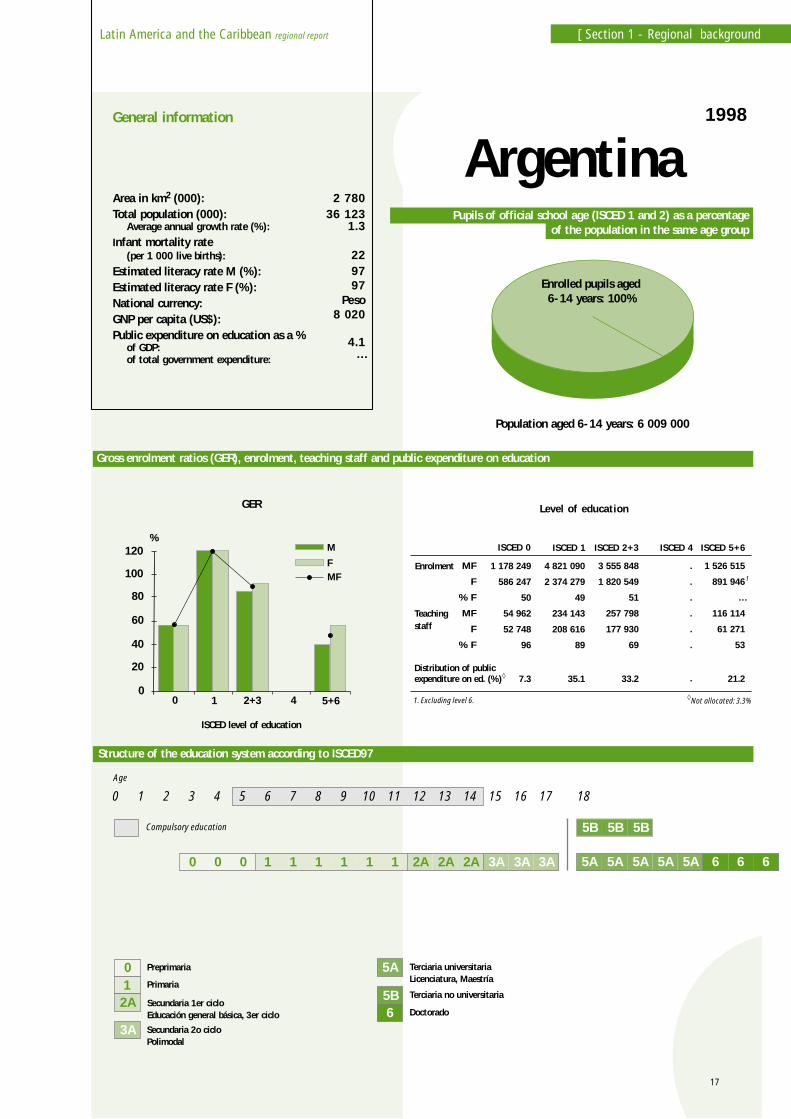
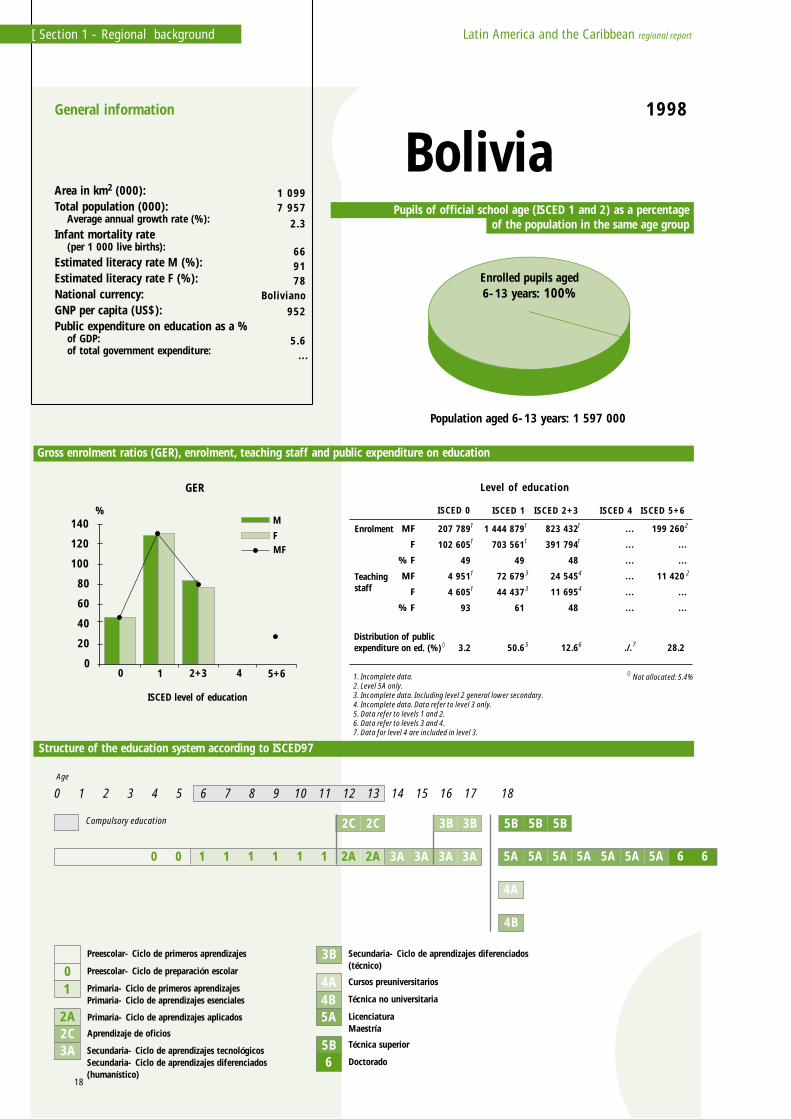
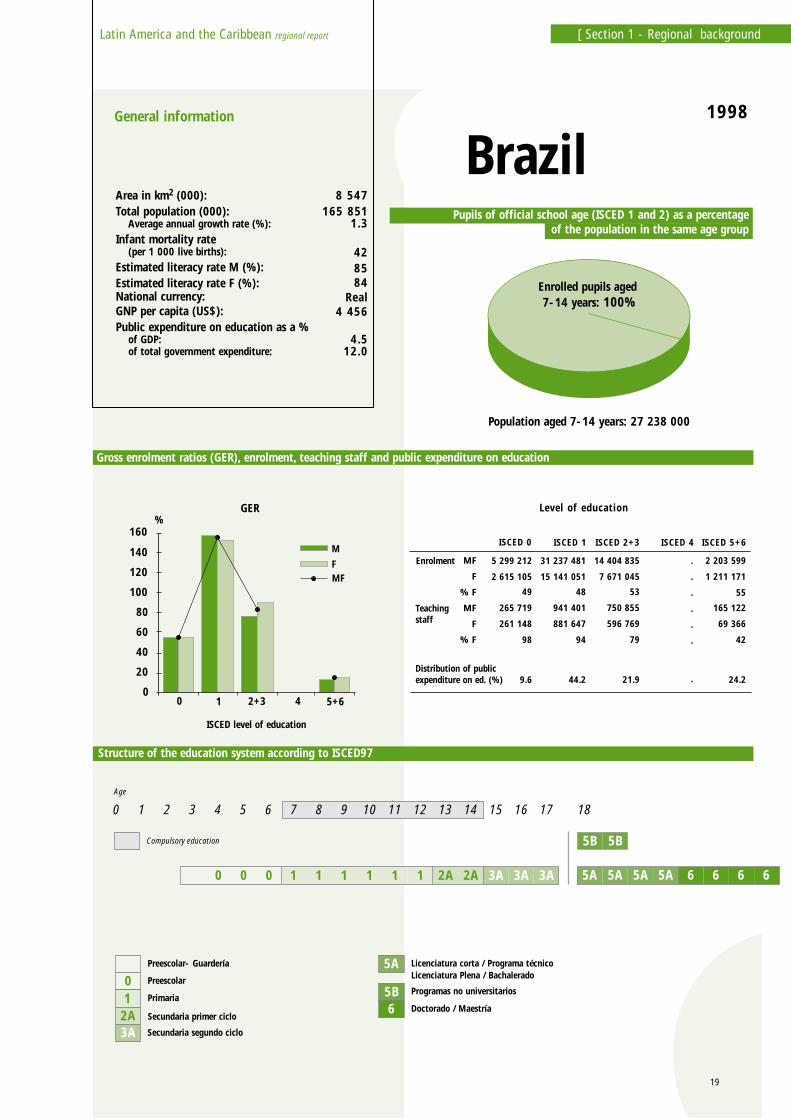
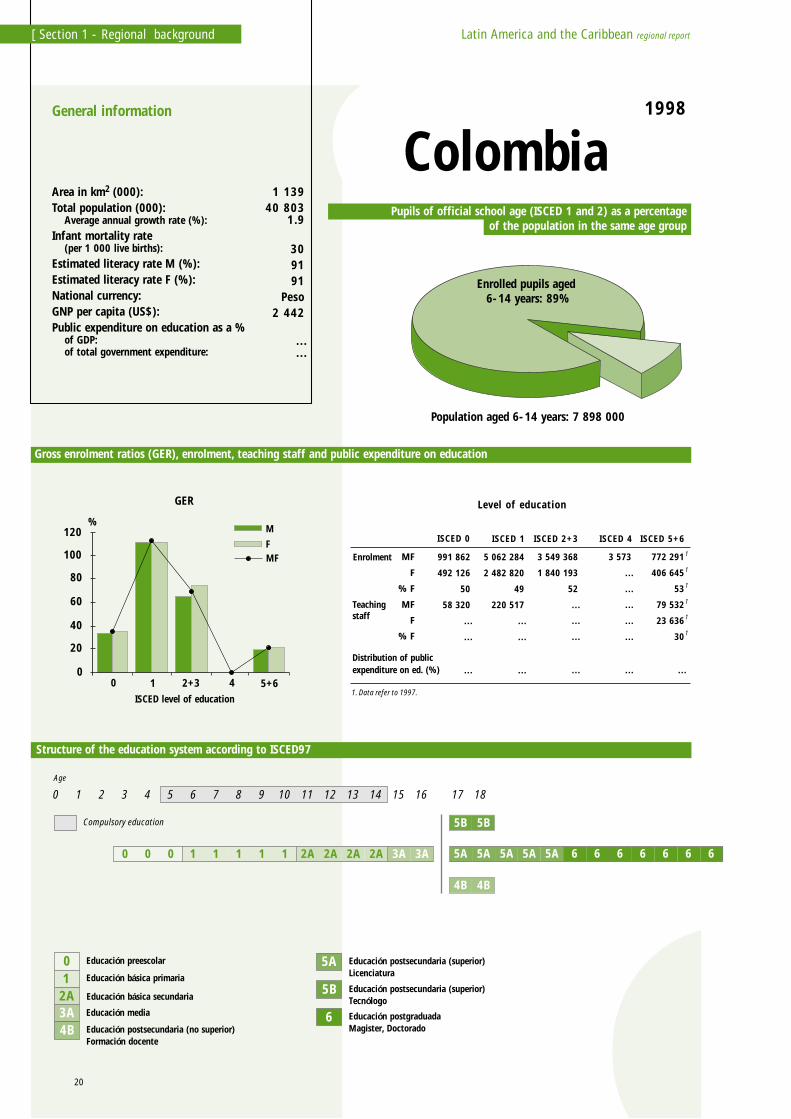
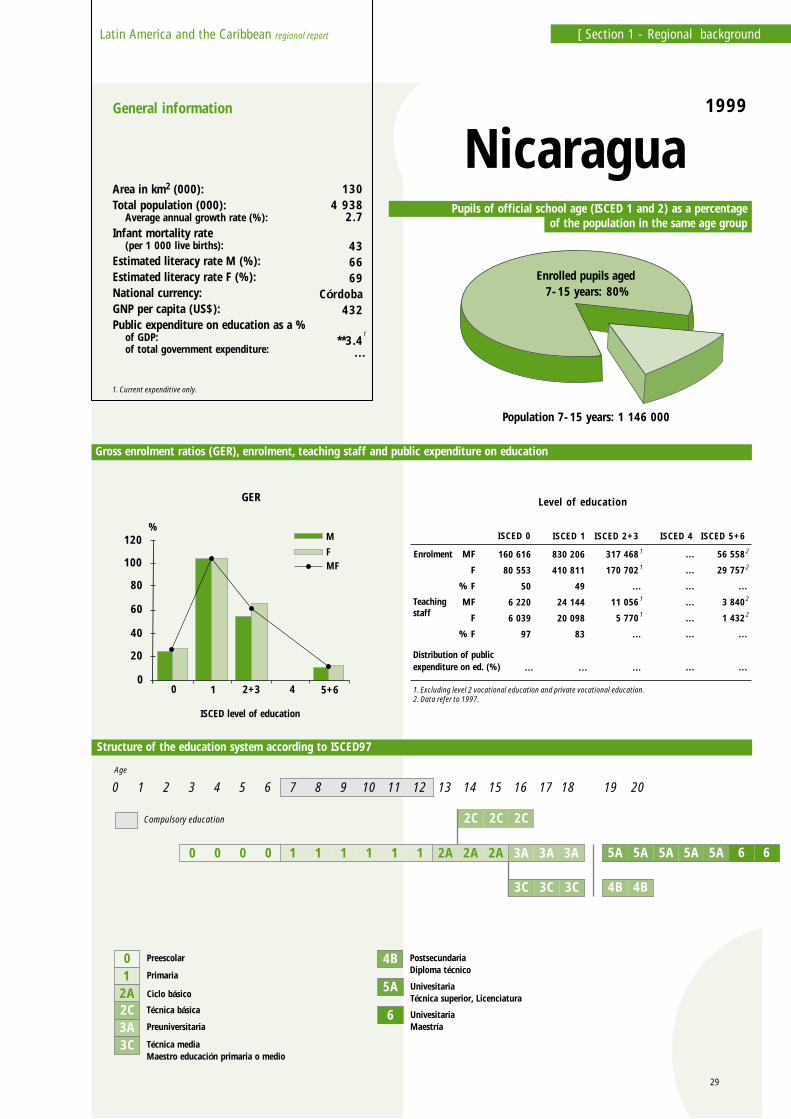
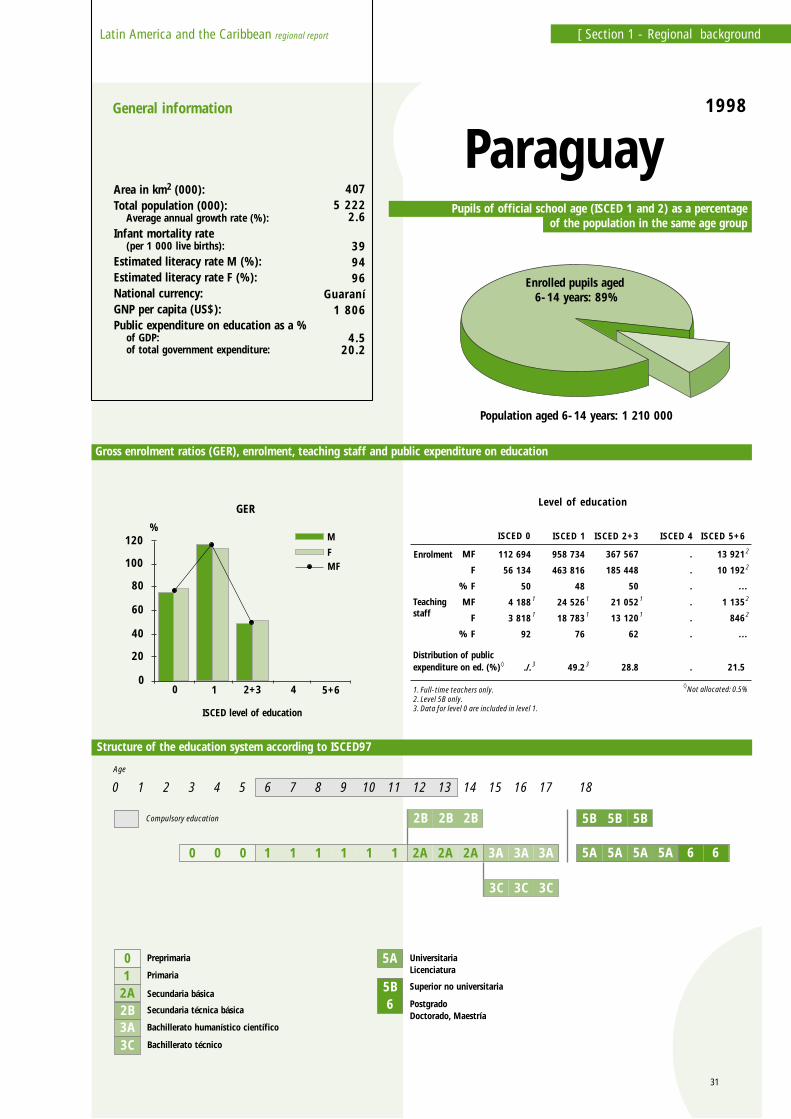
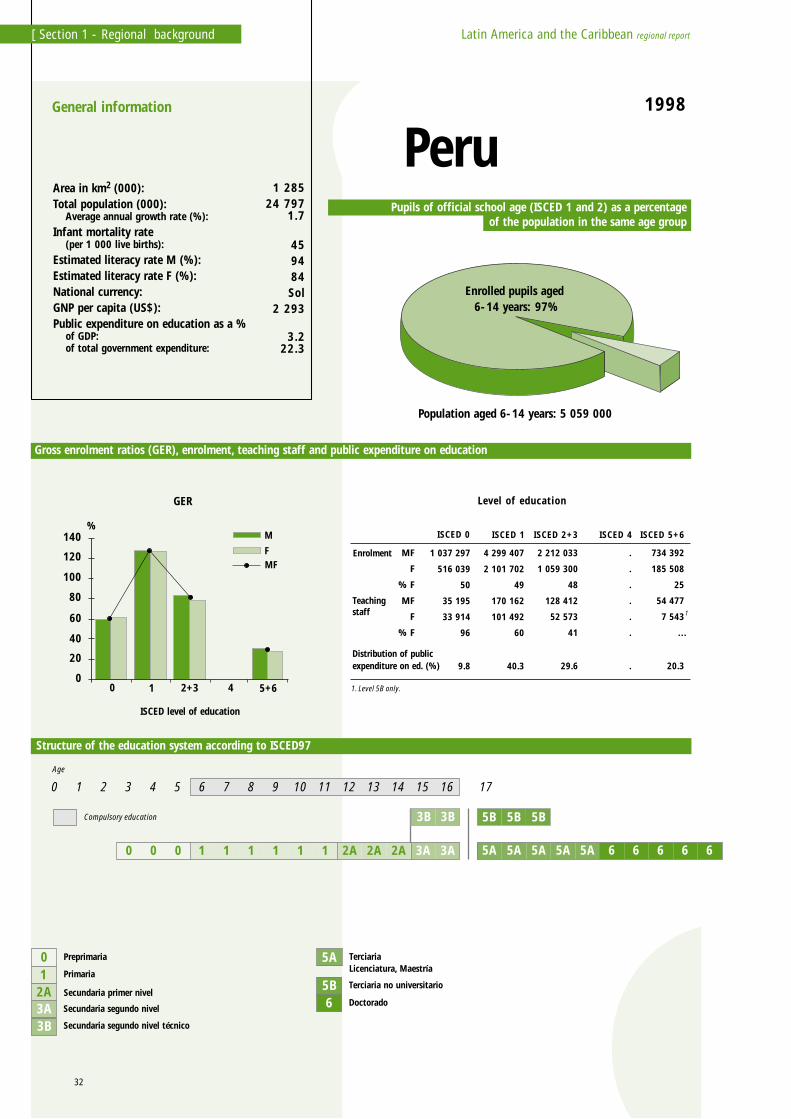
Pupils of official school age (ISCED 1 and 2) as a percentage of the population of the same age
This graph shows the proportion of children of official school age either for ISCED level 1 only(primary education) or, where sufficient data are available, for ISCED levels 1 and 2 combined(primary and lower secondary education) who are enrolled in school, regardless of the educationallevel of the institutions that they attend.
Gross enrolment ratios (GER), pupils, teaching staff and public expenditure on education
The bar chart shows the gender-specific gross enrolment ratios by ISCED level of education. Theoverall ratios (for males and females combined) are indicated by the line graph (see Annex 2 fordefinitions of indicators). The table presents raw data for each ISCED level on the total numbers ofpupils and teachers, the percentage of female students and teachers and, depending on dataavailability, the breakdown by level of education either of total (current plus capital) or of currentpublic expenditure on education.
Structure of the education system according to ISCED97
This graph presents information on the current most typical education system in each country. Thevarious national programmes of education are classified according to ISCED97 by level of education(0, 1, 2 etc) and programme destination (A, B or C). See Annexes 3 and 4 for a more detailedexplanation of ISCED97 and the Glossary for definitions of some expressions.
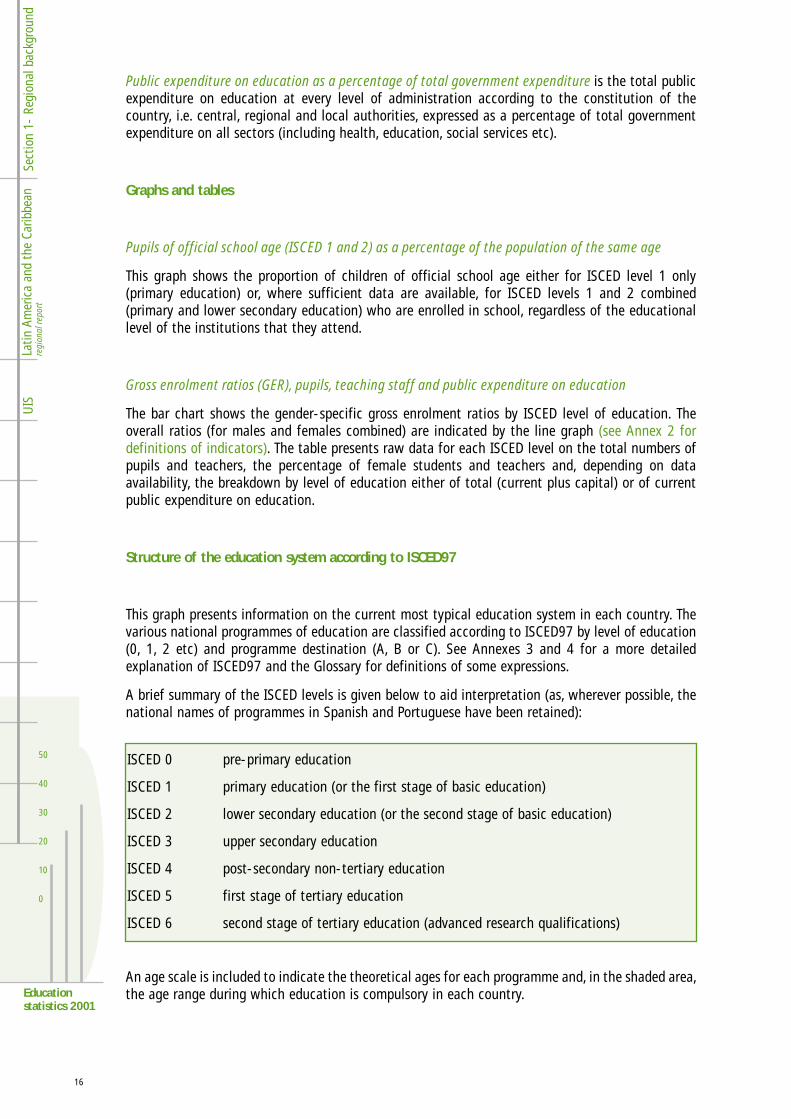
A brief summary of the ISCED levels is given below to aid interpretation (as, wherever possible, thenational names of programmes in Spanish and Portuguese have been retained):
An age scale is included to indicate the theoretical ages for each programme and, in the shaded area,the age range during which education is compulsory in each country.
16
50
40
30
20
10
0
Sect
ion
1- R
egio
nal b
ackg
roun
d La
tin A
mer
ica
and
the
Carib
bean
regi
onal
repo
rtU
IS
Educationstatistics 2001
ISCED 0 pre-primary education
ISCED 1 primary education (or the first stage of basic education)
ISCED 2 lower secondary education (or the second stage of basic education)
ISCED 3 upper secondary education
ISCED 4 post-secondary non-tertiary education
ISCED 5 first stage of tertiary education
ISCED 6 second stage of tertiary education (advanced research qualifications)
Area in km2 (000): Total population (000):
Average annual growth rate (%):Infant mortality rate
(per 1 000 live births):Estimated literacy rate M (%):Estimated literacy rate F (%):National currency: GNP per capita (US$):Public expenditure on education as a %
of GDP:of total government expenditure:
2 78036 123
1.3
229797
Peso 8 020
4.1…
5B Terciaria no universitaria
5A Terciaria universitariaLicenciatura, Maestría
6 Doctorado
0 Preprimaria
1 Primaria
3A Secundaria 2o ciclo Polimodal
2A Secundaria 1er cicloEducación general básica, 3er ciclo
5B5B5B
6 665A5A5A5A5A1 1 1 111
Age
Compulsory education
43210 5 6 7 8 9 10 11 12 13 14 15 16 17 18
3A3A3A2A2A2A000
Argentina1998
Enrolment MF
F
% F
MF
F
% F
Teaching
1
1 178 249
586 247
50
54 962
52 748
96
7.3
4 821 090
2 374 279
49
234 143
208 616
89
35.1
3 555 848
1 820 549
51
257 798
177 930
69
33.2
.
.
.
.
.
.
.
1 526 515
891 946
…
116 114
61 271
53
21.2
ISCED 0 ISCED 1 ISCED 2+3 ISCED 4 ISCED 5+6
1. Excluding level 6. Not allocated: 3.3%
Distribution of publicexpenditure on ed. (%)
General information
0
20
40
60
80
100
120
0 1 2+3 4 5+6
M
FMF
%
Gross enrolment ratios (GER), enrolment, teaching staff and public expenditure on education
Pupils of official school age (ISCED 1 and 2) as a percentageof the population in the same age group
Structure of the education system according to ISCED97
staff
Level of educationGER
ISCED level of education
Enrolled pupils aged 6-14 years: 100%
Population aged 6-14 years: 6 009 000
17
Latin America and the Caribbean regional report [ Section 1 - Regional background
1 099 7 957
2.3
669178
Boliviano 952
5.6…
Population aged 6-13 years: 1 597 000
Enrolled pupils aged6-13 years: 100%
0
20
40
60
80
100
120
140
0 1 2+3 4 5+6
M
FMF
1
1
1
1
1
1
3
3
5
1
1
4
4
6
2
2
7
Preescolar- Ciclo de primeros aprendizajes
0 Preescolar- Ciclo de preparación escolar
1 Primaria- Ciclo de primeros aprendizajesPrimaria- Ciclo de aprendizajes esenciales
2C Aprendizaje de oficios
3A Secundaria- Ciclo de aprendizajes tecnológicosSecundaria- Ciclo de aprendizajes diferenciados(humanístico)
4A Cursos preuniversitarios
4B Técnica no universitaria
5B Técnica superior
5A LicenciaturaMaestría
6 Doctorado
Secundaria- Ciclo de aprendizajes diferenciados(técnico)
3B
2A Primaria- Ciclo de aprendizajes aplicados
5B5B5B
5A5A5A5A5A5A5A1 1 1 111
4A
4B
43210 5 6 7 8 9 10 11 12 13 14 15 16 17 18
3A3A
3B3B
3A3A2A2A
2C2C
00 6 6
Area in km2 (000): Total population (000): Average annual growth rate (%):Infant mortality rate (per 1 000 live births):Estimated literacy rate M (%):Estimated literacy rate F (%):National currency: GNP per capita (US$):Public expenditure on education as a % of GDP: of total government expenditure:
Age
Compulsory education
Pupils of official school age (ISCED 1 and 2) as a percentageof the population in the same age group
Gross enrolment ratios (GER), enrolment, teaching staff and public expenditure on education
Structure of the education system according to ISCED97
Level of education
General information
GER
ISCED level of education
Bolivia1998
Enrolment
Teachingstaff
MF
F
% F
MF
F
% F
207 789
102 605
49
4 951
4 605
93
3.2
1 444 879
703 561
49
72 679
44 437
61
50.6
823 432
391 794
48
24 545
11 695
48
12.6
…
…
…
…
…
…
./.
199 260
…
…
11 420
…
…
28.2
ISCED 0 ISCED 1 ISCED 2+3 ISCED 4 ISCED 5+6
1. Incomplete data.2. Level 5A only.3. Incomplete data. Including level 2 general lower secondary.4. Incomplete data. Data refer to level 3 only.5. Data refer to levels 1 and 2.6. Data refer to levels 3 and 4.7. Data for level 4 are included in level 3.
Not allocated: 5.4%
Distribution of publicexpenditure on ed. (%)
%
18
Latin America and the Caribbean regional report[ Section 1 - Regional background
0
20
40
60
80
100
120
140
GER
0 1 2+3 4 5+6
ISCED level of education
M
FMF
160%
0 Preescolar
Preescolar- Guardería
1 Primaria
3A Secundaria segundo ciclo
5B Programas no universitarios
5A Licenciatura corta / Programa técnicoLicenciatura Plena / Bachalerado
6 Doctorado / Maestría 2A Secundaria primer ciclo
5B5B
6 6665A5A5A5A
Age
Compulsory education
43210 5 6 7 8 9 10 11 12 13 14 15 16 17 18
1 1 1 111 3A3A3A2A2A000
Gross enrolment ratios (GER), enrolment, teaching staff and public expenditure on education
Structure of the education system according to ISCED97
Brazil1998
8 547165 851
1.3
428584
Real4 456
4.512.0
Pupils of official school age (ISCED 1 and 2) as a percentageof the population in the same age group
Population aged 7-14 years: 27 238 000
Enrolled pupils aged 7-14 years: 100%
General information
Level of education
Enrolment MF
F
% F
MF
F
% F
Teachingstaff
5 299 212
2 615 105
49
265 719
261 148
98
9.6
31 237 481
15 141 051
48
941 401
881 647
94
44.2
14 404 835
7 671 045
53
750 855
596 769
79
21.9
.
.
.
.
.
.
.
2 203 599
1 211 171
55
165 122
69 366
42
24.2
ISCED 0 ISCED 1 ISCED 2+3 ISCED 4 ISCED 5+6
Distribution of publicexpenditure on ed. (%)
Area in km2 (000): Total population (000): Average annual growth rate (%):Infant mortality rate (per 1 000 live births):Estimated literacy rate M (%):Estimated literacy rate F (%):National currency: GNP per capita (US$):Public expenditure on education as a % of GDP: of total government expenditure:
19
Latin America and the Caribbean regional report [ Section 1 - Regional background
Area in km2 (000): Total population (000): Average annual growth rate (%):Infant mortality rate (per 1 000 live births):Estimated literacy rate M (%):Estimated literacy rate F (%):National currency: GNP per capita (US$):Public expenditure on education as a % of GDP: of total government expenditure:
1 13940 803
1.9
309191
Peso 2 442
……
6 Educación postgraduadaMagister, Doctorado
5B Educación postsecundaria (superior)Tecnólogo
5A Educación postsecundaria (superior)Licenciatura
5B5B
6 6 6 6 6 665A5A5A5A5A1 1 1 2A11
Age
Compulsory education
43210 5 6 7 8 9 10 11 12 13 14 15 16 17 18
3A3A2A2A2A000
4B4B
Pupils of official school age (ISCED 1 and 2) as a percentageof the population in the same age group
Gross enrolment ratios (GER), enrolment, teaching staff and public expenditure on education
Structure of the education system according to ISCED97
Colombia1998
Enrolled pupils aged 6-14 years: 89%
Population aged 6-14 years: 7 898 000
Level of education
Enrolment MF
F
% F
MF
F
% F
Teachingstaff
991 862
492 126
50
58 320
…
…
…
5 062 284
2 482 820
49
220 517
…
…
…
3 549 368
1 840 193
52
…
…
…
…
3 573
…
…
…
…
…
…
772 291
406 645
53
79 532
23 636
30
…
ISCED 0 ISCED 1 ISCED 2+3 ISCED 4 ISCED 5+6
1. Data refer to 1997.
Distribution of publicexpenditure on ed. (%)
General information
1
1
1
1
1
1
0 Educación preescolar
1 Educación básica primaria
3A Educación media
2A Educación básica secundaria
Educación postsecundaria (no superior)Formación docente
4B
%
0
20
40
60
80
100
120
GER
0 1 2+3 4 5+6 ISCED level of education
M
FMF
20
Latin America and the Caribbean regional report[ Section 1 - Regional background
Costa Rica1998
MF
F
% F
MF
F
% F
49
3 604
3 484
97
5.6
552 280
265 702
48
20 232
16 248
80
47.2
212 945
109 766
52
11 836
…
…
29.1
8 239
4 232
51
…
…
…
0.7
58 761
31 012
53
…
…
…
17.4
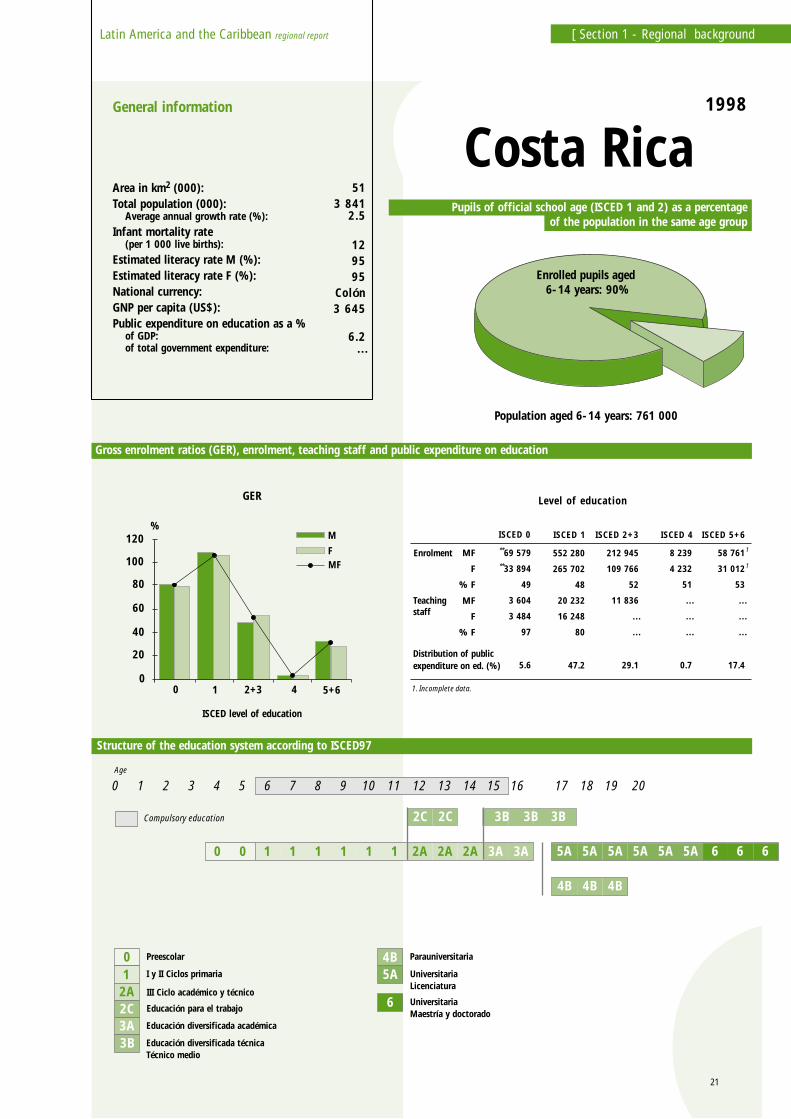
ISCED 0 ISCED 1 ISCED 2+3 ISCED 4 ISCED 5+6
1. Incomplete data.
1
1
51 3 841
2.5
129595
Colón 3 645
6.2…
4B Parauniversitaria
5A UniversitariaLicenciatura
6 UniversitariaMaestría y doctorado
0 Preescolar
1 I y II Ciclos primaria
2C Educación para el trabajo
3A Educación diversificada académica
3B Educación diversificada técnicaTécnico medio
2A III Ciclo académico y técnico
0
20
40
60
80
100
120
0 1 2+3 4 5+6
M
FMF
6 665A 5A 5A5A5A5A1 1 1 111
43210 5 6 7 8 9 10 11 12 13 14 15 16 17 18 19 20
3A3A2A2A2A00
4B 4B 4B
2C2C 3B3B
**69 579
**33 894
%
3B
Area in km2 (000): Total population (000): Average annual growth rate (%):Infant mortality rate (per 1 000 live births):Estimated literacy rate M (%):Estimated literacy rate F (%):National currency: GNP per capita (US$):Public expenditure on education as a % of GDP: of total government expenditure:
Age
Compulsory education
Pupils of official school age (ISCED 1 and 2) as a percentageof the population in the same age group
Gross enrolment ratios (GER), enrolment, teaching staff and public expenditure on education
Structure of the education system according to ISCED97
Level of education
General information
GER
ISCED level of education
Enrolment
Teachingstaff
Distribution of publicexpenditure on ed. (%)
Population aged 6-14 years: 761 000
Enrolled pupils aged 6-14 years: 90%
21
Latin America and the Caribbean regional report [ Section 1 - Regional background
4B Formación técnica y profesional (técnico medio)
5A Enseñanza superior
6 Master, Doctor en ciencia,Diplomado especialista 1er grado,Doctorado
Pupils of official school age (ISCED 1 and 2) as a percentageof the population in the same age group
Gross enrolment ratios (GER), enrolment, teaching staff and public expenditure on education
Structure of the education system according to ISCED97
Cuba1998
Level of education
Enrolment MF
F
% F
MF
F
% F
Teachingstaff
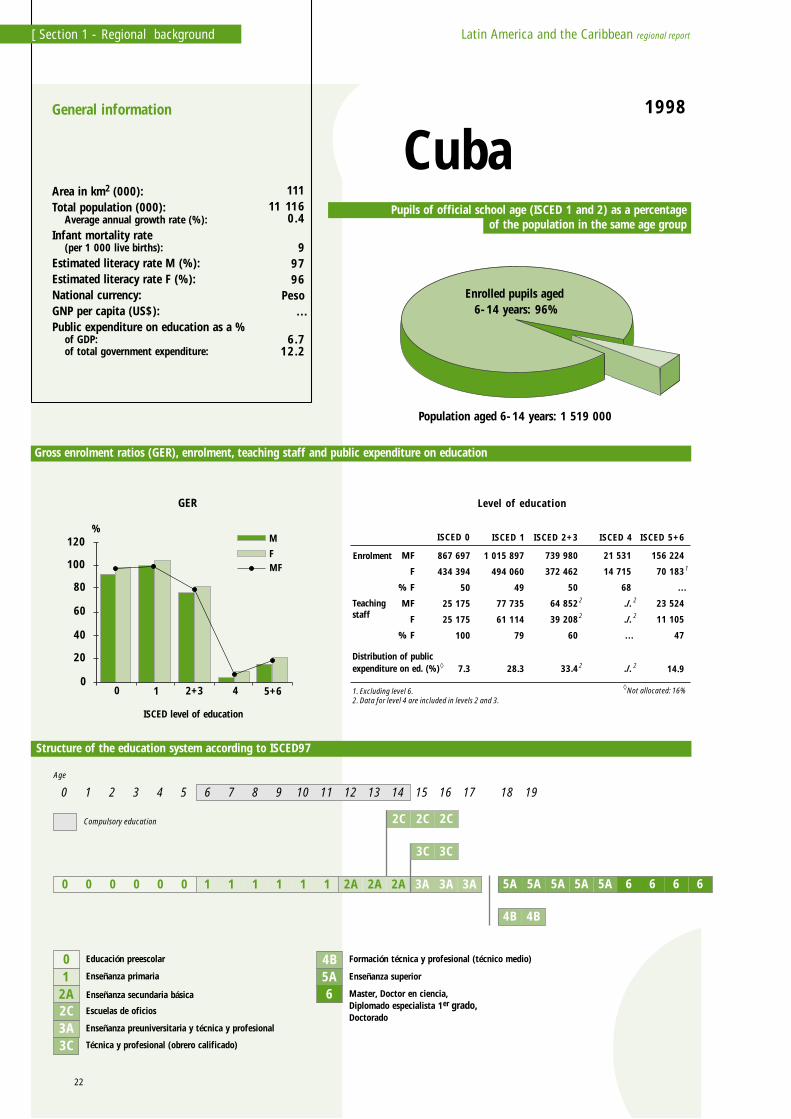
867 697
434 394
50
25 175
25 175
100
7.3
1 015 897
494 060
49
77 735
61 114
79
28.3
739 980
372 462
50
64 852
39 208
60
33.4
21 531
14 715
68
./.
./.
…
./.
156 224
70 183
…
23 524
11 105
47
14.9
ISCED 0 ISCED 1 ISCED 2+3 ISCED 4 ISCED 5+6
1. Excluding level 6.2. Data for level 4 are included in levels 2 and 3.
Not allocated: 16%
Distribution of publicexpenditure on ed. (%)
General information
1
2
2
2
2
2
2
11111 116
0.4
99796
Peso…
6.712.2
0 Educación preescolar
1 Enseñanza primaria
3A Enseñanza preuniversitaria y técnica y profesional
2C Escuelas de oficios
2A Enseñanza secundaria básica
Técnica y profesional (obrero calificado)3C
Population aged 6-14 years: 1 519 000
Enrolled pupils aged 6-14 years: 96%
0
20
40
60
80
100
120
GER
0 1 2+3 4 5+6
ISCED level of education
M
FMF
6 6 665A5A5A5A5A1 1 1 111
Age
Compulsory education
43210 5 6 7 8 9 10 11 12 13 14 15 16 17 18 19
3A3A3A2A2A2A000000
4B 4B
3C3C
2C 2C2C
%
Area in km2 (000): Total population (000): Average annual growth rate (%):Infant mortality rate (per 1 000 live births):Estimated literacy rate M (%):Estimated literacy rate F (%):National currency: GNP per capita (US$):Public expenditure on education as a % of GDP: of total government expenditure:
22
Latin America and the Caribbean regional report[ Section 1 - Regional background
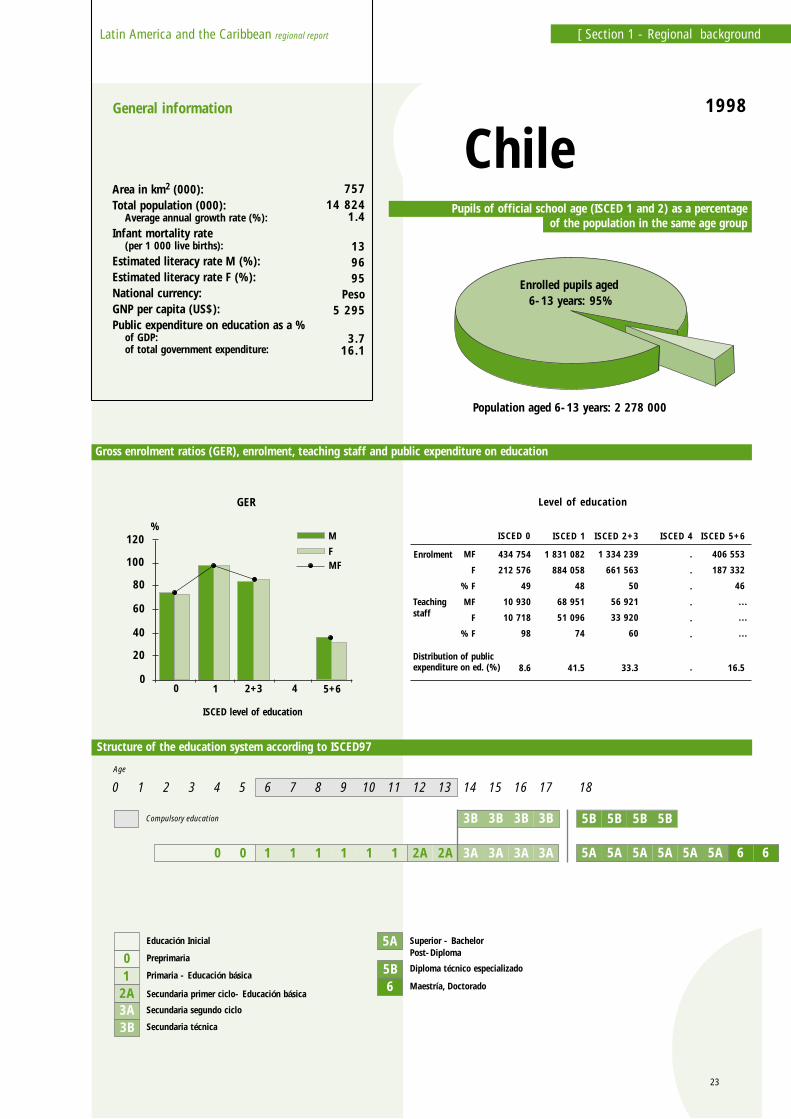
757 14 824
1.4
139695
Peso 5 295
3.716.1
5B Diploma técnico especializado
5A Superior - BachelorPost-Diploma
6 Maestría, Doctorado
5B 5B5B5B
6 65A5A5A5A5A5A1 1 1 111
Age
Compulsory education
43210 5 6 7 8 9 10 11 12 13 14 15 16 17 18
3A3A3A3A2A2A00
Pupils of official school age (ISCED 1 and 2) as a percentageof the population in the same age group
Gross enrolment ratios (GER), enrolment, teaching staff and public expenditure on education
Structure of the education system according to ISCED97
Chile1998
Level of education
Enrolment MF
F
% F
MF
F
% F
Teachingstaff
434 754
212 576
49
10 930
10 718
98
8.6
1 831 082
884 058
48
68 951
51 096
74
41.5
1 334 239
661 563
50
56 921
33 920
60
33.3
.
.
.
.
.
.
.
406 553
187 332
46
…
…
…
16.5
ISCED 0 ISCED 1 ISCED 2+3 ISCED 4 ISCED 5+6
Distribution of publicexpenditure on ed. (%)
General information
0 Preprimaria
Educación Inicial
1 Primaria - Educación básica
3A Secundaria segundo ciclo
2A Secundaria primer ciclo- Educación básica
Population aged 6-13 years: 2 278 000
Enrolled pupils aged 6-13 years: 95%
3B3B3B3B
Secundaria técnica3B
0
20
40
60
80
100
120
GER
0 1 2+3 4 5+6
ISCED level of education
M
FMF
%
Area in km2 (000): Total population (000): Average annual growth rate (%):Infant mortality rate (per 1 000 live births):Estimated literacy rate M (%):Estimated literacy rate F (%):National currency: GNP per capita (US$):Public expenditure on education as a % of GDP: of total government expenditure:
23
Latin America and the Caribbean regional report [ Section 1 - Regional background
5B Universidad o Escuela politécnicaTecnólogo o licenciado
5A Universidad o Escuela politécnicaTítulo profesional
6 Universidad o Escuela politécnicaDiplomado o Master
Pupils of official school age (ISCED 1 and 2) as a percentageof the population in the same age group
Gross enrolment ratios (GER), enrolment, teaching staff and public expenditure on education
Structure of the education system according to ISCED97
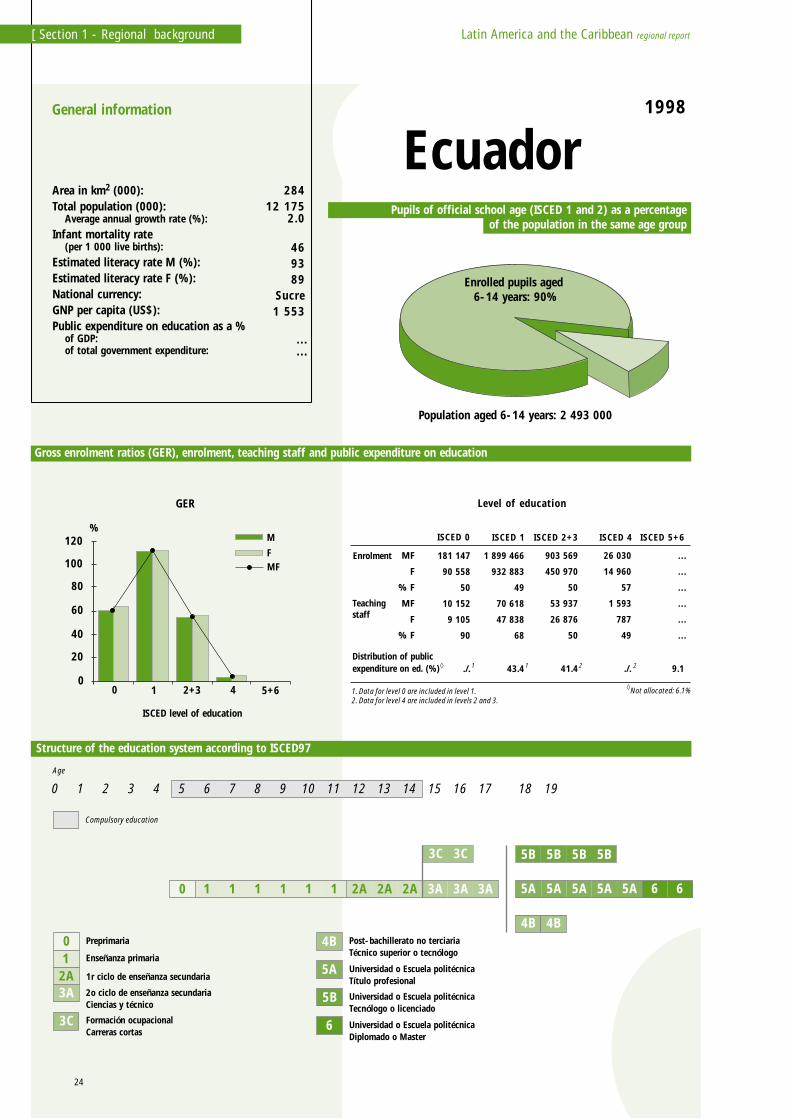
Ecuador1998
Level of education
Enrolment MF
F
% F
MF
F
% F
Teachingstaff
181 147
90 558
50
10 152
9 105
90
./.
1 899 466
932 883
49
70 618
47 838
68
43.4
903 569
450 970
50
53 937
26 876
50
41.4
26 030
14 960
57
1 593
787
49
./.
…
…
…
…
…
…
9.1
ISCED 0 ISCED 1 ISCED 2+3 ISCED 4 ISCED 5+6
1. Data for level 0 are included in level 1.2. Data for level 4 are included in levels 2 and 3.
Not allocated: 6.1%
Distribution of publicexpenditure on ed. (%)
General information
2211
Area in km2 (000): Total population (000): Average annual growth rate (%):Infant mortality rate (per 1 000 live births):Estimated literacy rate M (%):Estimated literacy rate F (%):National currency: GNP per capita (US$):Public expenditure on education as a % of GDP: of total government expenditure:
284 12 175
2.0
469389
Sucre 1 553
……
0 Preprimaria
1 Enseñanza primaria
3A 2o ciclo de enseñanza secundariaCiencias y técnico
2A 1r ciclo de enseñanza secundaria
Formación ocupacionalCarreras cortas
3C
4B Post-bachillerato no terciariaTécnico superior o tecnólogo
Age
Compulsory education
43210 5 6 7 8 9 10 11 12 13 14 15 16 17 18 19
3C3C
Enrolled pupils aged 6-14 years: 90%
Population aged 6-14 years: 2 493 000
0
20
40
60
80
100
120
GER
0 1 2+3 4 5+6
ISCED level of education
M
FMF
665A5A5A5A5A1 1 1 111 3A3A3A2A2A2A0
5B 5B5B5B
4B 4B
%
24
Latin America and the Caribbean regional report[ Section 1 - Regional background
5B Enseñanza superiorTécnica no universitaria
5A Enseñanza superior universitariaDoctor en medicina, Arquitecto, Ingeniero, LicenciadoPostgrado: Grado de Master y Postgrado
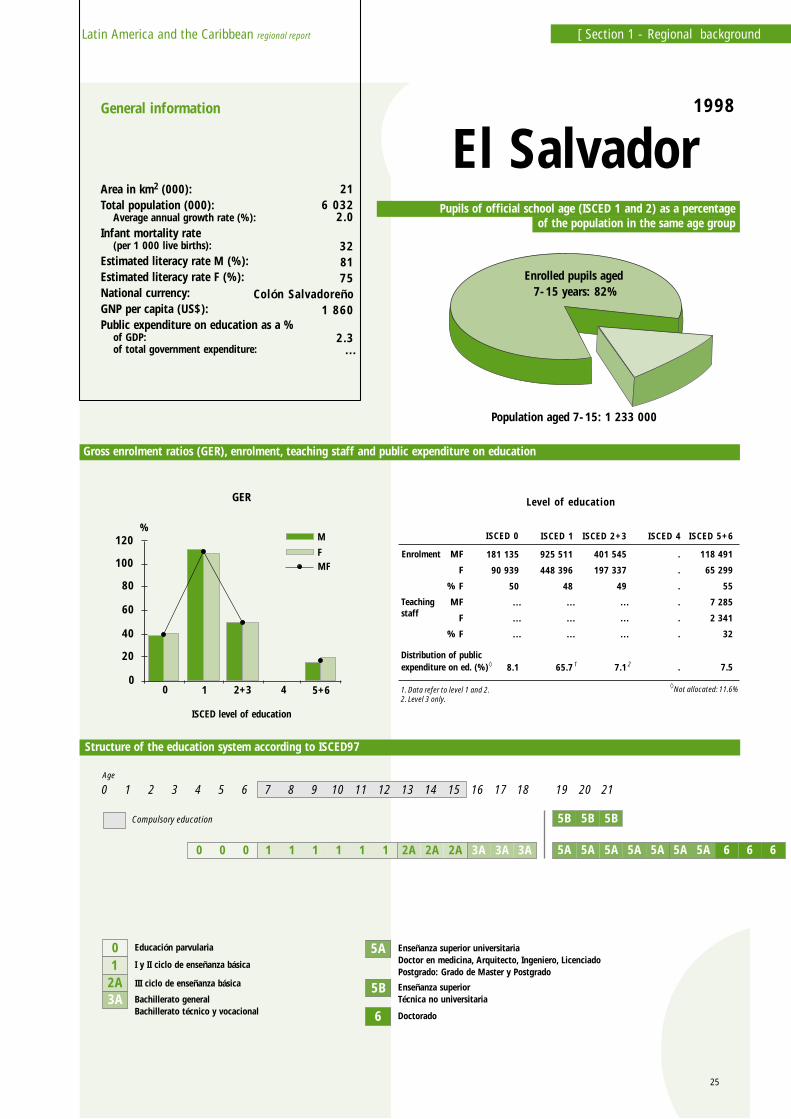
6 Doctorado
Tasas brutas de escolarización (TBE), matrícula, docentes y gastos públicos de educación
El Salvador1998
MF
F
% F
MF
F
% F
181 135
90 939
50
…
…
…
8.1
925 511
448 396
48
…
…
…
65.7
401 545
197 337
49
…
…
…
7.1
.
.
.
.
.
.
.
118 491
65 299
55
7 285
2 341
32
7.5
ISCED 0 ISCED 1 ISCED 2+3 ISCED 4 ISCED 5+6
1. Data refer to level 1 and 2.2. Level 3 only.
Not allocated: 11.6%
21
21 6 032
2.0
328175
Colón Salvadoreño 1 860
2.3…
0 Educación parvularia
1 I y II ciclo de enseñanza básica
3A Bachillerato generalBachillerato técnico y vocacional
2A III ciclo de enseñanza básica
0
20
40
60
80
100
120
0 1 2+3 4 5+6
M
FMF
6 665A5A 5A5A5A5A5A1 1 1 111
43210 5 6 7 8 9 10 11 12 13 14 15 16 17 18 19 20 21
3A3A3A2A2A2A000
5B5B5B
%
Area in km2 (000): Total population (000): Average annual growth rate (%):Infant mortality rate (per 1 000 live births):Estimated literacy rate M (%):Estimated literacy rate F (%):National currency: GNP per capita (US$):Public expenditure on education as a % of GDP: of total government expenditure:
Age
Compulsory education
Pupils of official school age (ISCED 1 and 2) as a percentageof the population in the same age group
Gross enrolment ratios (GER), enrolment, teaching staff and public expenditure on education
Structure of the education system according to ISCED97
Level of education
General information
GER
ISCED level of education
Enrolment
Teachingstaff
Distribution of publicexpenditure on ed. (%)
Population aged 7-15: 1 233 000
Enrolled pupils aged 7-15 years: 82%
25
Latin America and the Caribbean regional report [ Section 1 - Regional background
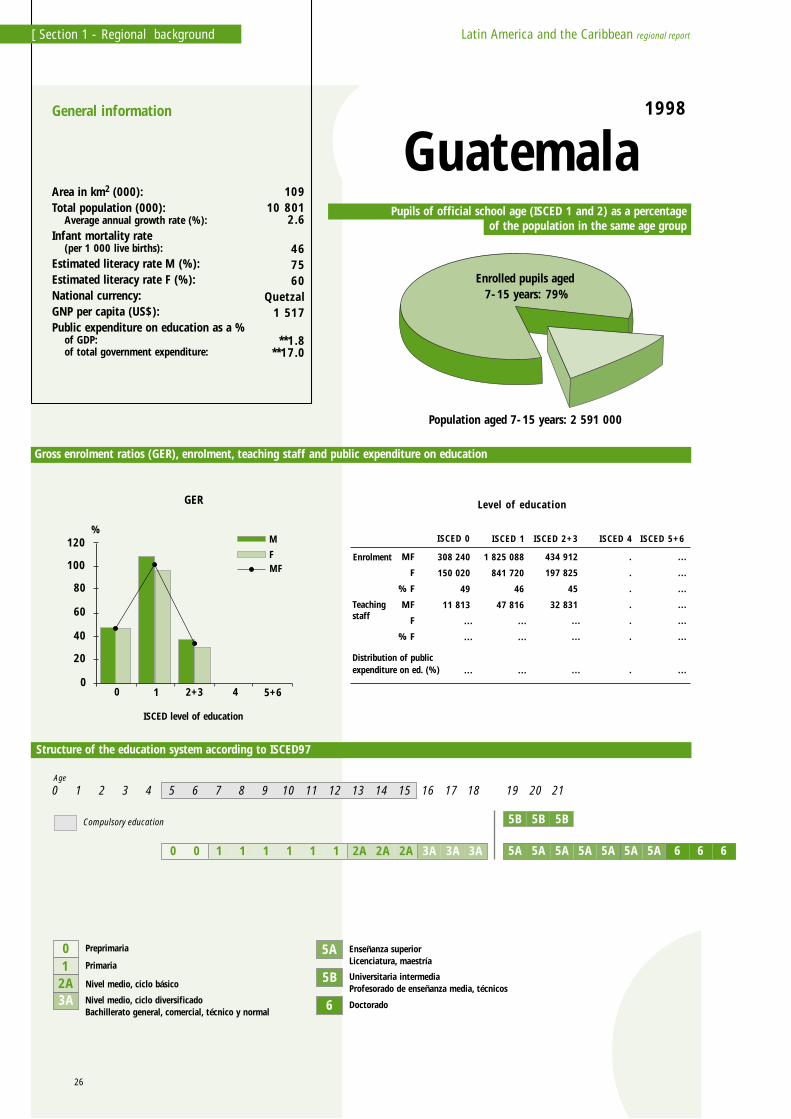
Guatemala1998
MF
F
% F
MF
F
% F
308 240
150 020
49
11 813
…
…
…
1 825 088
841 720
46
47 816
…
…
…
434 912
197 825
45
32 831
…
…
…
.
.
.
.
.
.
.
…
…
…
…
…
…
…
ISCED 0 ISCED 1 ISCED 2+3 ISCED 4 ISCED 5+6
109 10 801
2.6
467560
Quetzal 1 517
**1.8**17.0
0
20
40
60
80
100
120
0 1 2+3 4 5+6
M
FMF
5B Universitaria intermediaProfesorado de enseñanza media, técnicos
5A Enseñanza superiorLicenciatura, maestría
6 Doctorado
0 Preprimaria
1 Primaria
3A Nivel medio, ciclo diversificadoBachillerato general, comercial, técnico y normal
2A Nivel medio, ciclo básico
6 665A5A 5A5A5A5A5A1 1 1 111
43210 5 6 7 8 9 10 11 12 13 14 15 16 17 18 19 20 21
3A3A3A2A2A2A00
5B5B5B
%
Area in km2 (000): Total population (000): Average annual growth rate (%):Infant mortality rate (per 1 000 live births):Estimated literacy rate M (%):Estimated literacy rate F (%):National currency: GNP per capita (US$):Public expenditure on education as a % of GDP: of total government expenditure:
Age
Compulsory education
Pupils of official school age (ISCED 1 and 2) as a percentageof the population in the same age group
Gross enrolment ratios (GER), enrolment, teaching staff and public expenditure on education
Structure of the education system according to ISCED97
Level of education
General information
GER
ISCED level of education
Enrolment
Teachingstaff
Distribution of publicexpenditure on ed. (%)
Population aged 7-15 years: 2 591 000
Enrolled pupils aged 7-15 years: 79%
26
Latin America and the Caribbean regional report[ Section 1 - Regional background
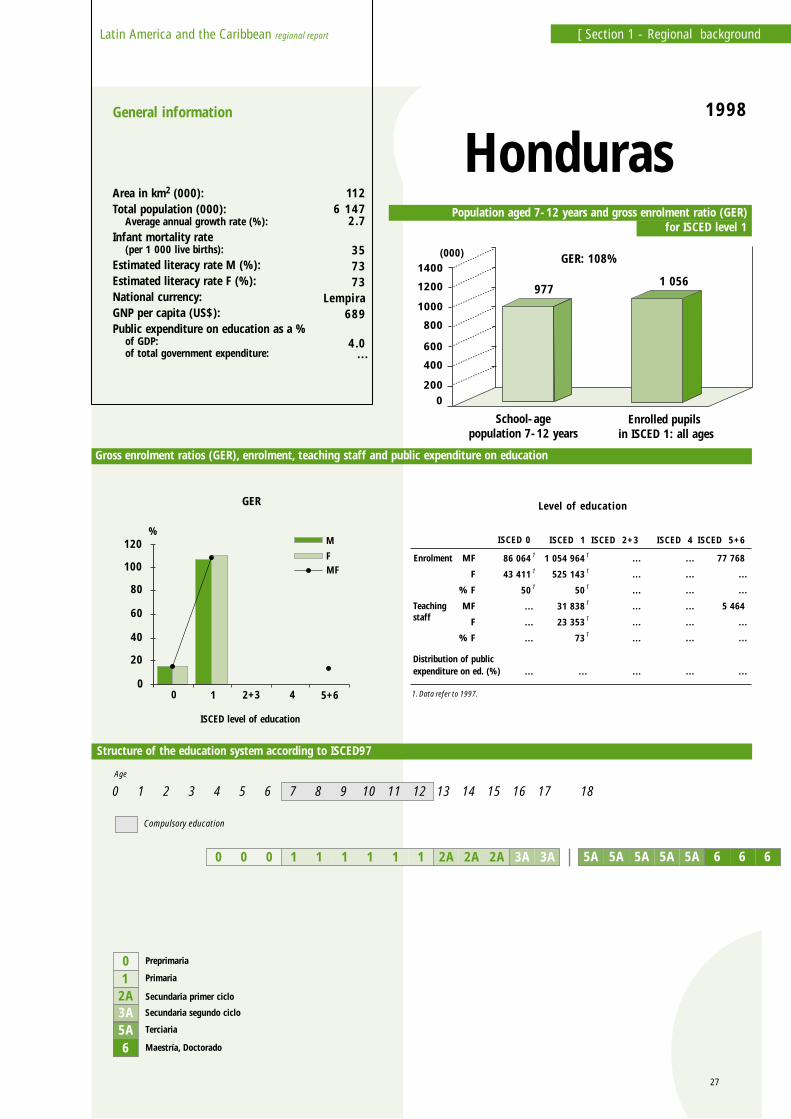
Honduras1998
MF
F
% F
MF
F
% F
86 064
43 411
50
…
…
…
…
1 054 964
525 143
50
31 838
23 353
73
…
…
…
…
…
…
…
…
…
…
…
…
…
…
…
77 768
…
…
5 464
…
…
…
ISCED 0 ISCED 1 ISCED 2+3 ISCED 4 ISCED 5+6
1. Data refer to 1997.
1
1
1
1
1
1
1
1
1
112 6 147
2.7
357373
Lempira 689
4.0…
0 Preprimaria
1 Primaria
3A Secundaria segundo ciclo
2A Secundaria primer ciclo
Terciaria5A6 Maestría, Doctorado
43210 5 6 7 8 9 10 11 12 13 14 15 16 17 18
1 1 1 111 3A3A2A2A2A000 6 665A5A5A5A5A
0200
400
600
800
1000
1200
1400GER: 108%
9771 056
School-agepopulation 7-12 years
Enrolled pupils in ISCED 1: all ages
0
20
40
60
80
100
120
0 1 2+3 4 5+6
M
FMF
%
(000)
Area in km2 (000): Total population (000): Average annual growth rate (%):Infant mortality rate (per 1 000 live births):Estimated literacy rate M (%):Estimated literacy rate F (%):National currency: GNP per capita (US$):Public expenditure on education as a % of GDP: of total government expenditure:
Age
Compulsory education
Gross enrolment ratios (GER), enrolment, teaching staff and public expenditure on education
Structure of the education system according to ISCED97
Level of education
General information
GER
ISCED level of education
Enrolment
Teachingstaff
Distribution of publicexpenditure on ed. (%)
Population aged 7-12 years and gross enrolment ratio (GER) for ISCED level 1
27
Latin America and the Caribbean regional report [ Section 1 - Regional background
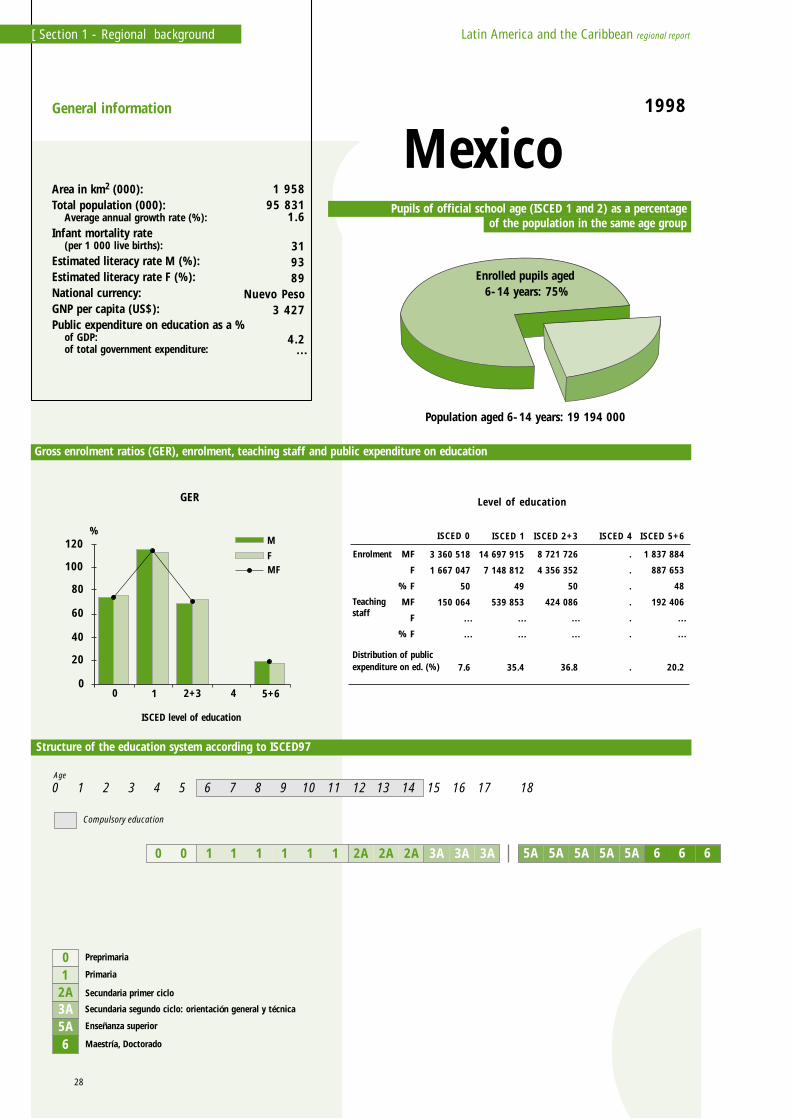
Mexico1998
MF
F
% F
MF
F
% F
3 360 518
1 667 047
50
150 064
…
…
7.6
14 697 915
7 148 812
49
539 853
…
…
35.4
8 721 726
4 356 352
50
424 086
…
…
36.8
.
.
.
.
.
.
.
1 837 884
887 653
48
192 406
…
…
20.2
ISCED 0 ISCED 1 ISCED 2+3 ISCED 4 ISCED 5+6
1 958 95 831
1.6
319389
Nuevo Peso 3 427
4.2…
0
20
40
60
80
100
120
0 1 2+3 4 5+6
M
FMF
%
0 Preprimaria
1 Primaria
3A Secundaria segundo ciclo: orientación general y técnica
2A Secundaria primer ciclo
Enseñanza superior5A6 Maestría, Doctorado
43210 5 6 7 8 9 10 11 12 13 14 15 16 17 18
1 1 11 11 3A3A3A2A2A2A00 6 665A5A5A5A5A
Area in km2 (000): Total population (000): Average annual growth rate (%):Infant mortality rate (per 1 000 live births):Estimated literacy rate M (%):Estimated literacy rate F (%):National currency: GNP per capita (US$):Public expenditure on education as a % of GDP: of total government expenditure:
Age
Compulsory education
Pupils of official school age (ISCED 1 and 2) as a percentageof the population in the same age group
Gross enrolment ratios (GER), enrolment, teaching staff and public expenditure on education
Structure of the education system according to ISCED97
Level of education
General information
GER
ISCED level of education
Enrolment
Teachingstaff
Distribution of publicexpenditure on ed. (%)
Population aged 6-14 years: 19 194 000
Enrolled pupils aged 6-14 years: 75%
28
Latin America and the Caribbean regional report[ Section 1 - Regional background
4B PostsecundariaDiploma técnico
5A UnivesitariaTécnica superior, Licenciatura
6 UnivesitariaMaestría
Nicaragua1999
MF
F
% F
MF
F
% F
160 616
80 553
50
6 220
6 039
97
…
830 206
410 811
49
24 144
20 098
83
…
317 468
170 702
…
11 056
5 770
…
…
…
…
…
…
…
…
…
56 558
29 757
…
3 840
1 432
…
…
ISCED 0 ISCED 1 ISCED 2+3 ISCED 4 ISCED 5+6
1. Excluding level 2 vocational education and private vocational education.2. Data refer to 1997.
2
2
2
2
1
1
1
1
130 4 938
2.7
436669
Córdoba 432
**3.4…
0 Preescolar
1 Primaria
2C Técnica básica
2A Ciclo básico
Preuniversitaria3ATécnica mediaMaestro educación primaria o medio
3C
43210 5 6 7 8 9 10 11 12 13 14 15 16 17 18 19 20
1
0
20
40
60
80
100
120
0 1 2+3 4 5+6
M
FMF
%
1 1 1 111 3A3A3A2A2A2A0000
2C 2C2C
3C 3C 3C
665A5A5A5A5A
4B 4B
Area in km2 (000): Total population (000): Average annual growth rate (%):Infant mortality rate (per 1 000 live births):Estimated literacy rate M (%):Estimated literacy rate F (%):National currency: GNP per capita (US$):Public expenditure on education as a % of GDP: of total government expenditure:
Age
Compulsory education
Pupils of official school age (ISCED 1 and 2) as a percentageof the population in the same age group
Gross enrolment ratios (GER), enrolment, teaching staff and public expenditure on education
Structure of the education system according to ISCED97
Level of education
General information
GER
ISCED level of education
Enrolment
Teachingstaff
Distribution of publicexpenditure on ed. (%)
1. Current expenditive only.
Population 7-15 years: 1 146 000
Enrolled pupils aged 7-15 years: 80%
29
Latin America and the Caribbean regional report [ Section 1 - Regional background
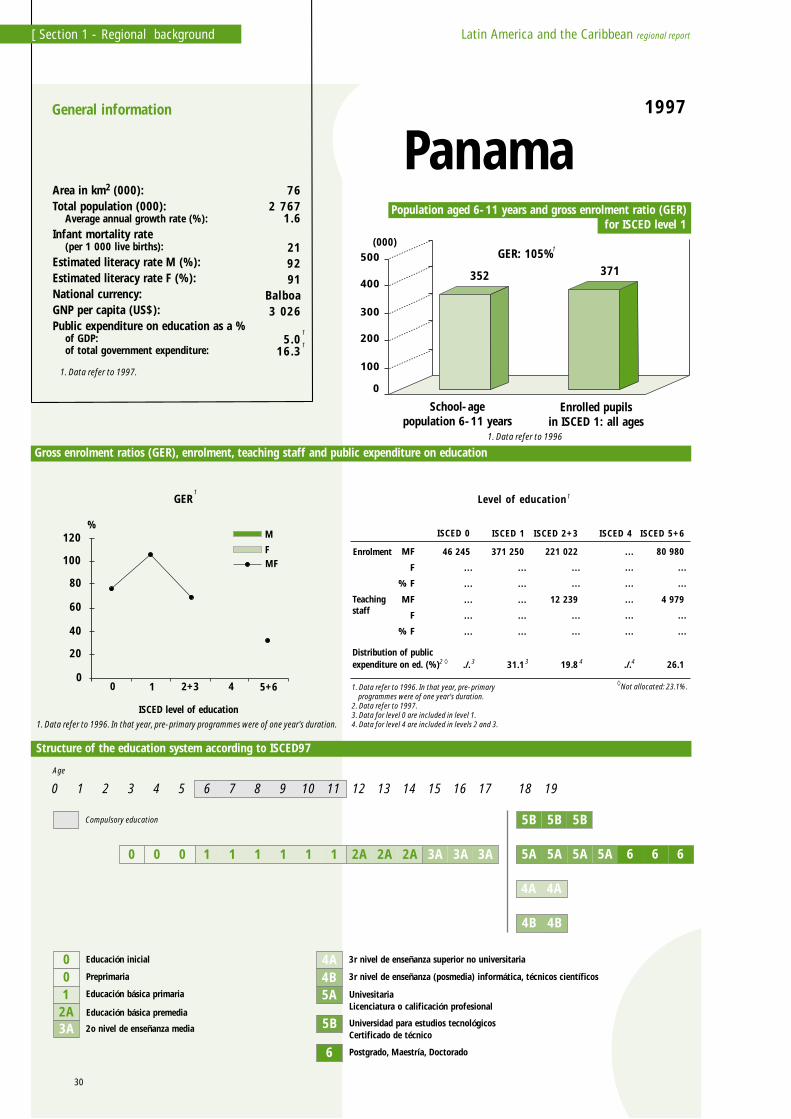
Population aged 6-11 years and gross enrolment ratio (GER)for ISCED level 1
Gross enrolment ratios (GER), enrolment, teaching staff and public expenditure on education
Structure of the education system according to ISCED97
Panama1997
Level of education
Enrolment MF
F
% F
MF
F
% F
Teachingstaff
46 245
…
…
…
…
…
./.
371 250
…
…
…
…
…
31.1
221 022
…
…
12 239
…
…
19.8
…
…
…
…
…
…
./.
80 980
…
…
4 979
…
…
26.1
ISCED 0 ISCED 1 ISCED 2+3 ISCED 4 ISCED 5+6
1. Data refer to 1996. In that year, pre-primary programmes were of one year's duration.2. Data refer to 1997.3. Data for level 0 are included in level 1.4. Data for level 4 are included in levels 2 and 3.
Not allocated: 23.1%.
Distribution of publicexpenditure on ed. (%)
General information
3 4432
76 2 767
1.6
219291
Balboa 3 026
5.016.3
0 Preprimaria
0 Educación inicial
1 Educación básica primaria
3A 2o nivel de enseñanza media
2A Educación básica premedia
4A 3r nivel de enseñanza superior no universitaria
4B 3r nivel de enseñanza (posmedia) informática, técnicos científicos
5A UnivesitariaLicenciatura o calificación profesional
5B Universidad para estudios tecnológicosCertificado de técnico
6 Postgrado, Maestría, Doctorado
1 1 1 111
Age
Compulsory education
43210 5 6 7 8 9 10 11 12 13 14 15 16 17 18 19
3A3A3A2A2A2A000 6 665A5A5A5A
5B5B5B
4A
4B
4A
4B
1
1
1
0
100
200
300
400
500 GER: 105% 1
352 371
School-agepopulation 6-11 years
Enrolled pupilsin ISCED 1: all ages
(000)
0
20
40
60
80
100
120
GER
0 1 2+3 4 5+6
ISCED level of education
M
FMF
%
1
1. Data refer to 1996. In that year, pre-primary programmes were of one year's duration.
1. Data refer to 1996
Area in km2 (000): Total population (000): Average annual growth rate (%):Infant mortality rate (per 1 000 live births):Estimated literacy rate M (%):Estimated literacy rate F (%):National currency: GNP per capita (US$):Public expenditure on education as a % of GDP: of total government expenditure:
1. Data refer to 1997.
30
Latin America and the Caribbean regional report[ Section 1 - Regional background
Pupils of official school age (ISCED 1 and 2) as a percentageof the population in the same age group
Gross enrolment ratios (GER), enrolment, teaching staff and public expenditure on education
Structure of the education system according to ISCED97
Paraguay1998
Level of education
Enrolment MF
F
% F
MF
F
% F
Teachingstaff
112 694
56 134
50
4 188
3 818
92
./.
958 734
463 816
48
24 526
18 783
76
49.2
367 567
185 448
50
21 052
13 120
62
28.8
.
.
.
.
.
.
.
13 921
10 192
…
1 135
846
…
21.5
ISCED 0 ISCED 1 ISCED 2+3 ISCED 4 ISCED 5+6
1. Full-time teachers only.2. Level 5B only.3. Data for level 0 are included in level 1.
Not allocated: 0.5%
Distribution of publicexpenditure on ed. (%)
General information
2
2
2
2
1
1
1
1
3
1
1
3
407 5 222
2.6
399496
Guaraní 1 806
4.520.2
5A UniversitariaLicenciatura
5B Superior no universitaria
6 PostgradoDoctorado, Maestría
0 Preprimaria
1 Primaria
3C Bachillerato técnico
2B Secundaria técnica básica
3A Bachillerato humanístico científico
2A Secundaria básica
1 1 1 111
Age
Compulsory education
43210 5 6 7 8 9 10 11 12 13 14 15 16 17 18
3A3A3A2A2A2A000
2B 2B2B
3C 3C3C
665A5A5A5A
5B5B5B
Enrolled pupils aged 6-14 years: 89%
Population aged 6-14 years: 1 210 000
0
20
40
60
80
100
120
GER
0 1 2+3 4 5+6
ISCED level of education
M
FMF
%
Area in km2 (000): Total population (000): Average annual growth rate (%):Infant mortality rate (per 1 000 live births):Estimated literacy rate M (%):Estimated literacy rate F (%):National currency: GNP per capita (US$):Public expenditure on education as a % of GDP: of total government expenditure:
31
Latin America and the Caribbean regional report [ Section 1 - Regional background
5A TerciariaLicenciatura, Maestría
5B Terciaria no universitario
6 Doctorado
Pupils of official school age (ISCED 1 and 2) as a percentageof the population in the same age group
Gross enrolment ratios (GER), enrolment, teaching staff and public expenditure on education
Structure of the education system according to ISCED97
Peru1998
Level of education
Enrolment MF
F
% F
MF
F
% F
Teachingstaff
1 037 297
516 039
50
35 195
33 914
96
9.8
4 299 407
2 101 702
49
170 162
101 492
60
40.3
2 212 033
1 059 300
48
128 412
52 573
41
29.6
.
.
.
.
.
.
.
734 392
185 508
25
54 477
7 543
…
20.3
ISCED 0 ISCED 1 ISCED 2+3 ISCED 4 ISCED 5+6
1. Level 5B only.
Distribution of publicexpenditure on ed. (%)
General information
1
1 285 24 797
1.7
459484Sol
2 293
3.222.3
0 Preprimaria
1 Primaria
3A Secundaria segundo nivel
2A Secundaria primer nivel
Secundaria segundo nivel técnico3B
Population aged 6-14 years: 5 059 000
Enrolled pupils aged 6-14 years: 97%
1 1 1 111
Age
Compulsory education
43210 5 6 7 8 9 10 11 12 13 14 15 16 17
3A3A2A2A2A000
3B3B
6 6 6 665A5A5A5A5A
5B5B5B
0
40
20
60
80
100
120
140
GER
0 1 2+3 4 5+6
ISCED level of education
M
FMF
%
Area in km2 (000): Total population (000): Average annual growth rate (%):Infant mortality rate (per 1 000 live births):Estimated literacy rate M (%):Estimated literacy rate F (%):National currency: GNP per capita (US$):Public expenditure on education as a % of GDP: of total government expenditure:
32
Latin America and the Caribbean regional report[ Section 1 - Regional background
5A Educación universitariaLicenciatura
5B Educación universitariaTecnólogo o certificado superior
6 Maestría, Doctorado
Pupils of official school age (ISCED 1 and 2) as a percentageof the population in the same age group
Gross enrolment ratios (GER), enrolment, teaching staff and public expenditure on education
Structure of the education system according to ISCED97
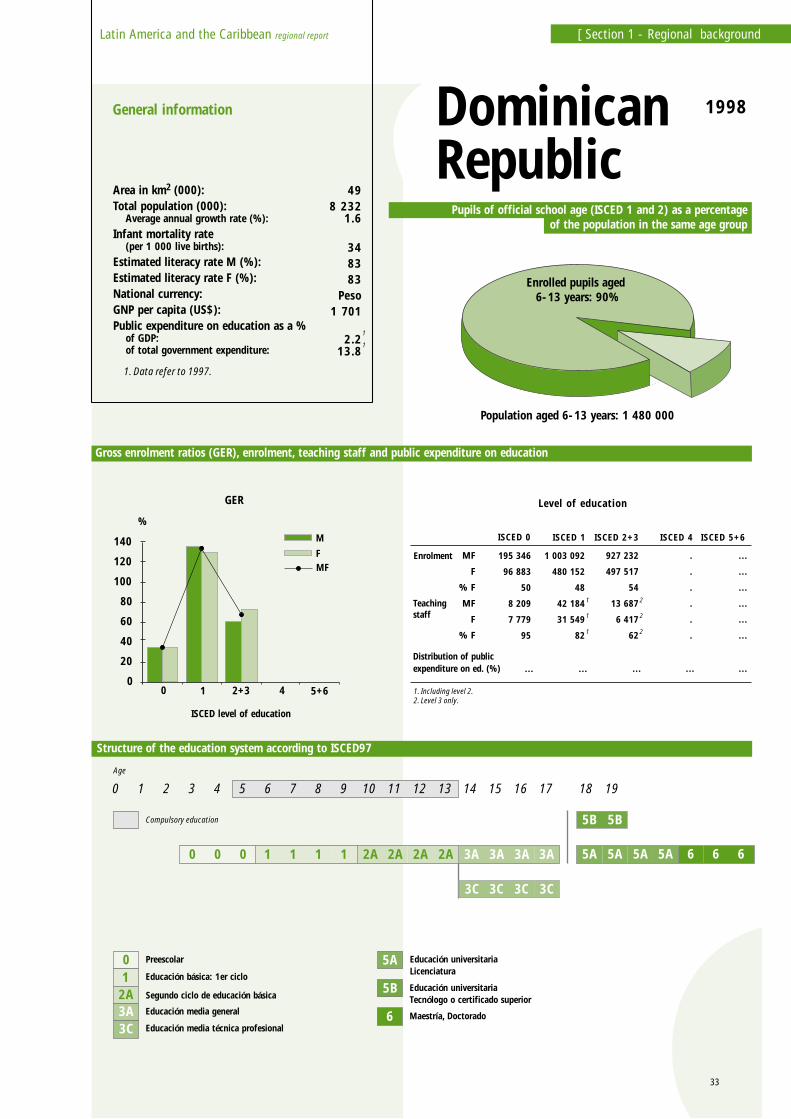
DominicanRepublic
1998
Level of education
Enrolment MF
F
% F
MF
F
% F
Teachingstaff
195 346
96 883
50
8 209
7 779
95
…
1 003 092
480 152
48
42 184
31 549
82
…
927 232
497 517
54
13 687
6 417
62
…
.
.
.
.
.
.
…
…
…
…
…
…
…
…
ISCED 0 ISCED 1 ISCED 2+3 ISCED 4 ISCED 5+6
1. Including level 2. 2. Level 3 only.
Distribution of publicexpenditure on ed. (%)
General information
2
2
2
1
1
1
49 8 232
1.6
348383
Peso 1 701
2.213.8
0 Preescolar
1 Educación básica: 1er ciclo
3A Educación media general
2A Segundo ciclo de educación básica
Educación media técnica profesional3C
1 1 1 1
Age
Compulsory education
43210 5 6 7 8 9 10 11 12 13 14 15 16 17 18 19
3A3A3A3A2A2A2A2A000
3C 3C 3C3C
6 665A5A5A5A
5B5B
1
1
0
20
40
60
80
100
120
140
GER
0 1 2+3 4 5+6
ISCED level of education
M
FMF
%
Enrolled pupils aged 6-13 years: 90%
Population aged 6-13 years: 1 480 000
Area in km2 (000): Total population (000): Average annual growth rate (%):Infant mortality rate (per 1 000 live births):Estimated literacy rate M (%):Estimated literacy rate F (%):National currency: GNP per capita (US$):Public expenditure on education as a % of GDP: of total government expenditure:
1. Data refer to 1997.
33
Latin America and the Caribbean regional report [ Section 1 - Regional background
5A Licenciatura, Ingeniero, Arquitecto, Doctor en medicina
5B Formación de docentes, Técnicos
6 Doctorado
Pupils of official school age (ISCED 1 and 2) as a percentageof the population in the same age group
Gross enrolment ratios (GER), enrolment, teaching staff and public expenditure on education
Structure of the education system according to ISCED97
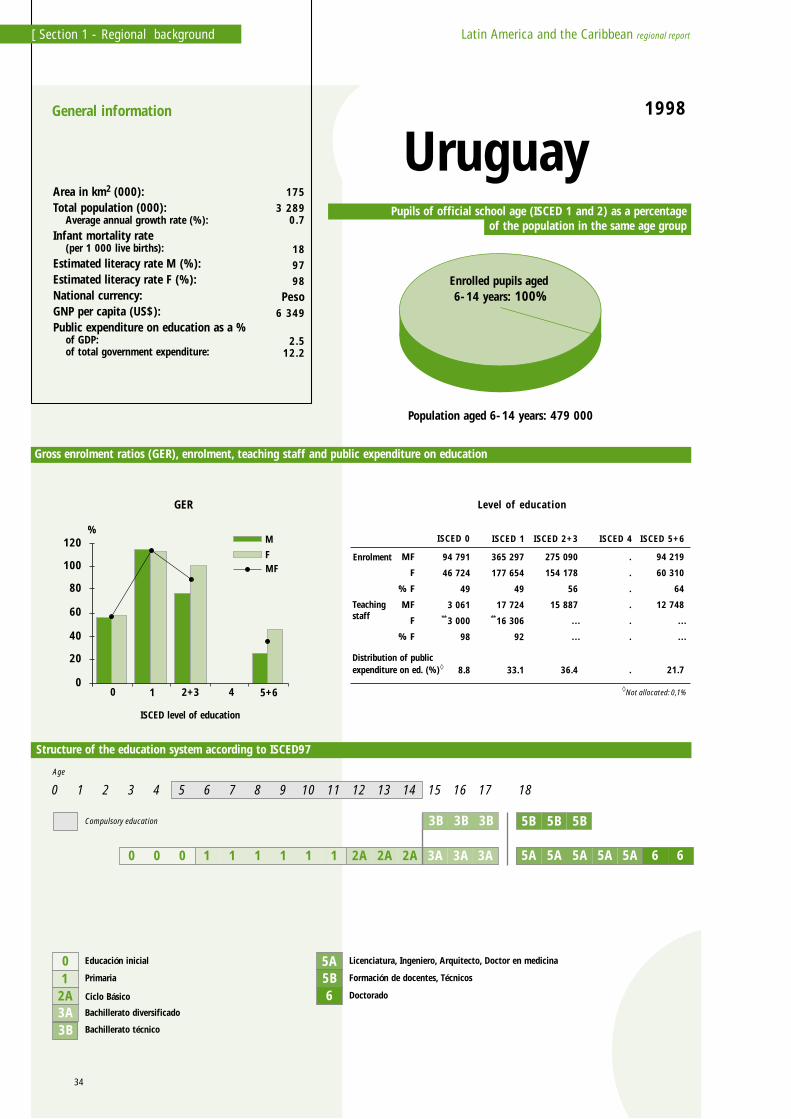
Uruguay1998
Level of education
Enrolment MF
F
% F
MF
F
% F
Teachingstaff
94 791
46 724
49
3 061
3 000
98
8.8
365 297
177 654
49
17 724
16 306
92
33.1
275 090
154 178
56
15 887
…
…
36.4
.
.
.
.
.
.
.
94 219
60 310
64
12 748
…
…
21.7
ISCED 0 ISCED 1 ISCED 2+3 ISCED 4 ISCED 5+6
Not allocated: 0,1%
Distribution of publicexpenditure on ed. (%)
General information
** **
175 3 289
0.7
189798
Peso 6 349
2.512.2
0 Educación inicial
1 Primaria
3A Bachillerato diversificado
2A Ciclo Básico
Bachillerato técnico3B
1 1 1 111
Age
Compulsory education
43210 5 6 7 8 9 10 11 12 13 14 15 16 17 18
3A3A3A2A2A2A000
3B 3B 3B
665A5A5A5A5A
5B5B5B
0
20
40
60
80
100
120
GER
0 1 2+3 4 5+6
ISCED level of education
M
FMF
%
Population aged 6-14 years: 479 000
Enrolled pupils aged 6-14 years: 100%
Area in km2 (000): Total population (000): Average annual growth rate (%):Infant mortality rate (per 1 000 live births):Estimated literacy rate M (%):Estimated literacy rate F (%):National currency: GNP per capita (US$):Public expenditure on education as a % of GDP: of total government expenditure:
34
Latin America and the Caribbean regional report[ Section 1 - Regional background

5A Licenciatura, Medicina, Ingeniería
5B Técnico superior
6 Maestría, Doctorado, Especialización
Pupils of official school age (ISCED 1 and 2) as a percentageof the population in the same age group
Gross enrolment ratios (GER), enrolment, teaching staff and public expenditure on education
Structure of the education system according to ISCED97
Venezuela1999
Level of education
Enrolment MF
F
% F
MF
F
% F
Teachingstaff
800 885
395 630
49
…
…
…
…
3 328 067
1 614 921
49
…
…
…
…
1 522 225
813 137
53
…
…
…
…
.
.
.
.
.
.
.
668 109
391 644
59
…
…
…
…
ISCED 0 ISCED 1 ISCED 2+3 ISCED 4 ISCED 5+6
Distribution of publicexpenditure on ed. (%)
General information
912 23 706
2.0
219391
Bolívar 3 166
……
0 Preprimaria
Programas no convencionales
1 Básica primera y segunda etapa
3A Media, Media profesional
2A Básica tercera etapa
1 1 1 111
Age
Compulsory education
43210 5 6 7 8 9 10 11 12 13 14 15 16 17 18 19
3A3A2A2A2A000 6 665A5A5A5A5A
5B5B5B
4A
4B
Enrolled pupils aged 6-14 years: 86%
Population aged 6-14 years: 4 636 000
0
20
40
60
80
100
120
GER
0 1 2+3 4 5+6
ISCED level of education
M
FMF
%
Area in km2 (000): Total population (000): Average annual growth rate (%):Infant mortality rate (per 1 000 live births):Estimated literacy rate M (%):Estimated literacy rate F (%):National currency: GNP per capita (US$):Public expenditure on education as a % of GDP: of total government expenditure:
35
Latin America and the Caribbean regional report [ Section 1 - Regional background
36
50
40
30
20
10
0
Sect
ion
2 - A
cces
s and
par
ticip
atio
nby
leve
l of e
duca
tion
Latin
Am
eric
a an
d th
e Ca
ribbe
anre
gion
al re
port
UIS
Educationstatistics 2001
2.1 Pre-primary education (ISCED 0)and other early childhood developmentprogrammes (Other ECD)
Pre-primary education (ISCED 0)constitutes, along with the other earlychildhood development programmes,
the first step on the long educational pathand the first contact with the formaleducation system. The nationalrepresentatives who attended the regionalworkshops organised by the UIS in 2000 and2001 emphasised the priority need to increasechildren's participation in pre-primaryeducation. Early childhood care anddevelopment and the access to pre-primaryeducation are key to preparing children forbasic education and introducing them to thesocialisation process. High pre-primaryenrolment ratios usually lead to higherenrolment levels in primary education andprovide an opportunity to implement jointprogrammes promoting children's welfare,health and nutrition. Pre-primary educationis generally well-developed in Latin America.Nevertheless, the workshop participantspointed out the need to expand coverage andaccess to pre-primary education indisadvantaged areas as well as amongstindigenous populations.
Pre-primary education (ISCED 0)
Great diversity in pre-primary programmesand levels of participation
There exists a great variety in the duration offormal pre-primary educational programmesin Latin America, ranging from a six-yearduration in Cuba (age 0 to 5) to a single yearin Costa Rica, Ecuador, Nicaragua and
Access andparticipation by
level of education
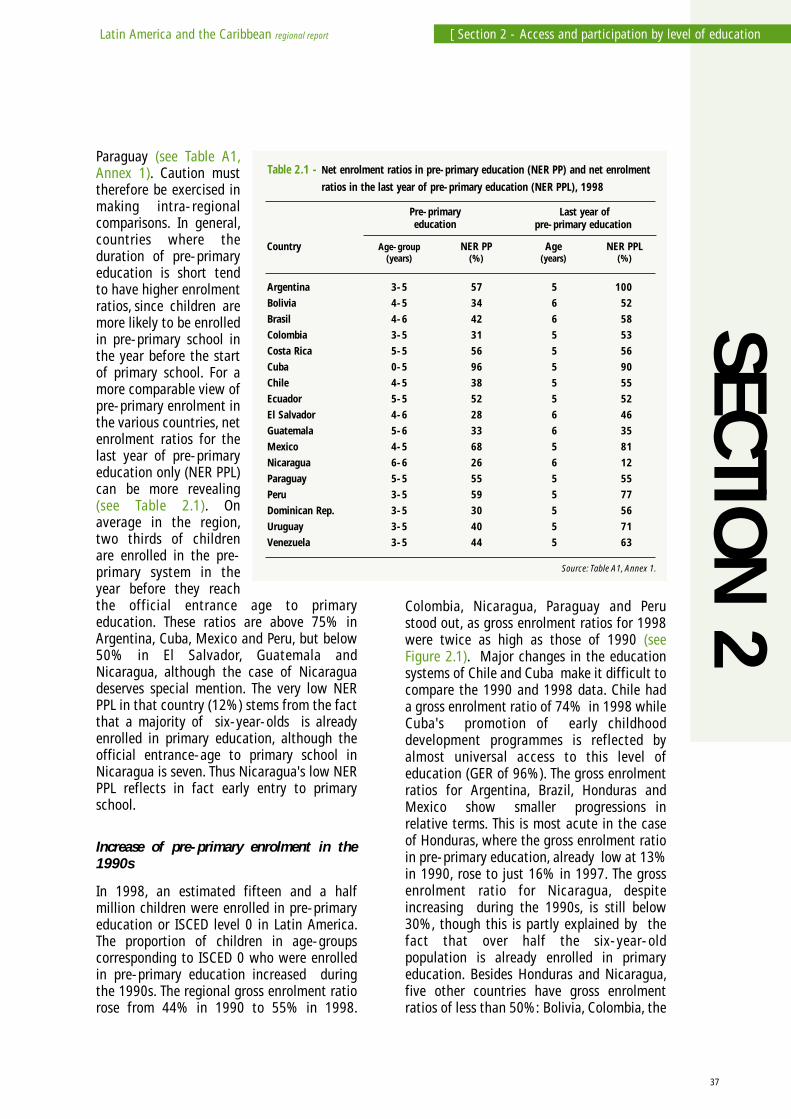
SECTION
2
37
Latin America and the Caribbean regional report [ Section 2 - Access and participation by level of education
Paraguay (see Table A1,Annex 1). Caution musttherefore be exercised inmaking intra-regionalcomparisons. In general,countries where theduration of pre-primaryeducation is short tendto have higher enrolmentratios, since children aremore likely to be enrolledin pre-primary school inthe year before the startof primary school. For amore comparable view ofpre-primary enrolment inthe various countries, netenrolment ratios for thelast year of pre-primaryeducation only (NER PPL)can be more revealing(see Table 2.1). Onaverage in the region,two thirds of childrenare enrolled in the pre-primary system in theyear before they reachthe official entrance age to primaryeducation. These ratios are above 75% inArgentina, Cuba, Mexico and Peru, but below50% in El Salvador, Guatemala andNicaragua, although the case of Nicaraguadeserves special mention. The very low NERPPL in that country (12%) stems from the factthat a majority of six-year-olds is alreadyenrolled in primary education, although theofficial entrance-age to primary school inNicaragua is seven. Thus Nicaragua's low NERPPL reflects in fact early entry to primaryschool.
Increase of pre-primary enrolment in the1990s
In 1998, an estimated fifteen and a halfmillion children were enrolled in pre-primaryeducation or ISCED level 0 in Latin America.The proportion of children in age-groupscorresponding to ISCED 0 who were enrolledin pre-primary education increased duringthe 1990s. The regional gross enrolment ratiorose from 44% in 1990 to 55% in 1998.
Colombia, Nicaragua, Paraguay and Perustood out, as gross enrolment ratios for 1998were twice as high as those of 1990 (seeFigure 2.1). Major changes in the educationsystems of Chile and Cuba make it difficult tocompare the 1990 and 1998 data. Chile hada gross enrolment ratio of 74% in 1998 whileCuba's promotion of early childhooddevelopment programmes is reflected byalmost universal access to this level ofeducation (GER of 96%). The gross enrolmentratios for Argentina, Brazil, Honduras andMexico show smaller progressions inrelative terms. This is most acute in the caseof Honduras, where the gross enrolment ratioin pre-primary education, already low at 13%in 1990, rose to just 16% in 1997. The grossenrolment ratio for Nicaragua, despiteincreasing during the 1990s, is still below30%, though this is partly explained by thefact that over half the six-year-oldpopulation is already enrolled in primaryeducation. Besides Honduras and Nicaragua,five other countries have gross enrolmentratios of less than 50%: Bolivia, Colombia, the
Argentina 3-5 57 5 100Bolivia 4-5 34 6 52Brasil 4-6 42 6 58Colombia 3-5 31 5 53Costa Rica 5-5 56 5 56Cuba 0-5 96 5 90Chile 4-5 38 5 55Ecuador 5-5 52 5 52El Salvador 4-6 28 6 46Guatemala 5-6 33 6 35Mexico 4-5 68 5 81Nicaragua 6-6 26 6 12Paraguay 5-5 55 5 55Peru 3-5 59 5 77Dominican Rep. 3-5 30 5 56Uruguay 3-5 40 5 71Venezuela 3-5 44 5 63
Country Age-group NER PP Age NER PPL(years) (%) (years) (%)
Table 2.1 - Net enrolment ratios in pre-primary education (NER PP) and net enrolment ratios in the last year of pre-primary education (NER PPL), 1998
Pre-primaryeducation
Last year ofpre-primary education
Source: Table A1, Annex 1.
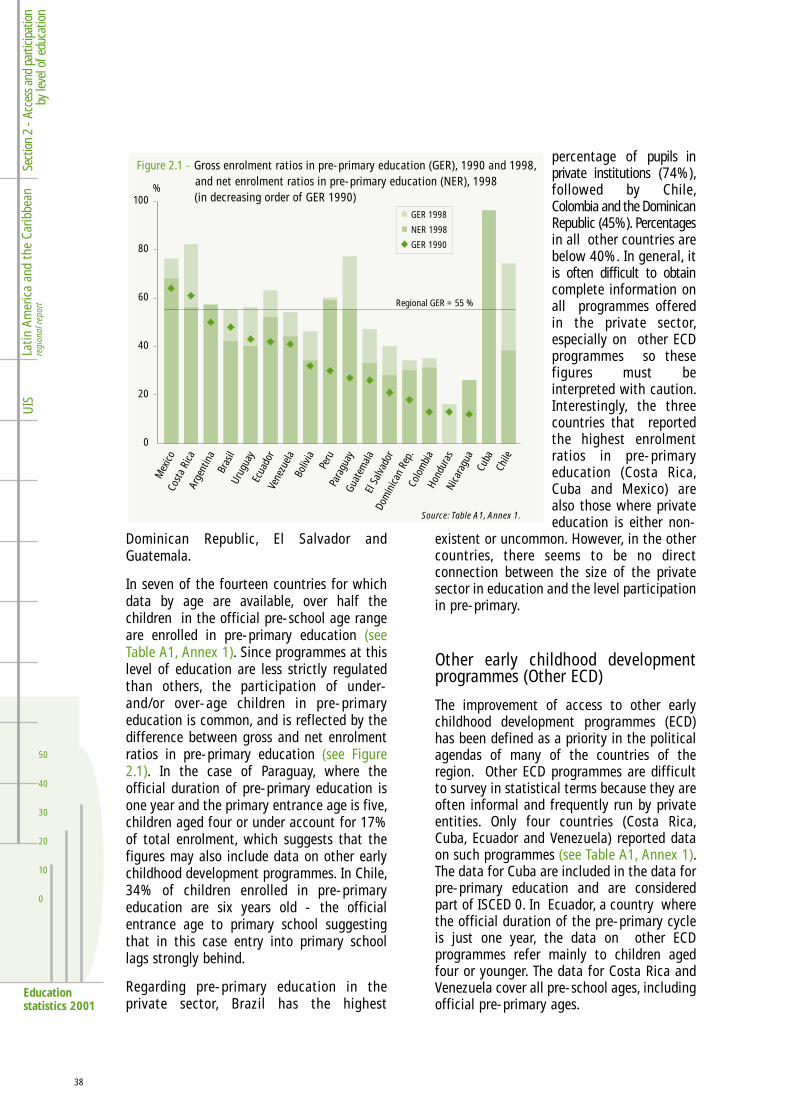
38
50
40
30
20
10
0
Sect
ion
2 - A
cces
s and
par
ticip
atio
nby
leve
l of e
duca
tion
Latin
Am
eric
a an
d th
e Ca
ribbe
anre
gion
al re
port
UIS
Educationstatistics 2001
percentage of pupils inprivate institutions (74%),followed by Chile,Colombia and the DominicanRepublic (45%). Percentagesin all other countries arebelow 40%. In general, itis often difficult to obtaincomplete information onall programmes offeredin the private sector,especially on other ECDprogrammes so thesefigures must beinterpreted with caution.Interestingly, the threecountries that reportedthe highest enrolmentratios in pre-primaryeducation (Costa Rica,Cuba and Mexico) arealso those where privateeducation is either non-
existent or uncommon. However, in the othercountries, there seems to be no directconnection between the size of the privatesector in education and the level participationin pre-primary.
Other early childhood developmentprogrammes (Other ECD)
The improvement of access to other earlychildhood development programmes (ECD)has been defined as a priority in the politicalagendas of many of the countries of theregion. Other ECD programmes are difficultto survey in statistical terms because they areoften informal and frequently run by privateentities. Only four countries (Costa Rica,Cuba, Ecuador and Venezuela) reported dataon such programmes (see Table A1, Annex 1).The data for Cuba are included in the data forpre-primary education and are consideredpart of ISCED 0. In Ecuador, a country wherethe official duration of the pre-primary cycleis just one year, the data on other ECDprogrammes refer mainly to children agedfour or younger. The data for Costa Rica andVenezuela cover all pre-school ages, includingofficial pre-primary ages.
Dominican Republic, El Salvador andGuatemala.
In seven of the fourteen countries for whichdata by age are available, over half thechildren in the official pre-school age rangeare enrolled in pre-primary education (seeTable A1, Annex 1). Since programmes at thislevel of education are less strictly regulatedthan others, the participation of under-and/or over-age children in pre-primaryeducation is common, and is reflected by thedifference between gross and net enrolmentratios in pre-primary education (see Figure2.1). In the case of Paraguay, where theofficial duration of pre-primary education isone year and the primary entrance age is five,children aged four or under account for 17%of total enrolment, which suggests that thefigures may also include data on other earlychildhood development programmes. In Chile,34% of children enrolled in pre-primaryeducation are six years old - the officialentrance age to primary school suggestingthat in this case entry into primary schoollags strongly behind.
Regarding pre-primary education in theprivate sector, Brazil has the highest
0
20
40
60
80
100
abuC
elihC
augaraciNsarudnoHaib
moloC.peR
nacinimoD
rodavlaSlEala
metauGyaugaraPurePaiviloBaleuzeneVrodaucEyaugurUlisarBanitnegrAaciR
atsoCocixe
MFigure 2.1 - Gross enrolment ratios in pre-primary education (GER), 1990 and 1998,
and net enrolment ratios in pre-primary education (NER), 1998 (in decreasing order of GER 1990)
Regional GER = 55 %
Source: Table A1, Annex 1.
GER 1998
NER 1998
GER 1990
%
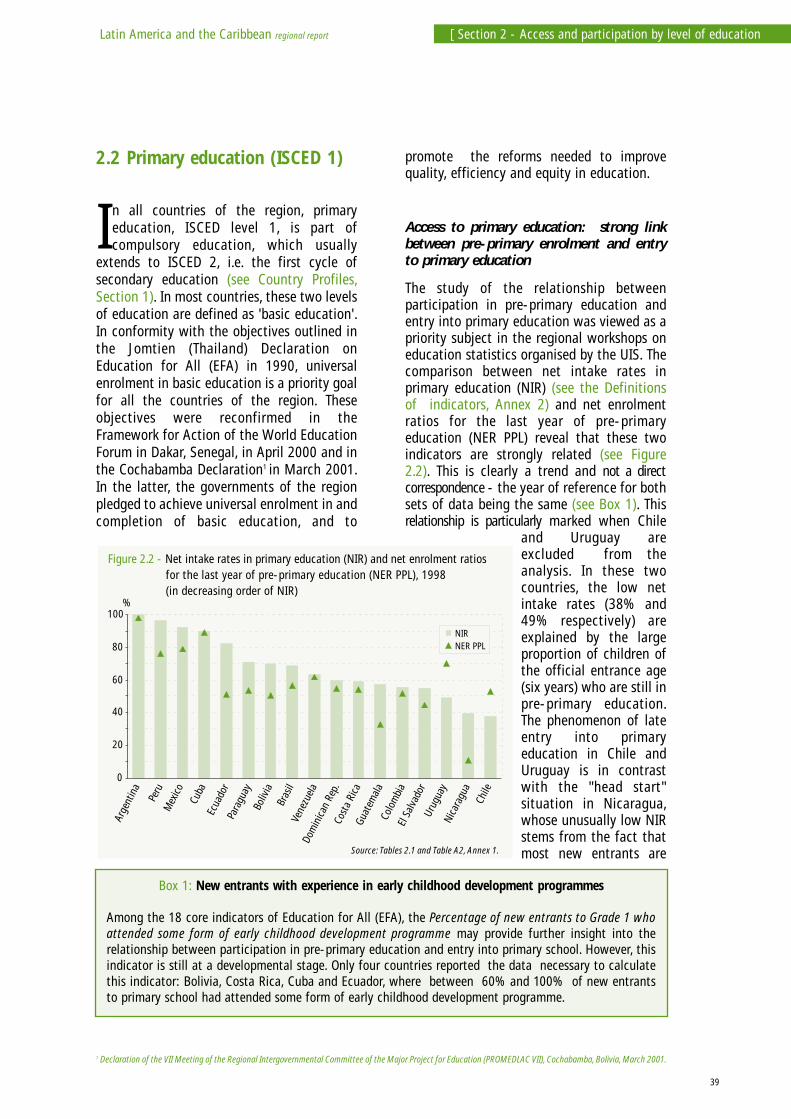
39
Latin America and the Caribbean regional report [ Section 2 - Access and participation by level of education
2.2 Primary education (ISCED 1)
In all countries of the region, primaryeducation, ISCED level 1, is part ofcompulsory education, which usually
extends to ISCED 2, i.e. the first cycle ofsecondary education (see Country Profiles,Section 1). In most countries, these two levelsof education are defined as 'basic education'.In conformity with the objectives outlined inthe Jomtien (Thailand) Declaration onEducation for All (EFA) in 1990, universalenrolment in basic education is a priority goalfor all the countries of the region. Theseobjectives were reconfirmed in theFramework for Action of the World EducationForum in Dakar, Senegal, in April 2000 and inthe Cochabamba Declaration1 in March 2001.In the latter, the governments of the regionpledged to achieve universal enrolment in andcompletion of basic education, and to
1 Declaration of the VII Meeting of the Regional Intergovernmental Committee of the Major Project for Education (PROMEDLAC VII), Cochabamba, Bolivia, March 2001.
promote the reforms needed to improvequality, efficiency and equity in education.
Access to primary education: strong linkbetween pre-primary enrolment and entryto primary education
The study of the relationship betweenparticipation in pre-primary education andentry into primary education was viewed as apriority subject in the regional workshops oneducation statistics organised by the UIS. Thecomparison between net intake rates inprimary education (NIR) (see the Definitionsof indicators, Annex 2) and net enrolmentratios for the last year of pre-primaryeducation (NER PPL) reveal that these twoindicators are strongly related (see Figure2.2). This is clearly a trend and not a directcorrespondence - the year of reference for bothsets of data being the same (see Box 1). Thisrelationship is particularly marked when Chile
and Uruguay areexcluded from theanalysis. In these twocountries, the low netintake rates (38% and49% respectively) areexplained by the largeproportion of children ofthe official entrance age(six years) who are still inpre-primary education.The phenomenon of lateentry into primaryeducation in Chile andUruguay is in contrastwith the "head start"situation in Nicaragua,whose unusually low NIRstems from the fact thatmost new entrants are
Box 1: New entrants with experience in early childhood development programmes
Among the 18 core indicators of Education for All (EFA), the Percentage of new entrants to Grade 1 whoattended some form of early childhood development programme may provide further insight into therelationship between participation in pre-primary education and entry into primary school. However, thisindicator is still at a developmental stage. Only four countries reported the data necessary to calculatethis indicator: Bolivia, Costa Rica, Cuba and Ecuador, where between 60% and 100% of new entrantsto primary school had attended some form of early childhood development programme.
0
20
40
60
80
100%
NIRNER PPL
augaraciN
elihC
yaugurUrodavlaSlEaib
moloCala
metauGaciR
atsoC.peR
nacinimoD
aleuzeneVlisarBaiviloByaugaraProdaucEabuCocixe
MureP
anitnegrA
Figure 2.2 - Net intake rates in primary education (NIR) and net enrolment ratios for the last year of pre-primary education (NER PPL), 1998 (in decreasing order of NIR)
Source: Tables 2.1 and Table A2, Annex 1.
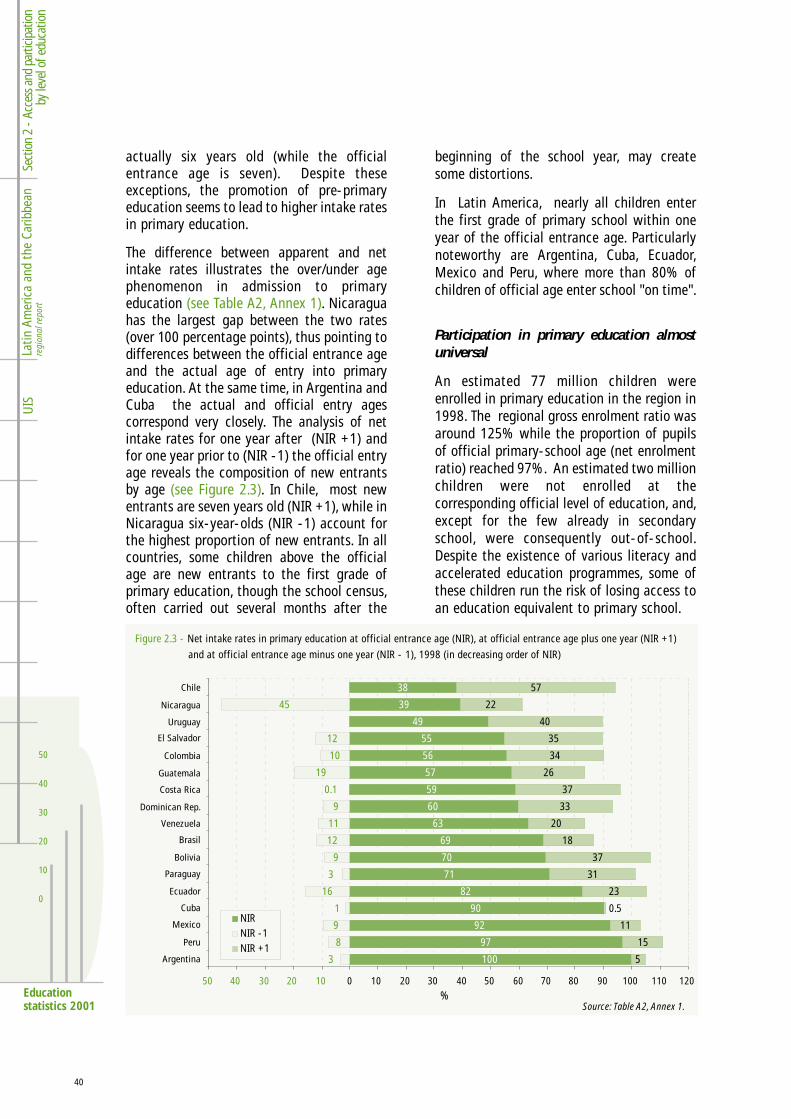
40
50
40
30
20
10
0
Sect
ion
2 - A
cces
s and
par
ticip
atio
nby
leve
l of e
duca
tion
Latin
Am
eric
a an
d th
e Ca
ribbe
anre
gion
al re
port
UIS
Educationstatistics 2001
actually six years old (while the officialentrance age is seven). Despite theseexceptions, the promotion of pre-primaryeducation seems to lead to higher intake ratesin primary education.
The difference between apparent and netintake rates illustrates the over/under agephenomenon in admission to primaryeducation (see Table A2, Annex 1). Nicaraguahas the largest gap between the two rates(over 100 percentage points), thus pointing todifferences between the official entrance ageand the actual age of entry into primaryeducation. At the same time, in Argentina andCuba the actual and official entry agescorrespond very closely. The analysis of netintake rates for one year after (NIR +1) andfor one year prior to (NIR -1) the official entryage reveals the composition of new entrantsby age (see Figure 2.3). In Chile, most newentrants are seven years old (NIR +1), while inNicaragua six-year-olds (NIR -1) account forthe highest proportion of new entrants. In allcountries, some children above the officialage are new entrants to the first grade ofprimary education, though the school census,often carried out several months after the
beginning of the school year, may createsome distortions.
In Latin America, nearly all children enterthe first grade of primary school within oneyear of the official entrance age. Particularlynoteworthy are Argentina, Cuba, Ecuador,Mexico and Peru, where more than 80% ofchildren of official age enter school "on time".
Participation in primary education almostuniversal
An estimated 77 million children wereenrolled in primary education in the region in1998. The regional gross enrolment ratio wasaround 125% while the proportion of pupilsof official primary-school age (net enrolmentratio) reached 97%. An estimated two millionchildren were not enrolled at thecorresponding official level of education, and,except for the few already in secondaryschool, were consequently out-of-school.Despite the existence of various literacy andaccelerated education programmes, some ofthese children run the risk of losing access toan education equivalent to primary school.
Source: Table A2, Annex 1.
Chile
Nicaragua
Uruguay
El Salvador
Colombia
Guatemala
Costa Rica
Dominican Rep.
Venezuela
Brasil
Bolivia
Paraguay
Ecuador
Cuba
Mexico
Peru
Argentina
%
Figure 2.3 - Net intake rates in primary education at official entrance age (NIR), at official entrance age plus one year (NIR +1)
and at official entrance age minus one year (NIR - 1), 1998 (in decreasing order of NIR)
NIRNIR -1NIR +1
50 40 30 20 10 0 10 20 30 40 50 60 70 80 90 100 110 120
38
45 22
57
39
56
55
49
10
12
34
35
40
59
5719
37
26
0.1
63
60
11
9
20
33
71
70
69
9
12
31
37
18
3
100
97
92
90
82
8
9
16
5
15
11
0.5
23
3
1
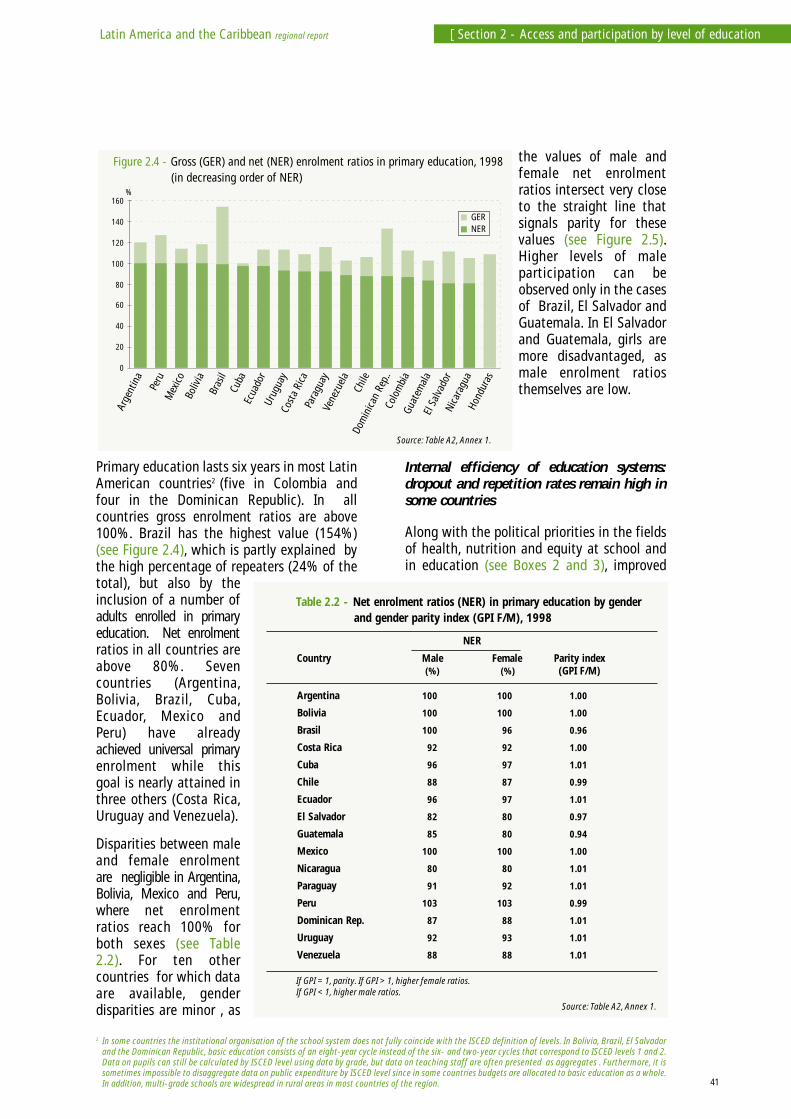
41
Latin America and the Caribbean regional report [ Section 2 - Access and participation by level of education
Primary education lasts six years in most LatinAmerican countries2 (five in Colombia andfour in the Dominican Republic). In allcountries gross enrolment ratios are above100%. Brazil has the highest value (154%)(see Figure 2.4), which is partly explained bythe high percentage of repeaters (24% of thetotal), but also by theinclusion of a number ofadults enrolled in primaryeducation. Net enrolmentratios in all countries areabove 80%. Sevencountries (Argentina,Bolivia, Brazil, Cuba,Ecuador, Mexico andPeru) have alreadyachieved universal primaryenrolment while thisgoal is nearly attained inthree others (Costa Rica,Uruguay and Venezuela).
Disparities between maleand female enrolmentare negligible in Argentina,Bolivia, Mexico and Peru,where net enrolmentratios reach 100% forboth sexes (see Table2.2). For ten othercountries for which dataare available, genderdisparities are minor , as
the values of male andfemale net enrolmentratios intersect very closeto the straight line thatsignals parity for thesevalues (see Figure 2.5).Higher levels of maleparticipation can beobserved only in the casesof Brazil, El Salvador andGuatemala. In El Salvadorand Guatemala, girls aremore disadvantaged, asmale enrolment ratiosthemselves are low.
Internal efficiency of education systems:dropout and repetition rates remain high insome countries
Along with the political priorities in the fieldsof health, nutrition and equity at school andin education (see Boxes 2 and 3), improved
0
20
40
60
80
100
120
140
160%
GERNER
Figure 2.4 - Gross (GER) and net (NER) enrolment ratios in primary education, 1998(in decreasing order of NER)
Source: Table A2, Annex 1. rodavlaSlE
augaraciN
sarudnoH
alametauG
aibmoloC
..peRnacini
moDelihCaleuzeneVyaugaraPaciR
atsoCyaugurUrodaucEabuClisarBaiviloBocixe
MureP
anitnegrA
Argentina 100 100 1.00
Bolivia 100 100 1.00
Brasil 100 96 0.96
Costa Rica 92 92 1.00
Cuba 96 97 1.01
Chile 88 87 0.99
Ecuador 96 97 1.01
El Salvador 82 80 0.97
Guatemala 85 80 0.94
Mexico 100 100 1.00
Nicaragua 80 80 1.01
Paraguay 91 92 1.01
Peru 103 103 0.99
Dominican Rep. 87 88 1.01
Uruguay 92 93 1.01
Venezuela 88 88 1.01
Country Male Female Parity index(%) (%) (GPI F/M)
Table 2.2 - Net enrolment ratios (NER) in primary education by gender and gender parity index (GPI F/M), 1998
NER
If GPI = 1, parity. If GPI > 1, higher female ratios. If GPI < 1, higher male ratios.
Source: Table A2, Annex 1.
2 In some countries the institutional organisation of the school system does not fully coincide with the ISCED definition of levels. In Bolivia, Brazil, El Salvadorand the Dominican Republic, basic education consists of an eight-year cycle instead of the six- and two-year cycles that correspond to ISCED levels 1 and 2.Data on pupils can still be calculated by ISCED level using data by grade, but data on teaching staff are often presented as aggregates . Furthermore, it issometimes impossible to disaggregate data on public expenditure by ISCED level since in some countries budgets are allocated to basic education as a whole.In addition, multi-grade schools are widespread in rural areas in most countries of the region.
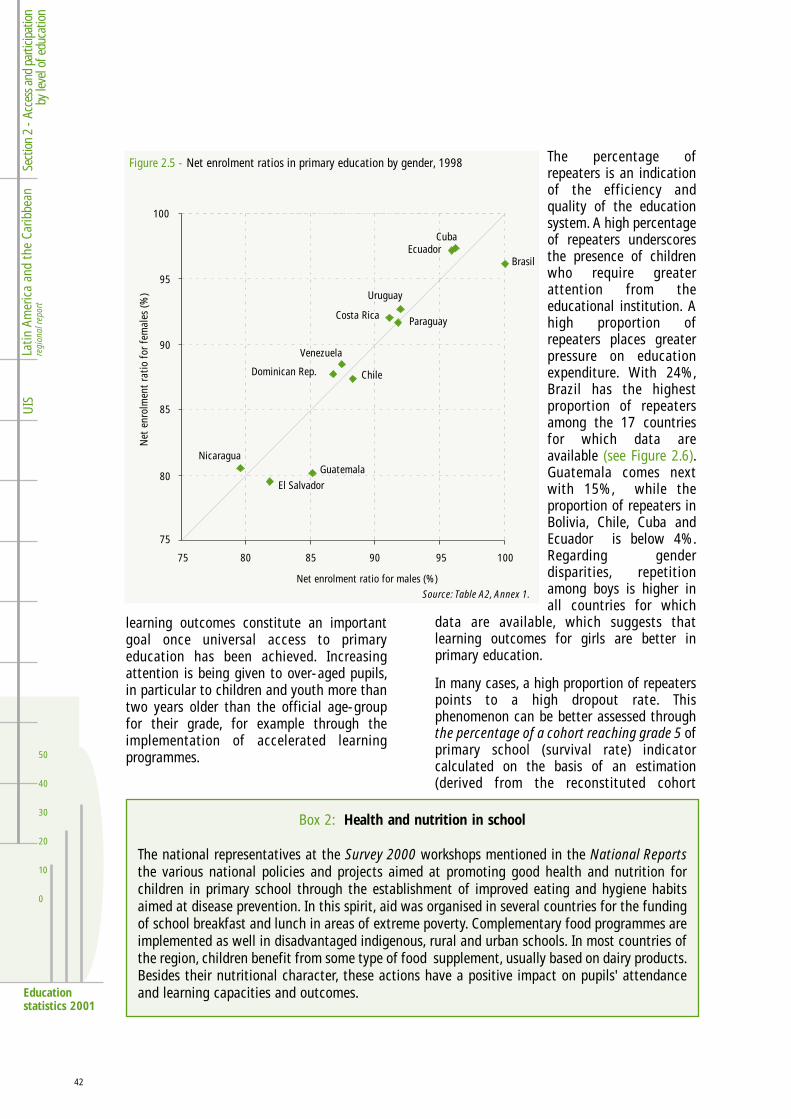
learning outcomes constitute an importantgoal once universal access to primaryeducation has been achieved. Increasingattention is being given to over-aged pupils,in particular to children and youth more thantwo years older than the official age-groupfor their grade, for example through theimplementation of accelerated learningprogrammes.
The percentage ofrepeaters is an indicationof the efficiency andquality of the educationsystem. A high percentageof repeaters underscoresthe presence of childrenwho require greaterattention from theeducational institution. Ahigh proportion ofrepeaters places greaterpressure on educationexpenditure. With 24%,Brazil has the highestproportion of repeatersamong the 17 countriesfor which data areavailable (see Figure 2.6).Guatemala comes nextwith 15%, while theproportion of repeaters inBolivia, Chile, Cuba andEcuador is below 4%.Regarding genderdisparities, repetitionamong boys is higher inall countries for which
data are available, which suggests thatlearning outcomes for girls are better inprimary education.
In many cases, a high proportion of repeaterspoints to a high dropout rate. Thisphenomenon can be better assessed throughthe percentage of a cohort reaching grade 5 ofprimary school (survival rate) indicatorcalculated on the basis of an estimation(derived from the reconstituted cohort
42
50
40
30
20
10
0
Sect
ion
2 - A
cces
s and
par
ticip
atio
nby
leve
l of e
duca
tion
Latin
Am
eric
a an
d th
e Ca
ribbe
anre
gion
al re
port
UIS
Educationstatistics 2001
100
95
90
85
80
75
75 80 85 90 95 100
Net enrolment ratio for males (%)
ParaguayCosta Rica
Uruguay
Chile
CubaEcuador
Dominican Rep.
Brasil
Venezuela
Nicaragua
El Salvador
Guatemala
Source: Table A2, Annex 1.
Net
enr
olm
ent
rati
o fo
r fe
mal
es (%
)
Figure 2.5 - Net enrolment ratios in primary education by gender, 1998
Box 2: Health and nutrition in school
The national representatives at the Survey 2000 workshops mentioned in the National Reportsthe various national policies and projects aimed at promoting good health and nutrition forchildren in primary school through the establishment of improved eating and hygiene habitsaimed at disease prevention. In this spirit, aid was organised in several countries for the fundingof school breakfast and lunch in areas of extreme poverty. Complementary food programmes areimplemented as well in disadvantaged indigenous, rural and urban schools. In most countries ofthe region, children benefit from some type of food supplement, usually based on dairy products.Besides their nutritional character, these actions have a positive impact on pupils' attendanceand learning capacities and outcomes.
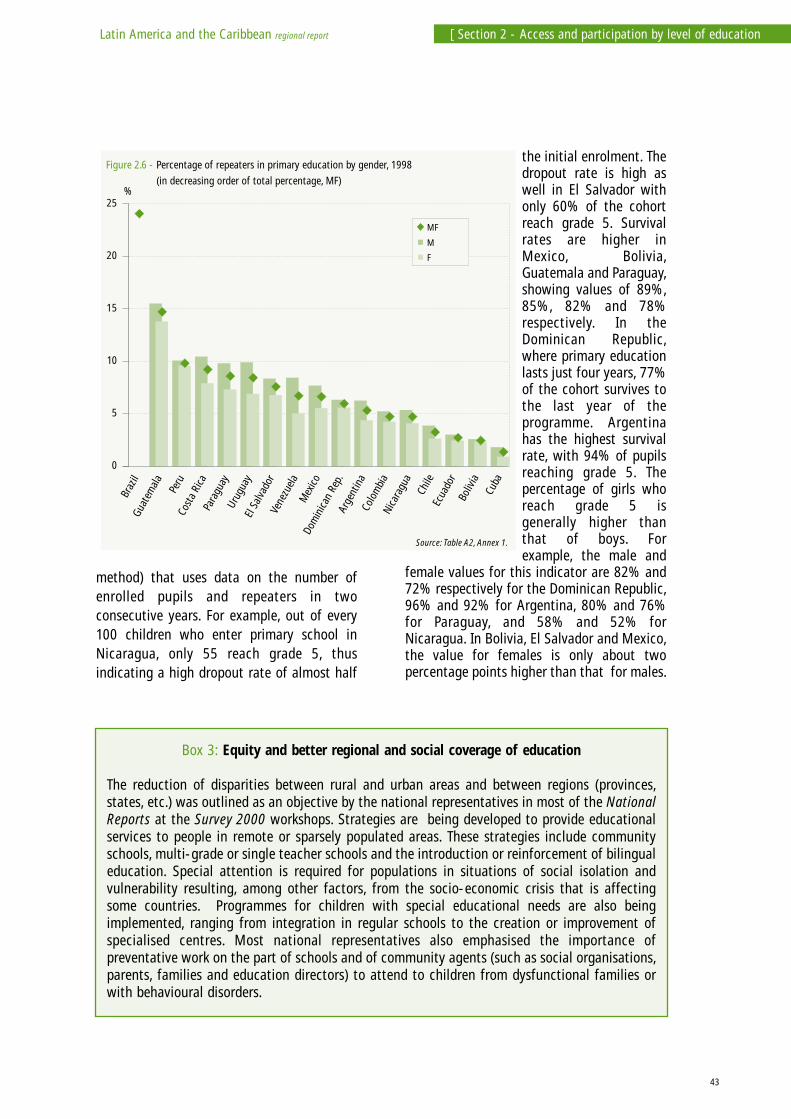
the initial enrolment. Thedropout rate is high aswell in El Salvador withonly 60% of the cohortreach grade 5. Survivalrates are higher inMexico, Bolivia,Guatemala and Paraguay,showing values of 89%,85%, 82% and 78%respectively. In theDominican Republic,where primary educationlasts just four years, 77%of the cohort survives tothe last year of theprogramme. Argentinahas the highest survivalrate, with 94% of pupilsreaching grade 5. Thepercentage of girls whoreach grade 5 isgenerally higher thanthat of boys. Forexample, the male and
female values for this indicator are 82% and72% respectively for the Dominican Republic,96% and 92% for Argentina, 80% and 76%for Paraguay, and 58% and 52% forNicaragua. In Bolivia, El Salvador and Mexico,the value for females is only about twopercentage points higher than that for males.
43
Latin America and the Caribbean regional report [ Section 2 - Access and participation by level of education
method) that uses data on the number ofenrolled pupils and repeaters in twoconsecutive years. For example, out of every100 children who enter primary school inNicaragua, only 55 reach grade 5, thusindicating a high dropout rate of almost half
Box 3: Equity and better regional and social coverage of education
The reduction of disparities between rural and urban areas and between regions (provinces,states, etc.) was outlined as an objective by the national representatives in most of the NationalReports at the Survey 2000 workshops. Strategies are being developed to provide educationalservices to people in remote or sparsely populated areas. These strategies include communityschools, multi-grade or single teacher schools and the introduction or reinforcement of bilingualeducation. Special attention is required for populations in situations of social isolation andvulnerability resulting, among other factors, from the socio-economic crisis that is affectingsome countries. Programmes for children with special educational needs are also beingimplemented, ranging from integration in regular schools to the creation or improvement ofspecialised centres. Most national representatives also emphasised the importance ofpreventative work on the part of schools and of community agents (such as social organisations,parents, families and education directors) to attend to children from dysfunctional families orwith behavioural disorders.
rodaucE
aiviloB
abuC
elihCaugaraciNaib
moloCanitnegrA.peR
nacinimoD
ocixeM
aleuzeneVrodavlaSlEyaugurUyaugaraPaciR
atsoCurePala
metauGlizarB
Figure 2.6 - Percentage of repeaters in primary education by gender, 1998
(in decreasing order of total percentage, MF)
Source: Table A2, Annex 1.
M
F
MF
%
0
5
10
15
20
25
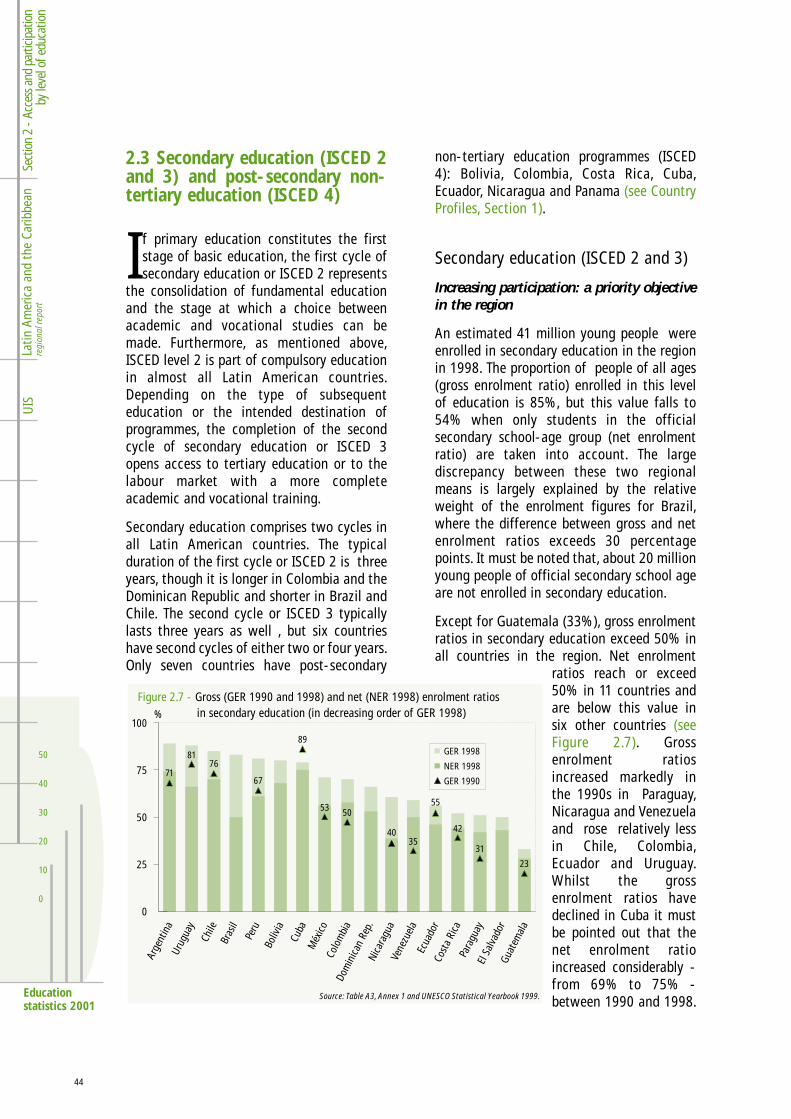
44
50
40
30
20
10
0
Sect
ion
2 - A
cces
s and
par
ticip
atio
nby
leve
l of e
duca
tion
Latin
Am
eric
a an
d th
e Ca
ribbe
anre
gion
al re
port
UIS
Educationstatistics 2001
2.3 Secondary education (ISCED 2and 3) and post-secondary non-tertiary education (ISCED 4)
If primary education constitutes the firststage of basic education, the first cycle ofsecondary education or ISCED 2 represents
the consolidation of fundamental educationand the stage at which a choice betweenacademic and vocational studies can bemade. Furthermore, as mentioned above,ISCED level 2 is part of compulsory educationin almost all Latin American countries.Depending on the type of subsequenteducation or the intended destination ofprogrammes, the completion of the secondcycle of secondary education or ISCED 3opens access to tertiary education or to thelabour market with a more completeacademic and vocational training.
Secondary education comprises two cycles inall Latin American countries. The typicalduration of the first cycle or ISCED 2 is threeyears, though it is longer in Colombia and theDominican Republic and shorter in Brazil andChile. The second cycle or ISCED 3 typicallylasts three years as well , but six countrieshave second cycles of either two or four years.Only seven countries have post-secondary
non-tertiary education programmes (ISCED4): Bolivia, Colombia, Costa Rica, Cuba,Ecuador, Nicaragua and Panama (see CountryProfiles, Section 1).
Secondary education (ISCED 2 and 3)
Increasing participation: a priority objectivein the region
An estimated 41 million young people wereenrolled in secondary education in the regionin 1998. The proportion of people of all ages(gross enrolment ratio) enrolled in this levelof education is 85%, but this value falls to54% when only students in the officialsecondary school-age group (net enrolmentratio) are taken into account. The largediscrepancy between these two regionalmeans is largely explained by the relativeweight of the enrolment figures for Brazil,where the difference between gross and netenrolment ratios exceeds 30 percentagepoints. It must be noted that, about 20 millionyoung people of official secondary school ageare not enrolled in secondary education.
Except for Guatemala (33%), gross enrolmentratios in secondary education exceed 50% inall countries in the region. Net enrolment
ratios reach or exceed50% in 11 countries andare below this value insix other countries (seeFigure 2.7). Grossenrolment ratiosincreased markedly inthe 1990s in Paraguay,Nicaragua and Venezuelaand rose relatively lessin Chile, Colombia,Ecuador and Uruguay.Whilst the grossenrolment ratios havedeclined in Cuba it mustbe pointed out that thenet enrolment ratioincreased considerably -from 69% to 75% -between 1990 and 1998.
rodavlaSlE
alametauG
yaugaraPaciR
atsoCrodaucEaleuzeneVaugaraciN.peR
nacinimoD
aibmoloC
ocixéM
aiviloBurePlisarBelihCyaugurUanitnegrA
abuC
Figure 2.7 - Gross (GER 1990 and 1998) and net (NER 1998) enrolment ratios in secondary education (in decreasing order of GER 1998)
Source: Table A3, Annex 1 and UNESCO Statistical Yearbook 1999.
GER 1998
NER 1998
GER 1990
%
71
8176
67
89
53
4035
31
42
23
5055
0
25
50
75
100
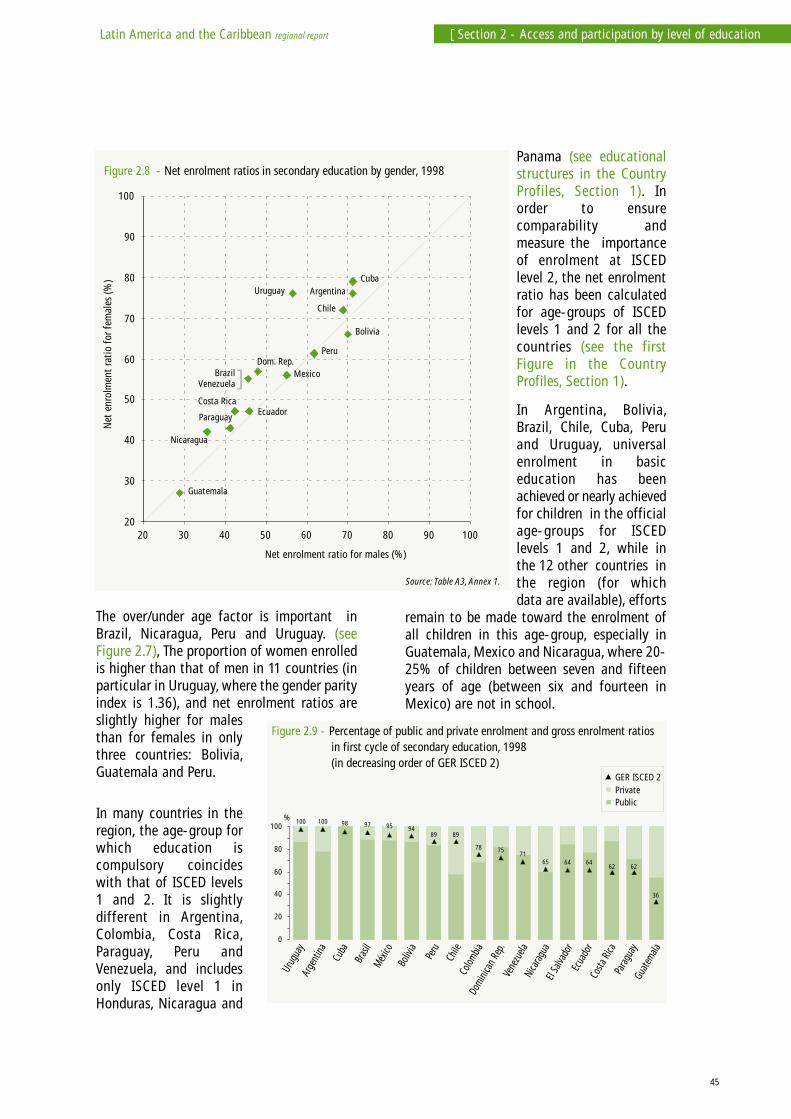
45
Latin America and the Caribbean regional report [ Section 2 - Access and participation by level of education
The over/under age factor is important inBrazil, Nicaragua, Peru and Uruguay. (seeFigure 2.7), The proportion of women enrolledis higher than that of men in 11 countries (inparticular in Uruguay, where the gender parityindex is 1.36), and net enrolment ratios areslightly higher for malesthan for females in onlythree countries: Bolivia,Guatemala and Peru.
In many countries in theregion, the age-group forwhich education iscompulsory coincideswith that of ISCED levels1 and 2. It is slightlydifferent in Argentina,Colombia, Costa Rica,Paraguay, Peru andVenezuela, and includesonly ISCED level 1 inHonduras, Nicaragua and
Panama (see educationalstructures in the CountryProfiles, Section 1). Inorder to ensurecomparability andmeasure the importanceof enrolment at ISCEDlevel 2, the net enrolmentratio has been calculatedfor age-groups of ISCEDlevels 1 and 2 for all thecountries (see the firstFigure in the CountryProfiles, Section 1).
In Argentina, Bolivia,Brazil, Chile, Cuba, Peruand Uruguay, universalenrolment in basiceducation has beenachieved or nearly achievedfor children in the officialage-groups for ISCEDlevels 1 and 2, while inthe 12 other countries inthe region (for whichdata are available), efforts
remain to be made toward the enrolment ofall children in this age-group, especially inGuatemala, Mexico and Nicaragua, where 20-25% of children between seven and fifteenyears of age (between six and fourteen inMexico) are not in school.
20
30
40
50
60
70
80
90
100
20 30 40 50 60 70 80 90 100
Dom. Rep. Brazil
Venezuela
Peru
Bolivia
Ecuador
Mexico
Costa Rica
Chile
Guatemala
Paraguay
UruguayCuba
Argentina
Nicaragua
Net enrolment ratio for males (%)
Net
enr
olm
ent
ratio
for f
emal
es (%
)
Figure 2.8 - Net enrolment ratios in secondary education by gender, 1998
Source: Table A3, Annex 1.
]
0
20
40
60
80
100%
PrivatePublic
GER ISCED 2
Figure 2.9 - Percentage of public and private enrolment and gross enrolment ratios in first cycle of secondary education, 1998 (in decreasing order of GER ISCED 2)
alametauGyaugaraPaciRatsoC
rodavlaSlE
rodaucE
augaraciNaleuzeneV.peR
nacinimoDaibmoloCelihCureP
aiviloBocixéMlisarBabuCanitnegrAyaugurU
6462 62
36
78 7571
65 64
8989
100 100 98 97 95 94
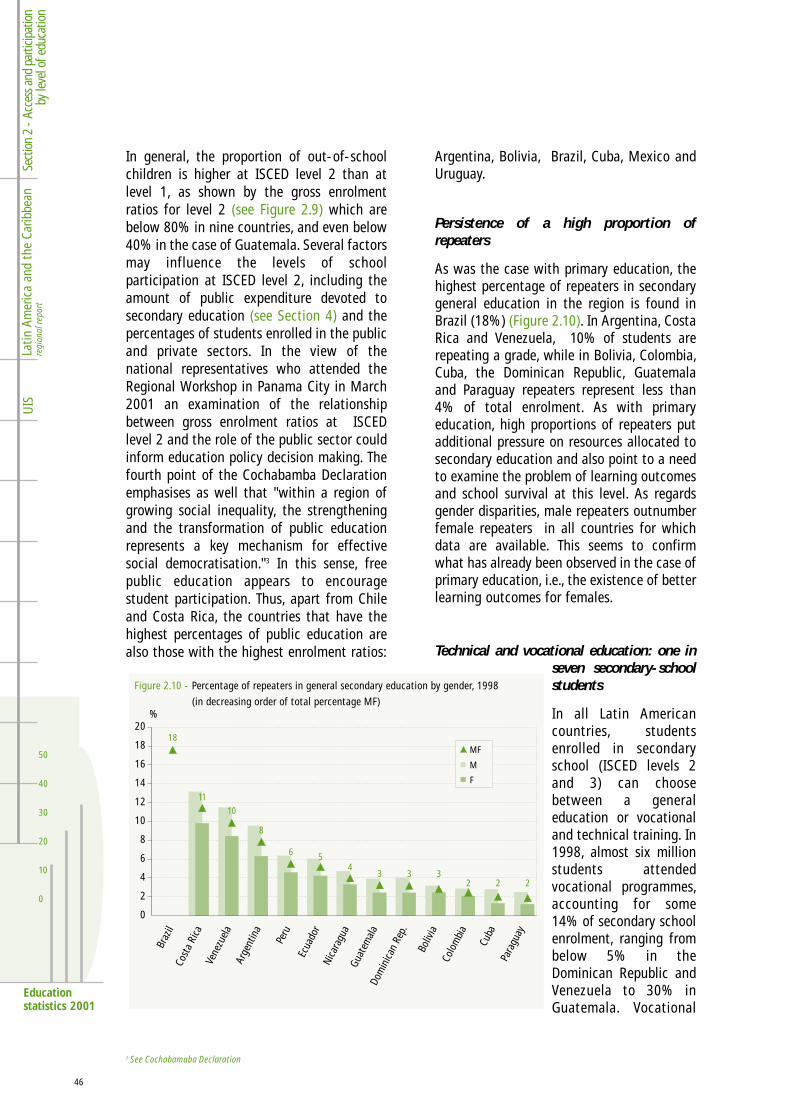
46
50
40
30
20
10
0
Sect
ion
2 - A
cces
s and
par
ticip
atio
nby
leve
l of e
duca
tion
Latin
Am
eric
a an
d th
e Ca
ribbe
anre
gion
al re
port
UIS
Educationstatistics 2001
In general, the proportion of out-of-schoolchildren is higher at ISCED level 2 than atlevel 1, as shown by the gross enrolmentratios for level 2 (see Figure 2.9) which arebelow 80% in nine countries, and even below40% in the case of Guatemala. Several factorsmay influence the levels of schoolparticipation at ISCED level 2, including theamount of public expenditure devoted tosecondary education (see Section 4) and thepercentages of students enrolled in the publicand private sectors. In the view of thenational representatives who attended theRegional Workshop in Panama City in March2001 an examination of the relationshipbetween gross enrolment ratios at ISCEDlevel 2 and the role of the public sector couldinform education policy decision making. Thefourth point of the Cochabamba Declarationemphasises as well that "within a region ofgrowing social inequality, the strengtheningand the transformation of public educationrepresents a key mechanism for effectivesocial democratisation."3 In this sense, freepublic education appears to encouragestudent participation. Thus, apart from Chileand Costa Rica, the countries that have thehighest percentages of public education arealso those with the highest enrolment ratios:
Argentina, Bolivia, Brazil, Cuba, Mexico andUruguay.
Persistence of a high proportion ofrepeaters
As was the case with primary education, thehighest percentage of repeaters in secondarygeneral education in the region is found inBrazil (18%) (Figure 2.10). In Argentina, CostaRica and Venezuela, 10% of students arerepeating a grade, while in Bolivia, Colombia,Cuba, the Dominican Republic, Guatemalaand Paraguay repeaters represent less than4% of total enrolment. As with primaryeducation, high proportions of repeaters putadditional pressure on resources allocated tosecondary education and also point to a needto examine the problem of learning outcomesand school survival at this level. As regardsgender disparities, male repeaters outnumberfemale repeaters in all countries for whichdata are available. This seems to confirmwhat has already been observed in the case ofprimary education, i.e., the existence of betterlearning outcomes for females.
Technical and vocational education: one inseven secondary-schoolstudents
In all Latin Americancountries, studentsenrolled in secondaryschool (ISCED levels 2and 3) can choosebetween a generaleducation or vocationaland technical training. In1998, almost six millionstudents attendedvocational programmes,accounting for some14% of secondary schoolenrolment, ranging frombelow 5% in theDominican Republic andVenezuela to 30% inGuatemala. Vocational
3 See Cochabamaba Declaration
Figure 2.10 - Percentage of repeaters in general secondary education by gender, 1998
(in decreasing order of total percentage MF) %
aibmoloC
abuC
yaugaraP
aiviloB
.peRnacini
moDala
metauGaugaraciNrodaucE
ureP
anitnegrAaleuzeneVaciR
atsoClizarB
0
2
4
6
8
10
12
14
16
18
2018
11
10
8
6 54
3 3 32 2 2
M
F
MF
47
Latin America and the Caribbean regional report [ Section 2 - Access and participation by level of education
education includes a large number ofprogrammes administered by variousministries and offered in both public andprivate institutions, which sometimes makesit difficult to collect information about allprogrammes. Depending on the country, thistype of education offers different pathways,summarised by ISCED codes for subsequentdestinations A, B and C (see ISCED, Annex 4).Vocational programmes which are designedto lead to the labour market (destination C)are available in the education systems ofBolivia, Costa Rica, Cuba, the DominicanRepublic, Ecuador, Nicaragua and Paraguaybut can only be entered in the first grade ofsecondary school in Bolivia and Costa Rica(see Country Profiles, Section 1). In the othercountries, access to such programmes is onlyafter the completion of one or two years ofthe first cycle of secondary school or at thebeginning of the second cycle. Second cyclevocational programmes with destination Bare aimed at facilitating access to tertiaryeducation (at level 5B). This is found in theeducational systems of Bolivia, Chile, CostaRica, Paraguay, Peru and Uruguay. In thesecountries, this type of education can beaccessed only after the completion of the firstcycle of secondary school, except forParaguay where access to vocationalprogrammes is possible from the first year ofsecondary school (the vocational second cycleis a destination C programme). Additionally, asizeable part of vocational education incountries such as Argentina, Brazil, Colombia,Cuba, El Salvador, Guatemala and Venezuelais included in destination A programmes,which provide the opportunity to attendtertiary education programmes ofdestination A.
The educational options that are offered ineach country and the preferences of studentsand their families regarding technical andvocational training programmes are reflectedby the distribution of enrolment by field ofstudy. This type of information is requestedonly from countries that complete the UISquestionnaires (see the Reader's Guide). Fivecountries reported these data, namely
Bolivia, Costa Rica (ISCED 3 only), Ecuador,Nicaragua and Venezuela. The most commonvocational fields are agriculture in Bolivia(71% of total enrolment), business andadministration in Costa Rica and Ecuador(45% and 64% of enrolment respectively) andengineering, manufacturing and constructionin Cuba and Venezuela (46% and 37%respectively). Women outnumber men in artsand in business and administration (86% inCuba, 74% in Ecuador, 72% in Venezuela and67% in Costa Rica), but are outnumbered inscience and in engineering, manufacturingand construction (25% in Ecuador, 20% inVenezuela, 30% in Cuba and 38% in CostaRica) (see Table A3, Annex 1, for totals ofvocational enrolment).
Post-secondary non-tertiary education(ISCED 4)
This is the first time that data on post-secondary non-tertiary education (ISCED level4) for Latin America have been published byUNESCO since the revision of theInternational Standard Classification ofEducation in 1997 (ISCED97).4 In previousyears, these programmes were included eitherin secondary or in tertiary educationdepending on the country. Only four out ofthe seven countries that have suchprogrammes reported data: Colombia, CostaRica, Cuba and Ecuador, with grossenrolment ratios of 0.2%, 3.6%, 7.4% and5.1% respectively (see Country Profiles,Section 1). Most of these programmes have atechnical or vocational orientation and a Btype of subsequent education or destination.In other words, these programmes do not leaddirectly to tertiary level programmes and aredesigned primarily for entry into the world ofwork. They correspond to teacher trainingprogrammes in Colombia, para-universityprogrammes in Costa Rica and technical andvocational training in Bolivia, Cuba, Ecuador,Nicaragua and Panama. Alongside 4Bprogrammes, Bolivia and Panama also offer4A programmes, which in the case of Boliviaprepare for entry into level 5A programmes.
4 The countries that participate in the UOE survey (Mexico) and in the World Education Indicators (WEI) project (Argentina, Brazil, Chile, Paraguay, Peru andUruguay) have no ISCED level 4 programmes.
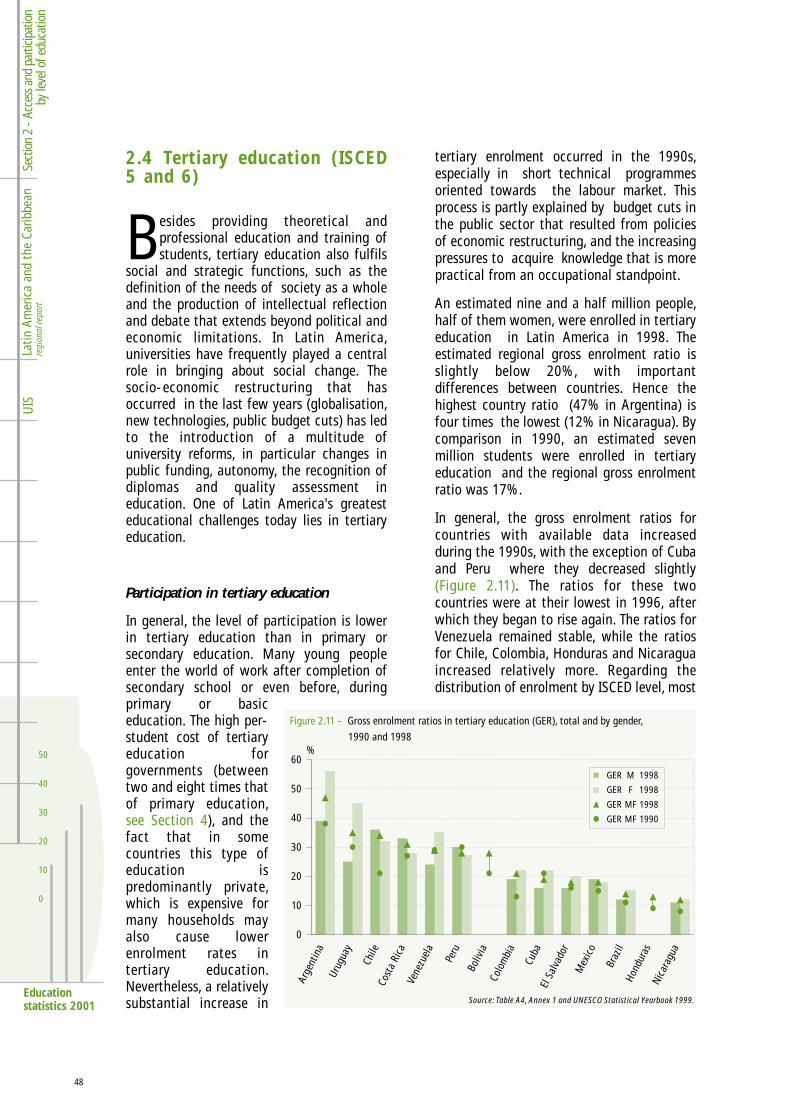
48
50
40
30
20
10
0
Sect
ion
2 - A
cces
s and
par
ticip
atio
nby
leve
l of e
duca
tion
Latin
Am
eric
a an
d th
e Ca
ribbe
anre
gion
al re
port
UIS
Educationstatistics 2001
2.4 Tertiary education (ISCED5 and 6)
Besides providing theoretical andprofessional education and training ofstudents, tertiary education also fulfils
social and strategic functions, such as thedefinition of the needs of society as a wholeand the production of intellectual reflectionand debate that extends beyond political andeconomic limitations. In Latin America,universities have frequently played a centralrole in bringing about social change. Thesocio-economic restructuring that hasoccurred in the last few years (globalisation,new technologies, public budget cuts) has ledto the introduction of a multitude ofuniversity reforms, in particular changes inpublic funding, autonomy, the recognition ofdiplomas and quality assessment ineducation. One of Latin America's greatesteducational challenges today lies in tertiaryeducation.
Participation in tertiary education
In general, the level of participation is lowerin tertiary education than in primary orsecondary education. Many young peopleenter the world of work after completion ofsecondary school or even before, duringprimary or basiceducation. The high per-student cost of tertiaryeducation forgovernments (betweentwo and eight times thatof primary education,see Section 4), and thefact that in somecountries this type ofeducation ispredominantly private,which is expensive formany households mayalso cause lowerenrolment rates intertiary education.Nevertheless, a relativelysubstantial increase in
tertiary enrolment occurred in the 1990s,especially in short technical programmesoriented towards the labour market. Thisprocess is partly explained by budget cuts inthe public sector that resulted from policiesof economic restructuring, and the increasingpressures to acquire knowledge that is morepractical from an occupational standpoint.
An estimated nine and a half million people,half of them women, were enrolled in tertiaryeducation in Latin America in 1998. Theestimated regional gross enrolment ratio isslightly below 20%, with importantdifferences between countries. Hence thehighest country ratio (47% in Argentina) isfour times the lowest (12% in Nicaragua). Bycomparison in 1990, an estimated sevenmillion students were enrolled in tertiaryeducation and the regional gross enrolmentratio was 17%.
In general, the gross enrolment ratios forcountries with available data increasedduring the 1990s, with the exception of Cubaand Peru where they decreased slightly(Figure 2.11). The ratios for these twocountries were at their lowest in 1996, afterwhich they began to rise again. The ratios forVenezuela remained stable, while the ratiosfor Chile, Colombia, Honduras and Nicaraguaincreased relatively more. Regarding thedistribution of enrolment by ISCED level, most
GER M 1998
GER F 1998
GER MF 1998
GER MF 1990
sarudnoH
augaraciN
lizarB
ocixeM
rodavlaSlEabuC
aibmoloC
aiviloB
ureP
aleuzeneVaciR
atsoCelihC
yaugurUanitnegrA
Source: Table A4, Annex 1 and UNESCO Statistical Yearbook 1999.
0
10
20
30
40
50
60
Figure 2.11 - Gross enrolment ratios in tertiary education (GER), total and by gender,
1990 and 1998 %
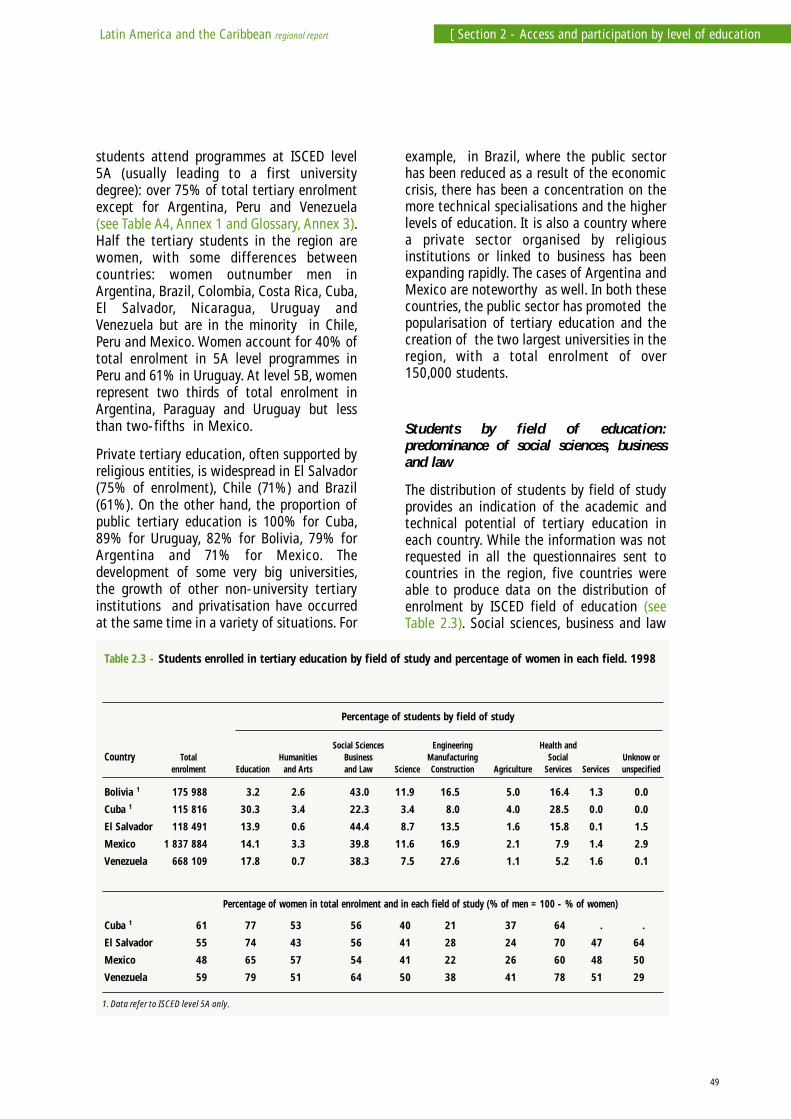
49
Latin America and the Caribbean regional report [ Section 2 - Access and participation by level of education
students attend programmes at ISCED level5A (usually leading to a first universitydegree): over 75% of total tertiary enrolmentexcept for Argentina, Peru and Venezuela(see Table A4, Annex 1 and Glossary, Annex 3).Half the tertiary students in the region arewomen, with some differences betweencountries: women outnumber men inArgentina, Brazil, Colombia, Costa Rica, Cuba,El Salvador, Nicaragua, Uruguay andVenezuela but are in the minority in Chile,Peru and Mexico. Women account for 40% oftotal enrolment in 5A level programmes inPeru and 61% in Uruguay. At level 5B, womenrepresent two thirds of total enrolment inArgentina, Paraguay and Uruguay but lessthan two-fifths in Mexico.
Private tertiary education, often supported byreligious entities, is widespread in El Salvador(75% of enrolment), Chile (71%) and Brazil(61%). On the other hand, the proportion ofpublic tertiary education is 100% for Cuba,89% for Uruguay, 82% for Bolivia, 79% forArgentina and 71% for Mexico. Thedevelopment of some very big universities,the growth of other non-university tertiaryinstitutions and privatisation have occurredat the same time in a variety of situations. For
example, in Brazil, where the public sectorhas been reduced as a result of the economiccrisis, there has been a concentration on themore technical specialisations and the higherlevels of education. It is also a country wherea private sector organised by religiousinstitutions or linked to business has beenexpanding rapidly. The cases of Argentina andMexico are noteworthy as well. In both thesecountries, the public sector has promoted thepopularisation of tertiary education and thecreation of the two largest universities in theregion, with a total enrolment of over150,000 students.
Students by field of education:predominance of social sciences, businessand law
The distribution of students by field of studyprovides an indication of the academic andtechnical potential of tertiary education ineach country. While the information was notrequested in all the questionnaires sent tocountries in the region, five countries wereable to produce data on the distribution ofenrolment by ISCED field of education (seeTable 2.3). Social sciences, business and law
Social Sciences Engineering Health andCountry Total Humanities Business Manufacturing Social Unknow or
enrolment Education and Arts and Law Science Construction Agriculture Services Services unspecified
Bolivia 1 175 988 3.2 2.6 43.0 11.9 16.5 5.0 16.4 1.3 0.0
Cuba 1 115 816 30.3 3.4 22.3 3.4 8.0 4.0 28.5 0.0 0.0
El Salvador 118 491 13.9 0.6 44.4 8.7 13.5 1.6 15.8 0.1 1.5
Mexico 1 837 884 14.1 3.3 39.8 11.6 16.9 2.1 7.9 1.4 2.9
Venezuela 668 109 17.8 0.7 38.3 7.5 27.6 1.1 5.2 1.6 0.1
Cuba 1 61 77 53 56 40 21 37 64 . .
El Salvador 55 74 43 56 41 28 24 70 47 64
Mexico 48 65 57 54 41 22 26 60 48 50
Venezuela 59 79 51 64 50 38 41 78 51 29
Table 2.3 - Students enrolled in tertiary education by field of study and percentage of women in each field. 1998
Percentage of students by field of study
Percentage of women in total enrolment and in each field of study (% of men = 100 - % of women)
1. Data refer to ISCED level 5A only.
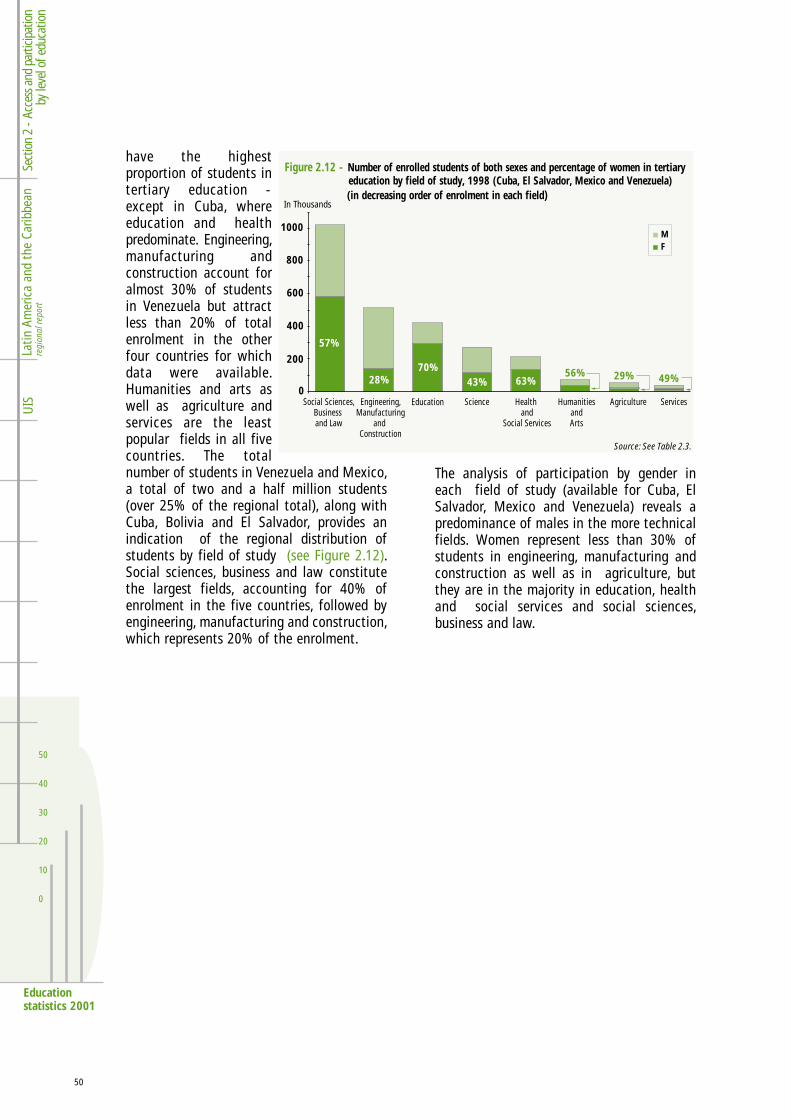
have the highestproportion of students intertiary education -except in Cuba, whereeducation and healthpredominate. Engineering,manufacturing andconstruction account foralmost 30% of studentsin Venezuela but attractless than 20% of totalenrolment in the otherfour countries for whichdata were available.Humanities and arts aswell as agriculture andservices are the leastpopular fields in all fivecountries. The totalnumber of students in Venezuela and Mexico,a total of two and a half million students(over 25% of the regional total), along withCuba, Bolivia and El Salvador, provides anindication of the regional distribution ofstudents by field of study (see Figure 2.12).Social sciences, business and law constitutethe largest fields, accounting for 40% ofenrolment in the five countries, followed byengineering, manufacturing and construction,which represents 20% of the enrolment.
50
50
40
30
20
10
0
Sect
ion
2 - A
cces
s and
par
ticip
atio
nby
leve
l of e
duca
tion
Latin
Am
eric
a an
d th
e Ca
ribbe
anre
gion
al re
port
UIS
Educationstatistics 2001
In Thousands
Figure 2.12 - Number of enrolled students of both sexes and percentage of women in tertiary education by field of study, 1998 (Cuba, El Salvador, Mexico and Venezuela) (in decreasing order of enrolment in each field)
Source: See Table 2.3.
Social Sciences,Business and Law
Engineering,Manufacturing
and Construction
Education Science Health and
Social Services
HumanitiesandArts
Agriculture Services0
200
400
600
800
1000
49%29%
57%
28%70%
43% 63%56%
MF
The analysis of participation by gender ineach field of study (available for Cuba, ElSalvador, Mexico and Venezuela) reveals apredominance of males in the more technicalfields. Women represent less than 30% ofstudents in engineering, manufacturing andconstruction as well as in agriculture, butthey are in the majority in education, healthand social services and social sciences,business and law.
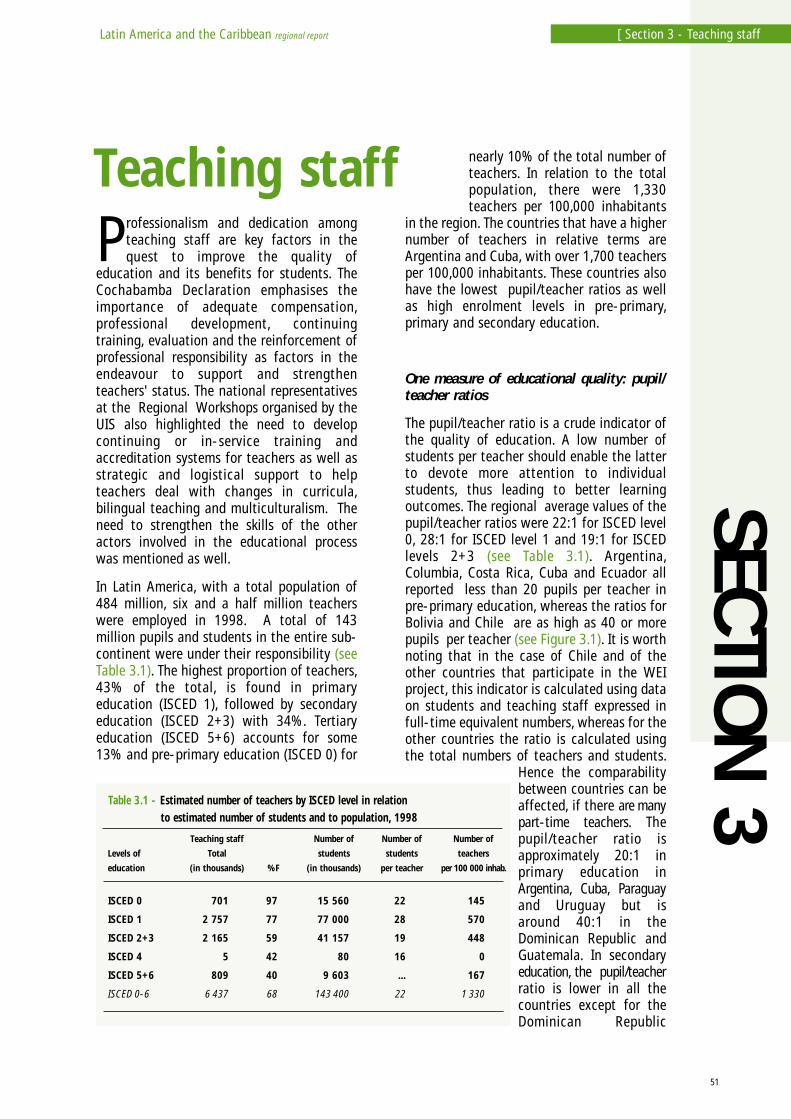
SECTION
3
51
Latin America and the Caribbean regional report [ Section 3 - Teaching staff
Professionalism and dedication amongteaching staff are key factors in thequest to improve the quality of
education and its benefits for students. TheCochabamba Declaration emphasises theimportance of adequate compensation,professional development, continuingtraining, evaluation and the reinforcement ofprofessional responsibility as factors in theendeavour to support and strengthenteachers' status. The national representativesat the Regional Workshops organised by theUIS also highlighted the need to developcontinuing or in-service training andaccreditation systems for teachers as well asstrategic and logistical support to helpteachers deal with changes in curricula,bilingual teaching and multiculturalism. Theneed to strengthen the skills of the otheractors involved in the educational processwas mentioned as well.
In Latin America, with a total population of484 million, six and a half million teacherswere employed in 1998. A total of 143million pupils and students in the entire sub-continent were under their responsibility (seeTable 3.1). The highest proportion of teachers,43% of the total, is found in primaryeducation (ISCED 1), followed by secondaryeducation (ISCED 2+3) with 34%. Tertiaryeducation (ISCED 5+6) accounts for some13% and pre-primary education (ISCED 0) for
nearly 10% of the total number ofteachers. In relation to the totalpopulation, there were 1,330teachers per 100,000 inhabitants
in the region. The countries that have a highernumber of teachers in relative terms areArgentina and Cuba, with over 1,700 teachersper 100,000 inhabitants. These countries alsohave the lowest pupil/teacher ratios as wellas high enrolment levels in pre-primary,primary and secondary education.
One measure of educational quality: pupil/teacher ratios
The pupil/teacher ratio is a crude indicator ofthe quality of education. A low number ofstudents per teacher should enable the latterto devote more attention to individualstudents, thus leading to better learningoutcomes. The regional average values of thepupil/teacher ratios were 22:1 for ISCED level0, 28:1 for ISCED level 1 and 19:1 for ISCEDlevels 2+3 (see Table 3.1). Argentina,Columbia, Costa Rica, Cuba and Ecuador allreported less than 20 pupils per teacher inpre-primary education, whereas the ratios forBolivia and Chile are as high as 40 or morepupils per teacher (see Figure 3.1). It is worthnoting that in the case of Chile and of theother countries that participate in the WEIproject, this indicator is calculated using dataon students and teaching staff expressed infull-time equivalent numbers, whereas for theother countries the ratio is calculated usingthe total numbers of teachers and students.
Hence the comparabilitybetween countries can beaffected, if there are manypart-time teachers. Thepupil/teacher ratio isapproximately 20:1 inprimary education inArgentina, Cuba, Paraguayand Uruguay but isaround 40:1 in theDominican Republic andGuatemala. In secondaryeducation, the pupil/teacherratio is lower in all thecountries except for theDominican Republic
Teaching staff
ISCED 0 701 97 15 560 22 145
ISCED 1 2 757 77 77 000 28 570
ISCED 2+3 2 165 59 41 157 19 448
ISCED 4 5 42 80 16 0
ISCED 5+6 809 40 9 603 ... 167
ISCED 0-6 6 437 68 143 400 22 1 330
Table 3.1 - Estimated number of teachers by ISCED level in relation to estimated number of students and to population, 1998
Teaching staff Number of Number of Number of
Levels of Total students students teachers
education (in thousands) %F (in thousands) per teacher per 100 000 inhab.
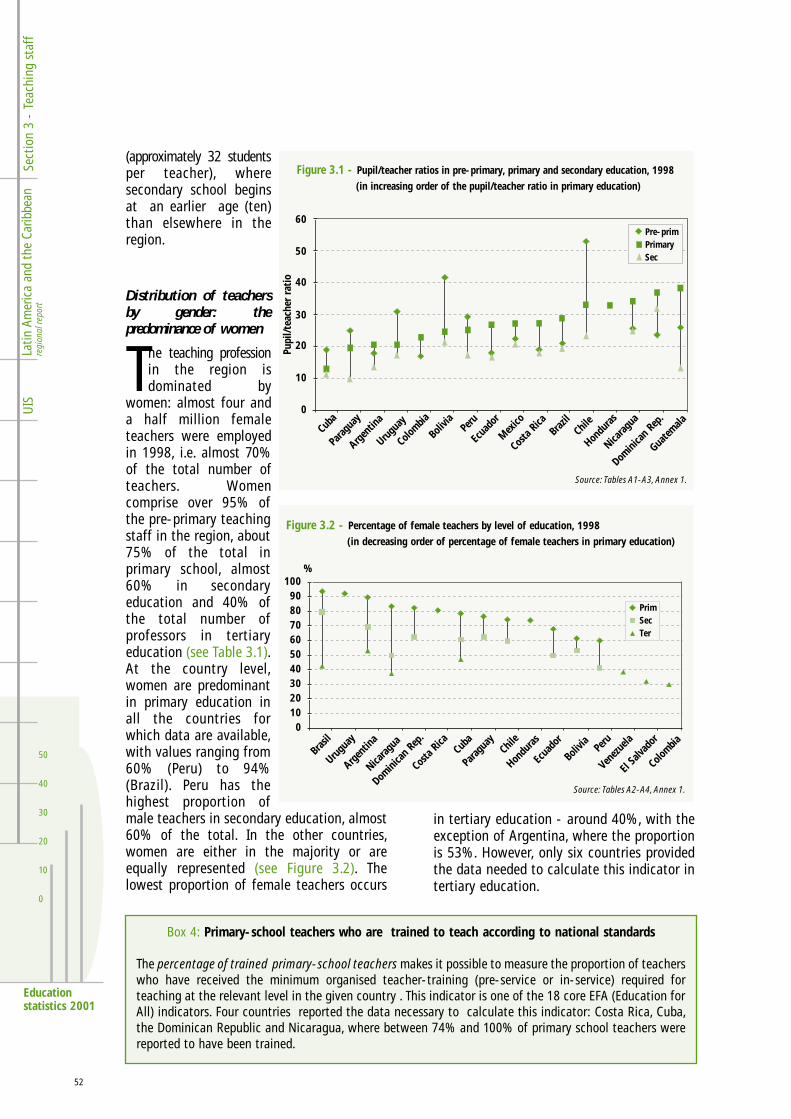
52
50
40
30
20
10
0
Sect
ion
3 -
Teac
hing
sta
ffLa
tin A
mer
ica
and
the
Carib
bean
regi
onal
repo
rtU
IS
Educationstatistics 2001
(approximately 32 studentsper teacher), wheresecondary school beginsat an earlier age (ten)than elsewhere in theregion.
Distribution of teachersby gender: thepredominance of women
The teaching professionin the region isdominated by
women: almost four anda half million femaleteachers were employedin 1998, i.e. almost 70%of the total number ofteachers. Womencomprise over 95% ofthe pre-primary teachingstaff in the region, about75% of the total inprimary school, almost60% in secondaryeducation and 40% ofthe total number ofprofessors in tertiaryeducation (see Table 3.1).At the country level,women are predominantin primary education inall the countries forwhich data are available,with values ranging from60% (Peru) to 94%(Brazil). Peru has thehighest proportion ofmale teachers in secondary education, almost60% of the total. In the other countries,women are either in the majority or areequally represented (see Figure 3.2). Thelowest proportion of female teachers occurs
0
10
20
30
40
50
60
Cuba
Parag
uay
Arge
ntina
Urug
uay
Colom
bia
Boliv
ia
Ecua
dor
Peru
Mexico
Brazi
l
Costa
Rica
Chile
Hondu
ras
Nicarag
ua
Dom
inica
n Rep
.
Guate
mala
Figure 3.1 - Pupil/teacher ratios in pre-primary, primary and secondary education, 1998 (in increasing order of the pupil/teacher ratio in primary education)
Pupi
l/tea
cher
rat
io
Source: Tables A1-A3, Annex 1.
Pre-primPrimarySec
Box 4: Primary-school teachers who are trained to teach according to national standards
The percentage of trained primary-school teachers makes it possible to measure the proportion of teacherswho have received the minimum organised teacher-training (pre-service or in-service) required forteaching at the relevant level in the given country . This indicator is one of the 18 core EFA (Education forAll) indicators. Four countries reported the data necessary to calculate this indicator: Costa Rica, Cuba,the Dominican Republic and Nicaragua, where between 74% and 100% of primary school teachers werereported to have been trained.
0102030405060708090
100
Brasi
l
Urug
uay
Arge
ntina
Nicarag
ua
Dom
inica
n Rep
.
Costa
Rica
Parag
uay
Cuba
Chile
Ecua
dor
Hondu
ras
Boliv
ia Peru
Vene
zuela
El Sa
lvado
r
Colom
bia
PrimSecTer
Source: Tables A2-A4, Annex 1.
Figure 3.2 - Percentage of female teachers by level of education, 1998 (in decreasing order of percentage of female teachers in primary education)
%
in tertiary education - around 40%, with theexception of Argentina, where the proportionis 53%. However, only six countries providedthe data needed to calculate this indicator intertiary education.
SECTION
4
53
Latin America and the Caribbean regional report [ Section 4 - Education finance and expenditure
The quality and coverage of education canbe improved only if adequate and stablefinancial support is available. The level of
public expenditure on education is anindication of the effort undertaken bygovernments in this area. It is difficult toobtain data on education expenditure thatare both exhaustive and classified in a waythat allows for international comparisons.Data on private expenditures and some partsof public expenditure (for example, localgovernment expenditure) are oftenunavailable. In addition, public expenditurecannot always be disaggregated by ISCEDlevel because their allocation depends oninstitutions and administrations that coverseveral levels of education at the same time.Moreover, capital expenditures on educationare often aggregated with other sections ofnon-educational expenditure from whichthey cannot be distinguished.
The indicators presented in this section areexpressed in relative terms (as percentages oftotal public expenditure or Gross DomesticProduct (GDP) - either total or per capita).They provide a possibility to comparecountries, which is not feasible with absolutevalues because of problems with currencyexchange rates.
Public expenditure on education as apercentage of total public expenditure andas a percentage of GDP
Nine countries provided the informationneeded to calculate public expenditure oneducation as a percentage of total publicexpenditure. This percentage, whichrepresents the share of the budget earmarkedfor education relative to other sectors,exceeds 10% in all nine countries. Paraguay
and Peru have the highest values, with 20%and 22% respectively (see Table A4, Annex 1).Public expenditure on education as apercentage of GDP is available for 16countries. In four of them, this indicator is 5%or more (Bolivia, Costa Rica, Cuba andPanama), but is below 3% in the DominicanRepublic, El Salvador and Uruguay.
Distribution of public current expenditureby level of education
The distribution of public current expenditureby level of education provides an indication ofthe relative priorities ascribed bygovernments to the various levels ofeducation. This indicator can be calculatedfor 13 countries, six of which produced dataincluding capital expenditure. Primaryeducation, which has the highest number ofstudents (54% of the regional total) alsoreceives the main share of public expenditure,except in Cuba and Uruguay, whereexpenditure on secondary education is higher(see Table A4 in the annexes). Tertiaryeducation has a smaller share of totalexpenditure than secondary education, exceptin Bolivia and Brazil, where tertiary educationis allocated about one quarter of the totalexpenditure.
Public expenditure per student by level ofeducation
The proportion of expenditure relative to thenumber of students at every level ofeducation presents another perspective ofhow resources are allocated. This indicatorshows the relationship between publicexpenditure (current or total depending onavailability) and the total number of students,in both the public and the private sector. Thismay be debatable but stems from the factthat in many countries a large share of theprivate sector is subsidised. Eleven countrieswere able to present the data needed tocalculate this indicator: Argentina, Bolivia,Brazil, Chile, Costa Rica, Cuba, El Salvador,Mexico, Paraguay, Peru and Uruguay.
Expenditure per pupil in pre-primaryeducation is generally lower than in primary
Educationfinance andexpenditure
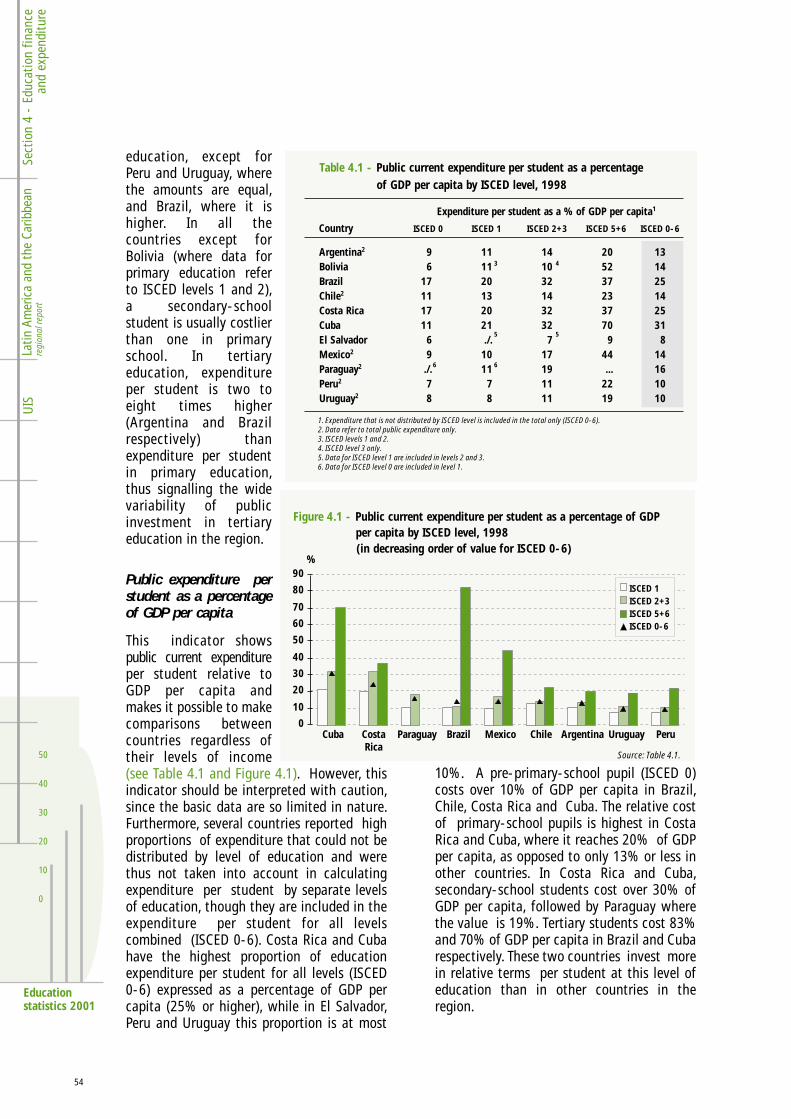
54
50
40
30
20
10
0
Sect
ion
4 -
Educ
atio
n fin
ance
and
expe
nditu
re
UIS
Educationstatistics 2001
education, except forPeru and Uruguay, wherethe amounts are equal,and Brazil, where it ishigher. In all thecountries except forBolivia (where data forprimary education referto ISCED levels 1 and 2),a secondary-schoolstudent is usually costlierthan one in primaryschool. In tertiaryeducation, expenditureper student is two toeight times higher(Argentina and Brazilrespectively) thanexpenditure per studentin primary education,thus signalling the widevariability of publicinvestment in tertiaryeducation in the region.
Public expenditure perstudent as a percentageof GDP per capita
This indicator showspublic current expenditureper student relative toGDP per capita andmakes it possible to makecomparisons betweencountries regardless oftheir levels of income(see Table 4.1 and Figure 4.1). However, thisindicator should be interpreted with caution,since the basic data are so limited in nature.Furthermore, several countries reported highproportions of expenditure that could not bedistributed by level of education and werethus not taken into account in calculatingexpenditure per student by separate levelsof education, though they are included in theexpenditure per student for all levelscombined (ISCED 0-6). Costa Rica and Cubahave the highest proportion of educationexpenditure per student for all levels (ISCED0-6) expressed as a percentage of GDP percapita (25% or higher), while in El Salvador,Peru and Uruguay this proportion is at most
10%. A pre-primary-school pupil (ISCED 0)costs over 10% of GDP per capita in Brazil,Chile, Costa Rica and Cuba. The relative costof primary-school pupils is highest in CostaRica and Cuba, where it reaches 20% of GDPper capita, as opposed to only 13% or less inother countries. In Costa Rica and Cuba,secondary-school students cost over 30% ofGDP per capita, followed by Paraguay wherethe value is 19%. Tertiary students cost 83%and 70% of GDP per capita in Brazil and Cubarespectively. These two countries invest morein relative terms per student at this level ofeducation than in other countries in theregion.
Table 4.1 - Public current expenditure per student as a percentage of GDP per capita by ISCED level, 1998
Expenditure per student as a % of GDP per capita1
Country ISCED 0 ISCED 1 ISCED 2+3 ISCED 5+6 ISCED 0-6
1. Expenditure that is not distributed by ISCED level is included in the total only (ISCED 0-6). 2. Data refer to total public expenditure only. 3. ISCED levels 1 and 2. 4. ISCED level 3 only. 5. Data for ISCED level 1 are included in levels 2 and 3.6. Data for ISCED level 0 are included in level 1.
3 4
5 5
6 6
Argentina2 9 11 14 20 13Bolivia 6 11 10 52 14Brazil 17 20 32 37 25Chile2 11 13 14 23 14Costa Rica 17 20 32 37 25Cuba 11 21 32 70 31El Salvador 6 ./. 7 9 8Mexico2 9 10 17 44 14Paraguay2 ./. 11 19 ... 16Peru2 7 7 11 22 10Uruguay2 8 8 11 19 10
10
20
30
40
50
60
70
80
90%
Cuba CostaRica
Paraguay Brazil Mexico Chile Argentina Uruguay Peru
ISCED 1ISCED 2+3ISCED 5+6ISCED 0-6
Source: Table 4.1.
Figure 4.1 - Public current expenditure per student as a percentage of GDP per capita by ISCED level, 1998(in decreasing order of value for ISCED 0-6)
0
Latin
Am
eric
a an
d th
e Ca
ribbe
anre
gion
al re
port
55
Latin America and the Caribbean regional report [ Annex
• ANNEX 1 - Statistical tables
• ANNEX 2 - Definitions of indicators
• ANNEX 3 - Glossary
• ANNEX 4 - ISCED97
ANNEX
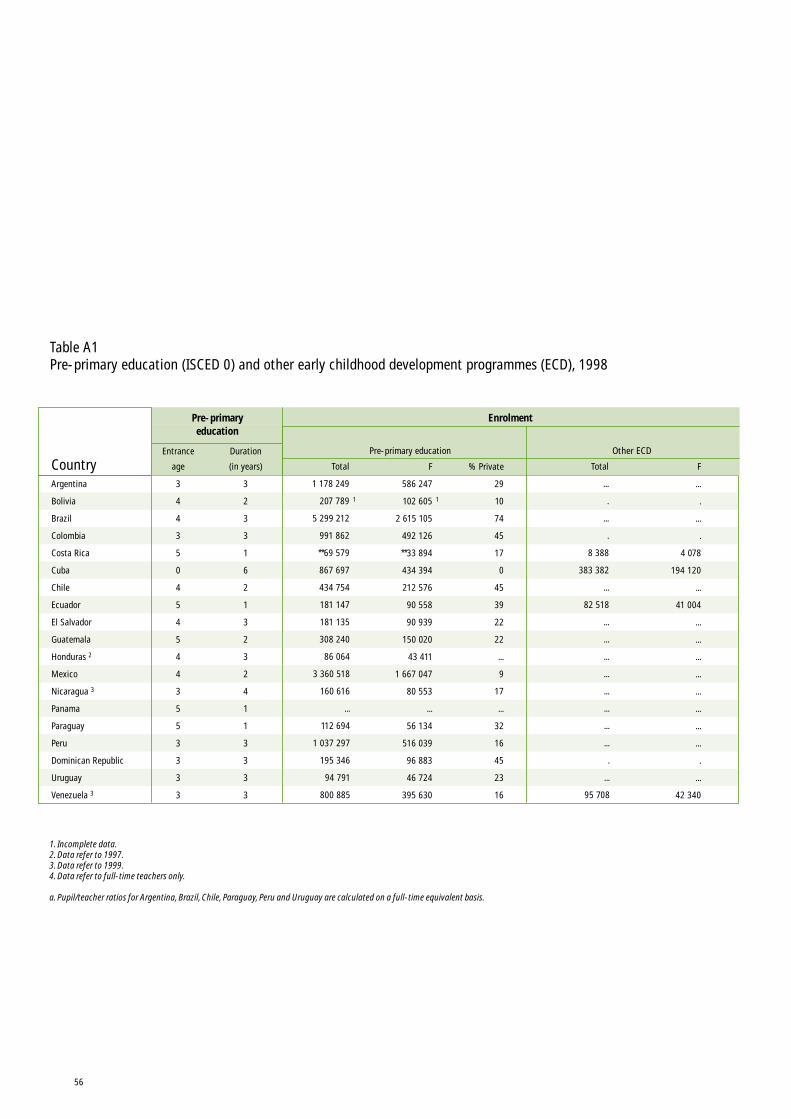
56
CountryArgentina
Bolivia
Brazil
Colombia
Costa Rica
Cuba
Chile
Ecuador
El Salvador
Guatemala
Honduras 2
Mexico
Nicaragua 3
Panama
Paraguay
Peru
Dominican Republic
Uruguay
Venezuela 3
Table A1Pre-primary education (ISCED 0) and other early childhood development programmes (ECD), 1998
3
4
4
3
5
0
4
5
4
5
4
4
3
5
5
3
3
3
3
3
2
3
3
1
6
2
1
3
2
3
2
4
1
1
3
3
3
3
Other ECDPre-primary education
EnrolmentPre-primaryeducation
% Private
29
10
74
45
17
0
45
39
22
22
...
9
17
...
32
16
45
23
16
Total
1 178 249
207 789
5 299 212
991 862
**69 579
867 697
434 754
181 147
181 135
308 240
86 064
3 360 518
160 616
...
112 694
1 037 297
195 346
94 791
800 885
1
F
586 247
102 605
2 615 105
492 126
**33 894
434 394
212 576
90 558
90 939
150 020
43 411
1 667 047
80 553
...
56 134
516 039
96 883
46 724
395 630
Total
...
.
...
.
8 388
383 382
...
82 518
...
...
...
...
...
...
...
...
.
...
95 708
F
...
.
...
.
4 078
194 120
...
41 004
...
...
...
...
...
...
...
...
.
...
42 340
1
1. Incomplete data. 2. Data refer to 1997. 3. Data refer to 1999. 4. Data refer to full-time teachers only.
a. Pupil/teacher ratios for Argentina, Brazil, Chile, Paraguay, Peru and Uruguay are calculated on a full-time equivalent basis.
Entrance
age
Duration
(in years)
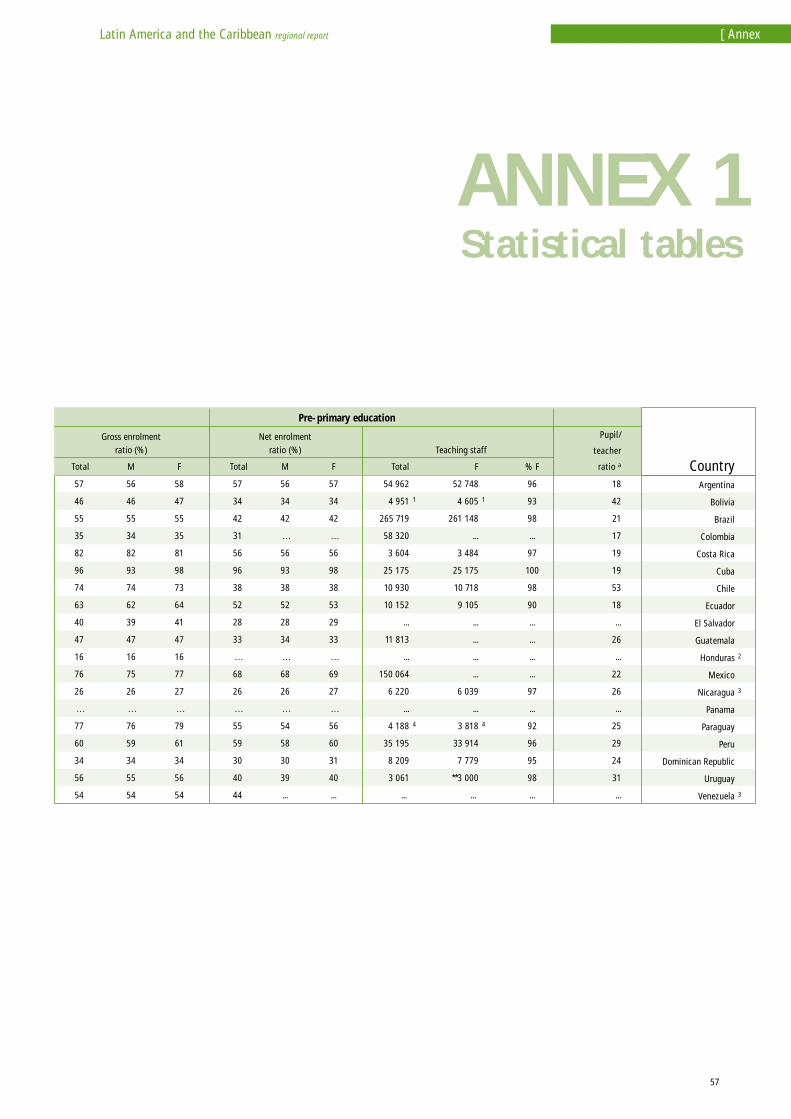
ANNEX 1Statistical tables
57
Latin America and the Caribbean regional report [ Annex
Gross enrolmentratio (%)
Net enrolmentratio (%) Teaching staff
Pupil/
teacher
ratio a
Pre-primary education
% F
96
93
98
...
97
100
98
90
...
...
...
...
97
...
92
96
95
98
...
Total
57
46
55
35
82
96
74
63
40
47
16
76
26
…
77
60
34
56
54
M
56
46
55
34
82
93
74
62
39
47
16
75
26
…
76
59
34
55
54
F
58
47
55
35
81
98
73
64
41
47
16
77
27
…
79
61
34
56
54
Total
57
34
42
31
56
96
38
52
28
33
…
68
26
…
55
59
30
40
44
M
56
34
42
…
56
93
38
52
28
34
…
68
26
…
54
58
30
39
...
F
57
34
42
…
56
98
38
53
29
33
…
69
27
…
56
60
31
40
...
1
4
18
42
21
17
19
19
53
18
...
26
...
22
26
...
25
29
24
31
...
Total
54 962
4 951
265 719
58 320
3 604
25 175
10 930
10 152
...
11 813
...
150 064
6 220
...
4 188
35 195
8 209
3 061
...
1
4
F
52 748
4 605
261 148
...
3 484
25 175
10 718
9 105
...
...
...
...
6 039
...
3 818
33 914
7 779
**3 000
...
2
3
3
CountryArgentina
Bolivia
Brazil
Colombia
Costa Rica
Cuba
Chile
Ecuador
El Salvador
Guatemala
Honduras
Mexico
Nicaragua
Panama
Paraguay
Peru
Dominican Republic
Uruguay
Venezuela
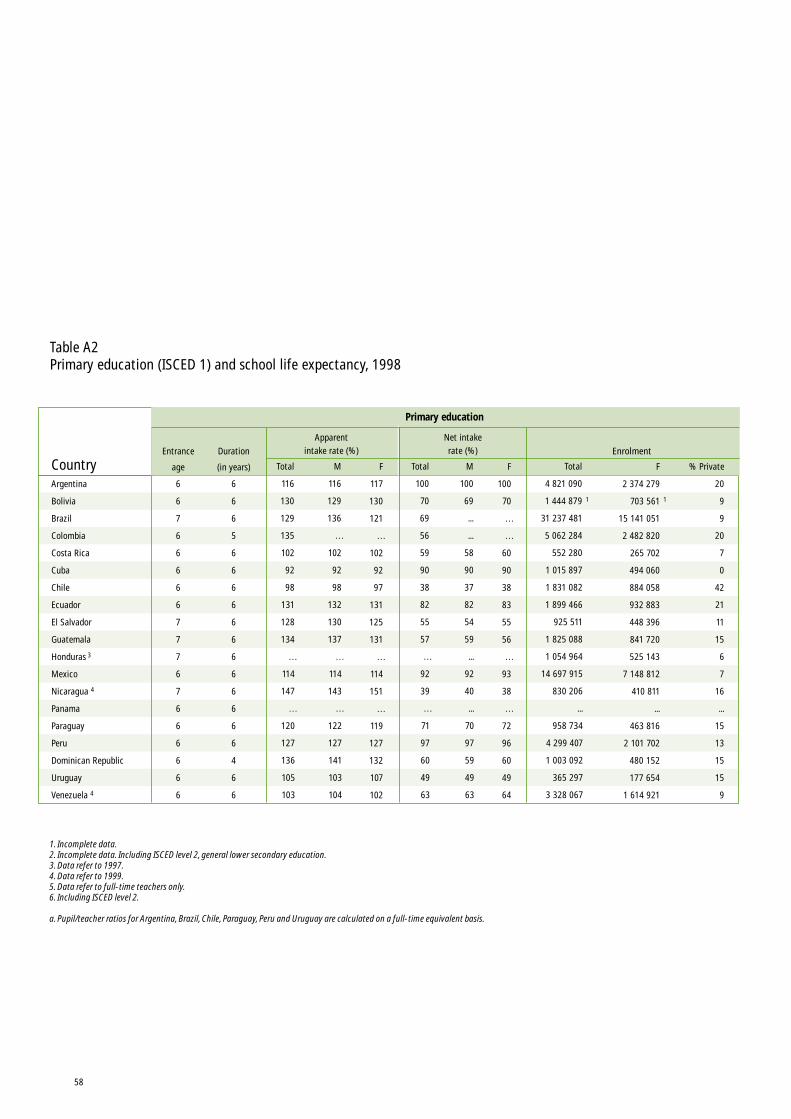
58
CountryArgentina
Bolivia
Brazil
Colombia
Costa Rica
Cuba
Chile
Ecuador
El Salvador
Guatemala
Honduras 3
Mexico
Nicaragua 4
Panama
Paraguay
Peru
Dominican Republic
Uruguay
Venezuela 4
6
6
7
6
6
6
6
6
7
7
7
6
7
6
6
6
6
6
6
6
6
6
5
6
6
6
6
6
6
6
6
6
6
6
6
4
6
6
Apparentintake rate (%)
Net intakerate (%) Enrolment
Primary education
Total
116
130
129
135
102
92
98
131
128
134
…
114
147
…
120
127
136
105
103
M
116
129
136
…
102
92
98
132
130
137
…
114
143
…
122
127
141
103
104
F
117
130
121
…
102
92
97
131
125
131
…
114
151
…
119
127
132
107
102
Total
100
70
69
56
59
90
38
82
55
57
…
92
39
…
71
97
60
49
63
M
100
69
...
...
58
90
37
82
54
59
...
92
40
...
70
97
59
49
63
F
100
70
…
…
60
90
38
83
55
56
…
93
38
…
72
96
60
49
64
% Private
20
9
9
20
7
0
42
21
11
15
6
7
16
...
15
13
15
15
9
Total
4 821 090
1 444 879
31 237 481
5 062 284
552 280
1 015 897
1 831 082
1 899 466
925 511
1 825 088
1 054 964
14 697 915
830 206
...
958 734
4 299 407
1 003 092
365 297
3 328 067
1
F
2 374 279
703 561
15 141 051
2 482 820
265 702
494 060
884 058
932 883
448 396
841 720
525 143
7 148 812
410 811
...
463 816
2 101 702
480 152
177 654
1 614 921
1
Entrance
age
Duration
(in years)
Table A2 Primary education (ISCED 1) and school life expectancy, 1998
1. Incomplete data.2. Incomplete data. Including ISCED level 2, general lower secondary education. 3. Data refer to 1997.4. Data refer to 1999.5. Data refer to full-time teachers only.6. Including ISCED level 2. a. Pupil/teacher ratios for Argentina, Brazil, Chile, Paraguay, Peru and Uruguay are calculated on a full-time equivalent basis.
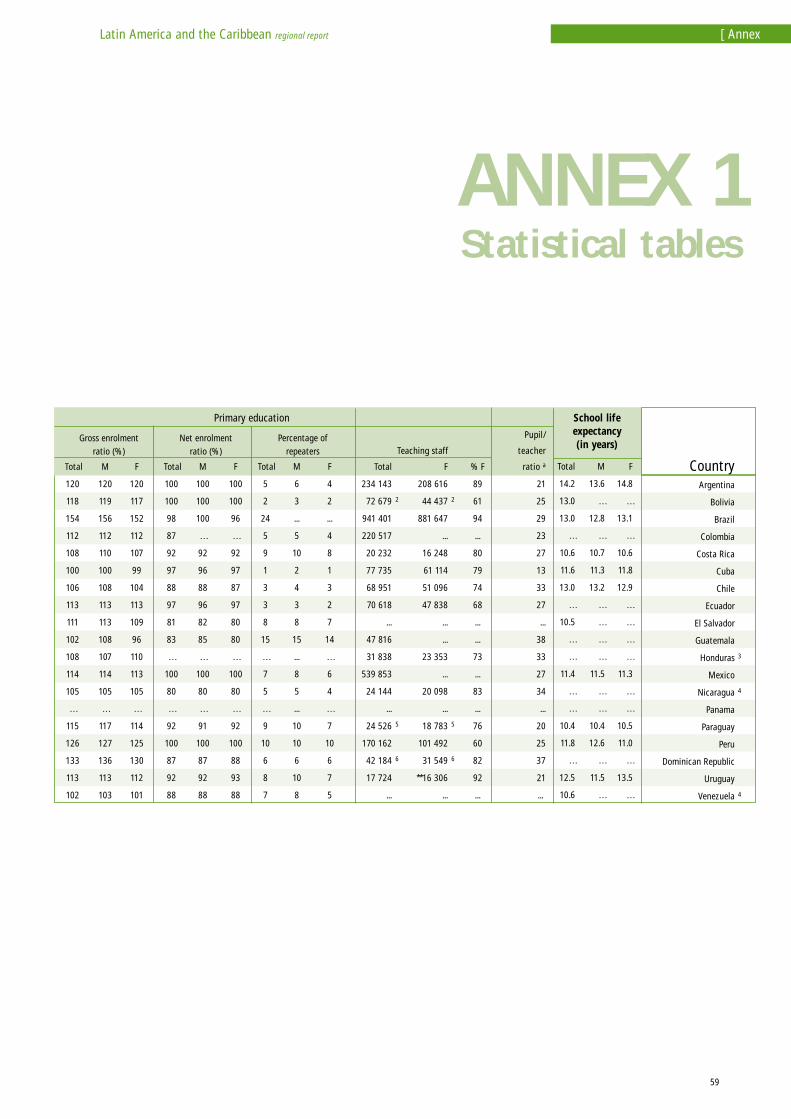
59
Latin America and the Caribbean regional report [ Annex
Gross enrolmentratio (%)
Net enrolmentratio (%) Teaching staff
Pupil/
teacher
ratio a
School lifeexpectancy(in years)
Primary education
% F
89
61
94
...
80
79
74
68
...
...
73
...
83
...
76
60
82
92
...
Total
120
118
154
112
108
100
106
113
111
102
108
114
105
…
115
126
133
113
102
M
120
119
156
112
110
100
108
113
113
108
107
114
105
…
117
127
136
113
103
F
120
117
152
112
107
99
104
113
109
96
110
113
105
…
114
125
130
112
101
Total
100
100
98
87
92
97
88
97
81
83
…
100
80
…
92
100
87
92
88
M
100
100
100
…
92
96
88
96
82
85
…
100
80
…
91
100
87
92
88
F
100
100
96
…
92
97
87
97
80
80
…
100
80
…
92
100
88
93
88
Percentage ofrepeaters
Total
5
2
24
5
9
1
3
3
8
15
…
7
5
…
9
10
6
8
7
M
6
3
...
5
10
2
4
3
8
15
...
8
5
...
10
10
6
10
8
F
4
2
...
4
8
1
3
2
7
14
…
6
4
…
7
10
6
7
5
2
5
6
21
25
29
23
27
13
33
27
...
38
33
27
34
...
20
25
37
21
...
Total
234 143
72 679
941 401
220 517
20 232
77 735
68 951
70 618
...
47 816
31 838
539 853
24 144
...
24 526
170 162
42 184
17 724
...
2
5
6
F
208 616
44 437
881 647
...
16 248
61 114
51 096
47 838
...
...
23 353
...
20 098
...
18 783
101 492
31 549
**16 306
...
F
14.8
…
13.1
…
10.6
11.8
12.9
…
…
…
…
11.3
…
…
10.5
11.0
…
13.5
…
Total
14.2
13.0
13.0
…
10.6
11.6
13.0
…
10.5
…
…
11.4
…
…
10.4
11.8
…
12.5
10.6
M
13.6
…
12.8
…
10.7
11.3
13.2
…
…
…
…
11.5
…
…
10.4
12.6
…
11.5
…
3
4
4
CountryArgentina
Bolivia
Brazil
Colombia
Costa Rica
Cuba
Chile
Ecuador
El Salvador
Guatemala
Honduras
Mexico
Nicaragua
Panama
Paraguay
Peru
Dominican Republic
Uruguay
Venezuela
ANNEX 1Statistical tables
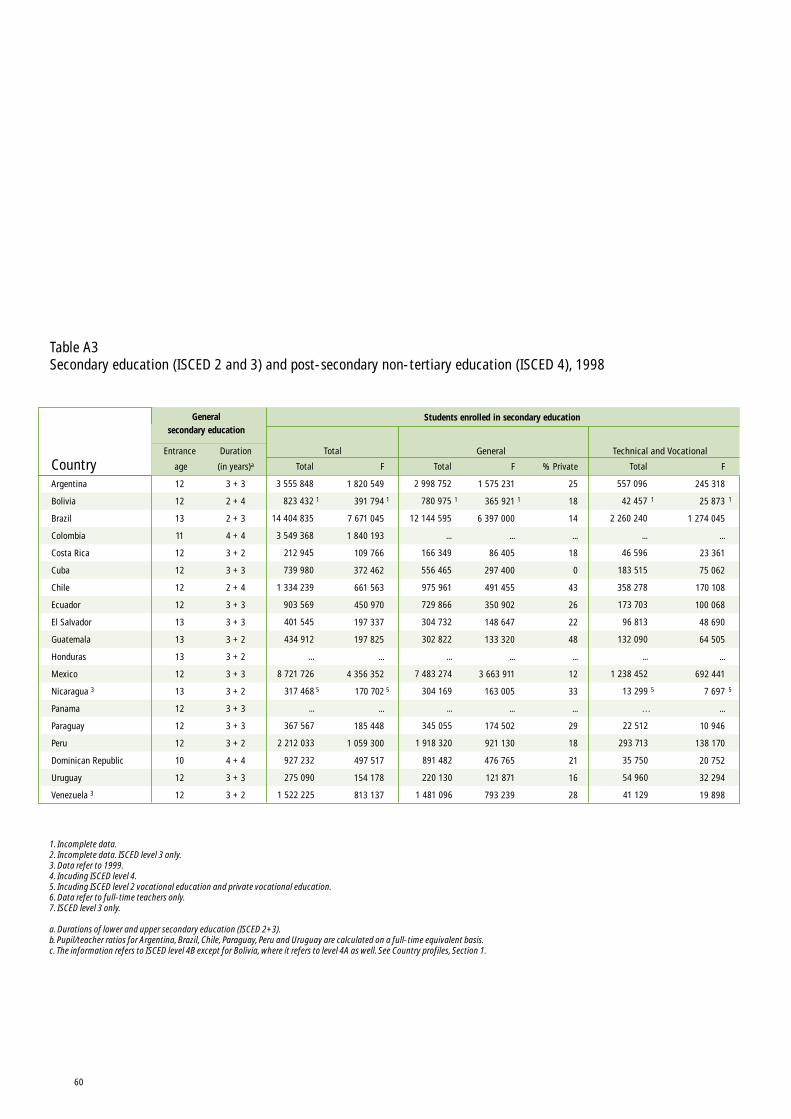
60
CountryArgentina
Bolivia
Brazil
Colombia
Costa Rica
Cuba
Chile
Ecuador
El Salvador
Guatemala
Honduras
Mexico
Nicaragua 3
Panama
Paraguay
Peru
Dominican Republic
Uruguay
Venezuela 3
Table A3Secondary education (ISCED 2 and 3) and post-secondary non-tertiary education (ISCED 4), 1998
12
12
13
11
12
12
12
12
13
13
13
12
13
12
12
12
10
12
12
3 + 3
2 + 4
2 + 3
4 + 4
3 + 2
3 + 3
2 + 4
3 + 3
3 + 3
3 + 2
3 + 2
3 + 3
3 + 2
3 + 3
3 + 3
3 + 2
4 + 4
3 + 3
3 + 2
Generalsecondary education
Total General Technical and Vocational
Students enrolled in secondary education
Total
3 555 848
823 432
14 404 835
3 549 368
212 945
739 980
1 334 239
903 569
401 545
434 912
...
8 721 726
317 468
...
367 567
2 212 033
927 232
275 090
1 522 225
1
5
Total
2 998 752
780 975
12 144 595
...
166 349
556 465
975 961
729 866
304 732
302 822
...
7 483 274
304 169
...
345 055
1 918 320
891 482
220 130
1 481 096
1
F
1 820 549
391 794
7 671 045
1 840 193
109 766
372 462
661 563
450 970
197 337
197 825
...
4 356 352
170 702
...
185 448
1 059 300
497 517
154 178
813 137
1
5
F
1 575 231
365 921
6 397 000
...
86 405
297 400
491 455
350 902
148 647
133 320
...
3 663 911
163 005
...
174 502
921 130
476 765
121 871
793 239
% Private
25
18
14
...
18
0
43
26
22
48
...
12
33
...
29
18
21
16
28
1
Total
557 096
42 457
2 260 240
...
46 596
183 515
358 278
173 703
96 813
132 090
...
1 238 452
13 299
…
22 512
293 713
35 750
54 960
41 129
1
5
F
245 318
25 873
1 274 045
...
23 361
75 062
170 108
100 068
48 690
64 505
...
692 441
7 697
...
10 946
138 170
20 752
32 294
19 898
1
5
1. Incomplete data.2. Incomplete data. ISCED level 3 only.3. Data refer to 1999.4. Incuding ISCED level 4.5. Incuding ISCED level 2 vocational education and private vocational education.6. Data refer to full-time teachers only.7. ISCED level 3 only. a. Durations of lower and upper secondary education (ISCED 2+3). b. Pupil/teacher ratios for Argentina, Brazil, Chile, Paraguay, Peru and Uruguay are calculated on a full-time equivalent basis. c. The information refers to ISCED level 4B except for Bolivia, where it refers to level 4A as well. See Country profiles, Section 1.
Entrance
age
Duration
(in years)a
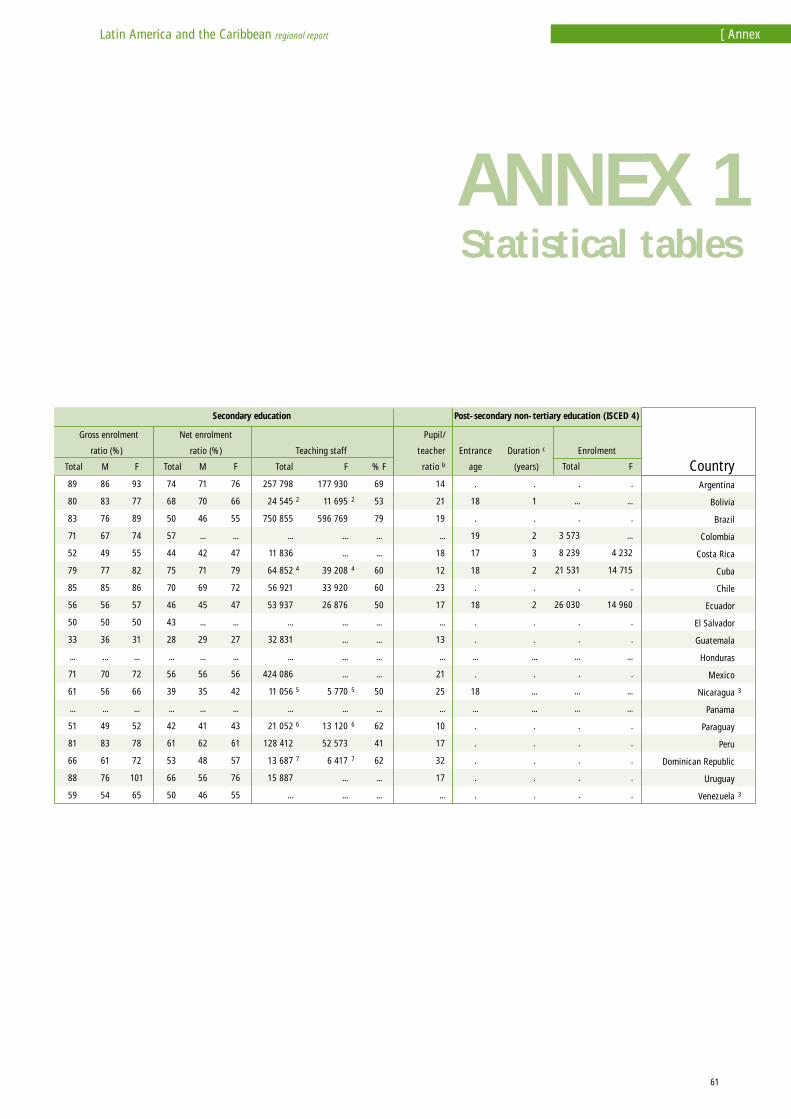
61
Latin America and the Caribbean regional report [ Annex
Gross enrolment
ratio (%)
Net enrolment
ratio (%) Teaching staff
Pupil/
teacher
ratio bEntrance
age
Duration c
(years)
Enrolment
Secondary education Post-secondary non-tertiary education (ISCED 4)
% F
69
53
79
...
...
60
60
50
...
...
...
...
50
...
62
41
62
...
...
Total
89
80
83
71
52
79
85
56
50
33
...
71
61
...
51
81
66
88
59
M
86
83
76
67
49
77
85
56
50
36
...
70
56
...
49
83
61
76
54
F
93
77
89
74
55
82
86
57
50
31
...
72
66
...
52
78
72
101
65
Total
74
68
50
57
44
75
70
46
43
28
...
56
39
...
42
61
53
66
50
M
71
70
46
...
42
71
69
45
...
29
...
56
35
...
41
62
48
56
46
F
76
66
55
...
47
79
72
47
...
27
...
56
42
...
43
61
57
76
55
2
4
5
6
7
14
21
19
...
18
12
23
17
...
13
...
21
25
...
10
17
32
17
...
.
18
.
19
17
18
.
18
.
.
...
.
18
...
.
.
.
.
.
.
1
.
2
3
2
.
2
.
.
...
.
...
...
.
.
.
.
.
Total
257 798
24 545
750 855
...
11 836
64 852
56 921
53 937
...
32 831
...
424 086
11 056
...
21 052
128 412
13 687
15 887
...
2
4
5
6
7
F
177 930
11 695
596 769
...
...
39 208
33 920
26 876
...
...
...
...
5 770
...
13 120
52 573
6 417
...
...
Total
.
...
.
3 573
8 239
21 531
.
26 030
.
.
...
.
...
...
.
.
.
.
.
F
.
...
.
...
4 232
14 715
.
14 960
.
.
...
.
...
...
.
.
.
.
.
3
3
CountryArgentina
Bolivia
Brazil
Colombia
Costa Rica
Cuba
Chile
Ecuador
El Salvador
Guatemala
Honduras
Mexico
Nicaragua
Panama
Paraguay
Peru
Dominican Republic
Uruguay
Venezuela
ANNEX 1Statistical tables
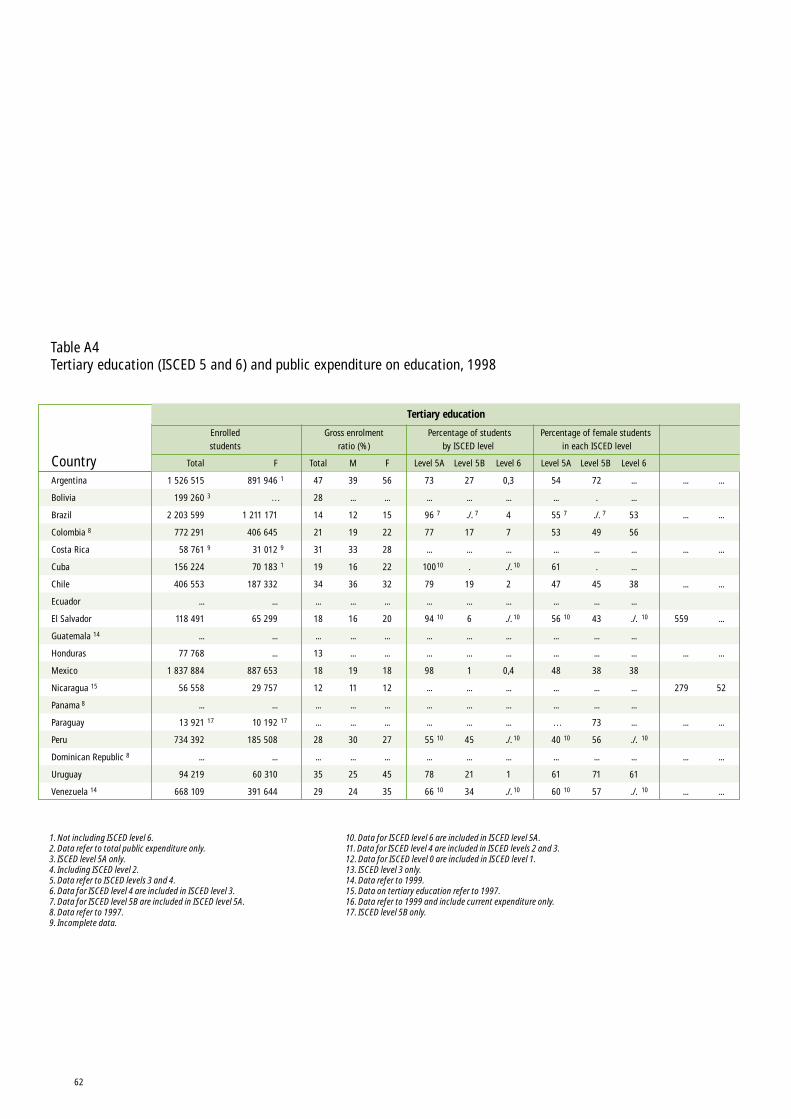
Foreignstudents
Total
...
...
...
...
...
3 740
...
...
559
...
...
...
279
...
...
...
...
...
...
F
...
...
...
...
...
...
...
...
...
...
...
...
52
...
...
...
...
...
...
3
CountryArgentina
Bolivia
Brazil
Colombia 8
Costa Rica
Cuba
Chile
Ecuador
El Salvador
Guatemala 14
Honduras
Mexico
Nicaragua 15
Panama 8
Paraguay
Peru
Dominican Republic 8
Uruguay
Venezuela 14
Total
1 526 515
199 260
2 203 599
772 291
58 761
156 224
406 553
...
118 491
...
77 768
1 837 884
56 558
...
13 921
734 392
...
94 219
668 109
F
891 946
…
1 211 171
406 645
31 012
70 183
187 332
...
65 299
...
...
887 653
29 757
...
10 192
185 508
...
60 310
391 644
3
9
17
1
9
1
17
Total
47
28
14
21
31
19
34
...
18
...
13
18
12
...
...
28
...
35
29
M
39
...
12
19
33
16
36
...
16
...
...
19
11
...
...
30
...
25
24
F
56
...
15
22
28
22
32
...
20
...
...
18
12
...
...
27
...
45
35
Level 5A
73
...
96
77
...
100
79
...
94
...
...
98
...
...
...
55
...
78
66
7
10
10
10
10
Level 5B
27
...
./.
17
...
.
19
...
6
...
...
1
...
...
...
45
...
21
34
7
Level 5A
54
...
55
53
...
61
47
...
56
...
...
48
...
...
…
40
...
61
60
7
10
10
10
Level 6
0,3
...
4
7
...
./.
2
...
./.
...
...
0,4
...
...
...
./.
...
1
./.
10
10
10
10
Level 6
...
...
53
56
...
...
38
...
./.
...
...
38
...
...
...
./.
...
61
./.
10
10
10
Enrolledstudents
Gross enrolmentratio (%)
Percentage of studentsby ISCED level
Percentage of female students in each ISCED level
1. Not including ISCED level 6. 2. Data refer to total public expenditure only. 3. ISCED level 5A only. 4. Including ISCED level 2. 5. Data refer to ISCED levels 3 and 4. 6. Data for ISCED level 4 are included in ISCED level 3. 7. Data for ISCED level 5B are included in ISCED level 5A. 8. Data refer to 1997. 9. Incomplete data.
10. Data for ISCED level 6 are included in ISCED level 5A. 11. Data for ISCED level 4 are included in ISCED levels 2 and 3. 12. Data for ISCED level 0 are included in ISCED level 1. 13. ISCED level 3 only. 14. Data refer to 1999. 15. Data on tertiary education refer to 1997. 16. Data refer to 1999 and include current expenditure only. 17. ISCED level 5B only.
Table A4Tertiary education (ISCED 5 and 6) and public expenditure on education, 1998
Level 5B
72
.
./.
49
...
.
45
...
43
...
...
38
...
...
73
56
...
71
57
7
Tertiary education
62
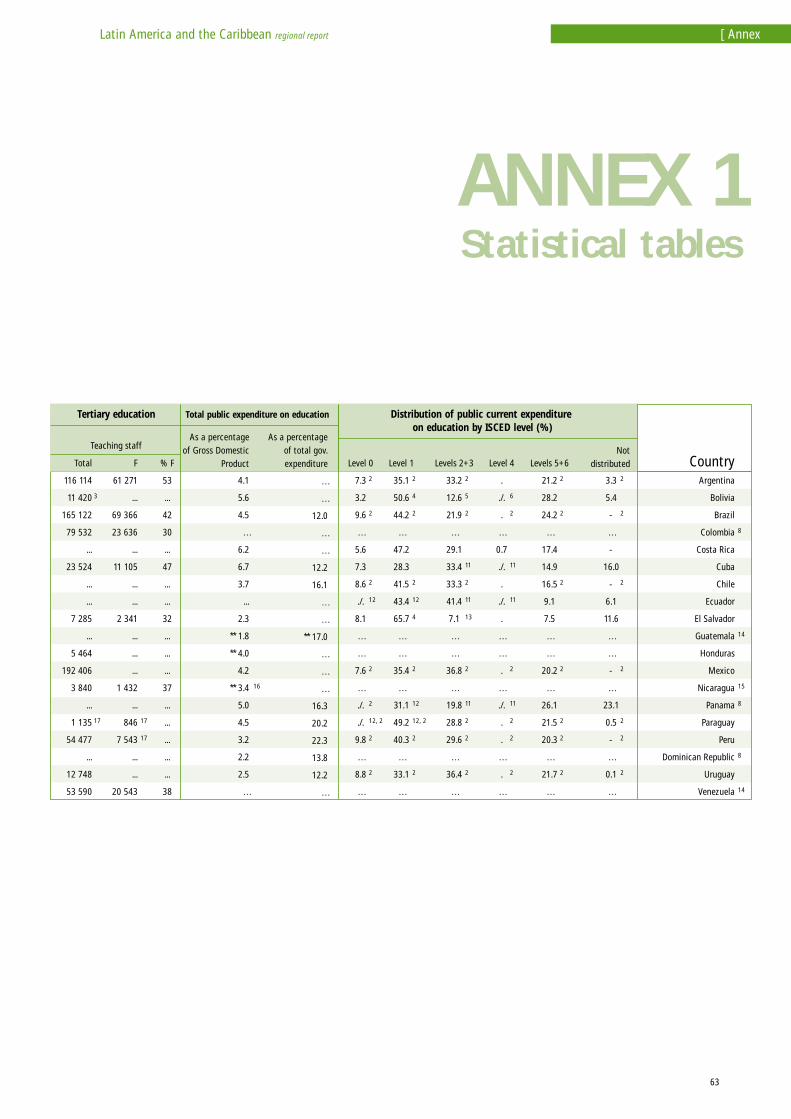
Levels 5+6
21.2
28.2
24.2
…
17.4
14.9
16.5
9.1
7.5
…
…
20.2
…
26.1
21.5
20.3
…
21.7
…
Total
116 114
11 420
165 122
79 532
...
23 524
...
...
7 285
...
5 464
192 406
3 840
...
1 135
54 477
...
12 748
53 590
F
61 271
...
69 366
23 636
...
11 105
...
...
2 341
...
...
...
1 432
...
846
7 543
...
...
20 543
3
17
17
17
% F
53
...
42
30
...
47
...
...
32
...
...
...
37
...
...
...
...
...
38
Teaching staff
16
4.1
5.6
4.5
…
6.2
6.7
3.7
...
2.3
** 1.8
** 4.0
4.2
** 3.4
5.0
4.5
3.2
2.2
2.5
…
As a percentageof Gross Domestic
Product
As a percentageof total gov.expenditure
…
…
12.0
…
…
12.2
16.1
…
…
** 17.0
…
…
…
16.3
20.2
22.3
13.8
12.2
…
Total public expenditure on education
Tertiary education Distribution of public current expenditure on education by ISCED level (%)
Level 0
7.3
3.2
9.6
…
5.6
7.3
8.6
./.
8.1
…
…
7.6
…
./.
./.
9.8
…
8.8
…
Level 1
35.1
50.6
44.2
…
47.2
28.3
41.5
43.4
65.7
…
…
35.4
…
31.1
49.2
40.3
…
33.1
…
Level 4
.
./.
.
…
0.7
./.
.
./.
.
…
…
.
…
./.
.
.
…
.
…
Levels 2+3
33.2
12.6
21.9
…
29.1
33.4
33.3
41.4
7.1
…
…
36.8
…
19.8
28.8
29.6
…
36.4
…
3.3
5.4
-
…
-
16.0
-
6.1
11.6
…
…
-
…
23.1
0.5
-
…
0.1
…
2
2
2
12
2
2
12, 2
2
2
2
4
2
2
12
4
2
12
12, 2
2
2
2
5
2
11
2
11
13
2
11
2
2
2
6
2
11
11
2
11
2
2
2
2
2
2
2
2
2
2
2
2
2
2
2
2
2
8
14
15
8
8
14
Notdistributed Country
Argentina
Bolivia
Brazil
Colombia
Costa Rica
Cuba
Chile
Ecuador
El Salvador
Guatemala
Honduras
Mexico
Nicaragua
Panama
Paraguay
Peru
Dominican Republic
Uruguay
Venezuela
ANNEX 1Statistical tables
Latin America and the Caribbean regional report [ Annex
63
ANN
EX 2
65
Latin America and the Caribbean regional report [ Annex
(Average) Annual Growth Rate (of population). Theaverage annual growth of the population during theperiod 1995 to 2000, expressed as a percentage.
Apparent intake rate in primary education. Numberof new entrants into first grade of primary education,regardless of age, expressed as a percentage of thepopulation of official entrance age to primaryeducation.
Coefficient of efficiency. The ideal number of pupil-years required for a cohort to complete a levelor cycle of education (e.g. the primary level) should there be no repetition nor drop-out, divided bythe total number of pupil-years actually spent by the same cohort.
Current expenditure per pupil (or student) as a percentage of GDP per capita. Public currentexpenditure per pupil (or student), at each level of education, expressed as a percentage of GDP percapita.
Gender parity index. Ratio of female to male values of a given indicator.
Gross enrolment ratio. Number of pupils enrolled in the given level of education, regardless of age,expressed as a percentage of the population in the relevant official age-group.
Gross enrolment ratio in tertiary education. Total enrolment in tertiary education regardless of age,expressed as a percentage of the population in the five-year age group following on from thesecondary-school leaving age.
Gross National Product per capita. The Gross National Product in current US dollars divided by thetotal population.
Infant mortality rate. The annual number of deaths of infants under 1 year of age per 1,000 livebirths in a given year.
Literacy rate. The number of literate adults expressed as a percentage of the total adult populationaged 15 years and above.
Net enrolment ratio. Number of pupils in the official age group for a given level of educationenrolled in that level expressed as a percentage of the total population in that age-group.
Net intake rate in primary education. Number of pupils at the official school entrance age who arenew entrants into the first grade of primary education, expressed as a percentage of the populationof official admission age to primary education.
Definitionsofindicators
66
Percentage of a cohort reaching grade 5, or survival rate to grade 5. Percentage of childrenstarting primary school who eventually attain grade 5.
Percentage of new entrants to primary grade 1 who have attended some form of organised earlychildhood development programme. Number of new entrants to primary grade 1 who haveattended some form of organised early childhood development programme equivalent to at least200 hours, expressed as a percentage of total number of new entrants to primary grade 1.
Percentage of repeaters. Number of pupils who are enrolled in the same grade (or level) as theprevious year, expressed as a percentage of the total enrolment in the given grade (or level) ofeducation.
Percentage of trained teachers, or percentage of teachers who are certified to teach accordingto national standards. Number of teachers who are certified to have received the minimumorganised teacher-training (pre-service or in-service) required for teaching at the relevant level ofeducation, expressed as a percentage of the total number of teachers in the given level of education.
Public expenditure on education as a percentage of total government expenditure. Total publicexpenditure on education at every level of administration according to the constitution of thecountry, i.e. central, regional and local authorities, expressed as a percentage of total governmentexpenditure on all sectors (including health, education, social services etc).
Public expenditure on education as a percentage of GDP. Total public expenditure on education atevery level of administration according to the constitution of the country, i.e. central, regional andlocal authorities, expressed as a percentage of the Gross Domestic Product.
Pupil/teacher ratio. Average number of pupils per teacher at the level of education specified in agiven school year. When data are available the calculation of the pupil/teacher ratio is based onteachers and pupils expressed in full-time equivalents.
Teachers' remuneration as a percentage of current expenditure on education. Public currentexpenditure on teachers' salaries and other remuneration expressed as a percentage of total publiccurrent expenditure on education.
School life expectancy. Number of years a child is expected to remain at school, or university,including years spent on repetition. It is the sum of the age-specific enrolment ratios for primary,secondary, post-secondary non-tertiary and tertiary education.
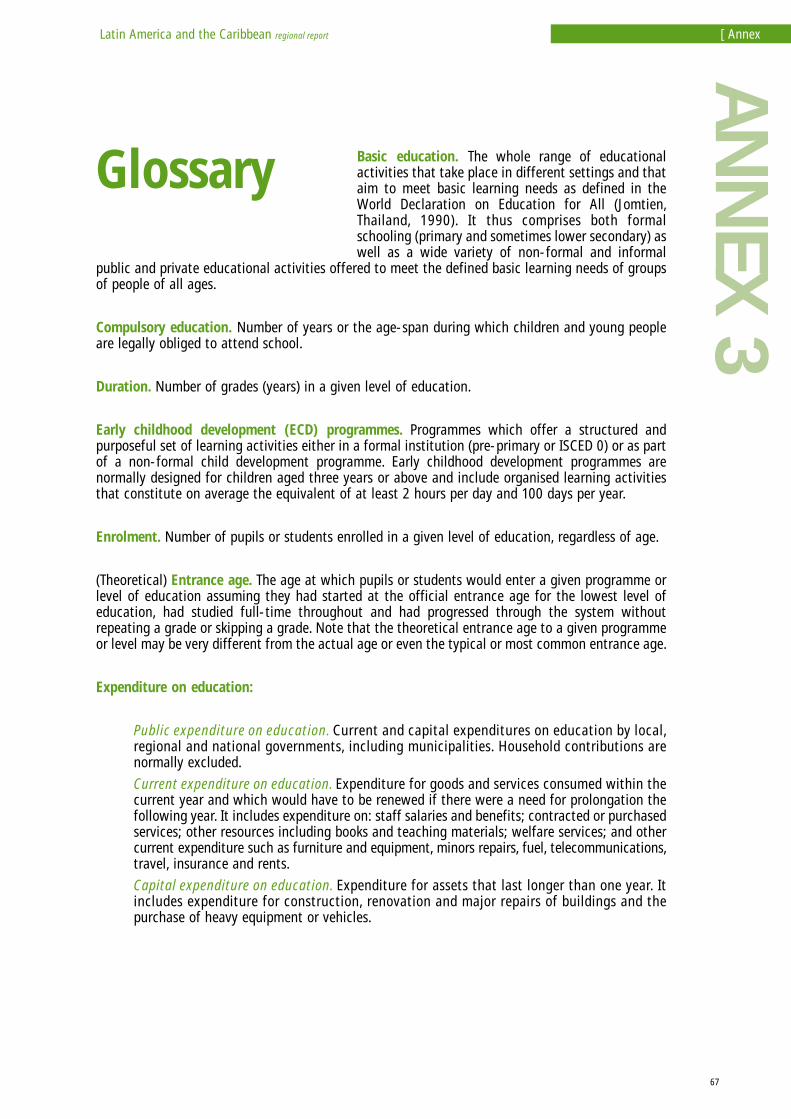
ANN
EX 3
67
Latin America and the Caribbean regional report [ Annex
Basic education. The whole range of educationalactivities that take place in different settings and thataim to meet basic learning needs as defined in theWorld Declaration on Education for All (Jomtien,Thailand, 1990). It thus comprises both formalschooling (primary and sometimes lower secondary) aswell as a wide variety of non-formal and informal
public and private educational activities offered to meet the defined basic learning needs of groupsof people of all ages.
Compulsory education. Number of years or the age-span during which children and young peopleare legally obliged to attend school.
Duration. Number of grades (years) in a given level of education.
Early childhood development (ECD) programmes. Programmes which offer a structured andpurposeful set of learning activities either in a formal institution (pre-primary or ISCED 0) or as partof a non-formal child development programme. Early childhood development programmes arenormally designed for children aged three years or above and include organised learning activitiesthat constitute on average the equivalent of at least 2 hours per day and 100 days per year.
Enrolment. Number of pupils or students enrolled in a given level of education, regardless of age.
(Theoretical) Entrance age. The age at which pupils or students would enter a given programme orlevel of education assuming they had started at the official entrance age for the lowest level ofeducation, had studied full-time throughout and had progressed through the system withoutrepeating a grade or skipping a grade. Note that the theoretical entrance age to a given programmeor level may be very different from the actual age or even the typical or most common entrance age.
Expenditure on education:
Public expenditure on education. Current and capital expenditures on education by local,regional and national governments, including municipalities. Household contributions arenormally excluded.
Current expenditure on education. Expenditure for goods and services consumed within thecurrent year and which would have to be renewed if there were a need for prolongation thefollowing year. It includes expenditure on: staff salaries and benefits; contracted or purchasedservices; other resources including books and teaching materials; welfare services; and othercurrent expenditure such as furniture and equipment, minors repairs, fuel, telecommunications,travel, insurance and rents.
Capital expenditure on education. Expenditure for assets that last longer than one year. Itincludes expenditure for construction, renovation and major repairs of buildings and thepurchase of heavy equipment or vehicles.
Glossary

68
Fields of study in tertiary or higher education:
General programmes: basic programmes; literacy and numeracy; personal development.
Education: teacher training and education science.
Humanities and arts: humanities; religion and theology; fine and applied arts.
Social science, business and law: social and behavioural sciences; journalism and information;business and administration; law.
Science: life and physical sciences; mathematics, statistics and computer sciences.
Engineering, manufacturing and construction: engineering and engineering trades; manufacturingand processing; architecture and building.
Agriculture: agriculture, forestry and fishery; veterinary.
Health and welfare: medical sciences and health-related services; social services.
Services: personal services; transport services; environmental protection; security services.
Other unspecified or unknown.
Foreign students. Students enrolled in an educational programme in a country of which they arenot a permanent resident.
Gross Domestic Product. The sum of gross value added by all resident producers in the economy,including distributive trades and transport, plus any product taxes and minus any subsidies notincluded in the value of the products.
Gross National Product. The sum of gross value added by all resident producers in the economy,including distributive trades and transport, plus any product taxes, minus any subsidies not includedin the value of the products plus net receipts of income from abroad. Since net receipts from abroadmay be positive or negative, it is possible for the GNP to be greater or smaller than the GDP.
Institutions:
Private institutions. Schools, colleges or universities which are controlled and managed by anon-governmental organisation (church, trade union, business enterprise or other NGO)whether or not they receive financial support from public authorities.
Public institutions. Schools, colleges or universities which are controlled and managed by apublic education authority or agency (national/federal, state/provincial, or local), whateverthe origin of its financial resources.
New entrants. Pupils or students entering a programme at a given level or sub-level of eduction forthe first time.
Orientation of educational programmes:
General education. Designed mainly to lead pupils to a deeper understanding of a subject orgroup of subjects, especially, but not necessarily, with a view to preparing pupils for further
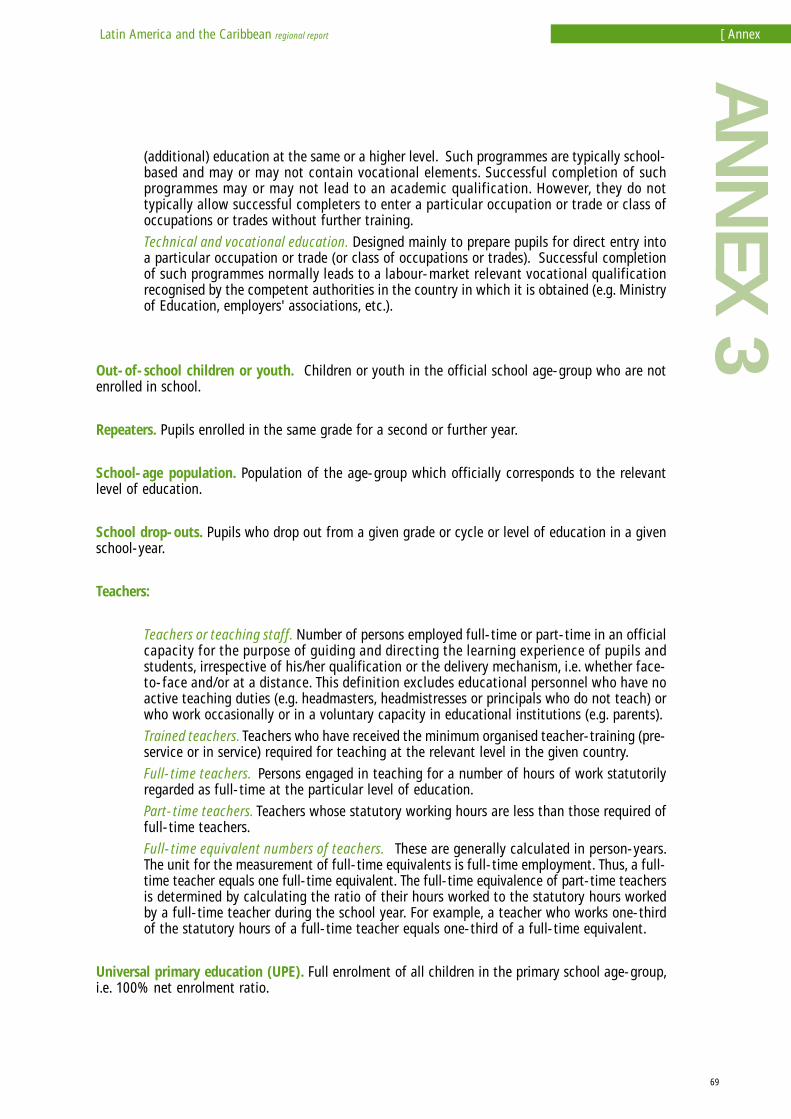
ANN
EX 3
69
Latin America and the Caribbean regional report [ Annex
(additional) education at the same or a higher level. Such programmes are typically school-based and may or may not contain vocational elements. Successful completion of suchprogrammes may or may not lead to an academic qualification. However, they do nottypically allow successful completers to enter a particular occupation or trade or class ofoccupations or trades without further training.
Technical and vocational education. Designed mainly to prepare pupils for direct entry intoa particular occupation or trade (or class of occupations or trades). Successful completionof such programmes normally leads to a labour-market relevant vocational qualificationrecognised by the competent authorities in the country in which it is obtained (e.g. Ministryof Education, employers' associations, etc.).
Out-of-school children or youth. Children or youth in the official school age-group who are notenrolled in school.
Repeaters. Pupils enrolled in the same grade for a second or further year.
School-age population. Population of the age-group which officially corresponds to the relevantlevel of education.
School drop-outs. Pupils who drop out from a given grade or cycle or level of education in a givenschool-year.
Teachers:
Teachers or teaching staff. Number of persons employed full-time or part-time in an officialcapacity for the purpose of guiding and directing the learning experience of pupils andstudents, irrespective of his/her qualification or the delivery mechanism, i.e. whether face-to-face and/or at a distance. This definition excludes educational personnel who have noactive teaching duties (e.g. headmasters, headmistresses or principals who do not teach) orwho work occasionally or in a voluntary capacity in educational institutions (e.g. parents).
Trained teachers. Teachers who have received the minimum organised teacher-training (pre-service or in service) required for teaching at the relevant level in the given country.
Full-time teachers. Persons engaged in teaching for a number of hours of work statutorilyregarded as full-time at the particular level of education.
Part-time teachers. Teachers whose statutory working hours are less than those required offull-time teachers.
Full-time equivalent numbers of teachers. These are generally calculated in person-years.The unit for the measurement of full-time equivalents is full-time employment. Thus, a full-time teacher equals one full-time equivalent. The full-time equivalence of part-time teachersis determined by calculating the ratio of their hours worked to the statutory hours workedby a full-time teacher during the school year. For example, a teacher who works one-thirdof the statutory hours of a full-time teacher equals one-third of a full-time equivalent.
Universal primary education (UPE). Full enrolment of all children in the primary school age-group,i.e. 100% net enrolment ratio.
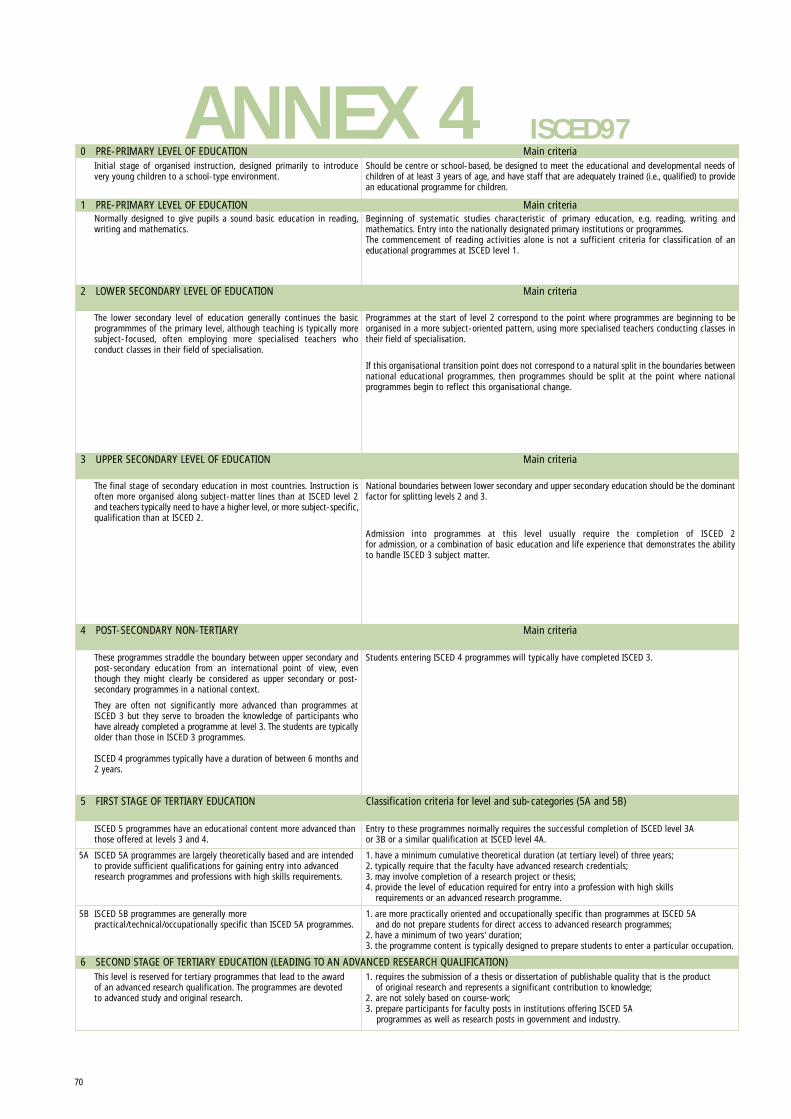
Entry to these programmes normally requires the successful completion of ISCED level 3Aor 3B or a similar qualification at ISCED level 4A.
1. have a minimum cumulative theoretical duration (at tertiary level) of three years; 2. typically require that the faculty have advanced research credentials;3. may involve completion of a research project or thesis;4. provide the level of education required for entry into a profession with high skills
requirements or an advanced research programme.
1. are more practically oriented and occupationally specific than programmes at ISCED 5Aand do not prepare students for direct access to advanced research programmes;
2. have a minimum of two years’ duration;3. the programme content is typically designed to prepare students to enter a particular occupation.
ISCED 5 programmes have an educational content more advanced thanthose offered at levels 3 and 4.
ISCED 5A programmes are largely theoretically based and are intendedto provide sufficient qualifications for gaining entry into advancedresearch programmes and professions with high skills requirements.
ISCED 5B programmes are generally morepractical/technical/occupationally specific than ISCED 5A programmes.
6 SECOND STAGE OF TERTIARY EDUCATION (LEADING TO AN ADVANCED RESEARCH QUALIFICATION)
2 LOWER SECONDARY LEVEL OF EDUCATION Main criteria
3 UPPER SECONDARY LEVEL OF EDUCATION Main criteria
4 POST-SECONDARY NON-TERTIARY Main criteria
1 PRE-PRIMARY LEVEL OF EDUCATION Main criteria
5 FIRST STAGE OF TERTIARY EDUCATION Classification criteria for level and sub-categories (5A and 5B)
Should be centre or school-based, be designed to meet the educational and developmental needs ofchildren of at least 3 years of age, and have staff that are adequately trained (i.e., qualified) to providean educational programme for children.
Programmes at the start of level 2 correspond to the point where programmes are beginning to beorganised in a more subject-oriented pattern, using more specialised teachers conducting classes intheir field of specialisation.
If this organisational transition point does not correspond to a natural split in the boundaries betweennational educational programmes, then programmes should be split at the point where nationalprogrammes begin to reflect this organisational change.
Beginning of systematic studies characteristic of primary education, e.g. reading, writing andmathematics. Entry into the nationally designated primary institutions or programmes.The commencement of reading activities alone is not a sufficient criteria for classification of aneducational programmes at ISCED level 1.
National boundaries between lower secondary and upper secondary education should be the dominantfactor for splitting levels 2 and 3.
Admission into programmes at this level usually require the completion of ISCED 2for admission, or a combination of basic education and life experience that demonstrates the abilityto handle ISCED 3 subject matter.
1. requires the submission of a thesis or dissertation of publishable quality that is the productof original research and represents a significant contribution to knowledge;
2. are not solely based on course-work;3. prepare participants for faculty posts in institutions offering ISCED 5A
programmes as well as research posts in government and industry.
Students entering ISCED 4 programmes will typically have completed ISCED 3.
The final stage of secondary education in most countries. Instruction isoften more organised along subject-matter lines than at ISCED level 2and teachers typically need to have a higher level, or more subject-specific,qualification than at ISCED 2.
Normally designed to give pupils a sound basic education in reading,writing and mathematics.
The lower secondary level of education generally continues the basicprogrammmes of the primary level, although teaching is typically moresubject-focused, often employing more specialised teachers whoconduct classes in their field of specialisation.
These programmes straddle the boundary between upper secondary andpost-secondary education from an international point of view, eventhough they might clearly be considered as upper secondary or post-secondary programmes in a national context.
They are often not significantly more advanced than programmes atISCED 3 but they serve to broaden the knowledge of participants whohave already completed a programme at level 3. The students are typicallyolder than those in ISCED 3 programmes.
ISCED 4 programmes typically have a duration of between 6 months and2 years.
This level is reserved for tertiary programmes that lead to the awardof an advanced research qualification. The programmes are devotedto advanced study and original research.
Initial stage of organised instruction, designed primarily to introducevery young children to a school-type environment.
0 PRE-PRIMARY LEVEL OF EDUCATION Main criteria
5A
5B
70
ANNEX 4 ISCED97
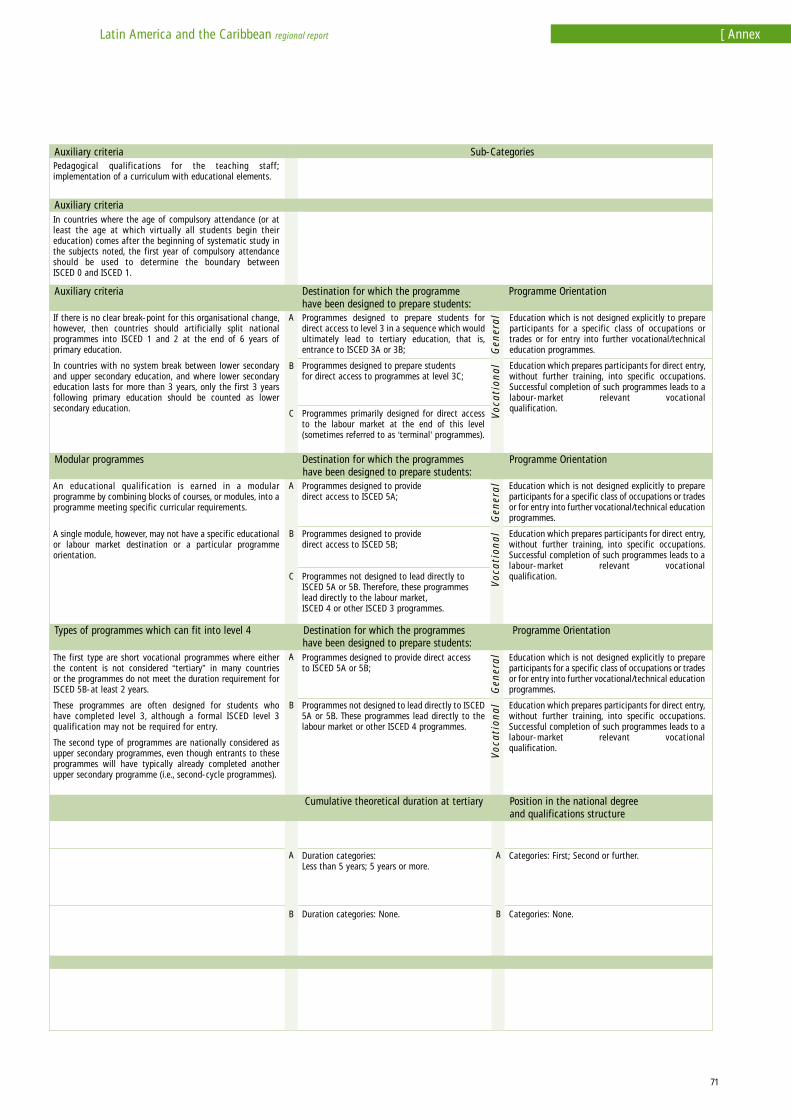
Gen
eral
Voca
tion
alG
ener
alVo
cati
onal
Gen
eral
Pedagogical qualifications for the teaching staff;implementation of a curriculum with educational elements.
An educational qualification is earned in a modularprogramme by combining blocks of courses, or modules, into aprogramme meeting specific curricular requirements.
A single module, however, may not have a specific educationalor labour market destination or a particular programmeorientation.
Programmes designed to prepare students fordirect access to level 3 in a sequence which wouldultimately lead to tertiary education, that is,entrance to ISCED 3A or 3B;
Programmes designed to prepare studentsfor direct access to programmes at level 3C;
Programmes primarily designed for direct accessto the labour market at the end of this level(sometimes referred to as ‘terminal’ programmes).
In countries where the age of compulsory attendance (or atleast the age at which virtually all students begin theireducation) comes after the beginning of systematic study in the subjects noted, the first year of compulsory attendanceshould be used to determine the boundary betweenISCED 0 and ISCED 1.
If there is no clear break-point for this organisational change,however, then countries should artificially split nationalprogrammes into ISCED 1 and 2 at the end of 6 years ofprimary education.
In countries with no system break between lower secondaryand upper secondary education, and where lower secondaryeducation lasts for more than 3 years, only the first 3 yearsfollowing primary education should be counted as lowersecondary education.
The first type are short vocational programmes where eitherthe content is not considered “tertiary” in many countriesor the programmes do not meet the duration requirement forISCED 5B-at least 2 years.
These programmes are often designed for students whohave completed level 3, although a formal ISCED level 3qualification may not be required for entry.
The second type of programmes are nationally considered asupper secondary programmes, even though entrants to theseprogrammes will have typically already completed anotherupper secondary programme (i.e., second-cycle programmes).
Categories: First; Second or further.
Categories: None.
Programmes designed to providedirect access to ISCED 5A;
Programmes designed to providedirect access to ISCED 5B;
Programmes not designed to lead directly toISCED 5A or 5B. Therefore, these programmeslead directly to the labour market,ISCED 4 or other ISCED 3 programmes.
Duration categories:Less than 5 years; 5 years or more.
Duration categories: None.
Programmes designed to provide direct accessto ISCED 5A or 5B;
Programmes not designed to lead directly to ISCED5A or 5B. These programmes lead directly to thelabour market or other ISCED 4 programmes.
Education which is not designed explicitly to prepareparticipants for a specific class of occupations or tradesor for entry into further vocational/technical educationprogrammes.
Education which prepares participants for direct entry,without further training, into specific occupations.Successful completion of such programmes leads to alabour-market relevant vocationalqualification.
Education which is not designed explicitly to prepareparticipants for a specific class of occupations ortrades or for entry into further vocational/technicaleducation programmes.
Education which prepares participants for direct entry,without further training, into specific occupations.Successful completion of such programmes leads to alabour-market relevant vocationalqualification.
A
B
C
A
B
C
A
B
A
B
A
B
Auxiliary criteria Sub-Categories
Auxiliary criteria
Auxiliary criteria Destination for which the programme Programme Orientationhave been designed to prepare students:
Types of programmes which can fit into level 4 Destination for which the programmes Programme Orientationhave been designed to prepare students:
Cumulative theoretical duration at tertiary Position in the national degreeand qualifications structure
Voca
tion
al
Modular programmes Destination for which the programmes Programme Orientationhave been designed to prepare students:
71
Latin America and the Caribbean regional report [ Annex
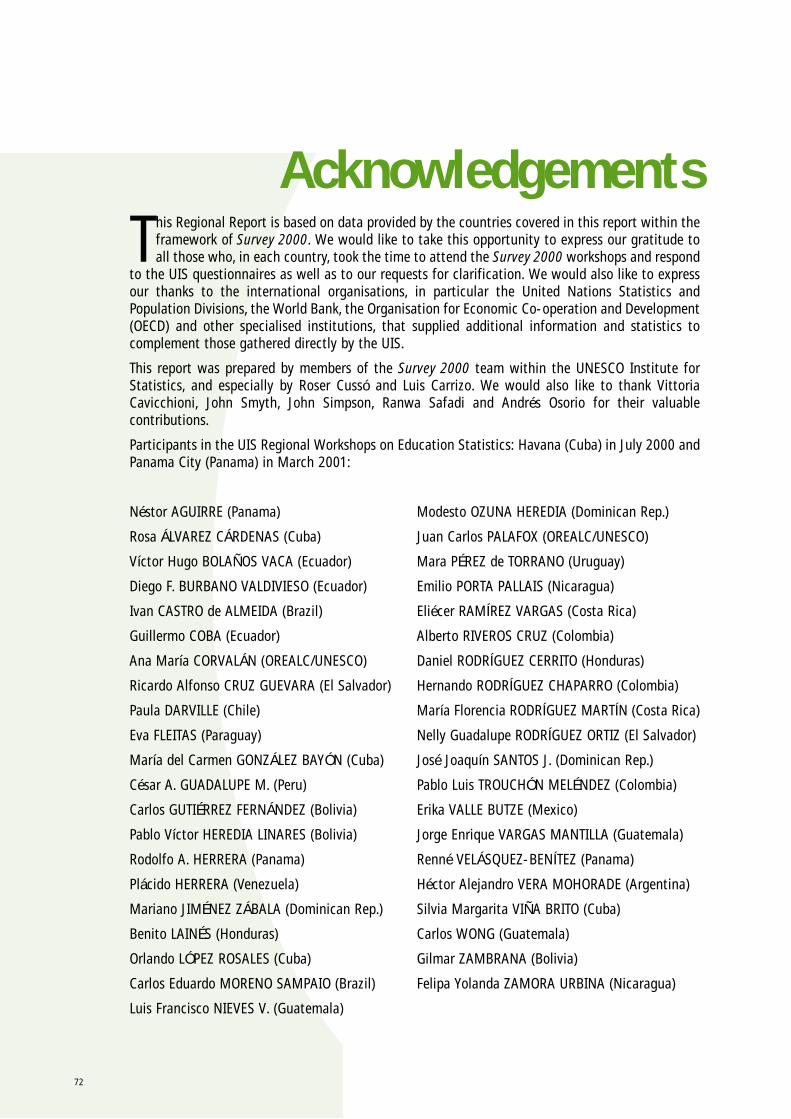
72
This Regional Report is based on data provided by the countries covered in this report within theframework of Survey 2000. We would like to take this opportunity to express our gratitude toall those who, in each country, took the time to attend the Survey 2000 workshops and respond
to the UIS questionnaires as well as to our requests for clarification. We would also like to expressour thanks to the international organisations, in particular the United Nations Statistics andPopulation Divisions, the World Bank, the Organisation for Economic Co-operation and Development(OECD) and other specialised institutions, that supplied additional information and statistics tocomplement those gathered directly by the UIS.
This report was prepared by members of the Survey 2000 team within the UNESCO Institute forStatistics, and especially by Roser Cussó and Luis Carrizo. We would also like to thank VittoriaCavicchioni, John Smyth, John Simpson, Ranwa Safadi and Andrés Osorio for their valuablecontributions.
Participants in the UIS Regional Workshops on Education Statistics: Havana (Cuba) in July 2000 andPanama City (Panama) in March 2001:
Néstor AGUIRRE (Panama) Modesto OZUNA HEREDIA (Dominican Rep.)
Rosa ÁLVAREZ CÁRDENAS (Cuba) Juan Carlos PALAFOX (OREALC/UNESCO)
Víctor Hugo BOLAÑOS VACA (Ecuador) Mara PÉREZ de TORRANO (Uruguay)
Diego F. BURBANO VALDIVIESO (Ecuador) Emilio PORTA PALLAIS (Nicaragua)
Ivan CASTRO de ALMEIDA (Brazil) Eliécer RAMÍREZ VARGAS (Costa Rica)
Guillermo COBA (Ecuador) Alberto RIVEROS CRUZ (Colombia)
Ana María CORVALÁN (OREALC/UNESCO) Daniel RODRÍGUEZ CERRITO (Honduras)
Ricardo Alfonso CRUZ GUEVARA (El Salvador) Hernando RODRÍGUEZ CHAPARRO (Colombia)
Paula DARVILLE (Chile) María Florencia RODRÍGUEZ MARTÍN (Costa Rica)
Eva FLEITAS (Paraguay) Nelly Guadalupe RODRÍGUEZ ORTIZ (El Salvador)
María del Carmen GONZÁLEZ BAYÓN (Cuba) José Joaquín SANTOS J. (Dominican Rep.)
César A. GUADALUPE M. (Peru) Pablo Luis TROUCHÓN MELÉNDEZ (Colombia)
Carlos GUTIÉRREZ FERNÁNDEZ (Bolivia) Erika VALLE BUTZE (Mexico)
Pablo Víctor HEREDIA LINARES (Bolivia) Jorge Enrique VARGAS MANTILLA (Guatemala)
Rodolfo A. HERRERA (Panama) Renné VELÁSQUEZ-BENÍTEZ (Panama)
Plácido HERRERA (Venezuela) Héctor Alejandro VERA MOHORADE (Argentina)
Mariano JIMÉNEZ ZÁBALA (Dominican Rep.) Silvia Margarita VIÑA BRITO (Cuba)
Benito LAINÉS (Honduras) Carlos WONG (Guatemala)
Orlando LÓPEZ ROSALES (Cuba) Gilmar ZAMBRANA (Bolivia)
Carlos Eduardo MORENO SAMPAIO (Brazil) Felipa Yolanda ZAMORA URBINA (Nicaragua)
Luis Francisco NIEVES V. (Guatemala)
Acknowledgements
Latin America and The Caribbean
Errata
Data for Bolivia, Costa Rica and Guatemala refer to 1999.
Page 56-57
Table A1
Pre-primary (ISCED 0) and other early childhood development programmes (ECD), 1998
The pupil/teacher ratio for Chile should be the symbol…(missing data).
Page 58
Table A2
Primary education (ISCED 1) and school life expectancy, 1998
The published numbers for AIR (apparent intake rate) and NIR (net intake rate) for Ecuador are
incorrect and we do not have data that allow us to recalculate these indicators.
Page 60-61
Table A3
Secondary Education (ISCED 2 and 3) and post-secondary non-tertiary education (ISCED
4), 1998
Pupil/Teacher Ratio:
Brazil should say 36
Chile should say 29
Uruguay should say 15