Latest developments in LNG export capabilities of the ... · demand growth to weaken from a decade...
24
IEEJ:August 2015 © IEEJ2015 1 Latest developments in LNG export capabilities of the United States, Canada, Australia, and Russia Aimee Hoffman Researcher, Oil Sub-Unit Introduction The global energy landscape has experienced an incredible shift this past year. Last year, signs of a global crude oil supply glut began to weaken crude oil prices. This was exacerbated in the second half of last year when the Organization of the Petroleum Exporting Countries (OPEC) made a decision to uphold high oil production in the region. It is suspected they maintained high supply to lower the price of oil in an attempt to protect market share and squeeze out high cost producers. i This has had wide-reaching repercussions on economies and energy companies worldwide. It has forced reductions in capital expenditures and modifications to future strategies across several sectors. The decline in oil price has had varying consequences on global liquefied natural gas (LNG) development especially in resource rich economies such as the United States, Canada, Australia, and Russia that are in the process of developing and increasing export capacity. LNG trade has increased substantially over the past decade. Since 2005, LNG exports have increased 70% with supply capacity set to increase another 40% in the next five years. 1 Imports into Asia alone have grown 95% in a decade, increasing Asia’s share of total global imports from 65% in 2005 to 75% in 2014. 2 The burgeoning LNG demand in Asia has led current and potential LNG exporters to invest significant capital across multiple export infrastructure projects. When crude oil price remained over $100/bbl, project economics were favorable and LNG infrastructure development was worthwhile. The oil-linked prices of LNG flowing into Asia resulted in attractive arbitrage opportunities for new developers; however, when oil prices plummeted it diminished the arbitrage opportunity and the allure of several high cost liquefaction projects. Not only has the oil price decline dampened LNG export development appeal, but the International Energy Agency (IEA) forecasts global natural gas demand growth to weaken from a decade of 2.3% growth per annum to 2% per annum until 2020. 3 The recent oil price collapse and the reduced natural gas demand forecasts cause uncertainties for the future of LNG. For natural gas importers, such as Japan, the next decade will be one of determining the best new LNG supply opportunities. The United States, Canada, Australia, and Russia are all contenders in becoming new LNG supply sources but face new challenges in a low oil price environment and a weakened demand forecast. This report will examine the challenges and opportunities faced in LNG export development in the United States, Canada, Australia, and Russia. i It is presumed high cost U.S. shale production was a target.
Transcript of Latest developments in LNG export capabilities of the ... · demand growth to weaken from a decade...
IEEJ:August 2015 © IEEJ2015
1
Latest developments in LNG export capabilities of the United States,
Canada, Australia, and Russia
Aimee Hoffman
Researcher, Oil Sub-Unit
Introduction
The global energy landscape has experienced an incredible shift this past year. Last
year, signs of a global crude oil supply glut began to weaken crude oil prices. This was
exacerbated in the second half of last year when the Organization of the Petroleum Exporting
Countries (OPEC) made a decision to uphold high oil production in the region. It is suspected
they maintained high supply to lower the price of oil in an attempt to protect market share and
squeeze out high cost producers.i This has had wide-reaching repercussions on economies and
energy companies worldwide. It has forced reductions in capital expenditures and
modifications to future strategies across several sectors. The decline in oil price has had
varying consequences on global liquefied natural gas (LNG) development especially in resource
rich economies such as the United States, Canada, Australia, and Russia that are in the process
of developing and increasing export capacity.
LNG trade has increased substantially over the past decade. Since 2005, LNG
exports have increased 70% with supply capacity set to increase another 40% in the next five
years.1 Imports into Asia alone have grown 95% in a decade, increasing Asia’s share of total
global imports from 65% in 2005 to 75% in 2014.2 The burgeoning LNG demand in Asia has
led current and potential LNG exporters to invest significant capital across multiple export
infrastructure projects. When crude oil price remained over $100/bbl, project economics were
favorable and LNG infrastructure development was worthwhile. The oil-linked prices of LNG
flowing into Asia resulted in attractive arbitrage opportunities for new developers; however,
when oil prices plummeted it diminished the arbitrage opportunity and the allure of several high
cost liquefaction projects. Not only has the oil price decline dampened LNG export
development appeal, but the International Energy Agency (IEA) forecasts global natural gas
demand growth to weaken from a decade of 2.3% growth per annum to 2% per annum until
2020.3 The recent oil price collapse and the reduced natural gas demand forecasts cause
uncertainties for the future of LNG. For natural gas importers, such as Japan, the next decade
will be one of determining the best new LNG supply opportunities. The United States, Canada,
Australia, and Russia are all contenders in becoming new LNG supply sources but face new
challenges in a low oil price environment and a weakened demand forecast. This report will
examine the challenges and opportunities faced in LNG export development in the United States,
Canada, Australia, and Russia.
i It is presumed high cost U.S. shale production was a target.

IEEJ:August 2015 © IEEJ2015
2
1. Current Natural Gas Sectors:
Table 1.0 - Natural Gas Reserves
Country Proved Natural
Gas Reserves Tcf
(BP)
% of World Estimated Technically
Recoverable Shale
Gas Resources Tcf
(EIA)
Rank in World
Russia 1153 17.4% 285 9
U.S. 345 5.2% 665 4
Australia 132 2.0% 437 7
Canada 72 1.0% 573 5
Source: BP, “BP Statistical Review of World Energy June 2015” & EIA “Technically Recoverable
Shale Oil and Shale Gas Resources”, 2013
The United States produces 21.4% and consumes 22.7% of the world’s total natural
gas, making it both the largest producer and consumer of natural gas in the world.4 Production
has been rapidly increasing, with total dry natural gas production growing 33% since 2007.5
The increase is enabled by the advancement in shale gas extraction technologies. Shale gas
production alone has grown sevenfold since 2007 and has advanced from contributing to 9% of
total production to over 50% presently.6 Production growth is expected to continue as the U.S.
Energy Information Administration (EIA) forecasts growth of 10% from 2015 to 2020 and
another 22% from 2020-2040.7 Currently in the United States, there are five LNG export
plantsii under construction with total liquefaction capacity of 53.4 million tonnes per annum
(mtpa) and will place the United States as the third largest LNG exporter by 2020. The
projects already under construction will be developed regardless of the oil price decline. The
United States has traditionally been a net importer of gas; however, due to increased production,
decreased imports, and the development of LNG export infrastructure, the country is forecasted
to become a net exporter of gas by 2017.8
Canada’s natural gas production has been declining an average of 2% per year since
2005, but grew 4% from 2013 to 2014 due to rising shale gas production.9 Canada is one of
the four countriesiii in the world that produces commercial volumes of shale gas. In May of
ii Four terminals in the Gulf of Mexico and one on the Northeast Coast in Maryland
iii The four countries producing commercial volumes of Shale Gas and Tight Oil is the United States,
Canada, China, and Argentina

IEEJ:August 2015 © IEEJ2015
3
2014 shale gas production had doubled since 2001.10
Many Shale resources are still largely
undeveloped leaving great potential for further production. Canada solely relies on the U.S.
market for gas exports and over the past decade has exported around 50% of natural gas
produced per year to the United States.11
Increased U.S. production has directly displaced
Canadian gas and since 2005, Canada’s natural gas exports have decreased over 25% and
consequently production volumes have decreased by 13%.12
As the United States becomes
increasingly independent, Canada must diversify its energy markets and is focusing on LNG to
do so. Currently, on the West Coast of Canada there are several proposed LNG terminals at
various stages of the approval process, but no projects have taken a Final Investment Decision
(FID).iv Canadian projects are greenfield therefore require significant investments especially
due to the remoteness and the need for new pipeline systems through difficult terrain. Since
the oil price collapsed, the viability of the capital intensive Canadian LNG infrastructure is
being questioned; therefore optimism of completed development before 2020 is weakening. If
LNG development does not advance it will have diminishing effects on production as seen in
Figure 1.0.
Australia’s natural gas sector has experienced phenomenal growth over the past
decade. Production has grown 49% since 2005 and LNG exports have increased 107% from
iv Petronas led Pacific Northwest LNG has taken a conditional FID pending federal environmental
approval due in September 2015
Figure 1.0 - Canadian Production Forecasts
Source: Canadian Association of Petroleum Producers (CAPP), “Natural Gas Production Forecast”, 2015

IEEJ:August 2015 © IEEJ2015
4
0
100
200
300
400
500
600
700
800
Production
Consumption
2005 2014 2005 2014 2005 2014 2005 2014
Canada USA Russia Australia
Bcm
11.411 mtpa in 2005 to 23.6 mtpa in 2014.13
Australia’s shale gas remains largely undeveloped,
but Australia is a top producer of coal seam gas (CSG, or CBM (coalbed methane)) and has
already been home to the first CBM-based liquefaction facilities. In 2014 Australia exported
57% of produced natural gas as LNG, with about 80% of exports flowing into Japan.14
Australia has an advantage over other new supply sources as LNG development is well under
way and Australia is set to become the world’s largest LNG exporter by 2020. Australia’s first
plant was in 1989, the North West Shelf, with initial capacity of 7.5 mtpa.v Three more plants
have become operational since and currently there are six projects under construction. If
construction is completed on schedule, LNG liquefaction capacity is expected to grow to 85
mtpa by 2020.15
Russia holds 17.4% of the world’s natural gas reserves which is the second largest
amount in the world.16
Russian production and exports have decreased in the past year due to
both the oil and gas price decline’s effect on the economy and state-owned energy giant
Gazprom as well as decreased demand from Europe and specifically Ukraine. Russia’s share
in Ukraine’s gas market was 74% in 2014 and has dropped to 37% in the first half of 2015.17
In 2014, 93% of exports were via pipeline into Europe and the Former Soviet Union; however,
pipeline exports into Europe from 2013 to 2014 have fallen by 9% from 162.4 Bcm to 147.7
Bcm and exports from Russia into the Former Soviet Union have fallen by 19% from 48.9 Bcm
to 39.8 Bcm.18
Russian natural gas production has remained fairly flat since 2005, but has
fallen 4% from 2013 to 2014 and Gazprom, which produces around 75% of Russia’ s gas, has
forecasted another drop of 6.7% in 2015 production.19
LNG accounts for the remaining 7% of
v Has since increased to 16.5mtpa.
Figure 1.1 - Natural Gas Production vs Consumption in 2005 and 2014
Source: BP, “BP Statistical Review of World Energy 2015”, 2015

IEEJ:August 2015 © IEEJ2015
5
exports. Russia’s first and only LNG plant, the Sakhalin 2, became operational in 2009 with a
capacity of 9.6 mtpa. The plant is located on the East Coast of Russia and on average 80% of
exported LNG flows into Japan.20
Russia has proposed three additional LNG plans with the
Yamal LNG project looking the most optimistic at this time. Imposed sanctions have limited
Russia’s ability to access financing from the West that is required to fund LNG development,
therefore diminishing optimism of LNG development, besides Yamal LNG, before 2020.
Additionally, strained geopolitical relations with the West and the forthcoming increase of gas
supply into Europe from North America have shifted Russia’s focus to increasing pipeline
capacity into China. Two major proposed pipelines in agreement with China are the Power of
Siberia and Altai pipelines seen in Figure 1.2.vi
2. Effects of Crude Oil Price Decline on GDP and economic growth
As the largest energy consumer in the world, the United States economy was impacted less
by the oil price decline as the low energy prices led to increased domestic energy consumption
through energy savings. The United States economy is diverse therefore decreases in one
sector can spur growth in another sector; therefore although the oil price has had some declining
effects on the stock market, the energy cost savings allow consumers to spend elsewhere and
help offset negative effects of the oil price decline.
Canada suffered from the decline in oil price as the oil and gas industries contribute to
7.5% of total GDP, 29% of merchandise exports, and 21% of Canadian capital expenditures.21
vi Power of Siberia has a capacity of 61 Bcm/yr and China has signed a 30 year contract for supplies of
38 Bcm/yr and the Altai has a planned capacity of 30 Bcm/yr
Source: Gazprom, 2015
Figure 1.2 - Proposed Russian Pipelines into China

IEEJ:August 2015 © IEEJ2015
6
The Canadian dollar has depreciated 18% from CAD.94/USD in July 2014 to CAD.77/USD in
July of 2015, which has helped only slightly to alleviate the hit on the energy sector in terms of
exports and energy consumption. It is estimated that over 40,000 indirect and direct jobs in the
energy sector in Canada, a majority in Alberta, have been lost.22
The outlook for 2015 growth
has weakened as GDP forecasts by IMF in June 2015 were revised downwards .7% from April
2015 forecasts to 1.5% with 2016 GDP growth remaining at 2.1%.
Australia’s economy is more diversified and less reliant on oil and gas revenues as it
only accounts for 2% of GDP and 11.3% of export revenue.23
The Australian dollar
depreciated over 20% since mid-2014 from AUD.93/USD to AUD.72/USD in July 2015. This
was a relief for Australia as the inflated currency rate was hindering domestic industries
including LNG development.
Russia was the most impacted by the oil price decline as Russia heavily relies on the
oil and gas sector as an economic driver. Oil and gas exports made up 68% of total exports
revenues in 2013 and oil and gas activities made up roughly 50% of Russia’s federal budget
revenues.24
Geopolitical tensions and Western sanctions further economic woes and limited
investments. The ruble has depreciated over 35% since mid-2014 year and GDP is forecasted
to decline 3.4% in 2015 and grow minimally at 0.2% in 2016.25
Gazprom accounted for 9% of
Russian budget revenues in 2014 and it is predicted that the drop in gas prices and drop in
production will lead to a 27% decrease in Gazprom’s revenue.26
-10%
-8%
-6%
-4%
-2%
0%
2%
4%
6%
8%
10%
12%
Canada
Russia
Australia
United States
Source: IMF, United States, Canada, Australia, and Russia GDP Data, 2015
Figure 2.0 - Annual GDP Growth Rates

IEEJ:August 2015 © IEEJ2015
7
Overall assessment
Security risk
Political stability risk
Government effectiveness risk
Legal & regulatory risk
Foreign trade & payments …
Russia
US
Canada
Australia
3. Political Environments:
Source: The Economist’s Intelligence Unit, ViewsWire, “Risk Briefing-Australia”, “Risk Briefing- United
States of America”,” Risk Briefing- Russia”, “Risk Briefing- Canada”, 2015
As seen in Figure 3.0, Canada and Australia are both viewed globally as politically
stable countries with low risk when it comes to foreign trade and government effectiveness.
Canadian Federal elections will take place in October 2015 which could see a change in
political parties and could have implications on the energy sector. The United States has a
stable political environment, but as seen in Figure 3.0, holds slightly more risk than Canada and
Australia in terms of foreign trade and government effectiveness. The US will also be having
a Presidential election in November of 2016 which could have implications on the energy sector
and economy therefore it will be important to follow the progress in these elections. The
United States, Canada, and Australia all have a strong legal system and overall are have low
political risk.
Russia, however, holds a considerable amount of risk and instability especially due to
the recent Russian invasion of the Ukraine. The United States together with the European Union
(EU) and other international leaders have imposed sanctions to directly affect Russia’s energy
industry. These targeted sanctions limit financing to six of Russia’s largest banks and four
energy companies, and prohibit any support from the international partners for exploration and
production of Deepwater, Arctic offshore, or shale projects in Russia.27
Recently in July 2015,
the U.S. has increased sanctions to 15 more companies including affiliates of Rosneft and the
major bank Vnesheconombank, which is increasing tensions between the U.S. and Russia.
Russian companies have had to find alternate solutions to work around sanctions. One such
alternative was a recent agreement between Novatek and China National Petroleum Corporation
(CNPC) to receive nearly USD 20 billion for the development of the Yamal LNG project as
Less Risk More Risk
Figure 3.0 - Risk Ratings

IEEJ:August 2015 © IEEJ2015
8
China is not included in the sanctioning countries.vii
Additionally, international oil companies
such as BP and Shell have pledged to stay committed to maintaining business relationships with
Russia while abiding by the rules of the imposed sanctions.viii
The BRICS New Development
Bank that has been launched this year as well as increased investments from Saudi Arabia will
also ease Russian financial woes.ix
4. LNG Regulatory Environments:
4.1 United States
The United States has experienced longer approval times than expected by the industry with
both environmental and export authorizations for LNG plants; although authorities have made
policy improvements at the request of the industry. Two of the major approvals that must be
obtained are the Environmental Assessment or Environmental Impact Statement from the
Federal Energy Regulatory Commission (FERC) and two separate export licenses from the
Department of Energy (DOE), one for Free Trade Agreement (FTA) countries and one for
non-FTA countries.x Sabine pass LNG was approved by FERC in April of 2012, but the other
four projects were not approved until the end of 2014. Projects still continue to face hurdles
with FERC; for example, very recently, Veresen led Jordan Cove LNG, a U.S. West Coast
project, was notified by FERC that the environmental review would be delayed another six
months to mid-2016 for unexpected reasons. Authorities claim that environmental assessment
delays are a result of an increased work load and complexity in consolidating several
government agency assessments.28
It is likely that environmental assessments for greenfield
projects will continue to face hurdles, but additional liquefaction capacity to preexisting
infrastructure should be permitted more easily.
Acquiring an export license for non-FTA countries has also experienced longer times in
approval by the DOE. Three recent projects waited an average of 100 days for export approval
even after all environmental certificates were obtained. Projects were assessed in order that
they had applied rather than commercially mature projects before early stage projects. The
DOE recognized this was ineffective as 24 proposals were queued, including many that would
vii
The sanctions had delayed project financing of the 16.5 mtpa Yamal LNG project which needs USD 20
billion in loans over the next 15 years in order to produce the first round of gas at 5.5 mtpa by 2017 and
reach total capacity of 16.5 mtpa by 2021 viii
Shell has recently signed an agreement with Gazprom to develop a third train (5mtpa) at the Sakhalin
2 plant and Gazprom has also signed a proposed agreement with Shell, Germany’s E.ON and Austria’s
OMV to double the capacity of the Nord Stream Pipeline into Europe. The Nord Stream 2 will have
86% of the same route as Nord Stream 1 ix
BRICS stands for Brazil, Russia, India, China, and South Africa x Offshore must receive environmental approval from the Maritime Administration (MARAD) and the
United States Coast Guard (USCG)

IEEJ:August 2015 © IEEJ2015
9
not near fruition.29
Therefore, the DOE improved this by changing the assessment schedule to
prioritizing the assessment of commercially mature projects and more recently enacted
legislation that the DOE must give their decision within 45-days of environmental approval.
Another concern is the effects that increased fracking regulation will have on future shale
gas production. New federal legislation includes increased government inspection and requires
that companies must publicly disclose the chemicals used in fracking. As only a minor amount
of production occurs on federal land this will not affect production directly, but it could become
a standard for state legislatures who are in the process of forming state fracking laws therefore
could lead to increased regulatory burdens and production costs of shale gas.30
4.2 Canada
Canada is facing considerable regulatory burdens that have led to delays and
additional costs for project developers. Export licenses are granted by the Canadian National
Energy Board (NEB) and the approval rate has been high; however, environmental approvals
have seen less success. Canadian West Coast projects must receive both the British Columbia
(B.C.) Environmental Assessment Certificate (BCEAA) and the Canadian Environmental
Assessment Act (CEAA) Decision Statement. Only two projects out of the proposed 19 on the
West Coast have all necessary environmental certifications; however the approved projects
don’t foresee FID’s until 2016.xi
Similar to the United States the slow progress in
environmental approval can be attributed somewhat to the sudden increase in applications
leading to strained regulatory resources, but process improvements are expected. Canadian
projects do not only experience lengthy and thorough environmental approvals, but project
developers must dedicate resources and time engaging with First Nation communities.xii
Negotiations are ongoing and thorough with the First Nations who inhabit most of the land in
B.C. where developers are hoping to build plants and pipelines. Many energy companies have
developed strong relations with First Nations groups through revenue agreements, employment
opportunities, and community enhancement. There has been an increase in First Nation’s
support of LNG development with the creation of groups such as the B.C. First Nations-LNG
alliance which is a group created by First Nations that support the industry. Further, 28 First
Nations groups have signed revenue sharing agreements with the B.C. government which aids
in reducing financial investment risk for the developers and exhibits additional support.31
Negotiations are not always successful as exemplified by the Petronas led Pacific Northwest
LNG project’s offer being rejected by the Lax Kw’alaams First Nation Group. The Lax
xi
Shell led LNG Canada and Chevron/Woodside Kitimat LNG have both received all necessary
certification xii
First Nations refers to the aboriginal people of Canada who have historical connections to the land
needed for LNG infrastructure. They must be consulted before development may take place.

IEEJ:August 2015 © IEEJ2015
10
Kw’alaams rejected a USD 1 billion benefit package for the development of the export project
on their land due to the potential environmental impacts to a salmon habitat. Energy
companies and developers must take time to cooperate with First Nation’s groups to ensure long
lasting relationships to ease any future risk.
Both the provincial and federal governments have made efforts to alleviate
development delays as they see the importance and potential in the LNG industry for Canada.
Recently the B.C. Government has lowered the LNG income tax and the Federal government
has raised the capital cost allowance to lower tax payments and aid projects in recovering
capital costs more rapidly.xiii
The B.C. government also passed legislature, the Liquefied
Natural Gas Agreement, which allows the B.C. government to sign project agreements that lock
in current provincial taxes and royalties to protect them against any unfavorable future changes
in LNG income tax, carbon tax, or natural gas tax credits.32
4.3 Australia
Australia is facing increasing regulatory burdens as increases in domestic gas prices
and availability of gas supply has caused concern from regulatory authorities. The first signs
of increased domestic gas prices appeared in 2004 when initial export contracts were first
renegotiated with North West Shelf LNG (Western Australia). This caused domestic prices to
jump from USD 2.23/mmbtu to USD3.95-6.05/mmbtu in a year as they became tied with
international gas prices.33
As a result, the Western Australian state government implemented a
domestic gas reservation policy of 15% for the LNG projects. Gas reservation policies in the
West are agreed on a case-by-case basis and if LNG developers are not satisfied they may resort
to project relocation.34
In Eastern Australia, where around 50% of the Australian population lives, there is
increasing concern that there could be domestic supply issues as three new CSG LNG projects
come online in 2015-2016.xiv
Not only will the increase in demand diminish domestic supply
and put upwards pressure on price, but the viability of CSG production is being questioned as
reserves are proving harder to develop and becoming increasingly expensive. The East Coast
projects initially believed they had adequate reserves to supply their LNG projects, but have all
had to sign agreements to purchase gas supplies outside of the projects production.35
The
concern of supply as well as increasing concern of environmental effects of CSG production has
caused increasing regulatory burden. A new federal approval is required for CSG
xiii
LNG income tax was lowered to 1.5% before recovery of capital investment and 3.5% afterwards.
The capital cost allowance was raised 22% to a total of 30% for liquefaction equipment and rose to 10%
for non-residential facilities used for liquefaction. xiv
Queensland Curtis LNG July 2015 (8.5mtpa), Australia Pacific LNG Mid 2015 (9mtpa), & End Q3
2015Gladstone LNG (7.8mtpa)

IEEJ:August 2015 © IEEJ2015
11
developments (EPBC Act) that adds an additional USD360-730 million in costs and also
exclusion zones for CSG production have been created which has caused some companies to
reconsider exploration and production plans.36
To better serve the market the Eastern state
Queensland’s Department of Natural Resources and Mines is developing a “Queensland Gas
Supply and Demand Action Plan” that will be released in December of 2015. The plan will
include ways to find solutions without market interventions, help to facilitate policy issues, and
demonstrate support for the sector, among other things.37
4.4 Russia
Russian projects must also receive export licenses and environmental approval
although the process is less burdensome than its competitors. The Russian gas export market
has mostly been dominated by state-owned Gazprom, but some recent policy changes in
December of 2013 of the gas export market has allowed other companies to receive export
licenses.xv
Although there has been reform, the ability to export gas is still limited to Gazprom,
Rosneft, and Novatek. Environmental authorities must assess projects, but the process is not
entirely transparent to the public. For example, during the development of Sakhalin 2 oil and
gas project there were issues surrounding environmental impact initially when Shell and Japan’s
Mitsui and Mitsubishi were the only owners. Shell faced possible fines of up to USD 30
billion, but immediately after Gazprom took a 50 % stake in the project, the environmental
accusations were dropped and the project went on to completion.38
Russia does face some regulatory burdens in terms of gas sales into the EU. Russia
currently exports over 90% of its gas into Europe via pipeline therefore gas sales are under EU
jurisdiction. This has caused problems recently as a antitrust case has been filed against
Gazprom by the EU. The EU claims Gazprom abused market power by maintaining unfair
pricing policies in Central and Eastern Europe. Gazprom could further lose 10% of its
revenues due to fines and further complications with the EU could pose challenges to proposed
increases of gas export capacity into Europe.
xv
Novatek received an export license for Yamal LNG.

IEEJ:August 2015 © IEEJ2015
12
Source: EIA, “Annual Energy Outlook 2015”, 2015
5. Pricing Opportunities:
Gas on gas (GOG) price formation has been rising as traditional oil indexed (OPE)
sales have been declining as seen in Figure 5.0. Most of the increase in market based price
comes from Europe due to replacement of oil indexed contracts by an increase in imported spot
gas and trading hub volumes. Price formation in Asia Pacific has only changed slightly since
2005 with market based prices rising 6% and oil indexed prices declining 3% compared to a
46% increase in gas on gas pricing in Europe over the same time period.39
To that effect, Asia
Pacific is hoping to replace some oil-linked contracts with gas on gas market prices. Contract
flexibility is also increasing with the elimination of contract constraints such as destination
clauses which will help to increase liquidity as buyers can resell unneeded or uneconomic
cargoes.
Source: International Gas Union, “Wholesale Gas Price Survey”, 2015
Figure 5.1 - Average HH spot prices for Natural Gas in four cases, 2005-40 (2013$/mmbtu)
Figure 5.0 - World Price Formation 2005 to 2014
OPE- Oil Price Escalation
Gas-on-Gas Competition
BIM- Bilateral Monopoly
NET- netback from Final Product
RCS- Regulation: Cost of Service
RSP- Regulation: Social and Political
RBC- Regulation: Below Cost
NP- No Price
NK- Not known

IEEJ:August 2015 © IEEJ2015
13
$0.00
$2.00
$4.00
$6.00
$8.00
$10.00
$12.00
$14.00
$16.00
$18.00
$20.00
Ap
r-1
4
May
-14
Jun
-14
Jul-
14
Au
g-1
4
Sep
-14
Oct
-14
Nov-1
4
Dec
-14
Jan
-15
Feb
-15
Mar
-15
Ap
r-1
5
May
-15
Jun
-15
Advantage of HH
(Japan Spot-HH
Arrived)
Japan spot arrival
Henry Hub X 115%
+$3.00
Henry Hub Spot Price
With LNG exports from the United States expected to enter the market by 2015 a new
LNG pricing mechanism will emerge. In the Gulf Coast of the United States, Cheniere’s
Sabine Pass LNG has negotiated sales contracts with gas priced at 115% x Henry Hub + USD
2.50-3.50/million btu fixed charge.xvi
Japan and other Asian Pacific countries found the Henry
Hub linked price incredibly attractive when oil was priced over USD 100/bbl last year and
hoped to replace oil-linked contracts with Henry Hub linked contracts; however, since the oil
price has declined Henry Hub linked pricing is seemingly less competitive as seen in Figure 5.2.
In June of 2014 prices flowing into Japan were USD 16.3/mmbtu while Henry Hub to Japan
would have been around USD 8.28/mmbtu allowing Japan great costs savings from U.S. gas.xvii
Moving forward into June 2015, due to the oil price decline, prices flowing into Japan were
USD 7.60/mmbtu leaving Henry Hub at USD 6.20/mmbtu, therefore the attractive spread has
severely shrunk. Price forecasts by the EIA show in a high oil price environment a Henry Hub
price increase will follow due to increased demand for Henry Hub and decreased demand for
oil-linked prices. Alternatively, if more resource discovery is made resulting in increased U.S.
production, downwards pressure will be put on Henry Hub price, but all of this is unpredictable.
This exemplifies the volatile nature of the Henry Hub price and although cost-competitive,
Henry Hub linked prices come with more risk and less security. Another new pricing option
out of the U.S. is tolling agreements as exhibited by the U.S. Freeport project’s contract with
Chubu Electric, a Japanese energy firm. The contract enables Chubu to offtake 2.2 mtpa with
no destination restrictions; therefore if bringing Henry Hub linked LNG into Japan is not
economically viable they are able to sell their contracted supply to European or South American
markets and find arbitrage opportunities.40
xvi
Henry Hub is the pricing point in Louisiana used for natural gas futures on the New York Mercantile
Exchange xvii
Using 115% x 4.59/mmbtu (EIA June 2014 HH price) + 3.00/mmbtu and METI Spot LNG Price
Statistics
Source: EIA, “Henry Hub Natural Gas Spot Price”, July 2015 & METI “Spot LNG Price Statistics”, July 2015
Figure 5.2 - Japan Spot Price vs estimated Henry Hub arrival price
IEEJ:August 2015 © IEEJ2015
14
Pricing mechanisms for Canadian gas is yet to be determined. An Oxford Energy
Institute Study states Canada will be able to offer either hub based prices off of the Canadian
Alberta Energy Company hub price, hybrid pricing, or project based pricing.41
Although
Canada can offer hub based pricing, liquefaction prices will be higher due to the greenfield
nature of projects. Shell’s LNG Canada application documents state it could be anywhere
between USD 4.9/mmbtu to USD 11.3/mmbtu.42
A recent study done by Cedigaz modeled
delivered prices to Japan to be between USD 8.6/mmbtu and USD 16.1/mmbtu, including
shipping, tariffs, tax.43
An alternative export channel for Western Canadian gas is if Canadian
prices are lower than U.S. prices, then Canadian gas could be exported via West Coast U.S.
projects like Jordan Cove LNG. A change that especially affects Canadian exports is the
buyer’s deviation from long term supply contracts. Buyers have stated they are moving
towards 5-10 year contracts rather than the 20-25 year contracts that have been common in the
past, but Canadian projects need the long term contracts to secure buyers and obtain financing
for the high cost Canadian projects. It may be likely to see a combination of oil-linked and
hub based pricing mechanism in Canadian LNG contracts.
Australian LNG prices have historically been oil linked, but the next wave of LNG
supply using Henry Hub or hybrid pricing mechanisms from the United States could challenge
the competitiveness of these traditional pricing agreements. Australia does not yet have a fully
functioning nationwide gas hub and may experience higher liquefaction costs at the new
projects as the cost overruns have been unprecedented due to of the simultaneous nature of
construction. Thus far there has been an increase in budgets of all export projects under
construction. For example, Gorgon LNG’s budget has increased by 46% and QCLNG’s has
increased by 36% from their initial budgets.44
This was caused by increased demand of
$0
$20,000
$40,000
$60,000
$80,000
$100,000
$120,000
$140,000
$160,000
$180,000
Australia US Russia Canada
Local Average Salary
Imported Average Salary
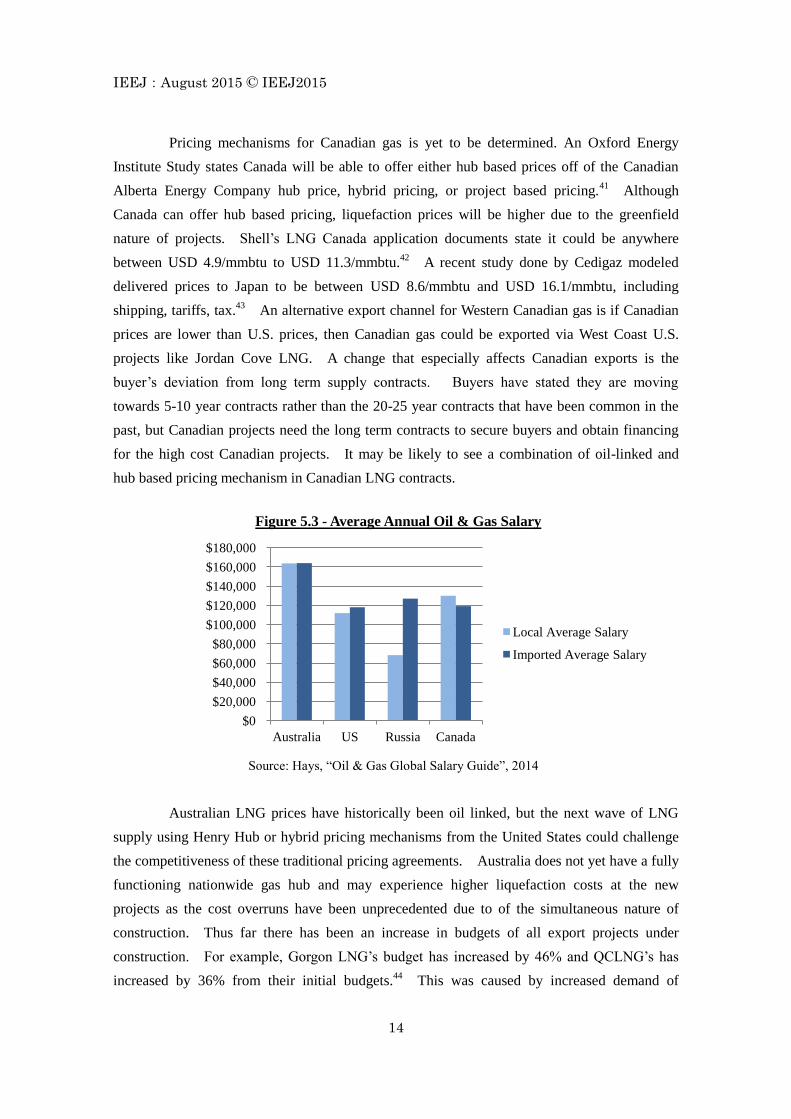
Figure 5.3 - Average Annual Oil & Gas Salary
Source: Hays, “Oil & Gas Global Salary Guide”, 2014
IEEJ:August 2015 © IEEJ2015
15
materials resulting in higher costs, an appreciation of the Australian dollar, and increased
demand for labor which has increased the average oil and gas salary in Australia to the highest
in the world at USD 163,000 as seen in Figure 5.3.45
Australian projects have much LNG
contracted but may have troubles when renegotiating contracts as prices in Australia may be less
competitive than spot market cargoes from North America.
Russia’s LNG prices have also been oil linked, but a new price influencer will be the
Power of Siberia and Altai pipelines into China from Russia. The major Russian and Chinese
gas companies are state-owned; therefore prices could be influenced by politics rather than
market fundamentals. Russia may be willing to take a less attractive price for the political
benefits of a partnership with China as well as the ability to swing gas to both Eastern and
Western markets.46
There is speculation that the abundance of gas flowing into China from
Russia at low prices could create a price floor, challenging the viability of higher priced LNG
coming from the United States, Canada, and Australia.47
5.1 Shipping Costs:
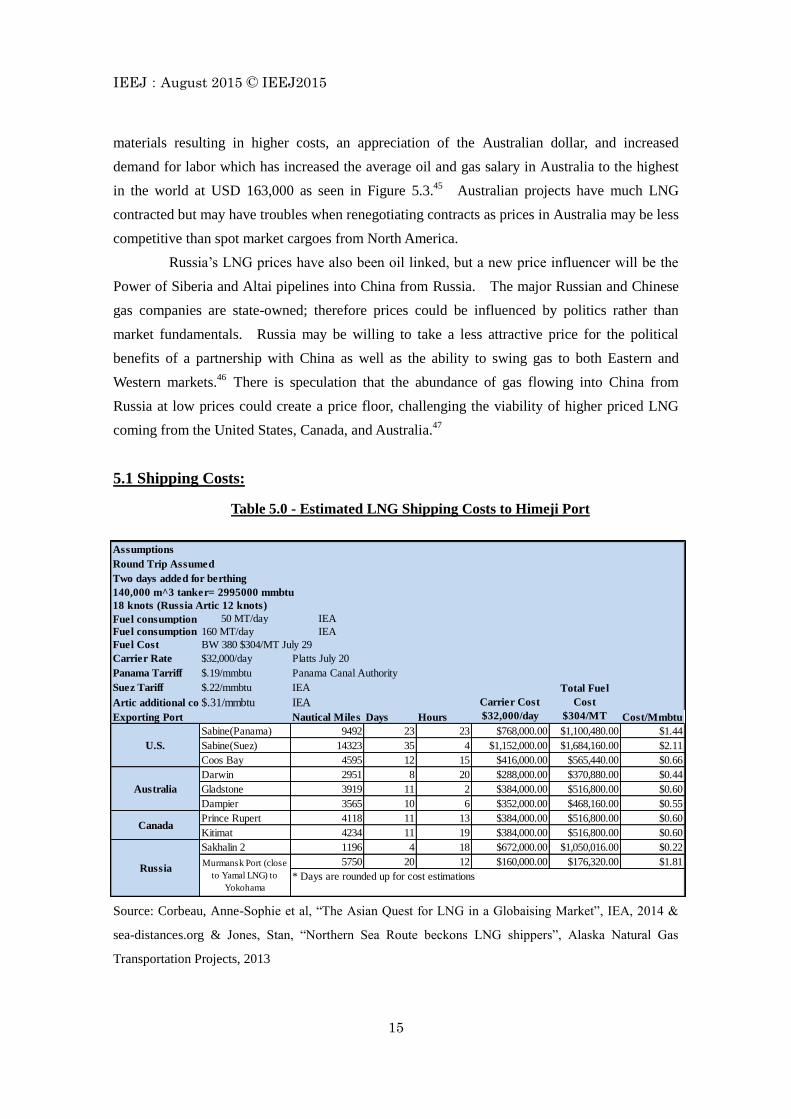
Source: Corbeau, Anne-Sophie et al, “The Asian Quest for LNG in a Globaising Market”, IEA, 2014 &
sea-distances.org & Jones, Stan, “Northern Sea Route beckons LNG shippers”, Alaska Natural Gas
Transportation Projects, 2013
Table 5.0 - Estimated LNG Shipping Costs to Himeji Port
Assumptions
Round Trip Assumed
Two days added for berthing
140,000 m^3 tanker= 2995000 mmbtu
18 knots (Russia Artic 12 knots)
Fuel consumption 50 MT/day IEA
Fuel consumption 160 MT/day IEA
Fuel Cost BW 380 $304/MT July 29
Carrier Rate $32,000/day Platts July 20
Panama Tarriff $.19/mmbtu Panama Canal Authority
Suez Tariff $.22/mmbtu IEA
Artic additional cost$.31/mmbtu IEA
Exporting Port Nautical Miles Days Hours Cost/Mmbtu
Sabine(Panama) 9492 23 23 $768,000.00 $1,100,480.00 $1.44
Sabine(Suez) 14323 35 4 $1,152,000.00 $1,684,160.00 $2.11
Coos Bay 4595 12 15 $416,000.00 $565,440.00 $0.66
Darwin 2951 8 20 $288,000.00 $370,880.00 $0.44
Gladstone 3919 11 2 $384,000.00 $516,800.00 $0.60
Dampier 3565 10 6 $352,000.00 $468,160.00 $0.55
Prince Rupert 4118 11 13 $384,000.00 $516,800.00 $0.60
Kitimat 4234 11 19 $384,000.00 $516,800.00 $0.60
Sakhalin 2 1196 4 18 $672,000.00 $1,050,016.00 $0.22
5750 20 12 $160,000.00 $176,320.00 $1.81
* Days are rounded up for cost estimations
Total Fuel
Cost
$304/MT
Murmansk Port (close
to Yamal LNG) to
Yokohama
U.S.
Australia
Canada
Russia
Carrier Cost
$32,000/day

IEEJ:August 2015 © IEEJ2015
16
Using estimates for the purpose of comparing costs, Russia’s Sakhalin 2 has the lowest
shipping costs. Although as stated by the IEA, vessels passing through the Arctic face
increased costs due to slower shipping speeds and the need for ice breakers which adds
USD .31/mmbtu and about a 10% fuel cost increase.48
The United States Gulf Coast is
disadvantaged in terms of shipping distance to Japan. Not only is shipping time longer, but
Gulf LNG exports are subject to Panama Canal tariffs which have been announced to be
between USD 560,000-700,000 with a round trip discount or between USD 620,000-780,00
without discount for vessel sizes between 138,000-177,000 cubic meters (around
USD .19/mmbtu). It has also been speculated that that LNG tankers could have to compete
with other ships for Panama Canal capacity therefore leading to bottlenecking.49
Canada and
Australia share similar distances and shipping costs, which gives them both an advantage in
terms of shipping. The shipping costs will be subject to changes based on freight costs and
fuel costs.
Conclusion:
The LNG market will be watched closely as the events in this decade will define the
future of global natural gas trade. These four economies in particular will become big players
in LNG exporting in the coming years, but it is clear that there are challenges to overcome and
the preciseness of the contribution of each player is unclear. It is certain that five projects from
the United States and six additional from Australia will come online by 2020 as they are already
under construction. The future of other proposed projects in the United States and Australia
seem less optimistic and may be delayed to development post 2020. The outlook for Canadian
projects is uncertain, but Canada will give impetus to develop proposed projects as Canada
needs to generate new export markets for its resources. It is likely a formal FID may come in
the fall from the partners of the Pacific Northwest LNG project as they have already made a
conditional FID pending the Federal environmental approval. Confidence is displayed by
project proponents and the provincial government through continued investments and a recent
visit by the B.C. finance minister to Malaysia to discuss with the leading shareholder, Petronas,
the project and the new Liquefied Natural Gas Agreement. It seems this will become the first
major export plant constructed on Canada’s West Coast with hopes that it will be completed by
2020. Shell’s LNG Canada project is also a leader as it has received full environmental
approval in June 2015 and could see an FID in 2016. Canada will possibly see two or three
smaller plants come online before 2020 and will likely see the remaining major projects
constructed in the 2020-2025 period. Russia has been focused on pipeline development more
so than LNG development and the result of the completion of pipelines into China could have
IEEJ:August 2015 © IEEJ2015
17
LNG Supply Economy Political Stability Regulatory Environment Price
United States
Strong currency and high energy
consumption driven by lower
prices aided in offsetting oil price
decline effects. GDP growth
forecasts for 2015 and 2016 are
2.5% and 3% respectively. 2015
was revised downwards from
April forecast by .6%.
Reliable and
politically stable
country. Federal
election in
October 2015
could see changes
that effect the
energy sector.
Complex, but manageable
with five projects fully
approved. Longer than
expected times with non-
FTA export approval have
motivated policy changes
to decrease time lags in the
future. Increasing
regulatory burden is
possible with fracking.
Offers Henry Hub linked
gas. Although cost
competitive, hub price will
bring more volatility and less
security. When oil price is
low, Henry Hub is less
competitive. Shipping
disadvantage to Japan, but
lower liquefaction costs.
Typically oil-linked, but new
pipelines into China could
push Russian gas prices into
Asian markets downwards.
Prices could be motivated by
politics therefore pushing
prices down lower. Shipping
advantage from the East, but
disadvantaged from the Arctic
(Yamal LNG).
Gas market dominated by
state-owned compnay.
Regulation procedures and
assessments are not very
transparent to public.
Politically unstable
and uncertain
future as the
invasion into the
Ukraine continues
to strain
international
relations and the
ability to do
business globally.
Economy impacted heavily by oil
price decline as oil and gas
exports make up 68% of export
revenues. GDP forecasted to
contract 3.4%, revised upwards
.4% since April forecasts by IMF
and .2% growth expected for
2016.
Holds 17.4% of the worlds
reserves and ranks 8th for shale
gas reserves. One LNG project
operational, one getting closer
to beginning construction
(Yamal LNG) and two-to-three
proposed. Focusing on
expanding pipeline capacity into
China.
Russia
Holds 1% of the worlds
proved reserves and ranks in
5th for shale gas reserves.
Has begun producing shale
gas but still relatively under
developed, has no LNG
export projects operational or
under construction, is in need
of a new export market or
production levels are
forecasted to drop.
Economy was negatively
impacted by oil price decline due
to high reliance on oil and gas for
GDP, exports, and investments.
GDP forecasts by IMF for 2015
were revised downwards .7%
from April 2015 forecasts to
1.5% with 2016 GDP growth
remaining at 2.1%.
Reliable and
politically stable
country.
Presidential
election in
November 2016
could have
implications on
economy and
energy sector.
Complex and involved.
Federal environmental
approval is experiencing
delays with only two
projects gaining approval
out of over 15 that have
applied. Consistent
engagement with First
Nation groups is
necessary.
Canada could offer hub
based pricing, oil-linked,
project based or a hybrid of
these. The amount of Asian
ownership in Canadian
projects will help to create
flexible sales contracts.
Shipping advantage to Japan,
but higher liquefaction costs.
Canada
Holds 2% of the worlds
proved reserves and ranked
7th for shale gas reserves.
Home to first coal seam gas
LNG plants, high availability
of supply, has four export
facilities operating and six
under construction which will
place Australia as the top
supplier of LNG in the world.
Economy slightly impacted by
decline as there is less reliance on
oil and gas for GDP revenues.
Some industries were suffering
from an inflated currency,
therefore the currency decline
brought on by oil price decline
was helpful.
Holds 5.2% of the worlds
reserves and ranks 4th place
for shale gas reserves.
Produces the most natural
gas in the world. Production
of unconventional gas is
forecasted to continue to
increase. Five LNG export
projects are under
construction and the U.S.
will become 3rd largest LNG
exporter by 2020.
Australia
Currently offer Oil-linked
prices. A nation-wide
domestic hub is not
developed. Has a high
shipping advantage.
Reliable and
politically stable
country. Stable
supply of LNG in
the foreseeable
future.
Growing concern of
environmental effects of
gas extraction and of rising
domestic gas prices has
motivated a heavier
regulatory burden. Gas
reservation policies and
new environmental
approvals have resulted
from concerns.
implications on prices coming into Asia. Yamal LNG has received enough financing from
China that it will most likely be constructed in time for 2020-21. The outcome of other
proposed projects in Russia is unclear, but will most likely be pushed post 2020. With
significant decisions being made every day by each economy and throughout the globe it will be
vital to watch the LNG market as the next decade will be crucial to the long term future of LNG
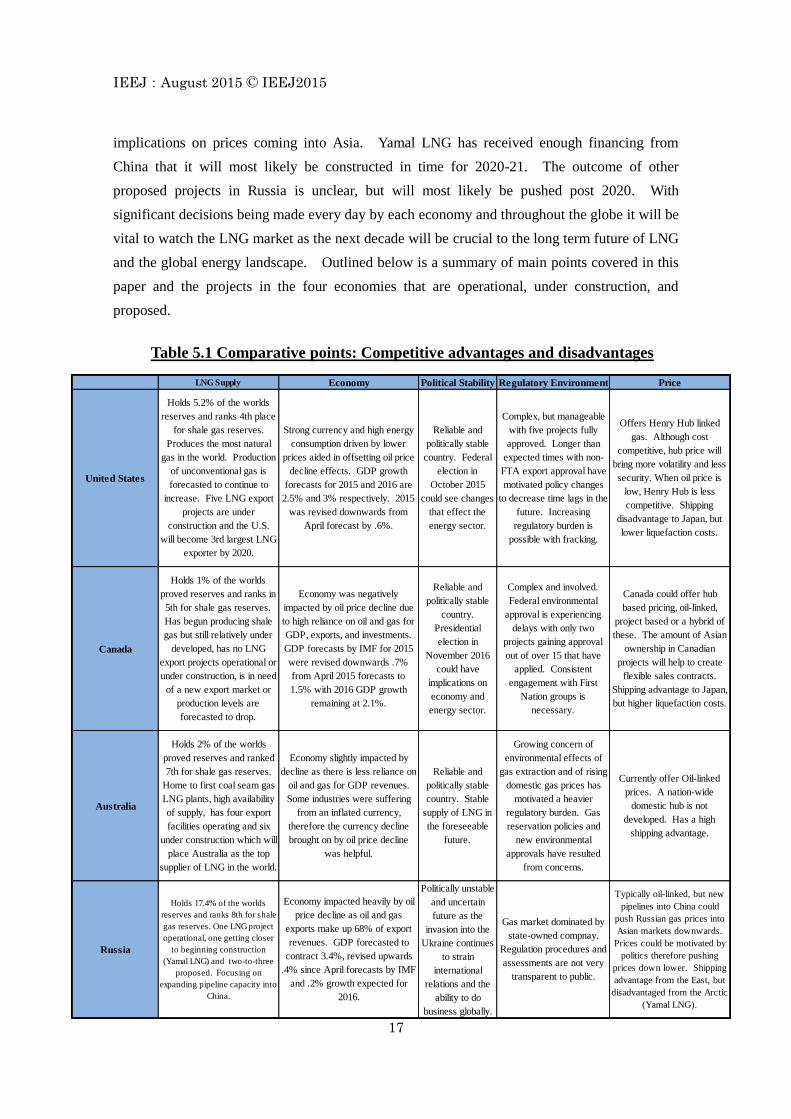
and the global energy landscape. Outlined below is a summary of main points covered in this
paper and the projects in the four economies that are operational, under construction, and
proposed.
Table 5.1 Comparative points: Competitive advantages and disadvantages
IEEJ:August 2015 © IEEJ2015
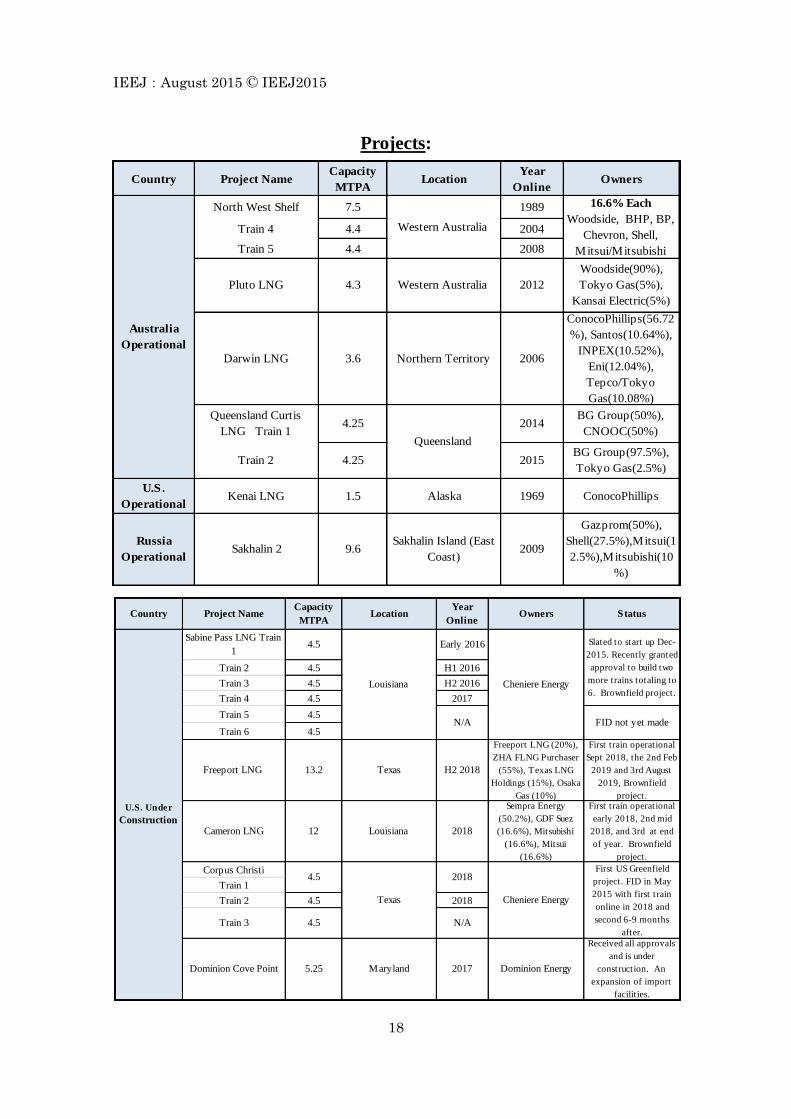
18
Projects:
Country Project NameCapacity
MTPALocation
Year
OnlineOwners
North West Shelf 7.5 1989
Train 4 4.4 2004
Train 5 4.4 2008
U.S.
OperationalKenai LNG 1.5 Alaska 1969 ConocoPhillips
Sakhalin 2Russia
Operational
Gazprom(50%),
Shell(27.5%),Mitsui(1
2.5%),Mitsubishi(10
%)
2009Sakhalin Island (East
Coast)9.6
4.25
Queensland
Australia
Operational
BG Group(97.5%),
Tokyo Gas(2.5%)20154.25Train 2
BG Group(50%),
CNOOC(50%)
Queensland Curtis
LNG Train 12014
3.6 2006
Woodside(90%),
Tokyo Gas(5%),
Kansai Electric(5%)
Pluto LNG Western Australia 4.3 2012
ConocoPhillips(56.72
%), Santos(10.64%),
INPEX(10.52%),
Eni(12.04%),
Tepco/Tokyo
Gas(10.08%)
Darwin LNG Northern Territory
Western Australia
16.6% Each
Woodside, BHP, BP,
Chevron, Shell,
Mitsui/Mitsubishi
Train 2 4.5 H1 2016
Train 3 4.5 H2 2016
Train 4 4.5 2017
Train 5 4.5
Train 6 4.5
Corpus Christi
Train 1
Train 2 4.5 2018
Capacity
MTPALocation
Year
OnlineOwners Status
Freeport LNG (20%),
ZHA FLNG Purchaser
(55%), Texas LNG
Holdings (15%), Osaka
Gas (10%)
H2 2018Texas13.2Freeport LNG
U.S. Under
Construction
Slated to start up Dec-
2015. Recently granted
approval to build two
more trains totaling to
6. Brownfield project.
Project Name
Sabine Pass LNG Train
14.5 Early 2016
First train operational
early 2018, 2nd mid
2018, and 3rd at end
of year. Brownfield
project.
Sempra Energy
(50.2%), GDF Suez
(16.6%), Mitsubishi
(16.6%), Mitsui
(16.6%)
2018Louisiana 12Cameron LNG
First US Greenfield
project. FID in May
2015 with first train
online in 2018 and
second 6-9 months
after.
5.25Dominion Cove Point
Train 3 4.5
4.5
N/A
2018
Country
N/A
Louisiana
Cheniere EnergyTexas
Received all approvals
and is under
construction. An
expansion of import
facilities.
Dominion Energy2017Maryland
Cheniere Energy
FID not yet made
First train operational
Sept 2018, the 2nd Feb
2019 and 3rd August
2019, Brownfield
project.

IEEJ:August 2015 © IEEJ2015
19
8Lavaca Bay LNG
Received export licenses
but waiting on
environmental assessment
due late 2015. Reversal of
import project BG/Shell
merger could change
outcome
BG Group (50%),
Southern Union
(50%)
2019+Louisiana 15Lake Charles LNG
Received full export
license. Final
Environmental Impact
Statement will be released
Sept 30 2015. Received
license to export Canadian
gas from NEB.
Veresen Inc2019Oregon6Jordan Cove Energy
Received export license for
both FTA and non-FTA.
Expecting environmental
approval sometime in late
2015. Has also received
license to export Canadian
gas from NEB.
Oregon LNG2020Oregon9.6Oregon LNG
U.S.
Proposed
Projects
Located at existing
import facility. FERC
approval expected
March 2016, waiting
on DOE non-FTA
export approval.
ExxonMobil(17.6%),
ConocoPhillips(12.4
%), Qatar Petroleum
(70%)
2020Texas15.6Golden Pass LNG
Have been behind in
submitting documentation
to FERC and was given a
deadline to complete
application by August or
FERC will suspend their
pre-filling process.
Cambridge EnergyPlaquemines Parish8CE FLNG ---
Offshore terminal, put
on hold indefinitely
due to oil price
decline.
Excelerate Energy---Texas

IEEJ:August 2015 © IEEJ2015
20
Yamal LNG
Train 1
Train 2-3 11 2021
5.5Arctic
2017Gazprom
Received funding from
CNPC of $20 billion
to fund project.
Will be delayed for a
while as there is a lack
of access to pipeline
gas due to Sakhalin II
terminal
Rosneft, ExxonMobil---Sakhalin (Eastern
Russia)5Far East LNG
Vladivostok (Eastern
Russia)
Russia
ProposedPostponed. No secured
buyers or foreign
partners. Gazprom
may be focusing more
on Pipelines into
China.
Gazprom---Vladivostok LNG 10
Sakhalin 2 expansion 5Sakhalin Island (East
Coast)2017+
Gazprom(50%),
Shell(27.5%),Mitsui(1
2.5%),Mitsubishi(10
%)
An agreement in June
2015 was signed to
expand.
Gorgon LNG
Train 2 5.2
Australia
Under
Construction
Chevron (64.14%),
KUFPEC (13.4%), Kyushu
Electric (1.46%), Woodside
(13%), PE
Wheatstone/TEPCO (8%)
2016Western
Australia8.9Wheatstone LNG
8.4Ichthys
INPEX (62.25%), Total
(30%), Tokyo Gas
(1.575%), Osaka Gas
(1.2%), Chubu Electric
(.735%), Toho Gas (.42%),
CPC (2.625%), Kansai
Electric (1.2%)
2016Northern
Territory
Shell (67.5%), INPEX
(17.5%), KOGAS (10%),
CPC (5%)
Prelude 3.6Northern
Territory2017
Highest cost LNG project
at $54 billion, a 46%
increase of initial budget.
Chevron (47.33%), Shell
Australia (25%),
ExxonMobil Aus (25%),
Osaka Gas (1.25%),Tokyo
Gas (1%), Chubu Electric
(.42%)2016-2018
2015-2016
Western
Australia
5.2Train 1
60% complete. First
cargo could be as early
as end of year.
Will be the largest
floating LNG facility in
the world.
First shipment will
commence in 2016.
CSG liquefaction that is
90% complete and
expects first cargo in H2
2015.
CSG liquefaction. Origin
said Train 1 expects
sustained production in
H2 2016.
Origin (37.5%),
ConocoPhillips (37.5%),
Sinopec (25%)
2015Queensland9Australia Pacific
LNG
GLNG 7.8 Queensland 2015
Santos (30%), Petronas
(27.5%), Total (27.5%),
KOGAS (15%)
Train 3 5.2

IEEJ:August 2015 © IEEJ2015
21
Planned FID was
pushed back six months
to end of 2016. In
FEED phase.
Sunrise FLNG
Shelved due to
regulatory and fiscal
issues with Timor-Leste
Is delayed while
struggling to secure gas
supplies, discussions to
find buyers still
continuing
Australia
Proposed
Queensland3.8Fishermans
Landing LNG
Shell (26.56%), Woodside
(33.44%), Osaka Gas (10%),
ConocoPhillips (30%)
2020+Northern
Territory4
Western
Australia11.7Browse FLNG
6Scarborough
FLNG
LNG ltd2020
Woodside (31.3%), BP
(18%),Shell (27%),
PetroChina (9%),
Mitsui/Mitsubishi (14.7%)
2017+
Placed on backburner
and could succumb to
other investments by
the companies
BHP (50%), ExxonMobil
(50%)2020+
Western
Australia
Canada
ProposedKitimat LNG
Kitimat, BC0.55Douglas Channel
FLNG
Received both Federal
and BC environmental
approval in June 2015
FID planned for 2016
Shell (50%), Mitsubishi
(15%), PetroChina (20%),
KOGAS (15%)
Pacific
Northwest LNG
Has all certification, but
FID planned for 2016
Chevron (50%), Woodside
(50%)2020
14Prince Rupert
LNGBG Group2021+
Prince
Rupert, BC
Kitimat, BC11
LNG Canada
FID expected at the end
of this year, waiting on
NEB export licenses and
environmental
assessments not needed,
will be the first BC
project in Operation. A
precursor to the
consortiums long-term
project Triton LNG.
Alta Gas/Idemitsu
(33.3%), Exmar (33.3%),
EDF (33.3%)
2018
2020+Kitimat, BC12
Gave a conditional
positive FID while
waiting for Federal
Environmental
Approval that is
expected in Fall 2015
Petronas (62%), Japex
(10%), Sinopec (10%),
Indian Oil Co. (10%),
PetroleumBrunei (3%),
Huadian (5%)
2019Prince
Rupert, BC12
Shell BG merger pushes
this project back,
possibly indefinitely
Has sold 1 mtpa /25 years
to China's Guangzhuo.
Recently was granted
extension on
environmental review so
they may engage further
with Squamish First
Nations groups.
Pacific Oil and Gas2019Sqamish, BC2.1Woodfibre LNG
BCEAA in Pre-
Application,CEAA
substituted by BCEAA,
NEB approved
Prince
Rupert, BC
ExxonMobile Canada
(50%), Imperial Oil
Resources (50%)
202415WCC LNG
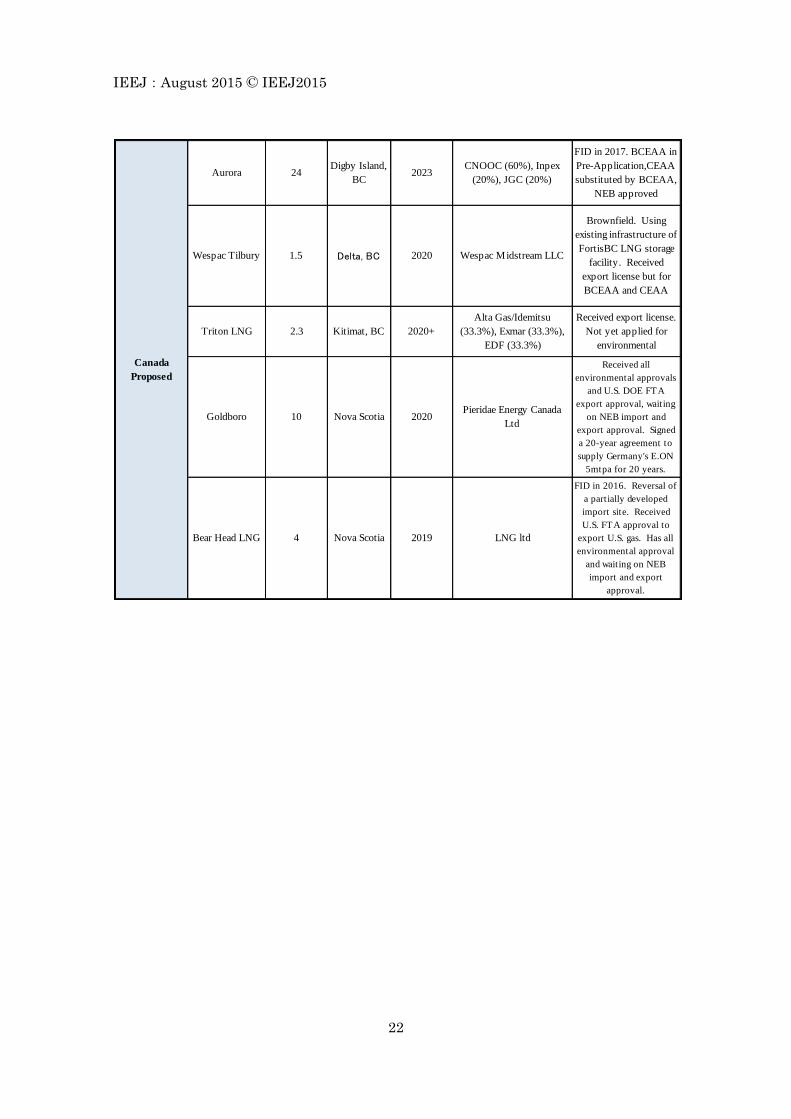
IEEJ:August 2015 © IEEJ2015
22
FID in 2017. BCEAA in
Pre-Application,CEAA
substituted by BCEAA,
NEB approved
CNOOC (60%), Inpex
(20%), JGC (20%)2023
Digby Island,
BC24Aurora
Canada
Proposed
Received export license.
Not yet applied for
environmental
Alta Gas/Idemitsu
(33.3%), Exmar (33.3%),
EDF (33.3%)
2020+Kitimat, BC2.3Triton LNG
Brownfield. Using
existing infrastructure of
FortisBC LNG storage
facility. Received
export license but for
BCEAA and CEAA
Wespac Midstream LLC20201.5 Delta, BCWespac Tilbury
Received all
environmental approvals
and U.S. DOE FTA
export approval, waiting
on NEB import and
export approval. Signed
a 20-year agreement to
supply Germany's E.ON
5mtpa for 20 years.
Pieridae Energy Canada
Ltd2020Nova Scotia10Goldboro
FID in 2016. Reversal of
a partially developed
import site. Received
U.S. FTA approval to
export U.S. gas. Has all
environmental approval
and waiting on NEB
import and export
approval.
LNG ltd2019Nova Scotia4Bear Head LNG
IEEJ:August 2015 © IEEJ2015
23
References
1 International Group of Liquefied Natural Gas Importers (GIIGNL), “The LNG Industry”, annual
reports 2005-2014 2 GIIGNL, “The LNG Industry”, annual reports 2005-2014
3 International Energy Agency (IEA), “Medium Term Gas Market Report 2015”, 2015
4 BP, “BP Statistical Review of World Energy 2015”, 2015
5 U.S. Energy Information Administration (EIA) Natural Gas Production Data, 2015
6 EIA Natural Gas Production Data, 2015
7 EIA, “Annual Energy Outlook 2015”, 2015
8 EIA, “Annual Energy Outlook 2015”, 2015
9 BP, “BP Statistical Review of World Energy 2015”, 2015
10 EIA, “Shale gas and tight oil are commercially produced in just four countries”, February 13, 2015
11 IEA, World Energy Statistics and Balances, 2014
12 EIA, Natural Gas Export Data, 2015
13 BP, “BP Statistical Review of World Energy 2015”, 2015
14 BP, “BP Statistical Review of World Energy 2015”, 2015
15 The Australian Petroleum Production & Exploration Association Ltd (APPEA), “Australian LNG
projects”, 2015 16
BP, “BP Statistical Review of World Energy 2015”, 2015 17
Farchy, Jack, “Gas production at Gazprom set to hit post-Soviet low”, Financial Times, July 29, 2015 18
BP, “BP Statistical Review of World Energy 2015”, 2015 19
Farchy, Jack, “Gas production at Gazprom set to hit post-Soviet low”, Financial Times, July 29, 2015 20
GIIGNL, “The LNG Industry”, annual reports 2005-2014 21
Natural Resources Canada, “Energy Markets Fact Book 2014-2015”, 2015 22
Geddes, Lisa, “Timeline: Tracking the layoffs in Alberta’s oilpatch”, Global News, May 11, 2015 23
The Australian Petroleum Production & Exploration Association Ltd (APPEA), “Value-adding
Australian Oil and Gas Industry”, 2014 24
EIA, “Oil and natural gas sales accounted for 68% of Russia’s total export revenues in 2013”, July 23,
2014 25
International Monetary Fund, “World Economic Outlook”, April 2015 26
Farchy, Jack, “Gas production at Gazprom set to hit post-Soviet low”, Financial Times, July 29, 2015 27
U.S. Department of State, “Ukraine and Russia Sanctions”, 2015 28
Crooks, Ed., “US drive on LNG exports hit by delays”, Financial Times, March 30, 2014 29
Goldwyn, David L., “DOE’s New Procedure for Approving LNG Export Permits: A More Sensible
Approach”, Brookings, June 10, 2014 30
Davenport, Coral, “New Federal Rules Are Set for Fracking”, New York Times, March 20, 2015 31
Morgan, Geoffrey, “First Nations LNG deals with B.C. will help in making final decisions, industry
says”, Financial Post, May 11, 2015 32
Jang, Brett, “Agreement with B.C. lets LNG group seek compensation if taxes increase”, Globe and
Mail, July 2015 33
Ledesma, David, Henderson, James,& Palmer, Nyrie, “The Future of Australian LNG Exports: Will
domestic challenges limit the development of future LNG export capacity”, The Oxford Institute for
Energy Studies, Sept 2014 34
Ledesma, David, Henderson, James,& Palmer, Nyrie, “The Future of Australian LNG Exports: Will
domestic challenges limit the development of future LNG export capacity”, The Oxford Institute for
Energy Studies, Sept 2014 35
Ledesma, David, Henderson, James,& Palmer, Nyrie, “The Future of Australian LNG Exports: Will
domestic challenges limit the development of future LNG export capacity”, The Oxford Institute for
Energy Studies, Sept 2014 36
Ledesma, David, Henderson, James,& Palmer, Nyrie, “The Future of Australian LNG Exports: Will
domestic challenges limit the development of future LNG export capacity”, The Oxford Institute for
Energy Studies, Sept 2014 37
Department of Natural Resources and Mines, Queensland, “Queensland Gas Supply and Demand

IEEJ:August 2015 © IEEJ2015
24
Action Plan”, July 2015 38
Bowers, Simon, “Sakhalin issue settled as Russia takes 50% stake”, The Guardian, December 2, 2006 39
International Gas Union (IGU), “Wholesale Gas Price Survey”, 2015 40
Platts, “Interview: Jera eyes selling US Freeport LNG volume to Europe as alternative to Japan”, LNG
Daily, May 28, 2015 41
Gomes, Ieda., “Natural Gas in Canada: what are the options going forward?”, The Oxford Institute for
Energy Studies. May 2015 42
Hureau, Geoffroy, & Jordan, Louis, “Waiting for the Next Train. An Assessment of the Emerging
Canadian LNG Industry”, Cedigaz, March 2015 43
Hureau Geoffroy & Jordan Louis, “Waiting for the Next Train. An Assessment of the Emerging
Canadian LNG Industry”, Cedigaz, March 2015 44
Ledesma David, Henderson James,& Palmer Nyrie, “The Future of Australian LNG Exports: Will
domestic challenges limit the development of future LNG export capacity”, The Oxford Institute for
Energy Studies, September 2014 45
Hays, “Oil & Gas Global Salary Guide”, 2014 46
Henderson, David, “The Commercial and Political Logic for the Altai Pipeline”, The Oxford Institute
For Energy Studies, December 2014 47
Almeida, Isis, “Russia-China Natural Gas Deal to Set LNG Price Floor, BofA Says”, Bloomberg
Business, May 27, 2014 48
Corbeau, Anne-Sophie et al, “The Asian Quest for LNG in a Globalising Market”, IEA, 2014 49
Woodmac, “Panama Canal: Will expansion be enough for US LNG?”, August 15 2014
Contact :[email protected]