Late Night Management Areas Research Project - City of · PDF fileLate Night Management Areas...
77
Late Night Management Areas Research Project October 2011 City of Sydney Parsons Brinckerhoff Australia Pty Limited ABN 80 078 004 798 Level 27, Ernst & Young Centre 680 George Street Sydney NSW 2000 GPO Box 5394 Sydney NSW 2001 Australia Telephone +61 2 9272 5100 Facsimile +61 2 9272 5101 Email [email protected] Certified to ISO 9001, ISO 14001, AS/NZS 4801 A+ GRI Rating: Sustainability Report 2010 2112993A-PR_3131_Rev_B
Transcript of Late Night Management Areas Research Project - City of · PDF fileLate Night Management Areas...

Late Night Management Areas Research Project
October 2011
City of Sydney
Parsons Brinckerhoff Australia Pty Limited ABN 80 078 004 798
Level 27, Ernst & Young Centre 680 George Street Sydney NSW 2000 GPO Box 5394 Sydney NSW 2001 Australia Telephone +61 2 9272 5100 Facsimile +61 2 9272 5101 Email [email protected]
Certified to ISO 9001, ISO 14001, AS/NZS 4801 A+ GRI Rating: Sustainability Report 2010
2112993A-PR_3131_Rev_B

2112993A-PR_3131_Rev_B
Revision Details Date Amended By
Original 04/10/11
A Final report 06/10/11 TV
B Final report with comments 07/10/11 TV
©Parsons Brinckerhoff Australia Pty Limited [2011].
Copyright in the drawings, information and data recorded in this document (the information) is the property of Parsons Brinckerhoff. This document and the information are solely for the use of the authorised recipient and this document may not be used, copied or reproduced in whole or part for any purpose other than that for which it was supplied by Parsons Brinckerhoff. Parsons Brinckerhoff makes no representation, undertakes no duty and accepts no responsibility to any third party who may use or rely upon this document or the information.
Author: Qingjian Jiang, Thomas Vaclavek; Ian Hay (City of Sydney) .......
Signed: ...................................................................................................
Reviewer: Graeme Steverson .....................................................................
Signed: ...................................................................................................
Approved by: Wendy Adam ..............................................................................
Signed: ...................................................................................................
Date: 7 October 2011 ...........................................................................
Distribution: ...................................................................................................
Please note that when viewed electronically this document may contain pages that have been intentionally left blank. These blank pages may occur because in consideration of the environment and for your convenience, this document has been set up so that it can be printed correctly in double-sided format.

Late Night Management Areas Research Project
PARSONS BRINCKERHOFF 2112993A-PR_3131_Rev_B Page i
Contents Page number
1. Introduction 1
2. Methodology 3
3. Literature review 5
3.1 Public realm profiling 5
3.2 Strategies to normalise late night precincts 6
3.3 Transport research 7
3.4 Event management 8
4. Pedestrian counts 9
4.1 Hot spots 9
4.1.1 Precinct maximums 9 4.1.2 Pedestrian volumes 13
4.2 Cross-precinct comparison 14
4.2.1 Precinct maximums 14 4.2.2 Central area averages 17
4.3 Key entry and exit points 17
4.3.1 Key entry and exit point findings 19
5. Observation survey 21
5.1 Anti-social behaviour 21
5.1.1 ASB with land use 22 5.1.2 Joint variable analysis of total ASB incidents 23 5.1.3 Joint variable analysis ASB and land use 25 5.1.4 Land use point data 27 5.1.5 ASB by precinct and month 28 5.1.6 ASB density by precinct and month 32 5.1.7 Key ASB findings 34 5.1.8 Aggregate mapping 35
5.2 Congregation and footpath congestion 36
5.2.1 Congregation with land use 36 5.2.2 Congestion by precinct and month 38
5.3 Gender distribution 39
Late Night Management Areas Research Project
Page ii 2112993A-PR_3131_Rev_B PARSONS BRINCKERHOFF
Contents (Continued)
Page number
6. Land use analysis 41
6.1 All precincts 41
6.2 CBD south 42
6.3 Kings Cross 42
6.4 Oxford Street 43
6.5 The Rocks 43
7. Intercept survey 45
7.1 Age 45
7.2 Visitation 46
7.2.1 Reasons of visitation 46 7.2.2 Intended places of visit 47 7.2.3 Previous destination 48 7.2.4 Next destination 48 7.2.5 Place to stay the night by region 49 7.2.6 Key findings related to visitation 50
7.3 Transport 51
8. Conclusion 53
8.1 Key research findings 53
8.1.1 Pedestrian movements 53 8.1.2 ASB, congregation, congestion and land use 53 8.1.3 Demographics and travel patterns 54
8.2 Precinct comparison 55
8.3 Key correlations and possible interacting factors 55
8.4 Future possibilities 56

Late Night Management Areas Research Project
PARSONS BRINCKERHOFF 2112993A-PR_3131_Rev_B Page iii
Contents (Continued)
Page number
List of tables Page number
Table 2.1 Survey days and areas 3 Table 4.1 The Rocks top five hotspots 9 Table 4.2 Oxford Street top five hotspots 10 Table 4.3 Oxford Street top five hotspots for March only 10 Table 4.4 Kings Cross top five hotspots 10 Table 4.5 Kings Cross top five hotspots for March only 11 Table 4.6 Kings Cross top five hotspots for December only 11 Table 4.7 CBD south top five hotspots 12 Table 4.8 CBD south top five hotspots for March only 12 Table 4.9 Precinct maximums based on top ten hotspots 14 Table 4.10 Precinct maximums based on top ten hotspots for March only 15 Table 4.11 Precinct maximums based on top ten hotspots for December only 16 Table 4.12 City-wide: top 5 entry/exit points 18 Table 4.13 CBD south: top 5 entry/exit points 18 Table 4.14 Kings Cross: top 5 entry/exit points 18 Table 4.15 Oxford Street: top 5 entry/exit points 19 Table 4.16 The Rocks: top 2 entry/exit points 19 Table 5.1 ASB vs. business type and land use 26 Table 5.2 Percentage chance of seeing more serious ASB in the three precincts 32 Table 5.3 Percentage chance of seeing less serious ASB in the three precincts 33 Table 7.1 Reasons for visiting precinct 46 Table 7.2 Distribution of locations where respondents will spend that night 49

Late Night Management Areas Research Project
Page iv 2112993A-PR_3131_Rev_B PARSONS BRINCKERHOFF
Contents (Continued)
Page number
List of figures Page number
Figure 1.1 Late night activity precincts 1 Figure 4.1 Peak pedestrian volumes in CBD south 13 Figure 4.2 Average number of people in the central area of each precinct by weekday 17 Figure 5.1 ASB congestion and approximate land use activity (open/closed) in CBD south 22 Figure 5.2 Total ASB vs. Total Congregation for all December days 23 Figure 5.3 Total ASB vs. number of high congestion locations for all survey days 24 Figure 5.4 ASB incident location distance to nearest business 25 Figure 5.5 ASB incidents and land use along Oxford Street 27 Figure 5.6 Number of ASB incidents by precinct for both March and December 28 Figure 5.7 Number of ASB incidents by precinct for March only 29 Figure 5.8 Number of ASB incidents by precinct for December only 29 Figure 5.9 Number of ASB incidents by precinct for both weeknights 30 Figure 5.10 Number of ASB incidents by precinct for Friday only 30 Figure 5.11 Number of ASB incidents by precinct for Saturday only 31 Figure 5.12 Aggregated ASB for Friday and Saturday nights in Kings Cross 35 Figure 5.13 Peak pedestrian congestion in Kings Cross 37 Figure 5.14 Mean level of congestion in the three precincts 38 Figure 5.15 Gender proportion by hour for all survey days 39 Figure 5.16 Gender proportion by precinct for all survey days 39 Figure 6.1 Number of businesses of each type open across all precincts 41 Figure 6.2 Number of businesses of each type open in CBD south 42 Figure 6.3 Number of businesses of each type open in Kings Cross 42 Figure 6.4 Number of businesses of each type open in Oxford Street 43 Figure 6.5 Number of businesses of each type open in The Rocks 43 Figure 7.1 Age group of respondents 45 Figure 7.2 Intended places of visitation 47 Figure 7.3 Location prior to arriving in the precinct 48 Figure 7.4 Where respondents are going after leaving the precinct 48 Figure 7.5 Places to stay that night by region 50 Figure 7.6 Transport mode shares 51
Appendices Appendix A Joint variable analysis Appendix B ASB and land use Appendix C Details of congestion

Late Night Management Areas Research Project
PARSONS BRINCKERHOFF 2112993A-PR_3131_Rev_B Page 1
1. Introduction This is an overview of key findings from the City of Sydney’s Late Night Management Areas Research project. The content is mainly descriptive of the key trends and patterns emerging from an analysis of the data collected in March and December 2010.
The Late Night Management Areas Research (LNMAR) project originated as a proposal from the (now disbanded) Sydney Liquor Taskforce: Public Areas and Services subgroup. The subgroup identified a lack of information regarding the numbers of people and common transport patterns in the key late night management areas (‘the precincts’) of Kings Cross, Oxford Street and the CBD south hampered effective management strategies. These locations had a temporary liquor licence freeze imposed through the legislation. An additional precinct, The Rocks, was also included to complement research undertaken by the NSW Department of Justice and Attorney General’s Department, Crime Prevention Division. An additional component of observational research was added to the project to provide empirical support to reported issues of public disorder, and to reflect best practice research methodology.
Figure 1.1 Late night activity precincts
Consultation was undertaken with key stakeholders in preparing the research methodology, including:
licensees and liquor accord representatives (i.e. Kings Cross, City Central)
research agencies and centres: NSW Bureau of Crime Statistics and Research (BOSCAR), University of Technology Sydney Designing Out Crime Research Centre, University of Western Sydney staff from the research project The City After Dark: The Governance and Lived Experience of Urban Night-Time Culture
the NSW Police.

Late Night Management Areas Research Project
Page 2 2112993A-PR_3131_Rev_B PARSONS BRINCKERHOFF
The consultation focussed on identifying:
main issues of on-street activity that the methodology should capture
suitable sample times and seasons in which to conduct research (NSW Police and industry stakeholders, research agencies and centres)
potential validation and reliability issues with the proposed methodology (research agencies and centres).
The purpose of this research is to assist the City and other stakeholders to its program management as it impacts the late night economy:
in the short term, it can inform:
precinct dispersal plans for late night areas
location of night time taxi ranks
location of garbage bins
how and when cleansing will occur
in the medium term, it can inform:
transport promotion
transport infrastructure locations
directional signage
in the long term it can inform:
measures for addressing footpath capacity
incentives to encourage economic diversity
effectively service areas at night.
This project is one of a series of research and consultation activities informing the development of the City of Sydney’s Night Time City Policy.

Late Night Management Areas Research Project
PARSONS BRINCKERHOFF 2112993A-PR_3131_Rev_B Page 3
2. Methodology The data collection and research was conducted by an independent survey contractor, Austraffic, on two night and early morning periods in March and December 2010:
Table 2.1 Survey days and areas
Research phase Dates of research Research areas No. of count
points No. of
observation points
LNMAR - Phase 1 (March 2010)
Friday 12/03/2010 Kings Cross
Oxford Street
CBD south
105 1757 Saturday 20/03/10
LNMAR - Phase 2 (December 2010)
Saturday 11/12/10 Kings Cross Oxford Street
CBD south 37 778
Friday 17/12/10
The research involved three components:
pedestrian counts: pedestrian counts were undertaken across the four precincts over the survey periods
observation survey: Systematic observation and recording of a range of types of on-street activity and environmental characteristics was undertaken. This included: congregation (standing groups), footway congestion (available space), anti-social behaviour (ASB), litter, policing and security, pedestrian age and gender, and temporal economic diversity (what businesses were open and when)
intercept survey: 947 on-street interviews were conducted with pedestrians regarding reasons for visiting the precincts, types of venues visited, migration between precincts, methods of travel to and from, times of departure, demographic and place of residence information.
The methodology for the research was developed through the following stages:
review and gap analysis of existing City of Sydney research into late night entertainment precincts
review of best practice in international research and planning for late night entertainment areas
consultation with key research agencies involved in issues surrounding alcohol related crime and cultural aspects of night time economy
preliminary fieldwork and pre-piloting of approaches and formal pilot studies.
The research also had a follow-up component which compared findings from the two different seasons.
The results of the surveys are primarily quantitative. Analysis of the results has been undertaken using Geographic Information System (GIS) spatial analysis software and other statistical methods.


Late Night Management Areas Research Project
PARSONS BRINCKERHOFF 2112993A-PR_3131_Rev_B Page 5
3. Literature review As part of the Late Night Management Area Research project, the City of Sydney engaged leading subject matter expert Dr Phil Hadfield, a Senior Visiting Researcher and Associate Fellow of the Centre for Criminal Justice Studies, School of Law, University of Leeds to undertake international research of night time economy management.
Parsons Brinkerhoff has reviewed the outcomes of Dr Hadfield’s research and drawn out the key findings which relate directly to the areas of data collected for this study. The following sections provide a brief summary of the relevant topics to this research from his literature review.
3.1 Public realm profiling
One of the key aspects of public realm profiling is locating crimes using ‘routine activities theory’. According to this theory:
“In order for a crime to occur there must be a convergence in time and space of three minimal elements:
a likely offender
a suitable target (person/s or object/s)
an absence of capable guardians against crime, (absence of surveillance).”
The data collected for this study has captured data on street-level activity such as congregation and the incidents of anti-social behaviour (ASB), the, by time and location and as well as proximity to a specific land use (business establishment) types and its status of operation (e.g. opened or closed). This data assists in the better understanding a number of social and built environmental characteristics which can influence the locations of a range of often alcohol-related disorder.
Hot spots, peak times and flashpoints can be captured through identifying the following movements:
local pedestrian counts
inter-precinct pedestrian movements
incidents of bar hopping (moving from one establishment to the next in a local area).
Factors which can influence the likelihood of crime include:
group behaviours, e.g. antagonism
behaviours as by-products of an individual’s psychological and physiological responses to intoxication/alcohol
people’s intent (small number of trouble makers) seeking out violence.

Late Night Management Areas Research Project
Page 6 2112993A-PR_3131_Rev_B PARSONS BRINCKERHOFF
Identifying the demographic composition of night time activity areas also assists in understanding the potential victimisation of specific groups (those underlined have been incorporated into this study) including:
age
gender
race
sexual preference
socio-economic status.
3.2 Strategies to normalise late night precincts
Key strategies in normalising an environment to reduce the incidence of ASB and to encourage the development of a more diverse, less alcohol-centric night time economy include:
diversifying the demographic composition of an area
development of mixed-use areas
considered location of outlets for food and alcohol and the position of transport nodes e.g. bus stops and taxi ranks.
Other strategies to reduce ASB and make night time activity areas more appealing include:
managing liquor outlet densities
controlling licensing hours
minimising noise nuisance impacts
designing the public realm and making key service interventions, such as timing police patrols, garbage collection, graffiti removal.
Dr Hadfield’s’ research reveals that adding or subtracting 1–2 hours to liquor trading after midnight can have a significant impact on the rate of violence (Hadfield, 20111):
Newcastle, NSW: Changes in closing times from 5.00 am to 3.00 am resulted in a 37% reduction in late-night violence
Perth, WA: The addition of an extra hour of trading after midnight was associated with a 70% increase in late-night violence incidents reported to the police
higher rates of road traffic accidents have been found in drivers who consumed their last drink at premises with extended opening hours.
1 Night-Time Economy Management: International Research and Practice, Hadfield, Phil 2011.

Late Night Management Areas Research Project
PARSONS BRINCKERHOFF 2112993A-PR_3131_Rev_B Page 7
3.3 Transport research
The longer time is spent in nightlife areas waiting for transport services to recommence after the closure of establishments leads to frustration and competition for scare transport services or the use of unsafe methods of travelling home e.g. drink driving or walking whilst intoxicated (Hadfield, 2011).
Safety for transport workers and the night time economy workforce are key requirements that should be considered. Other aspects that are important include:
driver safety – educating the public of pedestrian behaviour around night time activity areas
road safety design of spaces – managing speeds and traffic volumes through areas of high pedestrian traffic
transport staff: consider the occupational risks for staff while dealing with intoxicated patrons
night time economy workforce safety for journey from work trips is an Occupational Health and Safety consideration for employers. It is a key reason identified by late night businesses such as restaurants for not extending hours of operation
increasing Police support on public transport and at transport nodes during the late night hours.
The safety of patrons is also an important consideration for a successful night time economy. Some of the issues which influence the success of late night businesses are:
the pre-loading of alcohol ahead of a night out makes crime and disorder more likely on public transport routes into the city
common closing times have direct impacts on the completion for limited levels of transport provision e.g. competition for limited capacity
availability of multiple occupancy taxis can encourage increased utilisation of existing resources
the supply and demand of taxis needs to be well matched
taxi ranks are located with night-time safety security in mind
safety at both ends of the public transport trips is required, not just the city end
measure are put in place to reduce drink driving
premises supply ‘travel home’, e.g. providing buses themselves, links with local cab firms, etc.

Late Night Management Areas Research Project
Page 8 2112993A-PR_3131_Rev_B PARSONS BRINCKERHOFF
Developing ‘effective’ late night transport is an important aspect of reducing crime and supporting the growth of the night time economy. Key aspects of late night transport include:
the need to diversify transport to cater for a wide range of visitors
transport measures should be seen as one, albeit very important, component in wider programmes to promote and support safer nightlife. It must not be considered a standalone cure for reducing violence
closing time of licenced premises and transport service provision should be matched
taxis are one of the most popular forms of late night transport, but supply must meet patron demand or patron dwell times within the precinct increases. An example of this in Sydney is the 3.00 am taxi shift changeover and the hourly frequency on nightrider buses after rail services have ceased operation which both contribute to groups lingering in precincts longer than required
coordinating multi-modal transport across the city centre is required to achieve to effective dispersal.
3.4 Event management
The ‘Nuit Blanche’ (white night) arts festival concept was derived in France in 1984. It represents an annual event whereby art galleries and cultural facilities open free of charge for long periods of time into the night within the city centre.
In Sydney, similar annual events occur without a significant increase in late night transport provision. A local example of when late night transport was provided but not taken up by patrons was the FIFA World Cup Fan Fest at Darling Harbour in July 2010. Additional transport services were provided but there was poor local take-up due to the time of year (middle of winter) and the poor performance of the local team.
A recent example from New Zealand from the opening of the Rugby World Cup 2011 in the Auckland CBD was at the other end of the scale. For this event, several downtown ‘Live Sites’ were heavily promoted and poorly managed leading to the breakdown of the city’s train and ferry network due to the under-estimation of likely attendance. The transport network never had enough capacity to meet the demand of the highly promoted event.
Both of these examples demonstrate the need to carefully plan transport and city based activities at night when the regular transport services levels are reduced.

Late Night Management Areas Research Project
PARSONS BRINCKERHOFF 2112993A-PR_3131_Rev_B Page 9
4. Pedestrian counts In this section an analysis of the busiest parts of each precinct were identified with respect to the number of pedestrians counted during each hour at each location, with the top five locations identified for each precinct. A cross-precinct analysis also identified the top ten hotspots across the city along with a comparison of the average pedestrian activity with the central core of each precinct. This will identify which of the precincts have the most activity, and how the activity changes throughout the night as well as seasonally.
4.1 Hot spots
Each of the four precincts recorded clear ‘hotspot” locations for pedestrian flow. The following section describes the peak volumes in each location by time of year, day of week and hour of day.
4.1.1 Precinct maximums
4.1.1.1 The Rocks
As show in Table 4.1, the key pedestrian hotspots for The Rocks in the month of March were around the wharves and the waterfront. Pedestrian activity dropped by almost half when measured close to licenced premises in George Street North. The majority of high pedestrian activity in this precinct occurred before midnight and generally on Saturdays.
Table 4.1 The Rocks top five hotspots
Month rank
Hour rank Month Location Day Hour Persons
per hour
1 1 March Circular Quay (wharves) Friday 10–11.00 pm 4000
2 1 March Circular Quay (wharves) Saturday 11–12.00 pm 3500
3 1 March George Street between Argyle Street & Hickson Road
Saturday 9–10.00 pm 2500
4 2 March Circular Quay (MCA) Saturday 11–12.00 pm 2150
5 1 March Circular Quay (wharves) Saturday 12–1.00 am 2150
The Rocks precinct was not included in the December surveys
4.1.1.2 Oxford Street
Oxford Street, at its western end near the IGA supermarket, east of Brisbane Street, made up four of the five busiest locations along Oxford Street based on time periods. This is likely to reflect the significant inter-precinct pedestrian flows between Oxford Street and the CBD south. All of the busiest locations and time periods occurred in the month of December, typically on a Friday and generally before 1.00 am.

Late Night Management Areas Research Project
Page 10 2112993A-PR_3131_Rev_B PARSONS BRINCKERHOFF
Table 4.2 Oxford Street top five hotspots
Month rank
Hour rank Month Location Day Hour Persons
per hour
1 1 December Oxford Street (IGA) Friday 11–12.00 pm 6900
2 1 December Oxford Street (IGA) Friday 12–1.00 am 3900
3 1 December Oxford Street (IGA) Friday 1–2.00 am 3850
4 2 December Oxford Street (IGA) Saturday 11–12.00 pm 3650
5 3 December Oxford Street east of Crown Street Friday 11–12.00 pm 3500
Pedestrian volumes in Oxford Street during March were less than December and peaked later in the night. Oxford Square was the busiest location in March. Oxford Street generally experienced higher pedestrian activity on Saturday nights.
Table 4.3 Oxford Street top five hotspots for March only
Month rank
Hour rank Month Location Day Hour Persons
per hour
1 5 March Oxford Street (Oxford Square) Saturday 12–1.00 am 3050
2 2 March Oxford Street east of Crown Street Saturday 2–3.00 am 2250
3 4 March Oxford Street (Oxford Square) Friday 2–3.00 am 2050
4 2 March Oxford Street (Oxford Square) Saturday 3–4.00 am 1450
5 5 March Oxford Street (IGA) Saturday 4–5.00 am 700
4.1.1.3 Kings Cross
The busiest locations in Kings Cross occurred along Bayswater Road, between Kellett Street and Ward Avenue. Peaks also occurred in the month of March between 1.00 and 2.00 am. The second busiest time period was in December on a Saturday during the same time period. This indicates that Kings Cross is less seasonal than other night activity precincts in the City.
Table 4.4 Kings Cross top five hotspots
Month rank Month Location Day Hour Persons
per hour
1 March Bayswater Road between Kellett Street & Ward Avenue Saturday 1–2.00 am 5950
2 December Darlinghurst Road south of Roslyn Street Saturday 1–2.00 am 5900
3 March Darlinghurst Road north of Bayswater Road Saturday 12–1.00 am 5850
4 March Darlinghurst Road between Roslyn Street & Bayswater Road Saturday 12–1.00 am 5650
5 December Bayswater Road east of Darlinghurst Road Saturday 1–2.00 am 5400

Late Night Management Areas Research Project
PARSONS BRINCKERHOFF 2112993A-PR_3131_Rev_B Page 11
Darlinghurst Road was the busiest area in Kings Cross during March, accounting for four of the top five locations. The highest volumes were all recorded on a Saturday.
Table 4.5 Kings Cross top five hotspots for March only
Month rank Month Location Day Hour Persons
per hour
1 March Bayswater Road between Kellett Street & Ward Avenue Saturday 1–2.00 am 5950
2 March Darlinghurst Road north of Bayswater Road Saturday 12–1.00 am 5850
3 March Darlinghurst Road between Roslyn Street & Bayswater Road Saturday 12–1.00 am 5650
4 March Darlinghurst Road north of Bayswater Road Saturday 2–3.00 am 5050
5 March Darlinghurst Road north of Bayswater Road Saturday 11–12.00 pm 4700
Darlinghurst Road was also the busiest location in the month of December, typically after 1.00 am and always on a Saturday.
Table 4.6 Kings Cross top five hotspots for December only
Month rank Month Location Day Hour Persons
per hour
1 December Darlinghurst Road south of Roslyn Street Saturday 1–2.00 am 5900
2 December Bayswater Road east of Darlinghurst Road Saturday 1–2.00 am 5400
3 December Darlinghurst Road between Roslyn Street & Bayswater Road Saturday 1–2.00 am 5350
4 December Darlinghurst Road north of Bayswater Road Saturday 1–2.00 am 5250
5 December Darlinghurst Road north of Bayswater Road Saturday 12–1.00 am 5200

Late Night Management Areas Research Project
Page 12 2112993A-PR_3131_Rev_B PARSONS BRINCKERHOFF
4.1.1.4 CBD south
The busiest location in CBD south was on George Street at Central Street, in the cinema/entertainment precinct (see Table 4.7). The highest volume recorded at this location (7,600 pedestrians) occurred between 12.00 and 1.00 am on a Saturday in December. Rail services generally cease operation around 1.00 am. This precinct was busy on both Friday and Saturday evenings.
Table 4.7 CBD south top five hotspots
Month rank
Hour rank Month Location Day Hour Persons
per hour
1 1 December George Street at Central Street Saturday 12–1.00 am 7600
2 2 December George Street at Central Street Friday 12–1.00 am 6850
3 1 December George Street at Central Street Saturday 11–12.00 pm 6600
4 2 December George Street at Central Street Friday 11–12.00 pm 5850
5 1 December George Street at Central Street Saturday 1–2.00 am 5100
Whilst George Street, at Central Street, remained the busiest location in CBD south during March, the pedestrian volumes were almost half of those experienced in December. The time period of high activity was also more varied in March.
Table 4.8 CBD south top five hotspots for March only
Month rank
Hour rank Month Location Day Hour Persons
per hour
1 3 March George Street at Central Street Friday 11–12.00 pm 4560
2 4 March George Street at Central Street Saturday 11–12.00 pm 4400
3 5 March George Street at Central Street Saturday 12–1.00 am 3450
4 4 March George Street at Central Street Saturday 1–2.00 am 3150
5 4 March George Street at Central Street Saturday 2–3.00 am 2300

Late Night Management Areas Research Project
PARSONS BRINCKERHOFF 2112993A-PR_3131_Rev_B Page 13
4.1.2 Pedestrian volumes
Figure 4.1 shows the heat map of pedestrian activity for the CBD south precinct between 12.00 and 1.00 am in December 2010 which represents the busiest period recorded for the entire City (all precincts) during the period of the surveys.
Figure 4.1 Peak pedestrian volumes in CBD south

Late Night Management Areas Research Project
Page 14 2112993A-PR_3131_Rev_B PARSONS BRINCKERHOFF
4.2 Cross-precinct comparison
4.2.1 Precinct maximums
4.2.1.1 Top ten hotspots for all precincts both months
The busiest precincts during the month of December were CBD south and Kings Cross. Seven out of ten hotspots occurred during December. Seven hotpots also occurred on a Saturday night. All of the busiest time periods occurred between 11.00 pm and 2.00 am.
Table 4.9 Precinct maximums based on top ten hotspots
Rank Month Precinct Location Day Hour Persons per hour
1 December CBD south George Street at Central Street Saturday 12–1.00 am 7600
2 December Oxford Street Oxford Street (IGA) Friday 11–12.00 pm 6900
3 December CBD south George Street at Central Street Friday 12–1.00 am 6850
4 December CBD south George Street at Central Street Saturday 11–12.00 pm 6600
5 March Kings Cross Bayswater Road between Kellett Street & Ward Avenue
Saturday 1–2.00 am 5950
6 December Kings Cross Darlinghurst Road south of Roslyn Street
Saturday 1–2.00 am 5900
7 March Kings Cross Darlinghurst Road north of Bayswater Road
Saturday 12–1.00 am 5850
8 December CBD south George Street at Central Street Friday 11–12.00 pm 5850
9 March Kings Cross Darlinghurst Road between Roslyn Street & Bayswater Road
Saturday 12–1.00 am 5650
10 December Kings Cross Bayswater Road east of Darlinghurst Road
Saturday 1–2.00 am 5400

Late Night Management Areas Research Project
PARSONS BRINCKERHOFF 2112993A-PR_3131_Rev_B Page 15
4.2.1.2 Top ten hotspots for all precincts March only
In March, all but one hotspot occurred in Kings Cross. This reflects the regular activity that occurs at this location outside of the seasonal periods of activity elsewhere in the City.
Table 4.10 Precinct maximums based on top ten hotspots for March only
Month rank Month Precinct Location Day Hour Persons
per hour
1 March Kings Cross Bayswater Road between Kellett Street & Ward Avenue Saturday 1–2.00 am 5950
2 March Kings Cross Darlinghurst Road north of Bayswater Road Saturday 12–1.00 am 5850
3 March Kings Cross Darlinghurst Road between Roslyn Street & Bayswater Road Saturday 12–1.00 am 5650
4 March Kings Cross Darlinghurst Road north of Bayswater Road Saturday 1–2.00 am 5050
5 March Kings Cross Darlinghurst Road north of Bayswater Road Saturday 2–3.00 am 5050
6 March Kings Cross Darlinghurst Road between Roslyn Street & Bayswater Road Saturday 1–2.00 am 4800
7 March Kings Cross Darlinghurst Road north of Bayswater Road Saturday 11–12.00 pm 4700
8 March Kings Cross Darlinghurst Road between Roslyn Street & Bayswater Road Saturday 11–12.00 pm 4700
9 March CBD south George Street at Central Street Friday 11–12.00 pm 4550
10 March Kings Cross Darlinghurst Road south of Roslyn Street Saturday 11–12.00 pm 4450

Late Night Management Areas Research Project
Page 16 2112993A-PR_3131_Rev_B PARSONS BRINCKERHOFF
4.2.1.3 Top ten hotspots for all precincts December only
Four of the top six hotspots in December occurred in CBD south. Kings Cross also proved a popular location in December on Saturday nights between 1.00 and 2.00 am.
Table 4.11 Precinct maximums based on top ten hotspots for December only
Month rank Month Precinct Location Day Hour Persons
per hour
1 December CBD south George Street at Central Street Saturday 12–1.00 am 7600
2 December Oxford Street Oxford Street (IGA) Friday 11–12.00 pm 6900
3 December CBD south George Street at Central Street Friday 12–1.00 am 6850
4 December CBD south George Street at Central Street Saturday 11–12.00 pm 6600
5 December Kings Cross Darlinghurst Road south of Roslyn Street Saturday 1–2.00 am 5900
6 December CBD south George Street at Central Street Friday 11–12.00 pm 5850
7 December Kings Cross Bayswater Road east of Darlinghurst Road Saturday 1–2.00 am 5400
8 December Kings Cross Darlinghurst Road between Roslyn Street & Bayswater Road Saturday 1–2.00 am 5350
9 December Kings Cross Darlinghurst Road north of Bayswater Road Saturday 1–2.00 am 5250
10 December Kings Cross Darlinghurst Road north of Bayswater Road Saturday 12–1.00 am 5200
The Rocks precinct was not included in the December surveys

Late Night Management Areas Research Project
PARSONS BRINCKERHOFF 2112993A-PR_3131_Rev_B Page 17
4.2.2 Central area averages
A comparison of the central areas of each precinct was conducted to identify the level of activity for each precinct by weekday and season.
Figure 4.2 indicates the average number of pedestrian movements in each precinct for all survey nights.
Figure 4.2 Average number of pedestrian movements in the central area of each precinct for all survey days
Kings Cross has the highest activity for all precincts after 1 am, and The Rocks have the lowest activity throughout the night.
4.3 Key entry and exit points
The following shows the number of recorded pedestrian movements across a cordon (persons per two hour (p/2h) all periods, mean values) at key entry/exit points into and out of the precincts (i.e. in both directions).
0
500
1000
1500
2000
2500
3000
11pm-12am 12-1am 1-2am 2-3am 3-4am 4-5am
CBD South Kings Cross Oxford Street The Rocks

Late Night Management Areas Research Project
Page 18 2112993A-PR_3131_Rev_B PARSONS BRINCKERHOFF
Table 4.12 City-wide: top 5 entry/exit points4
Precinct Gateway Location 9.00–
11.00 pm (p/2h)
11.00 pm–1.00 am
(p/2h)
1.00–3.00 am (p/2h)
3.00–5.00 am (p/2h)
Total
CBD south east Liverpool Street east of Pitt Street n/a 4000 2300 1550 7850
CBD south north George Street north of Park Street n/a 3650 2750 1450 7850
CBD south west Liverpool Street west of Kent Street n/a 3600 1950 1150 6700
CBD south south George Street south of Hay Street n/a 3200 1850 1100 6150
Rocks east Alfred Street (McDonalds) 2850 2000 1200 3502 55003
Table 4.13 CBD south: top 5 entry/exit points4
Gateway Location 11.00 pm–1.00 am
(p/2h)
1.00–3.00 am (p/2h)
3.00–5.00 am (p/2h)
Total
East Liverpool Street east of Pitt Street 4000 2300 1550 7850
North George Street north of Park Street 3650 2750 1450 7850
West Liverpool Street west of Kent Street 3600 1950 1150 6700
South George Street south of Hay Street 3200 1850 1100 6150
North QVB Forecourt 2750 1550 900 5200
Table 4.14 Kings Cross: top 5 entry/exit points4
Gateway Location 11.00 pm–1.00 am
(p/2h)
1.00–3.00 am (p/2h)
3.00–5am
(p/2h) Total
West William Street east of Brougham Street 2200 2000 900 5100
North Macleay Street south of Orwell Street 1200 1050 650 2900
South Darlinghurst Road south of William Street 1250 800 450 2500
South Victoria Street south of Craigend Street 950 700 300 1950
North Ward Avenue south of Barncleuth Avenue 800 600 300 1700
2 To 4.00 am only 3 To enable a valid cross-precinct comparison, this figure has been adjusted for survey duration 4 In most cases this data only reflects the March survey, which had a larger extent. Mean values are used to
average any differences in survey times.

Late Night Management Areas Research Project
PARSONS BRINCKERHOFF 2112993A-PR_3131_Rev_B Page 19
Table 4.15 Oxford Street: top 5 entry/exit points5
Gateway Location 11.00 pm–1.00 am
(p/2h)
1.00–3.00 am (p/2h)
3.00–5.00 am (p/2h)
Total
West Liverpool Street west of College Street 2150 1250 950 4350
East Oxford Street east of Flinders Street 1950 1100 550 3600
North Crown Street north of Oxford Street 1400 700 300 2400
South Bourke Street south of Campbell Street 1200 400 200 1800
North Forbes Street (National Art School) 750 550 250 1550
Table 4.16 The Rocks: top 2 entry/exit points5
Gateway Location 9.00–
11.00 pm (p/2h)
11.00 pm–1.00 am (p/2h)
1.00–3.00 am (p/2h)
3.00–5.00 am (p/2h)
Total
East Alfred Street (McDonalds) 2850 2000 1200 350 6400
South Alfred Street and George Street 2500 2000 1250 350 6100
4.3.1 Key entry and exit point findings
The key findings relating to entry and exit points include:
In all locations, the busiest period was in the 11.00 pm–12.00 am period, with activity dropping steadily (by 20–45%) from the 12.00 pm–1.00 am to the 1.00–3.00 am period, and by 60-80% from the earlier period of the night to the latest 3.00–5.00 am period.
In CBD south, the eastern entry/exit point on Liverpool Street recorded the highest levels of inward and outward movement over the surveys (a peak of 4000 persons/2 hours during the busiest period of 11.00 pm–1.00 am). However, the combined the northern entry/exit points, around the Queen Victoria Building (George, York and Druitt Streets), accounted for the largest amount of inward and outward movement at a gateway area, city-wide (14,000 pedestrian movements over the night).
Kings Cross had a slightly steadier level of activity (i.e. not dropping off as quickly as other areas) at the key entry/exit points from the earlier to the middle part of the night. This may potentially reflect movement to/from Kings Cross and other precincts later into the evening. The western entry/exit point on William Street was the busiest area, having substantially more movement than other precinct entry/exit points.
Oxford Street had the largest pedestrian flows to and from the CBD south along Liverpool Street, west of College Street.
The Rocks has the largest difference between the earlier 11.00 pm–1.00 am period to the later part of the night (an 85% drop in activity), which is consistent with the generally lower levels of activity in this precinct, late at night.
5 In most cases this data only reflects the March survey. Mean values are used to average any differences in
survey times


Late Night Management Areas Research Project
PARSONS BRINCKERHOFF 2112993A-PR_3131_Rev_B Page 21
5. Observation survey The observation survey data was used to determine the number of anti-social behaviour (ASB) incidents across all the precincts. A number of factors were investigated to determine their potential influence on ASB incidents. An analysis of the level of crowding, congregation and gender proportion was conducted to determine the distribution across all precincts.
5.1 Anti-social behaviour
For the purposes of this research, anti-social behaviour (ASB) referred to the following types of behaviour:
more serious ASB – physical fights; verbal fights and arguments; shouting and verbal abuse
less serious ASB – drunken staggering, falling or bad balance; loud music; urination and vomiting; street drinking; vandalism
non-serious ASB – singing and horsing around
Police intervention – incidences of Police intervention.
To improve inter-rater reliability (a key error associated with systematic social observation using multiple surveyors), observers were given detailed definitions of the types of behaviour with practical examples that did and did not qualify for each of the behaviour types, pilot surveys were conducted, inter-rater reliability checking was undertaken,. Categories and definitions were revised based on pilot findings. Field training and practice were provided to the observers.

Late Night Management Areas Research Project
Page 22 2112993A-PR_3131_Rev_B PARSONS BRINCKERHOFF
5.1.1 ASB with land use
ASB was plotted against pedestrian congestion and land use operating hours using GIS. An example of this can be seen in Figure 5.1. This analysis has been undertaken for all precincts, for all time periods, and for all months.
Figure 5.1 ASB congestion and approximate land use activity (open/closed) in CBD south

Late Night Management Areas Research Project
PARSONS BRINCKERHOFF 2112993A-PR_3131_Rev_B Page 23
5.1.2 Joint variable analysis of total ASB incidents
This analysis compares the general trends between ASB incidents and congregation levels, and between ASB incidents and the number of high congestion locations across the four precincts. Some survey locations across each precinct were only surveyed during one month, therefore only general trends can be observed.
Figure 5.2 shows the reduction in congregation across all precincts as the night progresses, with a similar reduction in the total number of ASB incidents. Further analysis was completed for each precinct with the results shown in Appendix A.
Figure 5.2 Total ASB vs. Total Congregation for all December days
0
2000
4000
6000
8000
10000
12000
14000
16000
0
100
200
300
400
500
600
700
800
11 pm - 12am
12 -1 am 1 - 2 am 2 - 3 am 3 - 4 am 4 - 5 am
Tota
l Con
greg
atio
n (p
eopl
e)
Tota
l ASB
(inc
iden
ts)
Time
Total ASB Total Congregation

Late Night Management Areas Research Project
Page 24 2112993A-PR_3131_Rev_B PARSONS BRINCKERHOFF
Figure 5.3 shows the reduction in the number of high congestion locations across all precincts after the 12.00 am to 1.00 am hour, with a similar reduction in the total number of ASB incidents. Further analysis was completed for each precinct with the results shown in Appendix A.
Figure 5.3 Total ASB vs. number of high congestion locations for all survey days
Key findings indicated by observed trends in ASB6:
after 1.00 am there is a similar reduction in ASB incidents as congregation levels
there is also a similar reduction in ASB incidents as the number of high congestion locations is reduced after 1.00 am
CBD south shows a reduction in ASB incidents as congregation eases
Kings Cross shows a reduction of ASB incidents as both congregation and congestion fall
Oxford Street shows a reduction in ASB incidents with the reduction of both congregation and congestion, but only after 2.00 am
The Rocks show a delayed reduction in ASB incidents after both congregation and congestion are reduced.
6 Observed trends do not imply a direct relationships between ASB and congregation and congestion levels.
0
200
400
600
800
1000
1200
1400
0
100
200
300
400
500
600
700
800
11 pm - 12am
12 -1 am 1 - 2 am 2 - 3 am 3 - 4 am 4 - 5 am
Num
ber o
f Hig
h Co
nges
tion
Loca
tions
Tota
l ASB
(inc
iden
ts)
Time
Total ASB High Congestion Locations

Late Night Management Areas Research Project
PARSONS BRINCKERHOFF 2112993A-PR_3131_Rev_B Page 25
5.1.3 Joint variable analysis ASB and land use
Businesses were divided according to the industry type (ANZSIC7 categories), and were identified as open, open with outdoor dining or closed. The analysis used a 10-metre radius from each point representing a business, and therefore in areas with a high business density some ASB incidents may have been counted multiple times.
Figure 5.4 indicates the distance from the nearest open or open with dining outdoors premises that an ASB occurred.
Calculations are based on point data and these points were approximately 2-3m back from the building line toward the middle of the parcel
Figure 5.4 ASB incident location distance to nearest business
7 Australia New Zealand Standard Industrial Classification 2006.
-50
0
50
100
150
200
250
300
350
400
0 10 20 30 40 50 60 70 80 90
ASB
Inci
dent
s
Distance (m)
Open Open with Dining Outdoors
Linear (Open) Linear (Open with Dining Outdoors)

Late Night Management Areas Research Project
Page 26 2112993A-PR_3131_Rev_B PARSONS BRINCKERHOFF
Table 5.1 indicates the number of ASB incidents associated with each category of business, along with percentage of total ASB incidents. A detailed list of ANZSIC business types is provided in Appendix B for reference.
Table 5.1 ASB vs. business type and land use
Business type Total ASB Percentage of ASB
Open
Bars, pubs and liquor vendors 1,216 32%
Restaurant, cafes and food retailers 605 16%
Services (i.e. advertising, hairdressing, telecommunications) 524 14%
Retail (i.e. media, jewellers, bookshop) 430 11%
Accommodation 357 9%
Takeaway food services 348 9%
Entertainment 68 2%
Medical 5 <1%
Open with dining outdoors
Pubs and liquor vendors 145 4%
Restaurant and food retailers 118 3%
Takeaway food services 3 <1%
Retail 3 <1%
Total ASB incidents 3,822
The key findings related to ASB incidents and distance from a business are:
for open businesses, 43% of ASB incidents occurred within 10 m
with a further 41% of incidents occurring between 10 m and 40 m
77% of ASB incidents associated with businesses that were open with outdoor dining occurred within 20 m of a venue
bars, pubs and liquor vendors accounted for 36% of all ASB incidents, both open and open with outdoor dining
restaurants, cafes and food retailers accounted for 19% of all ASB incidents, both open and open with outdoor dining.

Late Night Management Areas Research Project
PARSONS BRINCKERHOFF 2112993A-PR_3131_Rev_B Page 27
5.1.4 Land use point data
ASB incidents were plotted against pedestrian congestion and land use type and operating hours using GIS. An example of this can be seen in Figure 5.5. This analysis has been undertaken for all precincts for all time periods and all months.
Figure 5.5 ASB incidents and land use along Oxford Street

Late Night Management Areas Research Project
Page 28 2112993A-PR_3131_Rev_B PARSONS BRINCKERHOFF
5.1.5 ASB by precinct and month
The ASB incidents for each precinct were recorded by hour. The results are presented to show seasonal changes between the March and December surveys, as well as weekday differences between Friday and Saturday nights.
The precincts all differed in size and shape, and consequently often had a different number of observers recording activity. As observational data, these overall figures reflect both methodological differences, as well as actual, differences in the type and level of activity. To account for this, we have also analysed density of ASB below in Section 5.1.6 which controls for these errors.
5.1.5.1 ASB incidents by month
Figure 5.6 Number of ASB incidents by precinct for both March and December
0
10
20
30
40
50
60
11pm-12am 12-1am 1-2am 2-3am 3-4am 4-5am
Num
ber o
f ASB
inci
dent
s
CBD South Kings Cross Oxford St The Rocks

Late Night Management Areas Research Project
PARSONS BRINCKERHOFF 2112993A-PR_3131_Rev_B Page 29
Figure 5.7 Number of ASB incidents by precinct for March only
No data for The Rocks precinct available for December surveys
Figure 5.8 Number of ASB incidents by precinct for December only
0102030405060708090
100
11pm-12am 12-1am 1-2am 2-3am 3-4am 4-5am
Num
ber o
f ASB
inci
dent
s
CBD South Kings Cross Oxford St The Rocks
0
5
10
15
20
25
30
35
11pm-12am 12-1am 1-2am 2-3am 3-4am 4-5am
Num
ber o
f ASB
inci
dent
s
CBD South Kings Cross Oxford St

Late Night Management Areas Research Project
Page 30 2112993A-PR_3131_Rev_B PARSONS BRINCKERHOFF
5.1.5.2 ASB incidents by weekday
Figure 5.9 Number of ASB incidents by precinct for both weeknights
Figure 5.10 Number of ASB incidents by precinct for Friday only
0
10
20
30
40
50
60
11pm-12am 12-1am 1-2am 2-3am 3-4am 4-5am
Num
ber o
f ASB
inci
dent
s
CBD South Kings Cross Oxford St The Rocks
0
10
20
30
40
50
60
70
11pm-12am 12-1am 1-2am 2-3am 3-4am 4-5am
Num
ber o
f ASB
inci
dent
s
CBD South Kings Cross Oxford St The Rocks

Late Night Management Areas Research Project
PARSONS BRINCKERHOFF 2112993A-PR_3131_Rev_B Page 31
Figure 5.11 Number of ASB incidents by precinct for Saturday only
The key findings on the number of ASB incidents occurring are:
Kings Cross has the greatest number of ASB incidents and peaks around 1.00–2.00 am
CBD south is the precinct with the second highest level of ASB incidents, and with a steadier rate of occurrence throughout the night
ASB incidents in Oxford Street typically occur later in the evening after 2.00 am
Kings Cross has a significantly higher level of ASB incidents than any other precinct in March
CBD south has the highest level of ASB incidents (up to 30 per hour) in December for all time periods, except between the hours of 3.00 and 5.00 am, when they are at the same level as Kings Cross (22 per hour)
Oxford Street has significantly more ASB incidents on Saturdays and typically later in the evening after 2.00 am.
0
10
20
30
40
50
60
70
80
11pm-12am 12-1am 1-2am 2-3am 3-4am 4-5am
Num
ber o
f ASB
inci
dent
s
CBD South Kings Cross Oxford St The Rocks

Late Night Management Areas Research Project
Page 32 2112993A-PR_3131_Rev_B PARSONS BRINCKERHOFF
5.1.6 ASB density by precinct and month
An analysis has been performed on the number of instances of ASB per metre of footway area in the core sections of the three major precincts8. This analysis refers to the likelihood of witnessing an instance of ASB in a 50-metre stretch of footway if walking normally through the respective precincts at certain hourly periods9. This does not refer to the total number of instances - which would be substantially higher. The Rocks had very low levels of ASB generally and does not make a meaningful for comparison in this analysis.
5.1.6.1 Serious ASB
There was a 16% chance of witnessing an instance of serious ASB on a 50 m stretch of footway across the three main precincts; this likelihood peaked at 69% in March in Kings Cross. Across the three precincts, the chances were highest at 1.00–2.00 am (22%) and lowest earlier in the evening (11% at 11.00 pm–12.00 am). There was a significantly higher chance in Kings Cross than in other areas (2–2.5 times more likely than the average to see ASB). The CBD south (12%) and Oxford Street (9%) had more comparable rates. In all areas the likelihood got higher as the night progressed, where one was 1.7 times more likely to see ASB at the end of the night (4.00–5.00 am) compared to the beginning (11.00 pm–12.00 am). Overall, rates were higher in March (18%) than in December (11%).
Table 5.2 Percentage chance of seeing more serious ASB in the three precincts
Season Precinct 11.00–12.00 am
12–1.00 am
1.00–2.00 am
2.00–3.00 am
3.00–4.00 am
4.00–5.00 am Mean
March
Kings Cross 35% 38% 69% 50% 40% 37% 45%
CBD south 1% 4% 3% 3% 3% 4% 3%
Oxford Street 1% 1% 5% 15% 13% 9% 7%
December
Kings Cross 7% 8% 10% 4% 16% 26% 12%
CBD south 13% 19% 25% 17% 13% 19% 17%
Oxford Street 2% 4% 7% 7% 7% 3% 5%
Mean
Kings Cross 28% 31% 52% 36% 36% 42% 37%
CBD south 8% 13% 15% 11% 9% 13% 12%
Oxford Street 2% 3% 8% 15% 14% 8% 9%
Three precinct mean 11% 13% 22% 18% 17% 18% 16%
CBD south
There was also a relatively low chance (12%) of seeing more serious ASB in the CBD south, and this rate stayed relatively consistent across the night. There was a substantially higher likelihood in December (17%) compared to March (3%), which was the reverse of Kings Cross and Oxford Street.
8 This has been adjusted to account for number of persons observing and number of nights over which
observation happened. 9 This reporting method better reflects the nature of the survey methodology, and better equates to the actual
experience of a person moving through these areas.

Late Night Management Areas Research Project
PARSONS BRINCKERHOFF 2112993A-PR_3131_Rev_B Page 33
Kings Cross
In Kings Cross there was more than a one in three chance of seeing serious ASB, however this is far more likely in March (45%) than December (around one in ten). In December the likelihood increased more consistently as the night progressed, whereas in March it peaked at 1.00–2.00 am (69%) and was relatively consistent in other periods (35–40%).
Oxford Street
On Oxford Street there was a comparatively low chance of seeing more serious ASB (less than one in ten – 9%). This was highest later in the night between 2.00–4.00 am (15% compared to 5% at other times) and higher in March (14%) than December (7%) during this same time bracket.
5.1.6.2 Less serious ASB
Overall, the chance of seeing less serious ASB was substantially higher (46%) than for more serious ASB (16%), and peaked at 95% in Kings Cross in March. Except for in the CBD south, the likelihood increased as the night progressed. Again, Kings Cross had rates around 1.5 times higher than the other precincts, however Oxford Street was more comparable (57% compared to 75% in Kings Cross) at certain times (1.00–3.00 am). Rates were also higher in March (40%) than December (32%).
Table 5.3 Percentage chance of seeing less serious ASB in the three precincts
Season Precinct 11.00–12.00 am
12.00–1.00 am
1.00–2.00 am
2.00–3.00 am
3.00–4.00 am
4.00–5.00 am Mean
March
Kings Cross 58% 61% 72% 84% 95% 48% 69%
CBD south 27% 31% 30% 27% 26% 9% 25%
Oxford Street 4% 11% 32% 41% 30% 24% 24%
December
Kings Cross 25% 31% 37% 35% 32% 47% 35%
CBD south 30% 24% 31% 34% 21% 19% 27%
Oxford Street 34% 26% 44% 49% 26% 22% 34%
Mean
Kings Cross 55% 61% 72% 78% 84% 62% 69%
CBD south 32% 31% 35% 34% 27% 16% 29%
Oxford Street 27% 26% 52% 62% 39% 32% 40%
Three precinct mean 38% 39% 53% 58% 50% 37% 46%
CBD south
There was close to a one in three chance of seeing less serious ASB in the CBD south (29%) and this was consistent between March and December. One was twice as likely to see less serious ASB in December compared to March in the 4.00–5.00 am period.
Kings Cross
Generally, one was twice as likely to see an instance of less serious ASB in March (69%) as in December (35%).

Late Night Management Areas Research Project
Page 34 2112993A-PR_3131_Rev_B PARSONS BRINCKERHOFF
Oxford Street
There was a relatively higher likelihood of less serious ASB in Oxford Street (i.e. in Kings Cross and the CBD south the rates between more and less serious ASB were more congruent).
5.1.7 Key ASB findings
The key findings relating to ASB include:
Kings Cross has the greatest number and density of ASB incidents and peaks around 1.00–2.00 am
CBD south is the precinct with the second highest level of ASB incidents with a steadier rate of occurrence throughout the night
ASB incidents in Oxford Street typically occur later in the evening after 2.00 am, and there are significantly more incidents on Saturday
Kings Cross has a significantly higher level of ASB incidents than any other precinct in March
CBD south has the highest level of ASB incidents (up to 30 per hour) in December for all time periods except between the hours of 3.00 and 5.00 am when they are at the same level as Kings Cross (22 per hour)
the highest chance of seeing serious ASB occurring anywhere in the study area is in Kings Cross between 1.00 and 2.00 am
the second most likely location where one could witness a serious ASB incident would be in CBD south early in the night up to 1.00 am, and then Oxford Street after this time
less serious ASB is likely to occur more evenly across the three main precincts (excluding The Rocks where overall rates were very low) but is still the highest in Kings Cross. The trends for the timing of incidents is similar across the precincts to serious ASB.

Late Night Management Areas Research Project
PARSONS BRINCKERHOFF 2112993A-PR_3131_Rev_B Page 35
5.1.8 Aggregate mapping
ASB incidents were aggregated for all survey nights and plotted against pedestrian congestion using GIS. An example of this can be seen in Figure 5.12. This analysis has been undertaken for all precincts and all months.
Figure 5.12 Aggregated ASB for Friday and Saturday nights in Kings Cross

Late Night Management Areas Research Project
Page 36 2112993A-PR_3131_Rev_B PARSONS BRINCKERHOFF
5.2 Congregation and footpath congestion
Congregation refers to groups of people congregating, usually standing, in the street, for reasons including waiting for a taxi, bus; in a queue or socialising, it also included people congregating whilst seated in outdoor dining areas located on the street. Congestion refers to the amount of available space on the footpath which is a function: i) number of pedestrians and groups, ii) footpath width, iii) obstacles, such as furniture (bins, outdoor dining, queue ropes) or trees.
5.2.1 Congregation with land use
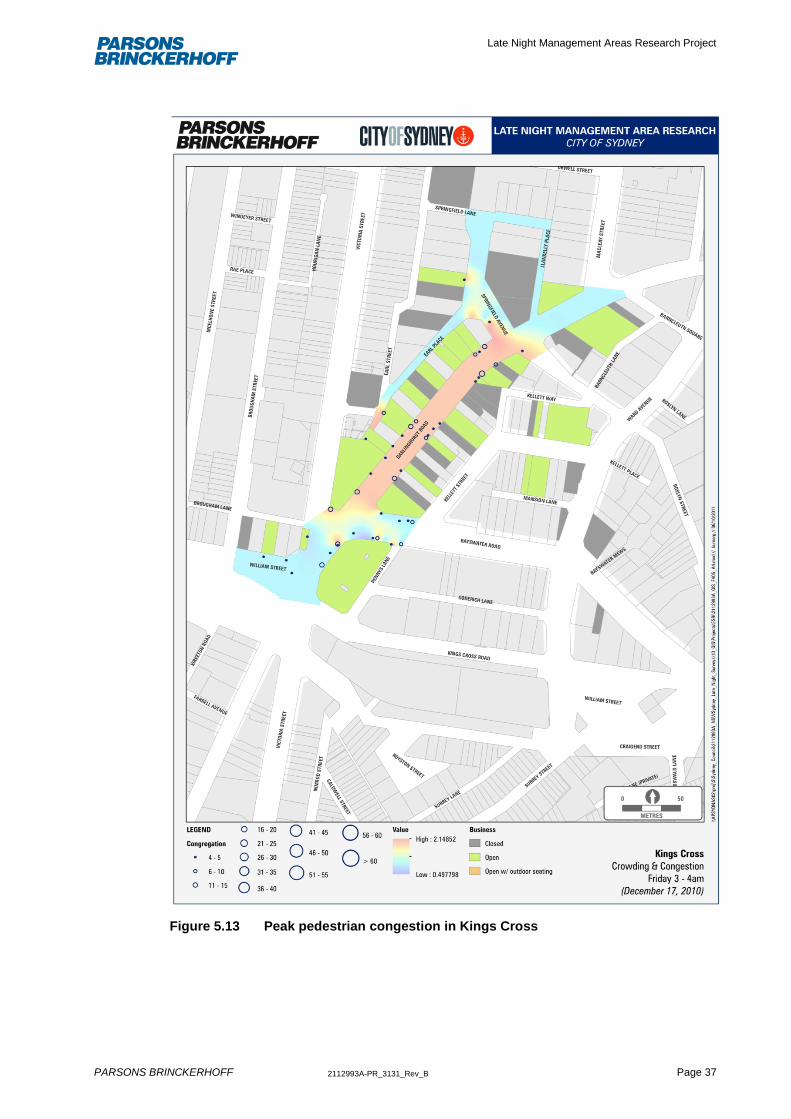
Congregation of groups was plotted against footway congestion and land use operating hours using GIS. An example of this can be seen in Figure 5.13. This analysis has been undertaken for all precincts for all time periods and all months.
Late Night Management Areas Research Project
PARSONS BRINCKERHOFF 2112993A-PR_3131_Rev_B Page 37
Figure 5.13 Peak pedestrian congestion in Kings Cross

Late Night Management Areas Research Project
Page 38 2112993A-PR_3131_Rev_B PARSONS BRINCKERHOFF
5.2.2 Congestion by precinct and month
Congestion was recorded as low, medium and high (see definitions Appendix C1). At a precinct level, the levels of congestion were relatively low, on average, rating just above low level. Generally, congestion is more relevant at the micro-level, i.e. associated with particular hotspot areas and times, and this is discussed in more detail in Section 4.1. However, understanding precinct-wide patterns is important to compare issues across the three major precincts.
Figure 5.14 indicates there were substantially higher levels in the CBD south in the earlier part of the night than other areas. In the CBD south and Oxford Street, the levels of congestion peak in earlier part of the night and in Kings Cross between 1.00 am and 4.00 am. At a precinct-wide level, The Rocks showed low congestion throughout the nights, with only certain hotspots appearing at certain times (see discussion of hotspots in Section 4.1).
Figure 5.14 Mean level of congestion in the three precincts
As shown in Appendix C2, Figure C2.1 to Figure C2.3, generally congestion levels were higher in Kings Cross in December than in March particularly later in the night. In the CBD south, levels were substantially higher in December, but followed a consistent pattern in both seasons of starting high and then dropping at a rate consistent with the three precinct mean. The seasonal variation on Oxford Street was the reverse of the two major precincts, with higher levels in March. In December however the rates stayed fairly consistent across the night.
11pm-12am 12-1am 1-2am 2-3am 3-4am 4-5am
Leve
l of f
ootw
ay c
onge
stio
n
TIME
Level of footway congestion precinct core area
Kings X CBD sth Oxford St 3 precinct mean
low
medium

Late Night Management Areas Research Project
PARSONS BRINCKERHOFF 2112993A-PR_3131_Rev_B Page 39
5.3 Gender distribution
Gender is a key variable in understanding the demographics of people in the precincts late at night. Figure 5.15 indicates the proportion of male and females observed in all precincts during all survey days.
There are some inconsistencies between precincts for data before 1.00 am and consequently is not reported
Figure 5.15 Gender proportion by hour for all survey days
Figure 5.16 indicates the proportion of each gender within all precincts across all the survey days.
Figure 5.16 Gender proportion by precinct for all survey days
40%
45%
50%
55%
60%
65%
70%
1:00am 2:00am 3:00am 4:00am 5:00am
Perc
enta
ge (%
)
Time
Female
Male
40%
45%
50%
55%
60%
65%
70%
CBD South Kings Cross Oxford St The Rocks
Female
Male

Late Night Management Areas Research Project
Page 40 2112993A-PR_3131_Rev_B PARSONS BRINCKERHOFF
The key findings relating to gender are:
approximately 60% of all people in late night precincts during all survey days were male
there was around a 10 percentage point increase in the proportion of males from 1.00 am to 5.00 am
the gender balance did not differ significantly between March and December
the proportion of females drops slightly on Friday nights
only The Rocks was substantially different to the overall rate of 60% male, with a ratio closer to 50:50 male:female.

Late Night Management Areas Research Project
PARSONS BRINCKERHOFF 2112993A-PR_3131_Rev_B Page 41
6. Land use analysis An analysis of land uses was conducted for all four precincts, with the number of open businesses identified during each hour of the survey period. Businesses were divided into open, open with dining outdoors, and closed to help identify the business types in each precinct contributing to the late night economy.
6.1 All precincts
Figure 6.1 indicates the number of open businesses during each time period for all precincts, with pubs, taverns and bars accounting for the highest number of open businesses.
Figure 6.1 Number of businesses of each type open across all precincts
0
200
400
600
800
1000
1200 Supermarket and GroceryStoresEntertainment MediaRetailingAccommodation
Personal Services N.E.C.
Other Store-BasedRetailing n.e.c.Other
Takeaway Food Services
Cafes and Restaurants
Pubs, Taverns and Bars

Late Night Management Areas Research Project
Page 42 2112993A-PR_3131_Rev_B PARSONS BRINCKERHOFF
6.2 CBD south
Figure 6.2 indicates that the CBD south has a large number of pubs, taverns and bars open until 3.00 am at which point there is a significant reduction. Cafes and restaurants begin to close around 1.00 am, however a large number of take away shops remain open throughout the night.
Figure 6.2 Number of businesses of each type open in CBD south
6.3 Kings Cross
Figure 6.3 indicates that the Kings Cross precinct has a fairly even distribution of business types that remain open throughout the night. The proportion of business types remains fairly constant in the precinct throughout the night as well.
Figure 6.3 Number of businesses of each type open in Kings Cross
0
50
100
150
200
250
300
350
400 Entertainment MediaRetailingPersonal Services N.E.C.
Supermarket and GroceryStoresAccommodation
Other Store-BasedRetailing n.e.c.Other
Cafes and Restaurants
Pubs, Taverns and Bars
Takeaway Food Services
0
50
100
150
200
250
300
350
400Entertainment MediaRetailingAccommodation
Other Store-BasedRetailing n.e.c.Personal Services N.E.C.
Cafes and Restaurants
Other
Takeaway Food Services
Pubs, Taverns and Bars

Late Night Management Areas Research Project
PARSONS BRINCKERHOFF 2112993A-PR_3131_Rev_B Page 43
6.4 Oxford Street
Figure 6.4 indicates that the Oxford Street precinct has a high proportion of cafes and restaurants, and of pubs, taverns and bars. A significant number of cafes and restaurants close before 2.00 am. Throughout the night there is an increasing proportion of pubs, taverns and pubs remaining open compared to other businesses in the precinct.
Figure 6.4 Number of businesses of each type open in Oxford Street
6.5 The Rocks
Figure 6.5 indicates that all businesses in the rocks are closed by 2.00 am. Bars, taverns and bars make up the largest proportion of open businesses between 11.00 pm and 2.00 am.
Figure 6.5 Number of businesses of each type open in The Rocks
0
50
100
150
200
250
300
350
400 Accommodation
Supermarket and GroceryStoresPersonal Services N.E.C.
Entertainment MediaRetailingOther
Other Store-BasedRetailing n.e.c.Takeaway Food Services
Cafes and Restaurants
Pubs, Taverns and Bars
0
50
100
150
200
250
300
350
400Supermarkets andGrocery StoresOther
Accommodation
Other Store-BasedRetailing n.e.c.Takeaway Food Retailing
Cafes and Restaurants
Pubs, Taverns & Bars


Late Night Management Areas Research Project
PARSONS BRINCKERHOFF 2112993A-PR_3131_Rev_B Page 45
7. Intercept survey The intercept survey data was analysed for the combined March and December survey period, with results showing data from all survey days. The sample size for this survey included 651 responses for both nights in March and 296 responses for both nights in December for a total survey sample of 947 respondents.
Sampling bias is a key error associated with intercept surveying in late night entertainment precincts. While interviewers sampled survey participants in a random manner, there was inevitably a bias to exclude people who were obviously heavily intoxicated (whose responses may not be coherent and hence valid) and/or aggressive (resulting in an occupational health and safety risk to interviewers). In addition, pedestrians moving in larger groups were often also less willing to participate.
7.1 Age
Understanding age profiles for the City and late night activity precincts can assist in targreting areas for more active management and also identfiying locations where the late night economy could be diversifed.
Figure 7.1 Age group of respondents
The key findings relating to age are:
the biggest age group was the 20–24 year old range, which represented 35% of the late night population
the second largest group were aged between 25–29 years of age (31%)
only 6% of the night time population were aged over 40 years.
0%
11%
35%
31%
12%
4%3% 1% 2%
<18
18-19
20-24
25-29
30-34
35-39
40-49
50-59
60+
Late Night Management Areas Research Project
Page 46 2112993A-PR_3131_Rev_B PARSONS BRINCKERHOFF
7.2 Visitation
Sections 7.2.1 to 7.2.5 present analysis of the intercept survey data while Section 7.2.6 provides a summary of the key points.
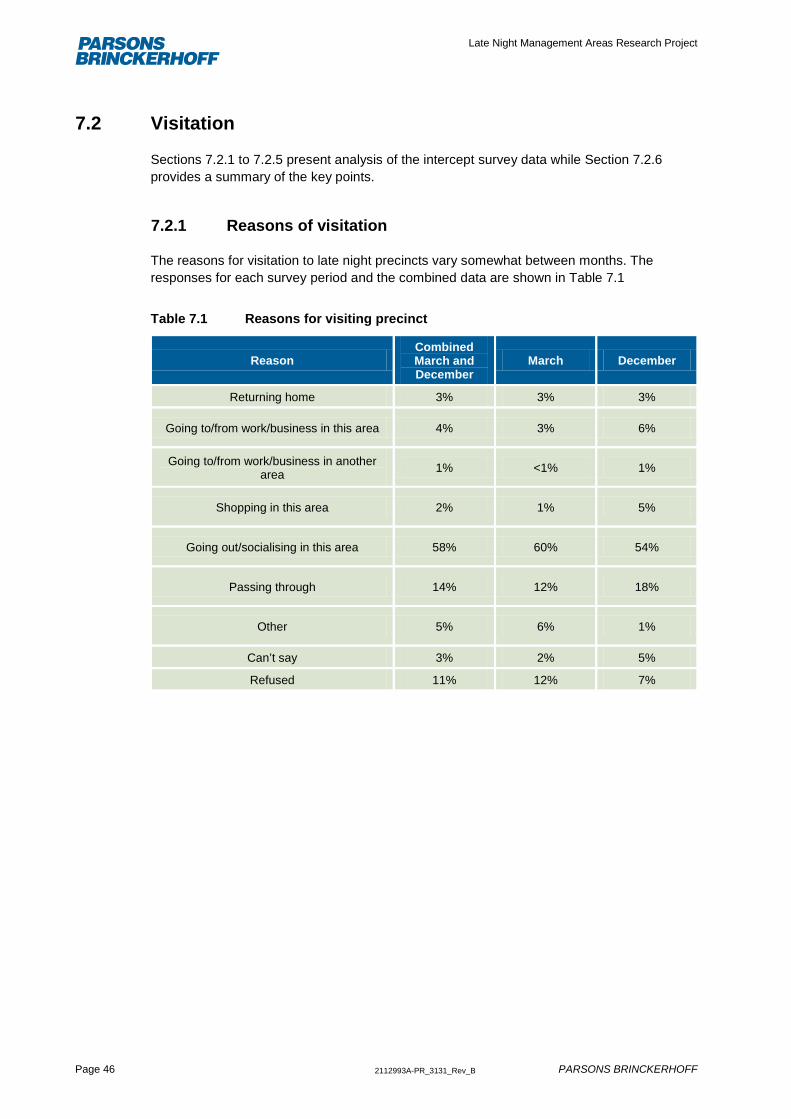
7.2.1 Reasons of visitation
The reasons for visitation to late night precincts vary somewhat between months. The responses for each survey period and the combined data are shown in Table 7.1
Table 7.1 Reasons for visiting precinct
Reason Combined March and December
March December
Returning home 3% 3% 3%
Going to/from work/business in this area 4% 3% 6%
Going to/from work/business in another area 1% <1% 1%
Shopping in this area 2% 1% 5%
Going out/socialising in this area 58% 60% 54%
Passing through 14% 12% 18%
Other 5% 6% 1%
Can’t say 3% 2% 5%
Refused 11% 12% 7%

Late Night Management Areas Research Project
PARSONS BRINCKERHOFF 2112993A-PR_3131_Rev_B Page 47
7.2.2 Intended places of visit
Similar to reasons for visitation, intended places to visit in late night precincts also vary slightly between months. The responses for each survey period and the combined data are shown in Figure 7.2.
Figure 7.2 Intended places of visitation
6% 3%
13%
16%17%
14%
9%6%
13%
16%18%
14%
24%25%
21%
15%16%
12%
3% 3%3%
4% 4%
4%
0%
10%
20%
30%
40%
50%
60%
70%
80%
90%
100%
Combined March and December March December
Perc
enta
ge
Surveys
Attractions/Activities
MissingRefusedCan’t sayOtherWorkHotel/HostelService establishmentEntertainment facilityBarNight clubPubCaféRestaurantShop

Late Night Management Areas Research Project
Page 48 2112993A-PR_3131_Rev_B PARSONS BRINCKERHOFF
7.2.3 Previous destination
The responses for the location of late night patron’s previous destination are shown in Figure 7.3.
Figure 7.3 Location prior to arriving in the precinct
7.2.4 Next destination
The responses for the location of late night patron’s next destination are shown in Figure 7.4.
Figure 7.4 Where respondents are going after leaving the precinct
0%
10%
20%
30%
40%
50%
60%
70%
80%
90%
100%
CBD Kings Cross Oxford St The Rocks
Refused
Can’t say
Another precinct
Straight from home
0%
10%
20%
30%
40%
50%
60%
70%
80%
90%
100%
CBD Kings Cross Oxford St The Rocks
Refused
Can’t say
Can’t say – probably go out
Can’t say – probably go home
Going to another precinct
Heading home

Late Night Management Areas Research Project
PARSONS BRINCKERHOFF 2112993A-PR_3131_Rev_B Page 49
7.2.5 Place to stay the night by region
The responses for the location of late night patron’s place of stay after a night out are shown in Table 7.2 with the responses shown visually in Figure 7.5.
Table 7.2 Distribution of locations where respondents will spend that night
Sub-regional statistical area (ABS10) Number of responses
Percentage of responses
City and Inner South 349 40%
Eastern Suburbs 136 16%
North Sydney and Hornsby 73 8%
Parramatta 68 8%
Inner West 67 8%
Inner South West 48 6%
Ryde 29 3%
Northern Beaches 21 2%
Sutherland 18 2%
South West 16 2%
Bankstown 14 2%
Outer West and Blue Mountains 11 1%
Sydney- Outer South West 9 1%
Baulkham Hills and Hawkesbury 4 0%
Central Coast 1 0%
Grand Total 864 100%
10 Australian Statistical Geography Standard (ASGS): Statistical Area Level 4 (SA4)

Late Night Management Areas Research Project
Page 50 2112993A-PR_3131_Rev_B PARSONS BRINCKERHOFF
Figure 7.5 Places to stay that night by region
7.2.6 Key findings related to visitation
The key findings relating to visitation of late night precincts include:
the biggest reason for visitation to a night time precinct was for going out and socialising (58%)
shopping only made up 2% of people’s reasons for visiting a precinct
shopping and visiting cafes was significantly higher in December
passing through the precinct was the second biggest reason for visitation (14%) followed by other (5%)
the most popular intended places of visitation were nightclubs (24%), pubs (16%), restaurants (16%) and bars (15%)
shops only contributed to 6% and entertainment facilities only accounted for 3%
52% of patrons travelled to a precinct straight from home, whilst a further 42% travelled from another precinct
57% of patron’s next destination was heading home, whilst only 18% were travelling to another precinct. A further 19% were undecided whether they would stay out or head home
over half (56%) of those interviewed were returning home that night to the areas in the City or the inner south (City of Sydney Local Government Area (LGA), and parts of Marrickville and Botany LGAs) or the Eastern suburbs (Woollahra, Waverly and Randwick LGAs)

Late Night Management Areas Research Project
PARSONS BRINCKERHOFF 2112993A-PR_3131_Rev_B Page 51
over four out of five (81%) were returning home to the inner or ‘middle ring’11 of areas in the Sydney metropolitan area.
7.3 Transport
Figure 7.6 indicates the transport mode shares for accessing, leaving and going home from the precincts for all survey days.
Figure 7.6 Transport mode shares12
The key findings relating to transport and late night precincts include:
the highest used mode of transport was walking (29%) for travel between precincts
the next most popular forms of transport were for rail to a precinct (25%), bus from a precinct (23%) and taxi from a precinct (23%)
private car still made up for approximately 15% of travel to and from precincts
travel to the precincts was fairly evenly spread amongst the major transport modes of rail, bus, taxi, car and on foot
travel between precincts was dominated walking (29%) and to a lesser extent taxi (11%)
bus and taxi dominate as the preferred mode of transport home, supported by rail, by foot and private car still performing significant portions of the transport task.
11 North Sydney and Hornsby, Inner West, Inner South West, Ryde sub-regional areas. 12 There were 3%, 42% and 1% non-responses for the categories “To precinct”, “Between precincts” and “From
precinct to home” categories respectively.
0%
10%
20%
30%
40%
50%
60%
70%
80%
90%
100%
To precinct Between precincts From precinct tohome
Refused
Can’t say
Other
By private car
By bus
By taxi
On foot
Rail


Late Night Management Areas Research Project
PARSONS BRINCKERHOFF 2112993A-PR_3131_Rev_B Page 53
8. Conclusion
8.1 Key research findings
A summary of the key quantitative findings of this late night research are as follows:
8.1.1 Pedestrian movements
CBD south is the busiest night time precinct in the City with pedestrian flows up to 7,600 persons per hour between midnight and 1.00 am during December possibly due to the proximity of Town Hall Station and its role as the NightRider bus service hub
Oxford Street has the second highest pedestrian flows of 6,900 persons per hour
Kings Cross has the most number of pedestrian hot spots in the top 10 with peak pedestrian flows of around 5,900 persons per hour occurring between midnight and 2.00 am at various times of the year
The Rocks experiences the lowest pedestrian flows in comparison to the other precincts ,with varying levels of activity between 2,000 and 4,000 persons per hour
the highest period of movement entering or exiting precincts across the city is between 11.00 pm and 1.00 am
Kings Cross has a steadier level of activity (i.e. not dropping off as quickly as other precincts) which may potentially reflect the movement into the area from other precincts later in the night
The Rocks experiences the quickest drop-off in activity earlier in the night after 1.00 am.
8.1.2 ASB, congregation, congestion and land use
Kings Cross has the greatest number of ASB incidents, and peaks around 1.00–2.00 am
CBD south is the precinct with the second highest level of ASB incidents, with a steadier rate of occurrence throughout the night
ASB incidents in Oxford Street typically occur later in the evening, after 2.00 am
Kings Cross has a significantly higher level of ASB incidents than any other precinct in March
CBD south has the highest level of ASB incidents (up to 30 per hour) in December for all time periods except between the hours of 3.00 and 5.00 am when they are at the same level as Kings Cross (22 per hour)
Oxford Street had significantly more ASB incidents on Saturdays and typically later in the evening after 2.00 am

Late Night Management Areas Research Project
Page 54 2112993A-PR_3131_Rev_B PARSONS BRINCKERHOFF
the highest chances of seeing serious ASB incidents occur in Kings Cross between 1.00 and 2.00 am
the second most likely location to witness a serious ASB incident would be in CBD south early in the night up to 1.00 am and then Oxford Street after this time
CBD south shows a reduction in ASB incidents as congregation levels fall
Kings Cross shows a reduction of ASB incidents as both congregation and congestion reduced
Oxford Street shows a reduction in ASB incidents with the reduction of both congregation and congestion, but only after 2.00 am
The Rocks show a delayed reduction in ASB incidents after both congregation and congestion are reduced.
8.1.3 Demographics and travel patterns
approximately 60% of all people in late night precincts during all survey days were male
the proportion of females drops slightly on Friday nights
the biggest age group was the 20–24 year old range which represented 35% of the late night population
only 6% of the night time population are aged over 40 years
the biggest reason for visitation to a night time precinct was for going out and socialising (56%)
shopping only made up 9% of people’s reasons for visiting a precinct
the greatest intended places of visitation were nightclubs (24%), pubs (16%), restaurants (16%) and bars (15%)
all precincts have the greatest open business type being Pubs, Taverns and Bars throughout the night
52% of patrons have travelled to a precinct straight from home whilst a further 42% travelled from another precinct
57% of patron’s next destination was heading home whilst only 18% were travelling to another precinct. A further 19% were undecided whether they would stay out or head home
the biggest proportion of patrons from the precincts travel home to the City and Inner south suburbs and the eastern suburbs
the highest used mode of transport was on foot (29%) for travel between precincts
the next most popular forms of transport were for rail to a precinct (25%), bus from a precinct (23%) and taxi from a precinct (23%)
Late Night Management Areas Research Project
PARSONS BRINCKERHOFF 2112993A-PR_3131_Rev_B Page 55
travel between precincts is dominated by foot (29%) and to a lesser extent taxi (11%)
bus and taxi dominate as the preferred mode of transport home supported by rail by foot and private car still performing a significant proportion of the transport task.
8.2 Precinct comparison
The key comparisons between the four night precincts in the City are as follows:
CBD south has the busiest activity of the night time precincts
The Rocks closes and disperses patrons earlier than the other precincts
Kings Cross is less seasonal in its activity as well as being the busiest location in March
activity in CBD south peaks earlier (before 1.00 am) in comparison with Kings Cross and Oxford Street
ASB incidents occur later in Oxford Street than in other precincts
the most serious ASB incidents are likely to occur in Kings Cross.
8.3 Key correlations and possible interacting factors
A summary of the key correlations and possible interacting factors drawn from the late night research results are as follows:
the reputation of Kings Cross makes it the focus of specific late night activity and a likely destination of choice later in the evening
the hours of operation of land use has a direct relationship to activity e.g. dispersal from a precinct with earlier closing hours
the proximity of Oxford Street to the CBD makes it a popular destination for migrating patrons later in the evening
the halving of migration from Oxford Street after 1.00 am may be related to the lack of public transport facilities provided in that precinct e.g. no rail station
the activity on George Street in December could be directly related to Christmas season activities including parties and longer retail hours
the presence of activities for the under 18 age group in George Street e.g. cinemas and arcades may contribute to the busier activity in CBD south
pedestrian activity in CBD south is influenced by the constrained footpath widths on George Street between Bathurst and Liverpool Streets
congregations that appear around transport nodes in Kings Cross in the early hours of the morning relate to the recommencement of train services

Late Night Management Areas Research Project
Page 56 2112993A-PR_3131_Rev_B PARSONS BRINCKERHOFF
higher levels of activity in Oxford Street and Kings Cross later in the night are directly related to the operating hours of night clubs
dwell times waiting for transport could lead to ASB or increased duration of drinking due to lack of availability of taxis or buses.
8.4 Future possibilities
Some of the future possibilities for further research and initiatives based upon the outcomes of this late night research that could be considered include:
focus on the CBD south and The Rocks precincts to increase and normalise the night time economy due to:
proximity to existing transport
proximity to existing landmark retail outlets
proximity to visitor accommodation and high density residential population
proximity to daytime worker population
proximity to cultural venues
likely appeal to underrepresented age groups
lesser fear associated with these precincts in comparison to the long established night time precincts of Kings Cross and Oxford Street
can better tie in with established City projects such as the laneways activations and the transformation of George Street
target the key time periods for ASB in Kings Cross and Oxford Street for policing
introduce late night or 24-hour bus services to the Metrobus cross-regional routes
better promote the existing 24-hour bus routes that travel through the city
better understand the destinations of late night patrons and workforce to better tailor public transport services to meet their needs
extend the hours of operation for ferries to bring them in line with last train services
engage with the taxi industry to develop strategies to overcome the impacts of the 3.00 am shift changeover
increase passenger safety on late train services
better understand the transport requirements and safety concerns of the late night workforce.

Appendix A
Joint variable analysis


PARSONS BRINCKERHOFF 2112993A-PR_3131_Rev_B Page A.1
CBD south
Figure A.1 shows that incidents of ASB drop as the total congregations of people drop. ASB incidents do climb between the hours of 1.00 am and 2.00 am in the CBD south and then drop away sharply.
Figure A.1 Total ASB vs. Total Congregation for all survey days
Figure A.2 shows that there is little correlation between ASB and areas of high pedestrian congestion.
Figure A.2 Total ASB vs. number of high congestion locations for all survey days
0
1000
2000
3000
4000
5000
6000
0
50
100
150
200
250
11 pm - 12am
12 -1 am 1 - 2 am 2 - 3 am 3 - 4 am 4 - 5 am
Tota
l Con
greg
atio
n (p
eopl
e)
Tota
l ASB
(inc
iden
ts)
Time
Total ASB Total Congregation
0
100
200
300
400
500
600
0
50
100
150
200
250
11 pm - 12am
12 -1 am 1 - 2 am 2 - 3 am 3 - 4 am 4 - 5 am Num
ber o
f Hig
h Co
nges
tion
Loca
tions
(peo
ple)
Tota
l ASB
(inc
iden
ts)
Time
Total ASB High Congestion Locations

Page A.2 2112993A-PR_3131_Rev_B PARSONS BRINCKERHOFF
Kings Cross
Figure A.3 shows that incidents of ASB drop as the total congregations of people drop. The number of ASB incidents peaks between the hours of 1.00 am and 2.00 am before dropping. Around 4.00 am, the proportion of ASB incidents versus the amount of congregation increases.
Figure A.3 Total ASB vs. Total Congregation for all survey days
Figure A.4 shows that when there are more congested areas the number of ASB incidents rises, with the greatest congestion and ASB incidents occurring between the hours of 1.00 am and 2.00 am.
Figure A.4 Total ASB vs. number of high congestion locations for all survey days
0
500
1000
1500
2000
2500
3000
3500
4000
4500
0
50
100
150
200
250
300
350
400
450
11 pm - 12am
12 -1 am 1 - 2 am 2 - 3 am 3 - 4 am 4 - 5 am
Tota
l Con
greg
atio
n (p
eopl
e)
Tota
l ASB
(inc
iden
ts)
Time
Total ASB Total Congregation
0
50
100
150
200
250
300
350
400
450
0
50
100
150
200
250
300
350
400
450
11 pm - 12am
12 -1 am 1 - 2 am 2 - 3 am 3 - 4 am 4 - 5 am Num
ber o
f Low
Con
gest
ion
Loca
tions
(peo
ple)
Tota
l ASB
(inc
iden
ts)
Time
Total ASB High Congestion Locations

PARSONS BRINCKERHOFF 2112993A-PR_3131_Rev_B Page A.3
Oxford Street
Figure 5.6 shows that the number of ASB incidents increases between the hours of 2.00 am and 3.00 am, after which the number of ASB incidents drops at the same rate as congregation levels.
Figure A.5 Total ASB vs. Total Congregation for all survey days
Figure A.6 shows that there is little correlation between the number ASB incidents and the number of high congestion areas at Oxford Street until the hours of 1.00 am and 2.00 am.
Figure A.6 Total ASB vs. number of high congestion locations for all survey days
0
500
1000
1500
2000
2500
3000
3500
4000
0
50
100
150
200
250
11 pm - 12am
12 -1 am 1 - 2 am 2 - 3 am 3 - 4 am 4 - 5 am
Tota
l Con
greg
atio
n (p
eopl
e)
Tota
l ASB
(inc
iden
ts)
Time
Total ASB Total Congregation
0
50
100
150
200
250
300
350
400
0
50
100
150
200
250
11 pm - 12am
12 -1 am 1 - 2 am 2 - 3 am 3 - 4 am 4 - 5 am Num
ber o
f Hig
h Co
nges
tion
Loca
tions
(peo
ple)
Tota
l ASB
(inc
iden
ts)
Time
Total ASB High Congestion Locations

Page A.4 2112993A-PR_3131_Rev_B PARSONS BRINCKERHOFF
The Rocks
Figure A.7 shows that incidents of ASB drop as the total congregations of people drop, although slightly later. ASB incidents do climb between the hours of 1.00 am and 2.00 am in The Rocks and then drop away sharply again.
Figure A.7 Total ASB vs. Total Congregation for all December days
Figure A.8 shows that when there are more congested areas, the number of ASB incidents rises, with the greatest congestion and ASB incidents occurring between the hours of 11.00 pm and 12.00 am. There is another increase in congested areas between the hours of 1.00 am and 2.00 am, with a corresponding increase in ASB incidents.
Figure A.8 Total ASB vs. number of high congestion locations for all December days
0
200
400
600
800
1000
1200
1400
1600
1800
0
20
40
60
80
100
120
9 - 10 pm 10 - 11 pm 11 pm - 12am
12 -1 am 1 - 2 am 2 - 3 am 3 - 4 am
Tota
l Con
greg
atio
n (p
eopl
e)
Tota
l ASB
(inc
iden
ts)
Time
Total ASB Total Congregation
-10
0
10
20
30
40
50
60
70
80
0
20
40
60
80
100
120
9 - 10 pm 10 - 11 pm 11 pm - 12am
12 -1 am 1 - 2 am 2 - 3 am 3 - 4 am Num
ber o
f Hig
h Co
nges
tion
Loca
tions
(peo
ple)
Tota
l ASB
(inc
iden
ts)
Time
Total ASB High Congestion Locations

Appendix B
ASB and land use


PARSONS BRINCKERHOFF 2112993A-PR_3131_Rev_B Page B.1
Table B.1 ASB vs. business type and land use
Business type Total ASB Percentage of ASB
Open
Pubs, taverns and bars 1,204 31.5%
Cafes and restaurants 506 13.2%
Accommodation 357 9.3%
Other store-based retailing 354 9.3%
Takeaway food services 348 9.1%
Personal services 255 6.7%
Hairdressing and beauty services 129 3.4%
Supermarket and grocery stores 91 2.4%
Entertainment media retailing 41 1.1%
Advertising services 35 0.9%
Police services 35 0.9%
Amusement and other recreation activities 31 0.8%
Newspaper and book retailing 28 0.7%
Rail passenger transport 24 0.6%
Banking 16 0.4%
Clubs (Hospitality) 16 0.4%
Creative and performing arts activities 16 0.4%
Liquor retailing 12 0.3%
Other social assistance services 11 0.3%
Other specialised food retailing 8 0.2%
Watch and jewellery retailing 7 0.2%
Internet service providers and web search portals 6 0.2%
Motion picture and video production 5 0.1%
General practice medical services 4 0.1%
Museum operation 4 0.1%
Other administrative services 3 0.1%
Travel agency and tour arrangement services 3 0.1%
Other allied health services 1 <0.1%
Public restrooms 1 <0.1%
Sports grounds and facilities 1 <0.1%
Telecommunications services 1 <0.1%
Open with dining outdoors
Pubs, taverns and bars 141 3.7%
Cafes and restaurants 67 1.8%
Other specialised food retailing 51 1.3%
Liquor retailing 4 0.1%
Other store-based retailing 3 0.1%
Takeaway food services 3 0.1%
Total ASB incidents 3,822


Appendix C
Details of congestion


PARSONS BRINCKERHOFF 2112993A-PR_3131_Rev_B Page C.1
C1. Definitions of footway congestion Low congestion:
this is when pedestrians can walk freely with no impedance to their movement
there are no blockages on the path that require a change of direction by the pedestrian
there is ample personal space around the pedestrian, with few other pedestrians in the vicinity.
Medium congestion:
this is where pedestrians cannot walk freely without some impedance to their movements
there could be some blockages on the path that requires a change of direction by the pedestrian including other pedestrians
there is reduced personal space around the pedestrians, and they have to deal with other pedestrians on their pathway.
High congestion:
this is where pedestrians cannot walk freely and their movement is severely impacted by other pedestrians
there could be numerous blockages on the path that requires a change of direction by the pedestrian to progress their journey
there is reduced personal space around the pedestrian with a high number of other pedestrians in their vicinity.

Page C.2 2112993A-PR_3131_Rev_B PARSONS BRINCKERHOFF
C2. Footway congestion by season
Figure C2.1 Kings Cross: footway congestion by season
Figure C2.2 CBD south: footway congestion by season
11pm-12am 12-1am 1-2am 2-3am 3-4am 4-5am
Leve
l of f
ootw
ay c
onge
stio
n
TIME
Kings Cross - Level of footway congestion precinct core area
March December Kings X mean 3 precinct mean
low
medium
11pm-12am 12-1am 1-2am 2-3am 3-4am 4-5am
Leve
l of f
ootw
ay c
onge
stio
n
TIME
CBD south - Level of footway congestion precinct core area
March December CBD mean 3 precinct mean
low
medium

PARSONS BRINCKERHOFF 2112993A-PR_3131_Rev_B Page C.3
Figure C2.3 Oxford Street: footway congestion by season
11pm-12am 12-1am 1-2am 2-3am 3-4am 4-5am
Leve
l of f
ootw
ay c
onge
stio
n
TIME
Oxford St - Level of footway congestion precinct core area
March December Oxford St mean 3 precinct mean
low
medium