LAST TIME Population growth, distribution, and size …carr/geog155/GEOG155_EnvDev_08.pdfLAST TIME...
46
LAST TIME • Population growth, distribution, and size in Latin America • Urbanization Problems with urban growth continued • The urban economy • Migration
Transcript of LAST TIME Population growth, distribution, and size …carr/geog155/GEOG155_EnvDev_08.pdfLAST TIME...
LAST TIME
• Population growth, distribution, and size in Latin America
• Urbanization
�Problems with urban growth continued
• The urban economy
•Migration

TODAY
• Agricultural and Rural Development
• Tropical Deforestation
Agricultural and Rural Development: Internal Colonization of Tropical Lowlands
• An example from Amazonia
�> 600 million ha
�Amazonian environments
�Terra firme
�Várza�Savanna

Development history in Amazonia
• Early extractive uses
�Rubber
�Forestry
Development history in Amazonia
• “Spontaneous” peasant agricultural colonization
�Brazilian
�Andean

Development history in Amazonia
• Governmentally planned peasant colonization�highways
�planning excessively centralized
�Highway location bad for soils
�geopolitical motives
�domestic political motives

Development history in Amazonia
• Cattle ranching
• Fishbone patterns

Development history in Amazonia
• Scale & geography of change
• Soil degradation on already poor soils
• Poor rural health
• Poor government planning

Development history in Amazonia
• Consequences
• Farm abandonment
• Consolidation by cattle ranchers and large soy farmers
• urbanization

Amazonian deforestation
• Wider consequences�in Brazil�speculation and abandoned lands�deforestation of rare tropical rain forest�destruction of species�destruction of Indigenous people’s traditional livelihood
�consequences for global warming�fails to solve land tenure problem
• Solutions?

Tropical Deforestation
• Deforestation rates

Tropical Deforestation
• Causes�agricultural clearing�pasture clearing�timber harvesting�oil exploration/extraction�population growth?�degradation of lands in source areas of migrants
�poor land tenure equity in source areas of migrants

© T. M. Whitmore
Population and Environmental Change in Latin America
• 519 million people in 2000 (UN, 2001)
• 30 year doubling time, 1970-2000. 1 billion by 2100?
• Declining fertility, Rural out-migration (2% annually) andUrbanization, but…
• Rapid forest clearing
• Major impact of rural-rural migrants and pasture expansion

© T. M. Whitmore
Significance
Environmental Impacts
The Amazon basin alone contains:
1) the greatest extent of closed tropical forests in the world
2) 45% of all the fresh water on the Earth
3) the planet’s largest carbon sink
4) the planet’s most bio-diverse forests
Human development Impacts
• rural underdevelopment
• food production

© T. M. Whitmore
Central America: Forest Cover
Source: FAO, 2003

© T. M. Whitmore
South America: Forest Cover
Source: FAO, 2003

© T. M. Whitmore
Results
Central America
1961-2001
• 59% rural population increase (19 million)
• 34%. rural population density increase.
• 15% deforestation (13 million ha.)
• Great temporal and geographic variation

© T. M. Whitmore-68%-47%-40%87%51%1.20Panama
-79%-51%-51%137%29%0.81Nicaragua
-32%2%-6%39%21%0.78Mexico
-56%5%-11%101%109%1.02Honduras
-70%-46%-51%62%71%2.81Haiti
-80%-62%-49%156%106%1.79Guatemala
-66%-17%-49%51%8%2.51El Salvador
59%109%100%26%-22%2.32
Dominican
Republic
-72%-24%-45%98%81%1.76Costa Rica
1961-
2000
1981-
20001961-20011961-20001961-20011961
Change
Forest/Capita
Deforesta
tion
Rural Population
Change
Rural Population
Density
CENTRAL AMERICA

© T. M. Whitmore
Central America: Pasture and Arable & Permanently
Cropped Land as a Percent of Total Land
12.9% 13.1% 15.2%
34.9% 36.7%38.9%
0%
10%
20%
30%
40%
50%
60%
1961 1981 2001

© T. M. Whitmore2852223019.0417.7510.39Average
293055.044.832.48Panama
236044.386.371.53Nicaragua
1870156119123.1522.1712.63Mexico
1522865.604.653.38Honduras
14606.827.823.02Haiti
18389156.823.982.08Guatemala
7388214.954.972.78El Salvador
98581417.2311.9311.11Dominican Republic
128721920.5712.975.42Costa Rica
Central America
200119811961200119811961
Fertilizer Use (1000 Kg/Ha. of Cropland)
Percent A&P Land Irrigated

© T. M. Whitmore
South America
1961-2001
• 62 million decrease in rural population (-6%)
• rural population density nearly halved
• 6% deforestation (12% weighted).

© T. M. Whitmore
19%38%26%6%-57%2.15Venezuela
-46%-14%8%101%-48%1.50Paraguay
-64%-35%-43%59%34%1.18Ecuador
-30%-3%-16%20%40%1.76Colombia
-7%-15%-18%-12%46%0.64Chile
23%20%-3%-21%-66%1.41Brazil
-40%-13%-12%47%-32%1.49Bolivia
-18%-39%-34%-19%-34%0.19Argentina
1961-20001981-20001961-20011961-20001961-20011961
Change Forest/CapitaDeforestation
Rural Population
Change
Rural Population
Density
SOUTH
AMERICA

© T. M. Whitmore
South America: Pasture and Arable & Permanently
Cropped Land as a Percent of Total Land
4.6%8.4% 7.7%
23.9%
26.3% 30.3%
0%
5%
10%
15%
20%
25%
30%
35%
40%
1961 1981 2001

© T. M. Whitmore
1,170434547.394.744.89Average
3001461916.878.3914.46Venezuela
6790.62.153.093.70Paraguay
231701128.9820.6517.53Ecuador
6402807121.187.434.55Colombia
4811144682.6122.7428.02Chile
6,7732,7532704.382.591.73Brazil
1270.84.264.444.99Bolivia
86096164.464.553.45Argentina
South America
200119811961200119811961
Fertilizer Use (1000 Kg/Ha. of Cropland)
Percent A&P Land Irrigated

© T. M. Whitmore
Revisiting hypotheses
Population and Forest Clearing
• Positive relation between rural population and population density dynamics AND deforestation rates and deforestation rates per capita (rural). YES AND NO
What are the land use drivers?
• Positive relation between rural population and population density dynamics AND cropland relative to pasture. YES and NO
• Negative relation between rural population and population density AND relative agricultural intensification. YES

© T. M. Whitmore
Conclusion
• Future food production: intensification and pasture expansion
• Migration
• Scale
• Data limitations
• Policy implications

In-migration of
Colonists
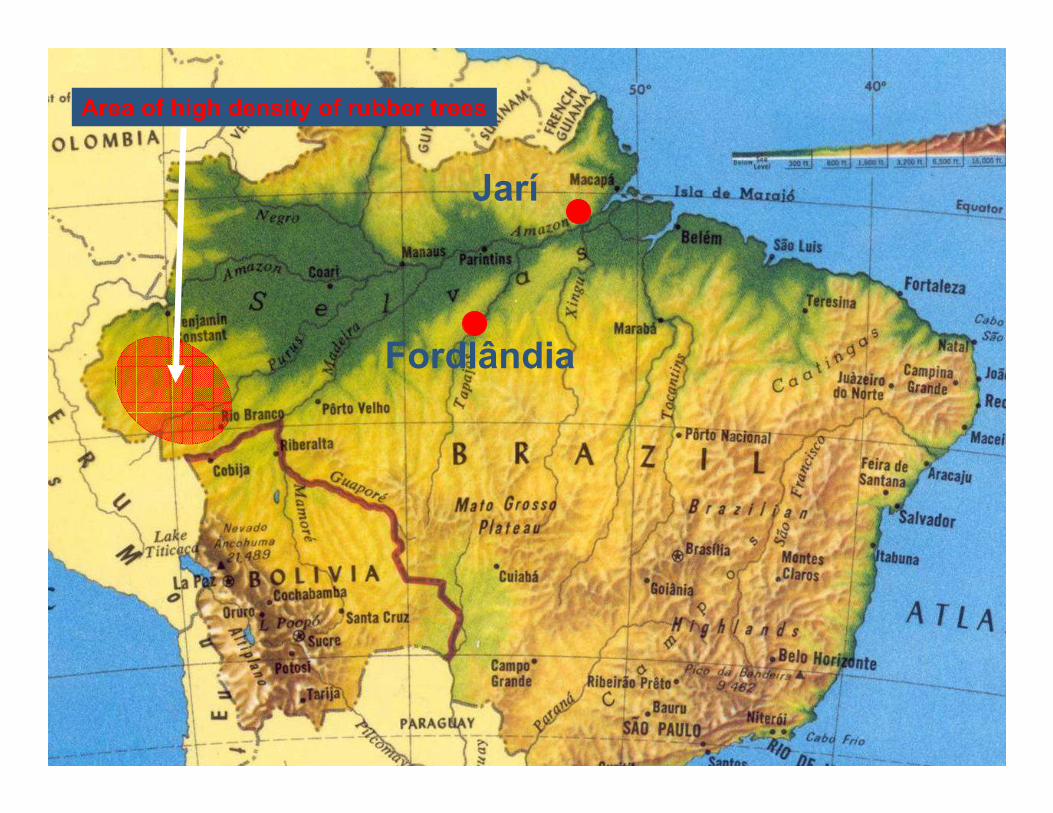
Fordlândia
Jarí
Area of high density of rubber trees


© T. M. Whitmore


USGS


© Roger J. Harris, 2001

© Roger J. Harris, 2001

© Roger J. Harris, 2001

NASA