Last Lab: (Hail formation) Anthony R. Lupo Atms 4310 / 7310 Lab 13.
15
Last Lab: (Hail formation) Anthony R. Lupo Atms 4310 / 7310 Lab 13
-
Upload
augustine-rodgers -
Category
Documents
-
view
215 -
download
0
Transcript of Last Lab: (Hail formation) Anthony R. Lupo Atms 4310 / 7310 Lab 13.
Last Lab: (Hail formation)
Anthony R. LupoAtms 4310 / 7310Lab 13

Last Lab: (Hail formation)
Hail is of course fronzen precipitation that forms within the updraft region of a severe thunderstorm.
A large droplet may be carried aloft into the colder regions of the cloud and freeze, the droplet may fall again and accumulate more unfrozen droplets (may go up or continue down again). This next coating of water may freeze and the stone grows.
The process repeats itself until the stones are too heavy to be supported by the updrafts.

Last Lab: (Hail formation)
Thus hail size is proportional to updraft strength and instability
Severe thunderstorm forecast: “…. these thunderstorms could be accompanied by wind gusts of up to 80 mph and hail up to 2 “ in diameter…”!
We’ve already examined an algorithm for wind gusts.

Last Lab: (Hail formation)
Hail formation
Miller-Fawbush technique:
developed by Air Force Col. Miller. (of sounding fame).
Again, like some indicies and wind gusts, this is an empirical relationship based on on solid thermodynamic principles and using thermodynamic quantities we’ve derived.

Last Lab: (Hail formation)
Recall: finding wet bulb temperature?
To determine hail-size must first determine wet-bulb zero. (WBZ)
-or-
determine height above the surface of Tw = 0 C
This height is assumed to be a indicator of the height of the 0 C level in a precipitating convective storm.

Last Lab: (Hail formation)
Relationship to Hail formation:
Empirical evidence suggests that 90% of hail accurrences are associated with WBZ between 1.5 km (850 hPa) to 4 km (roughly 600 hPa) with a maximum occurrence of roughly 3 km (700 hPa).
If WBZ is below 850 hPa, the air is too cold or dry for deep convection.
If above 600 hPa, air tends to be too warm and hail will melt.

Last Lab: (Hail formation)
Use of CCL and Fawbush – Miller charts (hail – size)
Determine the CCL as the intersection of the mean mixing ratio of lowest 150 hPa with the sounding.
Then, trace the moist adiabat from the CCL up to the pressure level at which T sounding = -5 C

Last Lab: (Hail formation)
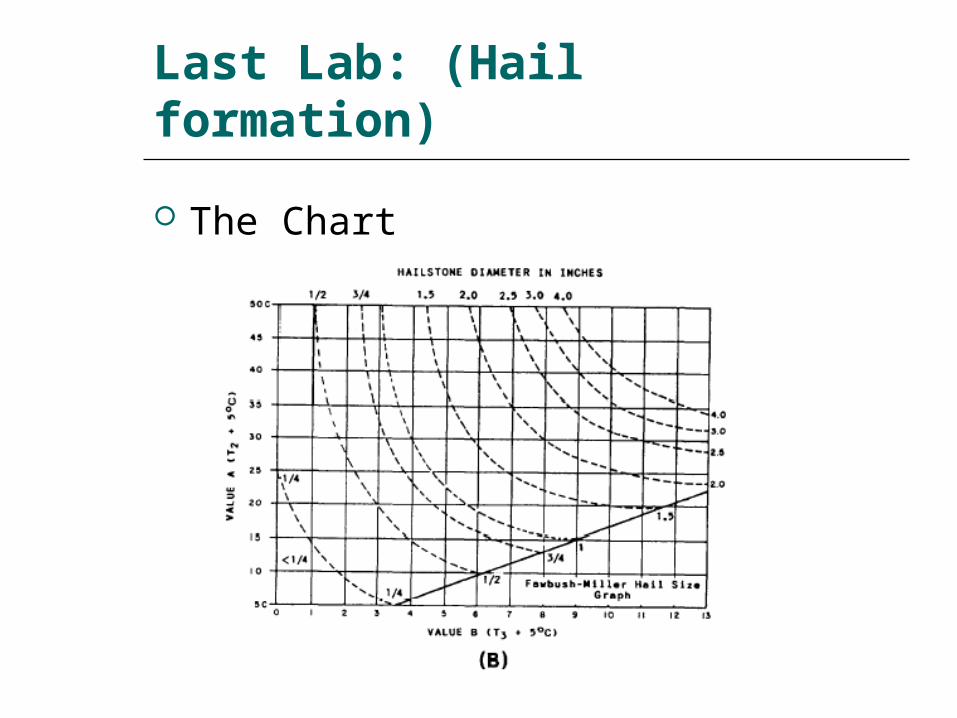
The Chart

Last Lab: (Hail formation)
This forms a triangle bounded by the sounding, the moist adiabat and the pressure level.
If the area is negative (-) stop!!
No hail formation!
If we have a (+) area:
the –5 C level temp difference between the sounding and the moist adiabat is identified as the triangle base (B’ – B) = Base

Last Lab: (Hail formation)
A second dimension, the altitude:
is the temperature difference along the dry adiabat extending from the CCL to the level of the triangle base and passing through the triangle.( H – H’) = Height
Enter the Fawbush – Miller chart values chart 1 using the base and height!
Last Lab: (Hail formation)
The Chart
Last Lab: (Hail formation)
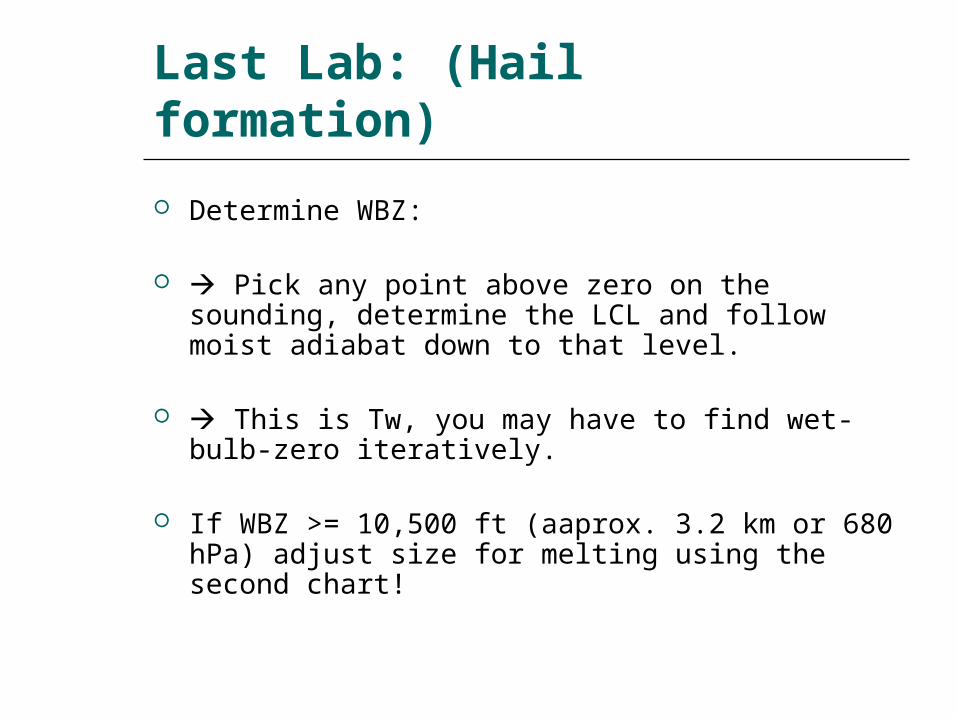
Determine WBZ:
Pick any point above zero on the sounding, determine the LCL and follow moist adiabat down to that level.
This is Tw, you may have to find wet-bulb-zero
iteratively.
If WBZ >= 10,500 ft (aaprox. 3.2 km or 680 hPa) adjust size for melting using the second chart!

Last Lab: (Hail formation)
The modification

Last Lab: (Hail formation)
The End!

Last Lab: (Hail formation)
Questions?
comments:?
Critique?