Laser compression of monocrystalline tantalummeyersgroup.ucsd.edu/papers/journals/Meyers...
20
Laser compression of monocrystalline tantalum C.H. Lu a , B.A. Remington b , B.R. Maddox b , B. Kad a , H.S. Park b , S.T. Prisbrey b , M.A. Meyers a,⇑ a University of California, San Diego, La Jolla, CA 92093, USA b Lawrence Livermore National Laboratory, Livermore, CA 94550, USA Received 31 May 2012; received in revised form 9 August 2012; accepted 14 August 2012 Available online 19 September 2012 Abstract Monocrystalline tantalum with orientations [1 0 0] and [1 1 1] was subjected to laser-driven compression at energies of 350–684 J, generating shock amplitudes varying from 10 to 110 GPa. A stagnating reservoir driven by a laser beam with a spot radius of 800 lm created a crater of significant depth (80 to 200 lm) on the drive side of the Ta sample. The defects generated by the laser pulse were characterized by transmission and scanning electron microscopy, and are composed of dislocations at low pressures, and mechanical twins and a displacive phase transformation at higher pressures. The defect substructure is a function of distance from the energy deposition surface and correlates directly with the pressure. Directly under the bottom of the crater is an isentropic layer, approximately 40 lm thick, which shows few deformation markings. Lattice rotation was observed immediately beneath this layer. Further below this regime, a high density of twins and dislocations was observed. As the shock amplitude decayed to below 40 GPa, the incidence of twinning decreased dramatically, suggesting a critical threshold pressure. The twinning planes were primarily {1 1 2}, although some {1 2 3} twins were also observed. Body-centered cubic to hexagonal close-packed pressure induced-transformation was observed at high pressures (68 GPa). The experimentally measured dislocation densities and threshold stress for twinning are compared with predictions using analyses based on the constitutive response, and the similarities and differences are discussed in terms of the mechanisms of defect generation. Ó 2012 Acta Materialia Inc. Published by Elsevier Ltd. All rights reserved. Keywords: Dislocation; Laser treatment; Tantalum; Twinning; Shock compression 1. Introduction Although the first laser shock experiments, by Askaryan et al. [1], date from the 1960s, and early work showed the potential use of laser shock pulses to harden aluminum alloys [2,3], there has been only limited inquiry on the nat- ure of laser-shock-induced defects. White [4,5] and others [6–8] introduced the use of lasers to obtain Hugoniot data over a broad range of pressures. A systematic inquiry into the effects of laser pulses on fcc metals (Cu and Cu–Al) was initiated in 2001 and has yielded significant results that have been explained in terms of shock compression [9–11]. This work was extended to nickel by Jarmakani et al. [12]. The objective of this study is to extend the methodology developed for copper and nickel to a model body-centered cubic (bcc) metal, tantalum. There are important funda- mental differences between face-centered cubic (fcc) and bcc metals; in tantalum, the Peierls–Nabarro stress is 2.97 GPa [13], whereas it is only 19 MPa in copper [14]. This difference profoundly affects the temperature and strain-rate sensitivities, and is expressed in different constitutive equations developed by Zerilli and Armstrong [15]. Tantalum has been subjected to shock compression experiments using gas-gun [16] and explosively driven flyer plate techniques [17]. The slip–twinning transition has been observed [18,19], and the bcc–hexagonal close-packed 1359-6454/$36.00 Ó 2012 Acta Materialia Inc. Published by Elsevier Ltd. All rights reserved. http://dx.doi.org/10.1016/j.actamat.2012.08.026 ⇑ Corresponding author. Tel.: +1 858 534 4719. E-mail address: [email protected] (M.A. Meyers). www.elsevier.com/locate/actamat Available online at www.sciencedirect.com Acta Materialia 60 (2012) 6601–6620
-
Upload
duongnguyet -
Category
Documents
-
view
220 -
download
0
Transcript of Laser compression of monocrystalline tantalummeyersgroup.ucsd.edu/papers/journals/Meyers...

Available online at www.sciencedirect.com
www.elsevier.com/locate/actamat
Acta Materialia 60 (2012) 6601–6620
Laser compression of monocrystalline tantalum
C.H. Lu a, B.A. Remington b, B.R. Maddox b, B. Kad a, H.S. Park b, S.T. Prisbrey b,M.A. Meyers a,⇑
a University of California, San Diego, La Jolla, CA 92093, USAb Lawrence Livermore National Laboratory, Livermore, CA 94550, USA
Received 31 May 2012; received in revised form 9 August 2012; accepted 14 August 2012Available online 19 September 2012
Abstract
Monocrystalline tantalum with orientations [100] and [111] was subjected to laser-driven compression at energies of 350–684 J,generating shock amplitudes varying from 10 to 110 GPa. A stagnating reservoir driven by a laser beam with a spot radius of�800 lm created a crater of significant depth (�80 to �200 lm) on the drive side of the Ta sample. The defects generated by the laserpulse were characterized by transmission and scanning electron microscopy, and are composed of dislocations at low pressures, andmechanical twins and a displacive phase transformation at higher pressures. The defect substructure is a function of distance fromthe energy deposition surface and correlates directly with the pressure. Directly under the bottom of the crater is an isentropic layer,approximately 40 lm thick, which shows few deformation markings. Lattice rotation was observed immediately beneath this layer.Further below this regime, a high density of twins and dislocations was observed. As the shock amplitude decayed to below�40 GPa, the incidence of twinning decreased dramatically, suggesting a critical threshold pressure. The twinning planes were primarily{112}, although some {123} twins were also observed. Body-centered cubic to hexagonal close-packed pressure induced-transformationwas observed at high pressures (�68 GPa).
The experimentally measured dislocation densities and threshold stress for twinning are compared with predictions using analysesbased on the constitutive response, and the similarities and differences are discussed in terms of the mechanisms of defect generation.� 2012 Acta Materialia Inc. Published by Elsevier Ltd. All rights reserved.
Keywords: Dislocation; Laser treatment; Tantalum; Twinning; Shock compression
1. Introduction
Although the first laser shock experiments, by Askaryanet al. [1], date from the 1960s, and early work showed thepotential use of laser shock pulses to harden aluminumalloys [2,3], there has been only limited inquiry on the nat-ure of laser-shock-induced defects. White [4,5] and others[6–8] introduced the use of lasers to obtain Hugoniot dataover a broad range of pressures.
A systematic inquiry into the effects of laser pulses onfcc metals (Cu and Cu–Al) was initiated in 2001 and hasyielded significant results that have been explained in terms
1359-6454/$36.00 � 2012 Acta Materialia Inc. Published by Elsevier Ltd. All
http://dx.doi.org/10.1016/j.actamat.2012.08.026
⇑ Corresponding author. Tel.: +1 858 534 4719.E-mail address: [email protected] (M.A. Meyers).
of shock compression [9–11]. This work was extended tonickel by Jarmakani et al. [12].
The objective of this study is to extend the methodologydeveloped for copper and nickel to a model body-centeredcubic (bcc) metal, tantalum. There are important funda-mental differences between face-centered cubic (fcc) andbcc metals; in tantalum, the Peierls–Nabarro stress is�2.97 GPa [13], whereas it is only �19 MPa in copper[14]. This difference profoundly affects the temperatureand strain-rate sensitivities, and is expressed in differentconstitutive equations developed by Zerilli and Armstrong[15]. Tantalum has been subjected to shock compressionexperiments using gas-gun [16] and explosively driven flyerplate techniques [17]. The slip–twinning transition has beenobserved [18,19], and the bcc–hexagonal close-packed
rights reserved.

6602 C.H. Lu et al. / Acta Materialia 60 (2012) 6601–6620
(hcp) transformation was identified by Hsiung [20] andHsiung and Lassila [21,22].
The dislocation response is governed at low strain ratesby thermal activation. With increasing strain rate, drag(phonon and electron) mechanisms become relevant [23],as well as a proposed new regime of effective “drag”through debris generation [24]. At even higher strain rates,relativistic effects have been postulated.
In spite of extensive research, we still do not fully under-stand at the lattice level how a strong shock – that is, ashock where the plastic wave has a higher shock velocitythan the elastic precursor – propagates through a solidsample [9]. Further, the timescale and physical processesinvolved in elastic–plastic [25] and polymorphic phase tran-sitions [26] are fertile areas of investigation.
The regimes obtained by laser-induced compression areextreme and cannot be accessed by other experimentalmethods. The timescales are two to three orders of magni-tude shorter than those in gas-gun and explosive experi-ments. The goal of this research is to probe themechanisms of plastic deformation (slip and twinning) ina time and pressure region accessible via laser energy depo-sition. Recovery experiments of ramp-loaded, monocrys-talline Ta were designed to study mechanisms of plasticdeformation and failure at high pressure and strain rates.
2. Experimental techniques
Pure monocrystalline Ta was obtained from MarkeTechIntl, Inc. in cylindrical shape, with dimensions of 3 mmdiameter and 3 mm height. The interstitial impurities(ppm in weight) in Ta measured by the Evans AnalyticalGroup are O:<10, N:<10, H: 7.6 and C:<10. The laserrecovery experiments were performed at the Laboratoryfor Laser Energetics, University of Rochester (OmegaFacility). The experimental set-up, shown in Fig. 1, hadpreviously been tested for recovery of fcc metals [9]. Thecylindrical tantalum monocrystal targets were placedbehind a tantalum washer inside a stainless steel recoverycontainer. The inside of this container was filled with silicaaerogel, which acted as a deceleration medium for the tan-talum specimens after they had undergone compressionloading.
The recovery container was designed to be mounted inthe Omega chamber [27,28] (Fig. 1a). Fig. 1b shows a moredetailed view of the recovery set-up. A shock was driveninto the 180 lm BrCH (2%) reservoir via direct illumina-tion of the 20 lm polycarbonate ablator by six overlappingbeams at a nominal energy of �60 J per beam for �3 ns.The standard SG8 distributed phase plates (focal spot ofradius �400 lm) were used [29] on each beam, with bestfocus at the ablation surface. The overlap region betweenthe six beams was optimized to ensure a large, uniformablation front. The stagnation of the reservoir materialagainst the Ta sample provided a quasi-isentropic loadingprofile for a few tens of micrometers of Ta sample beforesteepening into a shock [30]. The detailed cross-section of
the target holder with the tantalum specimen to be studiedis shown in Fig. 1c. The specimens were successfully recov-ered in this geometry. The aerogel did not introduce anyadditional damage into the recovered samples and actedas a gradual decelerating medium. A removable cap witha centered 4 mm hole was used to clamp and fix the sampleat the front end of the tube (Fig. 1a).
The generation of shockless compression using anexpanding plasma has three stages. First, the incident laserenergy flux is converted in the ablator/reservoir into a low-density plasma [27]. Secondly, the plasma expands in thegap. Thirdly, the plasma stagnates and piles up againstthe front surface of the tantalum, producing a monotoni-cally rising pressure. The amplitude of the pressure wavepropagating into the monocrystal increases and graduallysteepens into a shock wave as it propagates into the metal.Surface heating effects are minimized through this process.A 3 mm diameter and 20 lm thick polycarbonate ablator(C16H16O4), density 1.2 g cm–3, followed by 180 lm thickbrominated polystyrene reservoir (C50H48Br2), density1.23 g cm–3, was placed on the laser-irradiating front sur-face of the tantalum washer (Fig. 1c). The Ta washer, witha machined radial groove for vacuum pumping of the gap(marked in Fig. 1c), was clamped between the cap and thefront end of the tube. The radial groove was designed forpumping out the gap between the ablator/reservoir andthe front surface of monocrystals. The internal diameterof the Ta washer is 2 mm, determining the diameter ofthe compression pulse.
Five recovery experiments on monocrystals and threecomplementary VISAR (Velocity Interferometer Systemfor Any Reflector) experiments of the drive were per-formed. The VISAR experiments were conducted on Al–LiF drive calibration samples and provided interface veloc-ity data that allowed the pressure vs. time of loading to bededuced, which became the input to the subsequent com-puter simulations. The total drive laser energies (ELaser)varied between 350 and 684 J.
The shocked targets were examined using a profilome-ter, a microhardness tester, a scanning electron microscope(Phillips XL30 ESEM) and transmission electron micro-scopes (operated at 200 kV). Transmission electron micros-copy (TEM) foils were prepared by electropolishing andfocused ion beam (FIB; Hitachi NB-5000 FIB-SEM) tech-niques. The electropolishing liquid was a solution of87.5 vol.% methanol, 10 vol.% sulfuric acid and 2.5 vol.%hydrofluoric acid, which was used to polish at �25 V and��35 �C. The temperature was lowered by pouring liquidnitrogen directly into the electropolishing solution. FIBsamples were prepared by cutting targets into half alongthe energy deposition direction and mounting them intoepoxy. They were mechanically polished down to 0.05 lmusing Al2O3 and coated with a thin layer of Ir before theFIB milling procedure. The FIB samples were perpendicu-lar to the shock propagation direction and had thicknessesof 50–100 nm. DIFFRACTe was used to simulate the dif-fraction patterns taken from TEM images.

Fig. 1. (a) Tridimensional illustration of recovery tube; (b) cross-section of the recovery tube with dimensions; (c) detailed cross-section of the laserpackage and recovery tantalum specimen.
C.H. Lu et al. / Acta Materialia 60 (2012) 6601–6620 6603
3. Results and discussion
3.1. SEM analysis
The laser-driven loading produced significant crateringof the specimen surfaces. Figs. 2 and 3 show the craters,their profiles and scanning electron microscopy (SEM)observations of the surfaces for [100] and [111] monocrys-tals at the lowest (�350 J) and highest (�684 J) drive laserenergies, respectively. The crater radius is �1.2 mm in allcases, but the depth is a function of the laser energy, being
approximately 0.08 mm for the 350 J and �0.21 mm for the684 J total laser energy. Fig. 4 shows plots of the craterdimensions vs. laser energy; the crater depth increasesmonotonically with laser energy (Fig. 4a), whereas the cra-ter radius is largely independent of it (Fig. 4b).
The SEM micrographs of the shocked specimens revealinteresting features. First, the “blow-off” effect from thelaser energy deposition is seen through striations that ema-nate from the central region. This “blow-off” likelyinvolves melting of the surface layers. SEM micrographsalso show other features of relevance: two arrays of perpen-

Fig. 2. Surface of Ta [100] monocrystals after laser compression (top: ELaser = 358 J; bottom: ELaser = 684 J). (a) Optical micrographs; (b) SEM showingcracks; (c) profilometry traces.
6604 C.H. Lu et al. / Acta Materialia 60 (2012) 6601–6620
dicular dark lines (marked by arrows) are seen in the [10 0]crystal (Fig. 2). These lines are also present in the [11 1]crystal, but are irregular. Two possibilities were considered:cracks and twins. The irregular lines in the [11 1] crystal(Fig. 3) are not consistent with twin traces. It is possiblethat bcc tantalum undergoes a ductile-to-brittle transitionat high strain rates, where the cracks could be formed in
tension generated by the large stress, temperature anddeformation gradients generated by the laser pulse. Duc-tile-to-brittle transitions in bcc metals due to temperatureeffects have been studied both experimentally [31,32] andcomputationally [33], but high strain rate effects are notas well understood as temperature effects. However, thetwo effects, lowering the temperature and increasing the
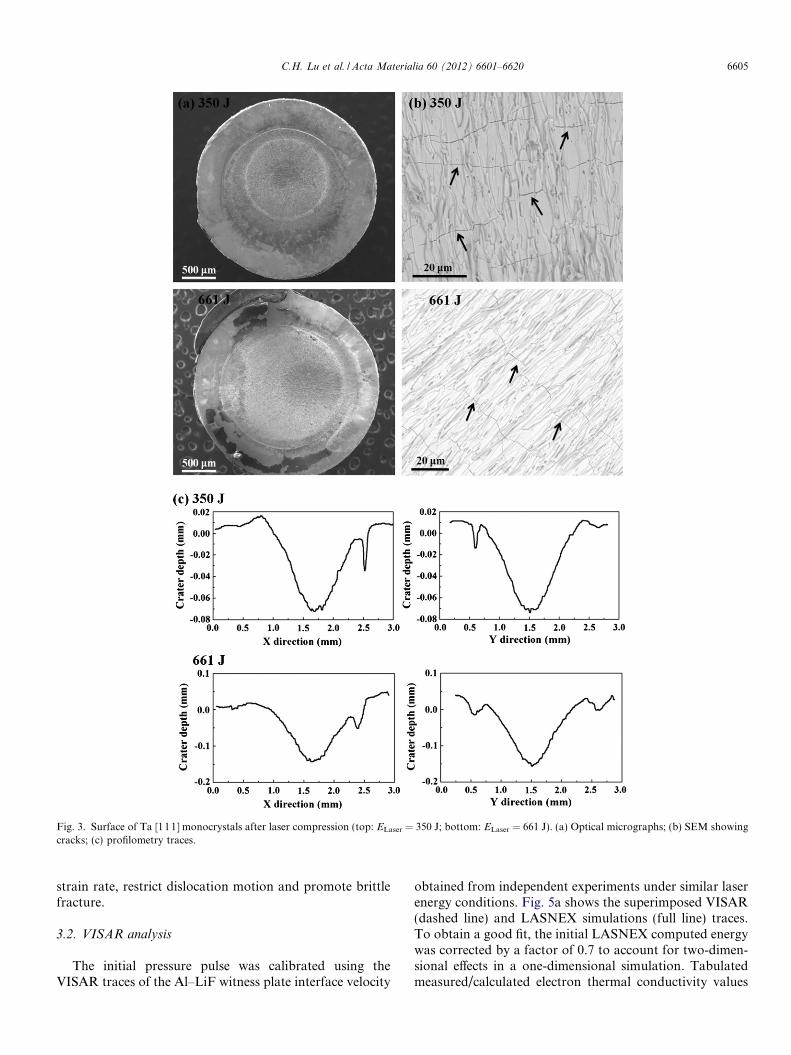
Fig. 3. Surface of Ta [111] monocrystals after laser compression (top: ELaser = 350 J; bottom: ELaser = 661 J). (a) Optical micrographs; (b) SEM showingcracks; (c) profilometry traces.
C.H. Lu et al. / Acta Materialia 60 (2012) 6601–6620 6605
strain rate, restrict dislocation motion and promote brittlefracture.
3.2. VISAR analysis
The initial pressure pulse was calibrated using theVISAR traces of the Al–LiF witness plate interface velocity
obtained from independent experiments under similar laserenergy conditions. Fig. 5a shows the superimposed VISAR(dashed line) and LASNEX simulations (full line) traces.To obtain a good fit, the initial LASNEX computed energywas corrected by a factor of 0.7 to account for two-dimen-sional effects in a one-dimensional simulation. Tabulatedmeasured/calculated electron thermal conductivity values

Fig. 4. (a) Depth and (b) radius of craters formed in [100] and [111]monocrystals as a function of laser energy. No significant differences incrater radius between the [100] and [111] samples are observed.
Fig. 5. Measured and simulated parameters for laser energy ofELaser = 684 J: (a) measured VISAR and simulated LASNEX traces ofthe Al–LiF interface velocity from a drive shot; (b) 1D LASNEXsimulation of temperature as a function of time at different depths into theTa. Note the transition from quasi-isentropic to shock compression withan attendant decrease in rise time and increase in temperature (12,000 K,�1 eV).
6606 C.H. Lu et al. / Acta Materialia 60 (2012) 6601–6620
were used. In spite of using a polycarbonate ablator/reser-voir, heating of the front of the Ta sample still occurs dueto the high-energy photon deposition into the Ta sampleduring laser ablation and the diffusion process used tomodel radiation propagation in the simulation. An aspectof the experimental set-up that is of relevance is that theinitial pulse rise is not a shock discontinuity. This is seenin Fig. 5b; the temperature is expressed as eV(�12,000 K). For distances of 5 and 10 lm from the energydeposition surface, the quasi-isentropic loading conditionprevails, providing a gradual temperature rise. By the timethe stress wave has penetrated 50 lm into the sample, thetemperature rise is much more rapid. This quasi-isentropicloading was purposely incorporated into the target designto minimize the temperature rise at high pressures. Thedip in Tion just before ramp occurs is due to the transitionof the zonal region from elastic to plastic flow and is anartifact of the simulation (not real). The ion temperatureafter the transition to plastic flow is still valid and can beseen to be ramp-like in nature until the sample is �25–30 lm in thickness. Then the induced shock heating caused
by the steepening of the ramped compression wave into ashock causes an abrupt jump in Tion and the ramp-like nat-ure is lost.
Fig. 6 shows the calculated pressure decay using theLASNEX radiation hydrodynamics code with the assump-tion of one-dimensional propagation. The radial release isnot incorporated into the calculation, which is reasonablefor a depth of up to 2 mm in our experimental set-up.The pressure–time profiles at different depths are shownin Fig. 6a and b for ELaser of 358 and 684 J, respectively.The pressure decays rapidly, but is still significant at the

Fig. 6. LASNEX simulations of the decay of the laser-generated pressurepulse as it travels through tantalum specimen for (a) total laser energy of358 J and (b) and total laser energy of 684 J.
C.H. Lu et al. / Acta Materialia 60 (2012) 6601–6620 6607
back surface of the specimen (3 mm). At the same time, thepulse, which has a characteristic triangular shape, widenswith depth into the sample. At each depth, the largest pres-sure occurs along the energy deposition axis and is indi-cated as “peak pressure” at that depth. For theELaser = 358 J (Fig. 6a) experiment, the pressure decaysfrom �50 to �10 GPa from the front (loading side) tothe back of the sample. For the ELaser = 684 J (Fig. 6b)experiment, it decays from �110 to �20 GPa.
3.3. Microhardness analysis
The shocked and recovered [10 0] and [111] specimenswere sectioned into six slices along their 3 mm length(Fig. 7a), slice 1 being �600 lm thick and the other slices�250 lm thick (Fig. 7a). After brief mechanical polishingof all flat surfaces, microhardness values were measuredacross the diameter of each slice. The microhardness variesacross the sample diameter, being highest in the center dueto the localization of the laser pulse in the central portionof the specimens (Fig. 7b). The microhardness of the[100] crystal driven with ELaser = 606 J as a function of dis-
tance from the driven Ta surface is shown in Fig. 7c. Themicrohardness decays from the front to back, from�1500 to �900 MPa. This decay is most significant in thefirst millimeter from the compression surface. The originalmicrohardness (before laser compression) is �760 MPa.The dashed line shows a hardness discontinuity, relatedto the slip-to-twinning transition, as explained in Sec-tion 3.4. The microhardness was also measured in the slicesfor the ELaser = 358 and 684 J experiments; the correspond-ing positions were converted to the respective pressuresthrough the use of the LASNEX calculations of Fig. 6.For the 606 J experiment, the pressures were interpolatedfrom the 358 and 684 J simulations. The relation betweenmicrohardness and pressure is shown in Fig. 7d. By assess-ing the slice location, we can extract the pressure fromFig. 6. It can be seen that the results from the three exper-iments are consistent. These results do not follow the Murrexpression, H / P1/2 [34]. This is due to the fact that twin-ning is prevalent above P � 43 GPa, as marked in Fig. 7d.The onset of twinning in Ta has been shown by Murr et al.[19] to generate an increase in hardness, as evident fromour results.
3.4. TEM analysis
3.4.1. Dislocation density analysis
TEM foils for dislocation density analysis were preparedby electropolishing slices 2–6 (see Fig. 7a) for the [100]monocrystals. TEM characterization shows the deforma-tion structures associated with the passage of the pressurewave/shock. Typical deformation substructures are shownin Fig. 8. The dislocation density decreases with distancefrom the laser deposition surface. The dislocation segmentsare predominantly of screw character, a feature well knownin bcc metals since the edge dislocations have much highermobility. As pressure increases (Fig. 8a), the dislocationstend to organize into well-defined bands. The g = 200imaging condition in Fig. 8a is normal to the deformationband, consistent with the projected (10 1) slip trace in bcctantalum.
Fig. 9b shows a high magnification region of loopsobserved in slice 3 of the [100], ELaser = 358 J sample. Thisis compared with earlier work on laser-shocked copper(Fig. 9a). There are striking similarities in loop structurebetween the laser-shocked Cu and Ta. The presence oflarge numbers of dislocation loops has been previouslyidentified by Meyers et al. [9]. Similarly, tantalum showsthe same proclivity for shear loop formation as markedin Fig. 9b.
3.4.2. Twin structure analysis
The FIB technique was used to prepare TEM foils fromslice 1 (Fig. 7a), for the locations just below the energydeposition surface at the center of the crater. The removalof FIB foils from slice 1 of the Ta [001] with ELaser = 606 Jis shown in Fig. 10a. The foil “Top” comes from 54 lmbeneath the center of the crater bottom, whereas the foil
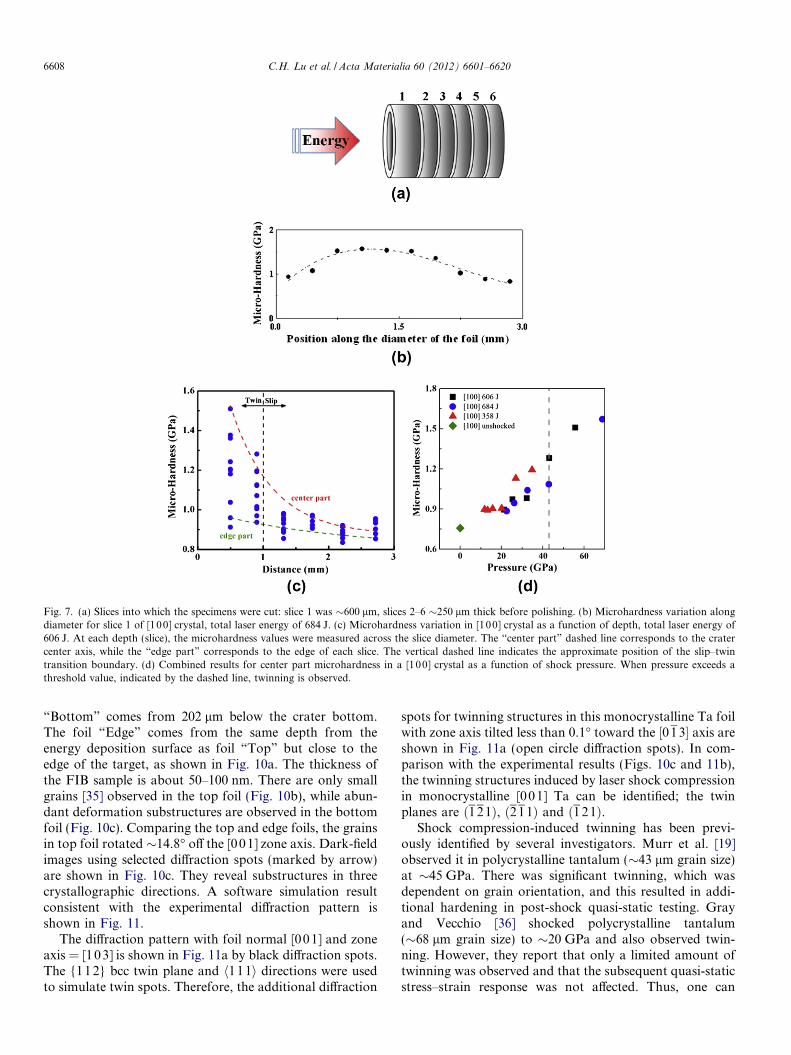
Fig. 7. (a) Slices into which the specimens were cut: slice 1 was �600 lm, slices 2–6 �250 lm thick before polishing. (b) Microhardness variation alongdiameter for slice 1 of [100] crystal, total laser energy of 684 J. (c) Microhardness variation in [100] crystal as a function of depth, total laser energy of606 J. At each depth (slice), the microhardness values were measured across the slice diameter. The “center part” dashed line corresponds to the cratercenter axis, while the “edge part” corresponds to the edge of each slice. The vertical dashed line indicates the approximate position of the slip–twintransition boundary. (d) Combined results for center part microhardness in a [100] crystal as a function of shock pressure. When pressure exceeds athreshold value, indicated by the dashed line, twinning is observed.
6608 C.H. Lu et al. / Acta Materialia 60 (2012) 6601–6620
“Bottom” comes from 202 lm below the crater bottom.The foil “Edge” comes from the same depth from theenergy deposition surface as foil “Top” but close to theedge of the target, as shown in Fig. 10a. The thickness ofthe FIB sample is about 50–100 nm. There are only smallgrains [35] observed in the top foil (Fig. 10b), while abun-dant deformation substructures are observed in the bottomfoil (Fig. 10c). Comparing the top and edge foils, the grainsin top foil rotated �14.8� off the [001] zone axis. Dark-fieldimages using selected diffraction spots (marked by arrow)are shown in Fig. 10c. They reveal substructures in threecrystallographic directions. A software simulation resultconsistent with the experimental diffraction pattern isshown in Fig. 11.
The diffraction pattern with foil normal [00 1] and zoneaxis = [103] is shown in Fig. 11a by black diffraction spots.The {11 2} bcc twin plane and h111i directions were usedto simulate twin spots. Therefore, the additional diffraction
spots for twinning structures in this monocrystalline Ta foilwith zone axis tilted less than 0.1� toward the ½013� axis areshown in Fig. 11a (open circle diffraction spots). In com-parison with the experimental results (Figs. 10c and 11b),the twinning structures induced by laser shock compressionin monocrystalline [001] Ta can be identified; the twinplanes are ð121Þ, ð211Þ and ð1 21Þ.
Shock compression-induced twinning has been previ-ously identified by several investigators. Murr et al. [19]observed it in polycrystalline tantalum (�43 lm grain size)at �45 GPa. There was significant twinning, which wasdependent on grain orientation, and this resulted in addi-tional hardening in post-shock quasi-static testing. Grayand Vecchio [36] shocked polycrystalline tantalum(�68 lm grain size) to �20 GPa and also observed twin-ning. However, they report that only a limited amount oftwinning was observed and that the subsequent quasi-staticstress–strain response was not affected. Thus, one can

Fig. 8. TEM micrographs as a function of distance from the laserdeposition surface for a [001] Ta single crystal, driven with laser energy of606 J: (a) slice 3 (1.3 mm from laser impact surface; local pressure�32.2 GPa); (b) slice 5 (2.2 mm from laser impact surface; local pressure�21.2 GPa); (c) slice 6 (2.7 mm from laser impact surface; local pressure�18.8 GPa). Foil normal ffi [001]. All images were taken with two electronbeam conditions �5� off [001] in the transmission electron microscope.The micrographs show dislocation tangles from deformation by slip, butno obvious evidence of twinning.
Fig. 9. Dislocation loops in shocked (a) monocrystalline copper [9] and(b) monocrystalline tantalum at a laser energy of 358 J and averagepressure of �22 GPa (slice 3).
C.H. Lu et al. / Acta Materialia 60 (2012) 6601–6620 6609
consider 20 GPa as a lower bound for twinning in polycrys-talline Ta. Hsiung [20] and Hsiung and Lassila [22]observed twins in pure Ta at 45 GPa but not at 30 GPa.In our current study, twinning structures were observedto depths of slice 2 in [001] driven at ELaser = 606 J andof slice 3 in [001] driven at ELaser = 684 J (Fig. 12). We esti-mate the pressure for slice 3 in [001] driven at ELa-
ser = 684 J to be �32 GPa (from Fig. 6b), at a depth of�1.49 mm from the front surface for this slice. Similarly,we estimate the pressure for slice 2 in [001] driven at ELa-
ser = 606 J as 43 GPa, interpolated for its 0.9 mm depthfrom the front surface. The slip–twinning transition islikely somewhere between 32 and 43 GPa in pure Ta, con-sistent with Murr et al. [19] and Hsiung [20]. It should bementioned that twins and dislocations are generated notby the pressure, but by the shear stresses associated withcompression in uniaxial strain. This will be discussed ingreater detail in Section 3.5.2.
Murr [34] reports an increase in hardness associatedwith the formation of twins. This is also seen in Fig. 7c.There are two lines in Fig. 7c – one at the edge and one

Fig. 10. (a) FIB cutting location in slice 1 for [001] orientation of Ta at ELaser = 606 J. “Top” foil: �50 lm from the crater bottom (�78 GPa); “Bottom”
foil: �200 lm from the crater bottom (�68 GPa). “Edge” foil: the same depth as “Top” foil, but far away from the crater center. (b) TEM bright-fieldimages and diffraction pattern of “Top” foil; (c) dark-field images and selected diffraction patterns in the “Bottom” foil. Foil normal ffi [103]. The beamconditions were �5� off [103] in the transmission electron microscope.
6610 C.H. Lu et al. / Acta Materialia 60 (2012) 6601–6620

C.H. Lu et al. / Acta Materialia 60 (2012) 6601–6620 6611
at the center – indicating that the results come from thecentral axis and outer edge of the cylindrical monocrystal,respectively. The vertical dashed line in Fig. 7c marks a dis-continuity in hardness and corresponds to the TEM obser-vations of twins. This line is �1 mm from the front forELaser = 606 J. Similarly, it is �1.5 mm from the front forELaser = 684 J. In all cases, the discontinuity in hardnessoccurs at a pressure of �30–40 GPa (Fig. 7d).
Looking back to the isentropic deformation profile,described in Section 3.2, the examination of the deforma-tion substructure in the region just below the surface is ofimportance. For this reason, the front and back surfacesof slice 1 for ELaser = 606 J were simultaneously evaluatedvia surface and backscattered SEM techniques. It shouldbe noted that the front and back surfaces of slice 1 are atdepths of �186 and �600 lm, respectively. Sample surfaceswere slightly electropolished for ease of examination, andthe depth of metal removed was carefully tracked via pro-filometry. Successive polishing, profilometry and SEMyielded the deformation substructure as a function ofdepth. On the first iteration, no substructure was observedon the front surface but extensive substructures arerevealed on the back surface of slice 1 for ELaser = 606 J,as shown in Fig. 13a and c. Because of the extreme defor-mation gradient, evidenced by the variance of surface fea-tures on the front and the back face of slice 1 forELaser = 606 J, it was necessary to incrementally polishand explore the depth-dependent deformation substruc-ture. After repeated surface removal steps by electropolish-ing, profuse twinning is first observed in only one smallpart on the front surface of slice 1 at a depth of �42 lmfrom the crater surface (Fig. 13b). It is thus surmised thatthe extent of the isentropic layer is of the order of �40 lm.This is also consistent with the simulation results shown inFig. 5b. However, the absence of features can also be dueto thermal annealing.
Fig. 11. (a) Diffraction pattern simulated by DIFFRACTe as foilnormal = [001] and zone axis = [103] with zone axis tilted less than 0.1�toward ½013� axis (subscripts m and t denote matrix and twin,respectively). (b) Experimental diffraction pattern from FIB foil “Bot-tom”; 202 lm below the crater bottom.
The orthogonal deformation twins observed in back-scattered SEM (Fig. 13b and c) are marked by arrows A,B and C, D. The nominal spacing is about 0.5 lm andthe thickness is, at most, �0.2 lm. Fig. 13d shows profusetwinning patterns observed via TEM. The orthogonal pat-tern of twins observed is also marked by arrows A and B.These correspond to the traces of {112} of the slip systemswith a Schmid factor of 0.457 on the (001) plane of the foil.There is also a significant number of markings at �40�,marked C and D. These are likely traces of the {123} slipplanes [37], with the highest Schmid factor (0.463) on the(001) plane of the foil. Therefore the {112} and {12 3} slipsystems are activated under almost similar conditions.
3.4.3. BCC to HCP transformation
The detailed mechanism of the a (bcc)! x (hexagonal)phase transformation in Ta was proposed by Hsiung [20]following experimental observations and confirmation viasimulation. For monocrystalline Ta ([011] orientation),the shock-induced x-phase transformation was observedat 45 GPa but not at 15 GPa [22]. In the current research,the x-phase was observed for [001] at ELaser = 606 J in thefoil “Bottom” and is shown in Fig. 14. From LASNEXsimulation results, the peak pressure of the foil “Bottom”
in slice 1 (202 lm under the crater bottom) is �68 GPa.However, there are only twinning structures, in slice 2 ofthe same target, at a peak pressure �43 GPa. The Schmidfactor of the transformation plane and direction({211}h11 1i) is higher for [01 1] than for [001] loading.Thus, to a first approximation, the transformation pressurefor [011] loading should be lower than for [001]. Similar tothe experimental results from Hsiung [20] and Hsiung andLassila [22], the x-phase is bulky (Fig. 14) compared to thelenticular shape of the twin structure (Figs. 10c and 12).The phase transition threshold pressure seems to be higherthan the slip–twinning transition pressure.
3.5. Modeling
3.5.1. Dislocation densities: comparison with experimental
results
Two analyses are applied in this section: the first is themechanism for homogeneous dislocation generationbehind the shock front [38,39]; the second is dislocationmultiplication by the Orowan mechanism. They yieldquantitative predictions of dislocation densities which arecompared with experimental results obtained here andthose reported by Hsiung [20] and Gray and Vecchio[36]. The dislocation density q can be statistically calcu-lated from the TEM pictures through:
q ¼ 2NLt
where N is the number of intersections on a grid line L, andt is the thickness of the sample [40–42]. From the FIB tech-nique, we approximate the thickness of the TEM samplesas 50 nm. Using the relation between pressure and depth
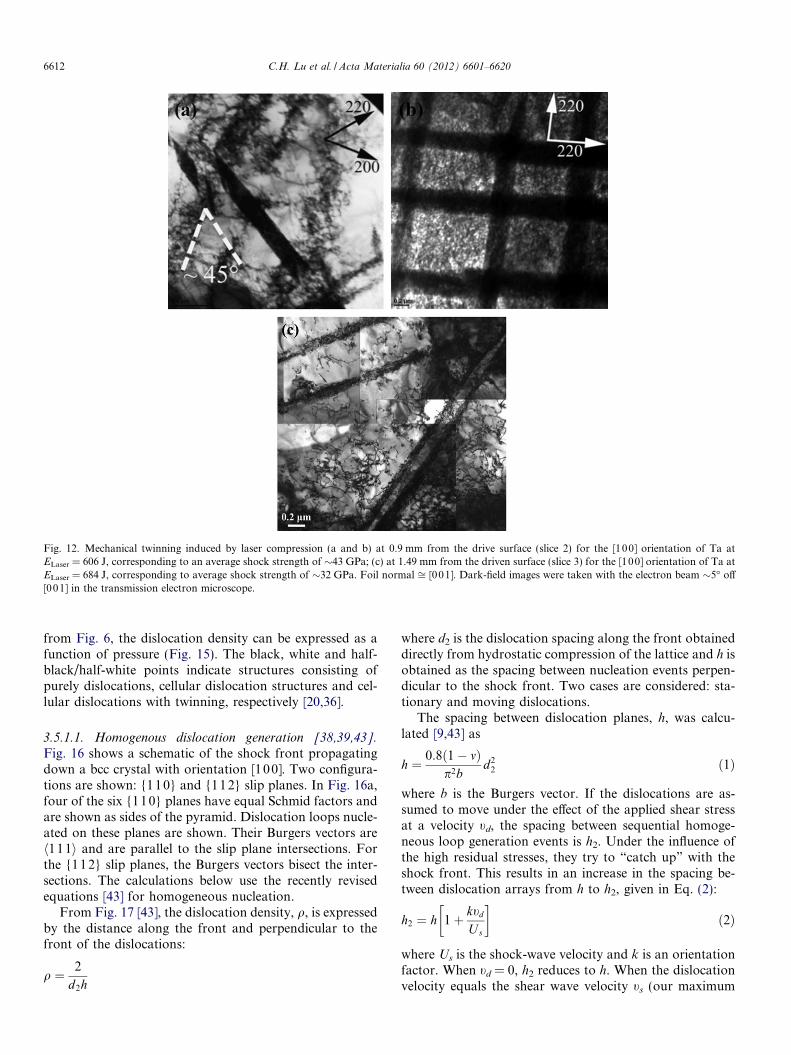
Fig. 12. Mechanical twinning induced by laser compression (a and b) at 0.9 mm from the drive surface (slice 2) for the [100] orientation of Ta atELaser = 606 J, corresponding to an average shock strength of �43 GPa; (c) at 1.49 mm from the driven surface (slice 3) for the [100] orientation of Ta atELaser = 684 J, corresponding to average shock strength of �32 GPa. Foil normal ffi [001]. Dark-field images were taken with the electron beam �5� off[001] in the transmission electron microscope.
6612 C.H. Lu et al. / Acta Materialia 60 (2012) 6601–6620
from Fig. 6, the dislocation density can be expressed as afunction of pressure (Fig. 15). The black, white and half-black/half-white points indicate structures consisting ofpurely dislocations, cellular dislocation structures and cel-lular dislocations with twinning, respectively [20,36].
3.5.1.1. Homogenous dislocation generation [38,39,43].
Fig. 16 shows a schematic of the shock front propagatingdown a bcc crystal with orientation [100]. Two configura-tions are shown: {110} and {112} slip planes. In Fig. 16a,four of the six {110} planes have equal Schmid factors andare shown as sides of the pyramid. Dislocation loops nucle-ated on these planes are shown. Their Burgers vectors areh111i and are parallel to the slip plane intersections. Forthe {112} slip planes, the Burgers vectors bisect the inter-sections. The calculations below use the recently revisedequations [43] for homogeneous nucleation.
From Fig. 17 [43], the dislocation density, q, is expressedby the distance along the front and perpendicular to thefront of the dislocations:
q ¼ 2
d2h
where d2 is the dislocation spacing along the front obtaineddirectly from hydrostatic compression of the lattice and h isobtained as the spacing between nucleation events perpen-dicular to the shock front. Two cases are considered: sta-tionary and moving dislocations.
The spacing between dislocation planes, h, was calcu-lated [9,43] as
h ¼ 0:8ð1� mÞp2b
d22 ð1Þ
where b is the Burgers vector. If the dislocations are as-sumed to move under the effect of the applied shear stressat a velocity td, the spacing between sequential homoge-neous loop generation events is h2. Under the influence ofthe high residual stresses, they try to “catch up” with theshock front. This results in an increase in the spacing be-tween dislocation arrays from h to h2, given in Eq. (2):
h2 ¼ h 1þ ktd
U s
� �ð2Þ
where Us is the shock-wave velocity and k is an orientationfactor. When td = 0, h2 reduces to h. When the dislocationvelocity equals the shear wave velocity ts (our maximum

Fig. 13. Twins imaged by SEM–BSE (20 kV) in [001] Ta at ELaser = 606 J; (a) front surface of slice 1 (�186 lm from the laser shock surface); (b) polishedout �42 lm depth from the front surface of slice 1 to where twins and the deformation microstructure first become visible (�228 lm from laser shocksurface); (c) back surface of slice 1 (�590 lm from the laser shock surface). All images are post-processed by inversion. (d) TEM image from FIB“bottom” (�202 lm from the laser shock surface).
Fig. 14. x (hexagonal) phase was observed in foil “Bottom” marked inFig. 10(a). A bright-field and a dark-field TEM image, and thecorresponding selected area diffraction pattern. x phase was lightened atan additional spot, as marked by an arrow. Dark-field images were takenwith two electron beam conditions �5� off [001] in the transmissionelectron microscope.
Fig. 15. Dislocation density calculated from TEM results. Black pointsreveal the dislocation density when only dislocations are observed. Whitepoints correspond to cellular dislocation structures. Half-black/half-whitepoints correspond to dislocation structures with concurrent twinning[20,36].
C.H. Lu et al. / Acta Materialia 60 (2012) 6601–6620 6613
assumed velocity for dislocation motion), h2 reaches amaximum:
h2 ¼ h 1þ kts
Us
� �ð3Þ
The expression connecting the dislocation density, q, tothe specific volume, V, for stationary dislocation is:

Fig. 16. Schematic representation of shear loops nucleating at (a) {110}and (b) {211} planes in shock compression along [100].
Fig. 17. Stress due to dislocations on a reference point 0 at the shock front[43].
Fig. 18. (a) Residual dislocation density as a function of shock pressurefor tantalum; comparison of calculated values (lines) with experimentalmeasurements (symbols); (b) dislocation velocity as a function of stressfrom MD simulations. The dashed curve is a fit to the simulation results.
6614 C.H. Lu et al. / Acta Materialia 60 (2012) 6601–6620
q ¼ 2p2
0:8ð1� mÞk3b2
VV 0
� ��2=3
1� VV 0
� �1=3" #3
ð4Þ
where k is an orientation parameter, m is Poisson’s ratio,and V0 and V are the initial and compressed specific vol-umes of the lattices. The specific volume is, in turn, relatedto the pressure through the Rankine–Hugoniot relation-ship [44]:
P ¼ C20 1� V =V 0ð Þ
V 0 1� Sð1� V =V 0Þ½ �2ð5Þ
where C0 is the sound velocity, and S is a material param-eter. Solving Eqs. (4) and (5) by assigning different values
V/V0 < 1, one obtains the dislocation density as a functionof pressure, as shown in Fig. 18a. The predictions basedon the two values of h (for stationary dislocations td ¼ 0and for dislocations moving at the shear sound velocitytd ¼ ts) are used in modeling dislocation density and com-pared with experimental results from three sources inFig. 18a. The calculated dislocation densities are ordersof magnitude higher than the values measured on recoverysamples. However, it should be mentioned that, at thisjuncture, the model does not incorporate either relaxationduring the shock nor the additional defect motion andannihilation during the rarefaction (unloading) portionof the shock pulse. This will be further developed in thefuture. Molecular dynamics calculations by Jarmakaniet al. [12] have shown that the homogeneous generationmechanism gives values, for nickel and copper, that arecomparable with the predictions of the homogeneous dis-location generation model. Upon unloading, the majorityof the dislocations are annihilated in the moleculardynamics calculations.

C.H. Lu et al. / Acta Materialia 60 (2012) 6601–6620 6615
3.5.1.2. Orowan dislocation multiplication. The alternativeto homogeneous dislocation generation at the front is theactivation of conventional sources and an increase in dislo-cation density through multiplication of dislocations. Theclassic Orowan equation has the form:
c ¼ Mbq‘ ð6Þwhere M = 3.08 is the Taylor factor, b = 2.86 � 10�8 cm isthe Burgers vector, q is the mobile dislocation density and ‘is the mean distance traveled by a dislocation. Taking thetime derivative,
_c ¼ dcdt¼ Mbq
@‘
@tþMb‘
@q@t¼ Mbðqtd þ ‘ _qÞ ð7Þ
In order to estimate the dislocation velocity, td, molecu-lar dynamics simulation results from Deo et al. [45] andTang et al. [37] were used. The computed results were fitto the following equation:
td ¼ ts 1� A exp �Brsp
� �m� �� �ð8Þ
where A, B and m are parameters. The stress r is normal-ized to the Peierls stress, sp, estimated to be sp = 3.76 GPa[37]. Eq. (8) predicts a maximum velocity equal to the shearwave velocity (ts ¼ 2; 039 m=s). The predictions from themolecular dynamics were fitted into Eq. (8) and are shownin Fig. 18b. The following fitting parameters were used:A = 0.999985, B = 0.012 and m = 3.1.
The relationship between pressure and strain rate inshock compression was obtained by Furnish et al. [16]for tantalum by passing a line through two experimentalpoints. In Fig. 19, a Swegle–Grady equation (P / _e1=4) ispassed through these points, providing the relationship:
_e ¼ 27:34� 10�36 � P 4shock ð9Þ
where P is expressed in Pa and the strain rate is in s�1. Inlaser compression, one has a state of uniaxial strain. Thus:
s ¼ r� r2
2¼ 1� 2m
2ð1� mÞ r ð10Þ
Fig. 19. Swegle–Grady relationship for Ta: _e ¼ 27:34� 10�36 � P 4shock [19],
where Pshock is in units of Pa and _e is in s�1; strain rate data within theisentropically loaded layer are also presented [16,19,64], with a Swegle–Grady relationship for Ta of _e ¼ 2:14� 10�31 � P 1:16.
Gc ¼ 1� 2m2ð1� mÞ eE
ð1� mÞð1þ mÞð1� 2mÞ ¼
eE2ð1þ mÞ ¼ Ge ð11Þ
and thus c = e, where s is the shear stress, r is the normalstress, r2 is the normal stress in the transverse direction, m isPoisson’s ratio, G is the shear modulus, c is the shear strain,e is the normal strain and E is Young’s modulus. Thus,_c ¼ _e is also used.
The rate of change in dislocation density _q is obtainedfrom the rate of generation, _qgen, and the rate of annihila-tion of dislocations, _qann:
_q ¼ _qgen þ _qann ð12ÞThe evolution of dislocation density was calculated
using two expressions:In Barton et al.’s [46] analysis, it is expressed as:
_q ¼ Hq� Dq2�
td ¼ R 1� qqsatð_epÞ
� �_ep ð13Þ
where qsat _ep
� ¼ qs0
_ep
_eNþ S0
� �n
ð14Þ
where qsat is the saturation dislocation density; H, D, R, S0
and n are parameters.Inserting Eqs. (13) and (14) into Eq. (7):
_c ¼ MbtdqþMbtd tR_ep �Mbtd tR_epq
qsatð_epÞð15Þ
q ¼ qð_ep; tdÞ ¼ qðP Þ ¼ _ep �Mbtd tR_ep
Mbtd � Mbtd tR_ep
qsatð_epÞ
� ð16Þ
The following parameters from Barton et al. [46] for tan-talum are used: R = 1018 m�2, qs0
¼ 1:1266� 1011 m�2,_eN ¼ 1 s�1, S0 = 650 and n = 0.59. The value of R used hereis a factor of 10 larger than that given by Barton et al. [46]in order to predict results that approximate the observa-tions by TEM reasonably. Applying Eqs. (8) and (9) toEq. (16), one obtains a relationship between dislocationdensity and pressure. The result is plotted in Fig. 18a. Itcan be seen that the curve, marked “Barton et al.”, predictsdensities that are fairly close to the observed residual den-sities at lower pressures. At higher pressures, twinningaccommodates part of the strain and the experimental dis-location densities are lower than predicted values. In amore general relationship, the overall strain based on Oro-wan equation has be expressed as
c ¼Mbq?l
Mbq?lþ fT cT
8><>:
if_c < _cthreshold
_c > _cthreshold
where q\ is the dislocation density, fT is the twin fraction,cT is the twin strain (= 0.707 in bcc [47]) and _cthreshold is thethreshold strain rate at which the slip–twinning transitionoccurs. For a strain rate below the threshold, the disloca-tion density increases with increasing strain as a result ofincreasing pressure. Above the threshold strain rate, partof the strain is accommodated by dislocations throughOrowan and part through twinning.

6616 C.H. Lu et al. / Acta Materialia 60 (2012) 6601–6620
In Kocks’s model [48], the dislocation density rate _q canbe expressed as
_q ¼ k1q1=2 � k2q
� _c ð17Þ
where k1 and k2 are experimentally determined parameters,and _c is the shear strain rate (¼ _e for uniaxial strain, Eq.(11)). The first term represents dislocation generation andthe second, dislocation annihilation. The difference withthe Barton et al. [46] model is in the exponents of the dis-location generation (½ vs. 1) and annihilation (1 vs. 2)terms. Two methods were used to estimate the parametersk1 and k2 in the dislocation density evolution:
Method 1: The saturation dislocation density is definedby: q = qsat, _q ¼ 0. Using the approach from Bartonet al. [46]:
k1
k2
� �2
¼ qsat ¼ qsatð_epÞ ¼ qs0
_ep
_eNþ S0
� �n
ð18Þ
q ¼ ðq1=2Þ2
¼�Mbtd t _ck1 �
ffiffiffiffiffiffiffiffiffiffiffiffiffiffiffiffiffiffiffiffiffiffiffiffiffiffiffiffiffiffiffiffiffiffiffiffiffiffiffiffiffiffiffiffiffiffiffiffiffiffiffiffiffiffiffiffiffiffiffiffiffiffiffiffiffiffiffiffiffiffiffiffiffiffiffiffiffiffiffiffiðMbtd t _ck1Þ2 � 4 Mbtd �Mbtd t _ck2ð Þð� _cÞ
q2ðMbtd �Mbtd t _ck2Þ
0@
1A
2
ð19Þ
where we set k2 = 1 � 10�5.
Method 2: Florando et al. [49] recently presented theparameter relationship for the dislocation evolutionequation based on Kocks’s [48] equation:
k2 ¼ k20
_er
_e
� �1=n
ð20Þ
where k1 = 16719, k20¼ 983:473, _er ¼ 1 s�1 and n = 0.25.
The predictions of Kocks [48] equation and its modifica-tion by Florando et al. [49] based on Orowan multiplica-tion are shown in Fig. 18a. The values are considerablylower than the ones using the Barton et al. [46] equation(with the corrected value for R). The two predictionsbracket the experimental results. It may be concluded thatdislocation multiplication can correctly predict the evolu-tion of dislocation density in shock compression of bcctantalum.
The differences between the models are still an unre-solved issue that needs to be addressed through a combina-tion of experiments, analysis and molecular dynamicssimulations. Two possible reasons for the differences havebeen identified:
a. The dislocation density increases through conven-tional multiplication according to the Orowan equa-tion. In this case, the strain dependence of thedislocation generation and annihilation terms fol-lowed the Barton et al. [46] model, based on Orowanmultiplication. According to the discussion at thebeginning of Section 3.5.1, the dislocation density
decreased as twin structures were observed at higherpressure.
b. Dislocations are homogeneously nucleated but alarge fraction of the dislocations generated in theshock front are annihilated during the release portionof the pulse. This was hypothesized earlier for Ni andCu via molecular dynamics simulations [12].
3.5.2. Slip–twinning transition
Slip and twinning can be considered as competing defor-mation processes. This criterion enables an analysis thatleads to the predicted transition between the two mecha-nisms. They are both determined by shear stresses actingin the slip or twin plane and in the direction of displace-ment (ss and sT, respectively). To a first approximation,one can establish a criterion for the dominance of onedeformation regime by using the transition in which theshear stresses are equal:
ss ¼ sT ð21ÞDuring shock compression, in the elastic loading stage
one can relate the maximum shear stress to the stressesaligned with (rxx) and perpendicular to (ryy) the propaga-tion direction (e.g., Stirk et al.[50]):
s ¼ 1
2rxx � ryy
� ¼ 1� 2t
2ð1� tÞ rxx ð22Þ
where t is Poisson’s ratio (=0.34 for Ta). Assuming that, toa first approximation, Poisson’s ratio is independent ofpressure, one has: s = 0.24rxx. Thus, there is a direct rela-tionship between the normal stress (that is directly relatedto the pressure, P) and the shear stress prior to plasticdeformation.
The slip–twinning analysis proposed by Meyers et al.[51] has been extended successfully to the shock compres-sion domain [10,11,52]. Meyers et al. [11] and Jarmakaniet al. [52] have developed constitutive descriptions for theslip–twinning transition for copper and nickel, respectively.In the calculations presented here, this treatment isextended to a bcc metal, tantalum, as done previously byMurr et al. [19]. The effects of strain rate on slip can beexpressed by the Zerilli–Armstrong equation for bcc metals[15]:
sS ¼ s�S þ C2e�C3T _eC4T þ kSd�1=2 ð23Þwhere sS is slip stress, s�S is athermal stress and d is the grainsize. C1, C2, C3, C4 and ks are parameters that have beenestablished for tantalum. The twinning stress, sT, has beenexpressed by Armstrong and Worthington [53] as:
sT ¼ s0 þ mGbC1
� �1=2 U �
RTln
_e_e0
� �1=q
d�1=2 ð24Þ
where s0 is a frictional stress, m is an orientation factor, G
is the shear modulus, b is the Burgers vector, U� is a nor-malized activation energy for twinning, R is the gas con-stant, _e0 is a reference strain rate, d is the grain size, and

C.H. Lu et al. / Acta Materialia 60 (2012) 6601–6620 6617
the exponent q varies between 4 and 8. The effect of strainrate on twinning can be neglected, to a first approximation.This can be surmised from the 1/q exponent in Eq. (24),where q has a large value of �5, as shown earlier by Meyerset al. [51]. Thus, the onset of twinning can be obtained bysetting Eq. (23) equal to Eq. (24), following the criterionexpressed in Eq. (21).
It is clear from the above discussion that, in shock com-pression, twinning is triggered by the shear stresses and notby the pressure. However, both are related by Eq. (22). Thepressure only creates the strain rate at the front, which inturn determines the level of shear stress. Applying the Swe-gle–Grady equation ðP / _e1=4Þ shown in Fig. 19(_e ¼ 27:34� 10�36 � P 4
shock) to Eqs. (23) and (24), one cancalculate the stresses required for slip and twinning, respec-tively, as a function of pressure. In isentropic compression,the strain rate is significantly lower for a prescribed pres-sure (Fig. 19). Average strain rates were computed fromthe effective plastic strain and compression time calculatedthrough LASNEX in the first 25 lm layer. The results arealso shown in Fig. 19.
There is extensive prior work indicating that the twin-ning stress is dependent on interstitial content. Table 1summarizes the different observations on twinning in tanta-
Table 1Interstitial content and twinning occurrence from different investigations.
Investigator Interstitial (ppm) Monocrystal/polycryst
Bechtold [31] 100 C Polycrystal (47 lm)100 N
Barrett and Bakish [54] 300 C Polycrystal
Anderson and Bronisz [55] 20 C Polycrystal (4 mm)8 O2
15 N2
10 H2
Mitchell and Spitzig [18] 18 C Monocrystal [123]37 O6 N<1 H
Sherwood et al. [56] 36 C Monocrystal [100]11 O7 N11 H Monocrystal [110]
Gray and Vecchio [36] 6 C Polycrystal (�68 lm)56 O24 N<1 H
Murr et al. [19] 70 C Polycrystal (�43 lm)60 O10 N4 H
Lu et al. (current work) <10 C Monocrystal [100]<10 O<10 N7.6 H
lum. The differences obtained by different investigatorsconfirm this. Barrett and Bakish [54] obtained twinningby impact deformation at 77 K, but not at 273 K; theirTa had �300 ppm C. On the other hand, Anderson andBronisz [55] had a total of �53 ppm of C, O, H and Nimpurity in their samples. They were able to twin Ta(d = 4 mm) at room temperature. Shock compression ofpolycrystalline Ta at room temperature suggests a concur-rence of lower shock pressures at lower interstitial contentat which twinning is observed [36,54–56]. Accordingly, thereported twinning stresses also vary with the source. Mitch-ell and Spitzig [18] observed twinning only in tensile tests at4.2 K. From Mitchell and Spitzig [18], a twinning stress of887.7 MPa (in tension) was calculated using {112}h111itwin system by finding the corresponding tension on[100]. It should be mentioned that loading was in the cen-ter of the stereographic triangle. In contrast, the twinningstresses in tension and compression were established forloading along [100] by Sherwood et al. [56]. They obtainedvalues that varied widely, and this is explained by the twin-ning plane and direction. The twinning stresses in tensionand compression were 370 and 755 MPa, respectively, for[100] monocrystal. Thus, there is a large difference betweenthe twinning stress in tension of Mitchell and Spitzig [18]
al Twin Temperature (K) Tension/compression
No 77 Tension
Yes 77 Compressive impactNo 196
273
Yes RT (298 K) Compressive impact
Yes 4.2 Tension
Yes 77 Tension (370 MPa)
4.2 Compression (755 MPa)
77 Tension (680 MPa)4.2 Compression (350 MPa)
Yes RT (298 K) Compression shock (�20 GPa)
Yes RT (298 K) Compression shock (�45 GPa)
Yes RT (298 K) Compression shock (�110 GPa)

Fig. 20. Temperature dependence of the asymmetry of flow stress for slipand twinning stresses in tension and compression for tantalum with [100]orientation (from Sherwood et al. [56]) at a strain rate of _e ¼ 10�4 s�1. TWrepresents the conditions at which twinning is observed.
Table 2Zerilli–Armstrong and other modeling parameters for experimental datafitting.
Parameters Unit Value
T K 298Athermal stress MPa 20C1 N/A 0.0005C2 = B0 MPa 1125C3 = b0 K�1 0.00535C4 = b1 K�1 0.00024Tension twin stress MPa 370Compression twin stress r0 MPa 755Burgers vector nm 0.286
Fig. 21. Flow stress–strain rate curves for [100] single crystal Tadeformed in tension (full lines) and compression (dash lines) [62]. Thetwinning stresses in tension and compression (from Sherwood et al. [56])were assumed to be independent of strain rate. The higher yield stresses athigh strain rates is due to our linear extrapolation from Rittel et al.’s [62]data.
Fig. 22. Slip and twinning stress vs. shock pressure for Ta (grain sized = 3 mm). The dashed curve corresponds to the isothermal case (close toisentropic compression); the solid curve includes the adiabatic shock-induced temperature rise (shock compression). The threshold ranges from29.2 to 35.2 GPa.
6618 C.H. Lu et al. / Acta Materialia 60 (2012) 6601–6620
and Sherwood et al. [56]. The experimental results by Sher-wood et al. [56] are the most complete because they includetension and compression of [100] and [110] monocrystals,and therefore will be used in this analysis. The inverse trendof tension–compression asymmetry pressure between [10 0]and [110] is not discussed in this paper. There is a signifi-cant tension–compression asymmetry in the shear stress ofbcc metals that has been extensively investigated by Vitekand co-workers [13,57–60] and Seeger [61], among others.This tension–compression asymmetry is due to dislocationcore effects. The yield stress in tension is lower than in com-pression in [100] monocrystal; the influence graduallydecreases with increasing temperature, as evident fromthe data of Sherwood et al. [56], plotted in Fig. 20. Thecompressive and tensile yield stresses are equal at 300 K.Thus, from Fig. 20, no apparent tension–compressionasymmetry should be expected in our 300 K laser shockexperiments. The (quasi-static and dynamic) experimentsby Rittel et al. [62] and quasi-static experiments in currentinvestigation (both in compression) were used to obtain theZ–A parameters, C4 and C2, given in Table 2. Fig. 21shows the application of the Z–A parameters in the predic-tion of the strain rate dependence of the flow stress. Thetwinning curves in tension and compression are shown in
the same plot, assuming no strain-rate sensitivity, due tothe high value of q in Eq. (24).
The temperature rise in Ta as a function of shock pres-sure can be expressed as the second-order polynomial,based on the R–H equations (and on the C0 and S valuesfor Ta [63]):
T shock Ta ¼ 1:007� 10�19P 2shock � 1:13� 10�9P shock þ 294:8
ð25Þwhere Pshock is expressed in units of Pa.
The calculated slip–twinning transition stress varies inthe �29–35 GPa range and is affected by consideration ofthe thermal rise in specimens during loading, i.e. isothermal(for quasi-isentropic) vs. adiabatic compression (forshock), as shown in Fig. 22. In our present study, twinning

C.H. Lu et al. / Acta Materialia 60 (2012) 6601–6620 6619
is observed above a 32 GPa pressure threshold for experi-ments performed at 300 K. Thus, considering the variousapproximations and assumptions of the model, the predic-tions match the experimental results fairly well.
4. Summary and conclusions
1. Tantalum monocrystals were subjected to laser com-pression utilizing an experimental set-up that providesquasi-isentropic loading for the first �40 lm depth; afterthis, the rise time of the pulse decreases and becomes ashock discontinuity.
2. The defects generated by the laser pulse were character-ized by transmission and scanning electron microscopy,and are composed of dislocations at low pressures, andmechanical twins and a displacive phase transformationat higher pressures.
3. The dislocation density increased with the proximity tothe energy deposition surface. The experimentallyobserved dislocation density was compared with calcula-tions based on homogeneous dislocation generation andOrowan dislocation multiplication.
4. The homogeneous dislocation generation mechanismpredicts results that are higher by orders of magnitudethan the experimentally measured densities. Theseresults are consistent with earlier investigations on cop-per (an fcc metal) [9].
5. The lower dislocation density observed experimentallymight be due to two reasons: (a) dislocations are nothomogeneously nucleated but rather increase their den-sity as a result of movement, interaction and multiplica-tion from existing sources; (b) a significant fraction ofthe dislocations generated homogeneously in shockcompression are annihilated upon release.
6. An analysis based on the Orowan mechanism of multi-plication and involving two forms of dislocation gener-ation and annihilation terms (Barton et al. [46] andKocks [48]) was applied and enabled the prediction ofdislocation densities as a function of pressure. The Bar-ton et al. [46] analysis predicted dislocation densitiesthat are consistent with experimental results at lowerpressures but higher than the experimental results athigher pressure. The difference may come from the effectof mechanical twins accommodating part of the strain.
7. In the proximity of the energy-deposition surface, as theshock pressure increases, the dislocations give way tomechanical twinning as the principal deformation mode.The experimentally obtained slip–twinning thresholdstress is �32–43 GPa. Calculations involving constitu-tive equations for slip and twinning and the Swegle–Grady equation predict a pressure �29–35 GPa range,consistent with experimental results.
8. The x-phase was observed at a peak pressure of�68 GPa. From the current results and Hsiung andLassila’s [22] experiments, it can be concluded that theexperimentally obtained phase transformation pressure
is �43–68 GPa. This is higher than the twinning thresh-old stress.
Acknowledgements
This research is funded by a UC Research LaboratoriesGrant (09-LR-06-118456-MEYM) and a National LaserUsers Facility (NLUF) Grant (PE-FG52-09NA-29043).We thank T. Remington for yield stress measurement,C.T. Wei for help with the manuscript preparation, RainLuo for profilometry measurement, Dr. Fabienne Gregorifor her hospitality at the Universite Paris Nord and fortransmission electron microscopy, and Dr. Y. Tang foroverall assistance. Electron microscopy was conducted atthe SHaRE User Facility, which is sponsored at Oak RidgeNational Laboratory by the Division of Scientific UserFacilities, US Department of Energy. We acknowledgethe use of the UCSD Cryo-Electron Microscopy Facility,which is supported by NIH grants to Dr. Timothy S. Bakerand a gift from the Agouron Institute to UCSD.
References
[1] Askaryan GA, Prokhorov AM, Chanturiya GF, Shipulo GP. SovPhys Jetp-Ussr 1963;17:1463.
[2] Safonov AN, Grigor’yants AG, Makusheva NA, Sergeev AV.Elektronnaya Obrabotka Materialov 1984;1:26.
[3] Gureyev DM, Zolotarevsky AV, Zaikin AE. J Mater Sci1991;26:4678.
[4] White RM. Inst Radio Eng Trans Instrum 1962;I-11:294.[5] White RM. J Appl Phys 1963;34:2123.[6] Bell CE, Landt JA. Appl Phys Lett 1967;10:46.[7] Panarell E, Savic P. Can J Phys 1968;46:183.[8] Skeen CH, York CM. Appl Phys Lett 1968;12:369.[9] Meyers MA, Gregori F, Kad BK, Schneider MS, Kalantar DH,
Remington BA, et al. Acta Mater 2003;51:1211.[10] Schneider MS, Kad B, Kalantar DH, Remington BA, Kenik E,
Jarmakani H, et al. Int J Impact Eng 2005;32:473.[11] Meyers MA, Schneider MS, Jarmakani H, Kad B, Remington BA,
Kalantar DH, et al. Metall Mater Trans A 2008;39A:304.[12] Jarmakani HN, Bringa EM, Erhart P, Remington BA, Wang YM, Vo
NQ, et al. Acta Mater 2008;56:5584.[13] Groeger R, Vitek V. Philos Mag 2009;89:3163.[14] Hobart RJ. Appl Phys 1965;36:1944.[15] Zerilli FJ, Armstrong RW. J Appl Phys 1990;68:1580.[16] Furnish MD, Chhabildas LC, Steinberg DJ. Shock Comp Condens
Matter AIP Conf Proc 1994;309:1099.[17] Thissell WR, Zurek AK, Tonks DL, Hixson RS. Shock Comp
Condens Matter AIP Conf Proc 2000;505:451.[18] Mitchell TE, Spitzig WA. Acta Metall 1965;13:1169.[19] Murr LE, Meyers MA, Niou CS, Chen YJ, Pappu S, Kennedy C.
Acta Mater 1997;45:157.[20] Hsiung LL. J Phys Condens Matter 2010;22:385702.[21] Hsiung LM, Lassila DH. Scr Mater 1998;38:1371.[22] Hsiung LM, Lassila DH. Acta Mater 2000;48:4851.[23] Meyers MA. Dynamic behavior of materials. New York: John Wiley
& Son; 1994.[24] Marian J, Cai W, Bulatov VV. Nat Mater 2004;3:158.[25] Bringa M, Rosolankova K, Rudd RE, Remington BA, Wark JS,
Duchaineau M, et al. Nat Mater 2006;5:805.[26] Kalantar DH, Belak JF, Collins GW, Colvin JD, Davies HM, Eggert
JH, et al. Phys Rev Lett 2005;95:075502.

6620 C.H. Lu et al. / Acta Materialia 60 (2012) 6601–6620
[27] Edwards J, Lorenz KT, Remington BA, Pollaine S, Colvin J, BraunD, et al. Phys Rev Lett 2004;92:075002.
[28] http://www.lle.rochester.edu/omega_facility/omega/.[29] http://www.lle.rochester.edu/media/about/documents/
nluf_users_guide.pdf.[30] Lorenz KT, Edwards MJ, Jankowski AF, Pollaine SM, Smith RF,
Remington BA. High Energy Density Phys 2006;2:113.[31] Bechtold JH. Acta Metall 1955;3:249.[32] Ferriss DP, Wulff J, Rose RM. Trans Metall Soc AIME
1962;224:584.[33] Cheung KS, Yip S. Modell Simul Mater Sci Eng 1994;2:865.[34] Murr LE. Scr Metall 1978;12:201.[35] Zhou JK, Hsiung LL, Chau R, Saw CK. Shock Comp Condens
Matter AIP Conf Proc 2007;955:677.[36] Gray GT, Vecchio KS. Metall Mater Trans A 1995;26:2555.[37] Tang Y, Bringa EM, Remington BA, Meyers MA. Acta Mater
2011;59:1354.[38] Meyers MA. Strength of metals and alloys. New York: Pergamon;
1979.[39] Meyers MA. Scr Metall 1978;12:21.[40] Smith CS, Guttman L. Trans Am Inst Min Metall Eng 1953;197:81.[41] Bailey JE, Hirsch PB. Philos Mag 1960;5:485.[42] Ham RK. Philos Mag 1961;6:1183.[43] Meyers MA, Jamarkani H, Bringa E, Remington B. In: Hirth JP,
Kubin L, editors. Dislocation in solids, vol. 15. Amsterdam: Elsevier;2009.
[44] Armstrong RW. Elban W. In: Hirth JP, Kubin L, editors. Disloca-tions in Solids. Amesterdam: Elsevier; 2004.
[45] Deo CS, Srolovitz DJ, Cai W, Bulatov VV. J Mech Phys Solids2005;53:1223.
[46] Barton NR, Bernier JV, Becker R, Arsenlis A, Cavallo R, Marian J,et al. J Appl Phys 2011;109:073501.
[47] Meyers MA, Chawla KK. Mechanical behavior of materials. Cam-bridge: Cambridge University Press; 2008.
[48] Kocks UF. J Eng Mater Technol 1976;98:76.[49] Florando JN, McNaney J, Hsiung L, Barton NR, Kumar M.
Presentation at TMS 140th annual meeting, San Diego, 27 February–3 March 2011.
[50] Stirk SM, Millet JCF, Bourne NK, Whiteman G, Park NT. ShockComp Condens Matter AIP Conf Proc 2009:1123–6.
[51] Meyers MA, Voehringer O, Lubarda VA. Acta Mater 2001;49:4025.[52] Jarmakani H, Wang YM, Bringa E, Meyers MA. Shock Comp
Condens Matter AIP Conf Proc 2007;955:239.[53] Armstrong RW, Worthington PJ. Metallurgical effects at high strain
rates. New York: Plenum; 1973.[54] Barrett CS, Bakish R. Trans Am Inst Min Metall Eng 1958;212:122.[55] Anderson RW, Bronisz SE. Acta Metall 1959;7:645.[56] Sherwood PJ, Guiu F, Kim HC, Pratt PL. Can J Phys 1967;45:1075.[57] Duesbery MS, Vitek V. Acta Mater 1998;46:1481.[58] Groeger R, Bailey AG, Vitek V. Acta Mater 2008;56:5401.[59] Groeger R, Racherla V, Bassani JL, Vitek V. Acta Mater
2008;56:5412.[60] Groeger R, Vitek V. Acta Mater 2008;56:5426.[61] Seeger A. Z Metallkd 2002;93:760.[62] Rittel D, Silva ML, Poon B, Ravichandran G. Mech Mater
2009;41:1323.[63] Meyers MA, Murr LE. Shock waves and high-strain-rate phenomena
in metals. New York: Plenum Press; 1981.[64] Tonks DL, Hixson RS, Johnson JN, Gray III GT. Shock Comp
Condens Matter AIP Conf Proc 1994;309:997.