Largo CAFR.pdfFINANCIAL REPORT SEPTEMBER 30, 2017 LARGOCITY OF LARGO.COM LOVELARGO FL.COM Your...
196
FINANCIAL REPORT SEPTEMBER 30, 2017 LARGO CITY OF LARGO .COM LOVE LARGO FL.COM Your Community of Choice in Tampa Bay! Largo COMPREHENSIVE ANNUAL City of For the fiscal year ended
Transcript of Largo CAFR.pdfFINANCIAL REPORT SEPTEMBER 30, 2017 LARGOCITY OF LARGO.COM LOVELARGO FL.COM Your...

FINANCIAL REPORTSEPTEMBER 30, 2017
LARGOCITY OFLARGO .COM LOVELARGOFL.COM
Your Community ofChoice in
Tampa Bay!
LargoCOMPREHENSIVE ANNUAL
City of
For the fiscalyear ended

Woody Brown Henry P. SchubertMayor City Manager
Curtis A. Holmes Michael StaffopoulosVice Mayor Assistant City Manager
John Carroll Alan S. ZimmetCity Attorney
Samantha FengerDiane Bruner, CMC
Donna Holck City Clerk
James Robinson Kimball R. Adams, CPAFinance Director
Michael A. SmithRebecca SpuhlerAssistant Finance Director
COMPREHENSIVE ANNUAL FINANCIAL REPORT
CITY COMMISSION CITY ADMINISTRATION
FOR THE FISCAL YEAR ENDED 9/30/2017

INTRODUCTORY SECTION
Letter of Transmittal............................................................................................................................................. i
Certificate of Achievement for Excellence in Financial Reporting....................................................................... v
Distinguished Budget Presentation Award.......................................................................................................... vi
List of Principal Officials...................................................................................................................................... vii
Organization Chart.............................................................................................................................................. viii
FINANCIAL SECTION
Independent Auditor's Report.............................................................................................................................. 1
Management's Discussion and Analysis Report................................................................................................. 4
Basic Financial Statements
Government-wide Financial Statements
Statement of Net Position............................................................................................................................ 34
Statement of Activities................................................................................................................................. 35
Fund Financial Statements
Balance Sheet-Governmental Funds.......................................................................................................... 36
Reconciliation of the Balance Sheet of Governmental Funds to the Statement of Net Position................. 38
Statement of Revenues, Expenditures and Changes in Fund Balances- Governmental Funds................ 39
Reconciliation of the Statement of Revenues, Expenditures and Changes in Fund Balances of Governmental Funds to the Statement of Activities .............................................................................
41
Statement of Revenues, Expenditures and Changes in Fund Balances-Budget and Actual-Major Funds
General Fund........................................................................................................................................ 42
Local Option Sales Tax Fund................................................................................................................ 43
SHIP Fund............................................................................................................................................. 44
HOME Fund........................................................................................................................................... 45
CDBG Fund........................................................................................................................................... 46
Statement of Net Position-Proprietary Funds.............................................................................................. 47
Statement of Revenues, Expenses and Changes in Fund Net Position-Proprietary Funds....................... 48
Comprehensive Annual Financial Report for the Fiscal Year Ended September 30, 2017
TABLE OF CONTENTS

Statement of Cash Flows-Proprietary Funds.............................................................................................. 49
Statement of Fiduciary Net Position-Fiduciary Funds................................................................................. 50
Statement of Changes in Fiduciary Net Position-Fiduciary Funds.............................................................. 51
Notes to Financial Statements Index............................................................................................................... 52
Notes to Financial Statements........................................................................................................................ 53
Required Supplementary Information-Police Officers and Firefighters Pension Plan..................................... 101
Required Supplementary Information-Schedule of Contributions……………………………………………….. 102
Required Supplementary Information-Schedule of Investment Returns………………………………………... 103
Required Supplementary Information – Post Employment Benefit Plan......................................................... 104
Community Redevelopment Agency
Balance Sheet................................................................................................................................................. 105
Statement of Revenues, Expenditures and Changes in Fund Balance ......................................................... 106
Combining and Other Supplementary Information Schedules
Schedule of Revenues, Expenditures and Changes in Fund Balance-Budget and Actual- General Fund............................................................................................................................................ 107
Combining and Individual Fund Statements
Combining Balance Sheet – Nonmajor Special Revenue Funds.................................................................... 109
Combining Statement of Revenues, Expenditures and Changes in Fund Balances- Nonmajor Special Revenue Funds............................................................................................................ 111
Schedule of Revenues, Expenditures and Changes in Fund Balance-Budget and Actual- County Gas Tax Fund................................................................................................................................... 113
Transportation Impact Fee Fund................................................................................................................... 114
Multimodal Impact Fee Fund……………………………………………………………………………………….. 115
Construction Services Fund.......................................................................................................................... 116
Stormwater Fund........................................................................................................................................... 117
Community Redevelopment Agency Fund.................................................................................................... 118
PCH Fund...................................................................................................................................................... 119
Comprehensive Annual Financial Report for the Fiscal Year Ended September 30, 2017
TABLE OF CONTENTS

Program Special Revenue Fund................................................................................................................... 120
Parkland Dedication Fund............................................................................................................................. 121
Combining Statement of Net Assets–Internal Service Funds............................................................................. 123
Combining Statement of Revenues, Expenses and Changes in Fund Net Position-
Internal Service Funds.................................................................................................................................. 124
Combining Statement of Cash Flows – Internal Service Funds.......................................................................... 125
Supplemental Information to Financial Statements…………………………………………………………………... 126
Schedule of Revenue and Expenditures and Changes in Reserves-
Largo Fire and Emergency Medical Services............................................................................................
Belleair Bluffs Fire and Emergency Medical Services...............................................................................
127
128
High Point Fire and Emergency Medical Services.................................................................................... 129
STATISTICAL SECTION…………………………………………………………………………………………...…... 130
Net Position by Component, Last Ten Fiscal Years...…..................................................................................... 132
Changes in Net Position, Last Ten Fiscal Years................................................................................................. 133
Governmental Activities Tax Revenue by Source, Last Ten Fiscal Years.......................................................... 135
Fund Balances of Governmental Funds, Last Ten Fiscal Years......................................................................... 136
Changes in Fund Balances of Governmental Funds, Last Ten Fiscal Years...................................................... 137
General Governmental Tax Revenues by Source, Last Ten Fiscal Years.......................................................... 138
Wastewater Charges, Last Ten Fiscal Years...................................................................................................... 139
Assessed Value, Taxable Value and Estimated Actual Value of Taxable Property, Last Ten Fiscal Years....... 140
Property Tax Rates Direct and Overlapping Governments, Last Ten Fiscal Years............................................ 141
Principal Property Taxpayers, September 30, 2017............................................................................................ 142
Property Tax Levies and Collections, Last Ten Fiscal Years.............................................................................. 143
Ratios of Outstanding Debt by Type, Last Ten Fiscal Years............................................................................... 144
Direct and Overlapping Governmental Activities Debt, as of September 30, 2017............................................. 145
Legal Debt Margin Information, Last Ten Fiscal Years....................................................................................... 146
Comprehensive Annual Financial Report for the Fiscal Year Ended September 30, 2017
TABLE OF CONTENTS
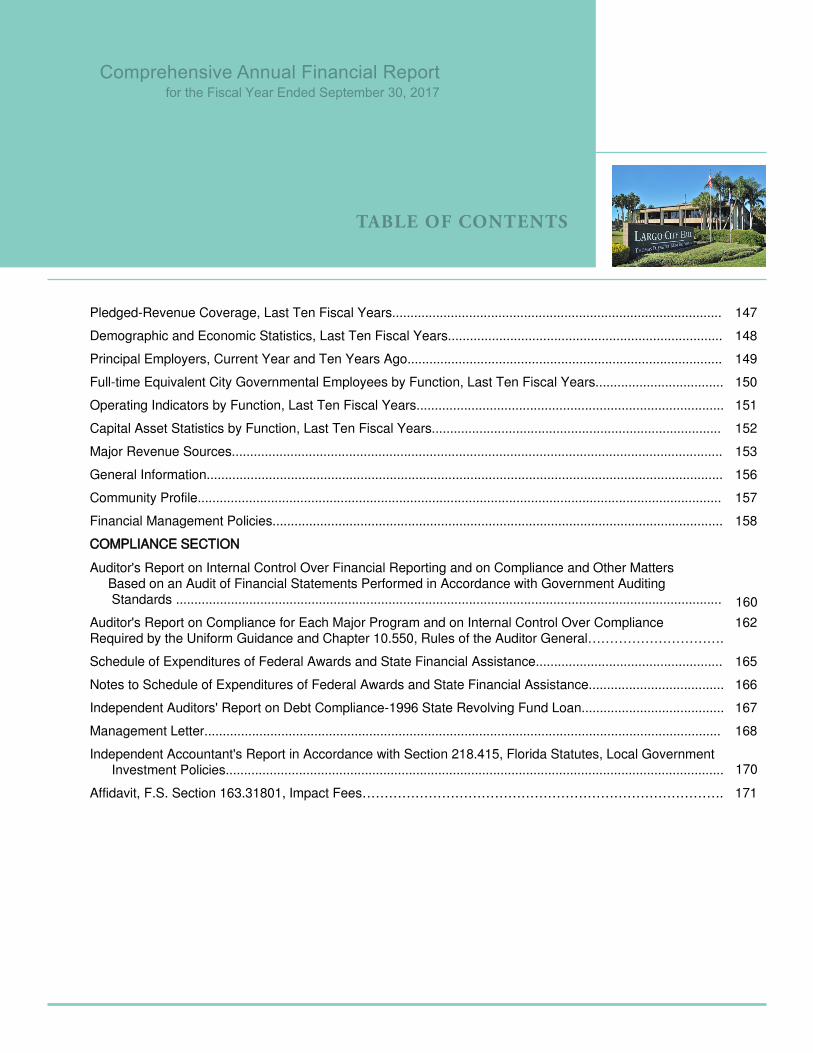
Pledged-Revenue Coverage, Last Ten Fiscal Years.......................................................................................... 147
Demographic and Economic Statistics, Last Ten Fiscal Years........................................................................... 148
Principal Employers, Current Year and Ten Years Ago...................................................................................... 149
Full-time Equivalent City Governmental Employees by Function, Last Ten Fiscal Years................................... 150
Operating Indicators by Function, Last Ten Fiscal Years.................................................................................... 151
Capital Asset Statistics by Function, Last Ten Fiscal Years............................................................................... 152
Major Revenue Sources...................................................................................................................................... 153
General Information............................................................................................................................................. 156
Community Profile............................................................................................................................................... 157
Financial Management Policies........................................................................................................................... 158
COMPLIANCE SECTION
Auditor's Report on Internal Control Over Financial Reporting and on Compliance and Other Matters Based on an Audit of Financial Statements Performed in Accordance with Government Auditing Standards ..................................................................................................................................................... 160
Auditor's Report on Compliance for Each Major Program and on Internal Control Over Compliance Required by the Uniform Guidance and Chapter 10.550, Rules of the Auditor General………………………….
162
Schedule of Expenditures of Federal Awards and State Financial Assistance................................................... 165
Notes to Schedule of Expenditures of Federal Awards and State Financial Assistance..................................... 166
Independent Auditors' Report on Debt Compliance-1996 State Revolving Fund Loan....................................... 167
Management Letter............................................................................................................................................. 168
Independent Accountant's Report in Accordance with Section 218.415, Florida Statutes, Local Government Investment Policies........................................................................................................................................ 170
Affidavit, F.S. Section 163.31801, Impact Fees………………………………………………………………………. 171
Comprehensive Annual Financial Report for the Fiscal Year Ended September 30, 2017
TABLE OF CONTENTS

March 2018
Letter of TransmittalHonorable Mayor and City Commissioners, City Manager and Citizens of the City of Largo, Florida
INTRODUCTION
The Finance Department respectfully transmits the City's FY17 Comprehensive Annual Financial Report(CAFR), which reflects a slightly better financial condition in many funds than at the end of last year.
Preparation of the City's CAFR fulfills the reporting requirements for several stakeholder groups. Firstand foremost, the CAFR reports the City's financial condition and results of operations to the Mayor andCity Commissioners, who are primarily responsible for maintaining the City's financial integrity.
Second, the CAFR provides information required by regulatory agencies, grant providers, the financialindustry and creditors, who are interested in whether the City was in compliance with grant restrictions,debt covenants, contractual provisions and statutory requirements. Finally, the CAFR targets theinformation needs of Largo citizens and businesses, who are the City's most important stakeholders.
Two documents are provided in the CAFR to assist all interested parties with interpreting the City'sfinancial statements and assess the City's financial condition, including:
• Letter of Transmittal – This letter introduces the CAFR, presents general information about theCity and highlights certain information that is not discussed elsewhere in the CAFR.
• Management's Discussion and Analysis (MD&A) – The MD&A is located after theIndependent Auditors' Report and provides an overview of financial reporting principles andpractices used by the City. The MD&A also provides commentary and analysis of majorcomponents of the City's financial condition, financial position at year end and results ofoperations for the year.
CITY OF LARGO PROFILE
The City of Largo, Florida is an independent reporting entity, as defined by the Governmental AccountingStandards Board (GASB). Please visit www.largo.com for more information about the City and for links toother sites within the Tampa Bay area.
Largo is located in Pinellas County on Florida's central Gulf Coast, which is the most densely populatedcounty in Florida. Largo provides a full range of municipal services, including police and fire protection,wastewater collection and treatment, solid waste collection, community planning, street repair andmaintenance, stormwater repair and maintenance, recreation, parks, arts and library services. PinellasCounty provides Largo citizens and businesses potable water, solid waste disposal and jail/court services.
Largo was incorporated in 1905 with 291 residents and an area of 1 square mile and has grown toapproximately 82,000 residents and 19 square miles and is the third largest city in Pinellas County. TheCity also serves over 30,000 unincorporated county residents with services, including: fire protection,EMS, wastewater, library, recreation, parks and arts, the cost of which is partially funded by the County.
In 1913, Largo became the first town in Florida and the second town in the nation to adopt theCommission/Manager form of government. Largo's Mayor and six City Commissioners (the CityCommission) are elected at large and serve staggered four-year terms. The City Commission establishespolicies, hires the City Manager and approves certain appointments. The City Manager implements theCity Commission's policies and manages daily operations through an executive management staff.
2017 Comprehensive Annual Financial Report | i

INDEPENDENT AUDIT AND AUDIT COMMITTEE
State Statutes and the City Charter require an annual audit to be conducted by independent CertifiedPublic Accountants selected by the City Commission. This requirement was fulfilled and the City'sfinancial statements have received an unqualified opinion from the auditors, Carr Riggs and Ingram, LLC,which is the highest opinion that can be received. The Independent Auditors' Report (opinion) enhancesthe reliability of the City's financial statements within certain limitations, as outlined in the opinion letter.
The City Commission appoints an Audit Committee that provides a formal mechanism to discuss audit-related matters. The Audit Committee monitors the audit through meetings with the auditors, whichenhances the auditors' independence and objectivity. Audit Committee members are, Mayor WoodyBrown, Chairperson and City Commissioners Curtis Holmes and James Robinson. The Audit Committeewas supported by OMB Manager Meridy Semones and an independent financial expert, John Houser,CPA, of Wells, Houser and Schatzel, PA.
MANAGEMENT'S FINANCIAL REPORTING RESPONSIBILITY
The City Administration (management) is responsible for the accuracy, completeness and fairness ofpresentation of all information included in this CAFR. Internal accounting and administrative controlshave been implemented to capture and record all financial information so that the City's financialstatements can be prepared in accordance with generally accepted accounting principles (GAAP).
The cost of a control should not exceed the benefit to be derived; therefore, the City’s internal controlshave been developed with the objective to provide reasonable, rather than absolute assurance, that thefinancial statements are free of any material misstatements. Management believes the informationpresented in this CAFR is accurate and complete in all material respects and fairly presents the City’sfinancial position and results of operations for FY17 and as of year-end.
FINANCIAL MANAGEMENT POLICIES
The City Commission has adopted policies to guide the City's financial activities, which are included in theStatistical Section of the CAFR. Financial policies cover the following areas:
• Operating Budget • Reserves & Fund Balance • Accounting, Auditing & Financial Reporting
• Revenues • Debt • Long-term Planning & Capital Improvements
• Purchasing • Investments • Capital Improvements Element
BUDGETARY & INTERNAL ACCOUNTING CONTROLS
The City's annual budget is an integral part of the financial accounting system. The City Managerproposes an annual operating budget to the City Commission. The City Commission must adopt anoperating budget in accordance with procedures established by the City Charter and the State of Florida.
Primary budget preparation and monitoring responsibility is assigned at the department level. Eachdepartment designates program managers who authorize purchases and payments and evaluate budgetperformance throughout the year. Encumbrances are recorded for all significant purchases at the time acommitment is made. Line item reports are accessible to all managers that include: amounts budgeted,expenditures to date, encumbrances, remaining budget balances and prior year activity for comparison.
The Finance Department monitors financial activity on an ongoing basis. Monthly financial reports areprepared for all departments and periodic reports summarizing a majority of the City's financial activitiesare prepared for the City Commission. City-wide financial activity is also periodically reviewed atmeetings with the City Manager, Assistant City Manager, Office of Management and Budget Manager,Finance Director, Assistant Finance Director and Treasury Manager.
LONG-TERM FINANCIAL PLANNING
The City prepares a five-year Long-term Financial Plan (LTFP) and Capital Improvements Program (CIP)for all Funds, which projects the City's major revenues, operating expenditures, fund balance and capitalprojects over a rolling five-year period. The LTFP/CIP provides information to assess the City's long-termfinancial condition in comparison to the short-term focus of the annual operating budget and CAFR.
2017 Comprehensive Annual Financial Report | ii

The City Manager proposes an LTFP/CIP to the City Commission annually and the City Commission mustadopt a CIP in accordance with requirements of the City Charter and the State of Florida. The LTFP/CIPis an integral part of the City's financial management system, but does not appropriate funds. Projectionsare updated and the first year's projects are incorporated into the next operating budget.
The City of Largo is projected to remain in good financial condition over the next several years, due to theestablishment an implementation of responsible fiscal policies. Actual and projected millage rates andunassigned fund balances in the General Fund are:
Actual Projected (FY18 millage rate is actual)
General Fund FY16 FY17 FY18 FY19 FY20 FY21 FY22
Millage rate (10 mill maximum) 5.3705 5.3705 5.7413 TBD TBD TBD TBD
Ending unassigned fund balanceas a % of the following year'sexpenditure budget 10.3% 12.90% 11.40% 11.30% 11.30% 12.20% TBD
The City's current utility rates are competitive with similar and surrounding communities. A stormwaterrate study is ongoing and recommendations are expected to be presented to the City Commission inFY18.
Currently projected utility rate and golf fee increases are:
Projected Increases FY18 FY19 FY20 FY21 FY22
Stormwater (drainage) - - 20% -
Wastewater (sewage) - - 20% - 15%
Reclaimed Water (sewage effluent) - - - - -
Solid Waste Collection (garbage) - 15% - - -
Golf (subject to market constraints) TBD TBD TBD TBD TBD
Conditions that will enable the City to maintain a positive financial condition, include:
• Adequate reserves in most funds
• No general obligation debt
• All revenue-pledged debt is within conservative guidelines
• Sufficient provisions have been made for infrastructure repairs, maintenance and replacement
• A relatively diversified revenue structure provides stability
Conditions that could significantly challenge the City's future financial condition, include:
• Previous years' of expenditure cuts have reduced operating flexibility
• Public safety pension costs are projected to remain relatively high
• Health care costs increases are projected
• Most major revenues are projected to grow slowly
• Existing and proposed property tax exemptions and 'Save Our Homes' portability will limitrevenue growth
• The Governor and state legislature have expressed a strong desire for smaller local governmentand lower local taxes by introducing legislation that erodes the City's Home Rule Authority
2017 Comprehensive Annual Financial Report | iii
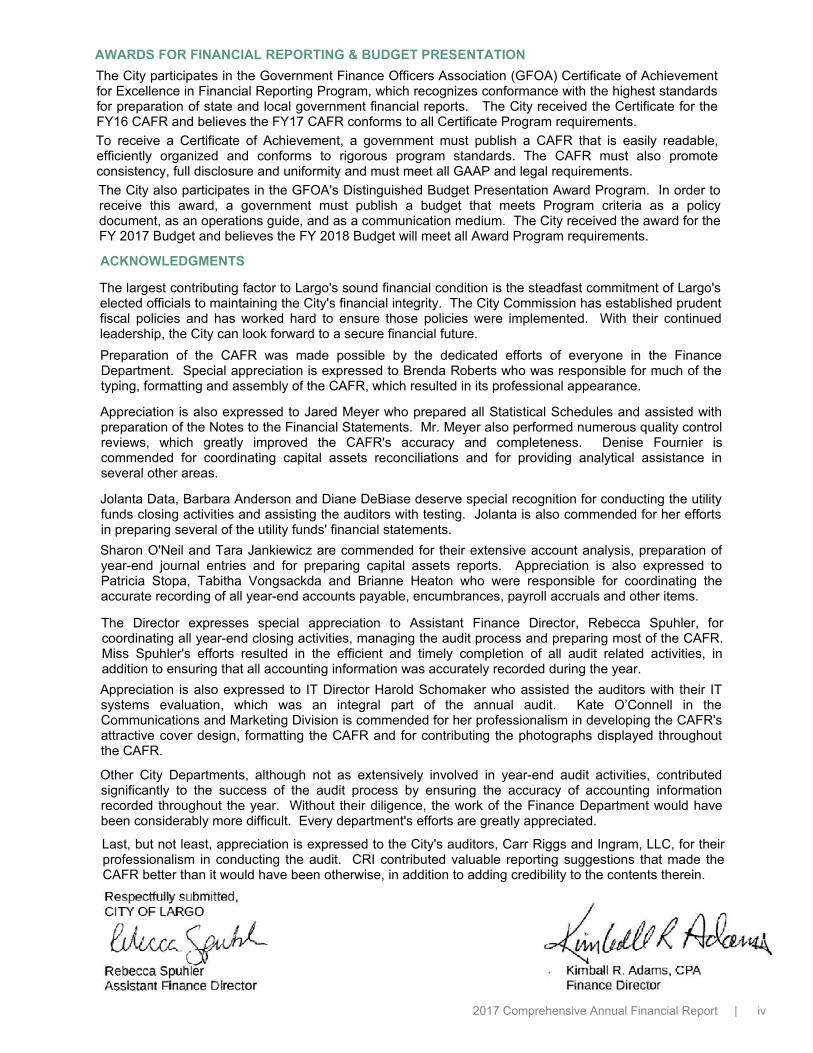
AWARDS FOR FINANCIAL REPORTING & BUDGET PRESENTATION
The City participates in the Government Finance Officers Association (GFOA) Certificate of Achievementfor Excellence in Financial Reporting Program, which recognizes conformance with the highest standardsfor preparation of state and local government financial reports. The City received the Certificate for theFY16 CAFR and believes the FY17 CAFR conforms to all Certificate Program requirements.
To receive a Certificate of Achievement, a government must publish a CAFR that is easily readable, efficiently organized and conforms to rigorous program standards. The CAFR must also promote consistency, full disclosure and uniformity and must meet all GAAP and legal requirements.
The City also participates in the GFOA's Distinguished Budget Presentation Award Program. In order to receive this award, a government must publish a budget that meets Program criteria as a policy document, as an operations guide, and as a communication medium. The City received the award for the FY 2017 Budget and believes the FY 2018 Budget will meet all Award Program requirements.
ACKNOWLEDGMENTS
The largest contributing factor to Largo's sound financial condition is the steadfast commitment of Largo'selected officials to maintaining the City's financial integrity. The City Commission has established prudentfiscal policies and has worked hard to ensure those policies were implemented. With their continuedleadership, the City can look forward to a secure financial future.
Preparation of the CAFR was made possible by the dedicated efforts of everyone in the FinanceDepartment. Special appreciation is expressed to Brenda Roberts who was responsible for much of thetyping, formatting and assembly of the CAFR, which resulted in its professional appearance.
Appreciation is also expressed to Jared Meyer who prepared all Statistical Schedules and assisted withpreparation of the Notes to the Financial Statements. Mr. Meyer also performed numerous quality controlreviews, which greatly improved the CAFR's accuracy and completeness. Denise Fournier iscommended for coordinating capital assets reconciliations and for providing analytical assistance inseveral other areas.
Jolanta Data, Barbara Anderson and Diane DeBiase deserve special recognition for conducting the utilityfunds closing activities and assisting the auditors with testing. Jolanta is also commended for her effortsin preparing several of the utility funds' financial statements.
Sharon O'Neil and Tara Jankiewicz are commended for their extensive account analysis, preparation ofyear-end journal entries and for preparing capital assets reports. Appreciation is also expressed toPatricia Stopa, Tabitha Vongsackda and Brianne Heaton who were responsible for coordinating theaccurate recording of all year-end accounts payable, encumbrances, payroll accruals and other items.
The Director expresses special appreciation to Assistant Finance Director, Rebecca Spuhler, forcoordinating all year-end closing activities, managing the audit process and preparing most of the CAFR.Miss Spuhler's efforts resulted in the efficient and timely completion of all audit related activities, inaddition to ensuring that all accounting information was accurately recorded during the year.
Appreciation is also expressed to IT Director Harold Schomaker who assisted the auditors with their ITsystems evaluation, which was an integral part of the annual audit. Kate O’Connell in theCommunications and Marketing Division is commended for her professionalism in developing the CAFR'sattractive cover design, formatting the CAFR and for contributing the photographs displayed throughoutthe CAFR.
Other City Departments, although not as extensively involved in year-end audit activities, contributed significantly to the success of the audit process by ensuring the accuracy of accounting information recorded throughout the year. Without their diligence, the work of the Finance Department would have been considerably more difficult. Every department's efforts are greatly appreciated.
Last, but not least, appreciation is expressed to the City's auditors, Carr Riggs and Ingram, LLC, for their professionalism in conducting the audit. CRI contributed valuable reporting suggestions that made the CAFR better than it would have been otherwise, in addition to adding credibility to the contents therein.
2017 Comprehensive Annual Financial Report | iv

2017 Comprehensive Annual Financial Report | v
2017 Comprehensive Annual Financial Report | vi

CITY COMMISSION
Woody Brown, Mayor
Curtis A. Holmes, Vice Mayor
John Carroll
Samantha Fenger
Donna Holck
James Robinson
Michael A. Smith
City Manager
Henry P. Schubert
Assistant City ManagerMichael Stafopoulos, PE
City Clerk Diane Bruner, CMC
EXECUTIVE MANAGEMENT STAFF
Alan S. ZimmetCarol Stricklin, AICPIrvin KetyKimball R. Adams, CPAShelby WillisSusan SinzHarold Schomaker, CCIOCasey McPheeJef Undestad
City Attorney Community Development Director Environmental Services Director Finance Director Fire Chief Human Resources Director Information Technology Director Library Director Police Chief Public Works Director Brian UsherRecreation, Parks and Arts Director J o an Byrne, CPRE
City of Largo
LIST OF PRINCIPAL OFFICIALSSeptember 30, 2017
2017 Comprehensive Annual Financial Report | vii

Police(203.81 FTE)
Fire Rescue(152.00 FTE)
City Commission
Human Resources(11.00 FTE)
Information Technology(28.00 FTE)
Assistant City Manager
Finance(14.60 FTE)
Rec, Parks & Arts(130.55 FTE)
Library(40.20 FTE)
Public Works(143.83 FTE)
Environmental Services
(87.25 FTE)
City Attorney
CITY OF LARGO(914.07 FTE)
Community Development(47.25 FTE)
Citizens
City Manager
Administration(25.58 FTE)
Legislative(8.00 FTE)
Engineering Services
(22.00 FTE)
ORGANIZATIONAL CHART
2017 Comprehensive Annual Financial Report | viii

INDEPENDENT AUDITORS’ REPORT Honorable Mayor, Members of the City Commission, and City Management City of Largo, Florida We have audited the accompanying financial statements of the governmental activities, the business‐type activities, each major fund, and the aggregate remaining fund information of City of Largo, Florida (the “City”), as of and for the year ended September 30, 2017, and the related notes to the financial statements, which collectively comprise the City’s basic financial statements as listed in the table of contents. We have also audited the financial statements of the Largo Community Redevelopment Agency as of and for the year ended September 30, 2017. Management’s Responsibility for the Financial Statements Management is responsible for the preparation and fair presentation of these financial statements in accordance with accounting principles generally accepted in the United States of America; this includes the design, implementation, and maintenance of internal control relevant to the preparation and fair presentation of financial statements that are free from material misstatement, whether due to fraud or error. Auditors’ Responsibility Our responsibility is to express opinions on these financial statements based on our audit. We conducted our audit in accordance with auditing standards generally accepted in the United States of America and the standards applicable to financial audits contained in Government Auditing Standards, issued by the Comptroller General of the United States. Those standards require that we plan and perform the audit to obtain reasonable assurance about whether the financial statements are free from material misstatement. An audit involves performing procedures to obtain audit evidence about the amounts and disclosures in the financial statements. The procedures selected depend on the auditor’s judgment, including the assessment of the risks of material misstatement of the financial statements, whether due to fraud or error. In making those risk assessments, the auditor considers internal control relevant to the entity’s preparation and fair presentation of the financial statements in order to design audit procedures that are appropriate in the circumstances, but not for the purpose of expressing an opinion on the effectiveness of the entity’s internal control. Accordingly, we express no such opinion. An audit also includes evaluating the appropriateness of accounting policies used and the reasonableness of significant accounting estimates made by management, as well as evaluating the overall presentation of the financial statements. We believe that the audit evidence we have obtained is sufficient and appropriate to provide a basis for our audit opinions.
2017 Comprehensive Annual Financial Report | 1
Opinions In our opinion, the financial statements referred to above present fairly, in all material respects, the respective financial position of the governmental activities, the business‐type activities, each major fund, and the aggregate remaining fund information of the City of Largo, Florida, as of September 30, 2017, and the respective changes in financial position and, where applicable, cash flows thereof and the respective budgetary comparison for the General Fund, Local Option Sales Tax Fund, SHIP Fund, HOME Fund and CDBG Fund for the year then ended in accordance with accounting principles generally accepted in the United States of America. In addition, in our opinion, the financial statements present fairly, in all material respects, the financial position of the Largo Community Redevelopment Agency as of September 30, 2017, and the changes in financial position for the year then ended in accordance with accounting principles generally accepted in United States of America. Other Matters Required Supplementary Information Accounting principles generally accepted in the United States of America require that the management’s discussion and analysis and required supplementary information, as listed in the table of contents, be presented to supplement the basic financial statements. Such information, although not a part of the basic financial statements, is required by the Governmental Accounting Standards Board, who considers it to be an essential part of financial reporting for placing the basic financial statements in an appropriate operational, economic, or historical context. We have applied certain limited procedures to the required supplementary information in accordance with auditing standards generally accepted in the United States of America, which consisted of inquiries of management about the methods of preparing the information and comparing the information for consistency with management’s responses to our inquiries, the basic financial statements, and other knowledge we obtained during our audit of the basic financial statements. We do not express an opinion or provide any assurance on the information because the limited procedures do not provide us with sufficient evidence to express an opinion or provide any assurance. Other Information Our audit was conducted for the purpose of forming opinions on the financial statements that collectively comprise the City’s basic financial statements and the Largo Community Redevelopment Agency. The introductory section, combining and individual nonmajor fund financial statements and schedules, and statistical section are presented for purposes of additional analysis and are not a required part of the basic financial statements. The schedule of expenditures of federal awards and state financial assistance and related notes is presented for purposes of additional analysis as required by Title 2 U.S. Code of Federal Regulations Part 200, Uniform Administrative Requirements, Cost Principles, and Audit Requirements for Federal Awards and Chapter 10.550, Rules of the Auditor General, and is also not a required part of the basic financial statements.
2017 Comprehensive Annual Financial Report | 2

The combining and individual nonmajor fund financial statements, schedules and the schedule of expenditures of federal awards and state financial assistance are the responsibility of management and were derived from and relate directly to the underlying accounting and other records used to prepare the basic financial statements. Such information has been subjected to the auditing procedures applied in the audit of the basic financial statements and certain additional procedures, including comparing and reconciling such information directly to the underlying accounting and other records used to prepare the basic financial statements or to the basic financial statements themselves, and other additional procedures in accordance with auditing standards generally accepted in the United States of America. In our opinion, the combining and individual nonmajor fund financial statements, schedules and the schedule of expenditures of federal awards and state financial assistance are fairly stated, in all material respects, in relation to the basic financial statements as a whole. The introductory and statistical sections have not been subjected to the auditing procedures applied in the audit of the basic financial statements and Largo Community Redevelopment Agency, and, accordingly, we do not express an opinion or provide any assurance on them. Other Reporting Required by Government Auditing Standards In accordance with Government Auditing Standards, we have also issued our report dated March 30, 2018, on our consideration of the City’s internal control over financial reporting and on our tests of its compliance with certain provisions of laws, regulations, contracts, and grant agreements and other matters. The purpose of that report is to describe the scope of our testing of internal control over financial reporting and compliance and the results of that testing, and not to provide an opinion on internal control over financial reporting or on compliance. That report is an integral part of an audit performed in accordance with Government Auditing Standards in considering the City’s internal control over financial reporting and compliance.
CARR, RIGGS & INGRAM, LLC Clearwater, Florida March 30, 2018
2017 Comprehensive Annual Financial Report | 3

This page was intentionally left blank

MANAGEMENT DISCUSSION AND ANALYSIS (MD&A) INTRODUCTION
Thank you for your interest in the City of Largo.
This MD&A report summarizes key financial information that is included in the City's FY 2017 Comprehensive Annual Financial Report (CAFR). The MD&A is intended for the majority of people who want to know, in simple terms, “How is the City of Largo doing, financially speaking?"
In simple terms, the City is doing better financially than last year in some areas, like fund balance and revenues, but is not doing as well relative to the years prior to what is being call the Great Recession. In other words, the City has not fully recovered from the Great Recession. Please note the colored traffic lights used throughout the MD&A, which indicate positive items (green), items to watch (yellow) and warning areas (red). While there are no "red lights" in the MD&A, there are several "yellow lights" that indicate areas where the City could improve its financial condition.
FINANCIAL OVERVIEW (Additional details are provided later in the MD&A) Fund Balances – The provision of financial resources for future needs and desires.
The General Fund's unassigned fund balance increased, due to economic improvement, fewer commitments for subsequent years, and a legal settlement of $1 million, but it remains lower than en years ago (an additional $600,000 from the legal settlement will be recognized in FY 2018). A lower fund balance reflects less capacity to respond to unexpected events, such as natural disasters or to seize opportunities. Debt – The impacts of borrowing decisions. The Police and Fire Pension Plan's net pension liability decl ined to $38 mil l ion, due mostly to favorable investment results, but continued to create a $19 million negative unrestricted net position (deficit) for Governmental Activities. Reducing the net pension liability will be a long-term and difficult process, as it is for many state and local governments.
Operating Results – The degree to which revenue and expenditure activity met expectations.
Several major revenues were over-budget as the result of an improving economy. Other revenues grew slowly or not at all, due partly to shifts in taxpayers' behaviors. Most departments were under budget, which helped to increase fund balance; however, several departments spent a greater portion of their budgets than normal, due to Hurricane Irma. Liquidity – The ability to pay liabilities when due.
The City maintained prudent liquidity levels throughout the year by maintaining reasonable amounts in short-term interest-baring accounts and by laddering investment maturities throughout the year, which means investments mature at different times during the year and maturing amounts can be used to pay obligations or can be re-invested if not needed. Trends – The degree to which key metrics are changing and are projected to change. Several major revenues have grown slightly or not at all over the past several years, which is similar to most other local governments in Florida. To compensate for slow revenue growth, budgets have been reduced or held constant, fund balances have been used, and tax revenue has been increased, all of which has reduced the City's fiscal flexibility. Projections indicate some improvement, so the City remains cautiously optimistic about the future.
City of Largo, Florida Management’s Discussion and Analysis September 30, 2017
2017 Comprehensive Annual Financial Report | 4
The City borrows infrequently, repays debt quickly and only borrows for major capital items, which is the cornerstone of the City's financial condition. All general government debt is serviced and secured by a local option sales tax. The Wastewater Fund is the only other fund with long-term debt, which is serviced and secured by wastewater fees. Wastewater debt increased, due to construction of three capital projects, but remains reasonable and affordable.

FINANCIAL HIGHLIGHTS
Government-wide financial statements (Statement of Net Position and Statement of Activities) The government-wide financial statements present highly-aggregated financial information for the City as a whole divided into two activities: Governmental Activities and Business-type Activities. The government- wide financial statements do not present any information for individual funds.
• Governmental Activities' (GA) program revenue (non-tax revenue) increased to $30.3 million from $30.1million in the prior year, which was insignificant. Reasons for the low growth are discussed below.
• GA program revenue paid 37% of GA expenses, which was about the same as last year and meansmost GA expenses were paid with general revenues (primarily taxes), which is normal.
• Business-type Activities' (BTA) program revenue (mostly charges for services) was essentiallyunchanged from the prior year, because there were no rate increases or major customer changes.
• BTA's total net position (equity) increased $2 million, which was lower than the prior year's increase of$5 million, due to the normal expense increases, no rate increases and low revenue growth.
Total government-wide Net Position (i.e. "equity") was positive for both GA and BTA, because total assets greatly exceeded total liabilities at year end, the difference being total net position; however, unfunded pension liabilities created a negative Unrestricted Net Position in Governmental Activities.
Question: Is having a higher Net Position (“equity”) a good thing?
Answer: It depends.
All things considered, having a higher net position is generally a good thing, as long as a government is accomplishing its objectives and meeting the community's needs. Generally, maintaining a higher net position means a government owns more of its assets, has a larger financial cushion for unforeseen events and did a better job of living within its means, all other things considered equal.
A government can have “too much” equity, depending on whether its stakeholders value having higher equity (e.g., having a higher fund balance), receiving more services or paying lower taxes and fees. Accumulating large equity levels can result in current stakeholders paying "too much" in taxes and fees and transferring excess assets to future stakeholders, which may be perceived as unfair.
The City reported a responsible debt to equity relationship for GA and BTA, which means the City has not shifted too many costs to future stakeholders through borrowing.
GA debt decreased, due to no new borrowing and normal repayments on existing debt, while BTA long-term debt increased, due to borrowing related to several large wastewater projects that were funded through a low-interest State loan.
Keys to responsible borrowing include: long-term debt should not be used to pay short-term costs; assets financed should last at least as long as related debt; some debt capacity should be reserved for unexpected needs; and, debt payments must be affordable, both currently and in the future.
City of Largo, Florida Management’s Discussion and Analysis September 30, 2017
2017 Comprehensive Annual Financial Report | 5

Question: Is having lower debt a good thing?
Answer: Again, it depends.
Debt brings with it debt payments and reduces borrowing capacity, which creates less flexibility for future stakeholders to spend resources as they see fit. For example, borrowing to build roads assumes that future stakeholders need or want the roads as much as current stakeholders.
On the positive side, debt helps to allocate the cost of long-lived assets among those who will benefit from their use. Some capital items are also too expensive to pay for without borrowing, so not borrowing can jeopardize public health and safety and may result in higher future costs.
Major Governmental Fund financial statements (Five Major Funds)
• The General Fund's unassigned fund balance increased $2.6 million, or about 36% from the prior year,primarily because expenditures grew slower than revenue, less fund balance was reserved at year end,departments under-spent their budgets and the General Fund recorded a $1 million legal settlement.
• Local Option Sales Tax Fund tax revenue was $200,000 higher than the prior year (3%), due tocontinued, although slower, improvement in the economy.
• Year-end loans receivable in the City's three major housing funds (SHIP, HOME and CDBG) totaled$12 million, which was approximately the same as at the end of the prior year. Loan repayments willgenerate future resources that can be used to fund future housing activities.
COMPREHENSIVE ANNUAL FINANCIAL REPORT (CAFR) OVERVIEW
The CAFR was prepared in accordance with generally accepted accounting principles (GAAP) applicable to state and local governments. As shown in Graph #1, the CAFR is organized into four main sections:
• Introductory:
• Financial:
• Statistical:
• Compliance:
Includes the Transmittal Letter and other general information about the City.
The CAFR's main section with three sub-sections, as shown in Graph #2.
Includes multi-year information that helps identify and analyze trends.
Includes information on grant, loan and other compliance requirements.
City of Largo, Florida Management’s Discussion and Analysis September 30, 2017
2017 Comprehensive Annual Financial Report | 6

FINANCIAL STATEMENTS OVERVIEW (A “Primer” on governmental accounting and reporting.)
This section of the MD&A provides an overview of the City's financial reporting structure, similar to a primer on governmental accounting, which is required by GASB reporting standards. This section is intended to help readers to better understand the financial statements.
This section does not present any financial data or analysis for the City of Largo.
Local Government Financial Statements - Unlike private sector financial reporting where one set of financial statements is presented, local governments (cities, counties, special districts and states) must present two sets of financial statements:
• Government-wide financial statements ( “big picture” )
• Similar to consolidated financial reporting in the private sector
• Reports Governmental Activities and Business-type Activities, not individual funds' activity
• Focuses on the flow of economic resources (long-term focus) using the full-accrual basis ofaccounting, similar to the private sector
• Individual fund financial statements ( “small picture” )
• Reports on financial activity of individual funds, e.g., the General Fund, which is usually whatmost financial statement readers are interested in
• Governmental funds – Focus on the flow of current financial resources (short-term focus), e.g.,cash inflows and outflows, using the modified-accrual basis of accounting
• Proprietary and Fiduciary funds – Focuses on the flow of economic resources (long-term focus)using the full-accrual basis of accounting, similar to the private sector
Fund Types – The City uses fund accounting to enhance accountability over public resources and to demonstrate compliance with legal requirements. Each fund maintains a separate self-balancing group of accounts and is both a fiscal and an accounting entity. Funds are established to maintain greater control and accountability over resources dedicated to specific activities.
The City reports all three of the major fund types: Governmental, Proprietary and Fiduciary.
a. Governmental funds. Includes: General, Special Revenue, Capital Projects, Debt Service andPermanent funds. The City always reports the first two and uses the other three as necessary.
Governmental fund financial statements focus on short-term inflows and outflows of financial resources(mostly cash) and on available (spendable) financial resources at year end. This information is usefulin evaluating the City's short-term financial position and results of operations.
i. Major Funds. Governmental fund financial statements focus on Major Funds, which for the City,include: General, Local Option Sales Tax, SHIP, CDBG and HOME. Major Fund financialstatements are located at the front of the CAFR, while all non-major fund information is aggregatedinto one non-major fund column. Detailed financial information for each non-major fund is providedin the Combining Financial Statements located directly after the Notes.
ii. Budgets. The City adopts an annual budget for all governmental funds. A budgetary comparisonstatement for major funds or a budget schedule for non-major funds (located after the Notes) isprepared for all governmental funds to demonstrate budget compliance. Significant budgetvariances are discussed in the Notes and summarized in the MD&A.
City of Largo, Florida Management’s Discussion and Analysis September 30, 2017
2017 Comprehensive Annual Financial Report | 7

b. Proprietary funds. The City reports both types of proprietary funds:
i. Enterprise funds. Enterprise funds report the same information presented as Business-typeActivities in the government-wide financial statements, only in greater detail. The City has threeenterprise funds: Wastewater, Solid Waste Collection (both major funds) and the Golf Course.
ii. Internal Service funds. Internal service funds are used to pay the costs of providing certain servicesto other City departments. The City uses internal service funds for vehicle repair and maintenance(Fleet Fund) and for risk management operations (Risk Fund).
▪ Both of the City's internal service funds are combined into a single column and presentedwith enterprise funds in the proprietary fund financial statements. Individual internal servicefund data is provided in the Combining Financial Statements after the Notes.
▪ In the government-wide financial statements, internal service funds are combined withGovernmental Activities, because they predominately serve Governmental Activities.
c. Fiduciary funds. Fiduciary fund financial statements report resources held for the benefit of others,such as pension plan members. Fiduciary fund information is not reported in the government-wide statements, because these resources are not available to fund City programs.
The City presents two types of financial statements along with supporting information:
a. Government-wide statements. Government-wide financial statements (the City as a whole) includetwo different statements and report information by two types of Activities using the accrual basis ofaccounting.
i. Government-wide financial statements include:
• Statement of Net Position. This statement presents information on all City assets andliabilities with the difference being reported as net position (equity). Changes in net positioncannot be considered positive or negative without further evaluation.
For example, when capital assets purchased with cash are depreciated, net positiondecreases. As long as the City's service objectives are met by using the capital assets, thedecrease in net position is positive, because capital assets are intended to be “used-up” whileproviding services and are not intended to be held for resale or to remain idle.
• Statement of Activities. This statement presents information on the changes in the City'snet position during the fiscal year related to revenues and expenses. All revenues andexpenses are reported as soon as an underlying event occurs, regardless of when cash isreceived or paid, as required under the accrual basis of accounting.
ii. Governmental Activities are primarily supported by taxes. The City's Governmental Activitiesinclude: general government, public safety (fire-rescue and police), public works, economicdevelopment, culture and recreation (library, recreation, parks and arts).
iii. Business-type Activities are primarily supported by charges for services (user fees). The City'sbusiness-type activities include: wastewater collection, treatment and disposal, solid wastecollection and the golf course.
b. Individual Fund statements. These statements report a smaller picture of financial information thatfocuses on each individual fund.
c. Financial Statement Comparison. Comparing the government-wide and individual fund financialstatements helps readers understand the long-term impacts in the government-wide statements caused by the short-term decisions in the individual fund statements. Since the government-wide and individual
City of Largo, Florida Management’s Discussion and Analysis September 30, 2017
2017 Comprehensive Annual Financial Report | 8

governmental funds statements are prepared using a different basis of accounting (full-accrual and modified-accrual, respectively), a reconciliation of the differences is provided after each statement.
d. Notes to the Financial Statements (“notes”). The notes provide information that is essential togaining a full understanding of the government-wide and individual fund financial statements.
e. Required Supplementary Information (RSI) Other Than the MD&A – RSI is required to bepresented, including information on pension funding progress. RSI is located just after the notes.
f. Combining Financial Statements, Individual Fund Financial Statements and Schedules – Thesestatements and schedules are provided for non-major governmental funds and internal service funds and are located immediately following RSI other than the MD&A.
GOVERNMENT-WIDE DISCUSSION and ANALYSIS (The City as a whole, “big-picture” focus.)
This section presents information from the City's government-wide financial statements (the City as a whole). This section focuses on Governmental Activities and Business-type Activities rather than on individual funds.
• Governmental Activities includes all governmental fund amounts combined together and adjusted fromthe modified accrual basis of accounting (short-term, financial-flow focus) to the accrual basis ofaccounting (long-term economic-flow focus).
• Business-type Activities include all enterprise fund amounts combined together using the accrual basisof accounting at the fund level and the government-wide level.
Summary – Statement of Net Position. The only significant change was in the Business-type Activities’ assets and liabilities, both of which increased significantly from the prior year, due to ongoing construction of three Wastewater Consent Order projects. All other amounts were relatively the same as the prior year.
The increase in BTA total assets ($39 million) was similar to the increase in BTA total liabilities ($37 million), because all Wastewater projects were financed. The $2 million difference is mostly related to debt repayments during the year.
Comparative Summary - Government-wide Amounts Statement of Net Position ($ in thousands)
Governmental Activities
Business-type Activities
Total Activities
Assets (a)
Deferred Outflows (b) 10,557 11,559 0 0 10,557 11,559
Liabilities (c) 67,339 71,229 74,179 37,226 141,518 108,455
Deferred Inflows (d) 2,810 2,000 0 0 2,810 2,000
Net Position (a+b-c-d):
Invested in capital assets, net 126,873 124,369 88,412 99,029 215,285 223,398
Restricted 40,747 41,783 9,113 8,992 49,860 50,775
Unrestricted (see comment below) (18,660) (20,472) 30,241 17,516 11,581 (2,956)
Total net position $148,960 $145,680 $127,766 $125,537 $276,726 $271,217
FY 2017 FY 2016 FY 2017 FY 2016 FY 2017 FY 2016
$208,552 $207,350 $201,945 $162,763 $410,497 $370,113
City of Largo, Florida Management’s Discussion and Analysis September 30, 2017
2017 Comprehensive Annual Financial Report | 9

Net Positon represents each Activities’ “equity”, which is the difference between its assets and liabilities. Since the majority of both Activities' Net Position is invested in capital assets, most of Net Position is illiquid and cannot be spent.
As the above Summary shows, total assets greatly exceeded total liabilities for both Activities in both years, which indicates a strong financial position. Not shown in the table, but included in the totals, current assets greatly exceeded current liabilities for both Activities, which indicates excellent liquidity.
Governmental Activities' Net Position invested in capital assets was 94% of the related capital assets at year end, which means that only 6% of GA capital assets were financed (9% in the prior year). This reflects the City's conservative "pay-as-you-go" philosophy for Governmental Activities' capital assets.
Business-type Activities' Net Position invested in capital assets was 58% of related capital assets, which means that 42% of BTA capital assets were financed (20% in the prior year). More BTA capital assets were financed this year, because of the three Wastewater Consent Order projects. Borrowing helps spread costs among future utility rate payers. Capital assets and related debt are discussed in more detail later.
Unrestricted GA Net Position reported a negative of $18.7 million at year end, due to recording of the net police and fire pension liability of $37.6 million. The good news is, the net pension liability declined $3.2 million from the prior year. The net pension liability is discussed later in the MD&A and in the Notes.
Summary – Statement of Activities. The following Comparative Summary of the Statement of Activities presents all revenues, expenses and other sources/uses of funds by Governmental Activities and Business- type Activities, which are responsible for the changes in the Net Position discussed above.
Total Activities (GA and BTA) - Total Revenue for both Activities combined (program and general revenue combined) increased slightly by 2.1% from FY 2016, while Total Expenses for both Activities combined increased 7.5%. This resulted in a lower positive Change In Net Position (aka, "net revenue over expenses") compared to FY 2016 ($5.5 million compared to $11.5 million), which means more City resources were used in FY 2017 than in FY 2016. These items are discussed in greater detail below.
Fun Fact - Total GA and BTA Program Revenue exceeded Total General Revenue in both years presented. This means a greater portion of the City's total revenue is generated by non-tax revenues (program revenue), mostly user charges, rather than by taxes (general revenue). Most people would guess the opposite.
GA General Revenue (mostly taxes) is always larger than BTA General Revenue (mostly interest earnings and miscellaneous items), because BTA includes the City's two utility activities and the Golf Course, which receive no tax revenue. General revenue always covers the greatest portion of GA expenses, which is just the opposite of BTA costs, which are always covered more from charges for services; much more.
City of Largo, Florida Management’s Discussion and Analysis September 30, 2017
2017 Comprehensive Annual Financial Report | 10

Comparative Summary - Government-wide Amounts Statement of Activities ($ in thousands)
Governmental Activities (GA)
Business-type Activities (BTA)
Total Activities
Program Revenue:
FY 2017 FY 2016 FY 2017 FY 2016 FY 2017 FY 2016
Charges for Services $26,531 $25,661 $34,990 $34,268 $61,521 $59,929 Operating grants/contrib. 3,008 2,817 99 60 3,107 2,877 Capital grants/contrib. 726 1,587 387 535 1,113 2,122
Total Program revenue $30,265 $30,065 Expenses:
$35,476 $34,863 $65,741 $64,928
General government 8,273 7,567 - - 8,273 7,567 Public safety 40,824 39,663 - - 40,824 39,663 Public works 8,195 8,805 - - 8,195 8,805 Economic development 9,264 5,511 - - 9,264 5,511 Culture and recreation 15,833 15,912 - - 15,833 15,912 Interest and fees 232 298 - - 232 298 Wastewater - - 21,237 19,111 21,237 19,111 Solid waste collection - - 11,597 10,542 11,597 10,542 Golf course - - 1,133 1,012 1,133 1,012
Total expenses 82,621 77,756 33,967 30,665 116,588 108,421
Net program revenue over (under) expenses (52,356) (47,691) 1,509 4,198 (50,847) (43,493)
General revenue 55,636 54,085 719 878 56,355 54,963 Change in net position - "net revenue (expenses)" 3,280 6,394 2,228 5,076 5,508 11,470 Net position – Oct. 1 145,680 139,286 125,537 120,461 271,217 259,747
Net position – Sept. 30 $148,960 $145,680 $127,765 $125,537 $276,725 $271,217
Business-type Activities (BTA)
As presented in the table above, all BTA expenses were paid with program revenue, mostly charges for services, in both years, which is normal. Charges for services were essentially unchanged from the prior year, because there were no rate increases and customer growth was relatively small.
BTA expenses increased 11% for each service (wastewater, solid waste and golf), which is discussed further in the fund analysis section. No rate increases were projected in FY 2018, but rate increases are projected in future years.
City of Largo, Florida Management’s Discussion and Analysis September 30, 2017
2017 Comprehensive Annual Financial Report | 11

Governmental Activities (GA) GA Revenues and Expenses - As presented in the table above, Total GA Expenses grew 6%, primarily related to Economic Development (ED), which is discussed in the Housing Fund area. Excluding ED expenses, Total GA expense growth was less than 2%.
GA program revenues paid 37% and 39% of GA expenses in FY 2017 and FY 2016, respectively. This means most GA expenses were paid with general revenue, mostly by taxes. Recovering almost 40% of GA service costs with program revenue is mostly attributable to collection of stormwater fees, fire/EMS fees (paid by Pinellas County), building permits and recreation/parks/arts fees.
While certain GA service costs can be paid with program revenue, most costs are difficult to recover through program revenue, because of collection and assessment difficulties, including services such as: parks, road maintenance and library services. These types of services are usually paid with taxes, except in limited situations such as toll roads, or through partial charges such as park facility rentals, because program revenues are not as practical to assess and collect. The extent of cost recovery also depends on each government's revenue structure and policies.
Fun Fact - Of Total FY 2017 GA revenue (program and general revenue combined), 24% came from property taxes and 31% came from charges for services, which is similar to the prior year. This indicates these revenues' significance for funding Governmental Activities and that property taxes is not the primary GA revenue source.
GA Charges for Services - As presented in the table below, Total GA Charges for Services increased $870,000 or about 3%. Most of the increase was due to payments from Pinellas County for Fire and EMS services (Public Safety), due to approved budget increases.
Construction services fees generated $600,000 less revenue (Economic Development), due to a reduction in development activities, which had reached a record level in the prior year and would have been difficult to sustain. Culture and Recreation charges increased, due mostly to increased program participation and a variety of small rate increases.
Governmental Activities (GA) Charges for Services ($ in thousands)
Major Function FY 2017 FY 2016 Increase (Decrease)
$ %
General Government $3,241 $3,172 $69 2.2%
Public Safety 9,975 9,057 918 10.1%
Public Works 5,849 5,869 (20) 0.0%
Economic Development 2,390 2,921 (531) (18.2%)
Culture and Recreation 5,076 4,642 434 9.4%
Total $26,531 $25,661 $870 3.4%
City of Largo, Florida Management’s Discussion and Analysis September 30, 2017
2017 Comprehensive Annual Financial Report | 12

GA General Revenue - Total GA General Revenue (mostly taxes) pays approximately 66% of GA Expenses and is summarized in the table below. Of all GA General Revenue, only property taxes can be increased by the City, because tax rates are set at their maximum or the City does not control the revenue source, as with State Shared Revenue. The property tax millage rate did not change from FY 2016, but property tax revenue increased, due to increases in taxable values related to continued improvement in the economy. Even with the revenue increase, FY 2017 total taxable values were $678 million lower than in FY08 (the highest level in the past ten years), which shows the significant impact of the Great Recession and subsequent slow recovery.
The percentage of taxable value to assessed value declined to 67% in FY17 from 70% in FY08, which is the result of higher exemptions, especially an additional homestead exemption and the Save Our Homes exemption, which was made "portable" between homesteads since FY08. More information on property values and exemptions is available in Schedule H of the Statistical Section.
Local Option Sales Tax revenue and State Shared revenue (mostly sales taxes) increased, because of continued improvement in the economy. CST continued to fall, albeit more slowly, due mostly to changes in customer behavior, including a shift away from cable services toward less expensive Internet-based options. Changes in cable and fiber providers likely contributed to the decrease, due to increased competition and bundling of services at lower costs. A continued decline in CST is likely.
Governmental Activities (GA) Major General Revenue ($ in millions)
Major General Revenues FY 2017 FY 2016 Increase (Decrease) $ %
Property Tax $21.0 $19.3 $1.7 8.8%
Utility Tax and Franchise Tax 14.2 14.1 0.2 1.4%
Sales Tax (local option) 8.3 8.1 0.2 2.5%
Communications Services Tax (CST) 2.9 2.9 0.0 0.0%
Shared Revenue (State) 8.5 8.2 0.3 3.7%
Total $54.9 $52.6 $2.3 4.4%
Major GA General Revenues increased 4.4% compared to a 5% increase last year, due mostly to continued economic improvement, which created higher property values and generated higher sales taxes. Most GA General Revenue is discussed in more detail in the General Fund section, which is where it is originally recorded.
GA Expenses - The following graph presents GA expenses for the past five years by Function, which is useful in identifying larger trends.
A "Function" is a group of similar activities, for example, the Public Safety Function includes police and fire rescue activities. Most Functions experienced little or no growth over the past five years, due budget reductions made during the Great Recession and slow recovery.
About half of total GA expenses relate to Public Safety activities, which is normal for the City. Most of the increase in Public Safety expenses is related to an increase in the net pension liability and expense of and additional police and fire personnel based on the long-term public safety staffing plan. Public Safety salaries and benefits also increased, due to new labor agreements.
City of Largo, Florida Management’s Discussion and Analysis September 30, 2017
2017 Comprehensive Annual Financial Report | 13

Most of the increase in General Government expenses related to normal salary, normal benefit cost increases and selected one-time wage compression adjustments that were made after several years of salary freezes in order to remain competitive in the labor market.
GA “Net” Expenses - The GASB requires a presentation of GA “net expenses”, which are total GA expenses minus related program revenue (non-tax revenue), mostly charges for services. This presentation shows the percentage of total expenses paid with general revenue, mostly taxes.
The table below summarizes the financial statement presentation of net expenses. Based on the table, about 63% of total GA expenses were paid with general revenue, which means 37% of total GA expenses were paid with program revenue, mostly charges for services, which is slightly different than last year (60% and 40%, respectively).
Governmental Activities - FY 2017“Net” Expense ($ in millions)
TotalExpense
ProgramRevenue
NetExpense
Net Expense as a % of
Total Expense
General Government $ 8.3 $ 3.4 $4.9 59% Public Safety 4 0.8 1 1.5 29.3 72% Public Works 8.2 6.0 2.2 27% Economic Development 9.3 4.0 5.3 57% Culture and Recreation 1 5.8 5.4 10.4 66%
Total $8 2.4 $3 0.3 $5 2.1 63%
It is difficult to pay for most GA expenses with program revenue, because many GA services are not the types of services where fees are practical or efficient to charge and collect, such as police investigations, fire suppression, library and general government administration. Some GA services lend themselves to recovery through user charges, such as recreation, special duty police services and building permitting.
City of Largo, Florida Management’s Discussion and Analysis September 30, 2017
2017 Comprehensive Annual Financial Report | 14
Function

Based on the table above, the Public Safety Function (police and fire rescue activities) reported the lowest program revenue as a percentage of expenses, which is normal and means the Public Safety Function requires more general revenue (mostly taxes) to support their operations. The vast majority of Public Safety Program Revenue is related to Fire/EMS revenues paid by Pinellas County for fire services provided to unincorporated areas of the Largo Fire District and for county-wide EMS.
The Public Works Function reported the highest percentage of program revenue, which is mostly related to stormwater user fees, which pays for all stormwater operating expenses and small capital improvements.
The Economic Development Function also reported a relatively high percentage of program revenue, which is mostly due to building permits, building inspections and housing grants.
Business-type Activities (BTA) – Three enterprise funds comprise all BTA: Wastewater (collection, treatment and disposal), Solid Waste collection (garbage, brush, bulk items and recyclables) and a Golf Course. Individual fund information is presented in the Proprietary Fund financial statements.
Key financial metrics for BTA include:
• Total BTA program revenue was approximately the same as in the prior year, because there wereno user charge (rate) increases. BTA rate increases have not been required since 2007, duelargely to improved efficiency, low inflation, cost reductions and wage freezes.
• Wastewater and Solid Waste revenues are not growing significantly, because the City is virtually atbuild-out and re-development growth is insignificant relative to the existing base. Wastewaterrevenue also declines when properties are annexed, because the 25% surcharge is removed.
• Wastewater operating income was $1.5 million lower than the prior year (38%), due mostly to higherrepair and maintenance costs. Several planned maintenance projects were conducted this yearto repair and “tighten-up” the collection system ($1 million extra) as part of an ongoing effort toreduce inflow an infiltration in the collection system.
• Golf course revenue was $100,000 higher than the prior year, due to better weather, enhancedmarketing and other golf course closures in Pinellas County. The Golf Course has continued tocover all of its normal operating expenses, except for depreciation and the General Fundadministrative charge, which has been waived for several years.
“GOVERNMENTAL” FUNDS DISCUSSION and ANALYSIS (Individual fund, “small-picture” focus)
Governmental Fund reporting focuses on “major” funds” (larger funds) and measures short-term flows of financial resources, like cash. This is different from the “big-picture” focus on Governmental Activities, which measures the flow of economic resources using the accrual basis of accounting.
The City reported the same five major funds over the past two fiscal years: General, Local Option Sales Tax, SHIP, HOME, and CDBG. These funds comprise the majority of Governmental Activities.
General Fund. The General Fund is the City's largest fund and accounts for the majority of Governmental Activities. The next several pages highlight financial activity in the General Fund.
Fund Balance – The following graph presents the General Fund's fund balance categories for the past ten years, which starts at approximately the beginning of the Great Recession.
• Committed & Assigned - A large part of the Committed & Assigned fund balance is appropriated tobalance each following year's budget, because budgeted expenditures usually exceeded estimatedrevenues. This amount is not available for additional appropriations unless the subsequent year'sbudget is amended.
City of Largo, Florida Management’s Discussion and Analysis September 30, 2017
2017 Comprehensive Annual Financial Report | 15

• On a positive note, the amount appropriated for the following year's budget has decreased sinceFY 2011. This means there is a smaller difference between the following year's budgeted revenuesand budgeted expenditures, which resulted from several years of budget reductions during therecession and subsequent slow recovery.
At year end, $1.7 million was committed for the FY 2018 budget compared to $1.9 million at the end of the prior year, which is 2.2% and 2.8% of the budgeted expenditures, respectively. The reduction in the amount committed for next year's budget means that next year's budget is closer to being balanced, which is a positive development. Most of the fund balance committed for the following year's budget is never used, because of normal employee turnover and prudent management.
The amount committed for the following year's budget is relatively low compared to prior years and is also below the average annual under-expenditure percentage of 4%-5% of the total budget. This means the amount committed will likely not be expended and can be carried forward to the next year.
Part of the Committed & Assigned fund balance is also for outstanding purchase orders (PO's) of $1.6 million at the end of FY 2017 compared to $1.2 million at the end of FY 2016. Outstanding PO's reflect a claim against the current year's budget and most PO's are usually filled shortly after year end.
Approximately $2 million was also assigned for earned, but unpaid, vacation leave at the end of the last two years. Unpaid vacation leave is recorded as a liability and as an expense in proprietary funds and at the government-wide reporting level, but it cannot be recorded as a liability and expenditure in governmental funds that use the modified accrual basis of accounting; therefore, an “assignment” is recorded to reflect the potential impact on fund balance if the amounts were paid-out early in next year.
Unassigned fund balance - The Unassigned fund balance is sometimes called a “rainy day” or emergency reserve. This amount is available to appropriate, if needed, to compensate for revenue shortfalls, expenditure increases, disasters or to seize unexpected opportunities.
The Unassigned fund balance has declined significantly from its highest level in FY 2008; however, it increased by $2.6 million in FY 2017 and by $2.3 million in FY 2016, which are positive developments.
City of Largo, Florida Management’s Discussion and Analysis September 30, 2017
2017 Comprehensive Annual Financial Report | 16

The unassigned fund balance has declined significantly since FY 2008, which has reduced the City capability to compensate for unexpected events, such as natural disasters. The main cause of the FY 2017 increase was related to a one-time legal settlement of $1 million (an additional $600,000 will be recorded in FY 2018).
Of the $2.6 million increase in FY 2017, $1 million (38%) was due to a one-time legal settlement. The FY 2016 increase was due to revenues increasing more than expenditures and a $1.2 million decrease in the amount appropriated to balance the following year's budget.
The Unassigned fund balance increased significantly in FY 2017 and FY 2016, which are positive developments. Based on current projections, a question remains as to whether the unassigned fund balance can be maintained and grown even more before the next recession occurs.
Fund Balance Policy - The City Commission adopted a General Fund balance policy in FY 2016, which establishes a minimum level and a target level (desired level) for "Unrestricted" fund balance. The Unrestricted fund balance is defined by the Government Finance Officers Association (GFOA) as a combination of the committed, assigned and unassigned fund balances. Florida Statutes set no minimum fund balance requirement, except that total fund balance must not be negative.
The GFOA's Unrestricted fund balance minimum target level is based on maintaining two months of budgeted expenditures (2months/12months) in the Unrestricted fund balance, which equals approximately 17% of annual expenditures. The Unrestricted fund balance is most useful for managing cash flow, but is usually not all available for appropriation if needed, unless established commitments or assignments can be removed, which is not always possible.
Since much of the Unrestricted fund balance may not be available for appropriation, because it is already committed or assigned, the Unrestricted fund balance is less useful as a measurement of an available emergency or “rainy day” fund.
The Unassigned fund balance is completely available for appropriation, so it is a better measurement of an emergency fund. The most common methods of determining and evaluating the sufficiency of an Unrestricted or Unassigned fund balance are:
• As an absolute dollar amount ("pick a number", such as $1 million)• As a percentage of the current year's projected or budgeted revenues or expenditures• As a percentage of the next year's budgeted revenues or expendituresNote: As with the Unrestricted fund balance, any “projected” ending fund balance cannot be appropriated, because the actual amount is unknown.
Question: How much of an Unrestricted or Unassigned fund balance should the General Fund have?
Answer: Defining a “one size fits all” fund balance policy is impossible, because each governments' fiscal characteristics are different.
City of Largo, Florida Management’s Discussion and Analysis September 30, 2017
2017 Comprehensive Annual Financial Report | 17
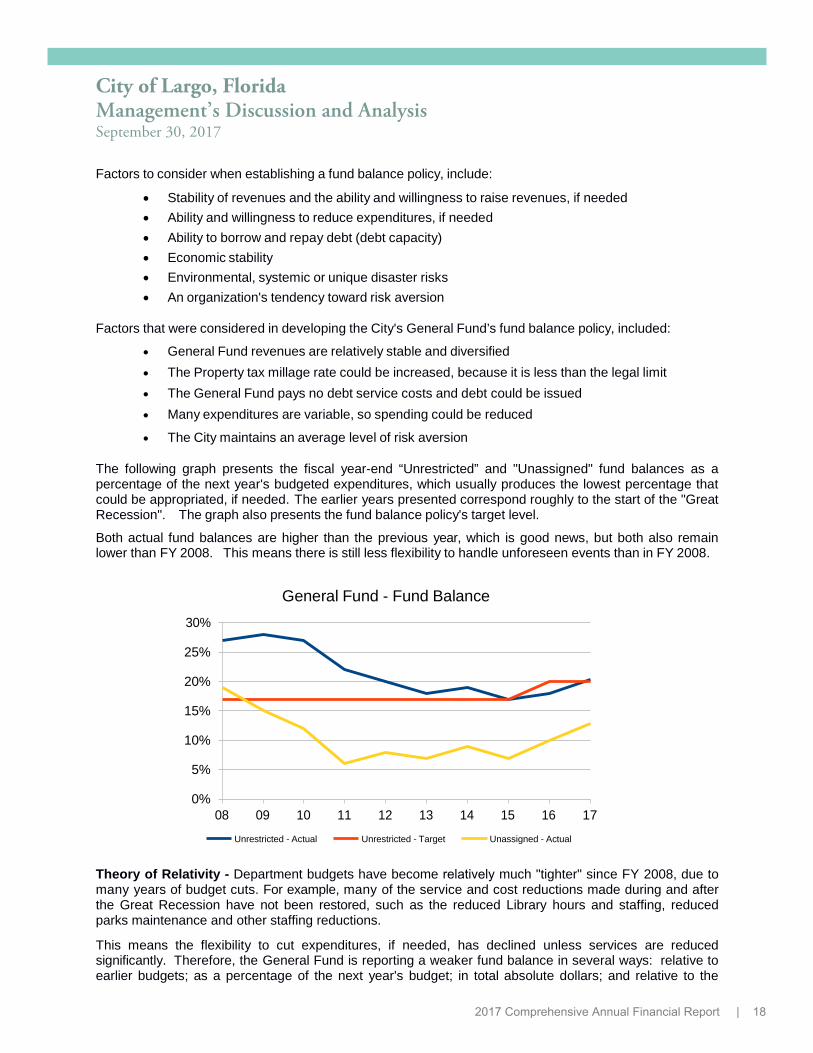
Factors to consider when establishing a fund balance policy, include:
• Stability of revenues and the ability and willingness to raise revenues, if needed• Ability and willingness to reduce expenditures, if needed• Ability to borrow and repay debt (debt capacity)• Economic stability• Environmental, systemic or unique disaster risks• An organization's tendency toward risk aversion
Factors that were considered in developing the City's General Fund’s fund balance policy, included:
• General Fund revenues are relatively stable and diversified• The Property tax millage rate could be increased, because it is less than the legal limit• The General Fund pays no debt service costs and debt could be issued• Many expenditures are variable, so spending could be reduced
• The City maintains an average level of risk aversion
The following graph presents the fiscal year-end “Unrestricted” and "Unassigned" fund balances as a percentage of the next year's budgeted expenditures, which usually produces the lowest percentage that could be appropriated, if needed. The earlier years presented correspond roughly to the start of the "Great Recession". The graph also presents the fund balance policy's target level.
Both actual fund balances are higher than the previous year, which is good news, but both also remain lower than FY 2008. This means there is still less flexibility to handle unforeseen events than in FY 2008.
30%
General Fund - Fund Balance
25%
20%
15%
10%
5%
0% 08 09 10 11 12 13 14 15 16 17
Unrestricted - Actual Unrestricted - Target Unassigned - Actual
Theory of Relativity - Department budgets have become relatively much "tighter" since FY 2008, due to many years of budget cuts. For example, many of the service and cost reductions made during and after the Great Recession have not been restored, such as the reduced Library hours and staffing, reduced parks maintenance and other staffing reductions.
This means the flexibility to cut expenditures, if needed, has declined unless services are reduced significantly. Therefore, the General Fund is reporting a weaker fund balance in several ways: relative to earlier budgets; as a percentage of the next year's budget; in total absolute dollars; and relative to the
City of Largo, Florida Management’s Discussion and Analysis September 30, 2017
2017 Comprehensive Annual Financial Report | 18

moderate level of inflation over the past ten years. In other words, even if the unassigned fund balance were to return to the FY 2008 dollar or percentage levels, it would still be relatively lower than it was in FY 2008.
Significant fund balance improvements have been made over the past two fiscal years; however, the City is not as well prepared to face the next recession or an emergency compared to FY 2008. If future budget reductions are required, they will have to be larger and will have to be made sooner than in the past, because there is less flexibility to make gradual reductions with a lower fund balance to appropriate.
It must be noted that any normal level of Unrestricted or Unassigned fund balance is usually unable to compensate for every economic downturn or disaster, especially the larger ones. An Unrestricted or Unassigned fund balance is just one tool to provide temporary fiscal stability until unusual conditions improve or to provide time for corrective and restorative actions to be taken in a rational manner.
Long-term projections indicate that the General Fund's Unrestricted and Unassigned fund balances will remain relatively low over the next five years.
General Fund Revenue. The following graph presents the General Fund's largest revenues for the past five years, which typically comprise 80%-85% of total General Fund revenue.
The graph's main message is there has been low or no growth in most major revenues over the last five years, except in property taxes, which has made it difficult to maintain service levels, because most costs have been increasing.
Property tax revenue increased $1.7 million or 9%, due to an increase in taxable values, which includes some new construction and annexations. The millage rate remained constant at 5.37 mills. This was the fourth taxable value increase since 2008 and indicates the economy continues to improve; however, FY 2017 taxable values were still $700 million lower than in FY 2008 (15% lower) even including new construction and annexations, which shows the significant impact of the Great Recession and slow recovery.
City of Largo, Florida Management’s Discussion and Analysis September 30, 2017
2017 Comprehensive Annual Financial Report | 19

Of all major revenues, only property tax and service charges can be increased by the City. State legislation has also been passed and more is proposed that limits property tax revenue growth. All other revenues are uncontrollable, because rates are set at the maximum level or revenue is determined by agreement or law.
Electric utility taxes and franchise fees have been essentially flat over the past three years, which is partly related to a decline in fuel prices and lower consumption, both of which reduced the tax base. Other major factors that reduce the tax base include: weather variations (milder or harsher winters and summers), greater voluntary energy conservation (turning-up the air and turning-down the heat), more residential and commercial solar installations and replacement of less efficient equipment, especially air conditioners and major appliances like TV’s, washing machines, clothes dryers and water heaters.
Any revenue source that is “flat”, is actually declining in relative terms, because of normal inflation and service level increases. Also, some major costs may increase differently than normal inflation, including employee healthcare, insurance and fuel.
State Shared revenues increased $200,000 or 3%, due to continued economic improvement, which generated higher sales taxes. The increase, while still a positive development, was only half as much last year, which indicates the economy has begun to level-off.
Fire and EMS revenue from the County increased $600,000 or 7%, due mostly to renegotiation of the service contract and an approved increase in the budget, partly due to additional positions authorized by the public safety staffing plan. This revenue paid approximately 50% of the General Fund’s Fire Rescue costs in FY 2017 and has been the third largest General Fund revenue source for many years.
Communications Services Tax (CST) was essentially flat (really a decline in relative terms), due partly to increased price competition, new service providers entering the market and lower charges related to bundling of services, all of which reduced the CST tax base. Many customers also continue to “cut the cord” for land-line based services, due to the increase in Internet-based communications services at lower costs. Almost all Florida governments have experienced similar CST revenue declines, based on a review of state disbursements, so this is not a problem that is just affecting the City of Largo.
FY 2017 CST revenue is $500,000 lower than in FY13, or 15%. Part of the decline is due to the receipt of additional “one-time” revenue generated in the earlier years from a State audit; however, CST revenue has declined even after adjusting for the additional audit revenue. Current projections do not indicate any future growth; therefore, this revenue will continue to decline relative to the budget.
Major Revenue Diversification. The following graph presents the General Fund's Major Revenues as a percentage of total General Fund revenue for the past ten years, which helps to identify trends in reliance on each revenue. There have been some changes over the past ten years.
City of Largo, Florida Management’s Discussion and Analysis September 30, 2017
2017 Comprehensive Annual Financial Report | 20

Property tax reliance has increased over the past several years from 23% of total revenue to 30%, because property tax is one of the few controllable General Fund revenues. The millage rate was increased gradually from 3.65 in FY 2008 to 5.37 in FY 2017 in response to a decline in taxable values, slow or no growth in other revenues and rising costs.
With a ten mill cap and increased State restrictions, the City has less flexibility to increase the millage rate now than in FY 2008, both legally and practically. Since most major revenues are not controllable by the City, greater reliance is likely to be placed on property taxes in the future to the extent possible and practical.
Reliance on Electric Utility Tax and Franchise Fees has dropped by about 2 percentage points and reliance on State Shared Revenue has declined about 1 percentage point. These revenues are not controllable by the City, because of statutory rate caps and economic constraints.
Reliance on Fire/EMS service charges has grown by 2 percentage points, due to growth in the Fire/EMS budget and contractual changes, which has increased the revenue received from Pinellas County. Reliance on other Service Charges has remained close to 9% of total revenue with some fluctuation between years, even though services charges are adjusted periodically based on an evaluation of the cost of providing services, elasticity of demand, competition and market conditions.
Even with the changes over the past ten years, the General Fund’s major revenues remain relatively diversified. Current projections indicate that greater reliance will have to be placed on Property Taxes in the future, because it is one of the few revenues that can be controlled by the City.
Fun Fact - Combining Fire/EMS Service Charges and Other Service Charges makes Total Service Charges the second largest General Fund revenue source in FY 2017 at 22%, pushing it just ahead of Electric Utility and Franchise taxes at 18%. Total Service Charges were tied for the second largest source in FY 2008 at 20%.
City of Largo, Florida Management’s Discussion and Analysis September 30, 2017
2017 Comprehensive Annual Financial Report | 21
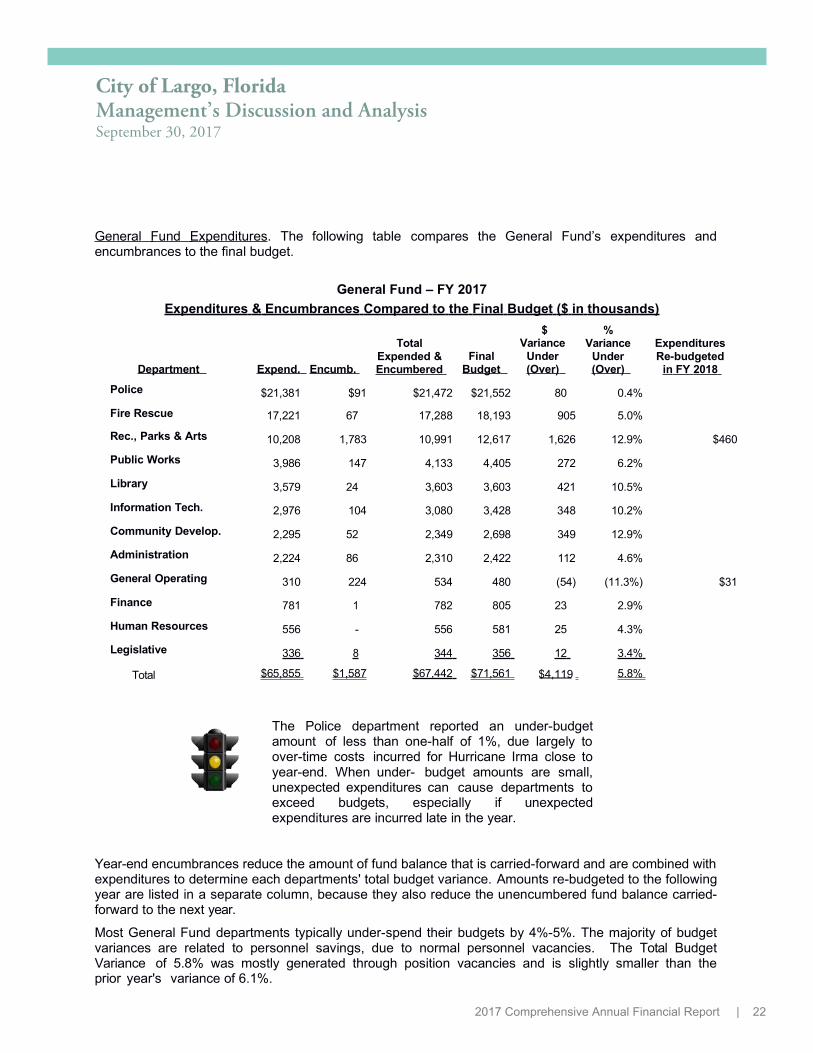
General Fund Expenditures . The following table compares the General Fund’s expenditures andencumbrances to the final budget.
General Fund – FY 2017
Expenditures & Encumbrances Compared to the Final Budget ($ in thousands)
Department Expend. Encumb.
TotalExpended &Encumbered
Final Budget
$Variance
Under(Over)
%Variance
Under(Over)
ExpendituresRe-budgeted
in FY 2018
Police $21,381 $91 $21,472 $21,552 80 0.4%
Fire Rescue 17,221 67 17,288 18,193 905 5.0%
Rec., Parks & Arts 10,208 1,783 10,991 12,617 1,626 12.9% $460
Public Works 3,986 147 4,133 4,405 272 6.2%
Library 3,579 24 3,603 3,603 421 10.5%
Information Tech. 2,976 104 3,080 3,428 348 10.2%
Community Develop. 2,295 52 2,349 2,698 349 12.9%
Administration 2,224 86 2,310 2,422 112 4.6%
General Operating 310 224 534 480 (54) (11.3%) $31
Finance 781 1 782 805 23 2.9%
Human Resources 556 - 556 581 25 4.3%
Legislative 336 8 344 356 12 3.4%
Total $65,855 $1,587 $67,442 $71,561 $4,119 5.8%
The Police department reported an under-budgetamount of less than one-half of 1%, due largely toover-time costs incurred for Hurricane Irma close toyear-end. When under- budget amounts are small,unexpected expenditures can cause departments toexceed budgets, especially if unexpectedexpenditures are incurred late in the year.
Year-end encumbrances reduce the amount of fund balance that is carried-forward and are combined withexpenditures to determine each departments' total budget variance. Amounts re-budgeted to the followingyear are listed in a separate column, because they also reduce the unencumbered fund balance carried-forward to the next year.
Most General Fund departments typically under-spend their budgets by 4%-5%. The majority of budgetvariances are related to personnel savings, due to normal personnel vacancies. The Total BudgetVariance of 5.8% was mostly generated through position vacancies and is slightly smaller than theprior year's variance of 6.1%.
City of Largo, Florida Management’s Discussion and Analysis September 30, 2017
2017 Comprehensive Annual Financial Report | 22

Budget variances greater than 10% are discussed below.
General Operating (11.3% over budget) – All of the $54,000 over-budget amount was caused by theissuance of an emergency purchase order (PO) for $220,000 very near year-end related to FEMArequired debris monitoring services as the result of Hurricane Irma, which struck Largo in earlySeptember. Only $100,000 of the PO was expended and the remaining $120,000 of the unexpendedPO was cancelled in FY 2018; therefore, the $54,000 over budget amount was not realized. A new POfor $50,000 was issued in FY 2018 for any additional debris monitoring costs that might be incurred andwill be charged to the FY 2018 budget.
All debris monitoring costs were able to be absorbed in the FY 2017 GO Department budget,because repairs and maintenance costs were under-budget by $30,000, utilities were under-budget by$66,000 and the new website costs were under-budget by $20,000.
Recreation, Parks & Arts (12.9% under budget) – Most of the variance was related to the following items:An FDOT grant for median beatification in the amount of $445,000 was re-budgeted to FY 2018; fourparking lot resurfacing projects totaling $310,000 were deferred and will be re-budgeted at a later date;grounds maintenance costs were under-expended by $141,000, due to contractor non-performance;department -wide utility costs were under-budget by $119,000; summer campy programing was reducedby 2 weeks, due to changes in the school year, which resulted in personnel cost savings of $ 340,000;and a $50,000 FRDAP grant for the Whitesell Complex was not received, so the project was cancelled.
Library (10.5% under budget) - Most of the variance was related to personnel savings of $200,000 dueto normal position vacancies; $33,000 was related to utility savings; and $10,000 was related tocontractual building maintenance savings.
Information Technology (10.2% under budget) - Most of the variance was related to the following items:personnel turnover of $100,000; software service agreement savings of $60,000; desktop devicereplacement savings of $60,000; and a Enterprise Asset Management software cost savings of$50,000.
Community Development (13% under budget) - Most of the variance was related to extendedpersonnel vacancies, including the planning manager, support specialist and office administrator,totaling $260,000 and the Special Magistrate service costs were under budget by $30,000.
Local Option Sales Tax Fund (Major Fund). The one-cent Local Option Sales Tax was originally approved for a ten year period beginning in February 1990 and has been extended three time through voter referendum. “Penny Three” began in FY 2011 and will expire on December 31, 2019 (FY 2020) and Penny Four will begin on January 1, 2020.
Local Option Sales Tax (LOST) revenue can be expended to: finance, design and construct or improve infrastructure; acquire land; and purchase public safety vehicles with a life expectancy of at least five years. LOST revenue cannot be used for operating costs.
The following graph presents LOST revenue for the past twelve years, including the highest year ever recorded in FY 2006. Revenue declined significantly from FY 2006 to FY 2011, due to the Great Recession and slow recovery, but has been gradually increasing as the economy improved.
2017 Comprehensive Annual Financial Report | 23
City of Largo, Florida Management’s Discussion and Analysis September 30, 2017

FY 2017 LOST revenue was $300,000 below budget (4%), but was above the prior year's revenue by $200,000 (3%), which was the sixth year of increases, albeit a smaller increase than previous years’ increases. The economy continues to improve, but has begun to plateau. FY 2017 LOST revenue of $7.3 million was still just below the highest annual amount ever received of $7.4 million in FY06, which shows the significant lack of growth over the past twelve years.
Initial ten-year revenue projections for the City’s share of “Penny Three” were $90 million, but new estimates are closer to $70 million, due mostly to the effects of the Great Recession and partly to increased Internet sales, many of which have not been taxed.
The schedule below summarizes major LOST Fund expenditures during the year.
LOST Fund – FY 2017 Expenditure Summary
Debt Service – Community Center & Highland Rec. $3,535,000 Fire Station #43 Construction 3,363,000 Police Date 911 Systems 402,000 Roadway Improvements 429,000 Public Safety Vehicles 1,691,000 Other Projects 405,000
Total expenditures $9,825,000
The LOST Fund’s fund balance decreased by $2 million to $8 million, because revenue was less than expenditures, which was anticipated and budgeted. The LOST Fund’s fund balance varies, due to normal variability in capital spending and is projected to be totally expended over the last three years of “Penny Three”, which end on December 31, 2019.
The LOST Fund’s fund balance is a good example of a fund balance that could be maintained close to zero, because the LOST Fund pays no operating costs and the cost of related capital expenditures is relatively easy to project, including debt service payments. Some fund balance is usually maintained to cover normal fluctuations in project costs, which may require additional appropriations.
Housing Assistance Funds. The City administers five housing assistance Funds, three of which are Major Funds (SHIP, HOME and CDBG). Housing assistance is offered citywide, but is primarily provided in the City’s Target Area.
2017 Comprehensive Annual Financial Report | 24
City of Largo, Florida Management’s Discussion and Analysis September 30, 2017

Housing/Fair Housing Counseling, Legal Assistance, Homeless Services, Chore Services for Seniors, Public Facilities Improvements, AHD for First-Time Homeowners and other assistance programs.
Information from all funds is presented in the following table to highlight the City's efforts. Additional information on the City’s housing programs is available at: largo.com/department/index.php?fDD=14-0
The down payment assistance program is available citywide for households whose income is below 80% of the median income. Recipients must live in the City or are purchasing a home within the City through Largo’s down payment assistance programs.
The SHIP Fund's major revenue was from the state documentary stamp tax until the State Legislature redirected revenues during the recession and recovery. The Legislature has restored some funding, so about half of SHIP revenue now comes from doc stamps and half comes from loan repayments.
The NSP2 and PCH Funds have no revenues projected, except principal and interest from loan repayments. The HOME Fund receives revenue from Pinellas County and loan repayments. CDBG Fund revenue is primarily from the Federal Government (HUD) and partially from loan repayments.
A fund balance is usually not maintained in HOME, CDBG, PCH or NSP2, because revenue is received on a reimbursement basis after expenditures are made. Loan repayments can generate a temporary fund balance when loan repayments cannot be fully expended before year end.
“ENTERPRISE” FUNDS DISCUSSION and ANALYSIS (Individual fund, “small-picture” focus)
Enterprise Fund reporting generally focuses on “major” funds” (larger funds), but the City only has three enterprise funds, so all three funds are discussed below. Enterprise funds use the same basis of accounting as Business-type Activities at the Government-wide level (accrual), which measures the flow of economic resources and is similar to private sector financial reporting.
The City has reported the same two major funds for several decades, plus one non-major fund, the Golf Course. These funds comprise all of the Business-type Activities reported at the Government-wide level.
The City prides itself on leveraging its housing resources by partnering with Pinellas County, non-profits and developers. Housing assistance, includes: Eviction Protection and Rental Start-up Fee/Utility Connection Deposits, Owner-Occupied/Rental Housing Rehabilitation, Down Payment Assistance,
2017 Comprehensive Annual Financial Report | 25
City of Largo, Florida Management’s Discussion and Analysis September 30, 2017

Enterprise Funds ($ millions)
Wastewater Solid Waste Golf Course
Wastewater Fund - The Wastewater Fund rate structure was changed during FY 2017, but no new revenue was generated by the changes. The 3,000 gallon minimum included in the residential rate was reduced to 0 gallons and the 8,000 maximum was increased to 10,000 gallons to create greater equity between residential rate payers and which brought the residential rate structure more in line with surrounding utilities.
A 20% rate increase is projected in FY 2020, which will be the first increase since FY 2007. Rates have remained steady despite slightly rising costs, due primarily to: three years of salary freezes; a delay in constructing several large Consent Order projects, which resulted in significant debt service savings compared to the costs projected at the last rate increase; and collection system improvements, which have reduced flows and the related collection and treatment costs.
The increase in unrestricted net position is due to additional draws that made on the State Loan during the year for capital expenditures that made during the prior year, which were temporarily financed (paid for) through the fund’s unrestricted net position. The State Loan is a reimbursement-based loan, so funds cannot be requested until amounts are expended and loan reimbursement may take several months.
Solid Waste Fund - The last Solid Waste rate increase was in FY 2007 and a 15% rate increase is projected in FY 2019. Rates have remained steady despite slightly rising personnel and operating costs, due primarily to: three years of salary freezes; an increase in the residential recycling rate primarily related to a shift to single-stream collection instead of separated curb-side collection, which reduced tipping fees and collection costs; improved route management; and no tipping fee increases from the County, which comprise about 30% of the Fund’s operating costs.
Golf Course - The Golf Course's net position decrease (loss) of $84,000 was lower than prior year's loss of $145,000, due to a $130,000 revenue increase and only a $50,000 expense increase from the prior year. Several factors contributed to the revenue increase, including excellent weather, increased marketing efforts and other golf course closures in the area. The Golf Course reported a positive cash flow of $64,000, which means that all of its cash related expenses were covered.
The normal administrative charge to the Golf Course from the General Fund for administrative services, such as HR, IT and Finance services, is still being waived in light of the continued weakness in the golfing industry, which provides additional operating funds for the Gold Course. A rate increase will likely be required over the next five years, subject to operating results, capital replacements and market constraints.
2017 2016 2017 2016 2017 2016
Operating Revenue $22.9 $22.6 $11.2 $10.8 $1.0 $0.8
Operating Expenses $11.7 $10.6 $1.1 $1.0
Operating Income (Loss) ($0.5) $0.2 ($0.1) ($0.2)
Change in Net Position ($0.3) $0.6 ($0.1) ($0.1)
Ending Net Position
$20.4 $18.7
$2.5 $3.9
$2.6 $4.1
$111.7 $109.1 $13.4 $13.7 $2.3 $2.4 Ending Unrestricted Net Position $23.0 $10.6 $6.7 $6.4 $0.3 $0.2
City of Largo, Florida Management’s Discussion and Analysis September 30, 2017
2017 Comprehensive Annual Financial Report | 26
Selected Elements

CAPITAL ASSETS, INFRASTRUCTURE AND DEBT Capital assets. The City's investment in capital assets is summarized in the table below for the past two fiscal years. No significant changes are reported in Governmental Activities, but significant changes were reported in Business-type Activities related to three Consent Order projects in the Wastewater Fund, which will eliminate overflows, eliminate risks associated with using chlorine gas and improve processing.
The three Wastewater projects are expected to be completed in FY 2018, including: Wet Weather, Head- works and Disinfection and Effluent Pumping. Total costs will be approximately $80 million.
Capital assets are depreciated using the straight-line method over each asset’s estimated useful life and comparing total accumulated depreciation to the capital assets’ total cost shows that all assets are less than 50% depreciated, in total (38% GA and 46% BTA). Provisions have been made to replace all major capital assets in the City’s Capital Improvements Program and Long-term Financial Plan, which are available on the City’s web site. Additional information on capital assets can be found in Note IV.C.
Activities ($ millions) Governmen tal Business-ty pe Total
Capital Assets 2017 2016 2017 2016 2017 2016 Land $25 $27 $3 $3 $28 $30 Construction in progress 8 10 100 76 108 86 Buildings and improvements 77 75 7 4 84 79 Improvements other than buildings 64 59 150 145 214 204 Machinery and equipment 41 40 23 21 64 61 Intangible 1 - - - 1 -
Total capital assets 216 211 283 249 499 460 Less accumulated depreciation (81) (75) (212) (201) Net capital assets $135 $136
(131) (126)
$152 $123 $287 $259
Long-term liabilities. The cornerstone of the City's financial condition is its debt policy. Details on all long-term debt is included in Note IV.F.
The following table presents total long-term debt and total future interest payments for Governmental Activities and Business-type Activities (Wastewater Enterprise Fund).
The City has adopted a “pay-as-you-go” policy for most capital purchases, including for most infrastructure. Borrowing is only used for large, infrequent capital projects after considering many factors, including the ability to repay the debt and elated assets' useful lives.
The City has no general obligation debt outstanding. All outstanding debt is 100% secured by pledged revenue from the “Penny for Pinellas” (LOST) or wastewater system revenues.
Governmental Activities' debt was issued in FY 2011 for construction of the Community Center and in FY 2012 for construction of the Highland Recreation Center. Both loans are secured and repaid with Local Option Sales Tax revenue. New Business-type Activities debt was issued in FY 2016 for construction of the three wastewater projects mentioned in the Capital Assets section above.
City of Largo, Florida Management’s Discussion and Analysis September 30, 2017
2017 Comprehensive Annual Financial Report | 27

Activities ($ millions)
Governmen tal Business-type Total
Long-term Liabilities 2017 2016 2017 2016 2017 2016
Community Center $3.0 $4.1 $ - $ - $3.0 $4.1 Highland Recreation Complex 5.6 7.7 - 5.6 7.7 Wastewater Improvements - - 63.4 24.3 63.4 24.3 Net Pension Liability 37.6 39.6 - - 37.6 39.6 Compensated Absences (vacation) 2.6 2.5 0.5 0.5 3.1 3.0 Other Post-employment Benefit (health care) 5.7 5.1 1.3 1.2 7.0 6.3 Other 2.0 1.6 - - 2.0 1.6 Total Long-term Debt $56.5 $60.6 $65.2 $26.0 $121.7 $86.6
Total future interest payments (dependent on final Consent Order Project costs) $0.3 $0.5 $4.3 $2.3 $4.6 $2.8
Fun Fact - The final payment on the Community Center loan and Highland Recreation Center loan will be made in December 2019, which is the end of the tenth year of, “Penny Three” (third ten-year local option sales tax).
The City has received wastewater loan authorization from the Florida Department of Environmental Protection loan program (DEP) to borrow up to $84 million for construction of three “Consent Order” projects that will expand and improve the wastewater collection system, disinfection system and plant head-works. Loan draws are taken after construction payments are made, which helps reduce the cost of borrowing compared to issuing bonds where proceeds are fully "funded" when the bonds are issued.
The City's DEP loans include lower than market interest rates of between 0.46% and 1.07%, depending on each loan segment, and will be repaid over 18 years. Low interest rates plus the fact that most outstanding debt will be retired by the time new debt payments begin means that no wastewater rate increases are required to service the new debt.
Fun Fact - The average interest rate on the DEP loans is approximately 0.75% and estimated savings over conventional borrowing is at least $10 million, net of all borrowing costs.
Another indicator of the City's conservative debt policy debt is the amount of debt outstanding compared to the cost of the City's capital assets. A relatively small percentage of capital assets are financed, even though the percentage increased from the prior year for Business-type Activities (wastewater), because of construction of the three Consent Order projects. These three projects' estimated final cost of approximately $80 million will effectively double the wastewater system's net capital assets.
City of Largo, Florida Management’s Discussion and Analysis September 30, 2017
2017 Comprehensive Annual Financial Report | 28

The table below depicts the relatively low percentage of the City's assets that are financed.
A long-term liability and related expense was also recorded for Compensated Absences (unpaid vacation leave) at year end. Compensated absences may or may not result in additional payments, depending on whether unused leave is taken by employees or is paid at separation.
The City does not pay any portion of retirees' healthcare insurance costs; however, retirees are allowed to remain on the City's healthcare plan by paying the same premiums charged to current employees, which results in an "implicit" subsidy that must be recorded, even though no retiree premium payments are ever made. The estimated subsidized cost of retiree healthcare premiums is recorded as Other Post- Employment Benefits. Other long-term liability are listed in Note IV.F.
Pension Liabilities. According to a recent article from Reuters, ten years from the Great Recession, many US local Government’s pension plans are still worse for the wear. That includes the City of Largo. “Some just cannot grow their way out of it (financial trouble). We have had several years of stellar returns and it barely improved the underfunding situation,” said Mikhail Foux, municipal credit analyst at Barclays, NY.
In 2007, a year before the crisis began, the median pension plan funded level was 92% for state plans and 97% for local plans, according to Wilshire Funding Studies. That fell to 68% for states and 72% for local governments by 2016, according to the most recent data. A lower funded ratio indicates the overall soundness of a pension plan is weaker and more money is required to meet future obligations.
The following table presents information for the City’s Police and Fire Pension Plan.
(1) – Highest Funded Ratio and Lowest Required Contribution since 1992 (2) – Lowest Funded Ratio and Highest Required Contribution since 1992
2017 2016 2017 2016 2017 2016152 $ 123 $ 287 $ 259-64 -24 -72 -3688 $ 99 $ 215 $ 223
Net capital ssets $ 135 $ 136 $ Less related loans payable -8 -12Equity in net capital assets $ 127 $ 124 $ Percent of assets financed 6% 9% 42% 20% 25% 14%
Activities ($ millions)Governmental Business-type Total
Actuarial SurplusReport Date Funded (Deficit)October 1 Ratio millions $ millions % of Pay
122.7% $ 0 10.3 $ 0.0%59.4% $ 5.1 (52.7) $ 36.7%
67.3% 4.3 (43.9) $ 31.6%74.4% $ 3.7 (35.0) $ 28.7%77.5% $ 3.5 (31.8) $ 26.5%
(38.6)73.6% 4.2$ 29.8%
1999 (1)2011 (2)
Last five years 20122013201420152016 70.6% (47.7) 5.1$ 32..3%
City's AnnualRequired Contribution
City of Largo, Florida Management’s Discussion and Analysis September 30, 2017
2017 Comprehensive Annual Financial Report | 29
$
Equity in net capital assets 94% 92% 58% 80% 75% 86%
$
$

The funded ratio trend has been mostly downward since FY 2000, because investment earnings have been below the assumed rate of return. Changes made to actuarial assumptions over the past ten years have also decreased the funded ratio, including: reducing the investment return assumption and increasing participants' life expectancies, which more accurately reflects participants' actual years in retirement.
The long- term goal of any pension plan is to reach a 100% funded ratio, which is when plan assets equal plan liabilities; however, funded ratios above or below 100% are normal in the short-term. The most important factor about a funded ratio is the trend, because it shows whether progress is being made toward fully funding the Plan. The trend for the City’s pension plan over the past ten years has been mostly downward.
A new GASB reporting standard required any unfunded pension liabilities (aka, net pension liabilities) or surpluses (over-funding) to be recorded in the financial statements for the first time in FY 2015. Previously, net pension liabilities and surpluses were only disclosed in the notes. The new standard is intended to more prominently report pension obligations, including additional note disclosures.
The new GASB standard didn’t significantly change how the pension liability was calculated, because the plan’s actuary was already using the valuation method required by the GASB. Recording the Pension Plan's net pension liability in the City's government-wide financial statements created a negative GA unrestricted net position in FY 2015, FY 2016 and FY 2017. The City’s $38 million net pension liability was created mostly by extraordinary investment losses and lower investment gains over the past decade, which have been experienced by most pension plans throughout the country. A summary of the pension liability based on the new reporting standards follows.
Governmental Activities (GA) Net Pension Liability – Prior Year and Current Year
Actuarial Valuation
Date
Total Pension Assets
Total Pension Liability
Net Pension Liability
Unrestricted GA Net Position
Without Net Pension Liability
Unrestricted GA Net (Deficit)
With Net Pension Liability
10/01/16 $127 million $165 million ($38 million) $19 million ($19 million)
10/01/15 $121 million $161 million ($40 million) $19 million ($21 million)
10/01/14 $123 million $155 million ($32 million) $12 million ($20 million)
An Actuarial Valuation Report is prepared every year; however, since the Report is sometimes issued after the CAFR is completed, the City has elected to use the immediately prior Actuarial Valuation Report to ensure information is consistent between years. Pension liabilities are long-term liabilities that are subject to change, so using a prior year's report is permissible under GAAP. This means pension information included in the CAFR will always be one fiscal year in arrears of the latest Actuarial Valuation Report.
As of the report dated 10/01/16, the City’s required pension contribution increased to 32.3% from 29.8%, which was mostly related to actuarial experience losses (certain actual amounts were different than the assumptions). The funded ratio also decreased to 74% from 77%, which means the pension plan had accumulated about 74 cents of assets for every $1 of liabilities.
2017 Comprehensive Annual Financial Report | 30
City of Largo, Florida Management’s Discussion and Analysis September 30, 2017

Question: What is the net pension liability’s effect on the City?
Answer: The City’s is reporting a weaker financial “position” by recording the net pension liability in the financial statements, which was the intent of the new GASB standard.
Recording the net pension liability caused a negative Net Position in the City’s Governmental Activities (negative equity or deficit); however, the net pension liability actually existed previously, was disclosed in the Notes and was calculated similarly, even though it was not recorded in the financial statements. Therefore, recording the net pension liability did not change the City’s underlying financial “condition”, it is just more visible in the financial statements now.
The net pension liability is unique, because it changes mostly based on investment performance and actuarial experience, which is why the net pension liability wasn't required to be recorded in the financial statement previously. The net pension liability may or may not require the use of future assets, as would be the case for a normal liability.
One way to demonstrate the fiscal impact of the $38 million net pension liability is, if the net pension liability was $0 (fully funded), the City's required pension contribution would decline from 32.32% of pay to 15.72%, which is a reduction of $2.6 million annually.
In other words, the 15.72% contribution is the “normal cost” of providing current year benefits for current employees. The additional 16.60% of pay (32.32%-15.72%) is the cost of funding the net pension liability. So, the City’s contribution would decline by over 50% if the plan was fully funded (no net pension liability).
The new pension reporting standard was issued in response significant, permanent and fundamental changes in the nature of pension plan liabilities, including lower projected investment returns, which reduces revenue; longer participant lives, which increase costs; and greater funding volatility, due to more volatile investment conditions. These changes have created unprecedented under-funding in local government pension plans throughout the country, which is likely to continue for the foreseeable future.
Additional information on the Pension Plan can be found in Note V.C and in the Required Supplementary Information located after the Notes. Pension Plan Actuarial reports are available at: http://www.largo.com/department/?structureid=1
Progress was made on reducing the net pension liability’s growth by making pension benefit changes in FY 2013, including: increasing contributions from all employees and reducing benefits for new employees.
The City's net pension liability and required pension contribution are slightly higher than average for most Florida public safety pension plans. Total pension costs were 6% of the total General Fund Budget.
Fun Fact - Police officers and firefighters are the only City employees who participate in a defined benefit pension plan. All other retirement plan eligible employees participate in defined contribution plans.
City of Largo, Florida Management’s Discussion and Analysis September 30, 2017
2017 Comprehensive Annual Financial Report | 31
ECONOMIC CONDITIONS, NEXT YEAR'S BUDGET AND NEXT YEAR'S RATES (FEES)
Economic Conditions. Most global, national, state and local economies continued to improve over the past year and the City is cautiously optimistic about future economic conditions.
Several factors point to a positive short-term economic outlook for the City, including annexations, redevelopment and low debt. The City's infrastructure is in good condition and provisions have been made to replace aging infrastructure, equipment and facilities. Florida tourism remained near record levels, construction starts increased, home values rose, sales taxes grew and unemployment dropped.
Question: Are current economic improvements sustainable?
Answer: Having four relatively positive fiscal years in a row has provided welcomed relief from years of budget c u t s and service reductions. Whether economic conditions can continue to improve as they have is anyone's guess, because the economy continues to be partially supported by artificial stimuli.
After the most derisive presidential campaign in modern history, the country is hardly united and moving in the same direction. What happens in Washington over the next few years is also anyone's guess.
The Federal Reserve is finally increasing interest rates; however, rates remain near historically low levels, which reduces the purchasing power of fixed-income investors like retirees, who comprise a large percentage of City residents. Lower interest rates have also increased the City's pension contributions, because 30% of Plan investments are fixed income securities. What is likely the "best" thing for the economy in the long-run is a return to "normal" rates that encourage saving and keep inflation in check.
After eight years of "recovery", it has been said that the US is closer to the next recession that the last recession, because the ongoing recovery's length is highly unusual. The housing market is very strong, but many homes remain in foreclosure or “under-water”. Personal income growth has been weak, the labor participation rate remains below average and many of the new jobs are lower paying. Auto sales have cooled and the negative effects of looser credit is emerging in the form of increasing loan defaults.
Unemployment figures are somewhat misleading, because many people simply stopped looking for work and are not counted as unemployed, others are employed in marginal jobs and many of those who took "early retirement" would have preferred to keep working. The main questions are: Where are all the good jobs; Where is the growth in wages; and Can everyone who has retired afford to stay retired?
All of the above factors were considered in preparing the City's FY 2018 budget, as much as possible, given the number of unusual conditions that exist and the large degree of uncertainty surrounding the future. It is vital for the City to maintain constant awareness in this unprecedented economic period.
Next Year's Budget and Rates. The FY 2018 property tax rate was increased from 5.37 mills to 5.7413, which was above the “rolled-back” rate and was also above the maximum millage rate that could be adopted with a simple majority vote. The new rate, plus growth in taxable values of 8%, are projected to generate an additional $3.5 million of revenue above the amount budgeted in FY 2017.
The property tax increase was proposed by the City Commission after many discussions about the need to increase the General Fund's fund balance, projected declines in several other major revenues and the need to prepare for potential future State legislation that could create additional tax restrictions.
This was the fifth straight year of property value growth following five straight years of declines. The FY 2018 millage rate remains well beneath the statutory cap of 10 mills, as well as remaining competitive.
Most major revenues are projected to exhibit moderate growth over the next five years. The General Fund budget is usually balanced with fund balance, because estimated expenditures usually exceed estimated revenues; however, the FY 2018 structural imbalance of $1.7 million or 2.2% of expenditures, was one of the lowest in many years, which is a very positive development.
2017 Comprehensive Annual Financial Report | 32
City of Largo, Florida Management’s Discussion and Analysis September 30, 2017

Stormwater, Wastewater and Solid Waste fees will not be increased in FY 2018. A wastewater rate re- structure was implemented in FY 2017, but total revenue remained the same and wastewater rates remain highly competitive. The next projected rate increases are: Solid Waste, FY 2019, 15%;Wastewater, FY 2020, 20%; and Stormwater, FY 2022, 20%, which are subject to change.
Long-term Projections. Most of the City's tax rates are set at the maximum levels allowed by law, except for property taxes, so growth is entirely dependent on growth in the tax base. The Local Option Sales tax was renewed through referendum in November 2017 for a ten-year period beginning on January 1, 2020, which will significantly shape capital spending over the next decade. The City is projected to receive $100 million over the fourth ten-year period of the sales tax.
Pension funding will increase about $900,000 annually beginning in FY 2018, largely because of a reduction in the assumed rate of return from 7.5% to 6.75%. Pension funding remains highly dependent on investment returns. Cost reductions from pension benefit reductions made in 2013 will not be realized for several years.
The Legislature, Governor and voters continue to express a strong desire for lower local taxes, even though Florida has one of the lowest total tax burdens of all 50 states and additional cost-laden state mandates are passed every year. Additional tax exemptions were passed in 2012, including: doubling the homestead exemption to $50,000 (except for public school taxes); imposing a valuation increase cap of 10% on non- homestead properties; making the Save Our Homes exemption portable; and providing a new $25,000 exemption for tangible personal property, which will restrict revenue growth.
An additional $25,000 homestead exemption (except for public school taxes) is slated for the November 2018 ballot, which would affect tax revenue in FY 2020; it is expected to pass.
Fund balances are projected to remain at historic low levels, including in the General Fund, which reduces the City's operating flexibility. Lower fund balances reduce the potential to compensate for revenue declines, which will require more service reductions sooner if revenues decline. Services are continually reviewed to determine if programs can be provided more efficiently or should be eliminated. The significant budget reductions made during the Great Recession and the many slow years of recovery means it is unlikely that additional reductions can be made without reducing services. The City will also be challenged to control salary and benefit increases in an ever-tightening labor market while attempting to maintain a competitive compensation structure.
Despite many consecutive years of budget reductions, the City has adequately maintained or replaced City facilities and infrastructure and the City's workforce is well trained and productive, albeit smaller than it once was at just over 914 Full-time Equivalent positions (one FTE = 2,080 hours). The City remains in good financial condition and is expected to continue providing highly-valued, high-quality services to the Largo community and surrounding area in the future.
ADDITIONAL INFORMATION
Additional information is available on the City's website, at: www.largo.com, including Annual Budget, Long- term Financial Plan & Capital Improvements Program and prior CAFR's. Telephone inquiries may be directed to the Finance Director at (727) 587-6747. Written requests for information may be addressed to the Finance Director, PO Box 296, Largo, FL 33779-0296 or may be emailed to: [email protected]
City of Largo, Florida Management’s Discussion and Analysis September 30, 2017
2017 Comprehensive Annual Financial Report | 33
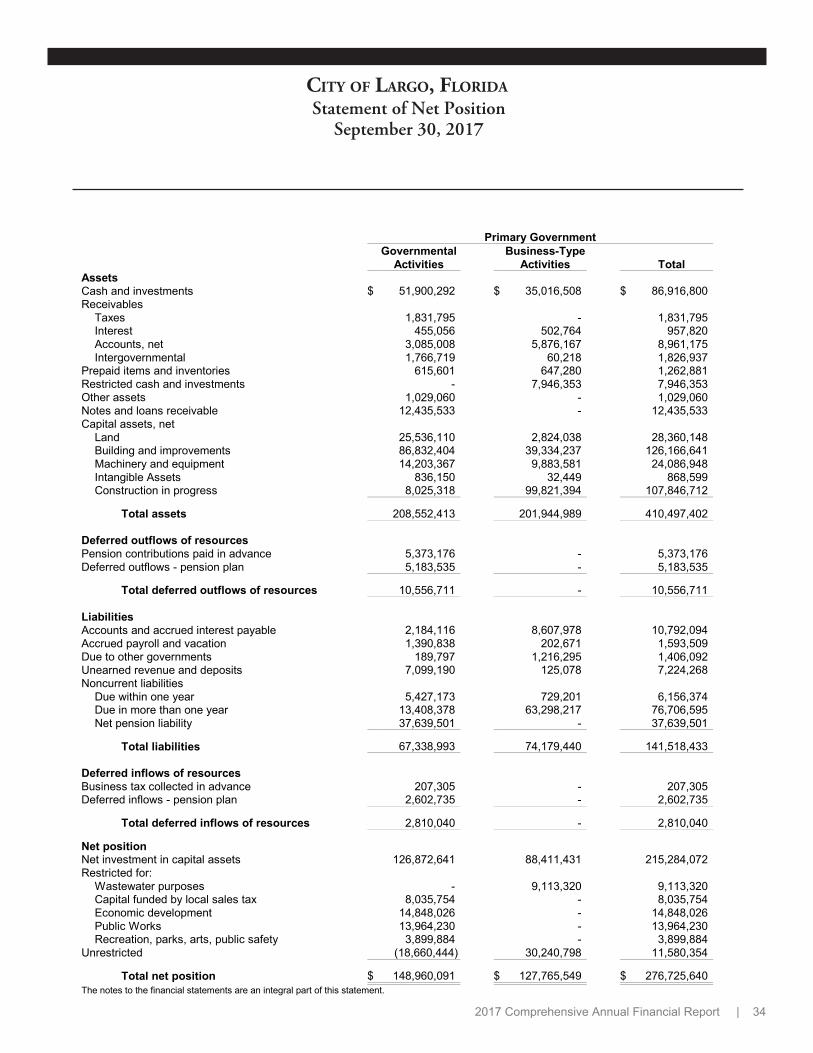
Primary GovernmentGovernmental
ActivitiesBusiness-Type
Activities Total
$ 51,900,292 $ 35,016,508 $ 86,916,800AssetsCash and investments Receivables
Taxes 1,831,795 - 1,831,795Interest 455,056 502,764 957,820Accounts, net 3,085,008 5,876,167 8,961,175Intergovernmental 1,766,719 60,218 1,826,937
615,601 647,280 1,262,881- 7,946,353 7,946,353
1,029,060 - 1,029,06012,435,533 - 12,435,533
Prepaid items and inventories Restricted cash and investments Other assetsNotes and loans receivable Capital assets, net
Land 25,536,110 2,824,038 28,360,148Building and improvements 86,832,404 39,334,237 126,166,641Machinery and equipment 14,203,367 9,883,581 24,086,948Intangible Assets 836,150 32,449 868,599Construction in progress 8,025,318 99,821,394 107,846,712
Total assets 208,552,413 201,944,989 410,497,402
Deferred outflows of resourcesPension contributions paid in advance 5,373,176 - 5,373,176Deferred outflows - pension plan 5,183,535 - 5,183,535
Total deferred outflows of resources 10,556,711 - 10,556,711
2,184,116 8,607,978 10,792,0941,390,838 202,671 1,593,509
189,797 1,216,295 1,406,0927,099,190 125,078 7,224,268
LiabilitiesAccounts and accrued interest payable Accrued payroll and vacationDue to other governmentsUnearned revenue and deposits Noncurrent liabilities
Due within one year 5,427,173 729,201 6,156,374Due in more than one year 13,408,378 63,298,217 76,706,595Net pension liability 37,639,501 - 37,639,501
Total liabilities 67,338,993 74,179,440 141,518,433
Deferred inflows of resourcesBusiness tax collected in advance 207,305 - 207,305Deferred inflows - pension plan 2,602,735 - 2,602,735
Total deferred inflows of resources 2,810,040 - 2,810,040
Net positionNet investment in capital assets 126,872,641 88,411,431 215,284,072Restricted for:
Wastewater purposes - 9,113,320 9,113,320Capital funded by local sales tax 8,035,754 - 8,035,754Economic development 14,848,026 - 14,848,026Public Works 13,964,230 - 13,964,230Recreation, parks, arts, public safety 3,899,884 - 3,899,884
Unrestricted (18,660,444) 30,240,798 11,580,354
Total net position $ 148,960,091 $ 127,765,549 $ 276,725,640The notes to the financial statements are an integral part of this statement.
City of Largo, fLoridaStatement of Net Position
September 30, 2017
2017 Comprehensive Annual Financial Report | 34

This page was intentionally left blank

Program RevenuesNet (Expense) RevenueChanges in Net Position
Primary Government
Functions/Programs ExpensesCharges for
Services
OperatingGrants and
Contributions
CapitalGrants and
ContributionsGovernmental
ActivitiesBusiness-type
Activities TotalGovernmental activites:General government $ 8,272,562 $ 3,241,113 $ 127,652 $ - $ (4,903,797) $ - $ (4,903,797)Public safety 40,824,240 9,975,567 1,482,712 - (29,365,961) - (29,365,961)Public works 8,195,381 5,848,749 7,712 127,249 (2,211,671) - (2,211,671)Economic development 9,263,379 2,389,602 1,263,370 321,004 (5,289,403) - (5,289,403)Culture and recreation 15,833,494 5,075,868 127,096 277,638 (10,352,892) - (10,352,892)Interest and fees 231,542 - - - (231,542) - (231,542)
Total governmental activities 82,620,598 26,530,899 3,008,542 725,891 (52,355,266) - (52,355,266)Business-Type ActivitiesWastewater 21,237,388 22,899,807 37,898 387,195 - 2,087,512 2,087,512Solid Waste 11,596,391 11,118,291 60,218 - - (417,882) (417,882)Golf Course 1,133,075 971,741 1,050 - - (160,284) (160,284)
Total Business-Type Activities 33,966,854 34,989,839 99,166 387,195 - 1,509,346 1,509,346Total primary government $ 116,587,452 $ 61,520,738 $ 3,107,708 $ 1,113,086 (52,355,266) 1,509,346 (50,845,920)
General revenues:21,025,777 - 21,025,777
8,440,054 - 8,440,0548,283,289 - 8,283,2892,870,558 - 2,870,5585,711,599 - 5,711,5998,461,742 - 8,461,742
469,168 443,450 912,618537,996 275,708 813,704
(1,766,817) - (1,766,817)
Property tax Utility tax Sales tax Communication services tax Franchise taxes
State shared revenue Investment earnings Miscellaneous
Special Item: Loss on sale of City property Extraordinary Item: Supreme Court settlement 1,602,462 - 1,602,462
Total general revenues and special and extraordinary items 55,635,828 719,158 56,354,986
Change in net position 3,280,562 2,228,504 5,509,066
Net position - beginning 145,679,529 125,537,045 271,216,574
Net position - ending $ 148,960,091 $ 127,765,549 $ 276,725,640
The notes to the financial statements are an integral part of this statement.
City of Largo, fLoridaStatement of Activities
Year Ended September 30, 2017
2017 Comprehensive Annual Financial Report | 35
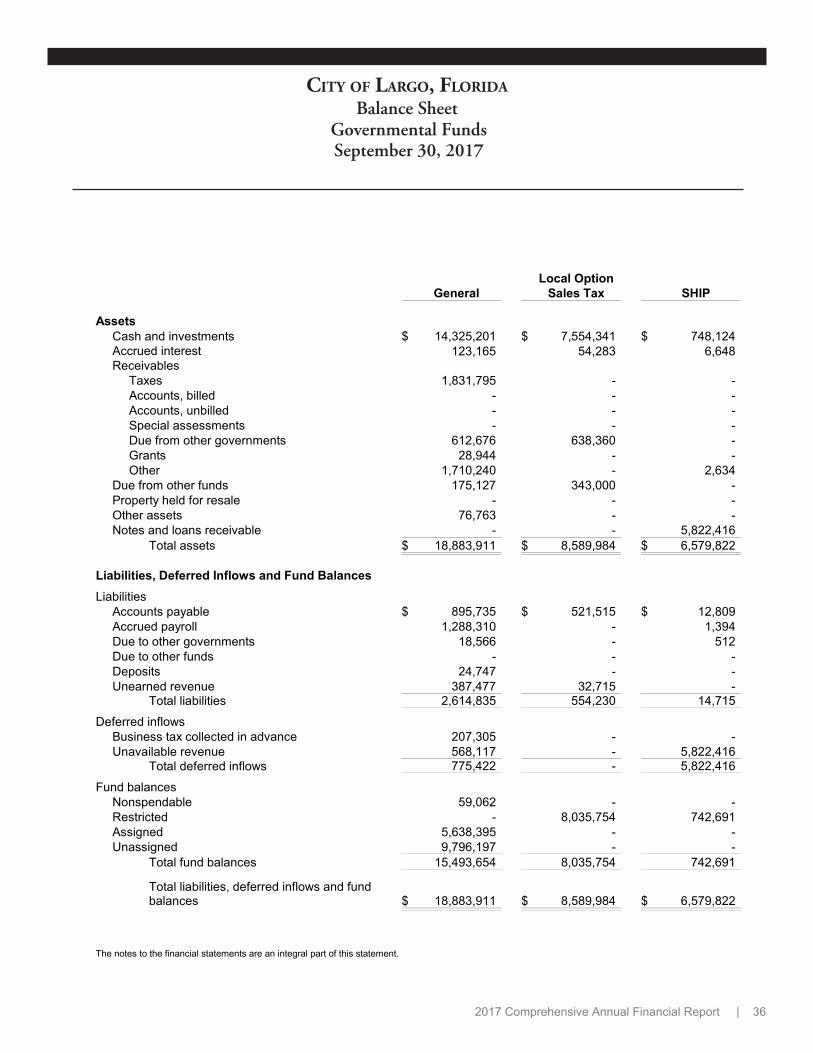
GeneralLocal Option
Sales Tax SHIP
Assets$ 14,325,201 $ 7,554,341 $ 748,124
123,165 54,283 6,648Cash and investments Accrued interest Receivables
Taxes 1,831,795 - -Accounts, billed - - -Accounts, unbilled - - -Special assessments - - -Due from other governments 612,676 638,360 -Grants 28,944 - -Other 1,710,240 - 2,634
Due from other funds 175,127 343,000 -Property held for resale - - -Other assets 76,763 - -Notes and loans receivable - - 5,822,416
Total assets $ 18,883,911 $ 8,589,984 $ 6,579,822
Liabilities, Deferred Inflows and Fund BalancesLiabilities
Accounts payable $ 895,735 $ 521,515 $ 12,809Accrued payroll 1,288,310 - 1,394Due to other governments 18,566 - 512Due to other funds - - -Deposits 24,747 - -Unearned revenue 387,477 32,715 -
Total liabilities 2,614,835 554,230 14,715
Deferred inflowsBusiness tax collected in advance 207,305 - -Unavailable revenue 568,117 - 5,822,416
Total deferred inflows 775,422 - 5,822,416
Fund balancesNonspendable 59,062 - -Restricted - 8,035,754 742,691Assigned 5,638,395 - -Unassigned 9,796,197 - -
Total fund balances 15,493,654 8,035,754 742,691
Total liabilities, deferred inflows and fundbalances $ 18,883,911 $ 8,589,984 $ 6,579,822
The notes to the financial statements are an integral part of this statement.
City of Largo, fLoridaBalance Sheet
Governmental Funds September 30, 2017
2017 Comprehensive Annual Financial Report | 36

HOME CDBG
OtherGovernmental
Funds
TotalGovernmental
Funds
$ - $ - $ 23,602,869 $ 46,230,535- - 222,312 406,408
- - - 1,831,795- - 568,957 568,957- - 488,017 488,017- - 14,604 14,604- - 91,699 1,342,735
147,507 215,006 - 391,4571,093 2,497 24,780 1,741,244
- - 189,000 707,127- - 829,060 829,060- - - 76,763
3,391,272 2,377,272 844,573 12,435,533$ 3,539,872 $ 2,594,775 $ 26,875,871 $ 67,064,235
$ 100,028 $ 79,968 $ 235,923 $ 1,845,978854 4,043 72,140 1,366,741
5,883 - 164,836 189,79741,635 133,492 532,000 707,127
- - 668 25,4153,391,472 2,377,272 354,800 6,543,7363,539,872 2,594,775 1,360,367 10,678,794
- - - 207,305- - 518,304 6,908,837- - 518,304 7,116,142
- - - 59,062- - 24,821,867 33,600,312- - 175,333 5,813,728- - - 9,796,197- - 24,997,200 49,269,299
$ 3,539,872 $ 2,594,775 $ 26,875,871 $ 67,064,235
2017 Comprehensive Annual Financial Report | 37

This page was intentionally left blank
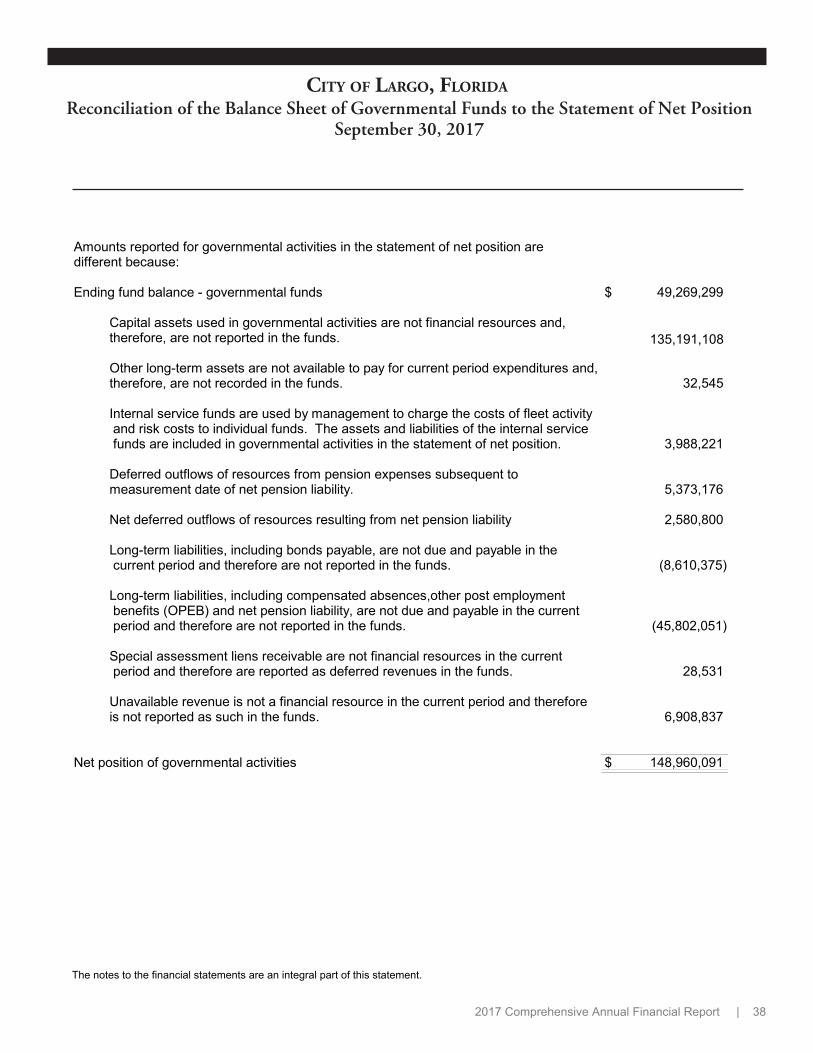
The notes to the financial statements are an integral part of this statement.
Amounts reported for governmental activities in the statement of net position are different because:
Ending fund balance - governmental funds $ 49,269,299
Capital assets used in governmental activities are not financial resources and, therefore, are not reported in the funds. 135,191,108
Other long-term assets are not available to pay for current period expenditures and,therefore, are not recorded in the funds. 32,545
Internal service funds are used by management to charge the costs of fleet activity and risk costs to individual funds. The assets and liabilities of the internal service funds are included in governmental activities in the statement of net position. 3,988,221
Deferred outflows of resources from pension expenses subsequent tomeasurement date of net pension liability. 5,373,176
Net deferred outflows of resources resulting from net pension liability 2,580,800
Long-term liabilities, including bonds payable, are not due and payable in the current period and therefore are not reported in the funds. (8,610,375)
Long-term liabilities, including compensated absences,other post employment benefits (OPEB) and net pension liability, are not due and payable in the current period and therefore are not reported in the funds. (45,802,051)
Special assessment liens receivable are not financial resources in the current period and therefore are reported as deferred revenues in the funds. 28,531
Unavailable revenue is not a financial resource in the current period and therefore is not reported as such in the funds. 6,908,837
Net position of governmental activities $ 148,960,091
City of Largo, fLoridaReconciliation of the Balance Sheet of Governmental Funds to the Statement of Net Position
September 30, 2017
2017 Comprehensive Annual Financial Report | 38

GeneralLocal Option
Sales Tax SHIP
RevenuesTaxes $ 32,642,366 $ 7,263,530 $ -Licenses and permits 5,723,838 - -Intergovernmental 10,146,005 263,219 527,012Charges for services 14,769,087 - -Fines 403,111 - -Interfund charges 3,297,864 - -Contributions and donations 46,806 - -Investment earnings 154,933 51,663 14,791Other 1,490,709 182,336 306,472
Total revenues 68,674,719 7,760,748 848,275
ExpendituresCurrent:
General government 7,072,513 - -Public safety 38,512,103 - -Public works 3,933,036 - -Economic development 2,225,307 - 668,677Culture and recreation 12,563,097 - -
Capital outlay 1,548,814 6,289,883 -Debt service:
Principal - 3,288,343 -Interest - 246,523 -
Total expenditures 65,854,870 9,824,749 668,677
Net change in fund balances 2,819,849 (2,064,001) 179,598
Fund balance - beginning 12,673,805 10,099,755 563,093
Fund balance - ending $ 15,493,654 $ 8,035,754 $ 742,691
The notes to the financial statements are an integral part of this statement.
City of Largo, fLoridaStatement of Revenues, Expenditures, and Changes in Fund Balances
Governmental FundsYear Ended September 30, 2017
2017 Comprehensive Annual Financial Report | 39

HOME CDBG
OtherGovernmental
Funds
TotalGovernmental
Funds
$ - $ - $ 705,365 $ 40,611,261- - 1,465,796 7,189,634
443,303 502,598 1,480,418 13,362,555- - 5,674,650 20,443,737- - - 403,111- - - 3,297,864- - 161,499 208,305- 11,164 167,821 400,372- 281,022 153,767 2,414,306
443,303 794,784 9,809,316 88,331,145
- - - 7,072,513- - 160,083 38,672,186- - 3,998,507 7,931,543
443,303 781,284 1,836,369 5,954,940- - 264,981 12,828,078- 13,500 3,367,020 11,219,217
- - - 3,288,343- - - 246,523
443,303 794,784 9,626,960 87,213,343
- - 182,356 1,117,802
- - 24,814,844 48,151,497
$ - $ - $ 24,997,200 $ 49,269,299
2017 Comprehensive Annual Financial Report | 40

The notes to the financial statements are an integral part of this statement.
Amounts reported for governmental activities in the statement of activities are different because:
Net change in fund balances - total governmental funds $ 1,117,802
Governmental funds report capital outlays as expenditures; however, in the statement ofactivities, the cost of those assets is allocated over their estimated useful lives andreported as depreciation expense. This is the amount by which capital outlay expenseexceeds depreciation expense. 1,411,328
The net effect of various miscellaneous transactions involving capital assets (i.e. sales,trade-ins, and donations) is to decrease net position. (2,242,429)
Revenues in the statement of activities that do not provide current financial resources arenot reported as revenues in the funds. The net effect of revenue accruals may increaseor decrease net position. 635,733
The issuance of long-term debt (e.g. bonds, leases) provides current financial resourcesto governmental funds, while the repayment of the principal of long-term debt consumesthe current financial resources of governmental funds. Neither transaction is reported onthe government-wide financial statements. 3,288,343
Some expenses reported in the statement of activities do not require the use of currentfinancial resources and therefore are not reported as expenditures in governmental funds,such as changes in accrued interest, changes in accrued vacation, otherpost-employment benefits and changes in net pension liability and any related deferredinflows/outflows. (628,494)
Internal service funds are used by management to charge the costs of fleet managementand risk activities to individual funds. The net revenues or loss of certain activities of theinternal service funds are reported with governmental activities. (301,721)
Change in net position of governmental activities (statement of activities) $ 3,280,562
City of Largo, fLoridaReconciliation of the Statement of Revenues, Expenditures, and
Changes in Fund Balances of Governmental Funds to the Statement of Activities Year Ended September 30, 2017
2017 Comprehensive Annual Financial Report | 41
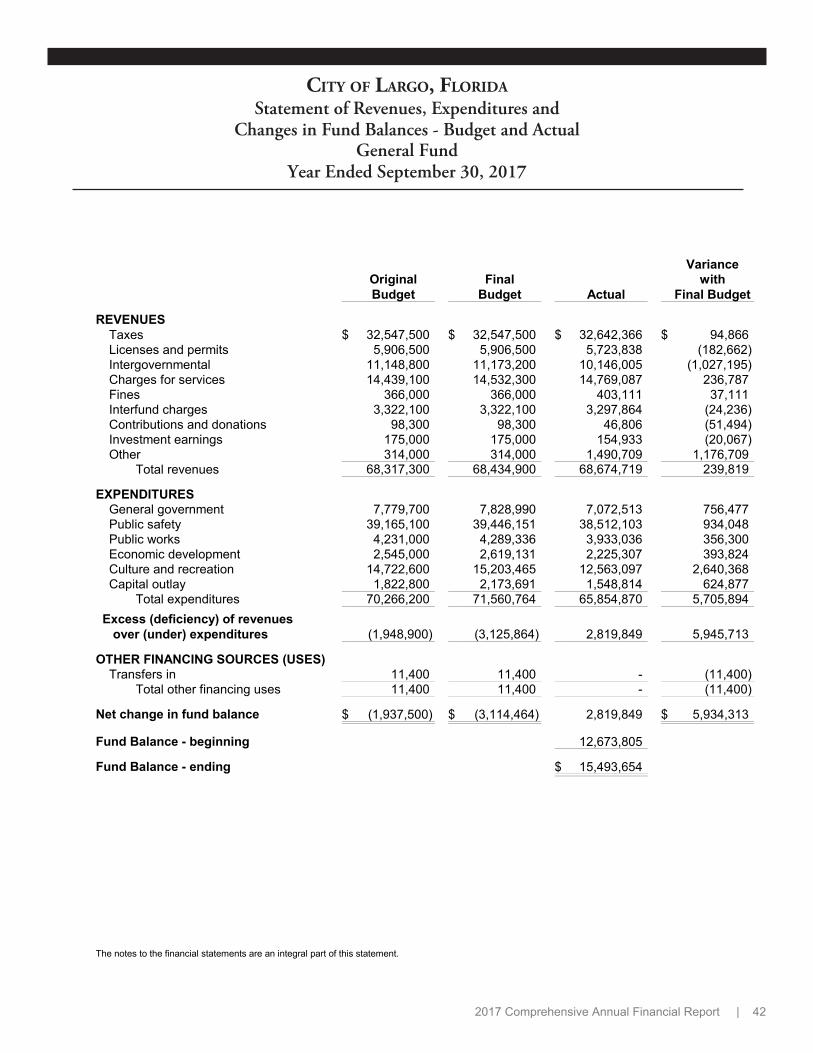
OriginalBudget
FinalBudget Actual
Variancewith
Final Budget
REVENUESTaxes $ 32,547,500 $ 32,547,500 $ 32,642,366 $ 94,866Licenses and permits 5,906,500 5,906,500 5,723,838 (182,662)Intergovernmental 11,148,800 11,173,200 10,146,005 (1,027,195)Charges for services 14,439,100 14,532,300 14,769,087 236,787Fines 366,000 366,000 403,111 37,111Interfund charges 3,322,100 3,322,100 3,297,864 (24,236)Contributions and donations 98,300 98,300 46,806 (51,494)Investment earnings 175,000 175,000 154,933 (20,067)Other 314,000 314,000 1,490,709 1,176,709
Total revenues 68,317,300 68,434,900 68,674,719 239,819
EXPENDITURESGeneral government 7,779,700 7,828,990 7,072,513 756,477Public safety 39,165,100 39,446,151 38,512,103 934,048Public works 4,231,000 4,289,336 3,933,036 356,300Economic development 2,545,000 2,619,131 2,225,307 393,824Culture and recreation 14,722,600 15,203,465 12,563,097 2,640,368Capital outlay 1,822,800 2,173,691 1,548,814 624,877
Total expenditures 70,266,200 71,560,764 65,854,870 5,705,894Excess (deficiency) of revenues
over (under) expenditures (1,948,900) (3,125,864) 2,819,849 5,945,713
OTHER FINANCING SOURCES (USES)Transfers in 11,400 11,400 - (11,400)
Total other financing uses 11,400 11,400 - (11,400)
Net change in fund balance $ (1,937,500) $ (3,114,464) 2,819,849 $ 5,934,313
Fund Balance - beginning 12,673,805
Fund Balance - ending $ 15,493,654
The notes to the financial statements are an integral part of this statement.
City of Largo, fLoridaStatement of Revenues, Expenditures and
Changes in Fund Balances - Budget and Actual General Fund
Year Ended September 30, 2017
2017 Comprehensive Annual Financial Report | 42

OriginalBudget
FinalBudget Actual
Variancewith
Final Budget
REVENUESTaxes $ 7,575,000 $ 7,575,000 $ 7,263,530 $ (311,470)Intergovernmental 756,000 756,000 263,219 (492,781)Investment earnings 50,000 50,000 51,663 1,663Other 150,000 150,000 182,336 32,336
Total revenues 8,531,000 8,531,000 7,760,748 (770,252)
EXPENDITURES11,282,600 12,479,472 6,289,883 6,189,589Capital outlay
Debt service Principal 3,220,000 3,220,000 3,288,343 (68,343)Interest 330,000 330,000 246,523 83,477
Total expenditures 14,832,600 16,029,472 9,824,749 6,204,723
Net change in fund balance $ (6,301,600) $ (7,498,472) (2,064,001) $ 5,434,471
Fund Balance - beginning 10,099,755
Fund Balance - ending $ 8,035,754
The notes to the financial statements are an integral part of this statement.
City of Largo, fLoridaStatement of Revenues, Expenditures and
Changes in Fund Balances - Budget and Actual Local Option Sales Tax Fund
Year Ended September 30, 2017
2017 Comprehensive Annual Financial Report | 43

OriginalBudget
FinalBudget Actual
Variancewith
Final Budget
REVENUESIntergovernmental $ 810,300 $ 810,300 $ 527,012 $ (283,288)Investment earnings 10,000 10,000 14,791 4,791Other 190,000 190,000 306,472 116,472
Total revenues 1,010,300 1,010,300 848,275 (162,025)
EXPENDITURESCurrent
Economic development 1,010,300 1,199,066 668,677 530,389Total expenditures 1,010,300 1,199,066 668,677 530,389
Net change in fund balance $ - $ (188,766) 179,598 $ 368,364
Fund Balance - beginning 563,093
Fund Balance - ending $ 742,691
The notes to the financial statements are an integral part of this statement.
City of Largo, fLoridaStatement of Revenues, Expenditures and
Changes in Fund Balances - Budget and Actual SHIP Fund
Year Ended September 30, 2017
2017 Comprehensive Annual Financial Report | 44

OriginalBudget
FinalBudget Actual
Variancewith
Final Budget
REVENUESIntergovernmental $ 262,300 $ 483,300 $ 443,303 $ (39,997)
Total revenues 262,300 483,300 443,303 (39,997)
EXPENDITURESCurrent
Economic development 262,300 541,815 443,303 98,512Total expenditures 262,300 541,815 443,303 98,512
Net change in fund balance $ - $ (58,515) - $ 58,515
Fund Balance - beginning -
Fund Balance - ending $ -
The notes to the financial statements are an integral part of this statement.
City of Largo, fLoridaStatement of Revenues, Expenditures and
Changes in Fund Balances - Budget and Actual HOME Fund
Year Ended September 30, 2017
2017 Comprehensive Annual Financial Report | 45

OriginalBudget
FinalBudget Actual
Variancewith
Final Budget
REVENUESIntergovernmental $ 982,700 $ 982,700 $ 502,598 $ (480,102)Investment earnings 5,000 5,000 11,164 6,164Other 150,000 150,000 281,022 131,022
Total revenues 1,137,700 1,137,700 794,784 (342,916)
EXPENDITURESCurrent
Economic development 1,137,700 1,259,032 781,284 477,748Capital outlay - - 13,500 (13,500)
Total expenditures 1,137,700 1,259,032 794,784 464,248
Net change in fund balance $ - $ (121,332) - $ 121,332
Fund Balance - beginning -
Fund Balance - ending $ -
The notes to the financial statements are an integral part of this statement.
City of Largo, fLoridaStatement of Revenues, Expenditures and
Changes in Fund Balances - Budget and Actual CDBG Fund
Year Ended September 30, 2017
2017 Comprehensive Annual Financial Report | 46
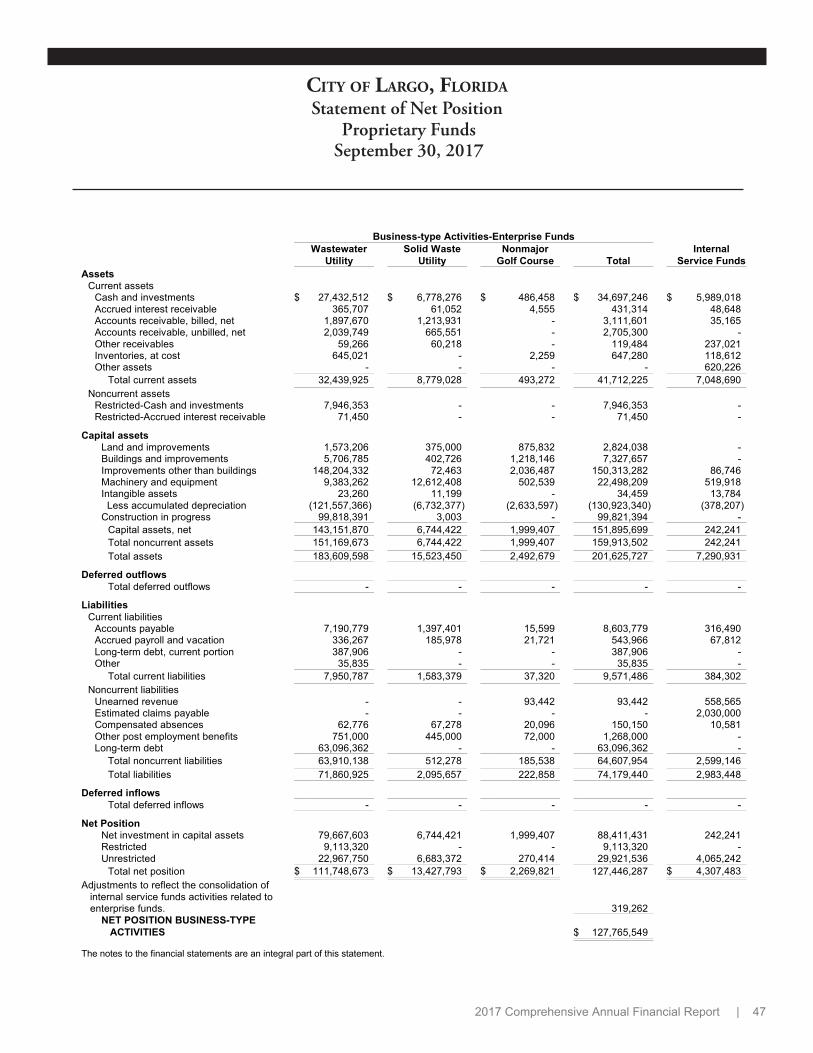
Business-type Activities-Enterprise FundsWastewater
UtilitySolid Waste
UtilityNonmajor
Golf Course TotalInternal
Service FundsAssets
Current assetsCash and investments $ 27,432,512 $ 6,778,276 $ 486,458 $ 34,697,246 $ 5,989,018Accrued interest receivable 365,707 61,052 4,555 431,314 48,648Accounts receivable, billed, net 1,897,670 1,213,931 - 3,111,601 35,165Accounts receivable, unbilled, net 2,039,749 665,551 - 2,705,300 -Other receivables 59,266 60,218 - 119,484 237,021Inventories, at cost 645,021 - 2,259 647,280 118,612Other assets - - - - 620,226
Total current assets 32,439,925 8,779,028 493,272 41,712,225 7,048,690Noncurrent assets
Restricted-Cash and investments 7,946,353 - - 7,946,353 -Restricted-Accrued interest receivable 71,450 - - 71,450 -
Capital assetsLand and improvements 1,573,206 375,000 875,832 2,824,038 -Buildings and improvements 5,706,785 402,726 1,218,146 7,327,657 -Improvements other than buildings 148,204,332 72,463 2,036,487 150,313,282 86,746Machinery and equipment 9,383,262 12,612,408 502,539 22,498,209 519,918Intangible assets 23,260 11,199 - 34,459 13,784 Less accumulated depreciation (121,557,366) (6,732,377) (2,633,597) (130,923,340) (378,207)Construction in progress 99,818,391 3,003 - 99,821,394 -
Capital assets, net 143,151,870 6,744,422 1,999,407 151,895,699 242,241Total noncurrent assets 151,169,673 6,744,422 1,999,407 159,913,502 242,241Total assets 183,609,598 15,523,450 2,492,679 201,625,727 7,290,931
Deferred outflowsTotal deferred outflows - - - - -
LiabilitiesCurrent liabilities
Accounts payable 7,190,779 1,397,401 15,599 8,603,779 316,490Accrued payroll and vacation 336,267 185,978 21,721 543,966 67,812Long-term debt, current portion 387,906 - - 387,906 -Other 35,835 - - 35,835 -
Total current liabilities 7,950,787 1,583,379 37,320 9,571,486 384,302Noncurrent liabilities
Unearned revenue - - 93,442 93,442 558,565Estimated claims payable - - - - 2,030,000Compensated absences 62,776 67,278 20,096 150,150 10,581Other post employment benefits 751,000 445,000 72,000 1,268,000 -Long-term debt 63,096,362 - - 63,096,362 -
Total noncurrent liabilities 63,910,138 512,278 185,538 64,607,954 2,599,146Total liabilities 71,860,925 2,095,657 222,858 74,179,440 2,983,448
Deferred inflowsTotal deferred inflows - - - - -
Net PositionNet investment in capital assets 79,667,603 6,744,421 1,999,407 88,411,431 242,241Restricted 9,113,320 - - 9,113,320 -Unrestricted 22,967,750 6,683,372 270,414 29,921,536 4,065,242
Total net position $ 111,748,673 $ 13,427,793 $ 2,269,821 127,446,287 $ 4,307,483Adjustments to reflect the consolidation of
internal service funds activities related to enterprise funds. 319,262
NET POSITION BUSINESS-TYPE ACTIVITIES $ 127,765,549
The notes to the financial statements are an integral part of this statement.
City of Largo, fLoridaStatement of Net Position
Proprietary Funds September 30, 2017
2017 Comprehensive Annual Financial Report | 47
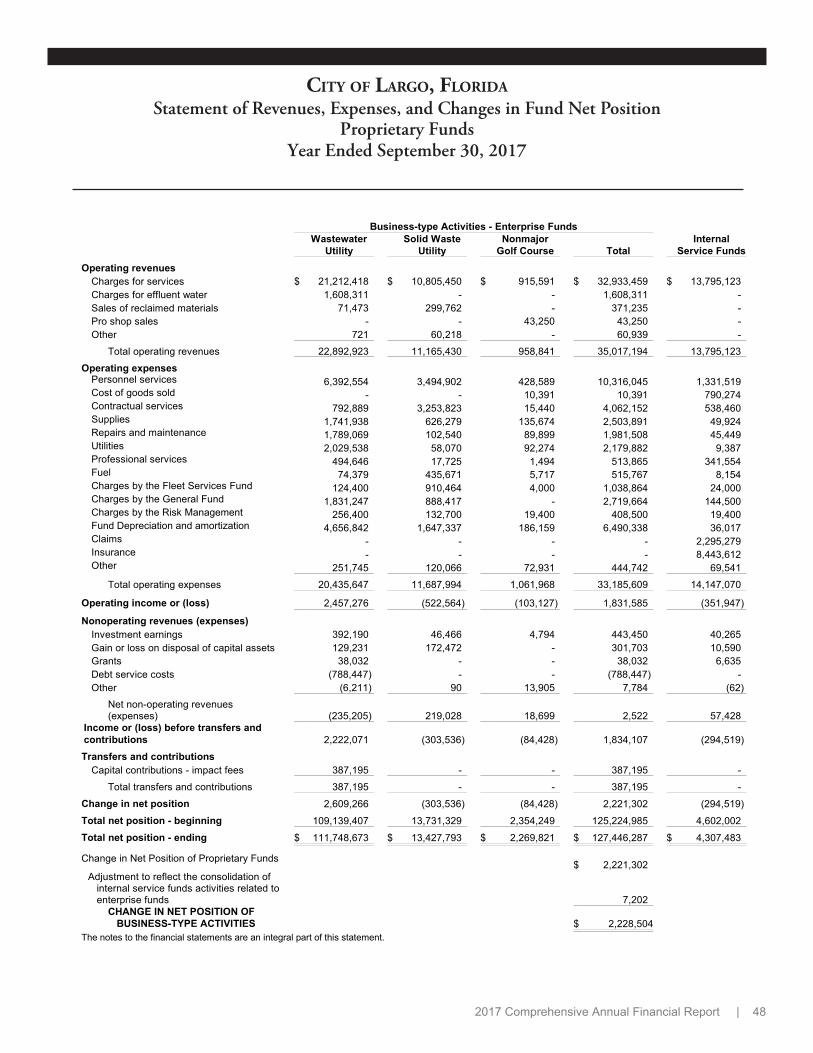
Business-type Activities - Enterprise FundsWastewater
UtilitySolid Waste
UtilityNonmajor
Golf Course TotalInternal
Service FundsOperating revenues
Charges for services $ 21,212,418 $ 10,805,450 $ 915,591 $ 32,933,459 $ 13,795,123Charges for effluent water 1,608,311 - - 1,608,311 -Sales of reclaimed materials 71,473 299,762 - 371,235 -Pro shop sales - - 43,250 43,250 -Other 721 60,218 - 60,939 -
Total operating revenues 22,892,923 11,165,430 958,841 35,017,194 13,795,123
Operating expenses6,392,554 3,494,902 428,589 10,316,045 1,331,519
- - 10,391 10,391 790,274792,889 3,253,823 15,440 4,062,152 538,460
1,741,938 626,279 135,674 2,503,891 49,9241,789,069 102,540 89,899 1,981,508 45,4492,029,538 58,070 92,274 2,179,882 9,387
494,646 17,725 1,494 513,865 341,55474,379 435,671 5,717 515,767 8,154
124,400 910,464 4,000 1,038,864 24,0001,831,247 888,417 - 2,719,664 144,500
256,400 132,700 19,400 408,500 19,4004,656,842 1,647,337 186,159 6,490,338 36,017
- - - - 2,295,279- - - - 8,443,612
Personnel servicesCost of goods soldContractual servicesSuppliesRepairs and maintenanceUtilitiesProfessional servicesFuelCharges by the Fleet Services Fund Charges by the General Fund Charges by the Risk Management Fund Depreciation and amortizationClaimsInsuranceOther 251,745 120,066 72,931 444,742 69,541
Total operating expenses 20,435,647 11,687,994 1,061,968 33,185,609 14,147,070
Operating income or (loss) 2,457,276 (522,564) (103,127) 1,831,585 (351,947)
Nonoperating revenues (expenses)Investment earnings 392,190 46,466 4,794 443,450 40,265Gain or loss on disposal of capital assets 129,231 172,472 - 301,703 10,590Grants 38,032 - - 38,032 6,635Debt service costs (788,447) - - (788,447) -Other (6,211) 90 13,905 7,784 (62)
Net non-operating revenues(expenses) (235,205) 219,028 18,699 2,522 57,428
Income or (loss) before transfers andcontributions 2,222,071 (303,536) (84,428) 1,834,107 (294,519)
Transfers and contributionsCapital contributions - impact fees 387,195 - - 387,195 -
Total transfers and contributions 387,195 - - 387,195 -
Change in net position 2,609,266 (303,536) (84,428) 2,221,302 (294,519)
Total net position - beginning 109,139,407 13,731,329 2,354,249 125,224,985 4,602,002
Total net position - ending $ 111,748,673 $ 13,427,793 $ 2,269,821 $ 127,446,287 $ 4,307,483
Change in Net Position of Proprietary Funds $ 2,221,302Adjustment to reflect the consolidation of
internal service funds activities related to enterprise funds 7,202
CHANGE IN NET POSITION OF BUSINESS-TYPE ACTIVITIES $ 2,228,504
The notes to the financial statements are an integral part of this statement.
City of Largo, fLoridaStatement of Revenues, Expenses, and Changes in Fund Net Position
Proprietary FundsYear Ended September 30, 2017
2017 Comprehensive Annual Financial Report | 48

The notes to the financial statements are an integral part of this statement.
Business-type Activities-Enterprise FundsInternal
Wastewater Solid Waste Nonmajor ServiceUtility Utility Golf Course Total Funds
Operating activitiesCash received from customers $ 23,489,063 $ 10,864,383 $ 1,052,793 $ 35,406,239 $ 13,339,876 Cash received from internal departments - - - - 1,474,100 Cash paid to employees (6,297,573) (3,443,554) (416,327) (10,157,454) (913,681)Cash paid to vendors (10,515,371) (5,375,732) (503,678) (16,394,781) (13,554,389)Cash paid for internal services (2,087,647) (1,021,117) (19,400) (3,128,164) (200,467) Net cash provided by (used in) operating activities 4,588,472 1,023,980 113,388 5,725,840 145,439
Non-capital financing activitiesCash received from grant agencies 38,032 - - 38,032 6,635 Net Cash provided by (used in) non capital 38,032 - - 38,032 6,635 financing activities
Capital and related financing activitiesContributed capital and grants 387,195 - - 387,195 Loan proceeds 39,422,325 39,422,325 - Sale of capital assets 129,673 172,472 - 302,145 64,692 Acquisition of capital assets (33,876,030) (1,095,802) (52,360) (35,024,192) (166,572)Debt issuance costs (788,447) (788,447) - Principal repayment on long-term debt (292,774) - - (292,774) - Interest payments on long-term debt (38,782) - - (38,782) -
Net cash provided by (used in) capital and related financing activities 4,943,160 (923,330) (52,360) 3,967,470 (101,880)
Investing activitiesInvestment earnings 326,419 33,715 3,462 363,596 31,461
Net cash provided by investing activities 326,419 33,715 3,462 363,596 31,461
Net increase (decrease) in cash and cashequivalents/investments 9,896,083 134,365 64,490 10,094,938 81,655
Cash and cash equivalents/investments Beginning of year 25,482,782 6,643,911 421,968 32,548,661 5,907,363
End of year $ 35,378,865 $ 6,778,276 $ 486,458 $ 42,643,599 $ 5,989,018
Reconciliation of operating income (loss) to net cash provided by/(used in) operating activities
Operating income (loss) $ 2,457,276 $ (522,564) $ (103,127) $ 1,831,585 $ (351,947)Adjustments to reconcile operating income (loss)
to net cash provided by (used in) operating activities:Other revenue/(expenses) 21,956 12,751 13,905 48,612 29,735 Depreciation and amortization 4,656,842 1,647,337 186,159 6,490,338 36,017
(Increase) decrease in assets and increase(decrease) in liabilities
Accounts receivable (177,389) (315,960) - (493,349) (22,463)Inventories 2,950 - 2,264 5,214 17,349 Prepaid expenses and other assets - - - - 2,021 Accounts payable (2,471,318) 151,068 (12,199) (2,332,449) (64,391)Accrued payroll and vacation 94,981 51,348 12,262 158,591 (22,310)Deposits 3,174 - - 3,174 - Unearned revenue - - 14,124 14,124 43,428 Estimated claims payable - - - - 478,000
Total adjustments 2,131,196 1,546,544 216,515 3,894,255 497,386
Net cash provided by (used in) operatingactivities $ 4,588,472 $ 1,023,980 $ 113,388 $ 5,725,840 $ 145,439
City of Largo, fLoridaStatement of Cash Flows
Proprietary FundsYear Ended September 30, 2017
2017 Comprehensive Annual Financial Report | 49

Pension TrustFunds
AssetsCash and investments $ 29,508,513Accrued interest receivable 5,223Due from other funds 60,353Investments, at fair value:
Loans receivable 1,416,982U.S. Treasury & U.S. Agency securities 9,187,756Corporate bonds 4,252,915Mutual funds 79,492,853Common stock 59,877,335
Total assets 183,801,930
LiabilitiesDue to employee investment accounts 12,706,713Due to other funds 60,361Unearned revenue 1,028
Total liabilities 12,768,102
Net positionRestricted for
Pension benefits 171,033,828Total net position $ 171,033,828
The notes to the financial statements are an integral part of this statement.
City of Largo, fLoridaStatement of Fiduciary Net Position
Fiduciary FundsSeptember 30, 2017
2017 Comprehensive Annual Financial Report | 50

Pension TrustFunds
AdditionsContributions
Employer $ 5,290,964Plan members 2,367,532State 1,247,930Forfeitures 95,315Service buy back 51,592Interest on loan paybacks 44,363
Total contributions 9,097,696
Investment earningsNet increase (decrease) in investment value 17,296,526Interest and dividends 2,314,568
19,611,094Less investment costs (622,677)
Net investment earnings 18,988,417
Net additions 28,086,113
DeductionsBenefits 11,272,834Refund of contributions 33,559Administrative 154,935Forfeitures 120,722Insurance 61,984
Total deductions 11,644,034
Change in net position 16,442,079
Total net position - beginning 154,591,749
Total net position - ending $ 171,033,828
The notes to the financial statements are an integral part of this statement.
City of Largo, fLoridaStatement of Changes in Fiduciary Net Position
Fiduciary FundsYear Ended September 30, 2017
2017 Comprehensive Annual Financial Report | 51

I. Summary of Significant Accounting Policies
A.B.C.D.E.
Reporting entity...................................................................................................................................... Generally Accepted Accounting Principles............................................................................................Government-wide and individual fund financial statements...................................................................Measurement focus, basis of accounting and financial statement presentation....................................Assets, liabilities, and net position (fund equity)..............................................................................…...
5354545557
II. Reconciliation of Government-wide Financial Statements and Fund Financial Statements
A.
B.
Explanation of certain differences between the governmental funds balance sheets and the government-wide statement of net position (governmental activities column).......................................Explanation of certain differences between the governmental funds statement of revenues,expenditures, and changes in fund balances and the government-wide statement of activities(governmental activities column)............................................................................................................
63
63
III. Stewardship, Compliance and Accountability................................................................................................ 65
IV. Detailed Notes on All Funds
A.B.C.D.E.F.G.H.
Deposits and investments......................................................................................................................Receivables............................................................................................................................................Capital assets.........................................................................................................................................Interfund receivables, payables and transfers.......................................................................................Leases....................................................................................................................................................Non-current liabilities..............................................................................................................................Fund equity.............................................................................................................................................Encumbrances..............................................................................................................................…......
6774757778788181
V. Other Disclosures
A.B.C.D.
Risk management..................................................................................................................................Contingent liabilities...............................................................................................................................Tax abatements..................................................................................................................................…Subsequent event………….……………………………………………………………………………………
82848484
REQUIRED SUPPLEMENTARY INFORMATION
Police Officers and Firefighters Pension Plan
Schedule of changes in the net position liability............…………………………………..……………....Schedule of contributions…….............................…………………………………………….…………….Schedule of investment returns……………………………………………………………….……………...
101102103
Post-employment health benefit plan……………………………………………..…......................................... 104
2017 Comprehensive Annual Financial Report | 52
NOTES TO FINANCIAL STATEMENTSSeptember 30, 2017
City of Largo
Employee retirement systems and pension plans..............................................................................…E. 84

I. SUMMARY OF SIGNIFICANT ACCOUNTING POLICIES
A. Reporting entity
The City of Largo is a political subdivision of the State of Florida, located in Pinellas County onFlorida’s Suncoast, within the Tampa Bay metropolitan area. The City was incorporated in 1905 andis approximately 18.6 square miles in area. The City is a full-service municipality that offers a varietyof high-quality services to City residents and certain unincorporated county residents. Servicesoffered include: general government, public safety, recreation, parks, library, cultural arts and publicworks. The City also operates a wastewater utility, solid waste utility and golf course and maintainsvarious trust funds in a fiduciary capacity.
The reporting entity is considered the primary government and any component units for which theprimary government is financially accountable. In defining the City’s reporting entity, managementconsidered all potential component units and determined that one component unit should be includedin the reporting entity for FY 2017.
A component unit is a legally separate organization for which the elected officials of the primarygovernment are financially accountable. In addition, a component unit may be another organizationfor which the nature, and significance of its relationship with a primary government is such thatexclusion would cause the reporting entity’s financial statements to be misleading or incomplete.
The decision to include or exclude a potential component unit in the reporting entity is made byapplying the criteria set forth in generally accepted accounting principles (GAAP) applicable togovernmental entities. The primary government is financially accountable if (1) it appoints a votingmajority of the organization's governing body and it is able to impose its will on that organization, (2) itappoints a voting majority of the organization's governing body and there is a potential for theorganization to provide specific financial benefits to, or impose specific financial burdens on, theprimary government, (3) the organization is fiscally dependent on and there is a potential for theorganization to provide specific financial benefits to, or impose specific financial burdens on, theprimary government.
In conformity with applicable Governmental Accounting Standards Board (GASB) requirements, thefinancial statements of the Largo Community Redevelopment Agency (CRA) are included as ablended component unit. This component unit has the same governing body as the City. A blendedcomponent unit, although a legally separate entity is, in substance, part of the primary government’soperations; therefore, financial information from this component unit is combined with information ofthe primary government. The component unit is included in the reporting entity, because of thesignificance of operational and financial relationships with the City.
City of Largo, Florida Notes to Financial Statements September 30, 2017
2017 Comprehensive Annual Financial Report | 53

The CRA was established by Ordinance 1997-34, pursuant to Chapter 163, Part III, Florida Statutes. The purpose of this agency is to organize and direct redevelopment activities of the West Bay Drivedowntown area and Clearwater/Largo area of the City of Largo. The seven member City of Largo CityCommission acts as the CRA governing board, and as such, establishes the CRA operating plan,operating budget, operating policies and conducts all official business of the CRA. The financialactivities of the CRA are reported in a special revenue fund, titled the Downtown Tax IncrementFinancing Fund, which is included in this CAFR.
B. Generally Accepted Accounting Principles
The financial statements of the City of Largo, Florida (the “City”) have been prepared in conformitywith generally accepted accounting principles (GAAP) as applied to governmental units. TheGovernmental Accounting Standards Board (GASB) is the accepted primary standard-setting body forestablishing governmental accounting and financial reporting principles. The more significantaccounting policies of the City are described below.
The City uses fund accounting to report its financial position and results of operations. A fund is aseparate accounting entity with a self-balancing set of accounts. Fund accounting is designed todemonstrate compliance with financially related legal requirements and to aid in financialmanagement by segregating transactions related to certain activities.
Proprietary funds (enterprise and internal service) distinguish operating revenues and expenses fromnon-operating items. Operating revenues and expenses generally result from providing services inconnection with a proprietary fund’s principal ongoing operations. The wastewater fund alsorecognizes as operating revenue the portion of impact fees intended to recover the cost of connectingnew customers to the system. Operating expenses for proprietary funds include the cost of providingservices, administrative expenses, and depreciation on capital assets. All revenues and expenses notclassified as operating are reported as non-operating.
When both restricted and unrestricted amounts of fund balance are available for use for expendituresincurred, it is the City's policy to use restricted amounts first and then unrestricted amounts as theyare needed. Unrestricted amounts include committed, assigned and unassigned amounts which areavailable and can be used for the intended purpose.
C. Government-wide and individual fund financial statements
1. Government-wide financial statements
The government-wide financial statements (i.e., the statement of net position and the statement ofactivities) report information on all non-fiduciary activities of the City. Most interfund activity hasbeen removed from these statements. Governmental activities, which normally are supported bytaxes and intergovernmental revenues, are reported separately from business-type activities,which rely principally on user fees for support.
City of Largo, Florida Notes to Financial Statements September 30, 2017
2017 Comprehensive Annual Financial Report | 54

The statement of activities demonstrates the degree to which the direct expenses of a givenfunction or segment are offset by program revenues. Direct expenses are those that are clearlyidentifiable with a specific function or segment.
Program revenues include 1) charges to customers or applicants who purchase, use, or directlybenefit from goods, services, or privileges provided by a given City function, 2) operating grantsand contributions that pay for operating activities and 3) capital grants and contributions that payfor the acquisition, construction or refurbishment of capital assets. Internally dedicated revenues,taxes and other revenues which are not classified as program revenues are reported as generalrevenues.
2. Fund financial statements
Separate fund financial statements are provided for governmental funds, proprietary funds, andfiduciary funds; however, fiduciary funds are excluded from the government-wide financialstatements. Major individual governmental funds and major individual enterprise funds arereported as separate columns in the fund financial statements, while all nonmajor funds arecombined into one aggregate column.
3. Reconciliation of Government-wide and governmental fund statements
Since the governmental fund financial statements are presented on a different measurementfocus and basis of accounting than the government-wide statements, a reconciliation is providedwhich briefly explains the adjustments necessary to reconcile the results of governmental fundaccounting to the government-wide presentations.
D. Measurement focus, basis of accounting and financial statement presentation
1. Government-wide, proprietary fund and fiduciary fund financial statements
The government-wide financial statements and proprietary fund financial statements are reportedusing the economic resources measurement focus and the accrual basis of accounting, as arethe separate proprietary fund financial statements and fiduciary fund financial statements.Revenues are recorded when earned and expenses are recorded when a liability is incurred,regardless of the timing of related cash flows. Property taxes are recognized as revenues in theyear for which they are levied. Grants and similar items are recognized as revenue as soon as alleligibility requirements are met.
The effects of interfund activity have generally been eliminated from the government-widefinancial statements except for interfund charges. Elimination of interfund charges would distortthe direct costs and program revenues reported for the various functions.
City of Largo, Florida Notes to Financial Statements September 30, 2017
2017 Comprehensive Annual Financial Report | 55

2. Governmental fund financial statements
Separate governmental fund financial statements are reported using the current financialresources measurement focus and the modified accrual basis of accounting. Revenues arerecognized as soon as they are both measurable and available. Revenues are considered to beavailable when they are collectible within the current period or soon enough thereafter to payliabilities of the current period (within 60 days of the end of the fiscal period). Grant revenues anddonations are recognized in the fiscal year in which all eligibility criteria have been satisfied.Expenditures generally are recorded when a liability is incurred; however, debt serviceexpenditures are recorded when payment is due.
Franchise taxes (fees), licenses, most intergovernmental revenues and interest income are allconsidered susceptible to accrual and have been recognized as revenues of the current fiscalperiod. All other revenues are considered measurable and available only when cash is received,including property taxes (see note I. E. 11).
3. Major funds and fund types
The City reports the following major governmental funds:
The General fund is the City’s primary operating fund and accounts for all general governmentresources, except those required to be accounted for in another fund.
The Local Option Sales Tax fund is a special revenue fund used to account for a county-widetax, also know as “The Penny for Pinellas” which is legally restricted for major capitalimprovements and public safety vehicles.
The State Housing Initiative Partnership (SHIP) fund is a special revenue fund used toaccount for tax revenue received from real estate sales, which is expended on low incomehousing.
The Home Investment Partnership (HOME) fund is a special revenue fund used to account forrevenue allocated to the City under the Home Investment Partnership Act program, which isexpended on low income housing.
The Community Development Block Grant Program (CDBG) fund is a special revenue fundused to account for revenue allocated to the City under the Community Development BlockGrant program which is expended on low income housing and redevelopment capitalimprovements.
City of Largo, Florida Notes to Financial Statements September 30, 2017
2017 Comprehensive Annual Financial Report | 56

The City reports the following major enterprise funds:
The Wastewater Utility fund accounts for the operations of the wastewater treatment plant,wastewater collection system and the reclaimed water distribution system.
The Solid Waste Collection Utility fund accounts for the solid waste collections operation,including residential, commercial, roll-off and recycling collections. The City does not operatea solid waste disposal facility.
The City also reports the following fund types:
Two internal service funds account for risk management and fleet repair services provided toother City departments on a cost reimbursement basis.
Four pension trust funds account for retirement income and disability income systems forpublic safety employees, general employees, and executive management employees. Thesefunds accumulate resources to pay for pension benefit payments and disability benefitpayments to qualified employees.
E. Assets, liabilities, and net position (fund equity)
1. Deposits and investments
The City utilizes a consolidated bank account (pooled cash and investments), wherein cash andinvestments of most funds are commingled, excluding certain investments held in a fiduciarycapacity or those investments belonging to a specific fund, due to legal or other restrictions.Formal accounting records detail the daily equity of all funds. Interest earned on pooledinvestments is allocated to funds based on the average equity in pooled balances. Allinvestments are reported at fair value. Each fund’s individual equity in the City’s investment poolis considered to be a cash equivalent, since the funds can deposit or effectively withdraw cash atany time without prior notice or penalty. This methodology is also used in the statement of cashflows for the proprietary funds.
Florida Statute 218.261 authorizes the City to invest in negotiable direct obligations of, orguaranteed by, the US Government; interest-bearing time or savings deposits in federal or statechartered banks or savings and loan associations provided that any such deposits are secured bycollateral as may be prescribed by law; obligations of certain federal agencies andinstrumentalities; and repurchase agreements.
The City maintains a buy and hold investment strategy, the objectives of which are safety ofprincipal, liquidity and investment earnings, in that order of priority. The City utilizes a ladderedmaturity policy, whereby investment purchases are made throughout the year to avoid any form of
City of Largo, Florida Notes to Financial Statements September 30, 2017
2017 Comprehensive Annual Financial Report | 57

market timing, and to provide a relatively consistent maturity of investments throughout the year. This policy is intended to enhance liquidity and mitigate volatility in valuation fluctuations. Thepolicy limits interest rate risk by limiting the final maturity for any individual investment to no morethan 60 months and by limiting the weighted average maturity for the portfolio to 24 months orless.
The general employees’ pension trust fund and the executive employees’ pension trust fundinvestments are divided among mutual funds, money market funds, and fixed incomeinvestments. All investments are directed solely by plan members.
The police officers’ and firefighters’ pension trust fund Board of Trustees has broad investmentauthority, but is prohibited from investing in private placements, fixed income or interest ratefutures, and arbitrage or any other specialized investments. Investment managers have beenretained to invest fund assets according to the fund’s investment guidelines. A trustee has beenretained to purchase, hold and sell all investments, at the direction of the investment managers. A performance manager has been retained to review, analyze and report on each investmentmanager’s performance.
2. Accounts receivable
All receivables are shown net of an allowance for uncollectibles, which is generally insignificant.Un-billed charges for services are accrued in the Wastewater, Solid Waste, and StormwaterFunds by prorating subsequent bills.
3. Due to/due from other funds
During the course of operations, transactions occur between individual funds for servicesrendered. These receivables and payables are classified as “due from other funds” or “due toother funds” on the statement of net position or balance sheet.
4. Inventories and prepaid items
Inventories are stated at cost, which approximates market, using the first-in/first-out (FIFO)method. As inventory items are consumed, expenditures are reported in governmental funds andexpenses are reported in proprietary funds.
Certain advance payments to vendors (e.g., insurance premiums) reflect costs applicable to futureaccounting periods and are recorded as prepaid items in both the government-wide and individualfund financial statements.
City of Largo, Florida Notes to Financial Statements September 30, 2017
2017 Comprehensive Annual Financial Report | 58

5. Restricted assets
The Wastewater Utility Fund is required by certain ordinances and resolutions to maintainrestricted reserves for debt service, maintenance and repairs, and capital outlays of the system.These reserves can only be used for the purposes specified in the ordinances City of Largo,Chapter 22, Section 22 and resolutions. Amounts equal to the restricted assets, less the liabilitiespayable from such assets, are reflected in the equity section of the fund’s statement of netposition as restricted for these purposes.
6. Capital assets
Capital assets, which include land, property, plant, equipment, and infrastructure assets (e.g.,roads, sidewalks, and similar immovable items), are reported in the applicable governmental orbusiness-type activities columns in the government-wide financial statements. Capital assets aredefined as assets with an initial, individual cost of more than $5,000, except for land.Infrastructure assets are defined as assets with an initial, individual cost of more than $100,000.All capital assets must have an estimated useful life greater than one year.
Capital assets are recorded at historical cost if purchased or constructed. Donated capital assets,donated works of art or similar items and capital assets received in a service concessionarrangement are reported at aquisition value at the date of donation. Costs that add to the valueof an asset or materially extend an asset’s originally estimated useful life are capitalized asimprovement (betterments). Normal maintenance and repair costs that do not add to the value ofan asset or materially extend an asset’s originally estimated useful life are expended or expensedin the current period.
Major outlays for constructed capital assets and improvements are capitalized as incurred.Interest incurred during the construction phase of capital assets related to business-type activitiesis included as part of the capitalized value of the assets constructed. Construction period interestof $409,191 was recorded during the current fiscal year.
Capital assets (except land) are depreciated using the straight-line method over the followingestimated useful lives:
Capital Asset Class Estimated Useful Lives (years)Infrastructure 30 - 50Buildings and building improvements 10 - 40Improvements other than buildings 20 - 30Machinery and heavy equipment 10 - 30Vehicles 5 - 7Intangible assets 5 - 10Office and computer equipment 3 - 5
City of Largo, Florida Notes to Financial Statements September 30, 2017
2017 Comprehensive Annual Financial Report | 59

7. Unearned revenue
Unearned revenue is recorded for governmental fund receivables that are not both measurableand available. In addition, inflows that do not yet meet the criteria for revenue recognition, suchas business taxes collected in advance, are recorded as unearned revenue in thegovernment-wide and the fund statements.
8. Compensated absences liability
City employees may accumulate earned, but unpaid, vacation and sick leave benefits. No liabilityis reported for accumulated sick leave, because the City does not pay any amounts whenemployees separate from service, except in cases of an employees' death. All accumulatedvacation leave is accrued when earned in government-wide, proprietary, and fiduciary fundfinancial statements. An assignment of fund balance is recorded in governmental fund financialstatements for the long-term portion of compensated absences.
9. Long-term obligations
In the government-wide financial statements and proprietary fund type financial statements,long-term debt and other long-term obligations are reported as liabilities in the applicablegovernmental activities, business-type activities, or proprietary fund type statement of net position.Bond premiums and discounts are reported as deferred charges and amortized over the life of therelated debt using the effective interest method. Bonds payable are reported net of bondpremiums or discounts.
In the separate fund financial statements, governmental fund types recognize bond premiums anddiscounts, as well as bond issuance costs, during the current period. The face amount of debtissued is reported as other financing sources. Premiums received on debt issuances are reportedas other financing sources while discounts on debt issuances are reported as other financinguses. Issuance costs, whether or not withheld from the actual debt proceeds received, arereported as debt service expenditures.
10. Fund equity
Fund equity at the governmental fund reporting level is referred to as “fund balance” and isreferred to as “net position” for all other reporting levels. Generally, fund balance represents thedifference between current assets and current liabilities, while net position represents thedifference between all assets and all liabilities.
In governmental funds, the City considers restricted amounts to be spent first when both restrictedand unrestricted fund balance is available unless there are legal documents or contracts thatprohibit doing this, such as in grant agreements requiring dollar for dollar spending. Additionally,the City would first use committed, then assigned and lastly unassigned amounts of fund balancewhen expenditures are made.
City of Largo, Florida Notes to Financial Statements September 30, 2017
2017 Comprehensive Annual Financial Report | 60
Restrictions of net position in proprietary funds mostly reflect legal segregations for debt service,debt reserves, or to satisfy debt covenants. Other proprietary fund restrictions segregaterevenues that were collected for specific purposes, such as impact fees.
The government-wide statement of net position reports $49,861,214 of restricted net position, ofwhich $9,113,320 is restricted by enabling legislation.
11. Nature and purpose of classifications of fund balance
In the fund financial statements, governmental funds report fund balance classifications thatcomprise a hierarchy based primarily on the extent to which the City is bound to honor constraintson the specific purposes for which amounts can be spent. Amounts that are restricted to specificpurposes either by (a) constraints placed on the use of resources by creditors, grantors,contributors, or laws or regulations of other governments or (b) imposed by law throughconstitutional provisions or enabling legislation are classified as Restricted fund balances.Committed fund balances can only be used for specific purposes as a result of constraintsimposed by formal action of the City’s highest level of decision-making authority (CityCommission), which is by Resolution or by an Ordinance (equally binding) passed by majorityvote. Committed amounts cannot be used for any other purpose unless the City removesthose constraints by taking the same type of formal action. Amounts that are constrained bythe City's intent to be used for specific purposes but are neither Restricted nor Committedare classified as Assigned fund balances. Assignments are made by the City Managerbased on City Commission direction. Non-spendable fund balances include amounts thatcannot be spent because they are either (a) not in spendable form such as inventory or (b)legally or contractually required to be maintained intact, such as an endowment. Unassignedfund balance represents the spendable fund balance that has not been Restricted, Committed,or Assigned to specific purposes within the General Fund only.
12. Fund balance reserve policy
The City will maintain in each fund an adequate balance to accommodate unanticipatedexpenditures, expenditures of a non-recurring nature, unanticipated revenue declines, and cashflow needs.
The City has a formal Legislative Policy adopted for fund balance in the General Fund. Theguidelines within this policy address the General Fund's balance in order to mitigate material risks,which could negatively affect the City's ability to provide public services. The guidelines areintended to comply with state statutes regarding adopting a balanced budget, the requirements ofthe Governmental Accounting Standards Board (GASB), and will strive to achieve theGovernmental Finance Officer's Association (GFOA) best practices.
The annual budget will be prepared including the General Fund's minimum ending fund balanceas follows:
(1) Minimum unrestricted fund balance of no less than 10% of budgeted expenditures (GFOA bestpractice target is 17%);
City of Largo, Florida Notes to Financial Statements September 30, 2017
2017 Comprehensive Annual Financial Report | 61
(2) Target unrestricted fund balance of 20% of budgeted expenditures.
The Policy requires the Proposed Budget to be drafted within the established fund balance levels.The Policy also establishes guidelines for the use and restoration of fund balance (1% per yearuntil balances are restored).
13. Interfund transactions
Exchange transactions between funds are accounted for as revenue, expenditures or expenses.Transactions that constitute reimbursements to a fund for payments initially made, but which areapplicable to another fund, are recorded as expenditures/expenses in the reimbursing fund and asreductions of expenditures/expenses in the fund that is reimbursed. All other interfundtransactions are reported as transfers.
The General Fund assesses charges to certain governmental funds and proprietary funds for theproportionate share of the costs of general government operations. The amounts charged tothese funds are based on a percentage of operating revenues.
14. Property taxes
Property taxes are levied on November 1 on property values assessed as of January 1 of thesame year. Property taxes are payable in arrears beginning in November through the followingMarch 31, a 1% discount for each month paid prior to March (4% maximum discount), after whichtime the taxes become delinquent. A lien is placed against properties by the County TaxCollector’s office if taxes are not paid prior to June 1 and tax certificates are eventually sold if thelien is not paid.
15. Property held for resale
In the governmental funds, property held for resale was reported reflecting land intended to besold for redevelopment purposes in the future. The land is held by the CommunityRedevelopment Agency.
16. Deferred inflows of resources
A deferred inflow of resources represents an source of net position that applies to a future timeperiod; therefore, the amount will not be recognized as an inflow of resources (revenue) until thatfuture time.
17. Deferred outflows of resources
A deferred outflow of resources represents a use of net position that applies to a future period;therefore, the amount will not be recognized as an outflow of resources (expense) until a futuretime.
City of Largo, Florida Notes to Financial Statements September 30, 2017
2017 Comprehensive Annual Financial Report | 62

II. RECONCILIATION OF GOVERNMENT-WIDE FINANCIAL STATEMENTS ANDFUND FINANCIAL STATEMENTS
A. Explanation of certain differences between the governmental funds balance sheets and the government-wide statement of net position (governmental activities column)
The governmental funds balance sheet requires a reconciliation between 1) fund balance – totalgovernmental funds and 2) net position – governmental activities as reported in the government-widestatement of net position. One element of this reconciliation recognizes that; long-term liabilities,(including bonds payable), are not due and payable in the current period and therefore are notreported in the fund financial statements. The details of this difference between these two financialstatements are, as follows:
Notes and Loans payable $ 8,560,708 Plus: Accrued interest payable 49,667 Net adjustment to decrease Fund Balance - total governmental funds toarrive at Net Position - governmental activities $ 8,610,375
B. Explanation of certain differences between the governmental funds statement of revenues, expenditures, and changes in fund balances and the government-wide statement of activities (governmental activities column)
The governmental funds statement of revenues, expenditures, and changes in fund balancesrequires a reconciliation between 1) net changes in fund balances – total governmental funds and 2)changes in net position of governmental activities as reported in the government-wide statement ofactivities.
One element of this reconciliation recognizes that governmental funds report capital outlays asexpenditures; however, in the government-wide statement of activities, the cost of those assets isallocated over the assets’ estimated useful lives and is reported as depreciation expense. Thedetails of this difference between the two financial statements are, as follows:
Capital outlay per funds $ 11,219,217 Add: Capital outlay of internal service funds 89,322 Less: Amount of capital outlay related to expenditures under threshhold (678,984)Capital Outlay related to capital expenditures 10,629,555 Less: Depreciation expense (9,218,227)Net adjustment to increase Net Changes in Fund Balances - total governmentalfunds to arrive at Changes in Net Position of Governmental Activities $ 1,411,328
City of Largo, Florida Notes to Financial Statements September 30, 2017
2017 Comprehensive Annual Financial Report | 63

Another element of this reconciliation recognizes that the net effect of various miscellaneoustransactions involving capital assets (i.e.,sales, trade-ins, and donations) is to increase net position. In the statement of activities, only the gain or loss on the sale of capital assets is reported; however,in the governmental funds, the proceeds from the sale increase financial resources. Thus, thechange in net position differs from the change in fund balance by the cost of the capital assets sold. The details of this difference are, as follows:
Cost of capital asets sold/retired $ 2,242,429 Net adjustment to decrease Net Changes in Fund Balances - total governmentalfunds to arrive at Changes in Net Position of Governmental Activities $ 2,242,429
Another element of this reconciliation recognizes that certain revenues reported in the statement ofactivities do not provide current financial resources and, therefore, are not reported as revenues ingovernmental funds. The details of these differences are, as follows:
Adjustment for deferred revenues $ 631,013 Add: Change in utility grants receivable: 3,844 Add: Change in special assessments receivable 876 Net adjustment to increase Net Changes in Fund Balances - total governmentalfunds to arrive at Changes in Net Position of Governmental Activities $ 635,733
Another element of this reconciliation recognizes that the issuance of long-term debt (e.g., bonds,leases, etc.), provides current financial resources to governmental funds and the repayment ofprincipal consumes current financial resources of governmental funds; however, neither transactionaffects net position at the government-wide reporting level. Also, governmental funds reportissuance costs, premiums, discounts, and similar items when debt is first issued, whereas theseamounts are deferred and amortized in the statement of activities. The details of this difference are,as follows:
Debt principal repayment $ 3,288,343 Net adjustment to increase Net Changes in Fund Balances - total governmentalfunds to arrive at Changes in Net Position of Governmental Activities $ 3,288,343
Another element of this reconciliation states that certain expenses reported in the statement ofactivities do not require the use of current financial resources and, therefore, are not reported asexpenditures in governmental funds. The details of these differences are, as follows:
Adjustment for net pension liability and related deferrals $ (7,916)Add: Adjustment to long-term compensated absences (106,559)Add: Change in accrued interest 14,981 Less: Adjustment for OPEB liability (529,000)Net adjustment to increase Net Changes in Fund Balances - total governmentalfunds to arrive at Changes in Net Position of Governmental Activities $ (628,494)
City of Largo, Florida Notes to Financial Statements September 30, 2017
2017 Comprehensive Annual Financial Report | 64

III. STEWARDSHIP, COMPLIANCE AND ACCOUNTABILITY
An annual budget is prepared for all governmental funds, with the exception of the NeighborhoodStabilization Program 2 fund in FY 2017. Budgets are prepared on a basis consistent with GAAP. The City Manager is authorized to transfer budgeted amounts between line items within departments,but not between departments or funds. Any transfer that alters the total expenditures/expenses ofany department or fund must be approved by the City Commission through a budget amendment. Allbudget amounts presented in the accompanying financial statements have been adjusted foramendments approved by the City Commission or transfers approved by the City Manager.
Supplemental appropriations were enacted during the year, as follows:
General Fund $ 153,600 SHIP 221,000 Construction Services Fund 167,400 Stormwater 102,300 Program Special Revenue 121,300
Every appropriation, except a capital expenditure appropriation, lapses at the close of the fiscal yearto the extent that the appropriation has not been expended or encumbered. The City Charterstipulates that appropriations for capital expenditure continue in force until the purpose has beenaccomplished or abandoned, or if three years pass without any disbursement or encumbrance of theappropriation, whichever occurs first; however, it is Management’s policy to request the CityCommission to re-appropriate unexpended or unencumbered appropriations in the succeeding year’sbudget.
Deficit Balances. Generally accepted accounting principles require disclosure of individual funds thathave deficit balances at year-end. The City does not have any funds with deficit balances atSeptember 30, 2017.
New Accounting Pronouncements. The GASB issued Statements No. 74, Financial reporting forpostemployment benefit plans other than pension plans, No. 77, Tax abatement disclosure, No. 78Pensions provided through certain multiple-employer defined benefit pension plans, No. 80 Blendingrequirements for certain component units - an amendment of GASB Standard No. 14 and No. 82Pension issues- an amendment of GASB Standards No. 67, No. 68 and No. 73 effective for reportingperiods beginning after June 15, 2016. The Statements address improving the usefulness ofinformation about postemployment benefits other than pensions (other postemployment benefits orOPEB) for making decisions and assessing accountability; assessing how tax abatements affectfinancial position and results of operations, including the ability to raise resources in the future; and the presentation of payroll-related measures in issues in presentation of required supplementaryinformation with relation to pensions.
City of Largo, Florida Notes to Financial Statements September 30, 2017
2017 Comprehensive Annual Financial Report | 65

Future Accounting Pronouncements. The Governmental Accounting Board has issued statementsthat will become effective in FY 2018. The statements address:
Accounting and financial reporting for postemployment benefits other than pensions, and Omnibus - issues related to blending component units, goodwill, fair value measuremenr and
application and post employment benefts, and Certain debt extinguishment issues, and Irrevocable split-interest agreements, and
The City of Largo is currently evaluating the effects that these statements will have in its FY 2018financial statements.
City of Largo, Florida Notes to Financial Statements September 30, 2017
2017 Comprehensive Annual Financial Report | 66

IV. DETAILED NOTES ON ALL FUNDS
A. Deposits and investments
City of LargoAs of September 30, 2017 the City of Largo held the following investments measured at fair value:
Fair Value ($000) & MaturitiesLess Than Fair Value
Investment Type 1 year 1-2 Years 2 -5 Years Total (2) % Total LevelUS Treasuries $ 10,022 $ 14,015 $ - $ 24,037 25.7% 1 US GSE (1)
FHLB - 5,969 7,912 13,881 14.8% 1 FFCB - 2,980 6,972 9,952 10.7% 1 Certificates of Deposit 14,500 7,000 15,000 36,500 39.0% N/A Demand Deposits (3) 9,194 - - 9,194 9.8% N/A
$ 33,716 $ 29,964 $ 29,884 $ 93,564 100.0%
% of Total 36.0% 32.0% 32.0% 100.0%
(1) Governmental Sponsored Enterprises are privately held corporations created by the U.S. Congress(2) Balance does not include deposits required by debt agreements ($493,523)(3) Total balance reflects actual bank balances at September 30, 2017
Fair Value Measurement. GASB Statement No. 72, Fair Value Measurement and Application, enhancescomparability of governmental financial statements by requiring fair value measurement for certain assets and liabilities using consistent definition and accepted valuation techniques. The Citycategorizes its fair value measurements within the fair value hierarchy established by generally accepted accounting principles. Fair value is the exchange price that would be received for an asset(exit price) in the principal or most advantageous market for an asset in an orderly transaction betweenmarket participants on the measurement date. There are three levels of inputs that may be used tomeasure fair values:
Level 1 inputs utilize quoted prices (unadjusted) for identical assets in active markets that the City hasthe ability to access.
Level 2 inputs are inputs other than quoted prices included in Level 1 that are observable for the assetor liability either directly or indirectly.
Level 3 inputs are unobservable inputs for an asset or liability which are typically based on the City’sown assumptions. The City’s assessment of the significance of particular inputs to these fair value measurements requires judgment and considers factors specific to each asset or liability.
City of Largo, Florida Notes to Financial Statements September 30, 2017
2017 Comprehensive Annual Financial Report | 67
The categorization of the investments within the hierarchy is based upon the pricing transparency of theinstrument and should not be perceived as the particular investment’s risk. Certificates of deposit andmoney market funds are valued using the quoted market prices. U.S. Treasury securities classified asLevel 1 of the fair value hierarchy are valued using quoted prices at September 30 (or the most recentmarket close date if the market are closed on September 30) in active markets from the custodianbank’s primary external pricing vendors. U.S. agencies and instrumentalities classifies as Level 2 areevaluated prices from the custodian bank’s external pricing vendors. The pricing methodology ofteninvolves the use of evaluation models such as matrix pricing, which is based on the securities’relationship to benchmark quoted prices.
Interest Rate Risk. The risk that changes in interest rates will adversely affect fair value of aninvestment in debt securities. Generally, the longer the time to maturity, the greater the exposure tointerest-rate risk. The City investment policy addresses interest rate risk by limiting the final maturity forany individual investment to no more than 60 months. Generally, the City manages exposure to declinesin fair value caused by rising interest rates by maintaining an investment portfolio with an averageweighted maturity of two years or less and by maintaining a minimum of two months of anticipatedrecurring disbursements in liquid investments. Investment maturities are also laddered (staggered)throughout the year so that a portion of investments mature monthly, which further reduces exposure todeclines in fair value. In addition, it is the City’s practice to hold all investments until maturity; therefore,declines in fair value, if any, caused by rising interest rates are recognized for accounting purposes, butare never realized.
Credit Risk. The risk that a debt issuer will not fulfill its obligations. The City’s investment objectives areweighted in the following order: safety of principal, liquidity and return on investments; therefore, and inaccordance with Florida Statue 218.415 and the City's investment policy, the City only invests in thehighest quality securities, such as US Government Treasury Securities and US GovernmentInstrumentality Securities. Time Deposits, including Certificates of Deposit, are collateralized under theState of Florida Qualified Public Depository Program, whereby member institutions are collectivelyresponsible for any individual member’s default. The City invests in US Government agencies that areonly implicitly guaranteed by the US Government. The Federal Home Loan Banks (FHLB) were ratedAaa/AA+ by Moody’s , and Standard & Poor’s, respectively. The Federal Farm Credit Bank (FFCB) wererated at Aaa/AA+ by Moody’s and Standard & Poor’s, respectively.
Custodial Credit Risk – Deposits and Investments. The risk that cash and investments held by anotherparty may not be recovered in the event of financial failure. All investments are held in the name of theCity of Largo and all time deposits are maintained with Qualified Public Depositories as required in theinvestment policy. The investment policy states:
1. All securities purchased by the City under this section except public depository investments shall beproperly designated as an asset of the City and held in safekeeping by a third party custodialinstitution, chartered by the United States Government or the State of Florida.
City of Largo, Florida Notes to Financial Statements September 30, 2017
2017 Comprehensive Annual Financial Report | 68

2. Certificates of deposit purchased under the authority of this policy shall be purchased only fromQualified Public Depositories of the State of Florida as identified by the State Treasurer, inaccordance with Chapter 280 of the State Statutes.
As of September 30, 2017, the carrying amount of the City's deposits with financial institutions was$47,561,372 and the total of the bank balances was $47,734,918 A portion of the bank balance iscovered by the FDIC. These funds were deposited with banks that are members of the Qualified PublicDepository Program under which collateral is pledged with the State Chief Financial Officer pursuant toChapter 280, Florida Statutes. Under this chapter, in the event of default by a participating financialinstitution (a qualified public depository), all participating institutions are obligated to reimburse thegovernment entity for the loss.
Concentration of Credit Risk. The risk of loss attributed to the magnitude of an investment in a singleissuer. Appropriate diversification is maintained between security types and issuers to reduceconcentration of credit risk. The City updated the investment policy in FY 2009, which addresses theallocation of investments. The allocation of investments follow the guidelines of the updated investmentpolicy. Broad categories of allowable and actual security concentrations are, as follows:
MaximumConcentration Actual Concentration at
Security Type Allowed September 30, 2017U.S. Treasury Obligations 50% 25.7% U.S. Agencies and Instrumentalities 40% 25.5% Time Deposits and Savings Accounts(Public Depositories) 40% 39.0% Checking Accounts (Public Depositories) 20% 9.8% Government Investment Pools 20% 0.0% Money Market Funds 20% 0.0% % of Total 100%
City of Largo, Florida Notes to Financial Statements September 30, 2017
2017 Comprehensive Annual Financial Report | 69

General 401(a) and Executive Management 401(a) Plans
At September 30, 2017, the General and Executive Management 401(a) Plans invested in the followingcash and investments:
Balance at Concentration Fair Value09/30/17 Credit Rating General Executive Total Level
Investments Measured at Net Asset Value(NAV)Mutual Funds Domestic Common Stock Funds $ 15,813,156 Not Reported 36.2% 58.1% 37.8% N/A International Common Stock Funds 2,413,855 5.7% 6.6% 5.8% N/A
Fixed Income Fund (Bonds) 1,581,768 Not Reported 3.4% 8.0% 3.8% N/AAsset Allocation (Stocks & Fixed Inc.) 11,384,396 28.6% 10.3% 27.2% N/AOther 350,983 0.9% 0.7% 0.8% N/A
Total Investments Measured at NAV 31,544,158
Investments at Amortized CostCash and Cash Equivalents 10,282,450 Not Reported 25.3% 16.3% 24.6% N/ATotal Investments Measured at Amortized
Cost 10,282,450 100.0% 100.0% 100.0%
Total Cash & Investments $ 41,826,608
Per Fiduciary Statement of Net Assets:
Executive Employees' Retirement $ 3,117,614 General Employees' Retirement 38,708,994 Total Cash & Investments $ 41,826,608
The City sponsors separate defined contribution retirement plans for general employees and executive-management employees, which requires mandatory participation by all eligible employees. The City andthe City's Retirement Board (the Board), which is responsible for administering the Pans, intend for thePlans to comply with ERISA Section 404(c) and the regulations thereunder.
The Plans' participants are expected to have different investment objectives, time horizons and risktolerances; therefore, to meet these varying investment needs, participants are able to direct their accountbalances among a range of investment options to construct diversified portfolios that reasonably span therisk/return spectrum. The Board selects the Plans' investment options based on relevant criteria,including: maximization of return within reasonable and prudent levels of risk, provision of returnscomparable to returns for similar investment options, provision of exposure to a wide range of investmentopportunities in various asset classes and vehicles, control of administrative and management costs,provision of appropriate diversification and each investment manager’s adherence to stated investmentobjectives.
City of Largo, Florida Notes to Financial Statements September 30, 2017
2017 Comprehensive Annual Financial Report | 70

Service providers and investment options are monitored by the Board on a quarterly basis to ensure thattotal costs and services are competitive and reasonable. A service provider may be removed if the Boarddetermines that their service quality and/or value has become uncompetitive. An investment option maybe removed if the Board has lost confidence in the related manager’s ability to: achieve competitiveperformance results, remain true to the fund's stated investment style, maintain an appropriate assetallocation, meet risk/return objectives and/or maintain acceptable qualitative standards (e.g., stableorganization, compliance guidelines, relative returns, etc.). A "score card" is prepared on each investmentoption every quarter and options that do nto meet acceptable criteria are placed on a watch list formonitoring. One or two investment options are usually replaced every year by the Board based onsub-par performance of other factors.
Interest Rate Risk. The risk that changes in interest rates will adversely affect fair value of an investmentin debt securities. Generally, the longer the time to maturity, the greater the exposure to interest-rate risk. The Plans have provided investment options with varying investment maturities to match participants'anticipated risk tolerances and cash-flow requirements.
Credit Risk. The risk that a debt issuer will not fulfill its obligations. The Plans provide adequate portfoliodiversification so participants can limit investments to the highest rated securities as rated by nationallyrecognized rating agencies. The Plans do provide a high yield fixed income securities investment option.
Concentration of Credit Risk. The risk of loss attributed to the magnitude of an investment in a singleissuer. The Plans provide a wide variety of mutual fund options, each of which holds securities and/orinvestments from many different issuers, which helps to manage this risk.
Custodial Credit Risk. The risk that the plan may not recover cash and investments held by another partyin the event of financial failure. Custodial credit risk is limited, because investments are held inindependent custodial safekeeping accounts or mutual funds.
Foreign Currency Risk. The risk that changes in exchange rates will adversely affect the fair value of aninvestment. The Plans provide a wide variety of mutual fund options, each of which holds securitiesand/or investments from many different countries, which helps to manage this risk.
City of Largo, Florida Notes to Financial Statements September 30, 2017
2017 Comprehensive Annual Financial Report | 71

Police Officers' and Firefighters' Retirement
At September 30, 2017, the Police Officers' and Firefighter’s Retirement System invested in the followingcash and investments:
Balance at09/30/17
CreditRating
(Moody's)
WeightedAverageMaturity(Years) Concentration
FairValueLevel
Investments at Fair Value LevelU.S. Treasury Securities 4.65 U.S. Treasury Bonds $ 366,470 Aaa 0.26% 1 U.S. Treasury Notes 3,134,439 Aaa 2.24% 1 U.S. Government Sponsored Agencies 13.39 Federal Home Loan Mortgage Corp. 2,196,272 Aaa 1.57% 2 Federal National Mortgage Assoc. 3,230,643 Aaa 2.31% 2 Government National Mortgage Assoc. 259,932 Aaa 0.19% 2 Corporate Obligations 6.15
Bonds 234,091 Aa3 0.17% 1 Bonds 301,620 A1 0.22% 1 Bonds 258,031 A2 0.18% 1 Bonds 284,769 A3 0.20% 1 Bonds 727,237 Baa1 0.52% 1 Bonds 800,336 Baa2 0.57% 1 Bonds 1,392,579 Baa3 1.00% 1 Bonds 25,551 Ba1 0.02% 1 Bonds 166,461 Ba2 0.12% 1 Bonds 62,240 B1 0.04% 1
Domestic Common Stock 58,640,562 41.91% 1 Foreign Common Stock 1,236,773 0.88% 1
Total Investments at Fair Value Level 73,318,006
Investments at Net Asset Value (NAV)Real Estate Investment Trusts 11,376,530 8.13% N/AMutual Funds
Domestic Common Stock Funds 1,624,104 1.16% N/AForeign Common Stock Funds 23,432,757 16.76% N/AFixed Income Funds 11,246,815 8.04% N/ABalanced Funds (Stocks & Fixed) 268,490 0.19% N/A
Total Investments at NAV 47,948,696
Investments at Amortized CostStable Value Fund 10,459,612 7.47% Goverment Money Market 8,181,792 5.85% N/ATotal Investments at Amortized Cost 18,641,404
Total Cash & Investments $ 139,908,106 100.00%
City of Largo, Florida Notes to Financial Statements September 30, 2017
2017 Comprehensive Annual Financial Report | 72

Interest Rate Risk. The risk that changes in interest rates will adversely affect the fair value of adebt security. Generally, the longer the time to maturity, the greater the exposure there is tointerest-rate risk.
The Plan manages investment maturities to anticipated cash-flow requirements so that allobligations are paid when due. The duration of the fixed income portfolio must also be less than135% of the duration of the related market index, which is defined as the Barclay’s Aggregate BondIndex. At September 30, 2017, the weighted average maturity in years for each investment type isincluded in the preceding table.
Credit Risk. The risk that a debt issuer will not fulfill its obligations. To reduce credit risk, all fixedincome securities must be issued by a corporation organized under the laws of the United States,any state or organized territory of the United States, or the District of Columbia.
The policy further limits credit risk by limiting investments to the highest rated securities as rated bynationally recognized rating agencies, in accordance with the Plan's fixed income investmentobjectives. Fixed income securities must maintain a weighted average credit quality rating of “A” orhigher. Investments in all corporate fixed income securities are further limited to those securitiesconsidered investment grade or higher by Moody’s, Standard & Poor’s and Fitch rating services. AtSeptember 30, 2017, for those where ratings are available, the portfolio met the credit ratinglimitations of the policy.
Concentration of Credit Risk. The risk of loss attributed to the magnitude of an investment in asingle issuer. The Plan utilizes limitations on securities of a single issuer to manage this risk.
The policy uses portfolio diversification to reduce concentration of credit risk and states that nomore than 10% of corporate securities (at market value) of an investment manager’s total fixedincome portfolio may be invested in the securities of any single corporate issuer. Fixed incomesecurities are also limited to no more than 30% of the portfolio. At September 30, 2017, theportfolio met the corporate single issuer limitation and overall asset allocation requirements of thepolicy.
Custodial Credit Risk . The risk that the plan may not recover cash and investments held by anotherparty in the event of financial failure. Custodial credit risk is limited, since investments are held inindependent custodial safekeeping accounts or mutual funds.
Foreign Currency Risk. The risk that changes in exchange rates will adversely affect the fair valueof an investment. To reduce this risk, investments in stocks of foreign companies are limited to25% of the value of the total investment portfolio.
City of Largo, Florida Notes to Financial Statements September 30, 2017
2017 Comprehensive Annual Financial Report | 73

General Employees' Disability Fund
The General Employees' Disability Fund cash and investments were apart of the City's pooled cashas defined in Note I.E.1. At September 30, 2017, the cash balance in the fund was $584,658.
B. Receivables
Uncollected accounts receivable at year-end are recorded, with an appropriate allowance forestimated uncollectible accounts in the Stormwater Fund, Wastewater Fund, and Solid Waste Fund.Receivables as of year end for the government’s individual major and non-major funds and internalservice funds in the aggregate are, as follows:
Non-Waste- Solid major
General LOST SHIP HOME CDBG Water Waste Funds TotalReceivables (Thousands):
Taxes $ 1,832 $ - $ - $ - $ - $ - $ - $ - $ 1,832 Interest 123 54 7 - - 437 61 276 958 Accounts - - - - - 3,937 1,897 1,092 6,926 Intergovernmental 613 638 - - - - - 92 1,343 Grants 29 - - 148 215 - - - 392 Other 1,710 - 3 1 2 59 60 276 2,111 Notes - - 5,822 3,391 2,377 - - 845 12,435
Total receivables $ 4,307 $ 692 $ 5,832 $ 3,540 $ 2,594 $ 4,433 $ 2,018 $ 2,581 $ 25,997
Taxes receivable. By fiscal year end, virtually all property taxes were collected either directly orthrough tax certificate sales. The Pinellas County Tax Collector advertises sales of tax certificatesat public auctions for unpaid taxes on all real property. All sales proceeds are remitted to taxingauthorities. Certificates not purchased are issued to Pinellas County.
Notes receivable are collateralized by first or second mortgages on rehabilitated low incomeproperties. As payments are received, revenue is recognized and the deferred revenue account isreduced, which reflects available resources for future rehabilitation projects. There are three typesof Notes Receivable, as follows:
1. State Housing Initiative Partnership (SHIP) notes receivable represent loans to first-timehomeowners to assist with down payments and closing costs. Notes bear interest at 3% and arecollateralized by second mortgages on the property.
2. Home Investment Partnership (HOME) notes receivable represent loans to first-timehomeowners to assist with down payments and closing costs and also the rehabilitation ofproperties. Notes bear interest at 3% and are collateralized by second mortgages on theproperty.
City of Largo, Florida Notes to Financial Statements September 30, 2017
2017 Comprehensive Annual Financial Report | 74

3. Community Development Block Grant (CDBG) notes receivables represent loans to propertyowners for rehabilitation of properties and bear interest from 3% to prime less 3%. Loans aremade for up to 95% (49% prior to 1993) of the property value after rehabilitation for periods up to20 years. Notes receivable are offset by a deferred revenue account in the individual fundfinancial statements, due to the length of time until collection. Federal requirements stipulate thatloan proceeds must be returned to the federal government unless they are used for rehabilitationpurposes; therefore, the loan amounts represent a perpetual loan pool that can fund futurerehabilitation.
C. Capital Assets
1. Capital asset activity
Capital asset activity for the year ended September 30, 2017 was as follows:
Beginning EndingBalance Increases Decreases Balance
Governmental activities:
Non-depreciable capital assets: Land $ 27,350,542 $ - $ 1,814,432 $ 25,536,110 Construction in progress 10,375,576 7,868,642 10,218,900 8,025,318 Total non-depreciable capital assets 37,726,118 7,868,642 12,033,332 33,561,428
Depreciable/Amortizable capital assets: Building 74,978,681 2,320,462 502,861 76,796,282 Improvements other than buildings 59,388,426 4,602,169 - 63,990,595 Machinery and equipment 39,789,990 5,287,549 3,551,738 41,525,801 Intangible - 894,970 - 894,970 Total depreciable/amortizable capital assets 174,157,097 13,105,150 4,054,599 183,207,648
Less accumulated depreciation/amortization for: Building 21,251,580 2,515,541 120,103 23,647,018 Improvements other than buildings 27,742,567 2,564,888 - 30,307,455 Machinery and equipment 26,671,273 4,114,994 3,463,833 27,322,434 Intangible - 58,820 - 58,820
Total accumulated depreciation/amortization 75,665,420 9,254,243 3,583,936 81,335,727 Net depreciable/amortizable capital assets 98,491,677 3,850,907 470,663 101,871,921 Net governmental activities capital assets $ 136,217,795 $ 11,719,549 $ 12,503,995 $ 135,433,349
City of Largo, Florida Notes to Financial Statements September 30, 2017
2017 Comprehensive Annual Financial Report | 75

Beginning EndingBalance Increases Decreases Balance
Business-type ActivitiesNon-depreciable capital assets:
Land $ 2,824,038 $ - $ - $ 2,824,038 Construction in progress 76,050,472 36,271,422 12,500,500 99,821,394
Total non depreciable capital assets 78,874,510 36,271,422 12,500,500 102,645,432
Depreciable/amortizable capital assets Building and improvements 4,469,504 2,858,153 - 7,327,657 Improvements other than buildings 144,912,382 5,411,768 10,866 150,313,284 Machinery and equipment 21,238,113 2,927,611 1,667,517 22,498,207 Intangible - 34,459 - 34,459
Total depreciable/amortizable capital assets 170,619,999 11,231,991 1,678,383 180,173,607
Less accumulated depreciation/amortization for: Building and improvements 2,048,651 149,410 - 2,198,061 Improvements other than building 112,164,353 3,955,156 10,866 116,108,643 Machinery and equipment 11,897,940 2,383,762 1,667,076 12,614,626 Intangible - 2,010 - 2,010
Total accumulated depreciation/amortization 126,110,944 6,490,338 1,677,942 130,923,340Net depreciable/amortizable capital assets 44,509,055 4,741,653 441 49,250,267Net business type activities capital assets 123,383,565 41,013,075 12,500,941 151,895,699
2. Depreciation and amortization expense
Depreciation and amortization expense was charged to functions and programs, as follows:
Governmental activities Business-type activitiesGeneral government $ 1,518,319 Wastewater $ 4,656,842 Economic development 1,815,544 Solid waste 1,647,337 Public safety 2,282,347 Golf course 186,159 Public works 1,271,322 - Culture and recreation 2,330,695 - Internal service funds chargedto various functions 36,016 -
Total depreciation/amortization expense $ 9,254,243 $ 6,490,338
City of Largo, Florida Notes to Financial Statements September 30, 2017
2017 Comprehensive Annual Financial Report | 76

3. Construction commitments
The City has active construction projects as of September 30, 2017. The projects includevarious street, wastewater and drainage projects. In addition, the City has outstandingpurchase commitments for engineering and design services. At year end, the City's significantcommitments with contractors are as follows:
Remaining Incurred Commitment
WRF Influent Pumping & Headworks improvements $ 26,770,611 $ 2,280,740 Lake Avenue sanitary system improvements 1,475,643 705,269 Wet weather monitoring & pumping system 44,957,329 650,285 Clearwater-Largo Road district improvements 551,262 3,669,771 Trotter Road reconstruction design 614,062 5,869,367
Total $ 74,368,907 $ 13,175,432
The commitments shown above are financed from existing City resources and future proceeds ofthe State Revolving Fund Loan through the Florida Department of Environmental Protection.
D. Interfund receivables, payables and transfers
1. Interfund receivables and payables
Receivable Fund Payable Fund Total Amount PurposeGeneral (major) CDBG (major) $ 133,492 Awaiting receipt of housing-related receivableGeneral (major) HOME (major) 41,635 Awaiting receipt of housing-related receivableLOST (major) Non-Major (CRA) 343,000 Financing for redevelopment property to be sold Non-Major (ParklandDedication) Non-Major (CRA) 189,000 Financing for redevelopment property to be sold
$ 707,127
City of Largo, Florida Notes to Financial Statements September 30, 2017
2017 Comprehensive Annual Financial Report | 77

E. Leases
Operating Leases
The City leases office and other equipment under non-cancelable operating leases. Total costs forsuch leases were $100,063 for the year ended September 30, 2017. The future minimum leasepayments for these leases are as follows:
Year Ending Sept. 30 Amount 2018 $ 101,980 2019 80,244 Total $ 182,224
F. Non-current liabilities
Net interest cost (interest cost less the interest earned on the investment of unexpended debtproceeds) is capitalized in the proprietary funds on construction projects financed with long-termdebt. Interest cost is not capitalized on projects financed by government grants or third-partydonations.
Pledged Revenues Disclosures. The City has pledged the net revenues of the wastewater utilitysystem to repay the $10,861,059 State Revolving Loan Fund #2 (SRL#2) loan issued in October,1997 and the State Revolving Loan Fund #3 (SRL#3) loan issued in May, 2016. The bonds are paidsolely from the net revenues of the wastewater utility system and are payable through October 2017and November 2035, respectively. The total outstanding balance of the SRL #2 bonds of$1,089,477 was paid in full on October 3, 2016. Principal and interest paid for the current year andnet revenues were $1,103,178 and $8,484,906 respectively. The SRL#3 loan agreement was fordrawdowns totaling $73,216,406 and is for wet weather improvements. The total amount borrowedas of September 30, 2017 is $62,501,952 including capitalized interest and a 2% loan service cost. Repayments on the loan begin in November 2018. Proceeds of the SRL #3 loan were used toprovide financing for system expansion and upgrades.
The City has pledged a portion of future local sales tax revenues, also known as Penny for Pinellas,to repay the $10,000,000 TD Bank loan issued in March 2010 and the $10,000,000 JPMorganChase loan issued in December 2011. Proceeds of the TD Bank loan were used in construction ofa new community center, while the proceeds from the JPMorgan Chase loans were used toconstruct a new recreation facility and assist with the payoff of an outstanding wastewater loan. Theloans are payable through January 2020. The total remaining to be paid on the loans is $6,272,273. For the current year, principal and interest paid were $2,597,677 and total Penny for Pinellas salestax revenues were $7,263,530.
City of Largo, Florida Notes to Financial Statements September 30, 2017
2017 Comprehensive Annual Financial Report | 78
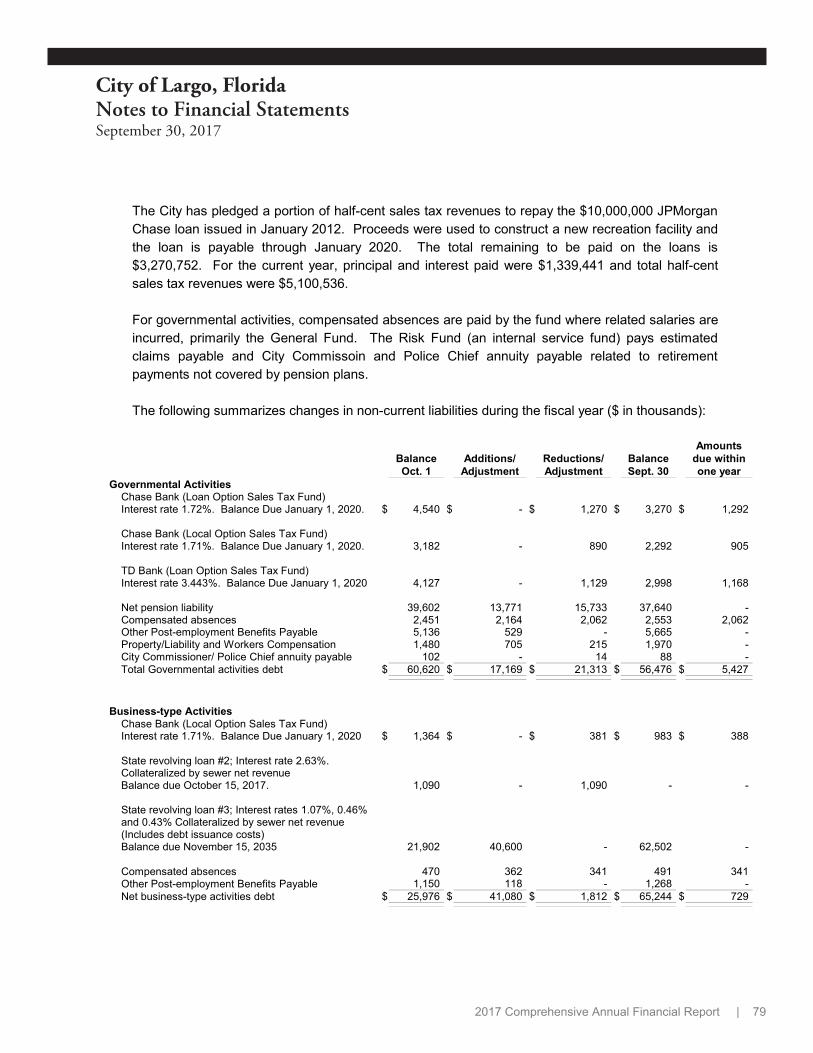
The City has pledged a portion of half-cent sales tax revenues to repay the $10,000,000 JPMorganChase loan issued in January 2012. Proceeds were used to construct a new recreation facility andthe loan is payable through January 2020. The total remaining to be paid on the loans is$3,270,752. For the current year, principal and interest paid were $1,339,441 and total half-centsales tax revenues were $5,100,536.
For governmental activities, compensated absences are paid by the fund where related salaries areincurred, primarily the General Fund. The Risk Fund (an internal service fund) pays estimatedclaims payable and City Commissoin and Police Chief annuity payable related to retirementpayments not covered by pension plans.
The following summarizes changes in non-current liabilities during the fiscal year ($ in thousands):
AmountsBalance Additions/ Reductions/ Balance due withinOct. 1 Adjustment Adjustment Sept. 30 one year
Governmental ActivitiesChase Bank (Loan Option Sales Tax Fund)Interest rate 1.72%. Balance Due January 1, 2020. $ 4,540 $ - $ 1,270 $ 3,270 $ 1,292
Chase Bank (Local Option Sales Tax Fund)Interest rate 1.71%. Balance Due January 1, 2020. 3,182 - 890 2,292 905
TD Bank (Loan Option Sales Tax Fund)Interest rate 3.443%. Balance Due January 1, 2020 4,127 - 1,129 2,998 1,168
Net pension liability 39,602 13,771 15,733 37,640 - Compensated absences 2,451 2,164 2,062 2,553 2,062 Other Post-employment Benefits Payable 5,136 529 - 5,665 - Property/Liability and Workers Compensation 1,480 705 215 1,970 - City Commissioner/ Police Chief annuity payable 102 - 14 88 - Total Governmental activities debt $ 60,620 $ 17,169 $ 21,313 $ 56,476 $ 5,427
Business-type ActivitiesChase Bank (Local Option Sales Tax Fund)Interest rate 1.71%. Balance Due January 1, 2020 $ 1,364 $ - $ 381 $ 983 $ 388
State revolving loan #2; Interest rate 2.63%.Collateralized by sewer net revenueBalance due October 15, 2017. 1,090 - 1,090 - -
State revolving loan #3; Interest rates 1.07%, 0.46%and 0.43% Collateralized by sewer net revenue(Includes debt issuance costs)Balance due November 15, 2035 21,902 40,600 - 62,502 -
Compensated absences 470 362 341 491 341 Other Post-employment Benefits Payable 1,150 118 - 1,268 - Net business-type activities debt $ 25,976 $ 41,080 $ 1,812 $ 65,244 $ 729
City of Largo, Florida Notes to Financial Statements September 30, 2017
2017 Comprehensive Annual Financial Report | 79

Other long-term liabilities, such as compensated absences and other post employment benefitspayable, are typically liquidated by the individual fund to which the liability is directly associated.
The following tables indicate future debt service requirements for both Governmental and business-typeactivities.
Governmental Activities Debt Service Requirements
Year Ending Total Total Total DebtSeptember 30 Principal Interest Service
2018 3,365,011 169,607 3,534,618 2019 3,443,696 90,922 3,534,618 2020 1,752,000 15,308 1,767,308
Total $ 8,560,707 $ 275,837 $ 8,836,544
Business-type Activities Debt Service Requirements
SRL #3 Chase 2011 TotalsFY Principal Interest Principal Interest Principal Interest Debt Service
2018 - - 387,906 14,319 387,906 14,319 402,225 2019 3,563,577 481,011 394,581 7,643 3,958,158 488,654 4,446,812 2020 3,591,452 453,136 199,830 1,282 3,791,282 454,418 4,245,700 2021 3,619,546 425,043 - - 3,619,546 425,043 4,044,589 2022 3,647,858 396,730 - - 3,647,858 396,730 4,044,588
2023-2027 18,671,799 1,551,142 - - 18,671,799 1,551,142 20,222,941 2028-2032 19,413,589 809,352 19,413,589 809,352 20,222,941 2033-2037 9,994,130 117,340 - - 9,994,130 117,340 10,111,470
Total $ 62,501,951 $ 4,233,754 $ 982,317 $ 23,244 $ 63,484,268 $ 4,256,998 $ 67,741,266
City of Largo, Florida Notes to Financial Statements September 30, 2017
2017 Comprehensive Annual Financial Report | 80

G. Fund equity
Governmental fund balances reported on the fund financial statements at September 30, 2017include the following:
NonmajorGeneral LOST SHIP HOME CDBG Funds Total
Nonspendable $ $ $ $ $ $ $ Deposits 39,360 - - - - - 39,360 Prepaid 2,028 - - - - - 2,028 Receivables 17,674 - - - - - 17,674 Property held for resale - -
Restricted Capital improvements and public works - 8,035,754 - - - 17,587,188 25,622,942 Economic development - - 742,691 - - 3,510,128 4,252,819 Public safety programs - - - - - 367,058 367,058 Youth and adult library/
recreation programs - - - - - 1,010,288 1,010,288 - - - - - 2,347,208 2,347,208 Parkland dedication
Assigned Subsequent year's operations 3,289,458 - - - - - 3,289,458 Accrued employee benefits 2,348,937 - - - - - 2,348,937 Other purposes - - - - - 175,330 175,330
Unassigned 9,796,197 - - - - - 9,796,197
$ 15,493,654 $ 8,035,754 $ 742,691 $ - $ - $ 24,997,200 $ 49,269,299
H. Encumbrances
Purchase orders are issued throughout the fiscal year to encumber budgets in the funds. Significant encumbrances in governmental funds as of September 30, 2017 are as follows:
Major governmental funds General $ 1,588,758 Local Option Sales Tax 5,202,761 SHIP 236,858
Total Major Funds 7,028,377 Non-major governmental funds 8,919,698 Total Encumbrances $ 15,948,075
City of Largo, Florida Notes to Financial Statements September 30, 2017
2017 Comprehensive Annual Financial Report | 81

V. OTHER DISCLOSURES
A. Risk management
The City’s Risk Management Fund (Internal Service Fund) is involved with two main elements of riskmanagement: risk control and risk financing. Risk control techniques are used to prevent/avoid potentiallosses, minimize the consequences of incurred losses, and segregate certain types of exposures. Riskfinancing techniques are used to obtain funds to restore the economic damages of losses including riskretention, risk transfer to insurers, and risk transfer to non-insurers (e.g., through indemnity clauses incontracts that transfer financial responsibility to the other contractual party).
Main activities of the Fund consist of: (1) initiating and monitoring risk control policies and procedures;(2) disbursing premium payments for insurance coverage; (3) processing and paying claims under theWorkers’ Compensation Act; and (4) processing and paying claims arising from property, vehicle andgeneral liability cases.
Fund revenue primarily includes contributions from other City funds and is planned to match expenseso f insurance premiums, anticipated “self-insured” losses and operating expenses. Premiums are paid intothe risk management fund by all other funds and are available to pay claims, claim reserves, andadministrative costs of the various risk programs. As of September 30, 2017, such interfund premiumsdid not exceed reimbursable expenditures.
The City recognizes insurance claim expenses based upon claims paid, claims reported, and estimatesof claims incurred but not reported (IBNR). Claims liabilities are recorded based upon the City’s bestestimates of potential losses after considering all available facts. The claims estimation process involvessubstantial uncertainties, including the ultimate outcome of certain legal actions that may affect theadequacy of amounts provided; however, management believes all claims liabilities recorded areappropriate.
Estimates of claims liabilities of the risk fund are reported when it is probable that a loss has occurredand the amount of the loss can be reasonably estimated. The actual result of this claims liabilityestimation process depends on many complex factors, such as investigations and discovery of facts,extent of the recovery of injured parties, inflation, changes in legal doctrines, and damage awards. Accordingly, claims are reevaluated periodically to consider the effects of new information, claimsettlement trends (including frequency and amount of pay-outs), and other factors. Due to the uncertainnature of the claims estimate, the City decided that it wasn't practical to recognize a portion as "due within one year" on the statement of net position.
City of Largo, Florida Notes to Financial Statements September 30, 2017
2017 Comprehensive Annual Financial Report | 82

The estimated claims liability also includes amounts for incremental claim adjustment expenses related tospecific claims and other claim adjustment expenses regardless of whether allocated to specific claims. Estimated recoveries, for example from salvage or subrogation, are another component of the claimsliability estimate. Excess coverage insurance policies cover individual claims in excess of certainamounts.
The City is partially “self-insured” for Workers Compensation claims on a per occurrence basis up to$600,000. The City carries insurance coverage for claims in excess of the Self-Insured Retention (SIR)level up to $1M per claim. The City has several ongoing claims that have exceeded SIR levels, whichwere lower in previous years (mostly $400,000 SIR).
The City carries insurance policies for employee health claims, EMS liability claims and general employeedisability claims. Public safety employee disability claims (sworn police and fire employees) are coveredthrough the pension plan.
The City carries property insurance with a $25,000 deductible per occurrence, and per occurrencecoverage of approximately $25M and for $181 million of insurable values. There have been nosettlements which exceeded insurance coverage.
The City is "self-insured” for motor vehicle and general liability claims. The City is relying on state statutesof sovereign immunity, which limit damage awards against local governments to $200,000 per claim and$300,000 per occurrence. There have been instances where the State Legislature has overridden thestatutes and removed these limitations; however, these instances are infrequent and the City of Largo hasnever been a party to a state legislative override. Sovereign immunity limits are not applicable in certaintypes of actions, such as breach of contract and federal civil rights actions.
The following is a roll-forward of claims reserves for the last two fiscal years:
Workers PropertyCompensation and Liability Total
Claims reserve, September 30, 2015 $ 1,315,000 $ 245,000 $ 1,560,000 Plus: Incurred claims and reserve adjustments 180,000 185,000 365,000 Less: Paid claims and reserve adjustments (355,000) (90,000) (445,000)Claims reserve, September 30, 2016 1,140,000 340,000 1,480,000 Plus: Incurred claims and reserve adjustments 555,000 150,000 705,000 Less: Paid claims and reserve adjustments (145,000) (70,000) (215,000)Claims reserve, September 30, 2017 $ 1,550,000 $ 420,000 $ 1,970,000
City of Largo, Florida Notes to Financial Statements September 30, 2017
2017 Comprehensive Annual Financial Report | 83

B. Contingent liabilities
Litigation. The City is a defendant in various lawsuits. Although the outcome of these lawsuits is notpresently determinable, it is the opinion of the City that the resolution of these matters will not have amaterial adverse effect on the City’s financial condition. Please refer to the note on Risk Management inthis section, V. A.
Federal and State Assistance Programs. Amounts received or receivable from grantor agencies aresubject to audit and adjustment by grantor agencies, principally the federal and state governments. Anydisallowed claims, including amounts already collected, may constitute a liability of the applicable funds. The amount, if any, of expenditures which may be disallowed by the grantor cannot be determined at thistime although the City expects such amounts, if any, to be immaterial.
C. Tax Abatements
The City enters into property tax abatements with local businesses under the s. 3, Art. VII of the FloridaState Constitution. The article provides the City the ability to grant community and economic developmentad valorem tax exemptions to new businesses and expansions of existing businesses. Chapter 22, articleVI of the City of Largo Code of Ordinances authorizes the granting of such exemptions.
For the fiscal year ended September 30, 2017, the City abated property taxes totaling $13,087 under thisprogram, including one agreement with a large distributor of IT products and services. The abatementwas enacted in November 2015 continues through December 31, 2024.
D. Subsequent Events
The City has continued to borrow funds for three Wastewater System Consent Order projects from theState DEP SRF Loan #3 after year end. Since September 30, 2017, additional draw downs totaling$5,712,688 have been received by the City resulting in a new loan principle balance of $66,527,423 as ofMarch 31, 2018.
Hurricane Irma occurred on September 10, 2017. The City took emergency protective measures toprepare for the storm and suffered minor losses. Over 50,000 cubic yards of debris was collected by theSolid Waste department and the City continued to incur costs after September 30, 2017 related toremoval of the debris and repair of City infrastructure. Total storm related costs to the City are estimatedto be approximately $2,000,000, including additional staff time, for which the City is in the process ofapplying for Federal Emergency Management Agency assistance.
E. Employee retirement systems and pension plans
Substantially all of the City’s full-time employees participate in three separate retirement plans: asingle-employer defined benefit pension plan (including disability pension) for police officers andfirefighters, a single-employer defined contribution retirement plan for most general employees, and asingle-employer defined contribution retirement plan for Executive Management employees. The Cityalso has a single-employer defined benefit disability income plan for general employees.
City of Largo, Florida Notes to Financial Statements September 30, 2017
2017 Comprehensive Annual Financial Report | 84

Summary of significant accounting policies – basis of accounting and valuation of investments (allpension funds). The City accounts for all four plans as pension trust funds; therefore they are accountedfor in substantially the same manner as proprietary funds with an “economic resources” measurementfocus and employment of the accrual basis of accounting. Financial statements are prepared using theaccrual basis of accounting.
Plan assets are valued at market value for financial statement purposes. Securities are traded on anational exchange and are valued at the last reported sales price on September 30. Plan membercontributions, employer contributions, and contributions from other entities are recognized in the period inwhich the contributions are due. Benefits and refunds are recognized when due and payable inaccordance with terms of the Plan. Plan member contributions are recognized in the period contributionsare due. The City’s contributions are recognized when due and a formal commitment to provide thecontribution has been made. Benefits and refunds are recognized when due and payable in accordancewith the terms of the plan.
Since separate financial reports are not issued for any individual plan, GAAP require inclusion of eachplan’s financial information in the notes, even though this information is already presented in combiningand individual fund statements. The following information is presented in compliance with GAAPrequirements.
City of Largo, Florida Notes to Financial Statements September 30, 2017
2017 Comprehensive Annual Financial Report | 85
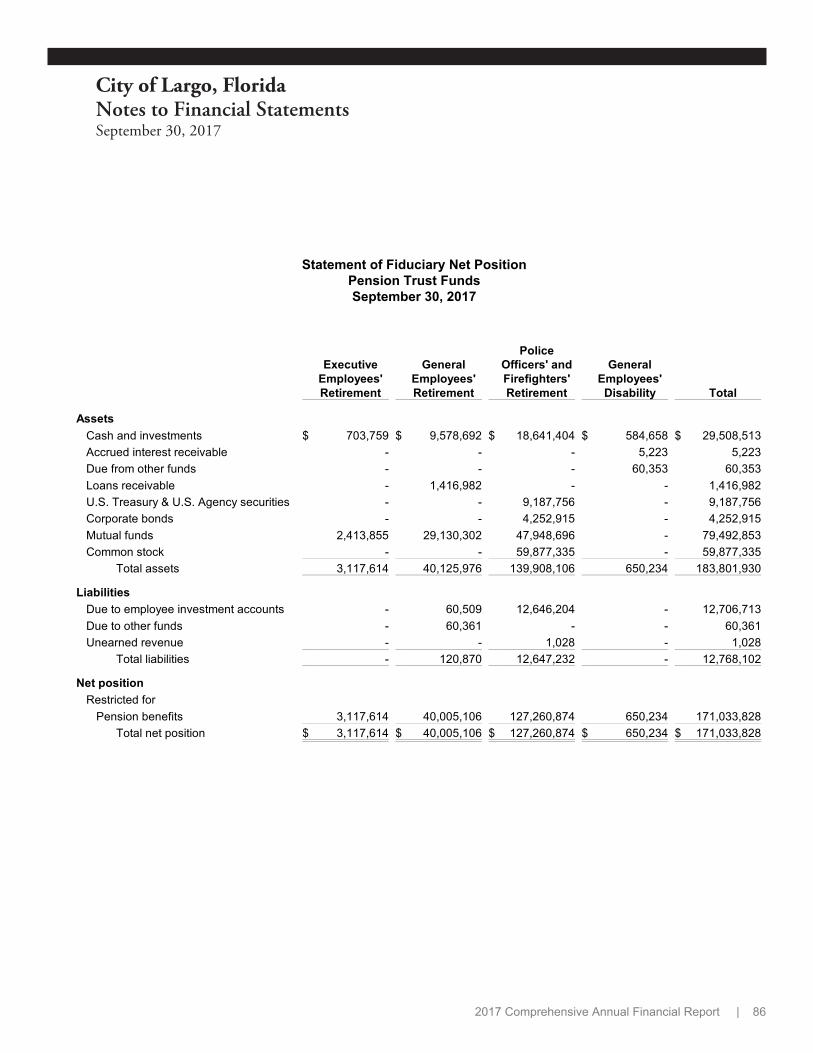
ExecutiveEmployees'Retirement
GeneralEmployees'Retirement
PoliceOfficers' andFirefighters'Retirement
GeneralEmployees'Disability Total
AssetsCash and investments $ 703,759 $ 9,578,692 $ 18,641,404 $ 584,658 $ 29,508,513Accrued interest receivable - - - 5,223 5,223Due from other funds - - - 60,353 60,353Loans receivable - 1,416,982 - - 1,416,982U.S. Treasury & U.S. Agency securities - - 9,187,756 - 9,187,756Corporate bonds - - 4,252,915 - 4,252,915Mutual funds 2,413,855 29,130,302 47,948,696 - 79,492,853Common stock - - 59,877,335 - 59,877,335
Total assets 3,117,614 40,125,976 139,908,106 650,234 183,801,930
LiabilitiesDue to employee investment accounts - 60,509 12,646,204 - 12,706,713Due to other funds - 60,361 - - 60,361Unearned revenue - - 1,028 - 1,028
Total liabilities - 120,870 12,647,232 - 12,768,102
Net positionRestricted for
Pension benefits 3,117,614 40,005,106 127,260,874 650,234 171,033,828Total net position $ 3,117,614 $ 40,005,106 $ 127,260,874 $ 650,234 $ 171,033,828
Statement of Fiduciary Net PositionPension Trust FundsSeptember 30, 2017
City of Largo, Florida Notes to Financial Statements September 30, 2017
2017 Comprehensive Annual Financial Report | 86
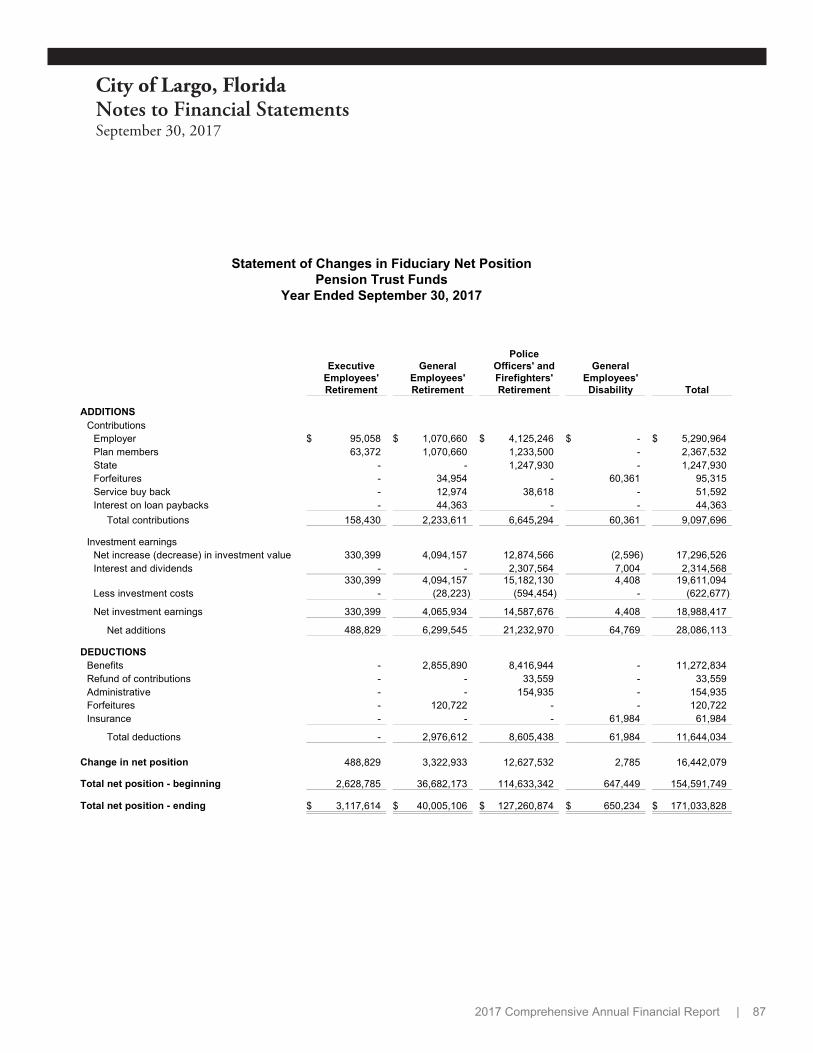
ExecutiveEmployees'Retirement
GeneralEmployees'Retirement
PoliceOfficers' andFirefighters'Retirement
GeneralEmployees'Disability Total
ADDITIONSContributions
Employer $ 95,058 $ 1,070,660 $ 4,125,246 $ - $ 5,290,964Plan members 63,372 1,070,660 1,233,500 - 2,367,532State - - 1,247,930 - 1,247,930Forfeitures - 34,954 - 60,361 95,315Service buy back - 12,974 38,618 - 51,592Interest on loan paybacks - 44,363 - - 44,363
Total contributions 158,430 2,233,611 6,645,294 60,361 9,097,696
Investment earningsNet increase (decrease) in investment value 330,399 4,094,157 12,874,566 (2,596) 17,296,526Interest and dividends - - 2,307,564 7,004 2,314,568
330,399 4,094,157 15,182,130 4,408 19,611,094Less investment costs - (28,223) (594,454) - (622,677)
Net investment earnings 330,399 4,065,934 14,587,676 4,408 18,988,417
Net additions 488,829 6,299,545 21,232,970 64,769 28,086,113
DEDUCTIONSBenefits - 2,855,890 8,416,944 - 11,272,834Refund of contributions - - 33,559 - 33,559Administrative - - 154,935 - 154,935Forfeitures - 120,722 - - 120,722Insurance - - - 61,984 61,984
Total deductions - 2,976,612 8,605,438 61,984 11,644,034
Change in net position 488,829 3,322,933 12,627,532 2,785 16,442,079
Total net position - beginning 2,628,785 36,682,173 114,633,342 647,449 154,591,749
Total net position - ending $ 3,117,614 $ 40,005,106 $ 127,260,874 $ 650,234 $ 171,033,828
Statement of Changes in Fiduciary Net PositionPension Trust Funds
Year Ended September 30, 2017
City of Largo, Florida Notes to Financial Statements September 30, 2017
2017 Comprehensive Annual Financial Report | 87
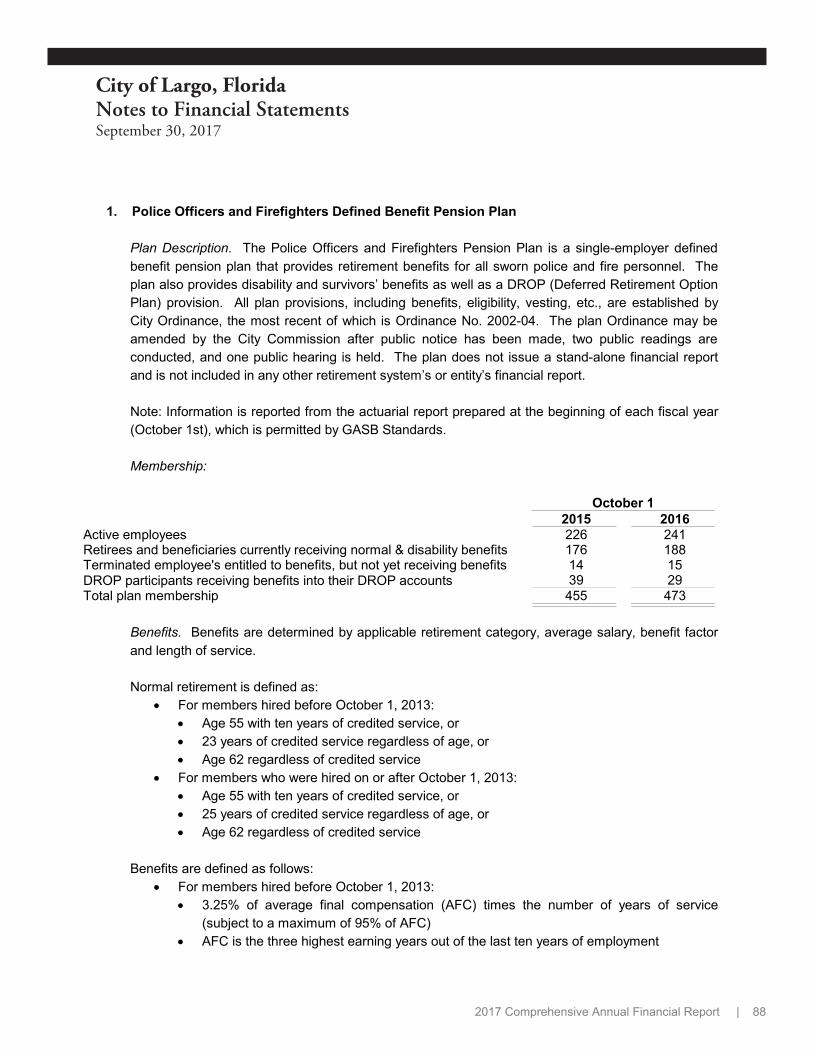
1. Police Officers and Firefighters Defined Benefit Pension Plan
Plan Description. The Police Officers and Firefighters Pension Plan is a single-employer definedbenefit pension plan that provides retirement benefits for all sworn police and fire personnel. Theplan also provides disability and survivors’ benefits as well as a DROP (Deferred Retirement OptionPlan) provision. All plan provisions, including benefits, eligibility, vesting, etc., are established byCity Ordinance, the most recent of which is Ordinance No. 2002-04. The plan Ordinance may beamended by the City Commission after public notice has been made, two public readings areconducted, and one public hearing is held. The plan does not issue a stand-alone financial reportand is not included in any other retirement system’s or entity’s financial report.
Note: Information is reported from the actuarial report prepared at the beginning of each fiscal year(October 1st), which is permitted by GASB Standards.
Membership:
October 1 2015 2016
Active employees 226 241 Retirees and beneficiaries currently receiving normal & disability benefits 176 188 Terminated employee's entitled to benefits, but not yet receiving benefits 14 15 DROP participants receiving benefits into their DROP accounts 39 29 Total plan membership 455 473
Benefits. Benefits are determined by applicable retirement category, average salary, benefit factorand length of service.
Normal retirement is defined as: For members hired before October 1, 2013:
Age 55 with ten years of credited service, or 23 years of credited service regardless of age, or Age 62 regardless of credited service
For members who were hired on or after October 1, 2013: Age 55 with ten years of credited service, or 25 years of credited service regardless of age, or Age 62 regardless of credited service
Benefits are defined as follows: For members hired before October 1, 2013:
3.25% of average final compensation (AFC) times the number of years of service(subject to a maximum of 95% of AFC)
AFC is the three highest earning years out of the last ten years of employment
City of Largo, Florida Notes to Financial Statements September 30, 2017
2017 Comprehensive Annual Financial Report | 88
For members who were hired on or after October 1, 2013: 2.75% of (AFC) times the number of years of service (subject to a maximum of 95% of
AFC) AFC is the five highest earning years out of the last ten years of employment
A service incurred disability benefit and a non-service incurred disability benefit is available at 60%of AFC and 50% of AFC, respectively, for continuous and permanent incapacity as defined by statestatutes. Vesting is 100% after ten years of creditable service; 0% prior to ten years, except fordisability benefits. The Plan does not provide for any post-retirement benefit increases.
Contributions. Employees contribute a fixed percentage of elligible compensation (currently 8%) ona pre-tax basis which may be amended by ordinance after collective bargaining.
Plan member contributions are recognized in the period in which the contributions are due. Citycontributions to the plan, as calculated by the plan actuary, are recognized as revenue when dueand the City has made a formal commitment to provide contributions. The City and employees'contributions for the fiscal year ended September 30, 2017 were $4,125,246 and $1,272,118,respectively. The City's contribution was made in accordance with actuarially determinedcontribution requirements ascertained through an actuarial valuation performed at October 1, 2016(one year in arrears).
The State of Florida has levied a tax on property, casualty, and auto insurance premiums, theproceeds of which are distributed to local governmental entities that maintain qualified PoliceOfficers and Firefighters pension plans. State contributions are an integral part of the plan’s fundingsources. The state has previously altered the amount or the usage of this tax and may do so againunilaterally at any time. The amount of state contributions for this fiscal year was $1,247,930. Thisamount was recorded as an intergovernmental revenue and an expenditure in the General Fund.
Net Pension Liability. The net pension liability was measured as of October 1, 2016, and the totalpension liability used to calculate the net pension liability was determined by an actuarial valuationas of that date.
The schedules of net pension liability, presented as required supplementary information (RSI)following the notes to the financial statements, present multi-year trend information about whetherthe plan net positions are increasing or decreasing over time relative to the total pension liabilities forbenefits.
The City is required by state statutes to make annual contributions that fluctuate according to themost recent actuarial valuation report, after deducting estimated contributions by members,contributions received from premium taxes, investment earnings, and all plan expenses. Significantactuarial assumptions used to compute actuarially determined contribution requirements are the
City of Largo, Florida Notes to Financial Statements September 30, 2017
2017 Comprehensive Annual Financial Report | 89

same as those used to compute the total pension liability.
The following information and assumptions were used in the most recent actuarial valuation.
October 1, 2015Valuation DateContribution Rates as a % of payoll
Employer (and State) 39.88%Plan Members 8%
Actuarial Cost Method (Funding) Entry Age Normal
Amortization Method Level Percent, ClosedMortality Rates RP-2000 Generational Mortality TableRemaining amortization period 30 years
Asset valuation method Market Value (Fair value)
Actuarial assumptionsInvestment rate of return 7.5%Projected salary increases 5%Includes inflation and other general increases at 3%Cost-of-living adjustments Not Applicable
Deferred Retirement Option Plan (DROP). When a plan member reaches retirement eligibility, themember may elect to participate in a deferred retirement option plan (DROP). Members who electto enter the DROP continue working, but all pension contributions stop and the pension benefitearned is deposited for that member in a separate account within the pension plan. DROP assetsare segregated from other plan assets and invested separately. At termination of employment(which cannot exceed seven years from the date of election into the DROP), DROP members havean option of receiving a lump sum payment or rolling over the account balance into a tax deferredaccount with all future pension benefit payments going directly to the member.
Share Plan. The Plan provides an individual share account for all active firefighters and forfirefighters who are DROP members, retirees, and terminated vested members on October 1, 2009.The Plan also provides an individual share account for all active police officers and for police officersemployed on September 1, 2011. The Share Plan allocation is derived from any non-dedicatedChapter 175 (fire) or 185 (police) revenue that exceeds the base amount. The excess revenue, netof administrative expenses, is allocated annually to individual accounts which earn interest at therate of investment return realized by the individual share plan account. Effective October 1, 2013, aportion of excess annual revenue is allocated to individual accounts if the plan's funding leveldetermined in the most recent valuation report is 80% and all excess revenue is allocated toindividual accounts once the plan's funding level reaches 100%.
City of Largo, Florida Notes to Financial Statements September 30, 2017
2017 Comprehensive Annual Financial Report | 90

Investment policy. The plan's policy in regard to the allocation of invested assets is established bythe pension board and may be amended by the pension board by a majority vote of its members. Itis the policy of the board to pursue an investment strategy that reduces risk through the prudentdiversification of the portfolio across a broad selection of distinct asset classes. The Board'sadopted Investment Policy is 62.5% equity, 30.0% bonds and 7.5% real estate. The following is theboard's target asset allocation as of September 30, 2016:
Asset Class Target Allocation Actual AllocationDomestic equities
Small Cap Blend 10.0% 11.9% Small Cap Growth 20.0% 21.3% Small Cap Value 20.0% 20.5%
International equitiesDeveloped markets 5.0% 2.7% Emerging Markets 7.5% 9.2%
Fixed income 30.0% 24.9% Real estate 7.5% 9.5%
100.0% 100.0%
The long-term expected rate of return on pension plan investments was determined using abuilding-block method in which best-estimate ranges of expected future real rates of return(expected returns, net of pension plan investment expense and inflation) are developed for eachmajor asset class. These ranges are combined to produce the long-term expected rate of return byweighting the expected future real rates of return by the target asset allocation percentage and byadding expected inflation. Best estimates of arithmetic real rates of return for each major asset classincluded in the pension plan’s target asset allocation as of September 30, 2016 are summarized inthe following table:
Long-TermExpected Real Weighted
Asset Class Rate of Return AverageDomestic equities
Small Cap Blend 10.70% 0.54% Small Cap Growth 10.90% 2.18% Small Cap Value 10.50% 2.10%
International equitiesDeveloped markets 9.70% 0.49% Emerging Markets 12.40% 0.93%
Fixed income 4.40% 0.44% Real estate 9.30% 0.35%
Total 7.03%
Rate of return. For the year ended September 30, 2016, the annual money-weighted rate of returnon pension plan investments, net of pension plan investment expense, was 9.09%. The
City of Largo, Florida Notes to Financial Statements September 30, 2017
2017 Comprehensive Annual Financial Report | 91

money-weighted rate of return expresses investment performance, net of investment expense,adjusted for the changing amounts actually invested.
Method used to value investments. Investments are reported at fair value. Securities and fundstraded on a national or international exchange are valued at the last reported sales price at currentexchange rates.
Discount rate. A single discount rate of 7.5% was used to measure the total pension liability. Theprojection of cash flows used to determine this single discount rate assumed that plan membercontributions will be made at the current contribution rate and that employer contributions will bemade at rates equal to the difference between the total actuarially determined contribution rates andthe member rate. Based on these assumptions, the pension plan’s fiduciary net position wasprojected to be available to make all projected future benefit payments of current plan members.Therefore, the long-term expected rate of return on pension plan investments (7.5%) was applied toall periods of projected benefit payments to determine the total pension liability.
Changes in the Total Pension Liability and the Net Pension Liability are as follows:
Total Pension Plan Fiduciary Net PensionLiability Net Position Liability
(a) (b) (a)-(b) $ 160,834,858 $ 121,233,244 $ 39,601,614 Balance at of September 30, 2015
Changes for the yearService cost 2,778,149 - 2,778,149 Interest 11,915,555 - 11,915,555 Difference between actual & expectedexperience (1,057,151) - (1,057,151)Contributions - employer - 3,460,575 (3,460,575)Contributions - employer (through state) - 1,187,377 (1,187,377)Contributions - member - 1,207,817 (1,207,817)Net investment income - 9,877,031 (9,877,031)Benefit payments (9,359,155) (9,359,155) - Refunds (118,729) (118,729) - Administrative expense - (134,134) 134,134 Other - - -
Net changes 4,158,669 6,120,782 (1,962,113)Balance at of September 30, 2016 $ 164,993,527 $ 127,354,026 37,639,501
City of Largo, Florida Notes to Financial Statements September 30, 2017
2017 Comprehensive Annual Financial Report | 92

Sensitivity of the Net Pension Liability to changes in discount rate. The following table presents theplan’s net pension liability of the Plan's current fiscal year of September, 20, 2017, calculated usinga single discount rate of 7.5%, as well as what the plan’s net pension liability would be if it werecalculated using a single discount rate that is 1-percentage-point lower or 1-percentage-point higher(sensitivity range):
Current SingleDiscount Rate
1% Decrease Assumption 1% Increase6.50% 7.50% 8.50%
$ 55,310,537 $ 37,639,501 $ 22,854,334
Pension expense, Deferred Outflows of Resources and Deferrred Inflows of Resources. For the yearended September 30, 2017 the City recognized pension expense of $5,381,092. At September 30,2017, the City reported deferred outflows of resources and deferred inflows of resources related topensions from the following sources:
Deferred Outflows Deferred Inflowsof Resources or Resources
Difference between expected and actualexperience $ - $ 921,304 Net difference between projected and actualearnings on pension plan investments 5,183,535 1,681,431 Employer contributions made subsequent tothe measurement date 5,373,176 -
Total $ 10,556,711 $ 2,602,735
Deferred outflows of resources related to the Plan, including $5,373,176 resulting from City contributions to the Plan subsequent to the measurement date, will be recognized as a increase of the net pension liability for the fiscal year ended September 30, 2018. Other amounts reported as deferred outflows of resources will be recognized in pension expense as follows:
Year ended September 30 2018 $ 712,705 2019 794,035 2020 1,284,924 2021 (210,864)
2022 and thereafter - $ 2,580,800
City of Largo, Florida Notes to Financial Statements September 30, 2017
2017 Comprehensive Annual Financial Report | 93
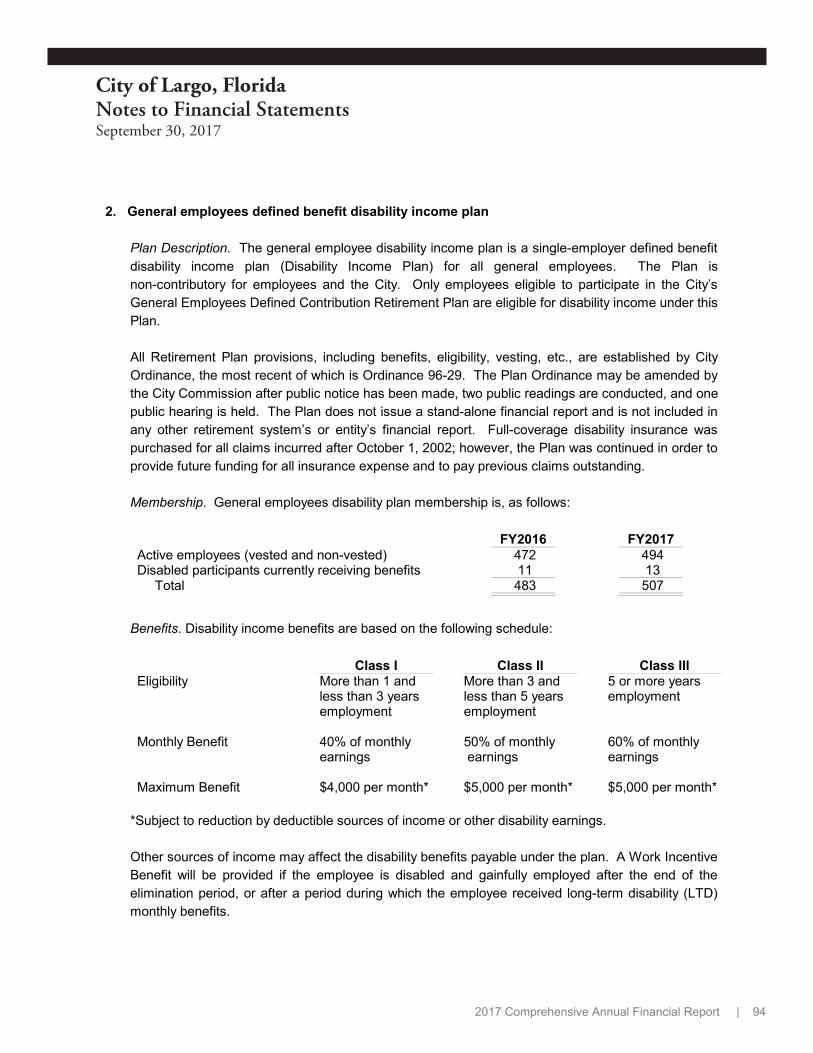
2. General employees defined benefit disability income plan
Plan Description. The general employee disability income plan is a single-employer defined benefitdisability income plan (Disability Income Plan) for all general employees. The Plan isnon-contributory for employees and the City. Only employees eligible to participate in the City’sGeneral Employees Defined Contribution Retirement Plan are eligible for disability income under thisPlan.
All Retirement Plan provisions, including benefits, eligibility, vesting, etc., are established by CityOrdinance, the most recent of which is Ordinance 96-29. The Plan Ordinance may be amended bythe City Commission after public notice has been made, two public readings are conducted, and onepublic hearing is held. The Plan does not issue a stand-alone financial report and is not included inany other retirement system’s or entity’s financial report. Full-coverage disability insurance waspurchased for all claims incurred after October 1, 2002; however, the Plan was continued in order toprovide future funding for all insurance expense and to pay previous claims outstanding.
Membership. General employees disability plan membership is, as follows:
FY2016 FY2017Active employees (vested and non-vested) 472 494 Disabled participants currently receiving benefits 11 13
Total 483 507
Benefits. Disability income benefits are based on the following schedule:
Class I Class II Class IIIEligibility More than 1 and More than 3 and 5 or more years
less than 3 years less than 5 years employmentemployment employment
Monthly Benefit 40% of monthly 50% of monthly 60% of monthly earnings earnings earnings
Maximum Benefit $4,000 per month* $5,000 per month* $5,000 per month*
*Subject to reduction by deductible sources of income or other disability earnings.
Other sources of income may affect the disability benefits payable under the plan. A Work IncentiveBenefit will be provided if the employee is disabled and gainfully employed after the end of theelimination period, or after a period during which the employee received long-term disability (LTD)monthly benefits.
City of Largo, Florida Notes to Financial Statements September 30, 2017
2017 Comprehensive Annual Financial Report | 94

Compensation includes regular pay for normal hours worked (including normal leave time) andexcludes extraordinary compensation, such as overtime, bonuses, severance pay, etc. The Planonly provides benefits during disability. Benefits also cease upon the death of the participant, orwhen a participant who is 61 years of age or younger reaches the normal retirement age (age 65).Participants who are 62 years of age or older at the time of disability receive benefit periods of 42months to 12 months, depending on age.
Funding Policy. The Plan is primarily funded through a surplus of net Plan assets available uponconversion of the City’s General Employees Defined Benefit Pension Plan to the GeneralEmployees Defined Contribution Pension Plan in 1996. The Plan also receives one-half of allaccount forfeitures from the General Employees Defined Contribution Retirement Plan andinvestment earnings on plan assets.
3. General employees defined contribution retirement plan
Plan Description. The General Employees Defined Contribution Retirement Plan was established toprovide supplemental income to employees upon retirement. All employees are eligible toparticipate in the Plan, except Police Officers, Firefighters, and Executive Management employees.,elected officials and employees whose customary employment is for less than 30 hours in any oneweek, or less than five months in any calendar year.
All Plan provisions, including benefits, eligibility, vesting, etc., are established by City Ordinance, themost recent of which is Ordinance 96-09. The Plan Ordinance may be amended by the CityCommission after public notice has been made, two public readings are conducted, and one publichearing is held. The Plan does not issue a stand-alone financial report and is not included in anyother retirement system’s or entity’s financial report.
All investments are directed by Plan members, including the non-vested portion of the City’scontributions, if any. Plan members may elect to allocate investments among stock mutual funds,money market funds, and fixed income mutual funds.
Membership. General employees defined contribution plan membership is, as follows:
FY2016 FY2017Active employees (vested and non-vested) 499 538 Retired and terminated members maintaining balances 481 162
Total 980 700
City of Largo, Florida Notes to Financial Statements September 30, 2017
2017 Comprehensive Annual Financial Report | 95

Benefits. Member contributions are 100% vested at all times. Employer contributions becomevested on a graduated basis at the rate of 25% per year after the second year of employment, with100% vesting after five years of employment. Actual benefits received are completely dependent onthe amount of contributions made plus investment earnings.
Funding Policy. Members are required to contribute 5% of covered salary (regular pay only) to the Plan, and the City is required to match this contribution percentage. During FY 2017, actual contributions were $1,070,660 from employees and $1,070,660 from the City, excluding roll-over dollars from other plans, if any. There was no outstanding employer liability at year end.
Loans. Employee loans are permitted up to 50% if the vested portion of acount balance of at least$4,000 with a minimum of $2,000 and a maximum of $50,000. Loans must be repaid within 5 yearswith interest determined at the time of the loan.
4. Executive management defined contribution retirement plan
Plan Description and membership. The Executive Management 401(a) Plan operates similarly tothe General Employees’ 401(a) Plan. There is no minimum number of participants required, whichis well suited to the City’s relatively small group of Executive Management personnel. The plan has10 active members.
Funding Policy. The City contribution is 7.5% of covered pay and member contributions are 5% ofcovered pay. Actual contributions were $63,372 from employees and $95,058 from the City.
Benefits. The vesting schedule is 100% at the date of hire. All investments are reported at fairvalue. All investments are directed by Plan members. Plan members may elect to allocateinvestments among stock mutual funds, money market funds, and fixed income mutual funds. Actual benefits received are completely dependent on the amount of contributions made plusinvestment earnings.
All Retirement Plan provisions, including benefits, eligibility, vesting, etc., are established by CityResolution, the most recent of which is Resolution No. 1740. The Plan does not issue a stand-alonefinancial report and is not included in any other retirement system’s or entity’s financial report.
City of Largo, Florida Notes to Financial Statements September 30, 2017
2017 Comprehensive Annual Financial Report | 96

5. Deferred compensation retirement savings plan
In addition to the four pension plans described above, the City offers all employees a voluntarydeferred compensation plan created in accordance with Internal Revenue Code (IRS) Section457(b). The plan is voluntary and permits employees to defer taxes on a portion of their salary untilfuture years. Deferred compensation can be withdrawn upon termination, retirement, death, orunforeseeable emergency. All amounts of deferred compensation, all property, all rights, and allincome are held in trust for employees and are subject only to the claims of the employee or otherbeneficiary. The City contributes to the account of the City Manager, as stipulated in the CityManager employment contract. Although these contributions are employer contributions, thecontributions are for the direct benefit of the employee.
It is the opinion of the City that the City has no liability for losses under the IRS Section 457(b) plan,the City does have the duty of due care that would be required of any prudent administrator. Sincethe City has no liability for losses and exercises no significant administrative control over assets, theDeferred Compensation Fund has been removed from the City’s financial statements in accordancewith GAAP.
Loans. Employee loans are permitted up to 50% if the vested portion of acount balance of at least$4,000 with a minimum of $2,000 and a maximum of $50,000. Loans must be repaid within 5 yearswith interest determined at the time of the loan.
Changes in total plan assets during the year were as follows:
Market ValueNet plan assets, October 1, 2016 $ 30,617,111 Employee contributions 1,250,132 Employer contributions 6,742 Rollover contributions 269,356 Earnings (loss) 3,359,055 Distributions (2,106,229)Net plan assets, September 30, 2017 $ 33,396,167
City of Largo, Florida Notes to Financial Statements September 30, 2017
2017 Comprehensive Annual Financial Report | 97

6. Voluntary Post-employment Health Savings Plan
Prior to FY 2008, the City offered all employees a voluntary Post-employment health savings plan.The Plan was discontinued in FY 2008 for all employees except members of the Police BenevolentAssociation (PBA) bargaining unit which were discontinued as of FY 2008, due to changes in U.S.Treasury regulations. Existing employee contributions may remain in the Plan.
It is the opinion of the City that the City has no liability for losses under this plan, but does have theduty of care that would be required of any ordinary prudent administrator. Since the City has noliability for losses and exercises no significant administrative control over assets, the VoluntaryPost-employment Health Savings Plan has not been included in the City’s financial statements inaccordance with GAAP.
Net Plan Assets, October 1, 2016 $ 93,521 Employee Contributions - Earnings/(Loss) 226 Distributions (21,314)Net Plan Assets, September 30, 2017 $ 72,433
7. Other Post-employment Benefits Payable (OPEB)
At September 30, 2009, the City adopted Governmental Accounting Standards Board (GASB)Statement No. 45, Accounting and Financial Reporting by Employers for Post-employment BenefitsOther than Pensions. The City engaged an actuary to determine the City’s liability forPost-employment healthcare benefits other than pensions as of September 30, 2017.
Plan Description. The City participates in a single-employer health plan (“the Plan”) that provides health and dental insurance to eligible employees and their spouses. Pursuant to the provisions of section 112.0801, Florida Statutes, former employees and eligible dependents may continue to participate in the City’s fully insured health plan for medical and prescription drug coverage. Retirees are completely responsible for payment of their insurance premiums and the City does not contribute toward this payment. However, the City is presumed to be subsidizing the premium rates paid by retirees by allowing them to participate in the plans at blended group premium rates (implicitly subsidized) for both active and retired employees. The Plan does not issue a publicly available financial report.
Funding Policy. Premium contribution requirements are negotiated between the City and unionrepresentatives.
City of Largo, Florida Notes to Financial Statements September 30, 2017
2017 Comprehensive Annual Financial Report | 98

Membership. There are 34 retired participants and dependents receiving health benefits. For FY2017, the City's implicit contribution was $281,000 to the plan.
Annual OPEB Cost and Net OPEB Obligation. The City’s annual other Post-employment benefit(OPEB) cost (expense) is calculated based on the annual required contribution (ARC), an amountactuarially determined in accordance with the parameters of GASB Statement 45. The ARCrepresents a level of funding that, if paid on an ongoing basis, is projected to cover normal costeach year and amortize any unfunded actuarial liabilities over a period not to exceed thirty years.The following table shows the components of the City’s annual OPEB cost for the year, the amountactually paid from the plan, and changes in the City’s net OPEB obligation.
2016 2017 Annual Required Contribution $ 1,175,000 $ 1,227,000 Interest on Net OPEB Obligation 224,000 251,000 Adjustment to Annual Required Contribution (485,000) (544,000)
Annual OPEB Cost (Expense) 914,000 934,000 Contributions Made (229,000) (281,000)Interest on Employer Contributions (5,000) (6,000)
Increase in Net OPEB Obligation 680,000 647,000 Net OPEB Obligation-Beginning of Year 5,606,000 6,286,000 Net OPEB Obligation-End of Year $ 6,286,000 $ 6,933,000
A summary of key information is, as follows:
Year Ended Cost Cost Contributed by City Net OPEB Obligation9/30/2015 $ 897,000 26% $ 5,606,000 9/30/2016 914,000 26% 6,286,000 9/30/2017 934,000 31% 6,933,000
Funded Status and Funding Progress. The actuarial valuation date is October 1, 2015. As of September 30, 2017, the actuarial accrued liability for implicit benefits was $7,308,000, and the actuarial value of assets was $0, resulting in an unfunded actuarial accrued liability of $7,308,000. The annual covered payroll for active employees covered by the plan was $33,826,000, and the ratio of the unfunded actuarial accrued liability to the covered payroll was 25.2%.
Actuarial valuations of an ongoing plan involve estimates of the value of reported amounts andassumptions about the probability of occurrence of events far into the future. Examples includeassumptions about future employment, mortality, years of participation in the plan prior to reachingmedicare eligibility and healthcare cost trends. Amounts determined regarding the funded status of theplan and the annual required contributions of the employer are subject to continual revision as actualresults are compared with past expectations and new estimates are made about the future. Theschedule of funding progress, presented as required supplementary information following the notes tothe financial statements, presents multi-year trend information about whether the actuarial value of planassets is increasing or decreasing over time relative to the actuarial accrued liabilities for benefits.
City of Largo, Florida Notes to Financial Statements September 30, 2017
2017 Comprehensive Annual Financial Report | 99

Actuarial Methods and Assumptions. Projections of benefits for financial reporting purposes are basedon the substantive plan (the plan as understood by the employer and plan members) and include thetypes of benefits provided at the time of each valuation and the historical pattern of sharing of benefitcosts between the employer and plan members to that point. The actuarial methods and assumptionsused include techniques that are designed to reduce the effects of short-term volatility in actuarialaccrued liabilities and the actuarial value of assets, consistent with the long-term perspective of thecalculations.
In the October 1, 2015 actuarial valuation, the projected unit credit actuarial cost method was used. The actuarial assumptions included a 4% discount rate which is a blended rate of the expected long-term investment returns on plan assets and on the employer’s own investments calculated based on the funded level of the plan at the valuation date, with 2.75% of the rate being attributed to inflation. The initial healthcare trend rate was 8%, reduced by decrements to an ultimate rate of 5.5% after five years. The UAAL is being amortized as a level percentage of projected payrolls on an open basis. The remaining amortization period at September 30, 2017 was 13 years.
City of Largo, Florida Notes to Financial Statements September 30, 2017
2017 Comprehensive Annual Financial Report | 100

POLICE OFFICERS AND FIREFIGHTERS PENSION PLANSCHEDULE OF CHANGES IN THE NET PENSION LIABILITY
PAST TEN YEARS ($ in thousands)
2015 2016 2017 Service cost $ 2,575 $ 2,572 $ 2,778 Interest 11,080 11,499 11,916 Changes of benefit terms - - - Difference between expected and actual experience (427) - (1,057)Changes of assumptions - - - Benefit payments, including refunds of employee contributions (7,325) (7,965) (9,478)Other 5 - Net change in total pension liability 5,908 6,106 4,159 Total pension liability-beginning 148,821 154,729 160,835 Total pension liability-ending 154,729 160,835 $ 164,994
Plan fiduciary net positionContributions-employer $ 4,591 $ 5,025 $ 4,648 Contributions-employee 706 940 1,208 Net investment income 10,838 497 9,877 Benefit payments, including refunds of employee contribtuons (7,325) (7,965) (9,478)Administrative expense (154) (149) (134)Other - - - Net change in fiduciary net postion 8,656 (1,652) 6,121
Plan fiduciary net position-beginning 114,230 122,885 121,233 Plan fiduciary net position-ending 122,886 121,233 127,354
Net pension liability $ 31,843 $ 39,602 $ 37,640
Plan fiduciary net position as a percentage of the total pension liability 79.42% 75.38% 77.19%
Covered employee payroll 12,456 13,311 13,660
Net pension liability as a percentage of covered payroll 255.64% 297.51% 275.55%
Notes to Schedule
Data unavailable prior to 2015 because it was not required by GASB Standards. Data not presented for most recentfiscal year because the Ciy has elected to use the prior fiscal year data to ensure availability, which is permitted byGASB Standards. Subsequent years will be added as available.
City of Largo, FloridaRequired Supplementary Information September 30, 2017
2017 Comprehensive Annual Financial Report | 101

POLICE OFFICERS AND FIREFIGHTERS PENSION PLANSCHEDULE OF CONTRIBUTIONS
LAST TEN FISCAL YEARS($ in thousands)
2014 2015 2016 2017 Actuarially determined contribution $ 4,987 5,025 $ 4,648 $ 5,373 Contributions in relation to the actuarially determined contribution 4,591 5,025 4,648 5,373 Contribution deficiency (excess) 396 * - - - Covered-employee payroll 12,456 13,311 13,660 15,419 Contributions as a percentage of covered-employee payroll 36.9% 37.8% 34.0% 34.8%
* Contribution deficiency in 2014 reflects excess contributions in 2013
Notes to Schedule:
Valuation Date: October 1, 2015Actuarially determined contribution rates are calculated as of October 1, two years prior to the end of the fiscal year inwhich contributions are reported.
Methods and Assumptions Used to Determine Net Pension Liability:
Actuarial Cost Method Entry Age NormalAmortization Method Level Percentage of Payroll, ClosedRemaining Amortization Period 30 yearsAsset Valuation Method Market ValueInflation 3.0%Salary Increases 5.0% including inflationInvestment Rate of Return 7.5%Retirement Age Experience-based table of rates that are specific to type of eligibility condition.Mortality RP-2000 Combined Healthy Participant Mortality Table for males and females with
mortality improvement projected to all future years after 2000 using Scale AA.
Other Information:Notes to schedule: Data unavailable prior to 2015 because it was not required by GASB Standards. Data
not presented for most recent fiscal year because the Ciy has elected to use the priorfiscal year data to ensure availability, which is permitted by GASB Standards.Subsequent years will be added as available.
See Discussion of Valuation results in the October 1, 2015 Actuarial Valuation Report dated January 8, 2016.
City of Largo, FloridaRequired Supplementary Information September 30, 2017
2017 Comprehensive Annual Financial Report | 102

POLICE OFFICERS AND FIREFIGHTERS PENSION PLANSCHEDULE OF INVESTMENT RETURNS
2015 2016 2017 Annual money-weighted rate of return 10.66% 0.33% 9.09%
Notes to Schedule Data unavailable prior to 2015 because it was not required by GASB Standards. Data notpresented for most recent fiscal year because the Ciy has elected to use the prior fiscal yeardata to ensure availability, which is permitted by GASB Standards. Subsequent years will beadded as available.
City of Largo, FloridaRequired Supplementary Information September 30, 2017
2017 Comprehensive Annual Financial Report | 103
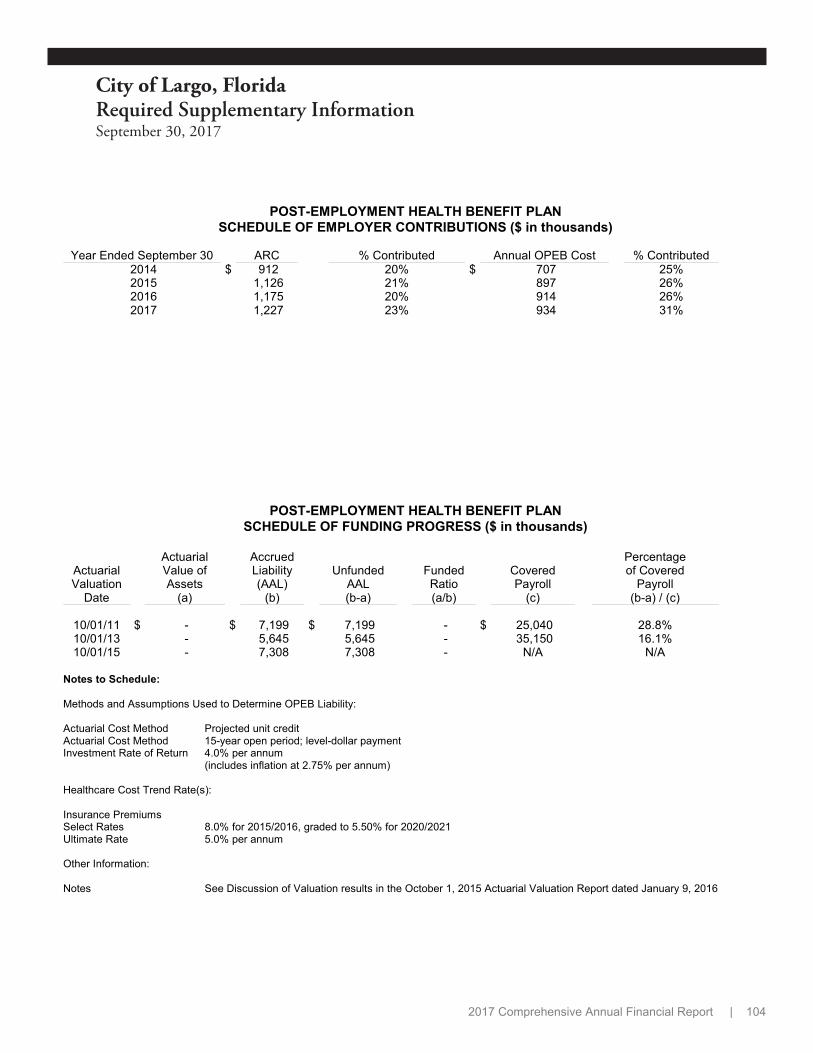
POST-EMPLOYMENT HEALTH BENEFIT PLANSCHEDULE OF EMPLOYER CONTRIBUTIONS ($ in thousands)
Year Ended September 30 ARC % Contributed Annual OPEB Cost % Contributed 2014 $ 912 20% $ 707 25% 2015 1,126 21% 897 26% 2016 1,175 20% 914 26% 2017 1,227 23% 934 31%
POST-EMPLOYMENT HEALTH BENEFIT PLANSCHEDULE OF FUNDING PROGRESS ($ in thousands)
Actuarial Accrued PercentageActuarial Value of Liability Unfunded Funded Covered of CoveredValuation Assets (AAL) AAL Ratio Payroll Payroll
Date (a) (b) (b-a) (a/b) (c) (b-a) / (c)
10/01/11 $ - $ 7,199 $ 7,199 - $ 25,040 28.8%10/01/13 - 5,645 5,645 - 35,150 16.1%10/01/15 - 7,308 7,308 - N/A N/A
Notes to Schedule:
Methods and Assumptions Used to Determine OPEB Liability:
Actuarial Cost Method Projected unit creditActuarial Cost Method 15-year open period; level-dollar paymentInvestment Rate of Return 4.0% per annum
(includes inflation at 2.75% per annum)
Healthcare Cost Trend Rate(s):
Insurance PremiumsSelect Rates 8.0% for 2015/2016, graded to 5.50% for 2020/2021Ultimate Rate 5.0% per annum
Other Information:
Notes See Discussion of Valuation results in the October 1, 2015 Actuarial Valuation Report dated January 9, 2016
City of Largo, FloridaRequired Supplementary Information September 30, 2017
2017 Comprehensive Annual Financial Report | 104

This page was intentionally left blank

AssetsCash and investments $ 3,180,404 Receivables
Accrued interest 28,392 Property held for resale 829,060
Total assets $ 4,037,856
LiabilitiesAccounts payable $ 12,257 Accrued payroll 1,562 Due to other funds 532,000
Total liabilities 545,819 Fund balances
Restricted 3,492,037 Total fund balances 3,492,037 Total liabilities and fundbalances $ 4,037,856
City of Largo, fLorida
Largo Community Redevelopment Agency Balance Sheet
September 30, 2017
2017 Comprehensive Annual Financial Report | 105
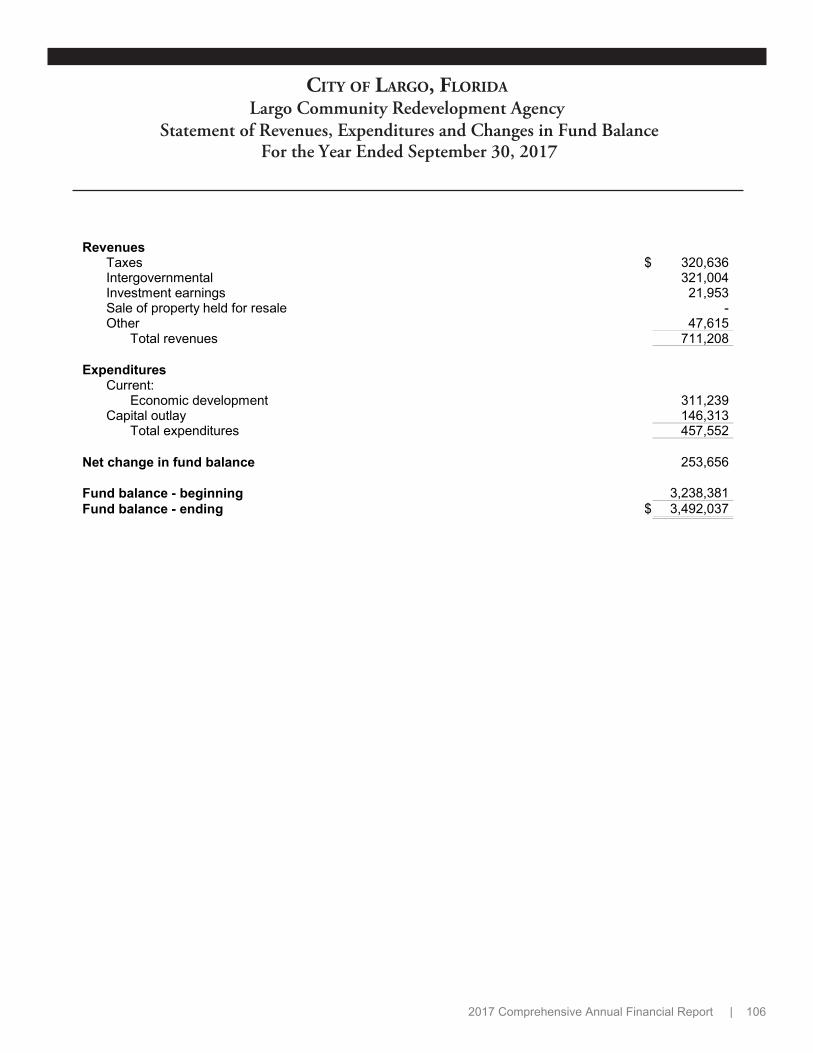
RevenuesTaxes $ 320,636 Intergovernmental 321,004 Investment earnings 21,953 Sale of property held for resale - Other 47,615
Total revenues 711,208
ExpendituresCurrent:
Economic development 311,239 Capital outlay 146,313
Total expenditures 457,552
Net change in fund balance 253,656
Fund balance - beginning 3,238,381 Fund balance - ending $ 3,492,037
City of Largo, fLoridaLargo Community Redevelopment Agency
Statement of Revenues, Expenditures and Changes in Fund Balance For the Year Ended September 30, 2017
2017 Comprehensive Annual Financial Report | 106

OriginalBudget Final Budget Actual
Final BudgetVariancesPositive
(Negative)Revenues
Taxes $ 32,547,500 $ 32,547,500 $ 32,642,366 $ 94,866Licenses and permits 5,906,500 5,906,500 5,723,838 (182,662)Intergovernmental 11,148,800 11,173,200 10,146,005 (1,027,195)Charges for services 14,439,100 14,532,300 14,769,087 236,787Fines 366,000 366,000 403,111 37,111Interfund charges 3,322,100 3,322,100 3,297,864 (24,236)Contributions and donations 98,300 98,300 46,806 (51,494)Investment earnings 175,000 175,000 154,933 (20,067)Other 314,000 314,000 1,490,709 1,176,709
Total revenues 68,317,300 68,434,900 68,674,719 239,819Expenditures
CurrentAdministration 2,361,600 2,370,024 2,119,689 250,335Community Development 2,545,000 2,619,131 2,225,307 393,824Finance 799,600 805,100 780,742 24,358Fire Rescue 17,819,600 17,922,316 17,163,793 758,523General Operating 389,900 388,522 336,547 51,975Human Resources 580,500 580,536 556,156 24,380Information Technology 3,074,900 3,110,483 2,724,379 386,104Legislative 354,900 356,025 336,010 20,015Library 3,409,600 3,432,714 3,064,087 368,627Police 21,345,500 21,523,835 21,348,310 175,525Public Works 4,231,000 4,289,336 3,933,036 356,300Recreation, Parks & Arts 11,531,300 11,989,051 9,718,000 2,271,051Capital outlay 1,822,800 2,173,691 1,548,814 624,877
Total expenditures 70,266,200 71,560,764 65,854,870 5,705,894Excess (deficiency) of revenues
over (under) expenditures (1,948,900) (3,125,864) 2,819,849 5,945,713Other Financing Sources (Uses)
Transfers in 11,400 11,400 - (11,400)Total other financing sources(uses) 11,400 11,400 - (11,400)
Net change in fund balance $ (1,937,500) $ (3,114,464) 2,819,849 $ 5,934,313
Fund balance - beginning 12,673,805
Fund balance - ending $ 15,493,654
City of Largo, fLorida
Schedule of Revenues, Expenditures and Changes in Fund Balance - Budget and Actual
General FundFor the Year Ended September 30, 2017
2017 Comprehensive Annual Financial Report | 107

Special Revenue Funds. A special revenue fund is used to finance particular activities and is created outof receipts of specific taxes or other earmarked revenue. Such funds are authorized by legislative,statutory or charter provisions to pay for certain activities with some special form of continuing revenue.
The County Gas Tax Fund was established to account for proceeds from the countywide Local OptionGas Tax. Expenditures are restricted to the construction and improvement of collector roads.
The Transportation Impact Fee Fund was established to account for revenue generated by impact fees. Expenditures are restricted to mobility improvement projects. All collections, less a 4 percentadministrative fee, are shared equally with the County. This impact fee was replaced by the multimodalfee (below); therefore, no future revenues will be collected.
The Multimodal Impact Fee Fund was established to account for revenue generated by impact fees. Expenditures are restricted to road improvement projects. All collections, less a 4 percent administrativefee, are shared equally with the County.
The Construction Services Fund was established for the financial activities related to enforcement of theFlorida Building Code. Revenue is generated from building permit and plan review fees and expendituresare specifically related to the direct and indirect costs associated with enforcement of the Florida BuildingCode.
The Stormwater Fund was established to account for fees charged to fund routine operations of andimprovements to the City's drainage system. This fund does not account for all drainage improvements,many of which are accounted for in the Local Option Sales Tax Fund.
The Community Redevelopment Agency Fund was established to account for revenues generated fromthe taxable value of properties located within the downtown West Bay Drive Redevelopment District.
The PCH Fund was established to account for revenues received from Pinellas County Housing Authorityto address community housing needs.
The Program Special Revenue Fund was established to account for a number of small accounts that arenot large enough to require establishment of individual funds. Included in this fund are accounts for policedonations, confiscated property, police education, athletic improvements, fire rescue donations, librarydonations and other miscellaneous donations. These funds must be maintained separately for theirdesignated purposes.
The Parkland Dedication Trust Fund was established to account for impact fees paid in either land ormoney from residential contractors and developers. Cash payments are used to purchase or improvepark land within the City, necessitated by the increased population generated by additional housing units.
The Neighborhood Stabilization Program 2 (NSP2) Fund accounts for revenue allocation to the City under the NSP2 program, which is expended on acquiring and redeveloping foreclosed and abandonedproperties within the community.
City of Largo, fLorida
Nonmajor Governmental Funds September 30, 2017
2017 Comprehensive Annual Financial Report | 108
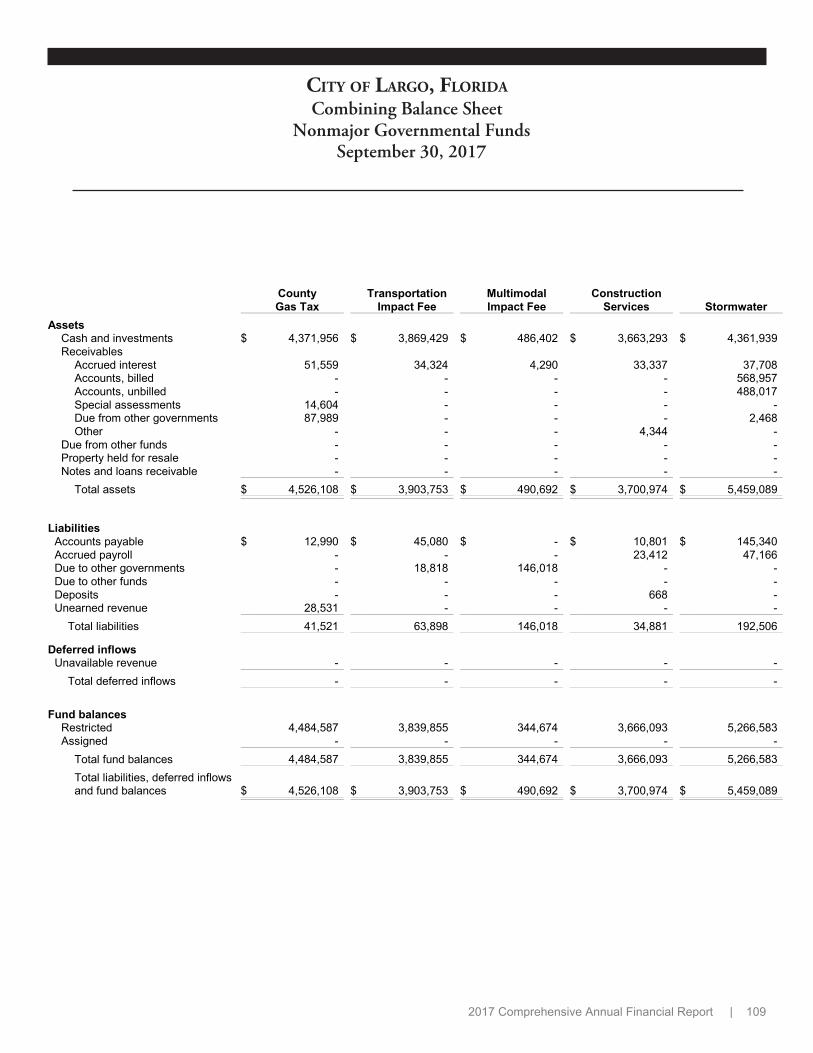
CountyGas Tax
TransportationImpact Fee
MultimodalImpact Fee
ConstructionServices Stormwater
Assets$ 4,371,956 $ 3,869,429 $ 486,402 $ 3,663,293 $ 4,361,939Cash and investments
ReceivablesAccrued interest 51,559 34,324 4,290 33,337 37,708Accounts, billed - - - - 568,957Accounts, unbilled - - - - 488,017Special assessments 14,604 - - - -Due from other governments 87,989 - - - 2,468Other - - - 4,344 -
Due from other funds - - - - -Property held for resale - - - - -Notes and loans receivable - - - - -
Total assets $ 4,526,108 $ 3,903,753 $ 490,692 $ 3,700,974 $ 5,459,089
LiabilitiesAccounts payable $ 12,990 $ 45,080 $ - $ 10,801 $ 145,340Accrued payroll - - - 23,412 47,166Due to other governments - 18,818 146,018 - -Due to other funds - - - - -Deposits - - - 668 -Unearned revenue 28,531 - - - -
Total liabilities 41,521 63,898 146,018 34,881 192,506
Deferred inflowsUnavailable revenue - - - - -
Total deferred inflows - - - - -
Fund balancesRestricted 4,484,587 3,839,855 344,674 3,666,093 5,266,583Assigned - - - - -
Total fund balances 4,484,587 3,839,855 344,674 3,666,093 5,266,583Total liabilities, deferred inflowsand fund balances $ 4,526,108 $ 3,903,753 $ 490,692 $ 3,700,974 $ 5,459,089
City of Largo, fLorida
Combining Balance Sheet Nonmajor Governmental Funds
September 30, 2017
2017 Comprehensive Annual Financial Report | 109

CommunityRedevelopment
Agency PCH
ProgramSpecial
RevenueParkland
Dedication
NeighborhoodStabilizationProgram 2
Total NonmajorSpecial Revenue
Funds
$ 3,180,404 $ 2,829 $ 1,546,977 $ 2,119,640 $ - $ 23,602,869
28,392 - 13,912 18,790 - 222,312- - - - - 568,957- - - - - 488,017- - - - - 14,604- - 1,242 - - 91,699- 658 - 19,778 - 24,780- - - 189,000 - 189,000
829,060 - - - - 829,060- 728,323 - - 116,250 844,573
$ 4,037,856 $ 731,810 $ 1,562,131 $ 2,347,208 $ 116,250 $ 26,875,871
$ 12,257 $ - $ 9,455 $ - $ - $ 235,9231,562 - - - - 72,140
- - - - - 164,836532,000 - - - - 532,000
- - - - - 668- 210,019 - - 116,250 354,800
545,819 210,019 9,455 - 116,250 1,360,367
- 518,304 - - - 518,304- 518,304 - - - 518,304
3,492,037 3,487 1,377,343 2,347,208 - 24,821,867- - 175,333 - - 175,333
3,492,037 3,487 1,552,676 2,347,208 - 24,997,200$ 4,037,856 $ 731,810 $ 1,562,131 $ 2,347,208 $ 116,250 $ 26,875,871
2017 Comprehensive Annual Financial Report | 110

County GasTax
TransportationImpact Fee
MultimodalImpact Fee
ConstructionServices Stormwater
RevenuesTaxes $ - $ - $ 154,904 $ - $ -Licenses and permits - - - 1,465,796 -Intergovernmental 1,044,602 - - - 16,150Charges for services - - - - 5,663,693Contributions and donations - - - - -Investment earnings 30,099 28,416 3,015 27,618 29,374Other - - - - 98,265
Total revenues 1,074,701 28,416 157,919 1,493,414 5,807,482
ExpendituresCurrent
Public safety - - - - -Public works 337,283 - - - 3,661,224Economic development - - - 1,525,130 -Culture and recreation - - - - -
Capital outlay 991,523 392,274 - 266,079 1,484,639Total expenditures 1,328,806 392,274 - 1,791,209 5,145,863
Net change in fund balances (254,105) (363,858) 157,919 (297,795) 661,619
Fund balances - beginning 4,738,692 4,203,713 186,755 3,963,888 4,604,964
Fund balances - ending $ 4,484,587 $ 3,839,855 $ 344,674 $ 3,666,093 $ 5,266,583
City of Largo, fLorida
Combining Statement of Revenues, Expenditures and Changes in Fund Balances Nonmajor Special Revenue FundsYear Ended September 30, 2017
2017 Comprehensive Annual Financial Report | 111

CommunityRedevelopment
Agency PCH
Program Special Revenue
ParklandDedication
NeighborhoodStabilizationProgram 2
Total NonmajorSpecial
Revenue Funds
$ 320,636 $ - $ 200,840 $ 28,985 $ - $ 705,365- - - - - 1,465,796
321,004 - 98,662 - - 1,480,418- - 10,957 - - 5,674,650- - 161,499 - - 161,499
21,953 - 11,964 15,382 - 167,82147,615 7,887 - - - 153,767
711,208 7,887 483,922 44,367 - 9,809,316
- - 160,083 - - 160,083- - - - - 3,998,507
311,239 - - - - 1,836,369- - 264,981 - - 264,981
146,313 - 86,192 - - 3,367,020457,552 - 511,256 - - 9,626,960
253,656 7,887 (27,334) 44,367 - 182,356
3,238,381 (4,400) 1,580,010 2,302,841 - 24,814,844
$ 3,492,037 $ 3,487 $ 1,552,676 $ 2,347,208 $ - $ 24,997,200
2017 Comprehensive Annual Financial Report | 112
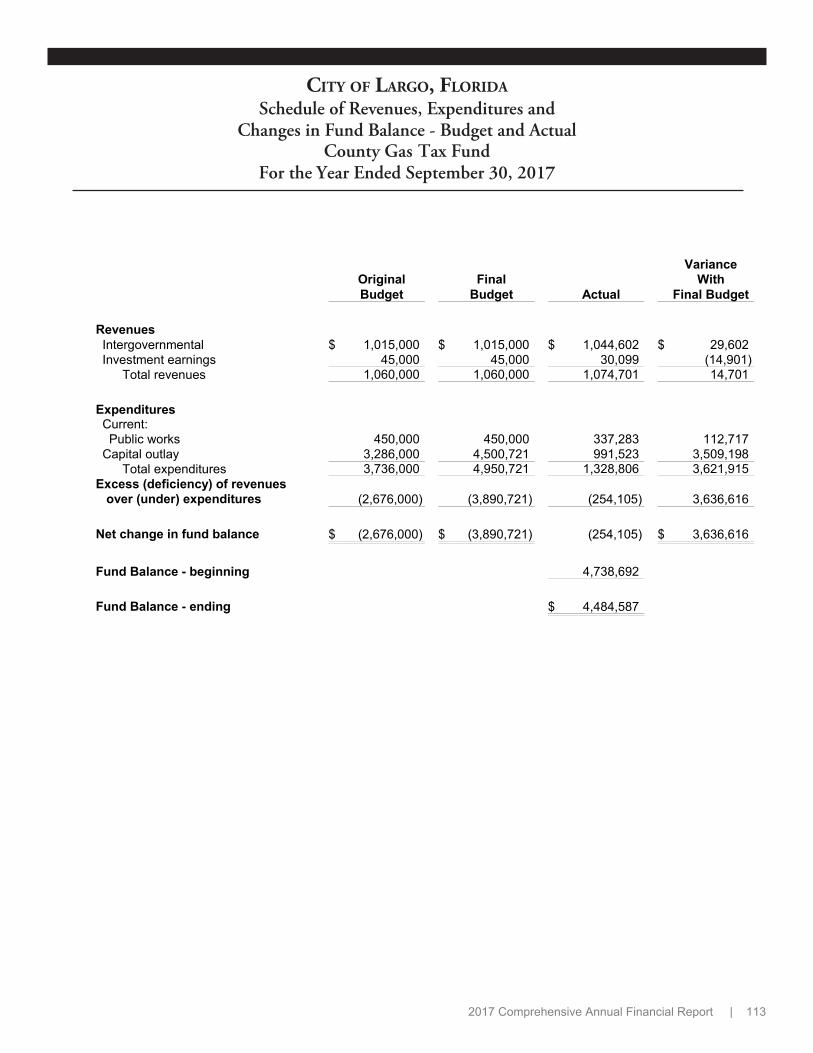
OriginalBudget
FinalBudget Actual
VarianceWith
Final Budget
RevenuesIntergovernmental $ 1,015,000 $ 1,015,000 $ 1,044,602 $ 29,602Investment earnings 45,000 45,000 30,099 (14,901)
Total revenues 1,060,000 1,060,000 1,074,701 14,701
ExpendituresCurrent:Public works 450,000 450,000 337,283 112,717
Capital outlay 3,286,000 4,500,721 991,523 3,509,198Total expenditures 3,736,000 4,950,721 1,328,806 3,621,915
Excess (deficiency) of revenues over (under) expenditures (2,676,000) (3,890,721) (254,105) 3,636,616
Net change in fund balance $ (2,676,000) $ (3,890,721) (254,105) $ 3,636,616
Fund Balance - beginning 4,738,692
Fund Balance - ending $ 4,484,587
City of Largo, fLorida
Schedule of Revenues, Expenditures and Changes in Fund Balance - Budget and Actual
County Gas Tax FundFor the Year Ended September 30, 2017
2017 Comprehensive Annual Financial Report | 113

OriginalBudget
FinalBudget Actual
VarianceWith
Final Budget
RevenuesInvestment earnings $ 40,000 $ 40,000 $ 28,416 $ (11,584)
Total revenues 40,000 40,000 28,416 (11,584)
ExpendituresCapital outlay 2,229,000 2,804,151 392,274 2,411,877
Total expenditures 2,229,000 2,804,151 392,274 2,411,877Excess (deficiency) of revenues
over (under) expenditures (2,189,000) (2,764,151) (363,858) 2,400,293
Net change in fund balance $ (2,189,000) $ (2,764,151) (363,858) $ 2,400,293
Fund Balance - beginning 4,203,713
Fund Balance - ending $ 3,839,855
City of Largo, fLorida
Schedule of Revenues, Expenditures and Changes in Fund Balance - Budget and Actual
Transportation Impact Fee FundFor the Year Ended September 30, 2017
2017 Comprehensive Annual Financial Report | 114

OriginalBudget
FinalBudget Actual
VarianceWith
Final Budget
RevenuesTaxes $ 200,000 $ 200,000 $ 154,904 $ (45,096)Investment earnings 2,000 2,000 3,015 1,015
Total revenues 202,000 202,000 157,919 (44,081)
Net change in fund balance $ 202,000 $ 202,000 157,919 $ (44,081)
Fund Balance - beginning 186,755
Fund Balance - ending $ 344,674
City of Largo, fLorida
Schedule of Revenues, Expenditures and Changes in Fund Balance - Budget and Actual
Multimodal Impact Fee FundFor the Year Ended September 30, 2017
2017 Comprehensive Annual Financial Report | 115

OriginalBudget
FinalBudget Actual
VarianceWith
Final Budget
RevenuesLicenses and permits $ 2,000,000 $ 2,000,000 $ 1,465,796 $ (534,204)Investment earnings 40,000 40,000 27,618 (12,382)
Total revenues 2,040,000 2,040,000 1,493,414 (546,586)
ExpendituresCurrentEconomic development 2,065,200 2,085,401 1,525,130 560,271
Capital outlay 50,800 270,633 266,079 4,554Total expenditures 2,116,000 2,356,034 1,791,209 564,825
Excess (deficiency) of revenues over (under) expenditures (76,000) (316,034) (297,795) 18,239
Net change in fund balance $ (76,000) $ (316,034) (297,795) $ 18,239
Fund Balance - beginning 3,963,888
Fund Balance - ending $ 3,666,093
City of Largo, fLorida
Schedule of Revenues, Expenditures and Changes in Fund Balance - Budget and Actual
Construction Services FundFor the Year Ended September 30, 2017
2017 Comprehensive Annual Financial Report | 116

OriginalBudget
FinalBudget Actual
VarianceWith
Final Budget
RevenuesIntergovernmental $ - $ - $ 16,150 $ 16,150Charges for services 5,644,800 5,644,800 5,663,693 18,893Investment earnings 20,000 20,000 29,374 9,374Other 80,000 80,000 98,265 18,265
Total revenues 5,744,800 5,744,800 5,807,482 62,682
ExpendituresCurrentPublic works 4,168,100 4,409,775 3,661,224 748,551
Capital outlay 4,171,400 5,404,107 1,484,639 3,919,468Total expenditures 8,339,500 9,813,882 5,145,863 4,668,019
Excess (deficiency) of revenues over (under) expenditures (2,594,700) (4,069,082) 661,619 4,730,701
Net change in fund balance $ (2,594,700) $ (4,069,082) 661,619 $ 4,730,701
Fund Balance - beginning 4,604,964
Fund Balance - ending $ 5,266,583
City of Largo, fLorida
Schedule of Revenues, Expenditures and Changes in Fund Balance - Budget and Actual
Stormwater FundFor the Year Ended September 30, 2017
2017 Comprehensive Annual Financial Report | 117

OriginalBudget
FinalBudget Actual
VarianceWith
Final Budget
RevenuesTaxes $ 321,500 $ 321,500 $ 320,636 $ (864)Intergovernmental 321,700 321,700 321,004 (696)Investment earnings 12,000 12,000 21,953 9,953Other - - 47,615 47,615
Total revenues 655,200 655,200 711,208 56,008
ExpendituresEconomic development 309,700 491,227 311,239 179,988Capital outlay 445,000 740,044 146,313 593,731
Total expenditures 754,700 1,231,271 457,552 773,719Excess (deficiency) of revenues
over (under) expenditures (99,500) (576,071) 253,656 829,727
Net change in fund balance $ (99,500) $ (576,071) 253,656 $ 829,727
Fund Balance - beginning 3,238,381
Fund Balance - ending $ 3,492,037
City of Largo, fLorida
Schedule of Revenues, Expenditures and Changes in Fund Balance - Budget and Actual
Community Redevelopment Agency FundFor the Year Ended September 30, 2017
2017 Comprehensive Annual Financial Report | 118

OriginalBudget
FinalBudget Actual
VarianceWith
Final Budget
Revenues$ 7,900 $ 7,900 $ 7,887 $ (13)Other
CurrentTotal revenues 7,900 7,900 7,887 (13)
Net change in fund balance $ 7,900 $ 7,900 7,887 $ (13)
Fund Balance - beginning (4,400)
Fund Balance - ending $ 3,487
City of Largo, fLorida
Schedule of Revenues, Expenditures and Changes in Fund Balance - Budget and Actual
PCH FundFor the Year Ended September 30, 2017
2017 Comprehensive Annual Financial Report | 119

OriginalBudget
FinalBudget Actual
VarianceWith
Final Budget
RevenuesTaxes $ 100,000 $ 100,000 $ 200,840 $ 100,840Intergovernmental 101,000 101,000 98,662 (2,338)Charges for services 24,500 24,500 10,957 (13,543)Contributions and donations 181,000 222,700 161,499 (61,201)Investment earnings 20,000 20,000 11,964 (8,036)
Total revenues 426,500 468,200 483,922 15,722
ExpendituresCurrentPublic safety 143,200 192,800 160,083 32,717Economic development 5,000 5,000 - 5,000Culture and recreation 401,700 476,923 264,981 211,942
Capital outlay 174,000 230,506 86,192 144,314Total expenditures 723,900 905,229 511,256 393,973
Excess (deficiency) of revenues over (under) expenditures (297,400) (437,029) (27,334) 409,695
Other Financing Sources/(Uses)Transfers out (11,400) (11,400) - 11,400
Total other financing sources(uses) (11,400) (11,400) - 11,400
Net change in fund balance $ (308,800) $ (448,429) (27,334) $ 421,095
Fund Balance - beginning 1,580,010
Fund Balance - ending $ 1,552,676
City of Largo, fLorida
Schedule of Revenues, Expenditures and Changes in Fund Balance - Budget and Actual
Program Special Revenue FundFor the Year Ended September 30, 2017
2017 Comprehensive Annual Financial Report | 120

OriginalBudget
FinalBudget Actual
VarianceWith
Final Budget
RevenuesTaxes $ - $ - $ 28,985 $ 28,985Investment earnings 20,000 20,000 15,382 (4,618)
Total revenues 20,000 20,000 44,367 24,367
Net change in fund balance $ 20,000 $ 20,000 44,367 $ 24,367
Fund Balance - beginning 2,302,841
Fund Balance - ending $ 2,347,208
City of Largo, fLorida
Schedule of Revenues, Expenditures and Changes in Fund Balance - Budget and Actual
Parkland Dedication FundFor the Year Ended September 30, 2017
2017 Comprehensive Annual Financial Report | 121

Internal Service Funds. An internal service fund is established to finance and account for goods and servicesprovided by a department to other departments within the City on a cost-reimbursement basis. Revenue in thesefunds is primarily derived from charges to other City funds for services rendered.
The Fleet Services Fund is responsible for the maintenance and repair of vehicles and heavy equipment owned bythe City.
The Risk Management Fund is responsible for the administration of the City's risk-retention activities andpurchased insurance activities, including health care, dental, workers' compensation, property, liability, medicalmalpractice and unemployment compensation.
City of Largo, fLorida
Internal Service Funds September 30, 2017
2017 Comprehensive Annual Financial Report | 122

Fleet ServicesRisk
Management TotalAssets
Current assetsCash and investments $ 725,530 $ 5,263,488 $ 5,989,018Accrued interest receivable 5,640 43,008 48,648Accounts receivable, billed, net - 35,165 35,165Other receivables - 237,021 237,021Inventories, at cost 118,612 - 118,612Prepaid expenses and deposits - 620,226 620,226
Total current assets 849,782 6,198,908 7,048,690
Capital assetsImprovements other than buildings 86,746 - 86,746Machinery and equipment 519,918 - 519,918Intangible assets 1,723 12,061 13,784Less accumulated depreciation (377,503) (704) (378,207)
Total capital assets 230,884 11,357 242,241Total assets 1,080,666 6,210,265 7,290,931
LiabilitiesCurrent liabilities
Accounts payable 164,947 151,543 316,490Accrued payroll and vacation 43,982 23,830 67,812
Total current liabilities 208,929 175,373 384,302
Noncurrent liabilitiesUnearned revenue - 558,565 558,565Estimated claims payable - 2,030,000 2,030,000Compensated absences 10,581 - 10,581
Total noncurrent liabilities 10,581 2,588,565 2,599,146Total liabilities 219,510 2,763,938 2,983,448
Net positionNet investment in capital assets 230,884 11,357 242,241Unrestricted 630,272 3,434,970 4,065,242
Total net position $ 861,156 $ 3,446,327 $ 4,307,483
City of Largo, fLorida
Combining Statement of Net Assets Internal Service FundsSeptember 30, 2017
2017 Comprehensive Annual Financial Report | 123

Fleet ServicesRisk
Management Total
Operating revenuesCharges for services $ 2,359,642 $ 11,435,481 $ 13,795,123
Total operating revenues 2,359,642 11,435,481 13,795,123
Operating expensesPersonnel services 901,654 429,865 1,331,519Cost of goods sold 790,274 - 790,274Contractual services 252,216 286,244 538,460Supplies 47,359 2,565 49,924Repairs and maintenance 45,449 - 45,449Utilities 9,387 - 9,387Professional services 2,676 338,878 341,554Fuel 8,154 - 8,154Charges by the Fleet Services Fund 24,000 - 24,000Charges by the General Fund 125,200 19,300 144,500Charges by the Risk Management Fund 19,400 - 19,400Depreciation and amortization 35,313 704 36,017Claims - 2,295,279 2,295,279Insurance - 8,443,612 8,443,612Other 38,092 31,449 69,541
Total operating expenses 2,299,174 11,847,896 14,147,070
Operating income (loss) 60,468 (412,415) (351,947)
Nonoperating revenuesInvestment earnings 4,141 36,124 40,265Gain or loss on disposal of capital assets 10,590 - 10,590Grants 6,635 - 6,635Other, net (29,797) 29,735 (62)
Total nonoperating revenues (8,431) 65,859 57,428
Change in net position 52,037 (346,556) (294,519)
Total net position - beginning 809,119 3,792,883 4,602,002
Total net position - ending $ 861,156 $ 3,446,327 $ 4,307,483
City of Largo, fLorida
Combining Statement of Revenues, Expenses, and Changes in Fund Net Position Internal Service Funds
Year Ended September 30, 2017
2017 Comprehensive Annual Financial Report | 124

Risk Fleet Services Management Total
Operating activitiesCash received from customers $ 3,397,242 $ 9,942,634 $ 13,339,876 Cash received from internal departments - 1,474,100 1,474,100 Cash paid to employees (913,681) - (913,681)Cash paid to vendors (2,140,351) (11,414,038) (13,554,389)Cash paid for internal services (181,167) (19,300) (200,467)
Net cash provided by (used in)operating activities 162,043 (16,604) 145,439
Non-capital financing activitiesCash received from granting agencies 6,635 - 6,635
Net cash provided by (used in) non capital financing activities 6,635 - 6,635
Capital and related financing activitiesSale of capital assets 64,692 - 64,692 Acquisition of capital assets (154,511) (12,061) (166,572)
Net cash provided by (used in) capital and related financing activities (89,819) (12,061) (101,880)
Investing activitiesInvestment earnings 2,610 28,851 31,461
Net cash provided by investing activities 2,610 28,851 31,461
Net increase (decrease) in cash and cashequivalents/investments 81,469 186 81,655
Cash and cash equivalents/investmentsBeginning of year 644,061 5,263,302 5,907,363
End of year $ 725,530 $ 5,263,488 $ 5,989,018
Reconciliation of operating income (loss)to net cash provided by (used in) operating activitiesOperating income (loss) $ 60,468 $ (412,415) $ (351,947)Adjustments to reconcile operating income (loss)
29,735 29,735 to net cash provided by (used in) operating activities Other revenue/(expenses)Depreciation and amortization 35,313 704 36,017
(Increase)/decrease in assets and increase/(decrease) in liabilities
Accounts receivable 980 (23,443) (22,463)Inventories 17,349 - 17,349 Prepaid expenses and other assets - 2,021 2,021 Accounts payable 59,960 (124,351) (64,391)Accrued payroll and vacation (12,027) (10,283) (22,310)Unearned revenue - 43,428 43,428 Estimated claims payable - 478,000 478,000
Total adjustments 101,575 395,811 497,386
Net cash provided by (used in) operating activities $ 162,043 $ (16,604) $ 145,439
City of Largo, fLorida
Combining Statement of Cash Flows Internal Service Funds
Year Ended September 30, 2017
2017 Comprehensive Annual Financial Report | 125

Notes to Schedule of Revenue and Expenditures and Changes in Reserves -Largo, Belleair Bluffs and High Point Fire Districts and Emergency Medical Services
GeneralThe accompanying Schedules of Revenues and Expenditures and Changes in Reserves for the Largo FireDistrict, Belleair Bluffs Fire District and the High Point Fire and Emergency Medical Services District present theactivity used in support of fire and emergency related activities.
Supplemental Financial InformationIn accordance with the Pinellas County Home Rule Charter and Chapter 62, Article II of the Pinellas County codeand the Fire Services Agreement, funds provided by Pinellas County to the Contractor (the City of Largo) can onlybe used in support of fire related activities. Therefore, a proportional share of any unspent balance at theconclusion of a fiscal year must be returned to Pinellas County where these funds will be retained in a discretespecial fund for the Fire Districts. The return of these funds will be accomplished through a reduction to thesubsequent year support funding provided by Pinellas County to the Contractor.
In accordance with Section 409(a), the information below is provided so the results of line 7 and the supportingannual audit may be used to adjust the subsequent year's payments from Pinellas County to the Contractor.
All references are only to the Fire Districts, and do not include any revenues or expenditures associated with EMS.State Law and County Code forbid the use of fire funds for EMS purposes or EMS funds for fire purposes, (i.e.,fire funds cannot be used to purchase rescue units, attend EMS related conferences, pay for membership in EMSorganizations, or to pay salaries and benefits of EMS personnel, etc.)
DistrictsLargo Belleair Bluffs High Point
Total Expenditures by Contractor $ 17,883,358 $ 1,829,637 $ 2,009,668
Other Funding Sources EMS 4,148,873 523,755 523,755 EMS and Fire Rescue Vehicles 230,056 - 3,866 Tech Rescue and CME Reimbursement 49,602 6,262 6,262 State Pension 372,728 124,243 124,243 City of Belleair Bluffs 293,754 - - Town of Belleair 279,797 279,797 - Fire Inspections Fees 117,864 - - Plan Review Fees 277,063 - - State Education Incentive 44,265 5,437 6,151
Total Other Funding Sources 5,814,002 939,494 664,277
12,069,356 890,143 1,345,391 14.68% 64.65% 74.97%
1,771,781 575,478 1,008,640 1,287,572 453,377 1,073,630
Net Outlay by ContractorPinellas County Percentage of District Total Pinellas County ShareAmount Paid to City by Pinellas County Total Due to Pinellas County (overexpended) $ (484,209) $ (122,101) $ 64,990
City of Largo, fLorida
Supplemental to Financial Statements September 30, 2017
2017 Comprehensive Annual Financial Report | 126

2017 2016
Budget Actual
Variancefavorable
(unfavorable) Budget Actual
Variancefavorable
(unfavorable)Revenue County
Fire $ 1,270,000 $ 1,287,572 $ 17,572 $ 1,464,000 $ 1,343,385 $ (120,615) 4,022,100 4,148,873 126,773 4,291,800 3,241,527 (1,050,273) EMS
Capital Contribution 756,000 230,056 (525,944) 756,000 416,317 339,683
State Pension contribution 381,000 372,728 (8,272) 381,000 344,941 (36,059) Education incentive 39,900 44,265 4,365 39,900 45,858 5,958
Hazmat, Tech Rescue and CME restitution 112,000 94,260 (17,740) 40,000 91,263 51,263
Municipality Belleair Bluffs mgmt. contract 296,700 293,754 (2,946) 275,100 268,139 (6,961) Town of Belleair mgmt. contract 281,200 279,797 (1,403) 250,050 243,770 (6,280) Current 11,848,718 11,132,053 (716,665) 10,164,610 7,578,785 (2,585,825)
Total revenue 19,007,618 17,883,358 (1,124,260) 17,662,460 13,573,985 (4,088,475)
Expenditures General Fund
Salaries and benefits 12,446,900 12,173,403 273,497 11,652,400 11,243,617 408,783 Operating 1,471,534 1,186,861 284,673 1,598,616 1,479,000 119,616 Capital outlay 253,180 55,880 197,300 305,195 90,580 214,615
Local Option Sales Tax Fund Capital outlay 4,836,004 4,467,214 368,790 4,106,249 760,788 3,345,461
Total expenditures 19,007,618 17,883,358 1,124,260 17,662,460 13,573,985 4,088,475
Excess of revenue over expenditures $ - $ - $ - $ - $ - $ -
2017 2016 Largo Fire ReserveDesignated fund balance at beginning of year $ 853,010 $ 846,250
- - 209,690 6,760
ExpendituresAdditions to reservesDesignated fund balance at end of year $ 1,062,700 $ 853,010
Notes Fire revenues are shown at gross. Actual amounts received were reduced for overpayment by the County of Pinellas. FY 2016 reduction was $76,932 for FY2015 overpayment, FY2017 reduction was $25,323 for FY2016 overpayment. Amounts reported as reserves are held by Pinellas County.
See accompanying notes to the Schedule of Revenue and Expenditures and Changes in Reserves.
City of Largo, fLoridaSchedule of Revenue and Expenditures and Changes in Reserves -
Largo Fire and Emergency Medical ServicesYear Ended September 30, 2017 and 2016
2017 Comprehensive Annual Financial Report | 127

2017 2016
Budget Actual
Variancefavorable
(unfavorable) Budget Actual
Variancefavorable
(unfavorable)Revenue County
Fire $ 683,800 453,377 $ (230,423) $ 360,000 $ 718,990 $ 358,990 EMS 507,700 523,755 16,055 127,000 458,451 331,451 Capital Contribution - 3,866 3,866 693,000 445,615 (247,385)
State Pension contribution 127,000 124,243 (2,757) 127,000 114,981 (12,019) Education incentive 2,000 5,437 3,437 2,000 5,189 3,189
Hazmat, Tech Rescue andCMERestitution - 6,262 6,262 - 8,138 8,138
Municipality Town of Belleair mgmt contract 281,100 279,797 (1,303) 250,050 243,770 (6,280) Current 337,378 432,900 95,522 1,053,372 414,657 (638,715)
Total revenue 1,938,978 1,829,637 (109,341) 2,612,422 2,409,791 (202,631)
Expenditures General Fund
Salaries and benefits 1,651,600 1,588,279 63,321 1,628,500 1,466,200 162,300 Operating 273,639 230,712 42,927 285,922 259,626 26,296 Capital outlay 5,000 - 5,000 698,000 683,965 14,035
Local Option Sales Tax Fund Capital outlay 8,739 10,646 -8739 - - -
Total expenditures 1,938,978 1,829,637 109,341 2,612,422 2,409,791 202,631
Excess of revenue over expenditures $ - - $ - $ - $ - $ -
2017 2016
$ 154,270 $ 543,570 (389,300)
7,630 -
Bellair Bluffs Fire Reserve Designated fund balance at beginning of yearExpendituresAdditions to reservesDesignated fund balance at end of year $ 161,900 $ 154,270
Notes Fire revenues are shown at gross. Actual amounts received were reduced for overpayment by the County of Pinellas.
FY 2016 reduction was $0 for FY 2015 overpayment. FY 2017 reduction was $0 for FY 2016 overpayment. Amounts reported as reserves are held by Pinellas County.
See accompanying notes to the Schedule of Revenue and Expenditures and Changes in Reserves.
City of Largo, fLoridaSchedule of Revenue and Expenditures and Changes in Reserves -
Belleair Bluffs Fire and Emergency Medical ServicesYear Ended September 30, 2017 and 2016
2017 Comprehensive Annual Financial Report | 128

2017 2016
Budget Actual
Variancefavorable
(unfavorable) Budget Actual
Variancefavorable
(unfavorable)Revenue County
Fire $ 1,054,500 $ 1,073,630 $ 19,130 $ 1,050,000 $ 1,153,733 $ 103,733 EMS 507,700 523,755 16,055 477,000 457,446 (19,554)
State Pension contribution 127,000 124,243 (2,757) 127,000 114,981 (12,019) Education incentive 3,100 6,151 3,051 3,100 5,893 2,793 Hazmat, Tech Rescue and CME
Restitution - 6,262 6,262 - 8,120 8,120
Municipality Current 422,484 275,627 (146,857) 498,046 166,364 (331,682)
Total revenue 2,114,784 2,009,668 (105,116) 2,155,146 1,906,537 (248,609)
Expenditures General Fund
Salaries and benefits 1,811,600 1,771,387 40,213 1,789,100 1,633,924 155,176 Operating 267,044 213,141 53,903 292,546 255,135 37,411 Capital outlay 12,400 1,400 11,000 73,500 17,478 56,022
Local Option Sales Tax Fund Capital outlay 23,740 23,740 - - - -
Total expenditures 2,114,784 2,009,668 105,116 2,155,146 1,906,537 248,609
Excess of revenue over expenditures $ - $ - $ - $ - $ - $ -
2017 2016
$ 219,250 $ -
272,640 -
219,250
High Point Fire Reserve Designated fund balance at beginning of year Expenditures Additions to reserves Designated fund balances at end of year $ 491,890 $ 219,250
Notes Fire revenues are shown at gross. Actual amounts received were reduced for overpayment by the County of Pinellas. FY 2016 reduction was $0 for FY2015 overpayment. FY2017 reduction was $145,443 for FY 2016 overpayment. The amonts reported as reserves are held by Pinellas County.
See accompanying notes to the Schedule of Revenue and Expenditures and Changes in Reserves.
City of Largo, fLoridaSchedule of Revenue and Expenditures and Changes in Reserves -
High Point Fire and Emergency Medical ServicesYear Ended September 30, 2017 and 2016
2017 Comprehensive Annual Financial Report | 129
This section of the City's CAFR presents detailed information as a context for understanding what theinformation in the financial statements, note disclosures, and required supplementary information sayabout the City's overall financial health. This information has not been audited by the independent auditor.
Financial Trends
These schedules contain trend information to help the reader understand how the City's financialperformance and well-being changed over time.
Schedule A Net Position by ComponentSchedule B Changes in Net PositionSchedule C Governmental Activities Tax Revenue by SourceSchedule D Fund Balances of Governmental FundsSchedule E Changes in Fund Balances of Governmental FundsSchedule F General Governmental Tax Revenues by SourceSchedule G Wastewater Charges
Revenue Capacity
These schedules contain information to help the reader assess the City's significant local revenue,the property tax.
Schedule H Assessed Value, Taxable Value and Estimated Actual Value of Taxable Property
Schedule I Property Tax Rates Direct and Overlapping GovernmentsSchedule J Principal Real Property TaxpayersSchedule J Principal Personal Property TaxpayersSchedule K Property Tax Levies and CollectionsSchedule U Major Revenue Sources
Debt Capacity
These schedules present information to help the reader assess the affordability of the City'scurrent levels of outstanding debt, and the City's ability to issue additional debt in the future.
Schedule L Ratios of Outstanding Debt by TypeSchedule M Direct and Overlapping Governmental Activities DebtSchedule N Legal Debt Margin InformationSchedule O Pledged-Revenue Coverage
City of Largo, fLorida
Statistical Section
2017 Comprehensive Annual Financial Report | 130

Economic and Demographic Information
These schedules offer economic and demographic indicators to help the reader understand the environment within which the City's financial activities take place.
Schedule P Demographic and Economic StatisticsSchedule Q Principal Employers
Operating Information
These schedules contain service and infrastructure data to help the reader understand how the information in the City's financial report relates to the services the City provides and the activities itperforms.
Schedule R Full-time Equivalent City Government Employees by FunctionSchedule S Operating Indicators by FunctionSchedule T Capital Assets Statistics by FunctionSchedule V General InformationSchedule W Community ProfileSchedule X Financial Management Policies
Sources: Unless otherwise noted, the information in this section is derived from the City's comprehensiveannual financial reports for the relevant year. The City implemented the new reporting model, GASB 34, inthe fiscal year ending September 30, 2003.
City of Largo, fLorida
Statistical Section
2017 Comprehensive Annual Financial Report | 131

Fiscal Year
(amounts expressed in thousands)
2008 2009 2010 2011 2012 2013 2014 2015 2016 2017 Governmental activities Net invested in capital assets $ 104,258 $ 109,483 $ 118,176 $ 113,640 $ 113,597 $ 117,811 $ 122,265 $ 122,159 $ 124,369 126,873 Restricted 32,040 30,938 20,481 26,783 35,520 34,495 33,541 37,313 41,783 40,747 Unrestricted 18,538 21,894 24,271 20,745 11,033 9,690 11,350 (20,187) (20,472) (18,660) Total governmental activities net position 154,836 162,315 162,928 161,168 160,150 161,996 167,156 139,285 145,680 148,960
Business-type activities Net invested in capital assets 49,374 49,992 50,361 53,805 58,868 61,381 65,018 78,180 99,029 88,411 Restricted 11,000 11,165 11,467 11,532 11,866 12,386 7,406 8,390 8,992 9,114 Unrestricted 28,181 32,670 36,110 35,308 32,509 36,621 42,270 33,892 17,516 30,241 Total business-type activities net position 88,555 93,827 97,938 100,645 103,243 110,388 114,694 120,462 125,537 127,766
Primary government Net invested in capital assets 153,632 159,475 168,537 167,445 172,465 179,192 187,283 200,339 223,398 215,284 Restricted 43,040 42,103 31,948 38,315 47,386 46,881 40,947 45,703 50,775 49,861 Unrestricted 46,719 54,564 60,381 56,053 43,542 46,311 53,620 13,705 (2,956) 11,581 Total primary government net position $ 243,391 $ 256,142 $ 260,866 $ 261,813 $ 263,393 $ 272,384 $ 281,850 $ 259,747 $ 271,217 276,726
City of Largo, fLoridaNet Position by Component
Last Ten Fiscal Years(accrual basis of accounting)
SCHEDULE A
2017 Comprehensive Annual Financial Report | 132

Fiscal Year(amounts expressed in thousands)
2008 2009 2010 2011 2012 2013 2014 2015 2016 2017 Expenses Governmental activities
General government $ 7,453 $ 6,939 $ 7,556 $ 7,093 $ 6,839 $ 6,736 $ 6,311 $ 6,650 $ 7,567 $ 8,273 Public safety 32,378 32,781 36,766 37,138 37,160 36,352 35,695 36,685 39,663 40,824 Public Works 10,036 7,854 9,480 10,560 10,106 8,372 8,735 9,253 8,805 8,195 Economic development 4,304 4,614 3,881 3,301 4,375 5,603 5,282 5,121 5,511 9,264 Culture and recreation 13,888 14,572 14,957 14,313 14,202 13,517 14,714 16,118 15,912 15,833 Interest on long-term debt 129 58 39 248 554 516 447 376 298 232
Total governmental activities expenses 68,188 66,818 72,679 72,653 73,236 71,096 71,184 74,203 77,756 82,621
Business-type activities
Wastewater 20,025 19,135 19,853 20,632 21,093 17,005 18,647 18,356 19,111 21,238 Solid Waste 9,781 9,404 9,533 10,195 9,703 9,788 10,358 10,586 10,542 11,596 Golf Course 1,127 1,113 1,072 1,003 1,007 969 1,007 996 1,012 1,133
Total business-type activities 30,933 29,652 30,458 31,830 31,803 27,762 30,012 29,938 30,665 33,967 expenses
Total primary governmentexpenses $ 99,121 $ 96,470 $ 103,137 $ 104,483 $ 105,039 $ 98,858 $ 101,196 $ 104,141 $ 108,421 $ 116,588
Program Revenues
Governmental activities
Charges for services
General government $ 2,865 $ 3,009 $ 2,919 $ 2,948 $ 2,874 $ 2,864 $ 3,067 $ 3,097 $ 3,172 $ 3,241 Public safety 7,937 7,780 8,711 8,812 9,131 8,093 8,596 8,282 9,057 9,976 Public works 3,444 3,783 3,834 3,825 4,050 4,498 4,541 4,699 5,869 5,849 Economic development 2,470 1,745 1,849 2,473 2,394 2,619 3,156 3,578 2,921 2,390 Culture and recreation 4,124 4,039 3,851 4,403 4,144 4,181 4,768 4,837 4,642 5,076 Other activities - - - - - - - - - -
Operating grants and contributions 3,235 2,205 2,314 1,976 2,352 1,930 2,757 2,594 2,817 3,008
Capital grants and contributions 1,066 4,246 1,644 2,034 2,363 2,083 439 786 1,587 726
Total governmental activities program revenues 25,141 26,807 25,122 26,471 27,308 26,268 27,324 27,873 30,065 30,266
Business-type activities
Charges for services
Wastewater 23,217 22,210 22,206 22,253 22,497 22,970 22,290 22,514 22,631 22,900 Solid Waste 10,640 10,266 10,339 10,455 10,186 10,165 10,359 10,452 10,773 11,118 Golf Course 988 854 753 787 874 874 847 872 863 972
Operating grants and contributions 57 57 57 57 60 60 73 61 60 99
Capital grants and contributions 148 703 114 216 323 106 47 882 535 387
Total business-type activities program revenues 35,050 34,090 33,469 33,768 33,940 34,175 33,616 34,781 34,862 35,476
Total primary government program revenues $ 60,191 $ 60,897 $ 58,591 $ 60,239 $ 61,248 $ 60,443 $ 60,940 $ 62,654 $ 64,927 $ 65,742
City of Largo, fLoridaChanges in Net Position
Last Ten Fiscal Years(accrual basis of accounting)
SCHEDULE B
Page 1 of 2
2017 Comprehensive Annual Financial Report | 133

Fiscal Year(amounts expressed in thousands)
2008 2009 2010 2011 2012 2013 2014 2015 2016 2017 Net (Expense)/RevenueGovernmental activities $ (43,047) $ (40,011) $ (47,557) $ (46,182) $ (45,928) $ (44,828) $ (43,860) $ (46,330) $ (47,691) $ (52,355)Business-type activities 4,117 4,438 3,011 1,938 2,137 6,413 3,604 4,843 4,197 1,509 Total primary government net(expense)/revenue $ (38,930) $ (35,573) $ (44,546) $ (44,244) $ (43,791) $ (38,415) $ (40,256) $ (41,487) $ (43,494) $ (50,846)
Governmental activities
Taxes Property $ 16,634 $ 16,237 $ 16,318 $ 14,545 $ 14,595 $ 15,691 $ 16,568 $ 17,395 $ 19,326 $ 21,026 Utility 7,012 7,113 8,146 7,723 7,224 7,786 8,202 7,991 8,382 8,440 Franchise 5,835 6,304 6,613 6,104 5,777 5,639 6,005 5,989 5,748 5,712 Sales (local option) 6,892 6,728 6,257 6,134 6,437 6,767 7,143 7,660 8,066 8,283 Communications services 3,953 4,310 3,841 3,772 3,611 3,374 3,139 3,073 2,914 2,871
Shared revenue 6,716 6,072 5,999 6,208 6,771 6,987 7,372 7,854 8,168 8,461 Investment earnings 2,083 1,271 769 491 424 331 320 621 463 469 Miscellaneous (1,294) (546) 227 75 72 99 271 394 973 538 Transfers in (out) - - - (175) - - - (788) 45 - Demolition of City property - - - (455) - - - - - - Extraordinary/Special Item - - - - - - - - - (164)
Total governmental activities 47,831 47,489 48,170 44,422 44,911 46,674 49,020 50,189 54,085 55,636
Business-type activities Investment earnings 1,527 1,031 796 554 376 278 313 657 496 443 Miscellaneous 118 (196) 304 40 84 455 389 267 427 276 Transfers in (out) - - - 175 - - - - (45) - Demolition of City property - - - - - - - - - - Extraordinary/Special Item - - - - - - - - - -
Total business-type activities 1,645 835 1,100 769 460 733 702 924 878 719
Total primary government $ 49,476 $ 48,324 $ 49,270 $ 45,191 $ 45,371 $ 47,407 $ 49,722 $ 51,113 $ 54,963 $ 56,355
Change in Net PositionGovernmental activities $ 4,784 $ 7,478 $ 613 $ (1,760) $ (1,017) $ 1,846 $ 5,160 $ 3,859 $ 6,394 $ 3,281 Business-type activities 5,762 5,273 4,111 2,707 2,597 7,146 4,306 5,767 5,075 2,228
Total primary government $ 10,546 $ 12,751 $ 4,724 $ 947 $ 1,580 $ 8,992 $ 9,466 $ 9,626 $ 11,469 $ 5,509
City of Largo, fLoridaChanges in Net Position
Last Ten Fiscal Years(accrual basis of accounting)
SCHEDULE B
Page 2 of 2
2017 Comprehensive Annual Financial Report | 134

Fiscal Year(amounts expressed in thousands)
2008 2009 2010 2011 2012 2013 2014 2015 2016 2017
Property tax $ 16,634 $ 16,237 $ 16,318 $ 14,545 $ 14,595 $ 15,691 $ 16,567 $ 17,395 $ 19,326 $ 21,026
Utility tax 7,012 7,113 8,146 7,723 7,224 7,786 8,202 7,991 8,382 8,440
Local Option Sales & County Gas tax 6,892 6,728 6,257 6,134 6,437 6,767 7,143 7,660 8,066 8,283
Communications Services tax 3,953 4,310 3,841 3,772 3,611 3,374 3,139 3,073 2,914 2,871
Franchise tax 5,835 6,304 6,613 6,104 5,777 5,639 6,005 5,989 5,748 5,712
Total $ 40,326 $ 40,692 $ 41,175 $ 38,278 $ 37,644 $ 39,257 $ 41,056 $ 42,108 $ 44,436 $ 46,332
City of Largo, fLoridaGovernment Activities Tax Revenue By Source
Last Ten Fiscal Years(accrual basis of accounting)
SCHEDULE C
2017 Comprehensive Annual Financial Report | 135

Fiscal Year(amounts expressed in thousands)
2008 2009 2010 2011(1) 2012(3) 2013 2014 2015 2016 2017
General FundReserved $ 1,829 $ 1,325 $ 1,363 N/A N/A N/A N/A N/A N/A N/ADesignated 4,866 7,689 9,010 N/A N/A N/A N/A N/A N/A N/AUndesignated(2) 11,851 9,842 7,908 N/A N/A N/A N/A N/A N/A N/A
Nonspendable N/A N/A N/A $ 147 $ 80 $ 56 $ 49 $ 49 $ 95 $ 59 Restricted N/A N/A N/A - - - - - - - Committed N/A N/A N/A 411 - - - - - - Assigned N/A N/A N/A 10,379 7,038 6,516 7,122 6,857 5,375 5,638 Unassigned N/A N/A N/A 4,106 5,143 4,284 5,337 4,925 7,204 9,796
Total General Fund $ 18,546 $ 18,856 $ 18,281 $ 15,043 $ 12,261 $ 10,856 $ 12,508 $ 11,831 $ 12,674 $ 15,493
All other governmental fundsReserved $ 3,275 $ 3,373 $ 6,248 N/A N/A N/A N/A N/A N/A N/AUnreserved, reported in:
Special revenue 24,183 22,982 9,394 N/A N/A N/A N/A N/A N/A N/ACapital projects - - 4,839 N/A N/A N/A N/A N/A N/A N/A
Nonspendable N/A N/A N/A $ - $ - $ - $ - $ - $ - $ - Restricted
Special revenue N/A N/A N/A 21,763 36,926 24,909 27,686 31,607 35,324 33,600 Capital projects N/A N/A N/A 4,939 4,302 3,493 - - - -
Committed N/A N/A N/A - - - - - - - Assigned
Special revenue N/A N/A N/A 81 96 123 138 135 158 175 Capital projects N/A N/A N/A - - - - - - -
Unassigned N/A N/A N/A - - - - (13) (4) - Total of all othergovernmental funds $ 27,458 $ 26,355 $ 20,481 $ 26,783 $ 41,324 $ 28,525 $ 27,824 $ 31,729 $ 35,478 $ 33,775
Notes: (1) GASB 54 required a change in reported fund balance, which was implemented in FY 2011.
(2) The General Fund's Undesignated Fund Balance is similar to the Unassigned Fund Balance that is reported beginning in FY 2011.
(3) Total of all other governmental funds in FY 2012 includes $11.8M of unexpended debt proceeds for the Highland Recreation Complexconstruction project in the Local Option Sales Tax Fund. Total is $29,488 without the unexpended debt proceeds.
City of Largo, fLoridaFund Balances of Government Funds
Last Ten Fiscal Years(modified accrual basis of accounting)
SCHEDULE D
2017 Comprehensive Annual Financial Report | 136
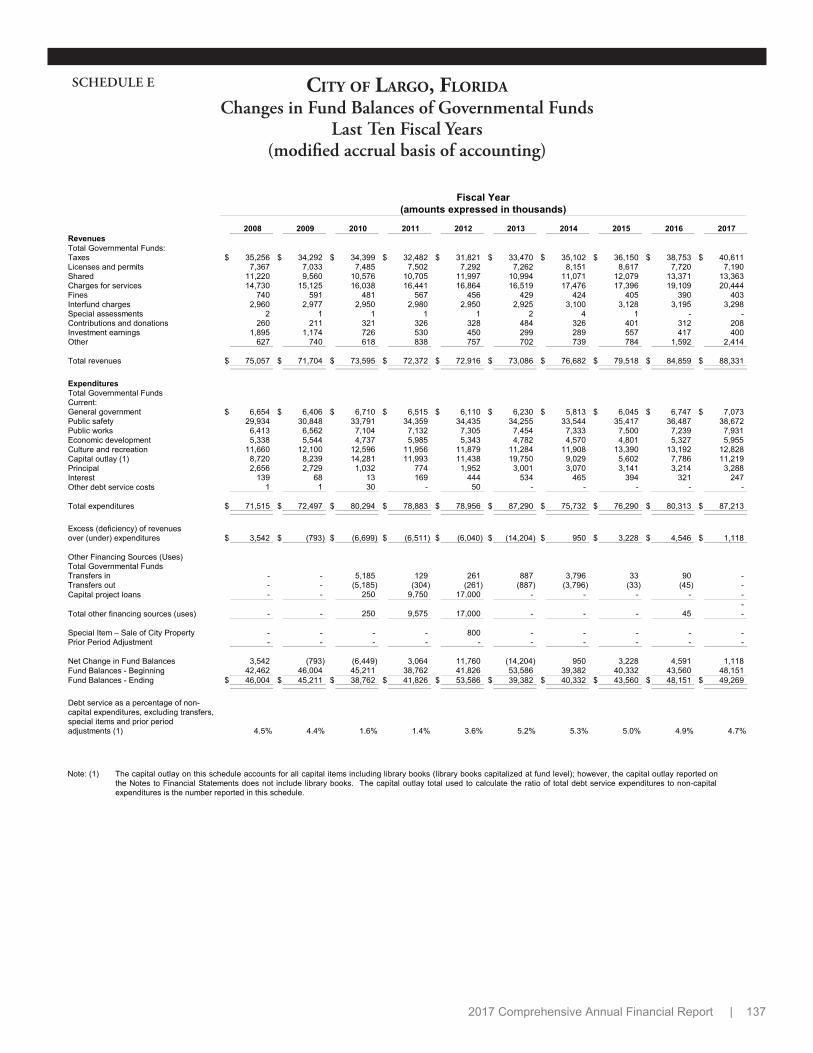
Fiscal Year(amounts expressed in thousands)
2008 2009 2010 2011 2012 2013 2014 2015 2016 2017 RevenuesTotal Governmental Funds:Taxes $ 35,256 $ 34,292 $ 34,399 $ 32,482 $ 31,821 $ 33,470 $ 35,102 $ 36,150 $ 38,753 $ 40,611 Licenses and permits 7,367 7,033 7,485 7,502 7,292 7,262 8,151 8,617 7,720 7,190 Shared 11,220 9,560 10,576 10,705 11,997 10,994 11,071 12,079 13,371 13,363 Charges for services 14,730 15,125 16,038 16,441 16,864 16,519 17,476 17,396 19,109 20,444 Fines 740 591 481 567 456 429 424 405 390 403 Interfund charges 2,960 2,977 2,950 2,980 2,950 2,925 3,100 3,128 3,195 3,298 Special assessments 2 1 1 1 1 2 4 1 - - Contributions and donations 260 211 321 326 328 484 326 401 312 208 Investment earnings 1,895 1,174 726 530 450 299 289 557 417 400 Other 627 740 618 838 757 702 739 784 1,592 2,414
Total revenues $ 75,057 $ 71,704 $ 73,595 $ 72,372 $ 72,916 $ 73,086 $ 76,682 $ 79,518 $ 84,859 $ 88,331
$ 6,654 $ 6,406 $ 6,710 $ 6,515 $ 6,110 $ 6,230 $ 5,813 $ 6,045 $ 6,747 $ 7,073 29,934 30,848 33,791 34,359 34,435 34,255 33,544 35,417 36,487 38,672
6,413 6,562 7,104 7,132 7,305 7,454 7,333 7,500 7,239 7,931 5,338 5,544 4,737 5,985 5,343 4,782 4,570 4,801 5,327 5,955
11,660 12,100 12,596 11,956 11,879 11,284 11,908 13,390 13,192 12,828 8,720 8,239 14,281 11,993 11,438 19,750 9,029 5,602 7,786 11,219 2,656 2,729 1,032 774 1,952 3,001 3,070 3,141 3,214 3,288
139 68 13 169 444 534 465 394 321 247
ExpendituresTotal Governmental Funds Current:General government Public safetyPublic worksEconomic development Culture and recreation Capital outlay (1) PrincipalInterestOther debt service costs 1 1 30 - 50 - - - - -
Total expenditures $ 71,515 $ 72,497 $ 80,294 $ 78,883 $ 78,956 $ 87,290 $ 75,732 $ 76,290 $ 80,313 $ 87,213
Excess (deficiency) of revenuesover (under) expenditures $ 3,542 $ (793) $ (6,699) $ (6,511) $ (6,040) $ (14,204) $ 950 $ 3,228 $ 4,546 $ 1,118
Other Financing Sources (Uses)Total Governmental FundsTransfers in - - 5,185 129 261 887 3,796 33 90 - Transfers out - - (5,185) (304) (261) (887) (3,796) (33) (45) - Capital project loans - - 250 9,750 17,000 - - - - -
- Total other financing sources (uses) - - 250 9,575 17,000 - - - 45 -
Special Item – Sale of City Property - - - - 800 - - - - - Prior Period Adjustment - - - - - - - - - -
Net Change in Fund Balances 3,542 (793) (6,449) 3,064 11,760 (14,204) 950 3,228 4,591 1,118 Fund Balances - Beginning 42,462 46,004 45,211 38,762 41,826 53,586 39,382 40,332 43,560 48,151 Fund Balances - Ending $ 46,004 $ 45,211 $ 38,762 $ 41,826 $ 53,586 $ 39,382 $ 40,332 $ 43,560 $ 48,151 $ 49,269
Debt service as a percentage of non-capital expenditures, excluding transfers, special items and prior period adjustments (1) 4.5% 4.4% 1.6% 1.4% 3.6% 5.2% 5.3% 5.0% 4.9% 4.7%
Note: (1) The capital outlay on this schedule accounts for all capital items including library books (library books capitalized at fund level); however, the capital outlay reported onthe Notes to Financial Statements does not include library books. The capital outlay total used to calculate the ratio of total debt service expenditures to non-capitalexpenditures is the number reported in this schedule.
City of Largo, fLoridaChanges in Fund Balances of Governmental Funds
Last Ten Fiscal Years(modified accrual basis of accounting)
SCHEDULE E
2017 Comprehensive Annual Financial Report | 137

Fiscal Year(amounts expressed in thousands)
2008 2009 2010 2011 2012 2013 2014 2015 2016 2017
$ 16,634 $ 16,237 $ 16,318 $ 14,545 $ 14,595 $ 15,691 $ 16,567 $ 17,395 $ 19,326 $ 21,026 6,524 5,792 5,319 5,219 5,508 5,820 6,195 6,677 7,055 7,264
487 178 142 585 271 181 378 382 442 385 3,953 4,311 3,841 3,772 3,611 3,374 3,139 3,073 2,914 2,871
Property TaxLocal Option Sales Tax Impact Fees Communication Tax Utility Tax Electricity 5,736 5,880 6,860 6,427 5,894 6,398 6,764 6,522 6,849 6,846 Water 1,019 1,010 1,036 1,065 1,074 1,116 1,142 1,175 1,250 1,305 Fuel 236 230 243 241 258 267 296 297 290 285
6,991 7,120 8,139 7,733 7,226 7,781 8,202 7,994 8,389 8,436
Franchise Tax Electricity 5,597 6,087 6,412 5,904 5,574 5,435 5,782 5,804 5,546 5,507 Gas 238 216 202 200 203 205 223 178 202 204
5,835 6,303 6,614 6,104 5,777 5,640 6,005 5,982 5,748 5,711
Total $ 40,424 $ 39,941 $ 40,373 $ 37,958 $ 36,988 $ 38,487 $ 40,486 $ 41,503 $ 43,874 $ 45,693
City of Largo, fLoridaGeneral Governmental Tax Revenues By Source
Last Ten Fiscal Years(modified accrual basis of accounting)
SCHEDULE F
2017 Comprehensive Annual Financial Report | 138
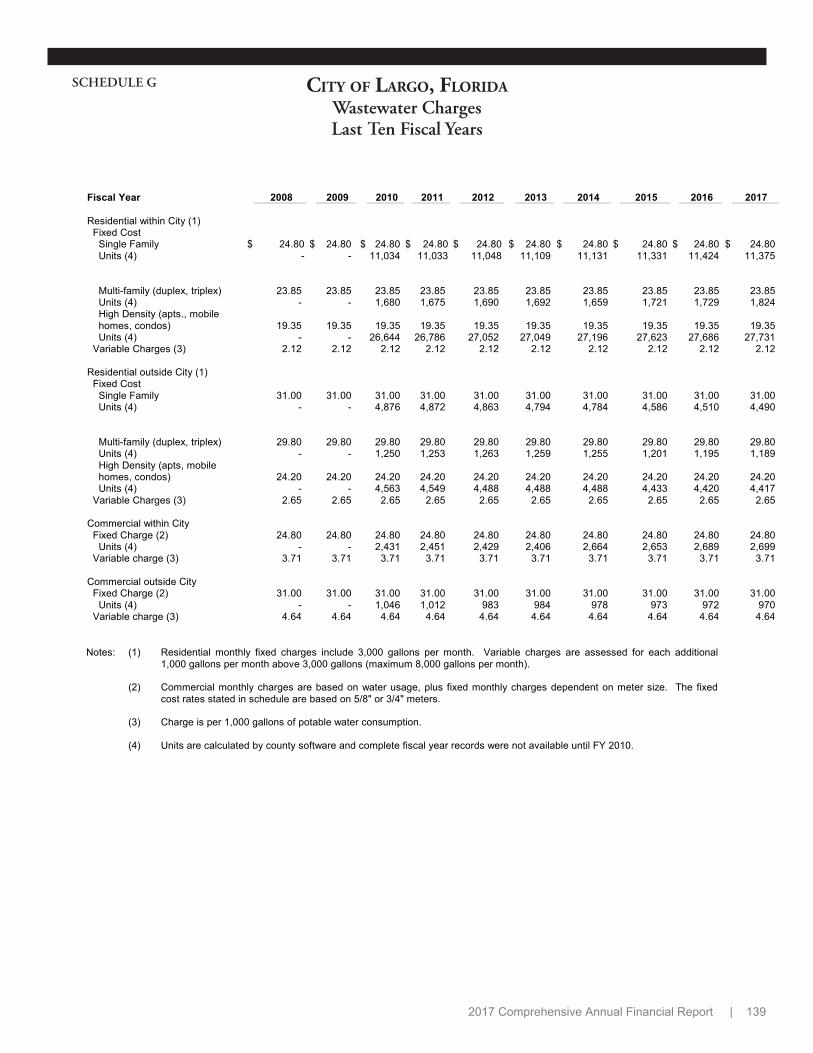
Fiscal Year 2008 2009 2010 2011 2012 2013 2014 2015 2016 2017
Residential within City (1) Fixed Cost
Single Family Units (4)
$ 24.80 -
$ 24.80 -
$ 24.80 11,034
$ 24.8011,033
$ 24.8011,048
$ 24.80 11,109
$ 24.80 11,131
$ 24.80 11,331
$ 24.80 11,424
$ 24.80 11,375
Multi-family (duplex, triplex) 23.85 23.85 23.85 23.85 23.85 23.85 23.85 23.85 23.85 23.85 Units (4) - - 1,680 1,675 1,690 1,692 1,659 1,721 1,729 1,824 High Density (apts., mobile homes, condos) Units (4)
19.35 -
19.35 -
19.35 26,644
19.35 26,786
19.35 27,052
19.35 27,049
19.35 27,196
19.35 27,623
19.35 27,686
19.35 27,731
Variable Charges (3) 2.12 2.12 2.12 2.12 2.12 2.12 2.12 2.12 2.12 2.12
Residential outside City (1) Fixed Cost
Single Family 31.00 31.00 31.00 31.00 31.00 31.00 31.00 31.00 31.00 31.00 Units (4) - - 4,876 4,872 4,863 4,794 4,784 4,586 4,510 4,490
Multi-family (duplex, triplex) 29.80 29.80 29.80 29.80 29.80 29.80 29.80 29.80 29.80 29.80 Units (4) - - 1,250 1,253 1,263 1,259 1,255 1,201 1,195 1,189 High Density (apts, mobile homes, condos) 24.20 24.20 24.20 24.20 24.20 24.20 24.20 24.20 24.20 24.20 Units (4) - - 4,563 4,549 4,488 4,488 4,488 4,433 4,420 4,417
Variable Charges (3) 2.65 2.65 2.65 2.65 2.65 2.65 2.65 2.65 2.65 2.65
Commercial within City Fixed Charge (2) 24.80 24.80 24.80 24.80 24.80 24.80 24.80 24.80 24.80 24.80 Units (4) - - 2,431 2,451 2,429 2,406 2,664 2,653 2,689 2,699 Variable charge (3) 3.71 3.71 3.71 3.71 3.71 3.71 3.71 3.71 3.71 3.71
Commercial outside City Fixed Charge (2) 31.00 31.00 31.00 31.00 31.00 31.00 31.00 31.00 31.00 31.00 Units (4) - - 1,046 1,012 983 984 978 973 972 970 Variable charge (3) 4.64 4.64 4.64 4.64 4.64 4.64 4.64 4.64 4.64 4.64
Notes: (1) Residential monthly fixed charges include 3,000 gallons per month. Variable charges are assessed for each additional1,000 gallons per month above 3,000 gallons (maximum 8,000 gallons per month).
(2) Commercial monthly charges are based on water usage, plus fixed monthly charges dependent on meter size. The fixedcost rates stated in schedule are based on 5/8" or 3/4" meters.
(3) Charge is per 1,000 gallons of potable water consumption.
(4) Units are calculated by county software and complete fiscal year records were not available until FY 2010.
City of Largo, fLoridaWastewater ChargesLast Ten Fiscal Years
SCHEDULE G
2017 Comprehensive Annual Financial Report | 139

Fiscal Year 2008 2009 2010 2011 2012 2013 2014 2015 2016 2017
Tax Year 2007 2008 2009 2010 2011 2012 2013 2014 2015 2016
$ 4,166,323 $ 3,809,739 $ 3,157,293 $ 2,718,422 $ 2,487,294 $ 2,498,822 $ 2,446,905 $ 2,738,831 $ 3,165,507 $ 3,520,089 1,390,125 1,412,725 1,351,719 1,182,675 1,135,842 1,142,172 1,162,433 1,216,276 1,279,470 1,372,492
698,883 719,407 604,895 555,376 552,843 425,277 575,387 602,364 662,416 674,253 442,327 461,909 455,939 453,485 445,267 433,694 425,073 406,829 445,876 464,699
938 487 520 512 560 570 602 962 977 1,038
Real Property Residential CommercialOtherPersonal Property Central Assessed PropertyTotal Assessed Value 6,698,596 6,404,267 5,570,366 4,910,470 4,621,806 4,500,535 4,610,400 4,965,262 5,554,246 6,032,571
(426,716) (772,276) (756,055) (700,761) (671,498) (637,961) (629,278) (626,665) (644,290) (653,646) (989,448) (681,034) (337,935) (155,745) (77,934) (43,409) (95,348) (250,947) (439,287) (547,372)
Less Tax Exempt Value Homestead (2) (3) Save Our HomeOther (560,080) (607,333) (578,305) (567,845) (565,568) (574,550) (596,708) (620,477) (746,460) (787,045)
Total Taxable Value $ 4,722,352 $ 4,343,624 $ 3,898,071 $ 3,486,119 $ 3,306,806 $ 3,244,615 $ 3,289,066 $ 3,467,173 $ 3,724,209 $ 4,044,508
Total Direct Tax Rate (1) 3.6514 3.8448 4.3113 4.3113 4.5594 4.9999 5.2139 5.1943 5.3705 5.3705
Estimated Actual TaxableValue $ 8,373,245 $ 8,005,334 $ 6,962,958 $ 6,138,088 $ 5,777,258 $ 5,625,669 $ 5,763,000 $ 6,206,578 $ 6,942,808 $ 7,540,714
Assessed Value as aPercentage of ActualValue 80% 80% 80% 80% 80% 80%
80% 80% 80% 80%
Total Taxable Value as aPercentage of TotalAssessed Value 70% 68% 70% 71% 72% 72% 71% 70% 67% 67%
Source: Pinellas County Property Appraiser
(1) Tax rate is per $1,000 of taxable value
(2) Starting FY 2008 the Homestead value includes additional homestead exemption for elders (65 years and older) and disabled veterans' homestead discount.
(3) In FY 2009 owners could qualify for an additional $25,000 for Homestead exemption.
City of Largo, fLoridaAssessed Value, Taxable Value and Estimated Actual Value of Taxable Property
Last Ten Fiscal Years(amounts expressed in thousands)
SCHEDULE H
2017 Comprehensive Annual Financial Report | 140

Fiscal Year 2008 2009 2010 2011 2012 2013 2014 2015 2016 2017
Tax Year 2007 2008 2009 2010 2011 2012 2013 2014 2015 2016
City of Largo General Operating 3.6514 3.8448 4.3113 4.3113 4.5594 4.9999 5.2139 5.1943 5.3705 5.3705
Special Operating - - - - - - - - - - Total City of Largo 3.6514 3.8448 4.3113 4.3113 4.5594 4.9999 5.2139 5.1943 5.3705 5.3705
General 4.811 4.811 4.811 4.811 4.811 5.011 5.276 5.276 5.276 5.276 Health 0.062 0.062 0.062 0.062 0.062 0.062 0.062 0.062 0.062 0.062 Mosquito Control - - - - - - - - - - EMS (1) 0.583 0.583 0.583 0.583 0.851 0.916 0.916 0.916 0.916 0.916
Total County 5.456 5.456 5.456 5.456 5.724 5.989 6.254 6.254 6.254 6.254
Other Authorities School Board 7.731 8.061 8.346 8.340 8.385 8.302 8.060 7.841 7.770 7.318 Transit Authority (1) 0.560 0.560 0.560 0.560 0.730 0.730 0.730 0.730 0.730 0.750 Water Management
General 0.387 0.387 0.387 0.377 0.393 0.393 0.382 0.366 0.349 0.331 Anclote Basin 0.370 0.360 0.320 0.260 - - - - - -
Juvenile Welfare Board 0.738 0.792 0.792 0.792 0.834 0.898 0.898 0.898 0.898 0.898 Planning Council 0.017 0.017 0.013 0.013 0.013 0.013 0.016 0.016 0.016 0.015 Total Other Authorities 9.803 10.177 10.418 10.342 10.355 10.336 10.086 9.851 9.763 9.312
Total All Authorities 18.910 19.478 20.185 20.109 20.638 21.325 21.554 21.299 21.388 20.937
Source: Pinellas County, Florida, Tax Collector's Office
Note: (1) Emergency Medical Services (EMS) and Transit Authority (PSTA) assessed on Real Property only.
City of Largo, fLoridaProperty Tax Rates
Direct and Overlapping1 GovernmentsLast Ten Fiscal Years
(in Mills, Per $1,000 Assessed Valuation)
SCHEDULE I
2017 Comprehensive Annual Financial Report | 141
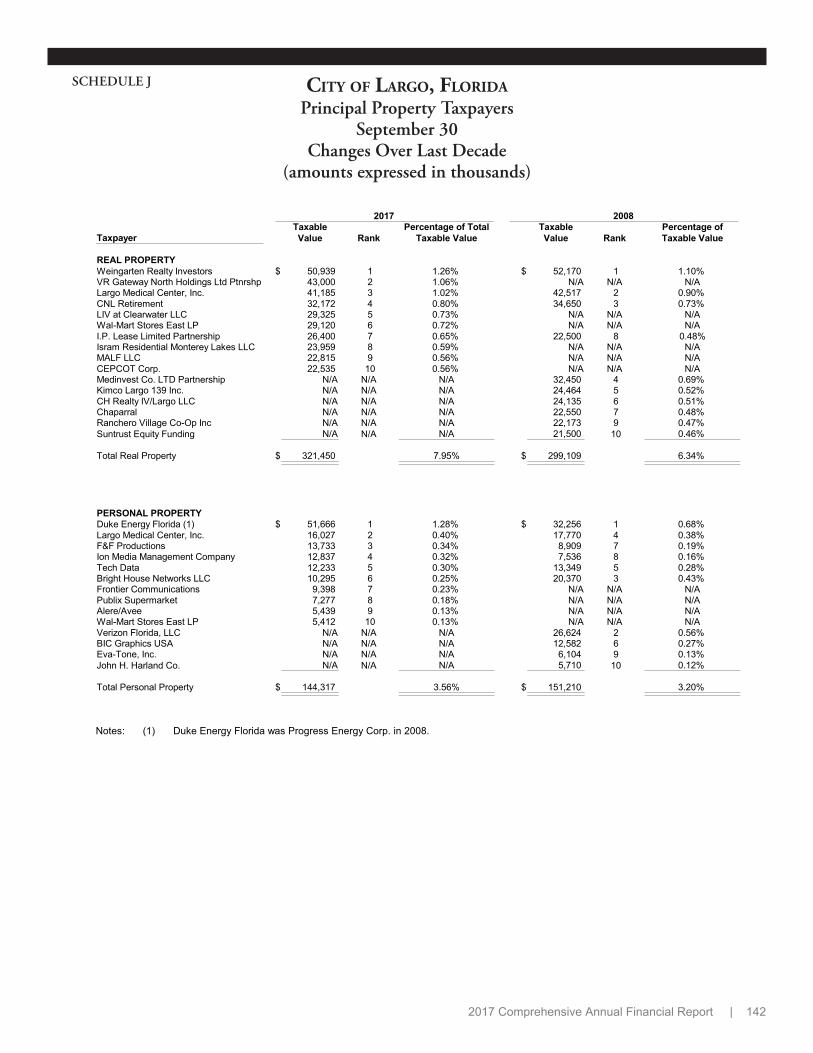
2017 2008
TaxpayerTaxableValue Rank
Percentage of TotalTaxable Value
TaxableValue Rank
Percentage ofTaxable Value
REAL PROPERTYWeingarten Realty Investors $ 50,939 1 1.26% $ 52,170 1 1.10% VR Gateway North Holdings Ltd Ptnrshp 43,000 2 1.06% N/A N/A N/ALargo Medical Center, Inc. 41,185 3 1.02% 42,517 2 0.90% CNL Retirement 32,172 4 0.80% 34,650 3 0.73% LIV at Clearwater LLC 29,325 5 0.73% N/A N/A N/AWal-Mart Stores East LP 29,120 6 0.72% N/A N/A N/AI.P. Lease Limited Partnership 26,400 7 0.65% 22,500 8 0.48%Isram Residential Monterey Lakes LLC 23,959 8 0.59% N/A N/A N/AMALF LLC 22,815 9 0.56% N/A N/A N/ACEPCOT Corp. 22,535 10 0.56% N/A N/A N/AMedinvest Co. LTD Partnership N/A N/A N/A 32,450 4 0.69% Kimco Largo 139 Inc. N/A N/A N/A 24,464 5 0.52% CH Realty IV/Largo LLC N/A N/A N/A 24,135 6 0.51% Chaparral N/A N/A N/A 22,550 7 0.48% Ranchero Village Co-Op Inc N/A N/A N/A 22,173 9 0.47% Suntrust Equity Funding N/A N/A N/A 21,500 10 0.46%
Total Real Property $ 321,450 7.95% $ 299,109 6.34%
PERSONAL PROPERTYDuke Energy Florida (1) $ 51,666 1 1.28% $ 32,256 1 0.68% Largo Medical Center, Inc. 16,027 2 0.40% 17,770 4 0.38% F&F Productions 13,733 3 0.34% 8,909 7 0.19% Ion Media Management Company 12,837 4 0.32% 7,536 8 0.16% Tech Data 12,233 5 0.30% 13,349 5 0.28% Bright House Networks LLC 10,295 6 0.25% 20,370 3 0.43% Frontier Communications 9,398 7 0.23% N/A N/A N/APublix Supermarket 7,277 8 0.18% N/A N/A N/AAlere/Avee 5,439 9 0.13% N/A N/A N/AWal-Mart Stores East LP 5,412 10 0.13% N/A N/A N/AVerizon Florida, LLC N/A N/A N/A 26,624 2 0.56% BIC Graphics USA N/A N/A N/A 12,582 6 0.27% Eva-Tone, Inc. N/A N/A N/A 6,104 9 0.13% John H. Harland Co. N/A N/A N/A 5,710 10 0.12%
Total Personal Property $ 144,317 3.56% $ 151,210 3.20%
Notes: (1) Duke Energy Florida was Progress Energy Corp. in 2008.
City of Largo, fLoridaPrincipal Property Taxpayers
September 30Changes Over Last Decade
(amounts expressed in thousands)
SCHEDULE J
2017 Comprehensive Annual Financial Report | 142

Fiscal Year 2008 2009 2010 2011 2012 2013 2014 2015 2016 2017 Tax Year 2007 2008 2009 2010 2011 2012 2013 2014 2015 2016
Millage rate 3.6514 3.8448 4.3113 4.3113 4.5594 4.9999 5.2139 5.1943 5.3705 5.3705 Gross tax levy (3) $ 17,243 $ 16,700 $ 16,805 $ 15,030 $ 15,077 $ 16,223 $ 17,149 $ 18,010 $ 20,001 $ 21,721 Less:Discounts–net of penalties(1) 585 559 571 515 524 564 593 636 710 775 Refunds/Other 9 - 4 4 1 2 1 5 1 2
Net tax levy $ 16,649 $ 16,141 $ 16,230 $ 14,511 $ 14,552 $ 15,657 $ 16,555 $ 17,369 $ 19,290 $ 20,944
Taxes Collected within fiscal year of levyPercentage of net levy 95.5% 95.4% 95.1% 95.7% 96.4% 97.1% 97.6% 97.9% 98.2% 98.2%
Amount $ 15,897 $ 15,393 $ 15,439 $ 13,882 $ 14,026 $ 15,202 $ 16,151 $ 17,002 $ 18,945 $ 20,573 Collections of delinquenttaxes in subsequent years (3) 844 879 663 569 490 416 393 380 453 N/A
Total collections to date $ 16,741 $ 16,272 $ 16,102 $ 14,451 $ 14,516 $ 15,618 $ 16,544 $ 17,382 $ 19,398 $ 20,573
Total percentage of net levycollected to date (2) 100.6% 100.8% 99.2% 99.6% 99.8% 99.8% 99.9% 100.1% 100.6% 98.2%
Source: Pinellas County, Florida, Tax Collector's Office and Property Appraiser's Office
Notes: (1) Discounts are allowed for early payments; 4% for November, 3% for December, 2% for January and 1% forFebruary. No discount is allowed for payment in March. Penalties are assessed beginning in April.
(2) All delinquent taxes collected area applied to the immediately prior tax year, because the County Tax Collectordoes not allocate delinquent taxes collected by original tax year levied. Consequently, the total collections to datepercentage of the tax levy to date may be greater than 100% of the maximum collectible tax levy for a given year.
(3) The gross tax levy numbers are recorded from the DR-403V form from the Office of the Pinellas County PropertyAppraiser.
City of Largo, fLoridaProperty Tax Levies and Collections
Last Ten Fiscal Years(amounts expressed in thousands)
SCHEDULE K
2017 Comprehensive Annual Financial Report | 143

2008 2009 2010 2011 2012 2013 2014 2015 2016 2017
Governmental activities
General obligation bonds $ - $ - $ - $ - $ - $ - $ - $ - $ - $ - Loans payable 3,761 1,032 250 9,226 24,274 21,273 18,204 15,063 11,849 8,561 Internal borrowing - - - - - - - - - -
Total governmental activities 3,761 1,032 250 9,226 24,274 21,273 18,204 15,063 11,849 8,561
Business-type activitiesSewer bonds and loans (4) 22,181 19,510 16,731 13,832 9,061 6,871 6,477 3,531 24,364 63,484
Total primary government $ 25,942 $ 20,542 $ 16,981 $ 23,058 $ 33,335 $ 28,144 $ 24,681 $ 18,594 $ 36,213 $ 72,045
Outstanding debt as a percentageof personal income (3) 3.1% 2.1% 2.0% 2.3% 3.6% 2.8% 2.0% 2.1% 3.1% 7.1%
Governmental activitiesOutstanding debt per capita (1)(3) $ 50 $ 14 $ 3 $ 119 $ 312 $ 271 $ 229 $ 187 $ 145 $ 104
Business-type activitiesOutstanding debt per capita (2)(3) 222 185 158 128 99 61 57 31 216 580
Total outstanding debt per capita (3) $ 272 $ 199 $ 161 $ 247 $ 411 $ 332 $ 286 $ 218 $ 361 $ 684
Notes: Details regarding the City's outstanding debt can be found in the Notes to the Financial Statements.
(1) All governmental activities debt is supported by the local option sales tax and half-cent sales tax; therefore, noproperty tax revenue is utilized for principal or interest repayment.
(2) Business-type activities debt is partially supported by residents in the unincorporated portions of the City'ssewer district; therefore, the sewer district population of approximately 109,503 was used to calculate debt percapita for each year.
(3) Refer to the Statistical Schedule of Demographic and Economic Statistics for personal income and populationdata. Excludes personal income of unincorporated residents in sewer district.
(4) The City has secured loans from the State of Florida for Sewer Fund capital. The debt reported is the amountthe City has borrowed by FY 2017 year-end.
City of Largo, fLoridaRatios of Outstanding Debt by Type
Last Ten Fiscal Years(amounts expressed in thousands, except per capita amounts)
SCHEDULE L
2017 Comprehensive Annual Financial Report | 144
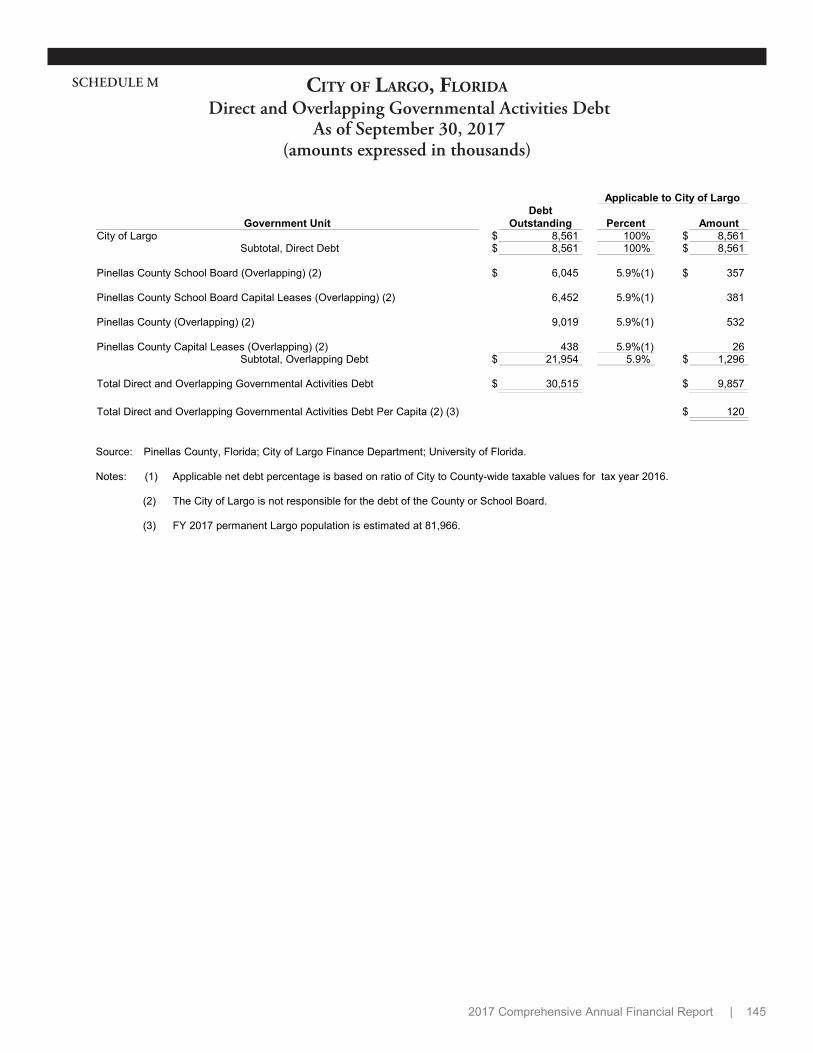
Applicable to City of LargoDebt
Government Unit Outstanding Percent AmountCity of Largo $ 8,561 100% $ 8,561
Subtotal, Direct Debt $ 8,561 100% $ 8,561
Pinellas County School Board (Overlapping) (2) $ 6,045 5.9%(1) $ 357
Pinellas County School Board Capital Leases (Overlapping) (2) 6,452 5.9%(1) 381
Pinellas County (Overlapping) (2) 9,019 5.9%(1) 532
Pinellas County Capital Leases (Overlapping) (2) 438 5.9%(1) 26 Subtotal, Overlapping Debt $ 21,954 5.9% $ 1,296
Total Direct and Overlapping Governmental Activities Debt $ 30,515 $ 9,857
Total Direct and Overlapping Governmental Activities Debt Per Capita (2) (3) $ 120
Source: Pinellas County, Florida; City of Largo Finance Department; University of Florida.
Notes: (1) Applicable net debt percentage is based on ratio of City to County-wide taxable values for tax year 2016.
(2) The City of Largo is not responsible for the debt of the County or School Board.
(3) FY 2017 permanent Largo population is estimated at 81,966.
City of Largo, fLoridaDirect and Overlapping Governmental Activities Debt
As of September 30, 2017(amounts expressed in thousands)
SCHEDULE M
2017 Comprehensive Annual Financial Report | 145

2008 2009 2010 2011 2012 2013 2014 2015 2016 2017 Debt limit (1) $ 4,722,353 $ 4,343,624 $ 3,897,783 $ 3,486,119 $ 3,306,806 $ 3,244,615 $ 3,289,066 $ 3,467,173 $ 3,724,209 $ 4,044,508 Total net debtapplicable to limit 3,761 1,032 250 9,226 24,274 21,273 18,204 15,063 11,849 8,561
Legal debt margin (1) $ 4,718,592 $ 4,342,592 $ 3,897,533 $ 3,476,893 $ 3,282,532 $ 3,223,342 $ 3,270,862 $ 3,452,110 $ 3,712,360 $ 4,035,947
Total net debtapplicable to this limit as a percentage of debt limit 0.08% 0.02% 0.01% 0.26% 0.73% 0.66% 0.55% 0.43% 0.32% 0.21%
Legal Debt Margin Calculation for Fiscal Year 2017
Assessed value $ 4,044,440 Add back: exempt real property 68 Total assessed value $ 4,044,508
Debit limit (100% of total assessed value) $ 4,044,508 Debt applicable to limit:
General obligation bonds - Other notes and loans 8,561 Less: Amount set aside for repayment of general obligation debt - Total net debt applicable to limit 8,561
Legal debt margin (1) $ 4,035,947
Notes: (1) The City of Largo has not adopted a legal debt limit; however, the City Commission has traditionally practicedconservative debt issuance. Amount presented is Total Taxable Value of all real property, personal property andcentrally assessed property.
(2) Includes all general government debt not supported by Enterprise Funds or special assessment.
(3) Pinellas County, Florida – Property Appraiser's Office and applicable City records.
City of Largo, fLoridaLegal Debt Margin Information
Last Ten Fiscal Years(amounts expressed in thousands)
SCHEDULE N
2017 Comprehensive Annual Financial Report | 146

2008 2009 2010 2011 2012 2013 2014 2015 2016 2017 (3)
Sewer revenue (excludes interest) $ 23,231 $ 22,103 $ 22,357 $ 22,259 $ 22,501 $ 22,585 $ 22,371 $ 22,680 $ 22,751 $ 23,083 Interest revenue 1,098 739 616 409 261 196 272 574 438 392
Total revenues 24,329 22,842 22,973 22,668 22,762 22,781 22,643 23,254 23,189 23,475 Less total operating expenses (14,882) (14,026) (14,751) (15,445) (15,917) (12,533) (14,252) (14,111) (14,546) (14,990)(excludes depreciation)
9,447 8,816 8,222 7,223 6,845 10,248 8,391 9,143 8,643 8,485 Net revenues Gulf Breeze loan (2)
Debt service charges 1,298 1,297 1,296 1,297 1,297 1,298 N/A N/A N/A N/A Required coverage % 1.25 1.25 1.25 1.25 1.25 1.25 N/A N/A N/A N/A Required coverage $ 1,623 1,621 1,620 1,621 1,621 1,623 N/A N/A N/A N/A
7,824 7,195 6,602 5,602 5,224 8,625 8,391 9,143 8,643 8,485 Remaining net revenues Florida Municipal League Council Pool (1)
Debt service charges 641 639 642 643 N/A N/A N/A N/A N/A N/A Required coverage % 1.25 1.25 1.25 1.25 N/A N/A N/A N/A N/A N/A Required coverage $ 801 799 803 804 N/A N/A N/A N/A N/A N/A
7,023 6,396 5,799 4,798 5,224 8,625 8,391 9,143 8,643 8,485 Remaining net revenues State loan (1996)
Debt service charges 746 746 746 746 746 746 746 746 746 1,103 Required coverage % 1.15 1.15 1.15 1.15 1.15 1.15 1.15 1.15 1.15 1.15 Required coverage $ 858 858 858 858 858 858 858 858 858 1,268
6,165 5,538 4,941 3,940 4,366 7,767 7,533 8,285 7,785 7,217 Remaining net revenues Wachovia loan (2003)
Debt service charges 904 904 904 451 N/A N/A N/A N/A N/A N/A Required coverage % 1.25 1.25 1.25 1.25 N/A N/A N/A N/A N/A N/A Required coverage $ 1,130 1,130 1,130 564 N/A N/A N/A N/A N/A N/A
Remaining net revenues $ 5,035 $ 4,408 $ 3,811 $ 3,376 $ 4,366 $ 7,767 $ 7,533 $ 8,285 $ 7,785 $ 7,217
Source: City of Largo Comprehensive Annual Financial Report for the Fiscal Years ended September 30, 2008 – 2017; and applicablebond official statements.
Notes: (1) The Florida Municipal League Council Loan was funded in November, 2001, on a parity with the Gulf Breeze Loan. Thecoverage percentage for the Gulf Breeze Loan was therefore increased per Section 4.5 of the Gulf Breeze LoanAgreement.
(2) The Gulf Breeze Loan requires a normal coverage ratio of 1.10 until additional parity debt is issued, after which a coverageratio of 1.15 is required; however, the Florida Municipal League Loan requires a coverage ratio of 1.25 for all parity debt,which includes the Gulf Breeze Loan.
(3) The City is currently using a State Revolving Loan Fund for sewer projects. The payments will be starting in FY 2019 andwill have an affect on coverage ratios.
City of Largo, fLoridaPledged-Revenue Coverage
Last Ten Fiscal Years(amounts expressed in thousands)
SCHEDULE O
2017 Comprehensive Annual Financial Report | 147

2008 2009 2010 2011 2012 2013 2014 2015 2016 2017
Permanent population (1) 75,441 74,805 75,268 77,653 77,836 78,488 79,431 80,747 81,587 81,966
Fire/Sewer district population (2)(7) 101,300 105,500 106,000 108,200 91,508 112,950 113,148 113,148 112,925 109,503
Total Housing units (4) 45,226 46,275 45,335 45,784 45,072 48,722 43,003 45,889 45,689 48,881 Owner-occupied housingunits (4) 23,592 22,343 22,437 21,449 19,985 20,060 19,659 19,085 18,411 22,212 Renter-occupied housingunits (4) 12,999 14,076 13,731 13,689 14,698 17,430 14,575 17,094 16,781 16,506
Vacant housing units (4) 8,636 9,856 9,167 10,646 10,389 11,232 8,769 9,710 10,497 10,163
Personal income(expressed in thousands)(4) $ 846,324 $ 994,022 $ 853,798 $ 998,561 $ 923,679 $ 1,003,171 $ 1,236,439 $ 884,192 $ 1,168,878 $ 1,011,753
Per capita personalincome (1)(4) $ 11,218 $ 13,288 $ 11,343 $ 12,859 $ 11,867 $ 12,781 $ 15,566 $ 10,950 $ 14,327 $ 12,344
Median family income (4) $ 44,131 $ 51,728 $ 48,080 $ 51,713 $ 47,401 $ 48,845 $ 48,846 $ 48,231 $ 53,827 $ 53,870
Median age (4) 48.4 50.9 48.6 46.9 47.6 46.8 48.2 49.0 45.1 50.1
Public school enrollment(5) 6,375 6,253 6,249 5,836 5,436 5,780 5,466 5,504 5,564 5,660
Percent high schoolgraduate or higher (4)(6) 86.6% 85.2% 86.1% 87.6% 87.6% 87.7% 85.7% 89.5% 89.7% 91.1%
Percent bachelor's degreeor higher (4)(6) 20.9% 18.8% 19.0% 21.4% 18.4% 18.8% 20.1% 21.0% 19.9% 20.8%
Unemployment rate (3) 5.5% 10.1% 12.4% 11.4% 9.4% 7.4% 6.4% 5.4% 4.6% 4.2%
Data Sources:
(1) University of Florida (2017)
(2) The method of estimation was changed for FY 2013. The new method uses the GIS to estimate the fire/sewer districtpopulation. Note, the Town of Belleair and City of Belleair Bluffs that contract out fire services with Largo are not includedin this population total. The City provides fire and EMS services and sewer services to unincorporated portions ofPinellas County.
(3) Florida Department of Labor (2008 – 2017). Bureau of Labor Statistics (www.bls.gov) (12 month average).
(4) United States Census Bureau (American Fact Finder) (2008); (2009); (2010); (2011); (2012); (2013); (2014); (2015);(2016).
(5) Pinellas County School Board.
(6) Includes population 25 years and older.
(7) A new population estimate was not calculated in FY 2015.
City of Largo, fLoridaDemographic and Economic Statistics
Last Ten Fiscal Years
SCHEDULE P
2017 Comprehensive Annual Financial Report | 148
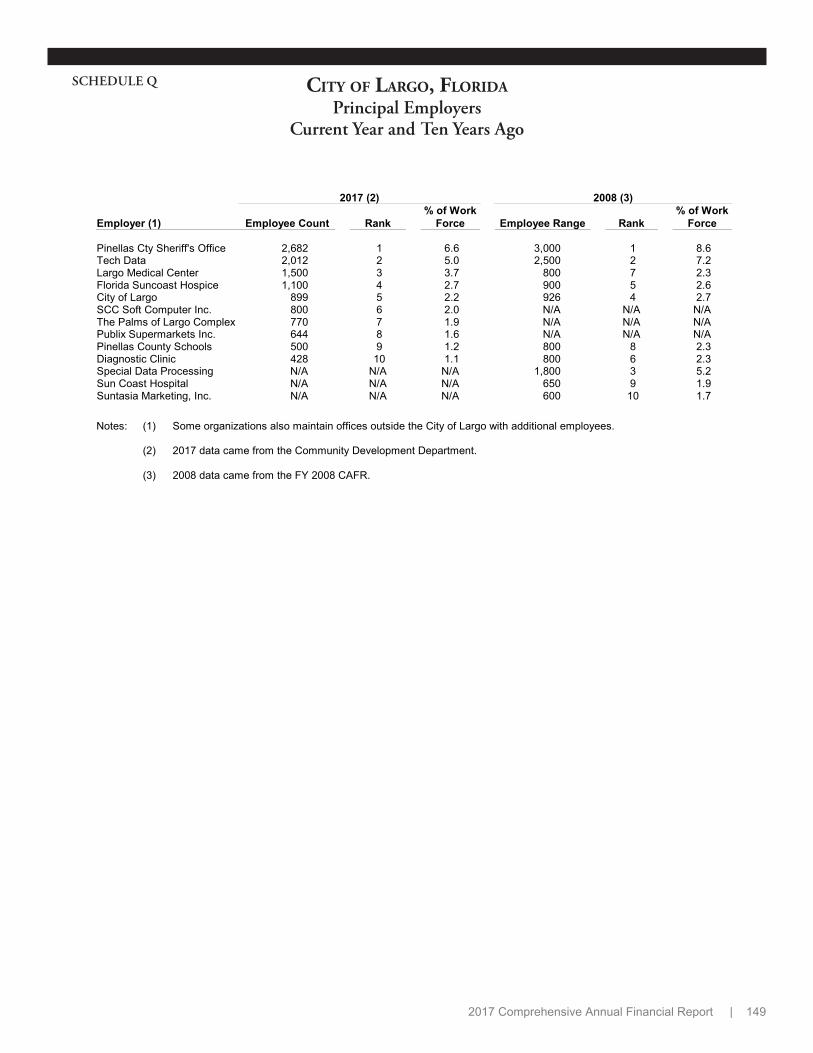
2017 (2) 2008 (3)
Employer (1) Employee Count Rank% of Work
Force Employee Range Rank% of Work
Force
Pinellas Cty Sheriff's Office 2,682 1 6.6 3,000 1 8.6 Tech Data 2,012 2 5.0 2,500 2 7.2 Largo Medical Center 1,500 3 3.7 800 7 2.3 Florida Suncoast Hospice 1,100 4 2.7 900 5 2.6 City of Largo 899 5 2.2 926 4 2.7 SCC Soft Computer Inc. 800 6 2.0 N/A N/A N/A The Palms of Largo Complex 770 7 1.9 N/A N/A N/A Publix Supermarkets Inc. 644 8 1.6 N/A N/A N/APinellas County Schools 500 9 1.2 800 8 2.3 Diagnostic Clinic 428 10 1.1 800 6 2.3 Special Data Processing N/A N/A N/A 1,800 3 5.2 Sun Coast Hospital N/A N/A N/A 650 9 1.9 Suntasia Marketing, Inc. N/A N/A N/A 600 10 1.7
Notes: (1) Some organizations also maintain offices outside the City of Largo with additional employees.
(2) 2017 data came from the Community Development Department.
(3) 2008 data came from the FY 2008 CAFR.
City of Largo, fLoridaPrincipal Employers
Current Year and Ten Years Ago
SCHEDULE Q
2017 Comprehensive Annual Financial Report | 149

2008 2009 2010 2011 2012 2013 2014 2015 2016 2017 FUNCTION
General GovernmentLegislative 8.00 8.00 8.00 8.00 8.00 8.00 8.00 8.00 8.00 8.00 Administration 26.63 25.63 24.13 23.63 22.33 19.33 19.33 20.48 23.58 24.58 Human Resources 12.50 13.00 13.00 12.50 12.00 11.00 11.00 11.00 11.00 11.00 Finance 13.00 12.75 13.00 12.00 12.40 12.40 12.60 12.60 12.60 12.60 Information Technology 18.00 17.25 20.00 20.00 19.00 19.00 20.00 21.00 25.00 27.00
Total General Government 78.13 76.63 78.13 76.13 73.73 69.73 70.93 73.08 80.18 83.18
Public SafetyPolice 208.25 207.25 202.25 201.25 198.80 195.02 195.27 197.77 200.81 203.81 Fire/Rescue 143.00 142.50 153.50 151.25 143.50 140.25 140.00 141.00 145.00 146.00
Total Public Safety 351.25 349.75 355.75 352.50 342.30 335.27 335.27 338.77 345.81 349.81
Environmental Services 87.00 87.00 87.25 87.25 88.25 88.25 88.25 88.10 87.25 86.25
Public Works 152.50 147.50 146.75 147.25 144.25 139.75 138.75 138.75 142.50 142.83
Community Development 60.75 60.75 63.25 63.25 62.25 61.25 62.25 64.75 63.75 66.25
Cultural and RecreationRecreation, Parks & Arts 140.62 137.32 131.68 128.03 122.81 119.24 119.14 119.79 121.08 129.75 Library 55.69 50.95 48.65 44.65 41.75 41.40 41.20 41.70 41.70 41.20
Total Cultural and Recreation 196.31 188.27 180.33 172.68 164.56 160.64 160.34 161.49 162.78 170.95
Total City 925.94 909.90 911.46 899.06 875.34 854.89 855.79 864.94 882.27 899.27
Source: City of Largo Annual Budget, Fiscal Years 2008 – 2017
City of Largo, fLoridaFull-time Equivalent City Governmental Employees by Function
Last Ten Fiscal Years
SCHEDULE R
2017 Comprehensive Annual Financial Report | 150

2008 2009 2010 2011 2012 2013 2014 2015 2016 2017 FUNCTION
PoliceArrests 6,271 5,696 4,258 3,853 4,387 3,535 3,055 3,145 3,302 3,099 Citations Processed 27,083 22,780 21,882 27,460 23,723 22,984 23,165 22,369 19,553 18,610
Fire/RescueInspections 3,088 4,709 4,946 4,762 4,918 5,294 4,321 4,230 3,024 2,666 Structure fires 101 141 150 167 102 70 71 53 45 41 EMS incidents 14,568 14,889 17,708 16,633 17,116 17,423 18,990 20,085 24,448 26,393 All other incidents 4,522 4,209 3,145 4,946 4,166 4,976 4,169 4,555 2,213 2,674
Highways and StreetsStreet repair (linear feet) 4,530 1,965 3,000 4,262 5,010 4,850 9,807 8,423 6,855 21,983 Potholes repaired (asphaltusage-tons) 640 142 205 191 192 124 95 94 120 171
Sanitation (Solid Waste)Refuse collected (tons) 85,608 79,108 77,523 77,522 74,887 79,322 77,671 81,861 84,537 84,612 Recyclables collected (tons) 4,640 4,333 5,386 5,611 9,244 9,235 10,906 11,861 12,234 11,084
Recreation, Parks and ArtsAttendance
Recreation centers (1) 499,371 616,415 593,922 726,630 662,000 650,005 571,027 589,566 596,626 424,006 Special events (1) 145,000 156,000 139,100 120,000 111,500 125,000 130,000 215,000 175,000 142,485 Golf Course (1) 53,280 47,320 50,500 54,221 48,500 49,000 49,500 49,500 47,500 47,500 Cultural Center (1) 61,894 73,780 75,100 68,900 63,347 57,000 63,700 69,000 74,200 45,646
Parks – acres maintained (1) 486 494.6 494.6 494.6 494.6 494.6 494.6 494.6 494.6 494.6
StormwaterDrainage pipes replaced(linear feet) 5,200 658 222 432 920 995 357 80 96 158
Subsurface drainage pipe(linear feet) 3,400 300 810 525 300 250 120 80 24 850
WastewaterAverage daily sewagetreatment (millions/gallons) 11.6 11.0 11.7 12.3 11.3 11.5 10.9 12.8 12.0 10.8
Notes: (1) In FY 2017 the Recreation, Parks and Arts Department started a more accurate way to track attendance.
City of Largo, fLoridaOperating Indicators by Function
Last Ten Fiscal Years
SCHEDULE S
2017 Comprehensive Annual Financial Report | 151

2008 2009 2010 2011 2012 2013 2014 2015 2016 2017 FUNCTION
Public safetyPolice
Stations 1 1 1 1 1 1 1 1 1 1 Patrol units 105 102 102 104 104 107 107 107 110 116
Fire stations 5 5 5 5 5 5 5 5 5 6
Sanitation (Solid Waste)Collection trucks 40 39 39 37 39 39 39 39 41 40
Highways and streetsStreets (miles) 151 151 156 158.3 158.3 158.3 158.3 158.3 158.3 158.3 Traffic signals 56 56 56 56 56 56 56 56 56 56
Culture and recreationParks acreage 486 495 495 495 495 495 495 495 495 495 Parks and facilities (1) (2) (3) 21 21 20 20 20 20 20 20 20 20 Swimming pools 3 3 3 3 3 3 3 3 3 3 Tennis courts (3) 2 2 2 2 2 2 2 2 2 2 Community centers 3 3 3 3 3 3 3 3 3 3 Cultural Center 1 1 1 1 1 1 1 1 1 1 Golf courses 1 1 1 1 1 1 1 1 1 1
Reclaimed waterMiles of distribution lines 88 88 88 88 88 88 88 88 88 89 Total gallons reuse(millions/per day) 6.9 7.1 6.1 6.0 5.7 5.8 5.8 5.2 5.0 5.6
SewerSanitary sewers (miles) 304 304 304 304 304 321 321 335 335 343 Lift stations maintained 53 53 53 57 57 57 57 57 57 57 Maximum daily treatmentcapacity (thousands of gallons) 18,000 18,000 18,000 18,000 18,000 18,000 18,000 18,000 18,000 18,000
StormwaterDrainage ditch/lines (miles) 132 132 132 132 132 132 132 132 132 132 City lakes and retention ponds 24 24 24 24 24 24 24 24 24 24
Notes: (1) Brittany Bay Outreach Center closed in FY 2008.
(2) Lake Palms Outreach Center has been included in past years and was closed in FY 2010.
(3) The construction of Highland Complex has temporarily removed the skate park and one set of tennis courts in FY 2012.
City of Largo, fLoridaCapital Asset Statistics by Function
Last Ten Fiscal Years
SCHEDULE T
2017 Comprehensive Annual Financial Report | 152

Municipal Revenue Sharing (General Fund)
The Municipal Revenue Sharing Act of 1972 created the RevenueSharing Trust Fund for Municipalities. The percentage of state salestax revenues transferred to the Revenue Sharing Trust Fund forMunicipalities is 1.3653%, (General Fund), in addition to the netcollections from the one-cent municipal fuel tax. Funds derived fromthe one-cent municipal fuel tax must be used for transportation-relatedexpenditures.
Requirements for eligibility beyond the “minimum entitlement” includean independent annual audit, reporting finances annually to theDepartment of Banking and Finance, formal application for participationin the program, meeting of state standards for the hiring of police andfire fighting personnel, a minimum local tax effort based on the revenueraised by a 3 mill property tax in 1972, and complying with Stateprocedures for the levying of property taxes.
Revenue sharing funds are allocated based on three factors: weightedpopulation figure; sales tax collections; and relative ability to raiserevenue. These three factors are added and then averaged todetermine the distribution factor. All funds above the guaranteedamount are distributed to the municipalities based on the distributionfactor as applied to the number of total dollars in the program availableafter guaranteed payments are distributed.
Effective June 3, 2003 Chapter 2003-86, Laws of Florida (HB 1813)expanded the authorized uses of the Municipal Fuel Tax to includeconstruction, reconstruction, operation, maintenance and repair ofbicycle paths and pedestrian pathways.
State Sales Tax (General Fund)
The current State Sales Tax is 6%, excluding any local option salestaxes of up to 1% (see other section on Local Infrastructure Surtax).Effective July 1, 2015 the funding of the state court system changedthe percentage of the state sales tax revenues transferred to theHalf-cent Sales Tax Clearing Trust Fund from 8.8854% to 8.9744%.
The amount distributed to each local government is calculated by firstdetermining the amount of sales tax collected within each county. Thisamount is then divided among the county government and themunicipalities within the county based on a formula which is based onvarious population factors. The funds may be expended formunicipality-wide programs or for municipality-wide property tax orutility tax relief. The proceeds from the sales tax may be pledged forthe payment of principal and interest incurred for capital projects.
Fire District Tax (General Fund)
The City provides fire protection services within a fire districtestablished by Pinellas County. Within the unincorporated portion ofthe fire district, the County levies a fire district tax, the proceeds fromwhich are remitted to the City in return for the provision of fire services.The proportion of the Fire Department budget received from the firedistrict tax is calculated by determining the proportion of the value ofreal property within the unincorporated portion of the fire district ascompared to the value of real property within the entire fire district. Thiscalculation is made by the County, which then establishes the firedistrict rate.
Currently, the fire district tax provides approximately 15% of the portionof the fire department budget not supported by EMS funding or theHigh Point Fire District.
On October 1, 2015 the City of Belleair Bluffs and Town of Belleairentered into another Agreement for the provision of fire suppressionservices with the City of Largo.
High Point Fire District Tax (General Fund)
Pinellas County contracts with the City of Largo to operate one firestation and to provide fire service protection for half of the High PointFire District. The City is reimbursed by the County for the actual costof the provision of this service. The County derives revenue for thispurpose by levying a special fire district tax within the High Point FireDistrict. Revenue from this source grows at the same rate asincreases in the budget for this particular portion of Fire Departmentservices.
Emergency Medical Services (EMS) Tax (General Fund)
The County levies a special tax county-wide to pay for the provision ofEMS. The County then contracts with municipal fire departments,special fire districts, and private firms to provide actual EMS to Countyresidents. Pinellas County and Largo entered into a three-yearagreement commencing October 1, 2014 and ending September 30,2017.
Franchise Fees (General Fund)
Public Utilities must pay a franchise fee to the City in return for the rightto use public rights-of-way for transmission lines, pipes, wires, etc. Allagreements are non-exclusive franchises. A summary of franchiseagreements and their rates is as follows: Gas Service - 6% of grossrevenues; Electric Service - 6% of gross revenues.
Communications Services Tax (CST) (General Fund)
Effective October 1, 2001, municipalities may no longer charge aFranchise Fee or Utility Tax on any type of communication services,including telecommunications, cable TV and satellite transmissions. The CST replaces the communications services Franchise Fee andUtility Taxes.
The State's intent was to set the CST rate high enough to returnrevenue lost by dis-allowance of the Franchise Fee and Utility Tax. The City of Largo's FY 2002 CST rate was set by the FloridaDepartment of Revenue at 6.12% for the first year's transition lag inreceiving revenues, and was reduced to 5.62% for FY 2003 andthereafter. This does not include the 0.60% county surtax conversionrate due to the Local Option Sales Tax.
Utility Tax (General Fund)
The City levies a utility tax on the purchase of electricity, metered orbottled gas, fuel oil, and water service. This tax is levied at thestate-allowed maximum of $0.04 per gallon for fuel oil, and 10% ofservices provided by the remaining utilities. In accordance with Statelaw, the utility tax does not include any fuel adjustment charges.
Library Cooperative (General Fund)
The City is a member of the Pinellas Public Library Cooperative, whichprovides funding to all participating municipalities in the County.Municipal libraries provide services free of charge to unincorporatedCounty residents and other member municipalities in return for thisfunding. Participation in the County Cooperative also makes the Cityeligible to receive State Library Grants, if any, available to allcounty-wide library systems.
City of Largo, fLoridaMAJOR REVENUE SOURCES
2017 Page 1 of 3
SCHEDULE U
2017 Comprehensive Annual Financial Report | 153
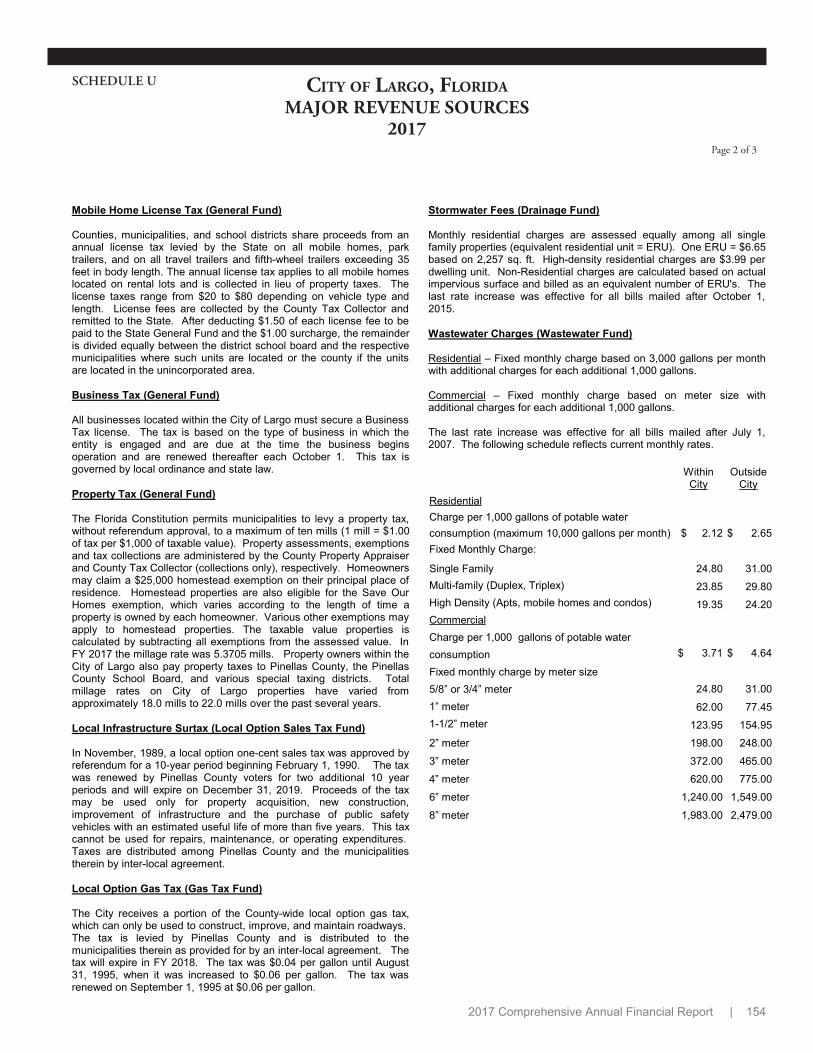
Mobile Home License Tax (General Fund)
Counties, municipalities, and school districts share proceeds from anannual license tax levied by the State on all mobile homes, parktrailers, and on all travel trailers and fifth-wheel trailers exceeding 35feet in body length. The annual license tax applies to all mobile homeslocated on rental lots and is collected in lieu of property taxes. Thelicense taxes range from $20 to $80 depending on vehicle type andlength. License fees are collected by the County Tax Collector andremitted to the State. After deducting $1.50 of each license fee to bepaid to the State General Fund and the $1.00 surcharge, the remainderis divided equally between the district school board and the respectivemunicipalities where such units are located or the county if the unitsare located in the unincorporated area.
Business Tax (General Fund)
All businesses located within the City of Largo must secure a BusinessTax license. The tax is based on the type of business in which theentity is engaged and are due at the time the business beginsoperation and are renewed thereafter each October 1. This tax isgoverned by local ordinance and state law.
Property Tax (General Fund)
The Florida Constitution permits municipalities to levy a property tax,without referendum approval, to a maximum of ten mills (1 mill = $1.00of tax per $1,000 of taxable value). Property assessments, exemptionsand tax collections are administered by the County Property Appraiserand County Tax Collector (collections only), respectively. Homeownersmay claim a $25,000 homestead exemption on their principal place ofresidence. Homestead properties are also eligible for the Save OurHomes exemption, which varies according to the length of time aproperty is owned by each homeowner. Various other exemptions mayapply to homestead properties. The taxable value properties iscalculated by subtracting all exemptions from the assessed value. InFY 2017 the millage rate was 5.3705 mills. Property owners within theCity of Largo also pay property taxes to Pinellas County, the PinellasCounty School Board, and various special taxing districts. Totalmillage rates on City of Largo properties have varied fromapproximately 18.0 mills to 22.0 mills over the past several years.
Local Infrastructure Surtax (Local Option Sales Tax Fund)
In November, 1989, a local option one-cent sales tax was approved byreferendum for a 10-year period beginning February 1, 1990. The taxwas renewed by Pinellas County voters for two additional 10 yearperiods and will expire on December 31, 2019. Proceeds of the taxmay be used only for property acquisition, new construction,improvement of infrastructure and the purchase of public safetyvehicles with an estimated useful life of more than five years. This taxcannot be used for repairs, maintenance, or operating expenditures. Taxes are distributed among Pinellas County and the municipalitiestherein by inter-local agreement.
Local Option Gas Tax (Gas Tax Fund)
The City receives a portion of the County-wide local option gas tax,which can only be used to construct, improve, and maintain roadways. The tax is levied by Pinellas County and is distributed to themunicipalities therein as provided for by an inter-local agreement. Thetax will expire in FY 2018. The tax was $0.04 per gallon until August31, 1995, when it was increased to $0.06 per gallon. The tax wasrenewed on September 1, 1995 at $0.06 per gallon.
Stormwater Fees (Drainage Fund)
Monthly residential charges are assessed equally among all singlefamily properties (equivalent residential unit = ERU). One ERU = $6.65based on 2,257 sq. ft. High-density residential charges are $3.99 perdwelling unit. Non-Residential charges are calculated based on actualimpervious surface and billed as an equivalent number of ERU's. Thelast rate increase was effective for all bills mailed after October 1,2015.
Wastewater Charges (Wastewater Fund)
Residential – Fixed monthly charge based on 3,000 gallons per monthwith additional charges for each additional 1,000 gallons.
Commercial – Fixed monthly charge based on meter size withadditional charges for each additional 1,000 gallons.
The last rate increase was effective for all bills mailed after July 1,2007. The following schedule reflects current monthly rates.
WithinCity
OutsideCity
ResidentialCharge per 1,000 gallons of potable waterconsumption (maximum 10,000 gallons per month) $ 2.12 $ 2.65 Fixed Monthly Charge:
Single Family 24.80 31.00
23.85 29.80
19.35 24.20
$ 3.71 $ 4.64
24.80 31.00
62.00 77.45
Multi-family (Duplex, Triplex)High Density (Apts, mobile homes and condos) CommercialCharge per 1,000 gallons of potable water consumptionFixed monthly charge by meter size5/8” or 3/4” meter1” meter1-1/2” meter 123.95 154.95
2” meter 198.00 248.00
3” meter 372.00 465.00
4” meter 620.00 775.00
6” meter 1,240.00 1,549.00
8” meter 1,983.00 2,479.00
City of Largo, fLoridaMAJOR REVENUE SOURCES
2017 Page 2 of 3
SCHEDULE U
2017 Comprehensive Annual Financial Report | 154

Reclaimed Water Charges
WithinCity
OutsideSewerDistrict
Residential
$ 10.00 $ 12.50 One acre or less (per month)
Commercial / Industrial / Golf Course
(minimum 25,000 gallons per month) 28.00 35.00
Usage Fee (per 1,000 gallons) 1.10 1.35
Golf Course Usage Fee (per 1,000 gallons) 0.85 1.05
Solid Waste Collection Charges (Solid Waste Fund)
The last rate increase was effective for all bills mailed after January 1,2007. The following schedule reflects current rates.
Curbside Collection (residential) - $17.65 monthly
Bulk Container (dumpsters) – The last rate change, which was adecrease, for commerical bulk containers was on October 1, 2011. Themonthly charge for bulk container service is based on the size ofcontainer services and the number of collections per week, as follows:
Size of Containers – Cubic Yards
CollectionsPer Week 2 4 6 8
1 $50.00 $96.00 $141.00 $184.00
2 106.00 204.00 299.00 390.00
3 159.00 305.00 448.00 585.00
4 212.00 407.00 598.00 780.00
5 265.00 509.00 747.00 975.00
6 318.00 611.00 897.00 1,170.00
There is a fee of $25.00 per month for the collection of recyclingfront-load dumpsters once per week. An additional fee of $25.00 permonth will be assessed for collection frequencies greater than once perweek. This was effective July 1, 2017.
Roll-off Containers and Roll-off Compactors - Charges include a fixedhauling fee based on container size, plus the actual cost of wastedisposal ($37.50 per ton for tipping fees).
Community Development Block Grant (CDBG Fund)
The federally funded CDBG program, created by the Housing andCommunity Development Act of 1974, provides funding to low andmoderate income individuals for the elimination of hazardous housingconditions. The funds are also available for infrastructureimprovements in designated target areas. The City's CommunityDevelopment Department implements the parameters established byHUD (Department of Housing and Urban Development) anddetermines who qualifies for the loans. The money is then loaned toselected homeowners for the purpose of housing rehabilitation.Deferred loans are due when there is a change in title and paybackloans have a maximum pay period of twenty years.
Loan repayments are available to be re-lent in accordance withprogram provisions, which provides a revolving pool of funds for futureyears.
State Housing Initiative Partnership Program (SHIP Fund)
The Sadowski Act approved by the Florida legislature created the SHIPprogram in order to provide revenues as an incentive to produce andpreserve affordable housing. The SHIP program distributes a portionof documentary stamp taxes on deeds to local governments for firsttime home buyers' mortgage down payment assistance andowner-occupied rehabilitation.
Loan repayments are available to be re-lent in accordance withprogram provisions, which provides a revolving pool of funds for futureyears.
HOME Investment Partnership Program (HOME Fund)
Federal funding is available through the Pinellas County Consortium forthe purpose of repairing current and eminent violations, connectingutilities, and handicap modifications. HUD provides guidelines underwhich funds are loaned to participants within a target area. Deferredand payback loans are available in this program.
Loan repayments are available to be re-lent in accordance withprogram provisions, which provides a revolving pool of funds for futureyears.
City of Largo, fLoridaMAJOR REVENUE SOURCES
2017 Page 3 of 3
SCHEDULE U
2017 Comprehensive Annual Financial Report | 155

City History
The City of Largo is located in Pinellas County on Florida's Suncoast,and is part of what is commonly referred to as the Tampa Bay Area.Largo was sited by Hernando De Soto in 1539 and was at one timepart of Hillsborough County. The warm subtropical climate and sanddunes helped shape Largo into a thriving, agricultural region. CountOdet Phillipe became the first European settler on the peninsula in1835, followed by Captain John Thomas Lowe, who established asettlement in 1872 in what is now Largo.
Originally named for its 500-acre Lake Largo, now drained, Largobecame a popular meeting place and trading post after the Orange Beltrailway established a midpoint station between Clearwater and St.Petersburg in 1888. During this period, Largo was one of the largestcitrus shipping points in Florida and home of the Black Diamondgrapefruit. Commercial shipping of citrus, turpentine and othercommodities began at the turn of the century. Shortly thereafter, in1905, Largo became a city of one square mile and 291 residents. In1912, Largo was separated from Hillsborough County, and made partof then newly-created Pinellas County.
Largo is bound to the east by Tampa Bay and to the west by the Gulfof Mexico. Its central location, friendly atmosphere, and locationbetween Tampa and the Gulf beaches make Largo an ideal residentialcommunity.
Demographics
Incorporated in 1905, the City of Largo has experienced remarkablegrowth in population over the past 30 years. In 1960, the populationwas 5,302. By 1970, it had increased dramatically to 22,300, partiallyresulting from a vigorous annexation program. The decades of the1970s and 1980s saw a steady and substantial increase in Largo'spopulation. By 1980, the City population was 57,688, the 14th largestcity in Florida. In 1990, the population reached 65,674; however, sinceother areas were growing at a faster rate, Largo dropped in ranking tothe 19th largest Florida city. According to the latest populationestimates, Largo's population of approximately 81,966 ranks as the28th largest in Florida.
The City of Largo has a marked concentration of elderly persons as iscommon in Pinellas County. Approximately 27 percent of the City'spermanent population is 65 years old and older, with a median age of50.1 years.
Based on the 2016 American Community Survey, the City's populationis 84.0 percent white, 3.8 percent black, 7.6 percent Hispanic or Latinoand 4.6 percent from other racial groups.
Largo is 19.18 square miles in size, with 61.5% of the land area inresidential uses, 22.2% in commercial uses, and 16.3% in other uses.
Economic Conditions
Largo has evolved from a farming, cattle, and citrus town, once one ofthe largest citrus shipping points in Florida and home of the BlackDiamond grapefruit, to a predominantly high-tech, service-oriented,residential community.
Many of Largo's older population are retired and receive income frompensions or other sources of retirement income. The manufacturing,retail trade, and services industries account for over two-thirds of theemployment of Largo's residents.
Educational Facilities
Largo is within commuting distance of the University of South Florida(Tampa and St. Petersburg campuses), the University of Tampa(Tampa), Eckerd College (St. Petersburg), Florida Institute ofTechnology (St. Petersburg), Florida Metropolitan University (Tampa),Schiller International University (Largo), and St. Petersburg College(previously St. Petersburg Junior College) with locations in Largo,Seminole, St. Petersburg, Pinellas Park, Tarpon Springs andClearwater. St. Petersburg College also hosts a Distance LearningCenter at the Seminole Campus where fully accredited Bachelordegrees are offered by several Universities including Florida State,Gulf Coast University and St. Leo College. The Pinellas County SchoolBoard provides opportunities for adult education through the PinellasCounty Vocational Technical Institute located in the Largo PlanningDistrict (Highpoint area).
City Government – Legislative/Executive
The City of Largo was the first city in the State of Florida to adopt the“council-manager” form of government in 1913 by referendum.
The City Commission is the legislative and governing body of the City.The non-partisan Commission consists of the Mayor and sixCommissioners who are elected at-large for staggered four-year terms. The Mayor is the presiding officer of the Commission with the samevoting powers as a Commissioner.
The City Commission assembles for regular public business meetingson the first and third Tuesday of every month and for public worksessions on the second Tuesday of the month. The Commission isempowered to establish City policy, to provide for the exercise of allduties and obligations imposed upon the City by the City Charter andlaw and to secure the general health, safety, and welfare of the Cityand its citizens.
The Commission discusses and adopts all ordinances and resolutionsnecessary to execute any of the City's powers. The Commissionappoints the City Manager and approves the City Manager'sappointments of City Attorney, Assistant City Managers, and CityClerk.
The Administration Department, headed by the City Manager, providesoverall administrative direction and control for the City. The CityManager appoints all department directors.
City of Largo, fLoridaGENERAL INFORMATION
2017
SCHEDULE V
2017 Comprehensive Annual Financial Report | 156

Form of Government Commission/Manager
Date Incorporated 1905
Area 19.18 sq. miles
Population (estimated) (1) 81,966 permanent
Governing Body City Commission (Mayor and 6 Commissioners elected in non-partisan, at-largeelection to 4-year overlapping terms).
Administration City Manager appointed by City Commission (5 votes required to hire and dismiss).
City Services Full service, including police, fire/EMS, wastewater collection and treatment,wastewater effluent disposal, solid waste collection, streets and drainage maintenanceand repair, library, parks, and recreation (no water system or solid waste disposalsystem).
Services Provided by Other Governments Transit – Pinellas Suncoast Transit Authority (Buses)Jail and Court System – Pinellas CountyWater – Pinellas CountySolid Waste Disposal – Pinellas CountyTraffic Planning, Signal Repair and Signal Maintenance– Pinellas CountyFire/EMS Dispatch – Pinellas CountyMosquito Control – Pinellas County
Services Provided to Areas Outside City Emergency Medical ServicesFire suppression and inspectionSanitary Sewer (wastewater)Effluent WaterLibraryRecreation, Parks and Arts
Population and Economic Characteristics (2) 85.0% 18 years of age or older; 27.0% 65 years of age or olderMedian Household Income $39,384Median Family Income $53,870
Location Central-West coast of Florida near the Gulf of Mexico; in Pinellas County, northwest ofSt. Petersburg and south of Clearwater, west of Tampa and in the Tampa Bay MetroArea.
Registered Voters 51,120
Percent Voted in Last City General Election 2016 – (November) 74.26% of registered voters
Data sources (1) University of Florida (2017)(2) United States Census Bureau (American Fact Finder) (2016)
City of Largo, fLoridaCOMMUNITY PROFILE
2017
SCHEDULE W
2017 Comprehensive Annual Financial Report | 157

Operating Budget Policies
The City will pay for all current expenditures with currentrevenues and fund balance. The City will avoid budgetaryprocedures that balance current expenditures at the expense offuture years, such as postponing expenditures, underestimatingexpenditures, overestimating revenues, or utilizing short-termborrowing to balance the budget.
The budget will provide for adequate maintenance and repair ofcapital assets and for their orderly replacement.
The budget will provide for adequate funding of all retirementplans based on annual actuarial studies.
The City will maintain a budgetary control system to ensureadherence to the budget.
The City Finance Department will prepare monthly reports ofrevenues and expenditures.
The City will update expenditure projections for each fiscalyear. Projections will include estimated operating costs of futurecapital improvements.
Where possible, the City will integrate performancemeasurement, service level, and productivity indicators withinthe budget.
Enterprise Funds (Wastewater, Solid Waste, Golf Course) areintended to be self-supporting through user fees. However, theGolf Course Fund has received General Fund support forseveral years by not paying the regular administrative chargepaid by all enterprise funds. Efforts are being made to returnthe Golf Course to profitability in the future.
The City aggressively seeks state and federal funds that areavailable for capital projects.
Capital Improvement Program Policies
The City will develop a five year program for capitalimprovements and update the program annually.
The City will enact an annual capital improvement budgetbased on the multi-year Capital Improvement Program.
The City will make all capital improvements in accordance withthe adopted Capital Improvement Program.
The City will coordinate development of the capitalimprovement budget with development of the operating budget.Future operating costs associated with capital improvementswill be projected and included in the operating budget.
The City will maintain all its capital assets at a level adequateto protect them and to minimize maintenance and replacementcosts.
The City will use intergovernmental assistance to finance onlythose capital improvements that are consistent with the CapitalImprovement Program and City priorities.
The City will identify the estimated costs and potential fundingsources for each capital improvement project proposal before itis submitted to the City Commission for approval.
The City will determine the least costly financing methodavailable for all new capital improvement projects.
Whenever possible, Local Option Sales Tax Funds will beutilized for projects that primarily benefit City residents.
Debt Policies
The City will confine long-term borrowing to capitalimprovement projects.
When the City finances capital projects by issuing debt, thedebt will be repaid within a period not to exceed the expecteduseful life of the projects.
Where possible, the City will use revenue bonds instead ofgeneral obligation bonds.
The City will follow a policy of full disclosure on every financialreport and bond prospectus.
Revenue Policies
The City will maintain, as permitted by State law, a diversifiedrevenue base to mitigate the effects of short-term fluctuationsin any one revenue source.
The City will estimate its annual revenues by a conservative,objective, and analytical process.
The City will project and update annually, revenues for the nextfive fiscal years.
Annually, the City will calculate the full cost of activitiessupported by user fees and consider such information whenestablishing user charges.
Non-recurring revenues will be used only to fund non-recurringexpenditures.
Reserve Policies
The City will maintain an adequate fund balance toaccommodate unanticipated expenditures, expenditures of anon-recurring nature, or unanticipated revenue declines. TheCity will strive to maintain an available General Fund fundbalance of no less than 10% of annual expenditures.
Investment Policies
Disbursement, collection and deposit of all funds will beappropriately scheduled to ensure the timely payment ofexpenditures and investment of funds.
Investment objectives shall be weighted in the order of safety ofprincipal, liquidity of funds and income generation, respectively.
City of Largo, fLoridaFINANCIAL MANAGEMENT POLICIES
2017 Page 1 of 2
SCHEDULE X
2017 Comprehensive Annual Financial Report | 158

The City will maintain an appropriate diversification of portfolioassets to control the risk of loss resulting fromover-concentration in a specific issuer, maturity, instrument ordealer.
The accounting system will provide regular informationconcerning cash positions and investment performance.
Accounting, Auditing & Financial Reporting Policies
The accounting system will maintain records on a basisconsistent with Generally Accepted Accounting Principlesapplicable to local government.
Monthly and annual financial reports will present a summary offinancial activity by major types of funds.
In accordance with state law, an independent accounting firmwill perform an annual audit of the financial statements of theCity and will publicly issue an opinion thereon.
Purchasing Policies
Purchases will be made in accordance with all federal, state,and municipal requirements. If there are no specificrequirements, purchases will be made in the best interest of theCity.
Purchases will be made in an impartial, economical,competitive and efficient manner.
Purchases will be made from the lowest priced and mostresponsible vendor. Qualitative factors such as vendor reputa-tion and financial condition will be considered, as well as price.
Preference will be given to purchases of like quality to vendorswho maintain a place of business within the City of Largo.
Capital Improvements Element (CIE) Policies
In accordance with state growth management legislation, theCity will update annually the Capital Improvements Element(CIE) of the Comprehensive Plan.
The CIE will contain multi-year projections of revenues andexpenditures.
The annual budget will implement the first year of the CIE.
City of Largo, fLoridaFINANCIAL MANAGEMENT POLICIES
2017 Page 2 of 2
SCHEDULE X
2017 Comprehensive Annual Financial Report | 159

INDEPENDENT AUDITORS’ REPORT ON INTERNAL CONTROL OVER FINANCIAL REPORTING AND ON COMPLIANCE AND OTHER MATTERS BASED ON AN AUDIT OF FINANCIAL STATEMENTS PERFORMED IN ACCORDANCE WITH GOVERNMENT AUDITING STANDARDS Honorable Mayor, Members of the City Commission, and City Manager City of Largo, Florida We have audited, in accordance with the auditing standards generally accepted in the United States of America and the standards applicable to financial audits contained in Government Auditing Standards issued by the Comptroller General of the United States, the financial statements of the governmental activities, the business‐type activities, each major fund, and the aggregate remaining fund information of City of Largo, Florida (the “City”), as of and for the year ended September 30, 2017, and the related notes to the financial statements, which collectively comprise City’s basic financial statements, and have issued our report thereon dated March 30, 2018. We have also audited the financial statements of the Largo Community Redevelopment Agency, as of and for the year ended September 30, 2017, and have issued our report thereon dated March 30, 2018. Internal Control over Financial Reporting In planning and performing our audit of the financial statements, we considered the City’s internal control over financial reporting (internal control) to determine the audit procedures that are appropriate in the circumstances for the purpose of expressing our opinions on the financial statements, but not for the purpose of expressing an opinion on the effectiveness of the City’s internal control. Accordingly, we do not express an opinion on the effectiveness of the City’s internal control. A deficiency in internal control exists when the design or operation of a control does not allow management or employees, in the normal course of performing their assigned functions, to prevent, or detect and correct, misstatements on a timely basis. A material weakness is a deficiency, or a combination of deficiencies, in internal control, such that there is a reasonable possibility that a material misstatement of the entity’s financial statements will not be prevented, or detected and corrected on a timely basis. A significant deficiency is a deficiency, or a combination of deficiencies, in internal control that is less severe than a material weakness, yet important enough to merit attention by those charged with governance. Our consideration of internal control was for the limited purpose described in the first paragraph of this section and was not designed to identify all deficiencies in internal control that might be material weaknesses or, significant deficiencies. Given these limitations, during our audit we did not identify any deficiencies in internal control that we consider to be material weaknesses. However, material weaknesses may exist that have not been identified.
2017 Comprehensive Annual Financial Report | 160

Compliance and Other Matters As part of obtaining reasonable assurance about whether the City’s financial statements are free from material misstatement, we performed tests of its compliance with certain provisions of laws, regulations, contracts, and grant agreements, noncompliance with which could have a direct and material effect on the determination of financial statement amounts. However, providing an opinion on compliance with those provisions was not an objective of our audit, and accordingly, we do not express such an opinion. The results of our tests disclosed no instances of noncompliance or other matters that are required to be reported under Government Auditing Standards. Purpose of this Report The purpose of this report is solely to describe the scope of our testing of internal control and compliance and the results of that testing, and not to provide an opinion on the effectiveness of the entity’s internal control or on compliance. This report is an integral part of an audit performed in accordance with Government Auditing Standards in considering the entity’s internal control and compliance. Accordingly, this communication is not suitable for any other purpose.
CARR, RIGGS & INGRAM, LLC Clearwater, Florida March 30, 2018
2017 Comprehensive Annual Financial Report | 161
INDEPENDENT AUDITORS’ REPORT ON COMPLIANCE FOR EACH MAJOR PROGRAM AND PROJECT AND ON INTERNAL CONTROL OVER COMPLIANCE REQUIRED BY THE UNIFORM GUIDANCE AND Chapter 10.550, RULES OF THE AUDITOR GENERAL Honorable Mayor, Members of the City Commission, and City Manager City of Largo, Florida Report on Compliance for Each Major Federal Program and State Project We have audited City of Largo, Florida’s (the “City”) compliance with the types of compliance requirements described in the OMB Compliance Supplement and Chapter 10.550, Rules of the Auditor General, that could have a direct and material effect on each of the City’s major federal programs and state projects for the year ended September 30, 2017. The City’s major federal programs and state projects are identified in the summary of auditor’s results section of the accompanying schedule of findings and questioned costs. Management’s Responsibility Management is responsible for compliance with the requirements of laws, regulations, contracts, and grants applicable to its federal programs and state projects. Auditors’ Responsibility Our responsibility is to express an opinion on compliance for each of the City’s major federal programs and state projects based on our audit of the types of compliance requirements referred to above. We conducted our audit of compliance in accordance with auditing standards generally accepted in the United States of America; the standards applicable to financial audits contained in Government Auditing Standards, issued by the Comptroller General of the United States; Title 2 U.S. Code of Federal Regulations Part 200, Uniform Administrative Requirements, Cost Principles, and Audit Requirements for Federal Awards (Uniform Guidance); and Chapter 10.550, Rules of the Auditor General. Those standards and the Uniform Guidance and Chapter 10.550, Rules of the Auditor General require that we plan and perform the audit to obtain reasonable assurance about whether noncompliance with the types of compliance requirements referred to above that could have a direct and material effect on a major federal program or state project occurred. An audit includes examining, on a test basis, evidence about the City’s compliance with those requirements and performing such other procedures as we considered necessary in the circumstances.
We believe that our audit provides a reasonable basis for our opinion on compliance for each major federal program and state project. However, our audit does not provide a legal determination of the City’s compliance.
2017 Comprehensive Annual Financial Report | 162

Opinion on Each Major Federal Program and State Project In our opinion, the City, complied, in all material respects, with the types of compliance requirements referred to above that could have a direct and material effect on each of its major federal programs and state projects for the year ended September 30, 2017. Report on Internal Control over Compliance Management of the City is responsible for establishing and maintaining effective internal control over compliance with the types of compliance requirements referred to above. In planning and performing our audit of compliance, we considered the City’s internal control over compliance with the types of requirements that could have a direct and material effect on each major federal program and state project to determine the auditing procedures that are appropriate in the circumstances for the purpose of expressing an opinion on compliance for each major federal program and state project and to test and report on internal control over compliance in accordance with the Uniform Guidance and Chapter 10.550, Rules of the Auditor General, but not for the purpose of expressing an opinion on the effectiveness of internal control over compliance. Accordingly, we do not express an opinion on the effectiveness of the City’s internal control over compliance. A deficiency in internal control over compliance exists when the design or operation of a control over compliance does not allow management or employees, in the normal course of performing their assigned functions, to prevent, or detect and correct, noncompliance with a type of compliance requirement of a federal program on a timely basis. A material weakness in internal control over compliance is a deficiency, or combination of deficiencies, in internal control over compliance, such that there is a reasonable possibility that material noncompliance with a type of compliance requirement of a federal program will not be prevented, or detected and corrected, on a timely basis. A significant deficiency in internal control over compliance is a deficiency, or a combination of deficiencies, in internal control over compliance with a type of compliance requirement of a federal program that is less severe than a material weakness in internal control over compliance, yet important enough to merit attention by those charged with governance. Our consideration of internal control over compliance was for the limited purpose described in the first paragraph of this section and was not designed to identify all deficiencies in internal control over compliance that might be material weaknesses or significant deficiencies. We did not identify any deficiencies in internal control over compliance that we consider to be material weaknesses. However, material weaknesses may exist that have not been identified.
2017 Comprehensive Annual Financial Report | 163

The purpose of this report on internal control over compliance is solely to describe the scope of our testing of internal control over compliance and the results of that testing based on the requirements of the Uniform Guidance and Chapter 10.550, Rules of the Auditor General. Accordingly, this report is not suitable for any other purpose.
CARR, RIGGS & INGRAM, LLC Clearwater, Florida March 30, 2018
2017 Comprehensive Annual Financial Report | 164

Federal or State Grantor/Pass-Through Grantor/Program
CFDA #/CSFA #
Pass-Through EntityIndentifying Grant
/Loan Number Expenditures
AmountProvided to
Subrecipients
U.S. Department of Agriculture Forest Service Passed Through Florida Department of Agriculture and Consumer Services Cooperative Forestry Assistance 10.664 #023869 $ 8,000 $
U.S. Department of Health and Human Services Center for DiseaseControl and Prevention
Passed Through Pinellas County Health Department Partnerships to Improve Community Health 93.331 NU-58-DP005597 25,612
U.S. Department of Homeland SecurityFederal Emergency Management Agency (FEMA)
Passed Through Florida Department of Financial Services Disaster Grants-Public Assistance (Presidentially Declared Disasters) 97.036 DR4283 10,361
Passed Through Florida Division of Emergency ManagementDisaster Grants-Public Assistance (Presidentially Declared Disasters) 97.036 DR4280 196,834
U.S. Department of Housing & Urban Development Direct Program: Community Development Block Grant Entitlement (CDBG) 14.218 B-16-MC-120028 794,779 135,604
Passed Through Pinellas County Home Investment Partnership Program (HOME) 14.239 M-16-DC-12-0217 443,303
TOTAL EXPENDITURES OF FEDERAL AWARDS $ 1,478,889 $ 135,604
Florida Housing Finance Corporationt Direct Program: State Housing Initiative Partnership (SHIP) 40.901 N/A $ 668,677 $
Florida Department of Environmental Protection Direct Program: Wastewater Treatment Facility Construction 37.077 CW520210 22,904,200
TOTAL EXPENDITURES OF STATE FINANCIAL ASSISTANCE $ 23,572,877 $ -
See accompanying notes to schedule of expenditures of federal awards and state assistance
2017 Comprehensive Annual Financial Report | 165
City of Largo, fLorida
Schedule of Expenditures of Federal Awards and State Financial Assistance
Year Ended September 30, 2017
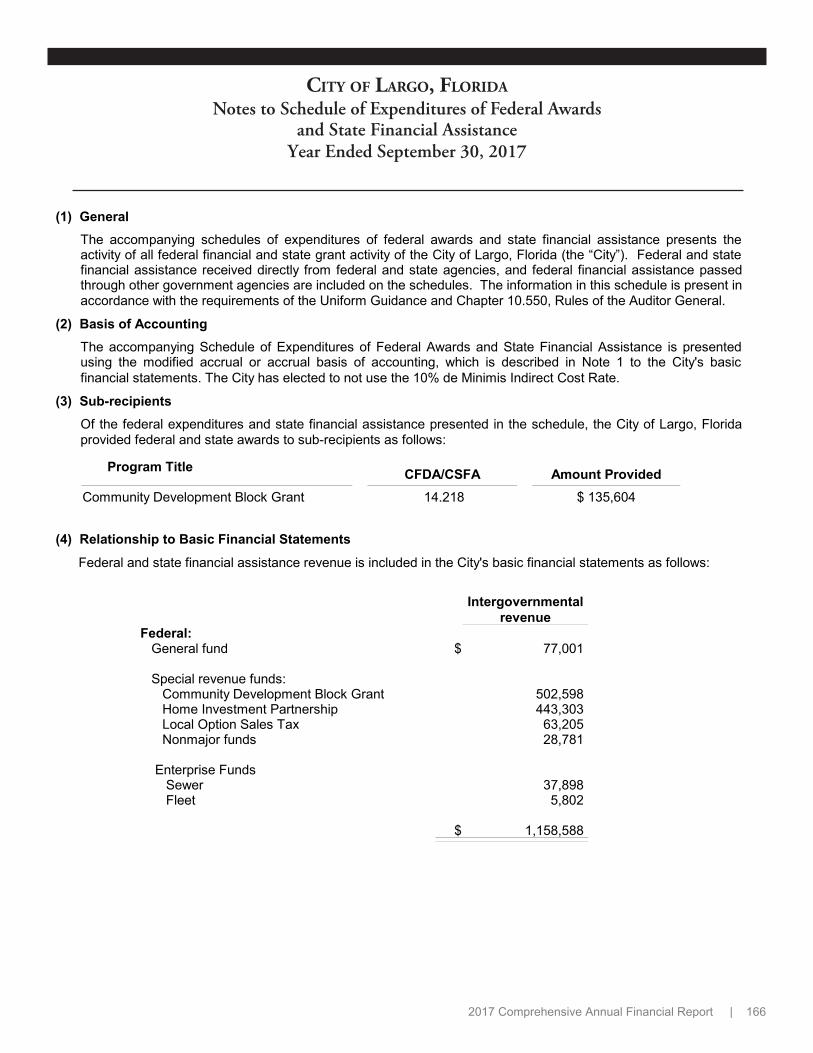
(1) GeneralThe accompanying schedules of expenditures of federal awards and state financial assistance presents theactivity of all federal financial and state grant activity of the City of Largo, Florida (the “City”). Federal and statefinancial assistance received directly from federal and state agencies, and federal financial assistance passedthrough other government agencies are included on the schedules. The information in this schedule is present inaccordance with the requirements of the Uniform Guidance and Chapter 10.550, Rules of the Auditor General.
(2) Basis of AccountingThe accompanying Schedule of Expenditures of Federal Awards and State Financial Assistance is presentedusing the modified accrual or accrual basis of accounting, which is described in Note 1 to the City's basicfinancial statements. The City has elected to not use the 10% de Minimis Indirect Cost Rate.
(3) Sub-recipientsOf the federal expenditures and state financial assistance presented in the schedule, the City of Largo, Floridaprovided federal and state awards to sub-recipients as follows:
Program Title CFDA/CSFA Amount ProvidedCommunity Development Block Grant 14.218 $ 135,604
(4) Relationship to Basic Financial Statements
Federal and state financial assistance revenue is included in the City's basic financial statements as follows:
Intergovernmentalrevenue
Federal: General fund $ 77,001
Special revenue funds: Community Development Block Grant 502,598 Home Investment Partnership 443,303 Local Option Sales Tax 63,205 Nonmajor funds 28,781
Enterprise Funds Sewer 37,898 Fleet 5,802
$ 1,158,588
2017 Comprehensive Annual Financial Report | 166
City of Largo, fLorida
Notes to Schedule of Expenditures of Federal Awards and State Financial Assistance
Year Ended September 30, 2017
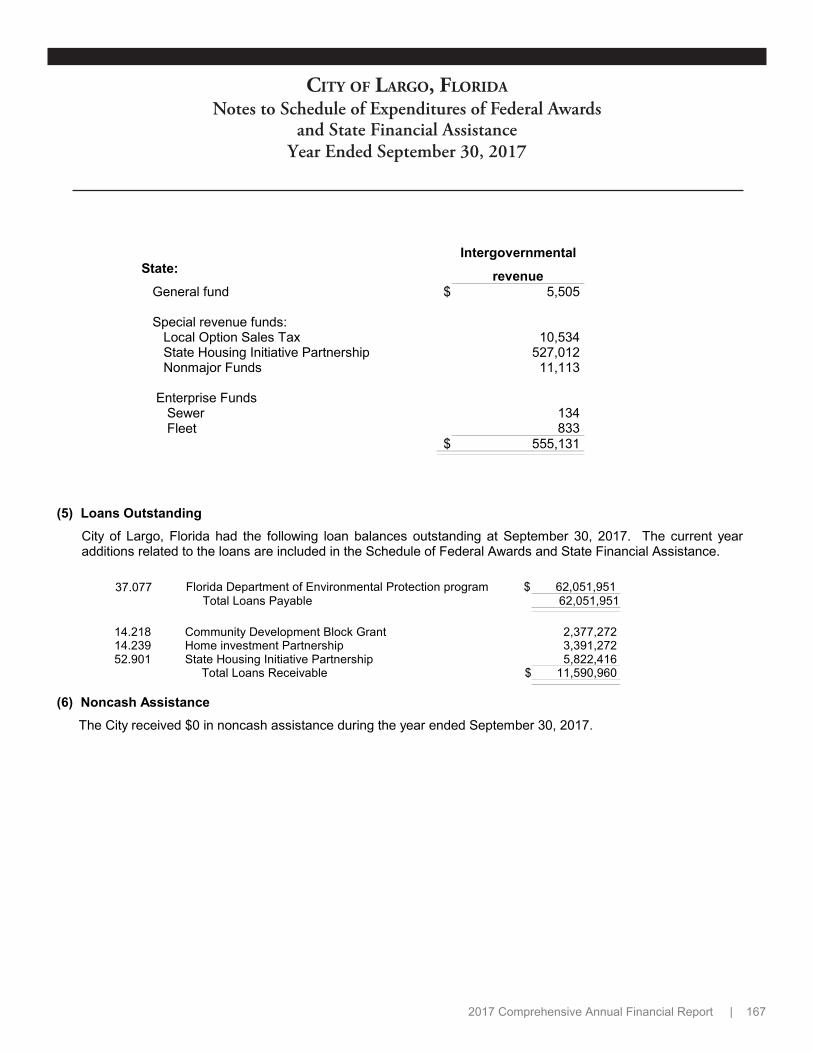
State:Intergovernmental
revenue General fund $ 5,505
Special revenue funds: Local Option Sales Tax 10,534 State Housing Initiative Partnership 527,012 Nonmajor Funds 11,113
Enterprise Funds Sewer 134 Fleet 833
$ 555,131
(5) Loans OutstandingCity of Largo, Florida had the following loan balances outstanding at September 30, 2017. The current yearadditions related to the loans are included in the Schedule of Federal Awards and State Financial Assistance.
37.077 Florida Department of Environmental Protection program $ 62,051,951 Total Loans Payable 62,051,951
14.218 Community Development Block Grant 2,377,272 14.239 Home investment Partnership 3,391,272 52.901 State Housing Initiative Partnership 5,822,416
Total Loans Receivable $ 11,590,960
(6) Noncash Assistance The City received $0 in noncash assistance during the year ended September 30, 2017.
2017 Comprehensive Annual Financial Report | 167
City of Largo, fLorida
Notes to Schedule of Expenditures of Federal Awards and State Financial Assistance
Year Ended September 30, 2017

SECTION I – SUMMARY OF AUDITORS’ RESULTS:
Financial Statements Results
Type of auditors’ report issued: Unmodifed
Internal control over fnancial reporting:
Material weakness(es) identifedd No
Signifiant defiieniies identifed not ionsidered to be a material weakness(es) No
Noniomplianie material to fnaniial statements notedd No
Awards and Financial Assistance Federal State
Internal control over major programs and projects:
Material weakness(es) identifedd No No
Signifiant defiieniies identifed not ionsidered to be a material weakness(es)
Nonereported
Nonereported
2017 Comprehensive Annual Financial Report | 168
City of Largo, fLoridaSchedule of Findings and Questioned Costs
Federal ProgramsYear Ended September 30, 2017

Type of auditors’ report issued on iomplianie for major programsd Unmodifed Unmodifed
Any audit fndings disilosed that are required to be reported in aiiordanie with –
Uniform Guidanie No -
Florida Single Audit Ait - No
2017 Comprehensive Annual Financial Report | 169
City of Largo, fLoridaSchedule of Findings and Questioned Costs
Federal ProgramsYear Ended September 30, 2017

Federal Name of Program or Cluster
CFDA 14.218 Community Development BlockGrant/Entitlement Grants
State Name of Program or Cluster
CSFA 37.077 Wastewater Treatment Facility Construction
Federal State
Dollar threshold used to distinguish between Type A and Type B programs: $750,000 $300,000
Auditee qualifed as low-risk auditeed Yes N/A
SECTION II – FINDINGS RELATED TO THE FINANCIAL STATEMENTS:
None
SECTION III – FINDINGS AND QUESTIONED COSTS – MAJOR FEDERAL PROGRAMS AND STATE PROJECTS:
None
2017 Comprehensive Annual Financial Report | 170
City of Largo, fLoridaSchedule of Findings and Questioned Costs
Federal ProgramsYear Ended September 30, 2017
Identifcation of Major Programs

SECTION IV – PRIOR YEAR FINDINGS RELATED TO THE FINANCIAL STATEMENTS:
None
SECTION V – PRIOR YEAR FINDINGS AND QUESTIONED COSTS – MAJOR FEDERAL PROGRAMS AND STATE PROJECTS:
None
2017 Comprehensive Annual Financial Report | 171
City of Largo, fLoridaSchedule of Findings and Questioned Costs
Federal ProgramsYear Ended September 30, 2017

INDEPENDENT AUDITORS’ REPORT ON DEBT COMPLIANCE – 1996 STATE REVOLVING FUND LOAN
Honorable Mayor, Members of the City Commission, and City Manager City of Largo, Florida
We have audited, in accordance with auditing standards generally accepted in the United States of America, the basic financial statements and the financial statements of the Largo Community Redevelopment Agency as of the City of Largo, Florida (the “City”), as of and for the year ended September 30, 2017, and have issued our report thereon dated March 30, 2018.
In connection with our audit, nothing came to our attention that caused us to believe that the City failed to comply with the terms, covenants, provisions, or conditions of Articles II, III, IV, V and VI of State Revolving Fund Loan Agreement dated March 8, 1996, with the State of Florida, Department of Environmental Protection, insofar as they related to accounting matters. However, our audit was not directly primarily toward obtaining knowledge of such noncompliance.
This report is intended solely for the information and use of City management, the City Commission, and the State of Florida, Department of Environmental Protection, and is not intended to be, and should not be used by anyone other than these specified parties.
CARR, RIGGS & INGRAM, LLC
Clearwater, Florida March 30, 2018
2017 Comprehensive Annual Financial Report | 172

MANAGEMENT LETTER
The Honorable Mayor, Members of the City Commission and City Mayor City of Largo, Florida
Report on the Financial Statements
We have audited the financial statements of the City of Largo, Florida ( the “C i t y” ) , as of and for the fiscal year ended September 30, 2017, and have issued our report thereon dated March 31, 2018. We have also audited the financial statements of the Largo Community Redevelopment Agency, as of and for the fiscal year ended September 30, 2017, and have issued our report thereon dated March 30, 2018.
Auditors’ Responsibility
We conducted our audit in accordance with auditing standards generally accepted in the United States of America; the standards applicable to financial audits contained in Government Auditing Standards, issued by the Comptroller General of the United States; the audit requirements of Title 2 U.S. Code of Federal Regulations Part 200, Uniform Administrative Requirements, Cost Principles, and Audit Requirements for Federal Awards (Uniform Guidance) and Chapter 10.550, Rules of the Auditor General.
Other Reporting Requirements
We have issued our Independent Auditors’ Report on Internal Control over Financial Reporting and Compliance and Other Matters Based on an Audit of the Financial Statements Performed in Accordance with Government Auditing Standards, Independent Auditors’ Report on Compliance for Each Major Program and Project and on Internal Control over Compliance Required by the Uniform Guidance and Chapter 10.550, Rules of the Auditor General; Independent Auditors’ Report on Debt Compliance – 1996 State Revolving Loan; Schedule of Findings and Questioned Costs; and Independent Accountants’ Report on an examination conducted in accordance with AICPA Professional Standards, AT‐C Section 315, regarding compliance requirements in accordance with Chapter 10.550, Rules of Auditor General. Disclosures in those reports and schedule, which are dated March 30, 2018, should be
considered in conjunction with this management letter.
Prior Audit Findings
Section 10.554(1)(i)1., Rules of the Auditor General, requires that we determine whether or not corrective actions have been taken to address findings and recommendations made in the preceding annual financial audit report. No audit findings or recommendations were noted in the preceding annual financial audit report.
Financial Condition and Management
Section 10.554(1)(i)5.a and 10.556(7), Rules of the Auditor General, require us to apply appropriate procedures and communicate the results of our determination as to whether or not the City has met one of more of the conditions described in Section 218.503(1), Florida Statutes, and to identify the specific conditions met. In connection with our audit, we determined that the City did not meet any of the conditions described in Section 218.503(1), Florida Statutes.
2017 Comprehensive Annual Financial Report | 173

Pursuant to Sections 10.554(1)(i)5.c. and 10.556(8), Rules of the Auditor General, we applied financial condition assessment procedures. It is management’s responsibility to monitor the City’s financial condition, and our financial condition assessment was based in part on representations made by management and the review of financial information provided by same.
Section 10.554(1)(i)2., Rules of the Auditor General, requires that we communicate any recommendations to improve financial management. In connection with our audit, we did not have any such recommendations.
Annual Financial Report
Section 10.554(1)(i)5.b. and 10.556(7), Rules of the Auditor General, requires that we report the results of our determination as to whether the annual financial report for the City for the fiscal year ended September 30, 2017, filed with the Florida Department of Financial Services pursuant to Section 218.32(1)(a), Florida Statutes, is in agreement with the comprehensive annual financial audit report for the fiscal year ended September 30, 2017. In connection with our audit, we determined that these two reports were in agreement.
Special District Component Units
Section 10.554(1)(i)5.d., Rules of the Auditor General, requires, if appropriate, that we communicate the failure of a special district that is a component unit of a county, municipality, or special district, provided the financial information necessary for proper reporting of the component unit within the audited financial statements of the county, municipality, or special district in accordance with Section 218.39(3)(b), Florida Statutes. In connection with our audit, we did not note any special district component units that failed to provide the necessary information for proper reporting in accordance with Section 218.39(3)(b), Florida Statutes.
Additional Matters
Section 10.554(1)(i)3., Rules of the Auditor General, requires us to communicate noncompliance with provisions of contracts or grant agreements, or abuse, that have occurred, or are likely to have occurred, that have an effect on the financial statements that is less than material but warrants the attention of those charged with governance. In connection with our audit, we did not note any such findings.
Purpose of this Letter
Our management letter is intended solely for the information and use of the Legislative Auditing Committee, members of the Florida Senate and the Florida House of Representatives, the Florida Auditor General, Federal and other granting agencies, and applicable management, and is not intended to be and should not be used by anyone other than these specified parties.
CARR, RIGGS & INGRAM, LLC Clearwater, FL March 30, 2018
2017 Comprehensive Annual Financial Report | 174

INDEPENDENT ACCOUNTANTS’ REPORT IN ACCORDANCE WITH SECTION 218.415, FLORIDA STATUTES, LOCAL GOVERNMENT INVESTMENT POLICIES
Honorable Mayor, Members of the City Commission, And City Manager City of Largo, Florida
We have examined City of Largo, Florida’s, (the “City”), compliance with the requirements of Section 218.415, Florida Statutes, Local Government Investment Policies, during the year ended September 30, 2017. Management is responsible for the City’s compliance with those requirements. Our responsibility is to express an opinion on the City’s compliance based on our examination.
Our examination was conducted in accordance with attestation standards established by the American Institute of Certified Public Accountants and, accordingly, included examining, on a test basis, evidence about the City’s compliance with those requirements and performing such other procedures as we considered necessary in the circumstances. We believe that our examination provides a reasonable basis for our opinion. Our examination does not provide a legal determination on the City’s compliance with specified requirements.
In our opinion, the City complied, in all material respects, with the aforementioned requirements for the year ended September 30, 2017.
This report is intended solely for the information and use of management and the State of Florida Auditor General and is not intended to be and should not be used by anyone other than these specified parties.
CARR, RIGGS & INGRAM, LLC
Clearwater, Florida March 30, 2018
2017 Comprehensive Annual Financial Report | 175

2017 Comprehensive Annual Financial Report | 176