LARGEST HISTORICAL TSUNAMIS IN THE WORLD OCEAN AND … · LARGEST HISTORICAL TSUNAMIS IN THE WORLD...
37
LARGEST HISTORICAL TSUNAMIS IN THE WORLD OCEAN AND THEIR IMPLICATION FOR COASTAL HAZARD ASSESSMENT V.K.Gusiakov Tsunami Laboratory Institute of Computational Mathematics and Mathematical Geophysics Institute of Computational Technologies Siberian Division, Russian Academy of Sciences, Novosibirsk, Russia Email: [email protected] Web-site: http://tsun.sscc.ru/tsulab
Transcript of LARGEST HISTORICAL TSUNAMIS IN THE WORLD OCEAN AND … · LARGEST HISTORICAL TSUNAMIS IN THE WORLD...
LARGEST HISTORICAL TSUNAMIS IN
THE WORLD OCEAN AND THEIR
IMPLICATION FOR COASTAL HAZARD
ASSESSMENT
V.K.Gusiakov Tsunami Laboratory
Institute of Computational Mathematics and
Mathematical Geophysics
Institute of Computational Technologies
Siberian Division, Russian Academy of Sciences,
Novosibirsk, Russia
Email: [email protected]
Web-site: http://tsun.sscc.ru/tsulab
Acknowledgement
This presentation is based on the results obtained in the Tsunami
Laboratory (TL) of the Institute of Computational Mathematics and
Mathematical Geophysics (ICMMG) of Siberian Division, Russian
Academy of Sciences (Novosibirsk) as well as in other research group
dealing with tsunami modeling in the Institute of Computational
Technologies (ICT) of Siberian Division, Russian Academy of Sciences
(Novosibirsk).
I would like to acknowledge the input of the following persons in the
results included in my today presentation:
Prof.L.Chubarov (ICT SD RAS, Novosibirsk)
Dr.S.Beisel (ICT SD RAS, Novosibirsk)
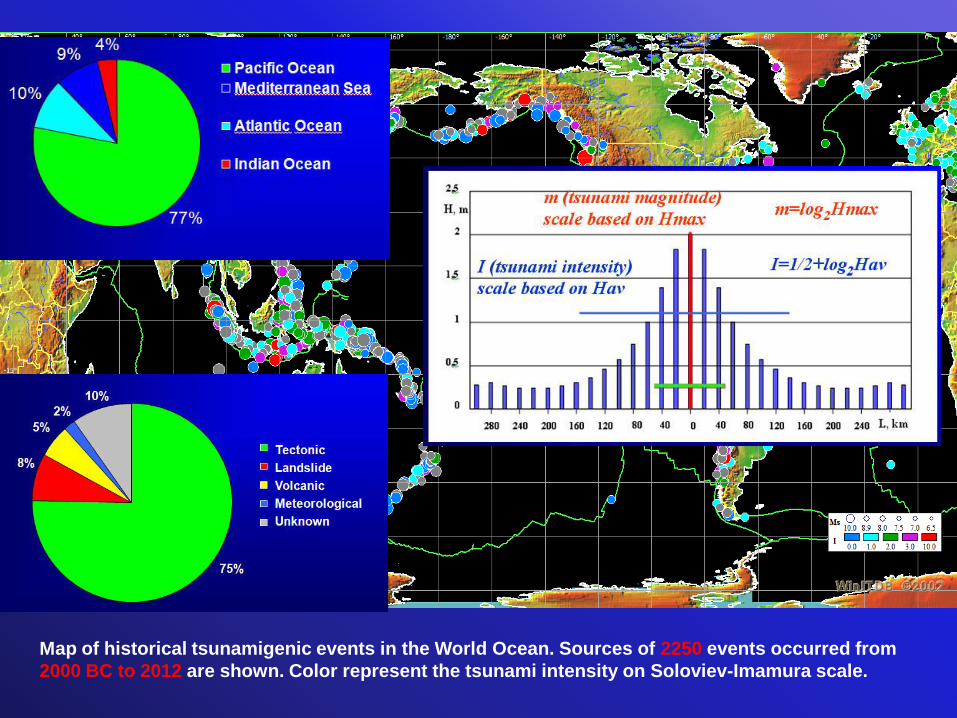
Map of historical tsunamigenic events in the World Ocean. Sources of 2250 events occurred from
2000 BC to 2012 are shown. Color represent the tsunami intensity on Soloviev-Imamura scale.
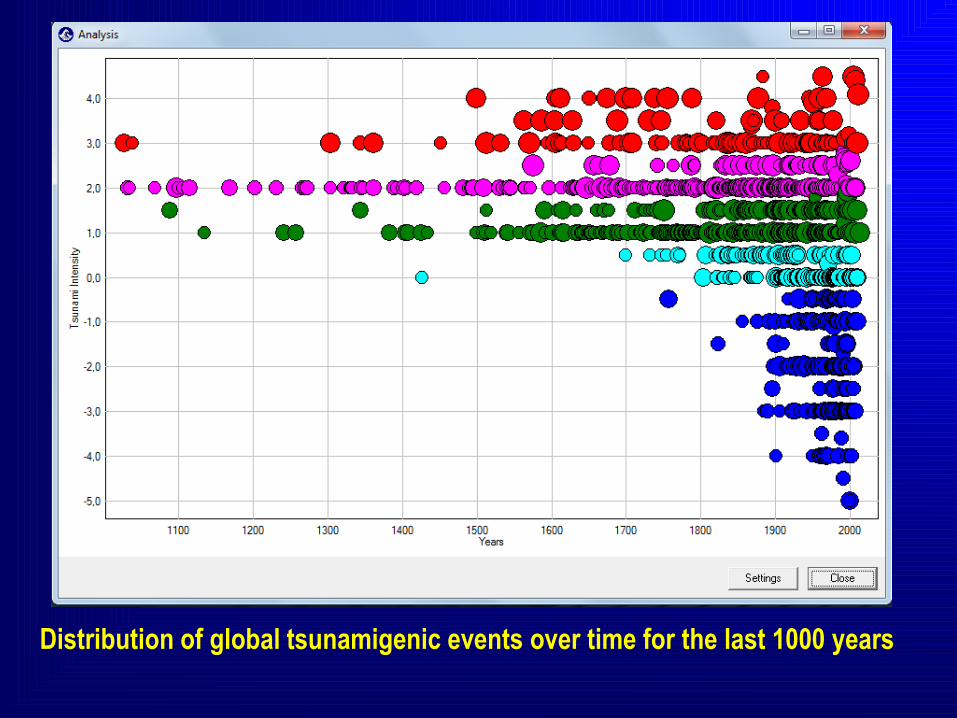
Distribution of global tsunamigenic events over time for the last 1000 years
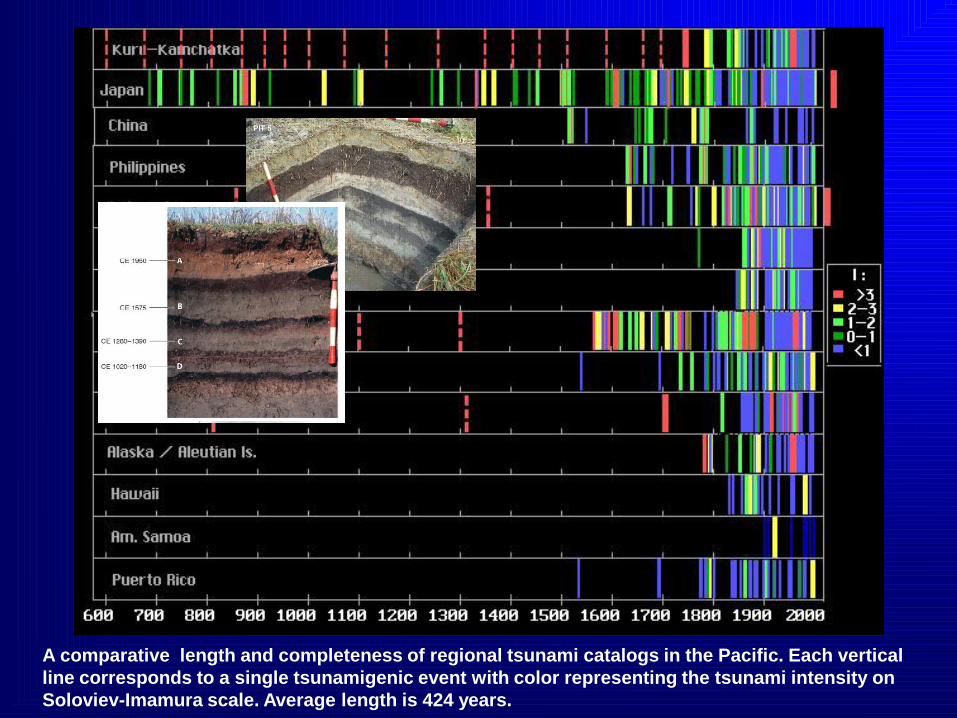
A comparative length and completeness of regional tsunami catalogs in the Pacific. Each vertical
line corresponds to a single tsunamigenic event with color representing the tsunami intensity on
Soloviev-Imamura scale. Average length is 424 years.
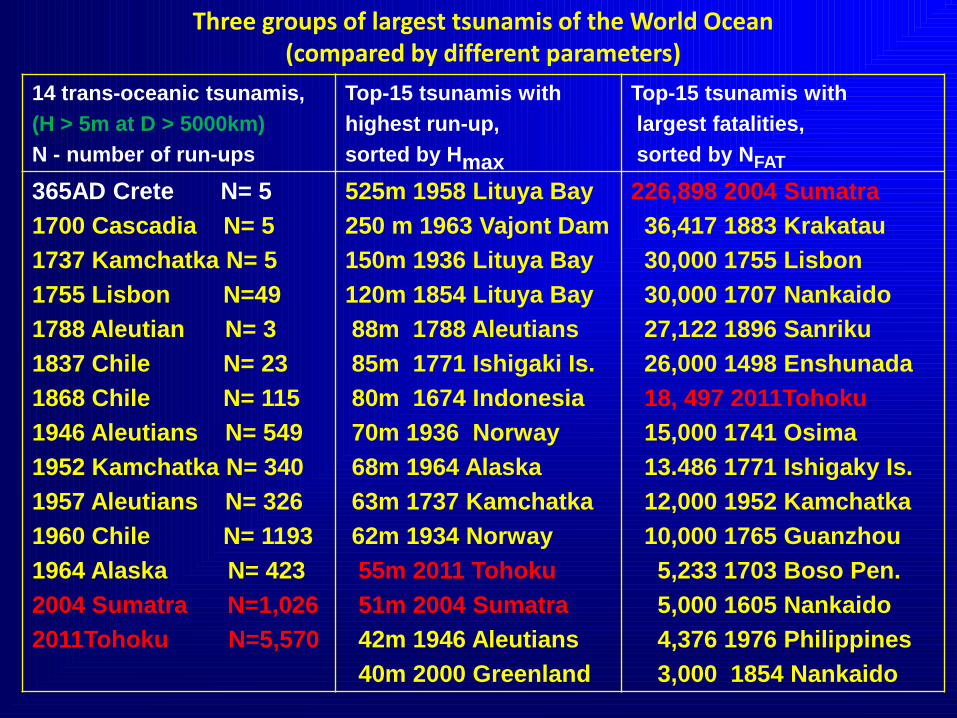
14 trans-oceanic tsunamis,
(H > 5m at D > 5000km)
N - number of run-ups
Top-15 tsunamis with
highest run-up,
sorted by Hmax
Top-15 tsunamis with
largest fatalities,
sorted by NFAT
365AD Crete N= 5
1700 Cascadia N= 5
1737 Kamchatka N= 5
1755 Lisbon N=49
1788 Aleutian N= 3
1837 Chile N= 23
1868 Chile N= 115
1946 Aleutians N= 549
1952 Kamchatka N= 340
1957 Aleutians N= 326
1960 Chile N= 1193
1964 Alaska N= 423
2004 Sumatra N=1,026
2011Tohoku N=5,570
525m 1958 Lituya Bay
250 m 1963 Vajont Dam
150m 1936 Lituya Bay
120m 1854 Lituya Bay
88m 1788 Aleutians
85m 1771 Ishigaki Is.
80m 1674 Indonesia
70m 1936 Norway
68m 1964 Alaska
63m 1737 Kamchatka
62m 1934 Norway
55m 2011 Tohoku
51m 2004 Sumatra
42m 1946 Aleutians
40m 2000 Greenland
226,898 2004 Sumatra
36,417 1883 Krakatau
30,000 1755 Lisbon
30,000 1707 Nankaido
27,122 1896 Sanriku
26,000 1498 Enshunada
18, 497 2011Tohoku
15,000 1741 Osima
13.486 1771 Ishigaky Is.
12,000 1952 Kamchatka
10,000 1765 Guanzhou
5,233 1703 Boso Pen.
5,000 1605 Nankaido
4,376 1976 Philippines
3,000 1854 Nankaido
Three groups of largest tsunamis of the World Ocean (compared by different parameters)
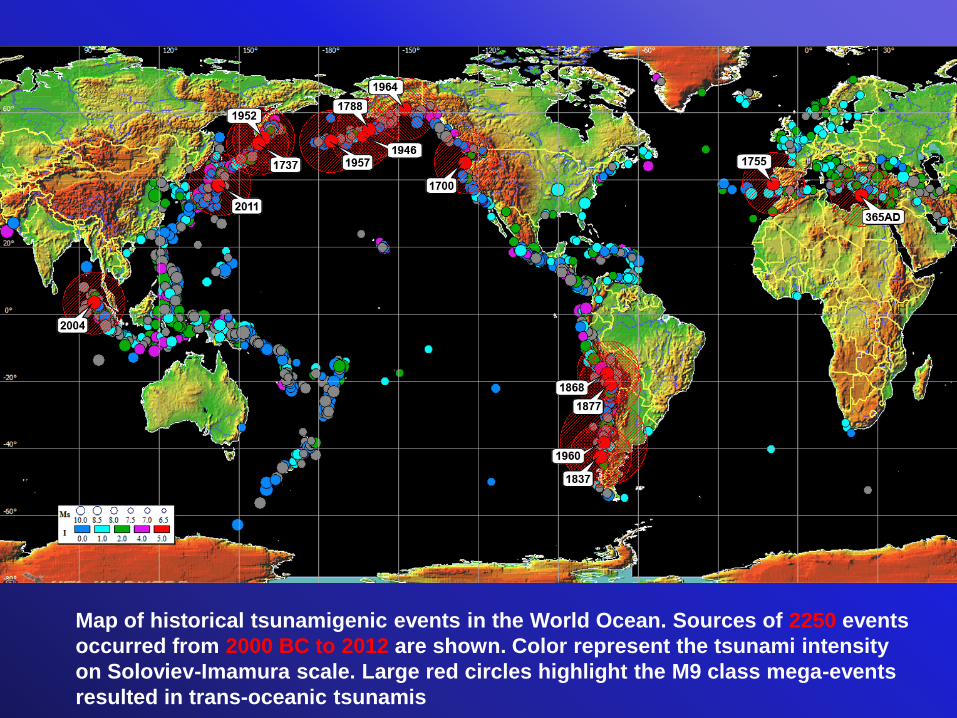
Map of historical tsunamigenic events in the World Ocean. Sources of 2250 events
occurred from 2000 BC to 2012 are shown. Color represent the tsunami intensity
on Soloviev-Imamura scale. Large red circles highlight the M9 class mega-events
resulted in trans-oceanic tsunamis .
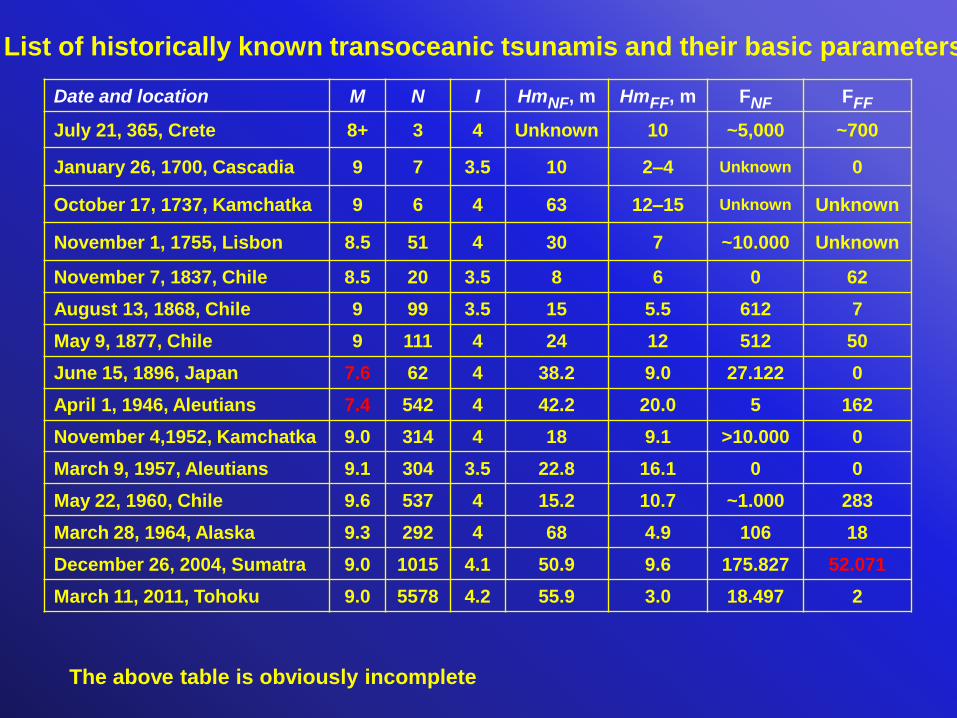
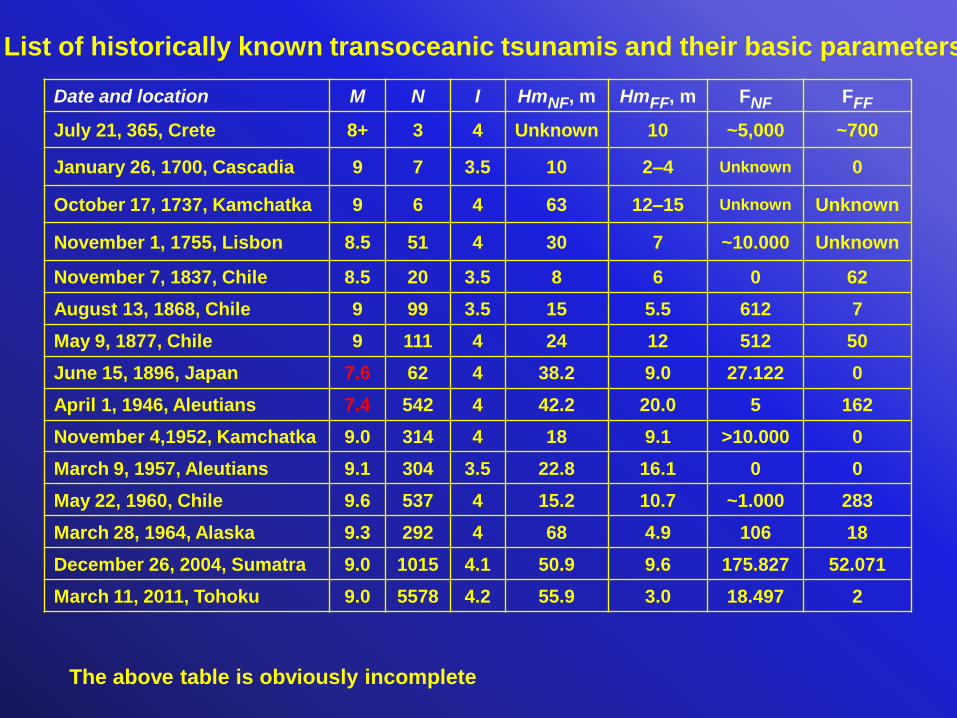
Date and location M N I HmNF, m HmFF, m FNF FFF
July 21, 365, Crete 8+ 3 4 Unknown 10 ~5,000 ~700
January 26, 1700, Cascadia 9 7 3.5 10 2–4 Unknown 0
October 17, 1737, Kamchatka 9 6 4 63 12–15 Unknown Unknown
November 1, 1755, Lisbon 8.5 51 4 30 7 ~10.000 Unknown
November 7, 1837, Chile 8.5 20 3.5 8 6 0 62
August 13, 1868, Chile 9 99 3.5 15 5.5 612 7
May 9, 1877, Chile 9 111 4 24 12 512 50
June 15, 1896, Japan 7.6 62 4 38.2 9.0 27.122 0
April 1, 1946, Aleutians 7.4 542 4 42.2 20.0 5 162
November 4,1952, Kamchatka 9.0 314 4 18 9.1 >10.000 0
March 9, 1957, Aleutians 9.1 304 3.5 22.8 16.1 0 0
May 22, 1960, Chile 9.6 537 4 15.2 10.7 ~1.000 283
March 28, 1964, Alaska 9.3 292 4 68 4.9 106 18
December 26, 2004, Sumatra 9.0 1015 4.1 50.9 9.6 175.827 52.071
March 11, 2011, Tohoku 9.0 5578 4.2 55.9 3.0 18.497 2
List of historically known transoceanic tsunamis and their basic parameters
The above table is obviously incomplete

Numerical model of the 365AD Crete earthquakes (adopted moment-magnitude Mw=8.4).
Propagation model is based on the MGC package maintained in the ICT SD RAS (Novosibirsk)
Date and location M N I HmNF, m HmFF, m FNF FFF
July 21, 365, Crete 8+ 3 4 Unknown 10 ~5,000 ~700
January 26, 1700, Cascadia 9 7 3.5 10 2–4 Unknown 0
October 17, 1737, Kamchatka 9 6 4 63 12–15 Unknown Unknown
November 1, 1755, Lisbon 8.5 51 4 30 7 ~10.000 Unknown
November 7, 1837, Chile 8.5 20 3.5 8 6 0 62
August 13, 1868, Chile 9 99 3.5 15 5.5 612 7
May 9, 1877, Chile 9 111 4 24 12 512 50
June 15, 1896, Japan 7.6 62 4 38.2 9.0 27.122 0
April 1, 1946, Aleutians 7.4 542 4 42.2 20.0 5 162
November 4,1952, Kamchatka 9.0 314 4 18 9.1 >10.000 0
March 9, 1957, Aleutians 9.1 304 3.5 22.8 16.1 0 0
May 22, 1960, Chile 9.6 537 4 15.2 10.7 ~1.000 283
March 28, 1964, Alaska 9.3 292 4 68 4.9 106 18
December 26, 2004, Sumatra 9.0 1015 4.1 50.9 9.6 175.827 52.071
March 11, 2011, Tohoku 9.0 5578 4.2 55.9 3.0 18.497 2
List of historically known transoceanic tsunamis and their basic parameters
The above table is obviously incomplete
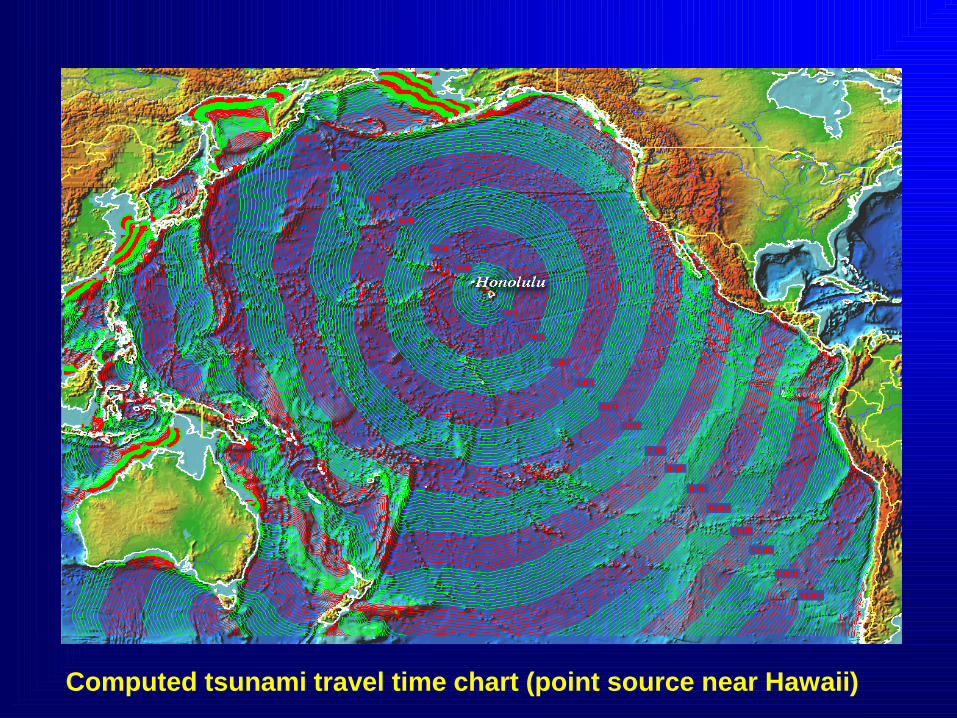
Computed tsunami travel time chart (point source near Hawaii)
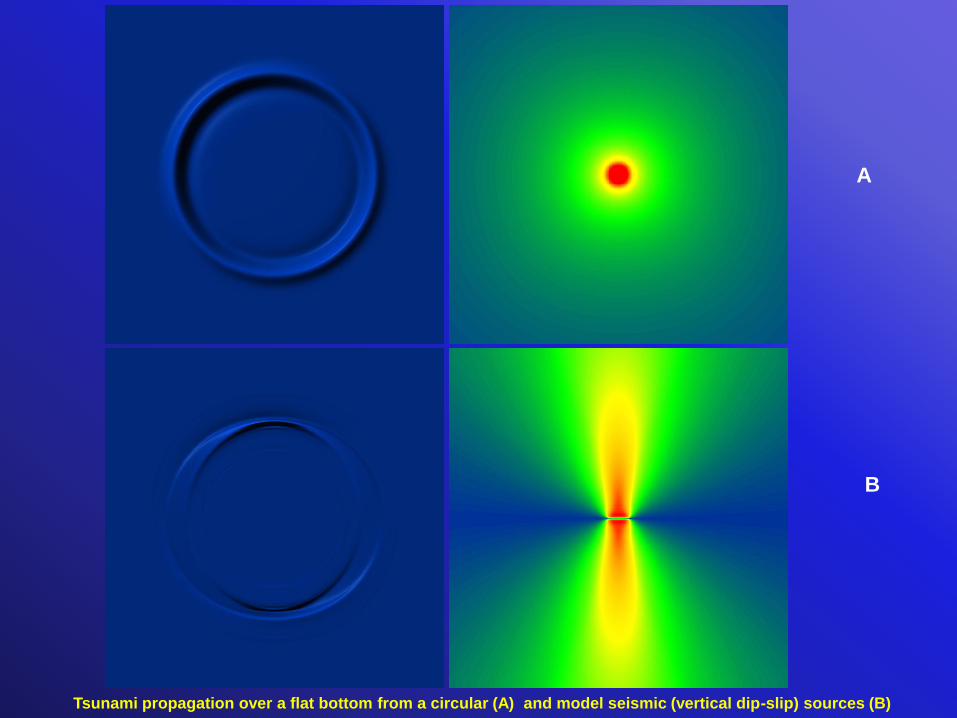
Tsunami propagation over a flat bottom from a circular (A) and model seismic (vertical dip-slip) sources (B)
A
B
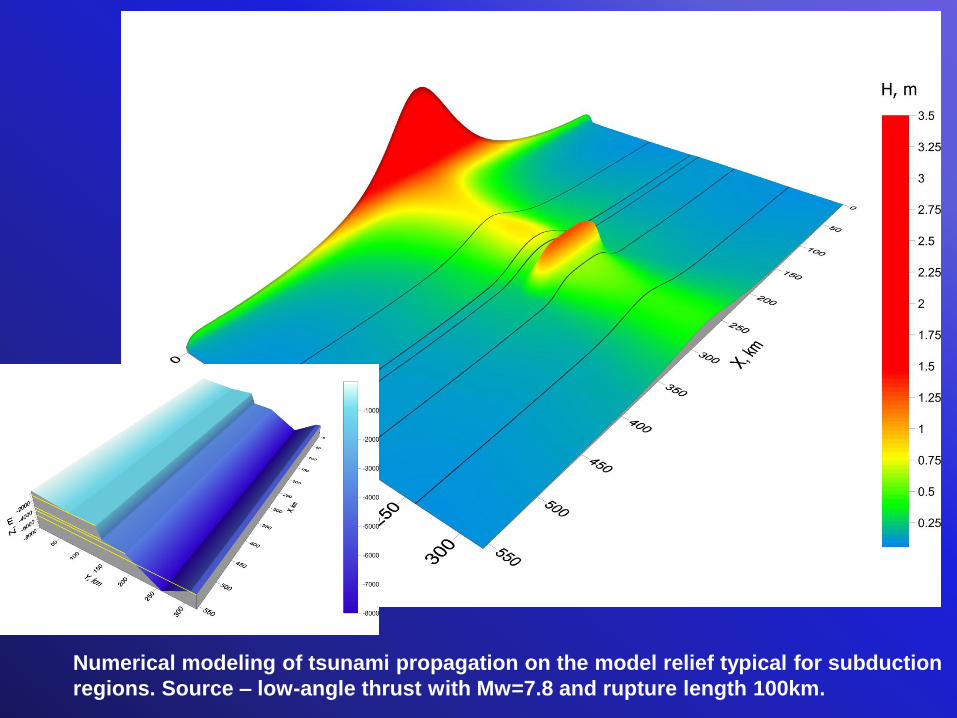
Numerical modeling of tsunami propagation on the model relief typical for subduction
regions. Source – low-angle thrust with Mw=7.8 and rupture length 100km.
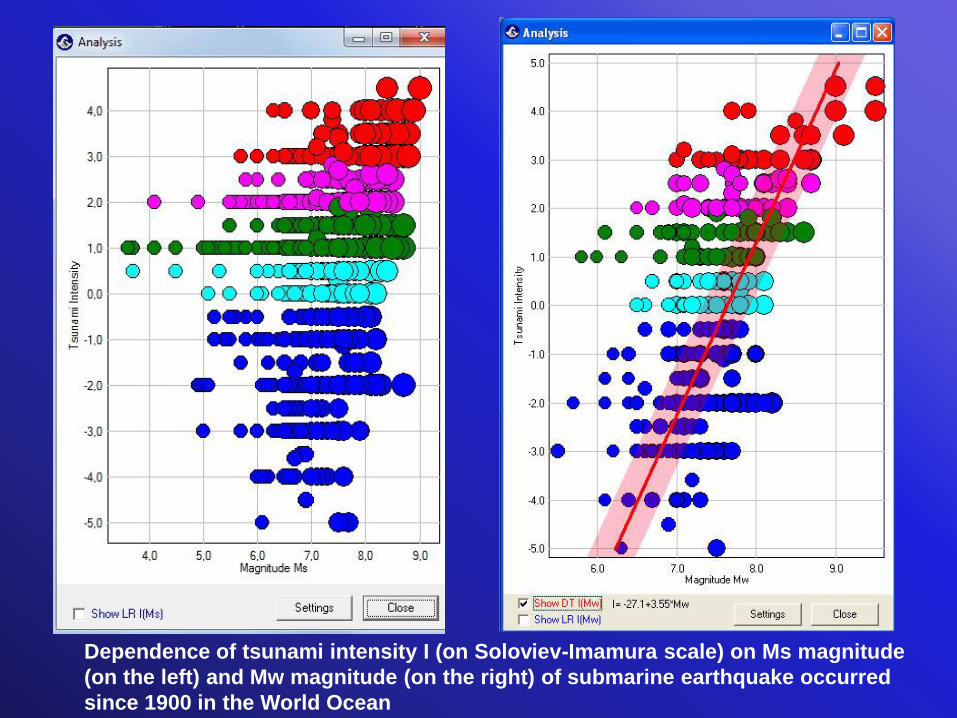
Dependence of tsunami intensity I (on Soloviev-Imamura scale) on Ms magnitude
(on the left) and Mw magnitude (on the right) of submarine earthquake occurred
since 1900 in the World Ocean
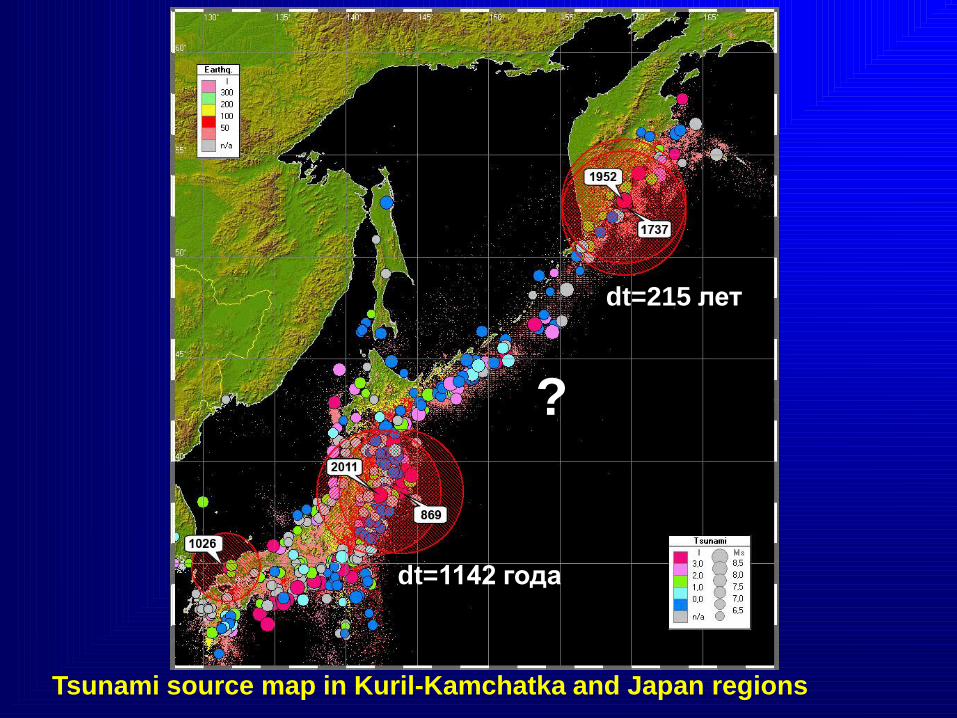
Tsunami source map in Kuril-Kamchatka and Japan regions
?
dt=1142 года
dt=215 лет
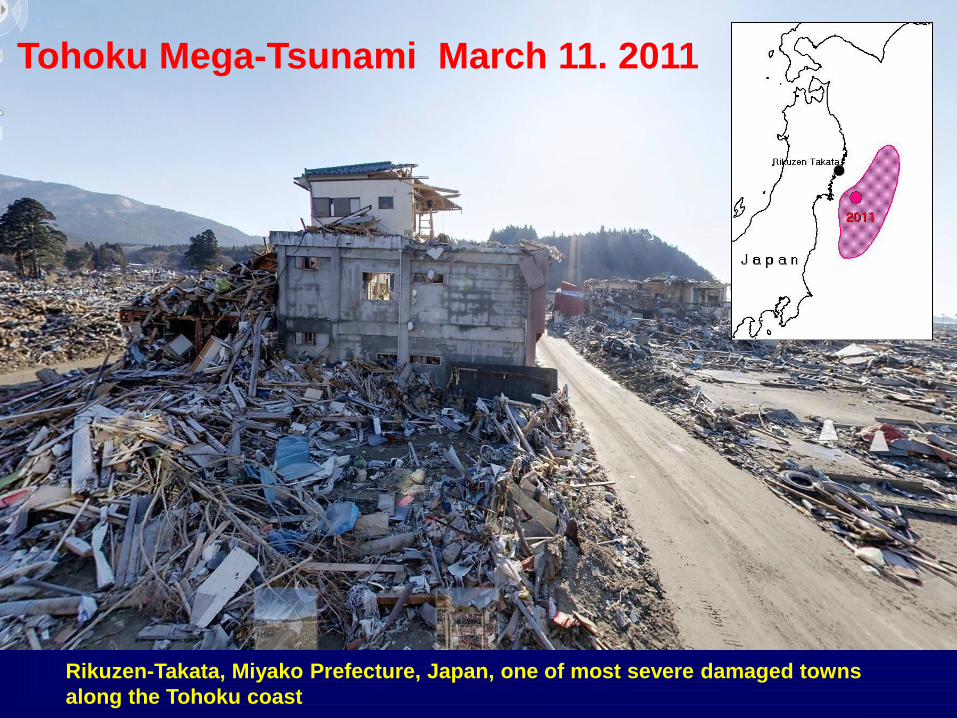
Rikuzen-Takata, Miyako Prefecture, Japan, one of most severe damaged towns
along the Tohoku coast
Tohoku Mega-Tsunami March 11. 2011
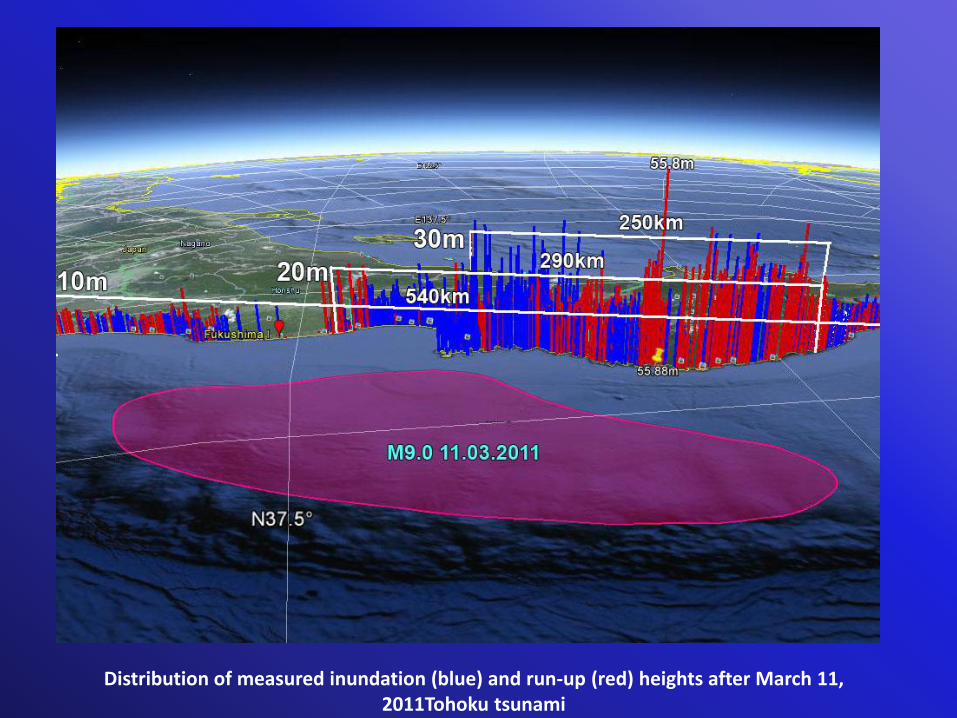
Distribution of measured inundation (blue) and run-up (red) heights after March 11, 2011Tohoku tsunami
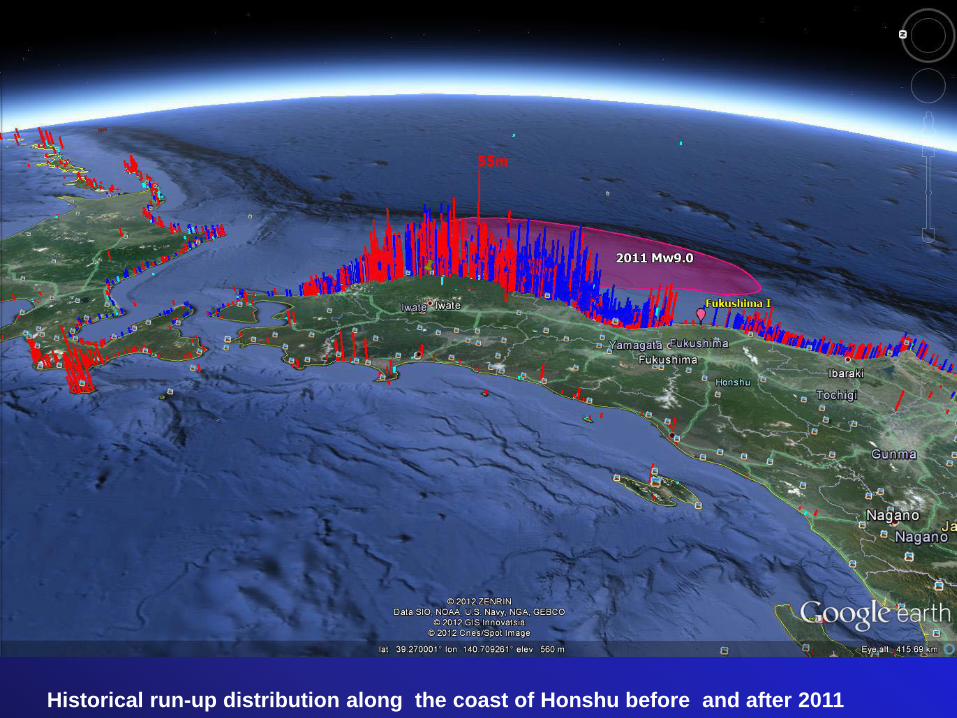
Historical run-up distribution along the coast of Honshu before and after 2011
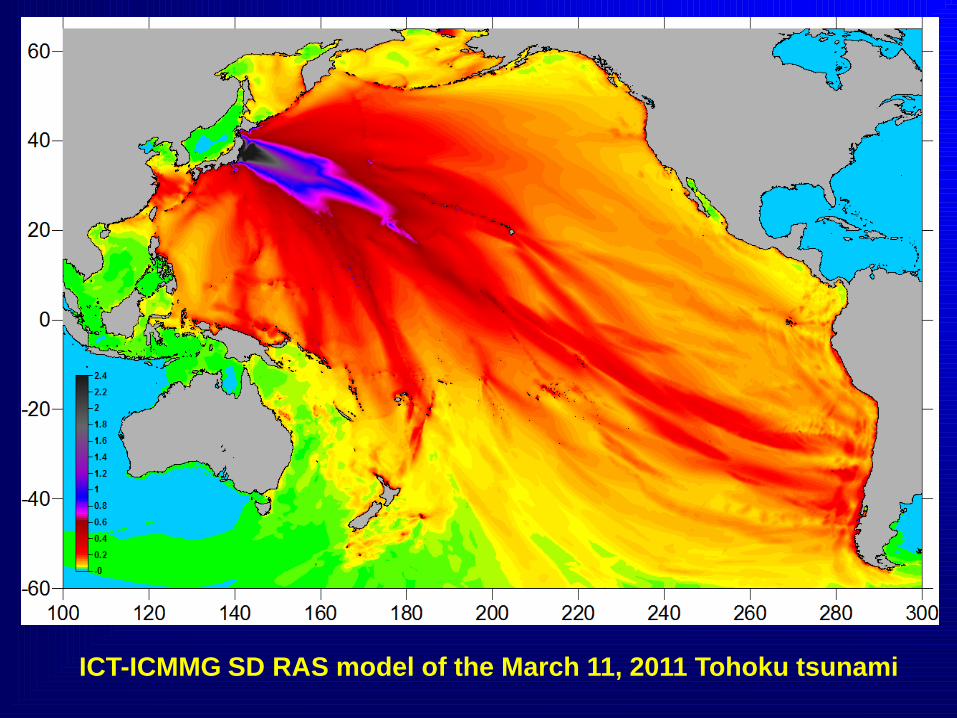
ICT-ICMMG SD RAS model of the March 11, 2011 Tohoku tsunami
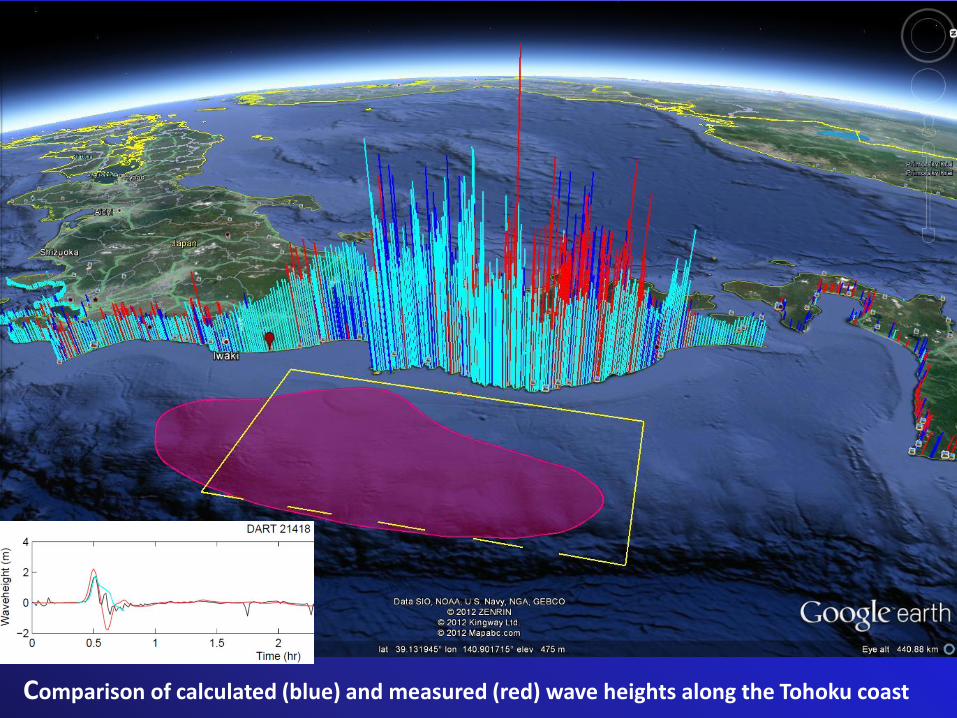
Comparison of calculated (blue) and measured (red) wave heights along the Tohoku coast
P
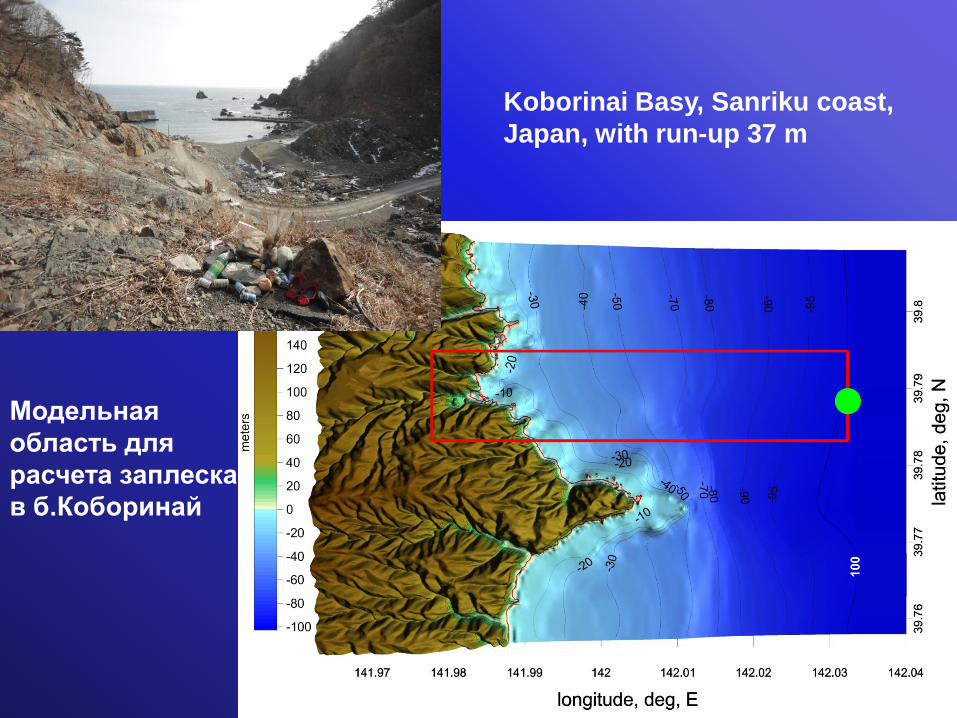
Koborinai Basy, Sanriku coast,
Japan, with run-up 37 m
Модельная
область для
расчета заплеска
в б.Коборинай
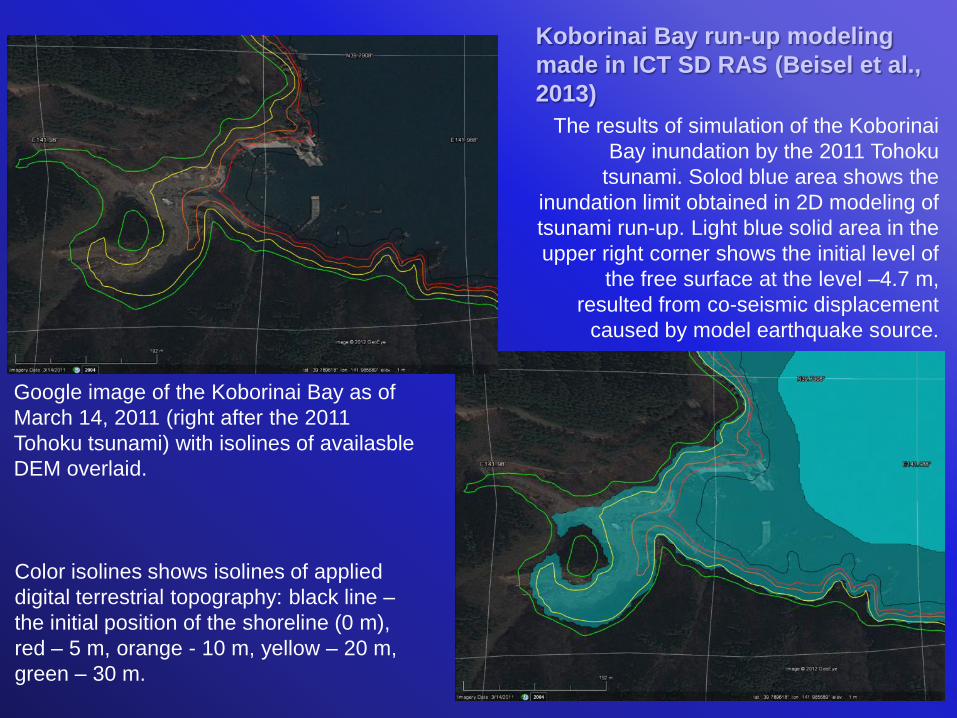
Google image of the Koborinai Bay as of
March 14, 2011 (right after the 2011
Tohoku tsunami) with isolines of availasble
DEM overlaid.
Koborinai Bay run-up modeling
made in ICT SD RAS (Beisel et al.,
2013)
The results of simulation of the Koborinai
Bay inundation by the 2011 Tohoku
tsunami. Solod blue area shows the
inundation limit obtained in 2D modeling of
tsunami run-up. Light blue solid area in the
upper right corner shows the initial level of
the free surface at the level –4.7 m,
resulted from co-seismic displacement
caused by model earthquake source.
Color isolines shows isolines of applied
digital terrestrial topography: black line –
the initial position of the shoreline (0 m),
red – 5 m, orange - 10 m, yellow – 20 m,
green – 30 m.
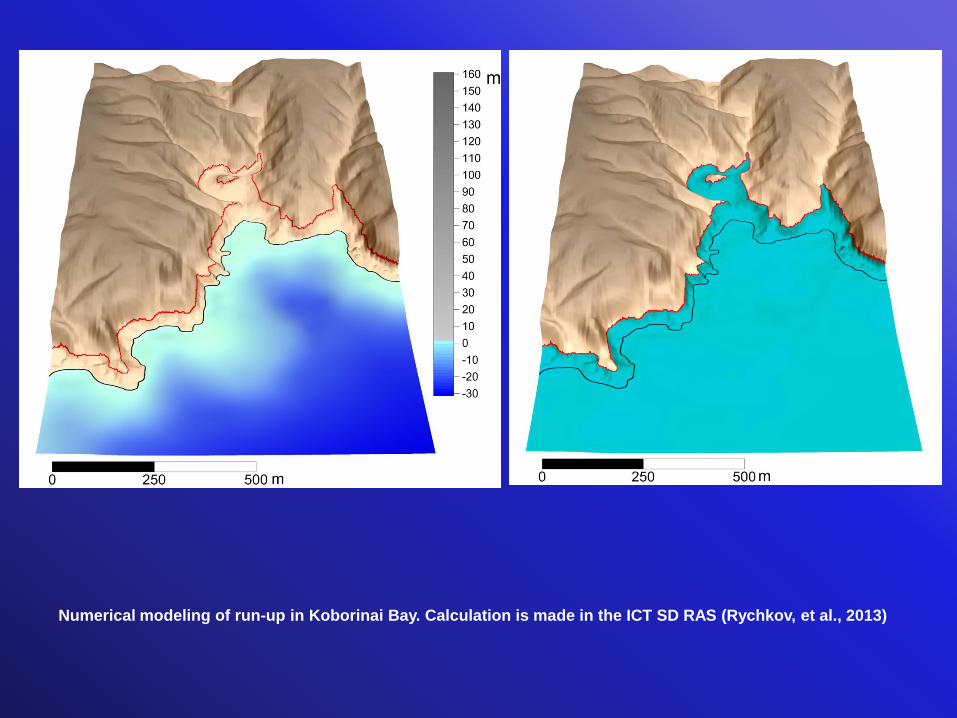
Numerical modeling of run-up in Koborinai Bay. Calculation is made in the ICT SD RAS (Rychkov, et al., 2013)
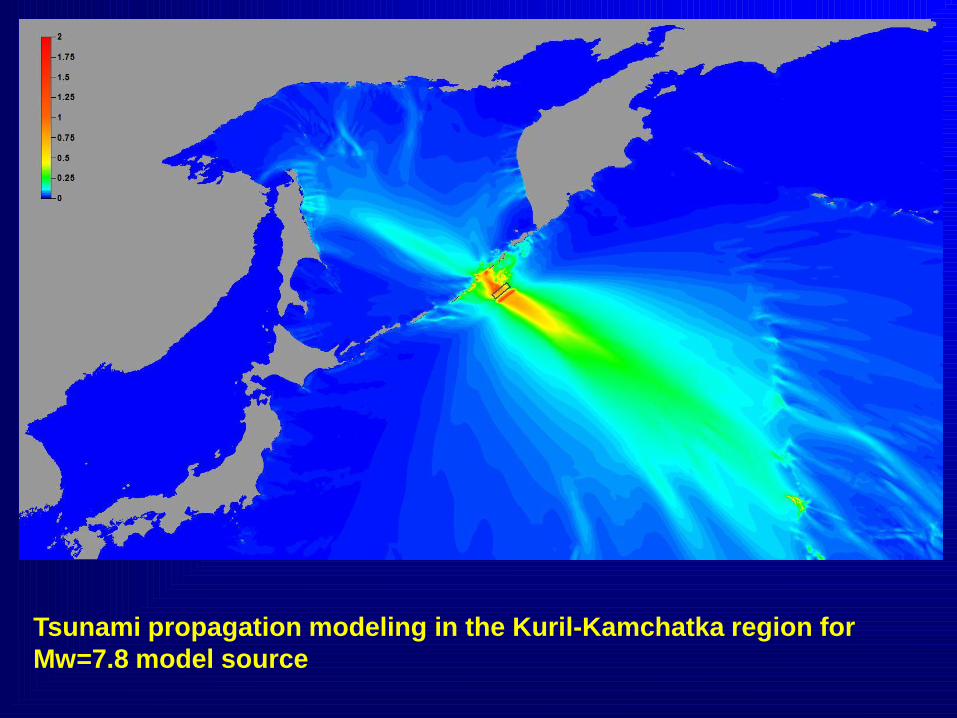
Tsunami propagation modeling in the Kuril-Kamchatka region for
Mw=7.8 model source
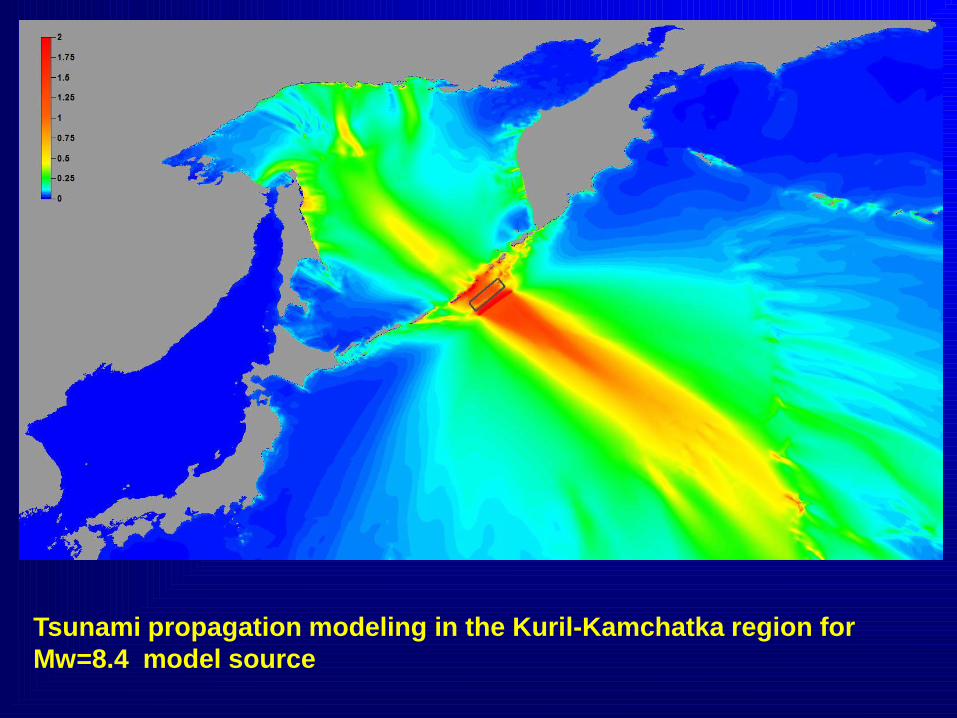
Tsunami propagation modeling in the Kuril-Kamchatka region for
Mw=8.4 model source
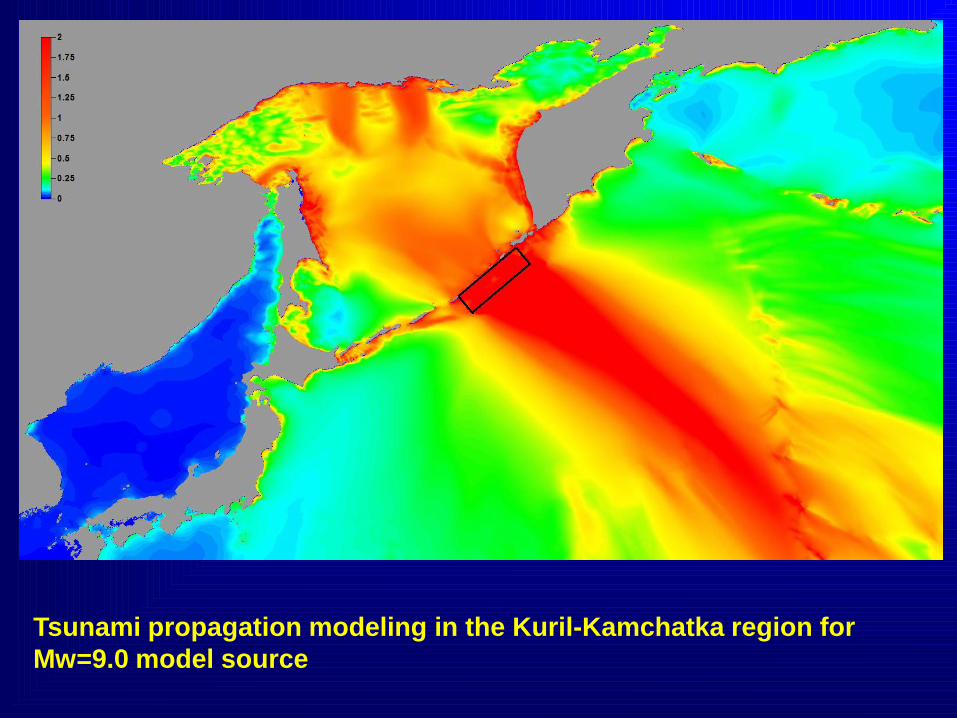
Tsunami propagation modeling in the Kuril-Kamchatka region for
Mw=9.0 model source
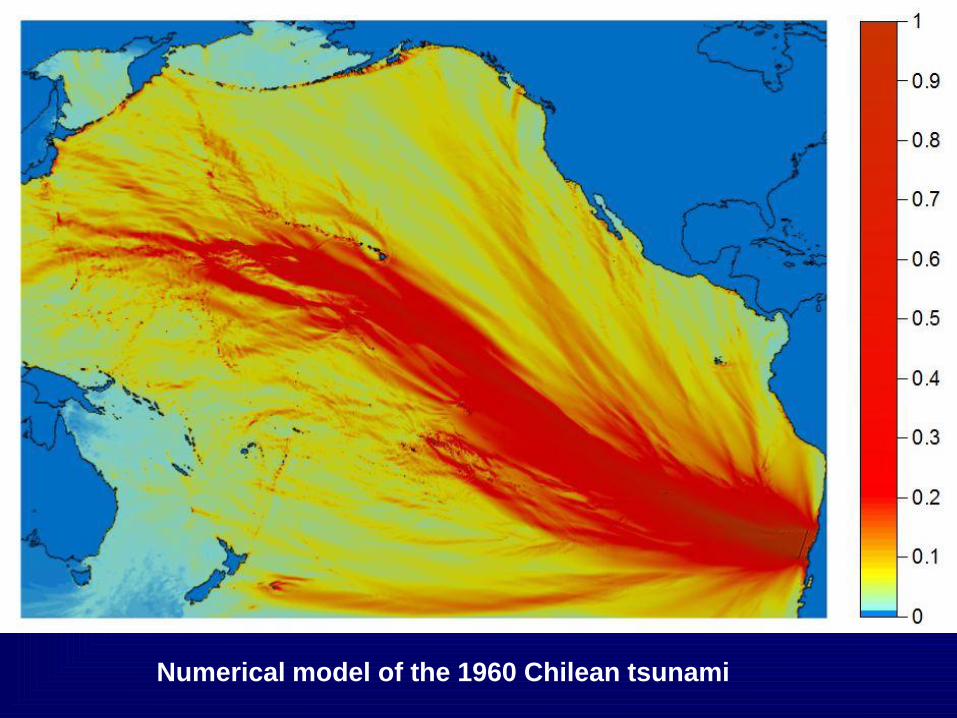
Numerical model of the 1960 Chilean tsunami
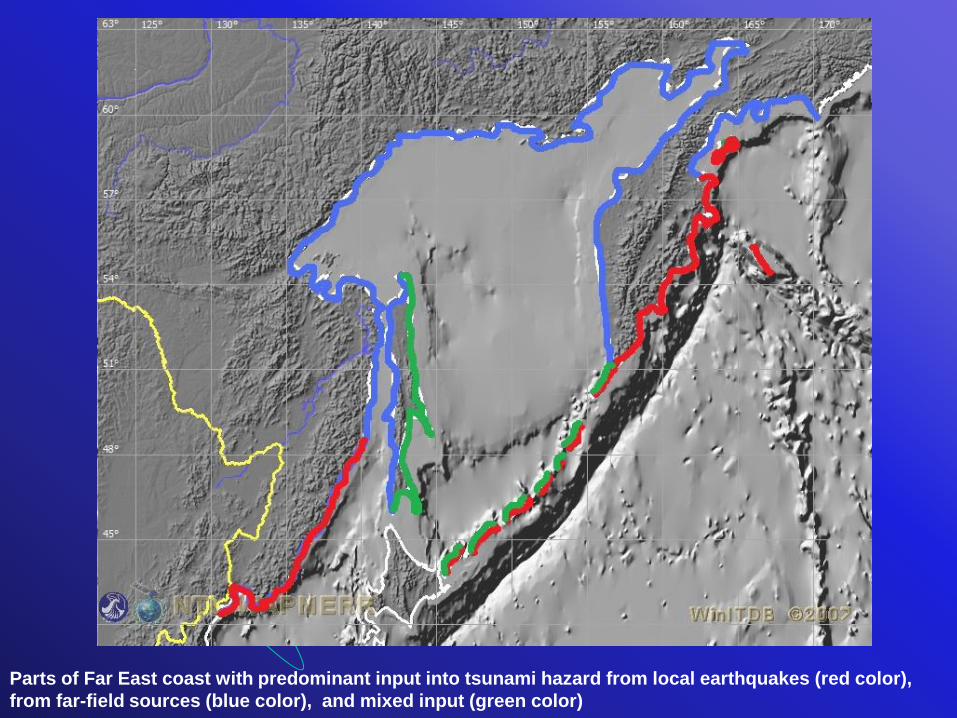
Parts of Far East coast with predominant input into tsunami hazard from local earthquakes (red color),
from far-field sources (blue color), and mixed input (green color)
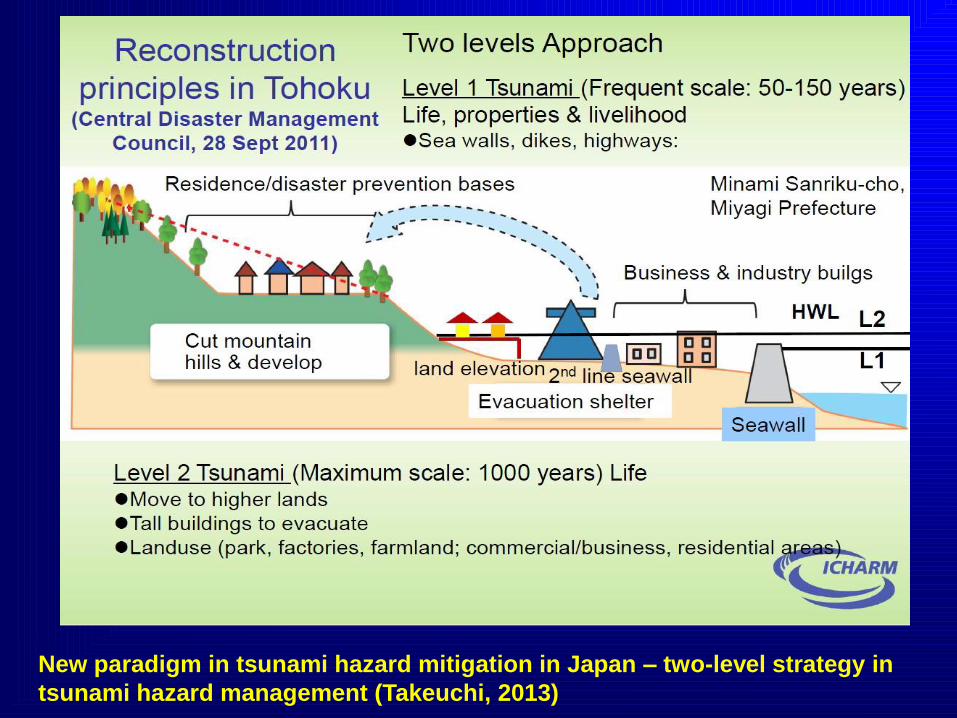
New paradigm in tsunami hazard mitigation in Japan – two-level strategy in
tsunami hazard management (Takeuchi, 2013)
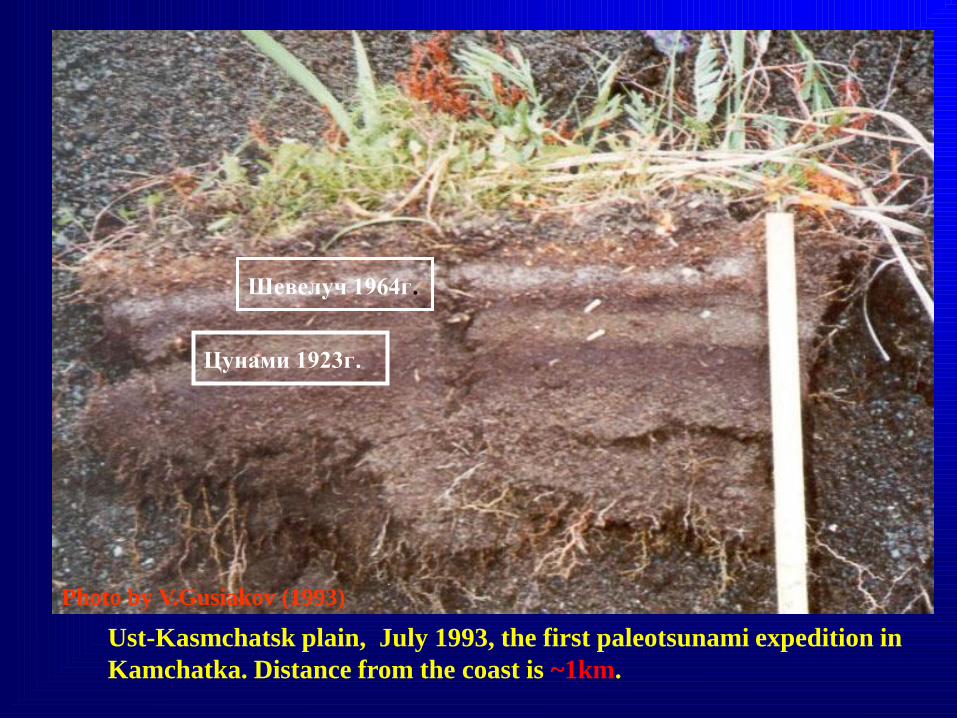
Ust-Kasmchatsk plain, July 1993, the first paleotsunami expedition in
Kamchatka. Distance from the coast is ~1km.
Цунами 1923г.
Шевелуч 1964г.
Photo by V.Gusiakov (1993)
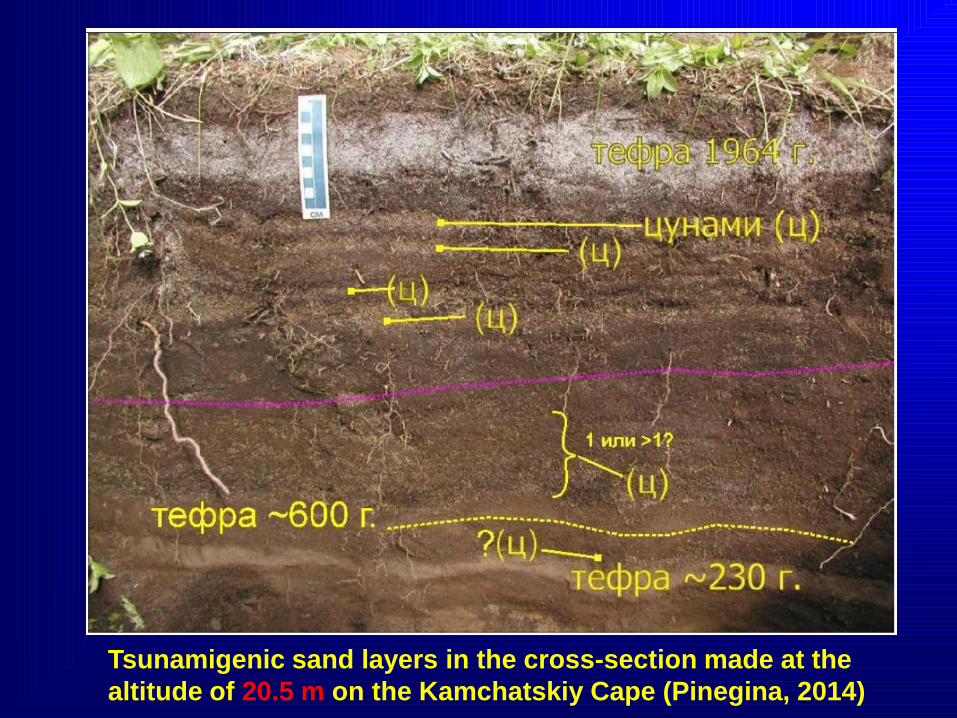
Tsunamigenic sand layers in the cross-section made at the
altitude of 20.5 m on the Kamchatskiy Cape (Pinegina, 2014)
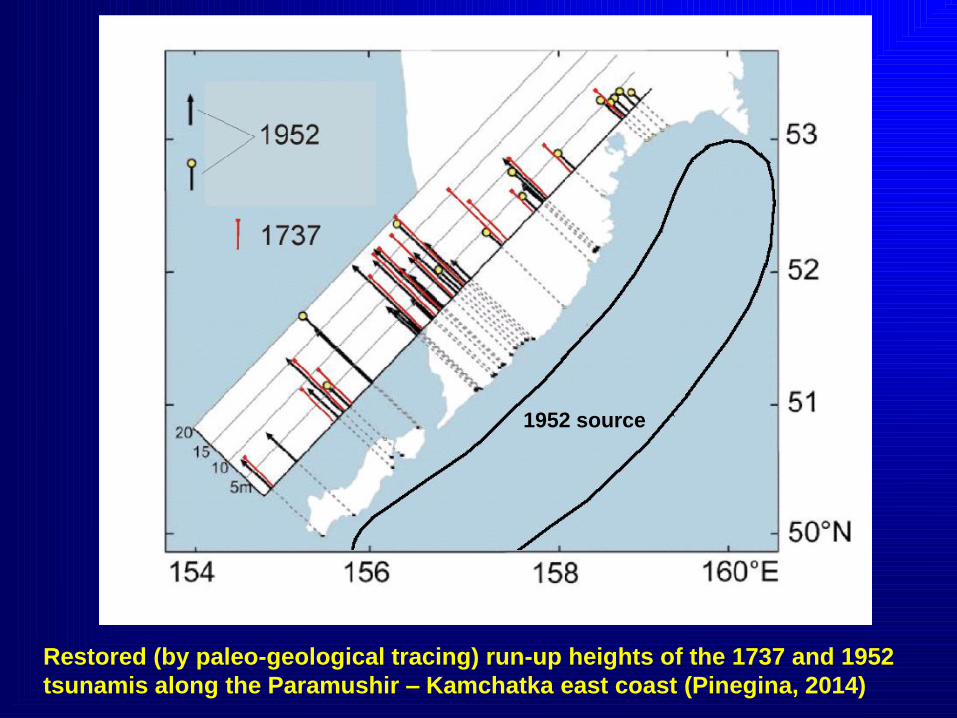
Restored (by paleo-geological tracing) run-up heights of the 1737 and 1952
tsunamis along the Paramushir – Kamchatka east coast (Pinegina, 2014)
1952 source
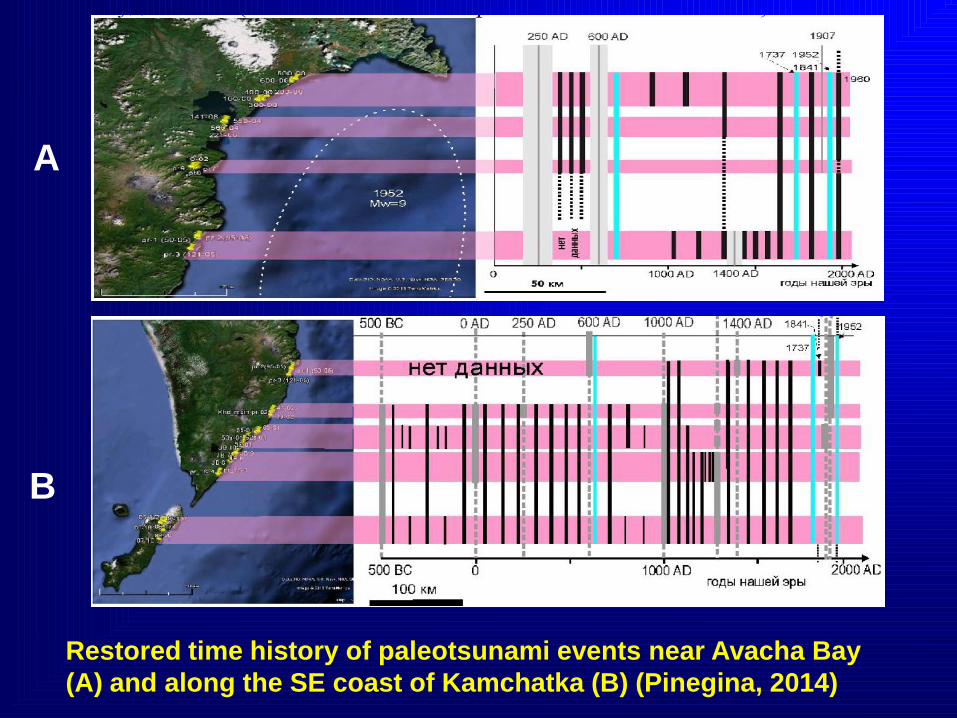
Restored time history of paleotsunami events near Avacha Bay
(A) and along the SE coast of Kamchatka (B) (Pinegina, 2014)
A
B
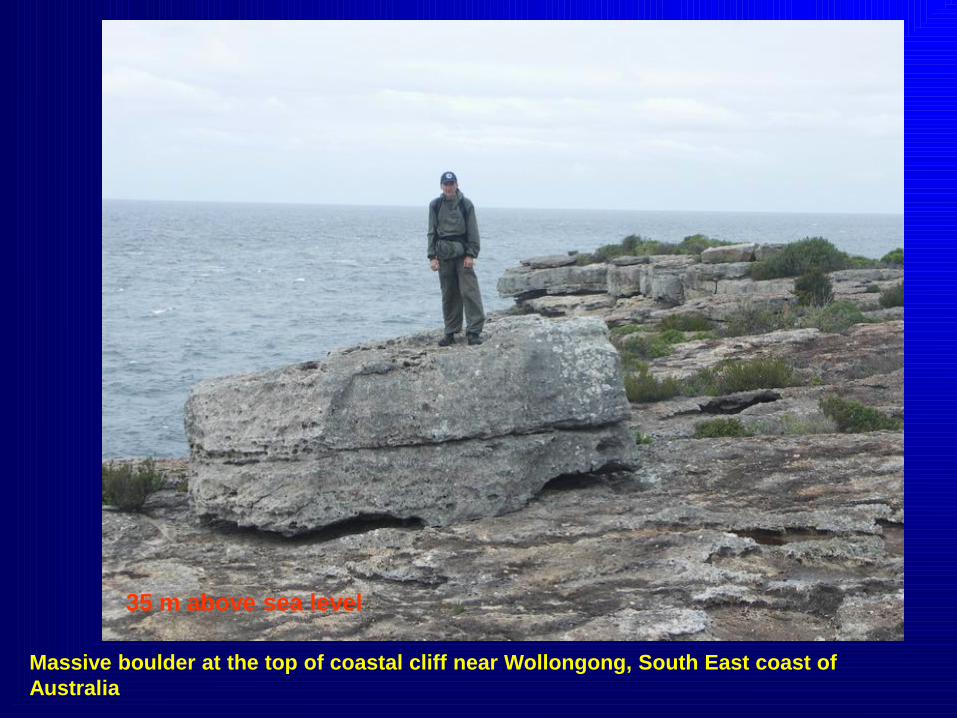
Massive boulder at the top of coastal cliff near Wollongong, South East coast of
Australia
35 m above sea level
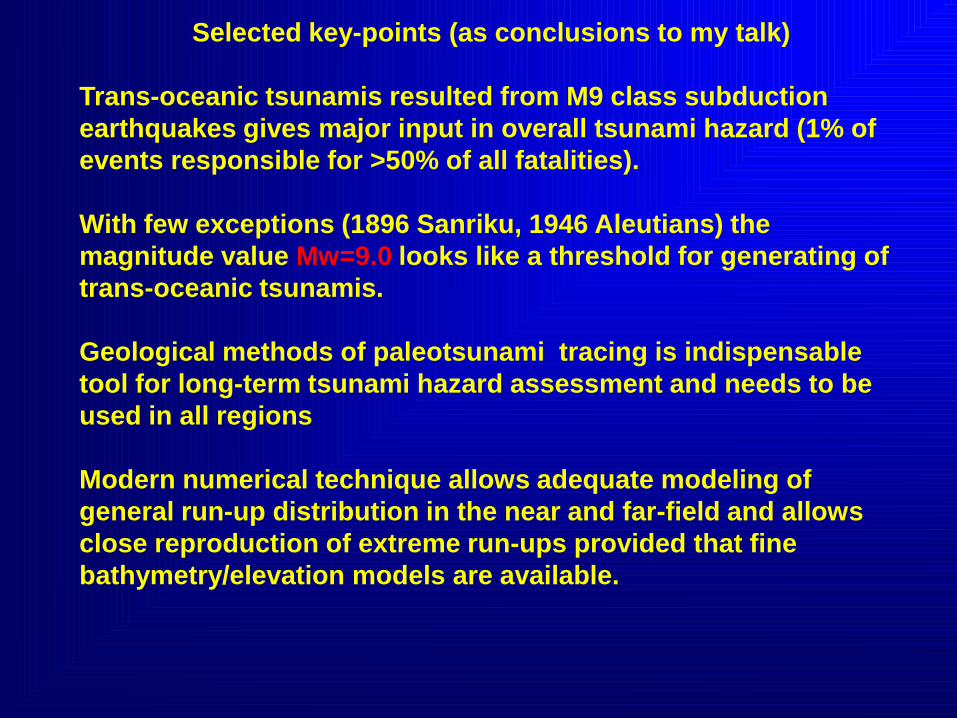
Selected key-points (as conclusions to my talk)
Trans-oceanic tsunamis resulted from M9 class subduction
earthquakes gives major input in overall tsunami hazard (1% of
events responsible for >50% of all fatalities).
With few exceptions (1896 Sanriku, 1946 Aleutians) the
magnitude value Mw=9.0 looks like a threshold for generating of
trans-oceanic tsunamis.
Geological methods of paleotsunami tracing is indispensable
tool for long-term tsunami hazard assessment and needs to be
used in all regions
Modern numerical technique allows adequate modeling of
general run-up distribution in the near and far-field and allows
close reproduction of extreme run-ups provided that fine
bathymetry/elevation models are available.

Thanks for your attention!
a