LARGE-SCALE TRIAXIAL TESTS TO STUDY EFFECTS OF …
12
633 i) Associate Professor, Department of Transportation Engineering and Management, University of Engineering and Technology, Lahore, Pakistan (drsajjadmaqbool@gmail.com). ii) Professor, Institute of Industrial Science, The University of Tokyo, Japan. The manuscript for this paper was received for review on January 15, 2009; approved on May 19, 2010. Written discussions on this paper should be submitted before May 1, 2011 to the Japanese Geotechnical Society, 4-38-2, Sengoku, Bunkyo-ku, Tokyo 112-0011, Japan. Upon request the closing date may be extended one month. 633 SOILS AND FOUNDATIONS Vol. 50, No. 5, 633–644, Oct. 2010 Japanese Geotechnical Society LARGE-SCALE TRIAXIAL TESTS TO STUDY EFFECTS OF COMPACTION ENERGY AND LARGE CYCLIC LOADING HISTORY ON SHEAR BEHAVIOR OF GRAVEL SAJJAD MAQBOOL i) and JUNICHI KOSEKI ii) ABSTRACT This study examines the eŠects of compaction on peak strength and small strain stiŠness of large prismatic speci- mens of gravel by conducting monotonic and large cyclic loading triaxial compression tests. The specimens were pre- pared using an automatic compaction system while measuring quantitatively the compaction energy. For the evalua- tion of small strain stiŠness, a static technique using small cyclic vertical loading with local strain measurement and a dynamic technique using P-wave measurement were employed. It was revealed that the peak strength of compacted gravel increased in a non-linear manner with the increase in the compaction energy. On the other hand, the diŠerence between statically and dynamically measured small strain Young's moduli was reduced as a result of increase in the compaction energy. The peak strengths of three almost equally dense specimens were found similar to each other ir- respective of the diŠerence in the loading histories with/without large cyclic loading. However, the values of the axial strain at the peak stress state were diŠerent among the three specimens, aŠected by the diŠerent loading histories. Key words: compaction, cyclic loading, gravel, small strain stiŠness, strength, triaxial test (IGC: D6/D9) INTRODUCTION Strength and deformation properties of gravelly soils have been studied for about half a century (Burmister, 1964 among others). Large scale triaxial compression tests on gravelly soils have been conducted to study the properties of ˆll materials for rockˆll dams (e.g., Holtz and Gibbs, 1956; Holtz and Ellis, 1963; Marsal, 1967; Marachi et al., 1969, 1972; Yasuda et al., 1994; Okuyama et al., 2003). In addition, gravelly soils have been investigated in Japan for their use in embankments and backˆll of retaining walls to support road and railway structures (e.g., Jiang et al., 1997; Kohata et al., 1999). Recently, increasing interests in larger and more com- plex structures of signiˆcant importance, such as tracks for bullet trains, high-rise buildings, long-span bridges (e.g., Tatsuoka et al., 1991), have highlighted the need for investigating the behavior of very dense coarse- grained soils, including gravelly ˆll materials with high compaction. High compaction is also used for the solu- tion of diŠerent types of foundation problems in gravelly deposits, in particular where the foundations may be sub- jected to dynamic and cyclic loadings (Massarsch and Fellenius, 2002). However, little is known about the eŠects of high com- paction on the properties of gravelly soils, in particular under well-deˆned compaction conditions in terms of the compaction energy applied. In the present study, there- fore, a technique of ``automatic compaction'' is in- troduced to prepare highly dense specimens of gravel while measuring quantitatively the compaction energy, and the eŠects of compaction energy on the peak strength and small strain stiŠness of the tested material are investi- gated through a series of triaxial compression tests. In ad- dition, possible eŠects of large-amplitude cyclic loading on the above properties are also studied, which would contribute towards establishing a rational design method against high seismic loads (Koseki et al., 2007). It is to be noted that, under working loads, the strain levels within highly dense deposits as well as in well- designed geotechnical structures are relatively small (Tat- suoka and Kohata, 1995). In soil mechanics, it is normal- ly assumed that the ground material is a continuum, and that the behavior is linear and recoverable within a very small strain range i.e., lesser than 10 -3 z (Tatsuoka and Shibuya, 1992). For the measurement of this ``elastic'' strain range, the experimental devices have to be very pre- cise and accurate. In the present study, very small vertical un- loading/reloading cycles were applied at some stress lev- els during loading on each gravel specimen, and strains were measured locally using local deformation trans-
Transcript of LARGE-SCALE TRIAXIAL TESTS TO STUDY EFFECTS OF …

633
i) Associate Professor, Department of Transportation Engineering and Management, University of Engineering and Technology, Lahore,Pakistan (drsajjadmaqbool@gmail.com).
ii) Professor, Institute of Industrial Science, The University of Tokyo, Japan.The manuscript for this paper was received for review on January 15, 2009; approved on May 19, 2010.Written discussions on this paper should be submitted before May 1, 2011 to the Japanese Geotechnical Society, 4-38-2, Sengoku, Bunkyo-ku,Tokyo 112-0011, Japan. Upon request the closing date may be extended one month.
633
SOILS AND FOUNDATIONS Vol. 50, No. 5, 633–644, Oct. 2010Japanese Geotechnical Society
LARGE-SCALE TRIAXIAL TESTS TO STUDY EFFECTS OFCOMPACTION ENERGY AND LARGE CYCLIC LOADING
HISTORY ON SHEAR BEHAVIOR OF GRAVEL
SAJJAD MAQBOOLi) and JUNICHI KOSEKIii)
ABSTRACT
This study examines the eŠects of compaction on peak strength and small strain stiŠness of large prismatic speci-mens of gravel by conducting monotonic and large cyclic loading triaxial compression tests. The specimens were pre-pared using an automatic compaction system while measuring quantitatively the compaction energy. For the evalua-tion of small strain stiŠness, a static technique using small cyclic vertical loading with local strain measurement and adynamic technique using P-wave measurement were employed. It was revealed that the peak strength of compactedgravel increased in a non-linear manner with the increase in the compaction energy. On the other hand, the diŠerencebetween statically and dynamically measured small strain Young's moduli was reduced as a result of increase in thecompaction energy. The peak strengths of three almost equally dense specimens were found similar to each other ir-respective of the diŠerence in the loading histories with/without large cyclic loading. However, the values of the axialstrain at the peak stress state were diŠerent among the three specimens, aŠected by the diŠerent loading histories.
Key words: compaction, cyclic loading, gravel, small strain stiŠness, strength, triaxial test (IGC: D6/D9)
INTRODUCTION
Strength and deformation properties of gravelly soilshave been studied for about half a century (Burmister,1964 among others). Large scale triaxial compressiontests on gravelly soils have been conducted to study theproperties of ˆll materials for rockˆll dams (e.g., Holtzand Gibbs, 1956; Holtz and Ellis, 1963; Marsal, 1967;Marachi et al., 1969, 1972; Yasuda et al., 1994; Okuyamaet al., 2003). In addition, gravelly soils have beeninvestigated in Japan for their use in embankments andbackˆll of retaining walls to support road and railwaystructures (e.g., Jiang et al., 1997; Kohata et al., 1999).
Recently, increasing interests in larger and more com-plex structures of signiˆcant importance, such as tracksfor bullet trains, high-rise buildings, long-span bridges(e.g., Tatsuoka et al., 1991), have highlighted the needfor investigating the behavior of very dense coarse-grained soils, including gravelly ˆll materials with highcompaction. High compaction is also used for the solu-tion of diŠerent types of foundation problems in gravellydeposits, in particular where the foundations may be sub-jected to dynamic and cyclic loadings (Massarsch andFellenius, 2002).
However, little is known about the eŠects of high com-paction on the properties of gravelly soils, in particular
under well-deˆned compaction conditions in terms of thecompaction energy applied. In the present study, there-fore, a technique of ``automatic compaction'' is in-troduced to prepare highly dense specimens of gravelwhile measuring quantitatively the compaction energy,and the eŠects of compaction energy on the peak strengthand small strain stiŠness of the tested material are investi-gated through a series of triaxial compression tests. In ad-dition, possible eŠects of large-amplitude cyclic loadingon the above properties are also studied, which wouldcontribute towards establishing a rational design methodagainst high seismic loads (Koseki et al., 2007).
It is to be noted that, under working loads, the strainlevels within highly dense deposits as well as in well-designed geotechnical structures are relatively small (Tat-suoka and Kohata, 1995). In soil mechanics, it is normal-ly assumed that the ground material is a continuum, andthat the behavior is linear and recoverable within a verysmall strain range i.e., lesser than 10-3z (Tatsuoka andShibuya, 1992). For the measurement of this ``elastic''strain range, the experimental devices have to be very pre-cise and accurate.
In the present study, very small vertical un-loading/reloading cycles were applied at some stress lev-els during loading on each gravel specimen, and strainswere measured locally using local deformation trans-

634
Photo 1. Prismatic specimen after setting all types of LDTs
Fig. 1. Positioning of LDTs on triaxial compression test specimen
634 MAQBOOL AND KOSEKI
ducers (LDTs, Goto et al., 1991) within a very smallstrain range at the specimen sides. This method is hereintermed as ``static''. On the same gravel specimen, the ve-locity of vertically transmitting compression waves (P-waves) was evaluated by triggering with a pulse wave atsome stress levels. This method is herein termed as ``dy-namic''.
This paper identiˆes at ˆrst the apparatus, measure-ment techniques, testing material and testing program,followed by discussion on the rationale for the automaticcompaction technique in detail. Next we discuss theresults of the monotonic and large cyclic loading triaxialcompression tests, focusing on the eŠects of compactionenergy on the peak strength and dilatancy properties.Lastly we discuss the eŠect of compaction energy onsmall strain stiŠnesses obtained by the static and dynamicmethods.
APPARATUS, MATERIAL AND TESTINGPROGRAM
A large-scale triaxial apparatus (AnhDan et al., 2006a)was employed to conduct triaxial compression tests oncompacted gravel specimens. The apparatus consists of atriaxial cell, an axial loading device, and a cell pressure-control device. The axial loading device employs an elec-tro-hydraulic actuator having a capacity of 490 kN andthe zero-balance system (Hayano et al., 1999).
For these tests, axial strain (e1) was measured by threepairs of vertical local deformation transducers (V-LDTs).Lateral strains in two directions (e3) were measured byanother three pairs of horizontal local deformation trans-ducers (H-LDTs) and two pairs of cantilever local defor-mation transducers (C-LDTs, AnhDan et al., 2006b).The directions of e1 and e3 and the test specimen after set-ting all LDTs are shown in Photo 1. The schematic dia-gram showing the location of all LDTs over the specimenis shown in Fig. 1. The mean of data measured with twoor three pairs of LDTs was used for each direction of lo-cal strain measurement for the analysis of test results.
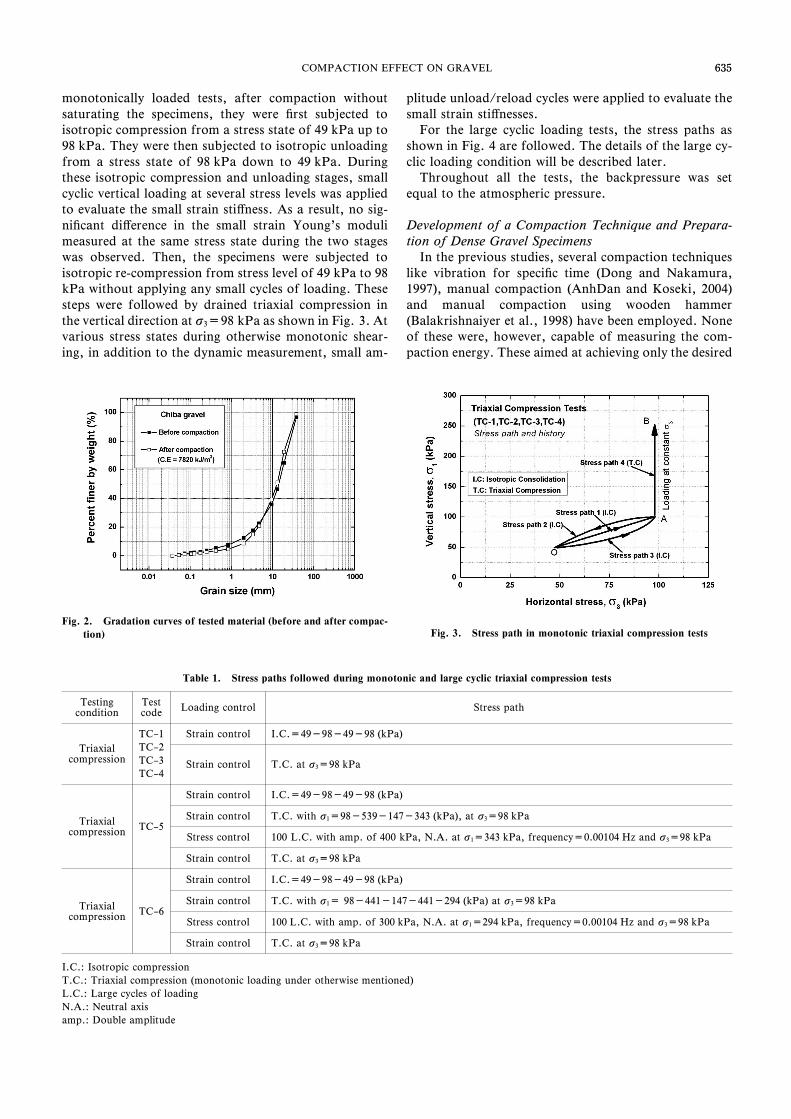
The testing material was Chiba gravel, used as a ˆllmaterial in Japan. The grains are in general hard and an-gular, consisting of well-graded crushed sandstones hav-ing Uc=30 and Gs=2.71 (Maqbool, 2005). This materialcan be categorized into well-graded sandy gravel. Itsgrain size distribution curves measured before and afterheavy compaction for specimen preparation are shown inFig. 2. The eŠect of particle crushing due to heavy com-paction on the grain size distribution was found to be in-signiˆcant. Rather, the content of ˆner particles having agrain size of about 5 mm or less decreased slightly by thecompaction, due possibly to the eŠect of particle aggrega-tion due to heavy compaction that was not fully reco-vered during the sieving process.
The friction between the specimen and top cap as wellas between the specimen and pedestal was reduced by ap-plying lubrication layers. The lubrication layer comprised0.8 mm thick rubber membrane and 30-mm thick grease,based on the recommended measure of AnhDan et al.
(2006a). No correction for the eŠects of membrane forcewas made in the data analysis.
The testing program is summarized in Table 1. For
635
Fig. 2. Gradation curves of tested material (before and after compac-tion)
Table 1. Stress paths followed during monotonic and large cyclic triaxial compression tests
Testingcondition
Testcode Loading control Stress path
Triaxialcompression
TC–1TC–2TC–3TC–4
Strain control I.C.=49-98-49-98 (kPa)
Strain control T.C. at s3=98 kPa
Triaxialcompression TC–5
Strain control I.C.=49-98-49-98 (kPa)
Strain control T.C. with s1=98-539-147-343 (kPa), at s3=98 kPa
Stress control 100 L.C. with amp. of 400 kPa, N.A. at s1=343 kPa, frequency=0.00104 Hz and s3=98 kPa
Strain control T.C. at s3=98 kPa
Triaxialcompression TC–6
Strain control I.C.=49-98-49-98 (kPa)
Strain control T.C. with s1= 98-441-147-441-294 (kPa) at s3=98 kPa
Stress control 100 L.C. with amp. of 300 kPa, N.A. at s1=294 kPa, frequency=0.00104 Hz and s3=98 kPa
Strain control T.C. at s3=98 kPa
I.C.: Isotropic compressionT.C.: Triaxial compression (monotonic loading under otherwise mentioned)L.C.: Large cycles of loadingN.A.: Neutral axisamp.: Double amplitude
Fig. 3. Stress path in monotonic triaxial compression tests
635COMPACTION EFFECT ON GRAVEL
monotonically loaded tests, after compaction withoutsaturating the specimens, they were ˆrst subjected toisotropic compression from a stress state of 49 kPa up to98 kPa. They were then subjected to isotropic unloadingfrom a stress state of 98 kPa down to 49 kPa. Duringthese isotropic compression and unloading stages, smallcyclic vertical loading at several stress levels was appliedto evaluate the small strain stiŠness. As a result, no sig-niˆcant diŠerence in the small strain Young's modulimeasured at the same stress state during the two stageswas observed. Then, the specimens were subjected toisotropic re-compression from stress level of 49 kPa to 98kPa without applying any small cycles of loading. Thesesteps were followed by drained triaxial compression inthe vertical direction at s3=98 kPa as shown in Fig. 3. Atvarious stress states during otherwise monotonic shear-ing, in addition to the dynamic measurement, small am-
plitude unload/reload cycles were applied to evaluate thesmall strain stiŠnesses.
For the large cyclic loading tests, the stress paths asshown in Fig. 4 are followed. The details of the large cy-clic loading condition will be described later.
Throughout all the tests, the backpressure was setequal to the atmospheric pressure.
Development of a Compaction Technique and Prepara-tion of Dense Gravel Specimens
In the previous studies, several compaction techniqueslike vibration for speciˆc time (Dong and Nakamura,1997), manual compaction (AnhDan and Koseki, 2004)and manual compaction using wooden hammer(Balakrishnaiyer et al., 1998) have been employed. Noneof these were, however, capable of measuring the com-paction energy. These aimed at achieving only the desired

636
Fig. 4. Stress path in large cyclic loading triaxial compression tests; (a)TC-5 and (b) TC-6
Fig. 5. Schematic diagram of specimen preparation employing auto-matic compaction (modified after Maqbool and Koseki, 2007)
Table 2. Testing conditions in monotonic and large cyclic triaxial compression tests
Specimen No Test Code Testing Condition No. of Blows per Layer Fall Height(cm)
Compaction Energy(kJm3)
Dry Density(g/cm3)
1 TC–1 Monotonic 33 44 680 1.92
2 TC–2 Monotonic 130 44 2700 2.01
3 TC–3 Monotonic 247 44 5120 2.06
4 TC–4 Monotonic 386 44 8685 2.17
5 TC–5 Large cyclic 30 44 620 1.90
6 TC–6 Large cyclic 30 44 620 1.90
636 MAQBOOL AND KOSEKI
dry density. During the manual compaction process, inparticular, it is not easy to achieve uniform densityamong the successive layers; the compaction applied oneach layer may not be uniform due to unavoidable varia-tion in the manual compaction forces being employed. Inaddition, compaction of the upper layers would inevita-bly reduce the thickness of the lower layers. Because thedensity of the successive layers is unpredictable, the re-producibility of such specimens tends to be inaccurate.
To obtain more uniform density of the specimens, thetraditional technique of manual compaction has beenreplaced in this study by controlling the compaction
energy employed. For each specimen, as schematicallyshown in Fig. 5, a hammer of 12 kg mass was droppedfrom a ˆxed height for a ˆxed number of times. The ham-mer was lifted using a motor-driven system. This methodis herein named as ``automatic compaction''. It enablesus to determine the exact compaction energy to bedeployed for achieving the required dry density. Thisprocess is also easily replicable. Refer to Maqbool andKoseki (2007) for the details of the apparatus for auto-matic compaction.
In this study, four diŠerent compaction energies wereemployed: i.e., 680, 2700, 6200 and 8685 kJ/m3. Testconditions are given in Table 2. For each level of compac-tion energy, two specimens were prepared deploying ex-actly the same procedures for conˆrming reproducibilityin terms of dry density as shown in Fig. 6. The dry densi-ties obtained were in the range of 1.90–2.17 g/cm3, whiletheir diŠerence for each compaction level was less than1z.
Of the above eight specimens, four specimens labeledas TC-1, TC-2, TC-3 and TC-4 were used for conductingmonotonic triaxial compression tests. For the cyclic load-ing triaxial compression tests, two additional specimenslabeled as TC-5 and TC-6 were prepared at compactionlevel of 620 kJ/m3. Each specimen measured 50 cm highand 23.5 cm times 23.5 cm in cross-section. It was pre-

637
Fig. 6. Reproducibility in terms of dry density of compacted gravel
Fig. 7. Relationship between compaction energy and dry density
Fig. 8. Externally measured axial strain versus deviator stress formonotonic triaxial compression tests
637COMPACTION EFFECT ON GRAVEL
pared in 12 layers with a compacted thickness of 4.0–4.5cm per layer. The surface of the preceding layer wasscraped in order to ensure good interlocking between suc-cessive layers.
Optimum moisture content of the tested gravel was de-termined from the compaction curves drawn for threelevels of compaction energy: 620, 2700 and 7820 kJ/m3
(Maqbool and Koseki, 2007). It was found that the valuesof the optimum moisture content were diŠerent for eachlevel of compaction. In order to keep consistency in thespecimen preparation procedure, the optimum moisturecontent (=5.5z) obtained for the maximum level ofcompaction (=7820 kJ/m3) was employed for all thecompaction levels.
As a result of this study, the trend of the curve betweencompaction energy and dry density was found to beslightly non-linear as shown in Fig. 7. Their relationshipis approximated by the equation shown in the ˆgure. Therelationship suggests that increase in compaction energybeyond a certain limit would not signiˆcantly increase thedry density.
It should be noted that the above evaluation of thelinearity or non-linearity in Fig. 7 was made in a subjec-tive manner, since the number of available data was limit-ed to be four. It will be also the case with the relevantˆgures to be shown in the next section (Figs. 9 through
12). Since the physical meaning of the parameters that arecompared in these ˆgures was diŠerent from each other,it was not possible for the authors to deduce the essentiallinearity or non-linearity in an objective manner.
TRIAXIAL TEST RESULTS AND DISCUSSIONS
Monotonically Loaded Triaxial Compression TestResults and Discussion
The relationship between deviator stress (q1=s1-s3)and axial strain (e1) for all four monotonically loadedtriaxial compression (stress path 4 in Fig. 3) tests isshown in Fig. 8. From this relationship, we can computemaximum deviator stress (qmax) and peak angle of inter-nal friction (qmax) by assuming no cohesion by the follow-ing equations;
qmax=(s1-s3)max
qmax=sin-1 [(s1-s3)/(s1+s3)]max
(1)
(2)
In these equations s1 is the major principle stress, and s3
is the minor principal stress that is equal to the conˆningstress in this study.
It was observed that the q1 values corresponding tosimilar axial strain levels were larger in denser specimensthan those in relatively loose specimens. In tests TC-1,TC-2, TC-3 and TC-4, qmax was observed at about 10.3z,6z, 3.3z and 1.9z of axial strain, respectively. Postpeak behavior was recorded in the three tests TC-1, TC-2and TC-3; however, it could not be recorded in test TC-4because the loading was stopped just after reaching qmax
due to mechanical dysfunction of the hydraulic pump.The expected post peak behavior of test TC-4 is indicatedby dotted line in Fig. 8.
The relationship between qmax and compaction energywas found to be non-linear; the slope of the curve becom-ing milder with the increase in compaction energy as ap-proximated by the equation shown in Fig. 9. On the otherhand, the relationship between qmax values and dry den-sity was rather linear as plotted in Fig. 10. The practicalimplication is that there will be an optimum condition forthe compaction level beyond which its execution becomesless economical. The relationship between qmax values

638
Fig. 9. Relationship between compaction energy and maximum devia-tor stress
Fig. 10. Relationship between dry density and maximum deviatorstress
Fig. 11. Relationship between compaction energy and maximum angleof internal friction
Fig. 12. Relationship between dry density and maximum angle of in-ternal friction
Fig. 13. Externally measured axial strain versus nominal volumetricstrain in monotonic triaxial compression tests
638 MAQBOOL AND KOSEKI
(obtained from Eq. (2)) with compaction energy was alsonon-linear; however, the relationship became more linearagain with dry density as shown in Figs. 11 and 12.
Dilatancy properties of all four specimens were com-pared based on their relationship between axial strain (e1)and nominal volumetric strain (evol); computed by the fol-lowing equation.
evol=e1+2×e3 (3)
Here e1 is the axial strain measured externally and e3 is thestrain measured by C-LDTs. The data obtained by H-LDTs was not used in this computation because of limit-ed range of H-LDTs as compared to C-LDTs.
The values of evol in tests TC-1, TC-2 and TC-3 werefound similar to each other up to about 3z of e1 asshown in Fig. 13. Beyond this range of e1, the specimen intest TC-1 prepared by employing lowest compactionenergy showed relatively less dilative behaviour than thespecimens in tests TC-2 and TC-3. On the other hand thespecimen in test TC-4, prepared with the highest compac-tion energy exhibited largest dilative behaviour than theother three specimens. Such diŠerence in dilatancy curvesrepresented the diŠerence in compaction level and drydensity for all four specimens. Since the particles of thetested material were angular, the denser the specimen is,
the more likely it is to dilate due to the particles trying tooverride one another.
Large Cyclic Loading Triaxial Compression Test Resultsand Discussion
The relationships between deviator stress (q1=s1-s3)and axial strain (e1) for two cyclic loading tests (TC-5 andTC-6) and one monotonically loaded triaxial compres-

639
Fig. 14. Externally measured axial strain versus deviator stress (q1) fortest TC-1 and large cyclic loading tests
Fig. 15. Externally measured axial strain versus deviator stress (q1) fortest TC-1 and large cyclic loading tests (until axial strains of about3%)
Fig. 16. Externally measured axial strain versus deviator stress (q1)during large cyclic loading for test TC-5
Fig. 17. Externally measured axial strain versus deviator stress (q1)during large cyclic loading for test TC-6
639COMPACTION EFFECT ON GRAVEL
sion test (TC-1) are shown in Fig. 14. The dry density issimilar in all three tests. The only diŠerence among threetests is application of cyclic loading at certain stress levelduring triaxial compression testing as given in Table 1.
Although the number of tested specimens is limited tothree, as can be seen from Fig. 14, the peak strength inthese tests was similar to each other irrespective of thediŠerence in the loading histories with/without large cy-clic loading. This may suggest that there exists a commonlimit of stress state beyond which the local soil particlestructure starts to fail, triggering overall strain softeningbehavior. However, as will be compared more in detaillater, the values of axial strain at the peak stress statewere diŠerent among the three tests.
In the ˆrst cyclic loading test labeled as TC-5, from aneutral stress state at a deviator stress q1 of about 245kPa, 100 cycles of loading/unloading with single ampli-tude vertical stress of 200 kPa and a frequency of 0.001Hz were applied. As shown in Fig. 15, during monotonicloading stage after the large cyclic loading, sudden in-crease in q1 value without any considerable increase in ax-ial strain was observed. In this test, the peak stress statewas obtained immediately after the large cyclic loading atan axial strain of about 2.3z.
In the second cyclic loading test labeled as TC-6, 100cycles of loading/unloading with single amplitude verti-cal stress of 150 kPa and a frequency of 0.001 Hz wereapplied from a neutral stress state at a deviator stress q1
of 196 kPa. Similar to the ˆrst test, as shown in Fig. 15,during monotonic loading stage after the large cyclicloading, sudden increase in q1 value without any con-siderable increase in axial strain was observed. On theother hand, qmax was observed at larger axial strain, i.e.,about 5.5z.
In these tests, during cyclic loading stage, the accumu-lation of axial strain was larger in the initial cycles anddecreased with the increase in number of cycles as shownin Figs. 16 and 17. Moreover, the axial strain incrementwas larger in test TC-5 due possibly to larger amplitude ofcyclic loading than that in test TC-6 as shown in Fig. 18.The unexpected behavior in test TC-5 as shown in Fig. 18
was due to mechanical problem in the loading controlwhich was immediately repaired. It should be noted thatcreep deformation during large cyclic loading may have

640
Fig. 18. Time versus axial strain increment during large cyclic loadingin tests TC-5 and TC-6
Fig. 19. Externally measured axial strain versus nominal volumetricstrain in large cyclic loading tests: (a) TC-5 and (b) TC-6
Fig. 20. Externally measured axial strain versus nominal volumetricstrain in monotonic (TC-1) and large cyclic loading tests
640 MAQBOOL AND KOSEKI
aŠected the above behavior as well, since the maximumstress levels mobilized were relatively high (i.e., about60–70z of the peak stress levels).
As shown in Fig. 19(a), the measured volumetric strainduring large cyclic loading in test TC-5 exhibited contrac-tive behavior, suggesting improvement of soil fabric byre-arrangement of particles. This re-arrangement of par-ticles during cyclic loading may have caused earlier dila-
tive behaviour in test TC-5 than the other two specimensas shown in Fig. 20, which also resulted into earliermobilization of the peak stress state as mentioned before(Fig. 14).
On the other hand, in test TC-6 (Fig. 19(b)), the speci-men response during large cyclic loading changed fromcontractive to dilative behavior. During the subsequentmonotonic loading, it exhibited dilative behavior thatwas similar to the behavior observed in the monotonicloading test (test TC-1) as plotted on the same ˆgure.Such diŠerent trends of dilatancy behavior during largecyclic loading between the two tests (tests TC-5 and TC-6)may be linked to the diŠerent axial strain levels that weremobilized at the peak stress state, as mentioned previous-ly. Further studies are required on the eŠects of cyclicloading amplitudes on the possible change in the soilfabric.
It should be noted that the eŠect of large cyclic loadingon small strain stiŠness of compacted gravel has beenstudied and reported by AnhDan and Koseki (2004).Therefore, its eŠect on the peak strength and dilatancycharacteristics is focused in this section. On the otherhand, in the next section, the eŠect of diŠerent compac-tion energies on small strain stiŠness of compacted gravelwithout the large cyclic loading history will be studied.
EŠect of Compaction Energy on Small Strain StiŠnessTo study the eŠect of compaction energy on small
strain stiŠness of compacted gravel, vertical Young'smoduli were measured by employing static and dynamictechniques. To evaluate quasi-elastic vertical Young'smoduli based on static measurement (Es), existing dataon the deformation properties from cyclic loading testson dense gravelly soils reported in the literature showedthat the behavior at strains lesser than about 0.001z isnearly elastic (Kokusho and Esashi, 1981, Jiang et al.,1997). In our study, the specimen was subjected to verysmall unloading/reloading cycles at speciˆc stress levelsin the vertical direction. For each stress level, stress-strainrelationship during small vertical loading cycle is depicted

641
Fig. 21. Typical stress-strain relationship during a small vertical load-ing cycle
Photo 2. P-wave triggers and accelerometers set on large scale pris-matic specimen of gravel
Fig. 22. Typical wave record to measure wave travel time
641COMPACTION EFFECT ON GRAVEL
by a straight line, and Es is evaluated from the slope ofthe line. Typical stress-strain relationship during a smallvertical loading cycle is shown in Fig. 21.
For dynamic measurements, in order to receive a clearsignal, AnhDan et al. (2002) employed continuoussinusoidal inputs for trigger excitation while testing ongravel specimens by using the same equipment as used inthis study. In their approach, it was sometimes di‹cult todetect the correct set of corresponding peak signals meas-ured at diŠerent levels. Moreover, they neglected to con-sider the eŠects of re‰ected waves for travel time determi-nation. In the present study, therefore, a diŠerent ap-proach was devised to determine accurately the wavetravel time. Single pulse wave at speciˆc stress levels wasgenerated using a trigger that was set on the top cap, andthe wave travel time was determined using two accelerom-eters that were attached on the side of specimen as shownin Photo 2. In this approach, by considering the ˆrstpeak point in computing the wave travel time, the prob-lem of re‰ected wave arrival could be eliminated. Finally,from the obtained wave travel time, the wave velocity wasevaluated. As the top cap touched the whole cross-sectionof the specimen that was with free side boundaries, we as-sumed that unconstrained compression waves were meas-ured at the side of the specimen where the accelerometerswere attached. Its wave velocity Vp is directly related to Ed
of the material as given in the following equation:
Ed=rV 2p (4)
where r is the mass density of the specimen, and Vp is thecompression wave velocity. The latter was calculated bythe equation:
Vp=L/t (5)
where L is the distance covered by the wave as deˆned inPhoto 2 and t is the wave travel time.
To determine the wave travel time (t ), it was decided touse the ˆrst peaks of the waves (Fig. 22) that were meas-ured at diŠerent levels after a detailed study given inMaqbool (2005). It should be noted that the Ed values canbe alternatively evaluated under an assumption of con-
strained condition and isotropic deformation propertiesby using the following equation. Refer to AnhDan et al.(2002) for more detailed discussion consideringanisotropic deformation properties.
M=rV 2c=
Ed(1-n)(1-2n)(1+n)
(6)
where M is the constrained modulus, Vc is the compres-sion wave velocity under constrained condition and n isthe Poisson's ratio.
The values of the small strain Poisson's ratio underisotropic stress states were found to be around 0.18–0.20in this study. With these values of Poisson's ratio, theabove Ed values under an assumption of constrained con-dition will be around 8–11z larger than the Ed values em-ployed in this study under an assumption of uncon-

642
(a) at isotropic stress state of 49 kPa
(b) at isotropic stress state of 60 kPa
(c) at isotropic stress state of 80 kPa
(d) at isotropic stress state of 98 kPa
(e) at anisotropic stress state of s3=98 kPa and s1=200 kPa
Fig. 23. Relationship between compaction energy and verticalYoung's moduli in tests TC-1 through TC-4
642 MAQBOOL AND KOSEKI
strained condition.Note also that the frequencies of the single pulse wave
employed in this study were in a range of 3.0 to 5.0 kHz.They correspond to wave lengths l of 0.097 to 0.264 cm,considering that the wave velocities measured in thisstudy were 404 to 734 m/sec. When they are normalizedwith the height of the specimen, H (=50 cm) and themean diameter of the tested material, d50 (=6.0 cm), theratios of l/H and l/d50 are 1/500 to 1/200 and 1/60 to
1/20, respectively. Since the l values are much smallerthan the equivalent radius of the specimen, req (=13.3cm), which is evaluated by Eq. (7) assuming an equiva-lent cylinder having the same cross-sectional area, the as-sumption of rod wave (i.e., for a condition of l:req, ac-cording to Santamarina, 2001) would not be relevant inthis study.
req=L・W
p(7)
where L and W are the horizontal dimensions of the pris-matic specimen (refer to Fig. 1).
Figure 23 compares the Es and Ed values that were eval-uated at several stress states during isotropic compressionand triaxial shearing. With the increase in compactionenergy, the Es values increased. On the other hand, Ed
values did not increase but were maintained almost con-stant.
The present study could reveal that at the same com-paction level, the Ed value was larger than the Es value,while their diŠerence was reduced as a result of increasein compaction energy or dry density; thus indicating theneed for developing a proper ``correction factor'' for

643643COMPACTION EFFECT ON GRAVEL
measuring small strain stiŠness of compacted gravel,which would depend on the levels of compaction energyor dry density and the conditions of dynamic measure-ment if it is employed.
The reason for the above behavior might be that in thedynamic measurement, unlike the static measurement,the wave does not re‰ect the overall cross-sectionalproperty of the specimen; rather it travels through theshortest path made by the interlocking of bigger particlesresulting in larger values of Young's moduli (Tanaka etal., 2000; AnhDan and Koseki, 2002). The diŠerence inthe two Young's moduli would increase with the decreasein the dry density. Since looser specimens would havelarger structural or microscopic heterogeneity than dens-er ones, the static measurement results would be aŠecteddirectly by it. On the other hand, the dynamic measure-ment results were not aŠected largely, because certainamounts of compaction were applied to all the specimensduring preparation process and possibly created inter-locking of bigger particles.
CONCLUSIONS
This study revealed the following conclusions;1) The automatic compaction technique makes it possi-
ble to obtain highly dense specimens as well as toevaluate compaction energy. The trend of the curvebetween compaction energy and dry density is foundto be slightly non-linear, which suggests that increasein compaction energy beyond a certain limit would notresult in further signiˆcant increase in dry density.
2) The peak strength of compacted gravel increases in anon-linear manner with the increase in compactionenergy, and the slope of the curve becomes milder;therefore, there will be an optimum condition for thecompaction level beyond which its execution in prac-tice would be less economical.
3) There exists diŠerence between statically and dynami-cally measured small strain Young's moduli of com-pacted gravel. They narrow as a result of increase incompaction energy; thus indicating the need for de-veloping a proper ``correction factor'' for evaluatingsmall strain stiŠness of compacted gravel.
4) The peak strength in three almost equally dense speci-mens was found to be similar irrespective of the diŠer-ence in the loading histories with/without large cyclicloading. On the other hand, the values of axial strainat the peak stress state were diŠerent among the threetests. Moreover, during monotonic loading stage justafter the large cyclic loading, sudden increase in theshear stress level without any considerable increase inaxial strain was observed. Such behavior may beaŠected by possible re-arrangement of particles duringthe large cyclic loading.
ACKNOWLEDGEMENTS
The authors express their sincere thanks to the Ministryof Science, Culture and Education of Japan for its ˆnan-
cial support to the ˆrst author for his PhD studies at theUniversity of Tokyo, Japan. They also thank Mr.Takeshi Sato, formerly Research Support PromotionMember, Institute of Industrial Science, the University ofTokyo, Japan for providing technical support in con-ducting the laboratory tests.
NOTATIONS
e1: Axial straine3: Lateral strain
evol: Nominal volumetric strains1: Axial stresss3: Lateral conˆning stressUc: Uniformity coe‹cientGs: Speciˆc gravity
qmax: Maximum deviator stressqmax: Peak angle of internal friction
ASTM: American Society for Testing and MaterialsLDTs: Local Deformation Transducers
H-LDTs: Horizontal Local Deformation TransducersC-LDTs: Cantilever Local Deformation Transducers
I.C.: Isotropic ConsolidationVp: Compression wave velocityEd: Small strain vertical Young's modulus by dy-
namic measurementr: Mass density of the specimenL: Distance covered by wavet: Wave travel time
M: Constrained modulusVc: Compression wave velocity under constrained
conditionEs: Vertical Young's modulus obtained by static
measurementn: Poisson's ratio
REFERENCES
1) AnhDan, L. Q., Koseki, J. and Sato, T. (2002): Comparison ofYoung's moduli of dense sand and gravel measured by dynamic andstatic methods, Geotechnical Testing Journal, ASTM, 25(4),349–368.
2) AnhDan, L. Q. and Koseki, J. (2004): EŠects of large number ofcyclic loading on deformation characteristics of dense granularmaterials, Soils and Foundations, 44(3), 115–123.
3) AnhDan, L. Q., Koseki, J. and Sato, T. (2006a): Evaluation ofquasi-elastic properties of gravel using a large scale true triaxial ap-paratus, Geotechnical Testing Journal, ASTM, 29(5), 374–384.
4) AnhDan, L. Q., Tatsuoka, F. and Koseki, J. (2006b): ViscouseŠects on the stress-strain behavior of gravelly soil in drained triaxi-al compression, Geotechnical Testing Journal, ASTM, 29(4),330–340.
5) Balakrishnaiyer, K., Koseki, J., Modoni, G., AnhDan, L. Q. andTatsuoka, F. (1998): Deformation characteristics at small strainlevels of dense gravel, Geotechnics of Hard Soils and Soft Rocks,eds. by Evangelista and Picarelli, Balkema, 1, 423–430.
6) Burmister, D. M. (1964): Environmental factors in soil compaction,Compaction of Soils, ASTM special technical publication (377),47–66.
7) Dong, J. and Nakamura, K. (1997): Anisotropic deformation andstrength characteristics of gravels in large-scale plane strain andtriaxial compression tests, Proc. 14th International Conference onSoil Mechanics and Foundation Engineering, Hamburg, 81–84.

644644 MAQBOOL AND KOSEKI
8) Goto, S., Tatsuoka, F., Shibuya, S., Kim, Y. S. and Sato, T.(1991): A simple gauge for local small strain measurements in thelaboratory, Soils and Foundations, 31(1), 169–180.
9) Hayano, K., Koseki, J., Sato, T. and Tatsuoka, F. (1999): Smallstrain deformation characteristics of sedimentary soft mudstonefrom true triaxial tests, Pre-failure Deformation Characteristics ofGeomaterials, eds. by Jamiolkowski, Lancellotta and Lo Presti, 1,191–198.
10) Holtz, W. G. and Gibbs, H. J. (1956): Triaxial shear tests on pervi-ous gravelly soils, Journal of Soil Mechanics and Foundation Divi-sion, Proc. of ASCE, 82(SM1), 1–22.
11) Holtz, W. G. and Ellis, W. (1963): Comparison of the shearstrengths of laboratory- and ˆeld-compacted soils, LaboratoryShear Testing of Soils, ASTM special technical publication (361),471–480.
12) Jiang, G. L., Tatsuoka, F., Flora, A. and Koseki, J. (1997): Inher-ent and stress-state-induced anisotropy in very small strain stiŠnessof a sandy gravel, Geotechnique, 47(3), 509–521.
13) Kohata, Y., Jiang, G. L., Murata, O. and Tatsuoka, F. (1999):Elastic-properties-based modeling of non-linear deformation char-acteristics of gravels, Pre-failure Deformation Characteristics ofGeomaterials, eds. by Jamiolkowski, Lancellotta and Lo Presti, 1,533–539.
14) Kokusho, T. and Esashi, Y. (1981): Cyclic triaxial tests on sandsand coarse materials, Proc. 10th International Conference on SoilMechanics and Foundation Engineering, Stockholm, 1, 673–676.
15) Koseki, J., Tateyama, M., Watanabe, K. and Nakajima, S. (2007):Stability of earth structures against high seismic loads, KeynoteLecture, Proc. 13th Asian Regional Conference on Soil Mechanicsand Geotechnical Engineering, Kolkata, 2, 222–241.
16) Maqbool, S. (2005): EŠect of compaction on strength and deforma-tion properties of gravel in triaxial and plane strain compressiontests, PhD thesis, Department of Civil Engineering, The Universityof Tokyo, Japan.
17) Maqbool, S. and Koseki, J. (2007): Large-scale plane strain com-pression tests on compacted gravel with active and passive controls,Soils and Foundations, 47(6), 1063–1073.
18) Marachi, N. D., Chan, C. K., Seed, H. B. and Duncan, J. M.
(1969): Strength and deformation characteristics of rockˆll materi-als, Report No. TE-69-5, Department of Civil Engineering, Univer-sity of California, Berkeley, 139.
19) Marachi, N. D., Chan, C. K. and Seed, H. B. (1972): Evaluation ofproperties of rockˆll materials, Journal of Soil Mechanics andFoundation Division, Proc. of ASCE, 98(SM1), 95–114.
20) Marsal, R. (1967): Large scale testing of rockˆll materials, Journalof Soil Mechanics and Foundation Division, Proc. of ASCE,93(SM2), 27–43.
21) Massarsch, K. R. and Fellenius, B. H. (2002): Vibratory compac-tion of coarse-grained soils, Canadian Geotechnical Journal, 39(3),695–709.
22) Okuyama Y., Yoshida, T., Tatsuoka, F., Koseki, J., Uchimura,T., Sato, N. and Oie, M. (2003): Shear banding characteristics ofgranular materials and particle size eŠects on the seismic stability ofearth structures, Deformation Characteristics of Geomaterials, eds.by Di Benedetto, Doanh, GeoŠroy and Sauzeat, 1, 607–616.
23) Santamarina, J. C. (2001): Soils and Waves, John Wiley & Sons,Ltd., 194–195.
24) Tanaka, Y., Kudo, K., Nishi, K., Okamoto, T., Kataoka, T. andUeshima, T. (2000): Small strain characteristics of soils in Hualien,Taiwan, Soils and Foundations, 40(3), 111–125.
25) Tatsuoka, F., Yamada, K., Yasuda, M., Yamada, S. and Manabe,S., (1991): Cyclic undrained behavior of an undisturbed gravel foraseismic design of a bridge foundation, Proc. 2nd InternationalConference on Recent Advances in Geotechnical Earthquake En-gineering and Soil Dynamics, St. Louis, 1, 141–148.
26) Tatsuoka, F. and Shibuya, S. (1992): Deformation characteristicsof soils and rocks from ˆeld and laboratory tests, Proc. 9th AsianRegional Conference of Soil Mechanics and Foundation Engineer-ing, Bangkok, 2, 101–170.
27) Tatsuoka, F. and Kohata, Y. (1995): StiŠness of hard soils and softrocks in engineering applications, Pre-failure Deformation of Geo-materials, eds. by Shibuya, Mitachi and Miura, 2, 947–1066.
28) Yasuda, N. and Matsumoto, N. (1994): Comparisons of deforma-tion characteristics of rockˆll materials using monotonic and cyclicloading laboratory tests and in situ tests, Canadian GeotechnicalJournal, 31(3), 162–174.