Large-scale physical modelling of wave damping of ...publications.deltares.nl/1202393_005.pdfJuly...
89
Large-scale physical modelling of wave damping of brushwood mattresses
Transcript of Large-scale physical modelling of wave damping of ...publications.deltares.nl/1202393_005.pdfJuly...

Large-scale physical modelling of wave damping of brushwood mattresses


Large-scale physical modelling of wave damping of brushwood mattresses
© Deltares, 2011
ir. P. Steeg dr. B.K. Wesenbeeck


July 2011, final
Large-scale physical modelling of wave damping of brushwood mattresses i
Contents
List of Tables v
List of Figures vii
List of Photographs ix
List of Symbols xi
1 Introduction 11.1 General 11.2 Background 11.3 Outline 2
2 Theoretical background 3
3 Physical model tests 53.1 Test set-up 5
3.1.1 Test facility 53.1.2 Coordinate system 53.1.3 General test set-up 5
3.2 Materials 63.2.1 Dimensions of matresses 63.2.2 Fixation of mattresses 6
3.3 Instrumentation: wave measurements 63.4 Hydraulic conditions and test programme 83.5 Description and visual observation 8
3.5.1 Test Series 200 (w = 12 m) 83.5.2 Test Series 300 (w = 4 m) 93.5.3 Test Series 600 (no mattresses) 9
3.6 Results: wave measurements 9
4 Analysis 114.1 Wave height exceedance curves and energy density spectra 114.2 Transmission coefficient 124.3 Prediction of transmission, reflection and dissipation coefficient 154.4 Summary prediction model 164.5 Restrictions of wave damping prediction model 174.6 Example of using prediction model 174.7 Strength aspects 18
5 Conclusions and recommendations 195.1 Conclusions 195.2 Recommendations 19
5.2.1 Wave damping characteristics 195.2.2 Other engineering aspects: strength and anchorage 20
6 References 21

ii
July 2011, final
Large-scale physical modelling of wave damping of brushwood mattresses

July 2011, final
Large-scale physical modelling of wave damping of brushwood mattresses iii
Appendices
A Tables
B Figures
C Photographs
D Exceedance curves and energy density spectra
E Theoretical background: determination of reflected, transmitted and dissipated wave energy
F Theoretical derivation of
G Theoretical determination of dissipation coefficient Cdiss
H Calculation tool


July 2011, final
Large-scale physical modelling of wave damping of brushwood mattresses v
List of Tables
In text
Table 3.1 Overview test series 5
Table 3.2 Overview of wave conditions (target values) for test series T200 (w = 12 m) 8
Table 3.3 Overview of wave conditions (target values) for test series T300 (w = 4 m) 8
Table 3.4 Overview of wave conditions (target values) for test series T600 (no mattresses) 8
Table 4.1 Overview of comparison of wave height exceedance curves and energy spectra 12
Table 4.2 Range of tested conditions 17
Table 4.3 Range of tested conditions (dimensionless) 17
Table 4.4 Hydraulic conditions of test case 17
Table 4.5 Mattress conditions of tests case 18
Table 4.6 Results of test case 18
Table 4.7 Warnings given for test case 18
In appendices
Table A.1 Measured wave conditions
Table A.2 Reflection, transmission and dissipation coefficients
Table A.3 Coordinates of all objects
Table A.4 Characteristics of mattresses
Table E.1 Overview determination incident, transmitted and reflected wave energy for an irregular wave field


July 2011, final
Large-scale physical modelling of wave damping of brushwood mattresses vii
List of Figures
In text
Figure 2.1 Classification of floating structures (after PIANC, 1994) 3
Figure 3.1 Overview test set-up 5
Figure 3.2 Schematisation of determination of the wave energy components 7
Figure 4.1 Wave spectra Test T204 (so,p = 0.02, Hs = 0.4 m) 11
Figure 4.2 Wave spectra Test T205 (so,p = 0.03, Hs = 0.4 m) 11
Figure 4.3 Wave spectra Test T202 (so,p = 0.04, Hs = 0.4 m) 11
Figure 4.4 Wave spectra Test T202 (Hs = 0.4 m, w = 12 m) 12
Figure 4.5 Wave spectra Test T302 (Hs = 0.4 m, w = 4 m) 12
Figure 4.6 Transmission coefficient Ct as function of Hm0 and as function of relative mattresslength w/Lp 13
Figure 4.7 Vertical energy distribution for shallow and deep water 13
Figure 4.8 Schematisation of object blocking a wave 13
Figure 4.9 Effect of wave and structure depth (derivation in Appendix F)) 14
Figure 4.10 Transmission coefficient as function of blocked wave energy BL 14
Figure 4.11 Transmission coefficient Ct as function of dimensionless parameter (w/Lp BL 15
Figure 4.12 Measured dissipation and reflection coefficients and derived trend line 15
Figure 5.1 Transmission coefficient Ct as function of mattress length w, wave length Lp and ratio of blocked wave energy BL 19

viii
July 2011, final
Large-scale physical modelling of wave damping of brushwood mattresses
In appendices
Figure B.1 Overview of test set-up
Figure B.2 Detail of mattresses
Figure B.3 Transmission, reflection and dissipation coefficient as function of significant wave height Hm0
Figure B.4 Transmission, reflection and dissipation coefficient as function of relative mattress length w/Lp
Figure B.5 Transmission, reflection and dissipation coefficient as function of (w/Lp BL
Figure D.1 Exceedance curve and energy density spectra for Test T201
Figure D.2 Exceedance curve and energy density spectra for Test T202
Figure D.3 Exceedance curve and energy density spectra for Test T204
Figure D.4 Exceedance curve and energy density spectra for Test T205
Figure D.5 Exceedance curve and energy density spectra for Test T203
Figure D.6 Exceedance curve and energy density spectra for Test T301
Figure D.7 Exceedance curve and energy density spectra for Test T302
Figure D.8 Exceedance curve and energy density spectra for Test T305
Figure D.9 Exceedance curve and energy density spectra for Test T308
Figure D.10 Exceedance curve and energy density spectra for Test T601
Figure D.11 Exceedance curve and energy density spectra for Test T603
Figure E.1 Schematisation of the model set-up for an irregular wave field
Figure F.1 Schematisation of fixed structure blocking wave energy
Figure G.1 Dissipation of energy on a porous segment
Figure G.2 Graphical presentation of dissipation coefficient based on Eq. (6.9)
Figure H.1 Impression of calculation tool (page 1/2)
Figure H.2 Impression of calculation tool (page 2/2)

July 2011, final
Large-scale physical modelling of wave damping of brushwood mattresses ix
List of Photographs
In appendices
Photo C.1 Construction of mattresses (1)
Photo C.2 Construction of mattresses (2)
Photo C.3 Mattresses after construction
Photo C.4 Mattresses during wave experiments
Photo C.5 Mattresses during wave experiment (2)
Photo C.6 Mattresses with a total length of 4 m
Photo C.7 Damage on mattresses after a test (1)
Photo C.8 Damage on mattresses after a test (2)


July 2011, final
Large-scale physical modelling of wave damping of brushwood mattresses xi
List of Symbols
Symbol Unit Description Bstr m width of structure Bfl m width of flume Cdiss - dissipation coefficient Cr - reflection coefficient Ct - transmission coefficient d m depth of structure under water D m height of structure Ediss N/m dissipated wave energy Ei N/m incident wave energy Er N/m reflected wave energy Et N/m transmitted wave energy f - coefficient f Hz frequency g m/s2 acceleration due to gravitational forces h water depth Hs m significant wave height based on spectral wave period k (rad/m) wave number Lflume m length of the flume Lp m local wave length based on Tp
Lo,p m wave length at deep water based on Tp
m kg mass n - number of individual mattresses N - number of waves in a wave field p - percentage of energy t s time Tp s peak wave period w m length of floating structure in the direction of the waves X m horizontal distance from the wave board in neutral position Y m horizontal distance from the western flume wall z m vertical distance from SWL (upward is positive)
- ratio between the transmitted and reflected wave energy = Ediss/Er
- peak enhancement factor of wave spectrum BL - ratio of blocked energy t ratio of transmitted energy

xii
July 2011, final
Large-scale physical modelling of wave damping of brushwood mattresses
Commonly used indexes
Symbol Description A index to relate the concerned parameter to waves travelling from
the wave board to the wall ARC Active reflection compensation of the wave board B index to relate the concerned parameter to reflected waves
travelling from the wall to the wave boardBL blocked wave energy bs breaking on smooth concrete 1:4 slope C index to relate the parameter to re-reflected waves travelling
from the floating structure to the wall diss dissipated fl flume i incident r reflected rr re-reflected t transmitted GHM wave height meter at seaward side of the mattresses WHM wave height meter at landward side of the mattresses 1 position: seaside of mattresses (or GHM 11,12, 13) 2 position: landward side of mattresses (or WHM 1, 2, 3)
July 2011, final
Large-scale physical modelling of wave damping of brushwood mattresses 1 of 21
1 Introduction
1.1 General Traditional gradients between land and water are disappearing in delta areas world wide. To realize safety from flooding building of hard structures such as levees, dams and dikes has become common practice along rivers, lakes and in coastal areas. In the Netherlands especially large fresh water lakes have lost their shallow water habitats and gradual transitions between land and water. Consequently, species that inhabit these zones are decreasing. Additionally, natural fluctuations in water level are often absent, making ecosystem dynamics of temporarily submerged wetlands impossible. This results in deterioration of these habitats. Wetland vegetation, submerged vegetation and filter feeders are not only of ecological importance but also play a decisive role in water purification and entrapment of suspended solids. This explains why construction of floating wetlands is becoming a popular restoration measure that is applied in open areas amidst natural wetlands areas, but also in urban areas.
In fresh water systems fixed water levels do not only have negative influences on the water system but also cause shoreline erosion, which affects management and maintenance of shorelines. To use floating wetlands for wave attenuation is a new and promising application. This application fits in other ecosystem based coastal protection measures that are being explored by Deltares under running Building with Nature or Eco-engineering projects. Multiple ecosystem services that can be combined by adopting such an approach make these solutions attractive and cost-efficient. Although Building with Nature solutions seem promising, quantitative data supporting their effectiveness is not always available. Especially on wave damping properties of biological elements in situ measurements are sparse.
Pilot experiments with using floating brushwood mattresses for establishment of reed were executed in 2009 in Lake Marken (the Netherlands). The aim was to protect shorelines from continuous impact of small waves and to create a sediment sink. However, the original design did not withstand field conditions and lost buoyancy within two months. Therefore, the mattresses were removed from the site sooner than anticipated. However, the original idea is still considered valuable and feasible. Therefore, the current study focuses on collection of wave damping properties of floating brushwood mattresses. This is tested in a large-scale flume facility with a range of wave conditions. Experiments and analyses were set up to provide general relationships between length and thickness of mattresses and their wave damping abilities. Deriving general relationships between wave characteristics and mattress properties will allow scaling up of results. This enables application of results to other situations, although testing of newly derived values and designs is still recommended to determine whether general relationships remain valid.
1.2 Background Within the Deltares research Theme “Water safety” of the Deltares Strategic Research program, several innovative concepts with respect to water retaining are studied. One of the aims of this research program is to explore wave damping aspects of ecological materials. In 2010, these explorations were started by exploring wave-damping properties of brushwood mattresses in large-scale flume facilities.
This report describes in detail the set-up and execution of large-scale physical model tests in the Deltares Delta Flume and subsequent data analyses.

2 of 21 Large-scale physical modelling of wave damping of brushwood mattresses
July 2011, final
The physical model tests were performed in the Delta Flume of Deltares under supervision of ir. P. van Steeg1 and Dr. B.K. van Wesenbeeck2 with assistance of mr. A. Scheer, mr. P.A. Wiersma, mr. L. Tulp and mr. J.H. Ouderling. Dr. B. Hofland contributed significantly with respect to derivation of design formulas. This report is written by ir. P. van Steeg and Dr. B.K. van Wesenbeeck and is reviewed by Dr. B. Hofland.
1.3 Outline Chapter 2 summarizes the theoretical background on wave damping by floating breakwaters. The model set-up is given in Chapter 3, followed by results, analysis of results and development of a prediction method in Chapter 4. Chapter 5 deals with main conclusions and recommendations on design of mattresses, applications and knowledge gaps.
1. Deltares, [email protected] 2. Deltares, [email protected]

July 2011, final
Large-scale physical modelling of wave damping of brushwood mattresses 3 of 21
2 Theoretical background
An analogy between floating wetlands and floating breakwaters is made concerning wave attenuation characteristics. In PIANC (1994), floating breakwaters are schematically divided into two groups:
• Reflective structures (reflect the wave energy) • Dissipative structures (dissipate the wave energy)
Figure 2.1 Classification of floating structures (after PIANC, 1994)
It should be realised that no floating structures exist that are only reflective or only dissipative. Distinction is only made to make understanding of the physics easier.
The main effect of reflective structures is to reflect incoming waves so that wave energy behind the structure is reduced (see also Figure 2.1). PIANC (1994) describes fixed structures and oscillating structures. Reflective structures can be divided in an infinitely thin screen (no width or w = 0) and a body with a certain width (w > 0). Examples of reflecting structures are pontoons or floating breakwaters.
Dissipative systems dissipate wave energy through viscous, or turbulent, effects. PIANC (1994) divides the dissipative systems in two types, surface systems and turbulence generators. The dissipative systems influence wave propagation in at least three ways:
1 Their mass and inertia induce a first attenuation, as the reflective systems do; 2 They form a semi flexible sheet, which tends to follow fluctuation of the water surface.
Provided wave lengths are short enough and the rigidity of the structure is high enough so that restoring forces may be important, this sheet will limit surface vertical displacements;
3 Their porosity generates drag forces, which contribute to energy losses.
Examples of surface systems are floating breakwaters made of car tyres (Volker et. al. 1979).
Besides the wave damping aspects, mooring forces are considered as important parameters since forces on mooring systems and the floating structure itself are large. Mooring forces are described in Van den Linden (1985) and PIANC (1994).
Brushwood mattresses resemble dissipating surface systems. This has implications to the type of modelling.
EiEr Et
Ei EdissEt
Reflective structure Dissipative structure


July 2011, final
Large-scale physical modelling of wave damping of brushwood mattresses 5 of 21
3 Physical model tests
3.1 Test set-up
3.1.1 Test facility Physical model tests were carried out in the Delta Flume of Deltares. The flume has a width of 5.0 m, a height of 7.0 m and an overall length of 240 m. In this flume waves can be generated, up to a significant wave height (Hs) of 1.5 m.
3.1.2 Coordinate system In this report, a coordinate system is used as follows:
X = distance from the wave board in neutral position (m) Y = distance from the western flume wall (m)
3.1.3 General test set-up The wave board is located at X = 0.0 m. A 1:4 smooth slope is located with the toe at X = 180 m. Three test series were performed. The difference between those test series is the length of the mattresses. An overview is given in Table 3.1.
Table 3.1 Overview test series Width of mattress, w (m)
Test Series 200 12 m Test Series 300 4 m Test Series 600 No mattress
The mattress of Test Series 200, which is described in Section 3.2, was placed from X = 57 m until X = 69 m. The mattress of Test Series 300, which is described in Section 3.2, was placed from X = 65 m until X = 69 m. Photographs of installing the mattresses are shown in Photo C.1, Photo C.2 and Photo C.3. Wave height meters, as described in Section 3.3, were placed in front (‘seaward side’) of the mattresses (at XGHM11 = 44.00 m, XGHM12 = 47.11 m and XGHM13 = 49.18 m) and behind (‘landward side’) the mattresses (at XWHM1 = 85.00 m, XWHM2 = 87.00 m and XWHM3 = 88.00 m). The water level in all test series was h = 4.00 m. An overview of the test set-up is given in Figure 3.1 and Figure B.1.
Figure 3.1 Overview test set-up
Waves, as described in Section 3.4, with incident wave energy (Ei), were generated at the wave board. The waves travel towards the wave height meters in front of the structure (GHM11, GHM12 and GHM13), and reach the mattress (indicated in Figure B.1 with M1, M2,…,M6). A part of the wave energy reflects directly (Er,A). This reflected wave energy is travelling from the mattress back towards the wave board, which absorbs returning wave energy with the Active Reflection Compensation System. The remainder of the wave energy
Wave board GHM11,12,13 WMH1,2,3 Wave damping slope
mattresses

6 of 21 Large-scale physical modelling of wave damping of brushwood mattresses
July 2011, final
(Ei-Er,A) is travelling through the mattress, which dissipates a part of this wave energy (Ediss,A). Resulting wave energy behind the mattress is transmitted wave energy (Et,A) which travels towards the wave height meters behind the mattress (WHM1, WHM2, WHM3) and towards the 1:4 smooth concrete slope. The slope reflects a part of this wave energy and resulting wave energy (Er,B) travels back in direction of the wave board and passes wave height meters WHM3, WHM2 and WHM1. Then, a part of this energy is re-reflected against the mattress (Er,C) and a part of this energy is dissipated in the mattress (Ediss,B). The resulting transmitted wave energy (Et,B) passes the wave height meters GHM13, GHM12 and GHM11 and is absorbed by the wave board. In the analysis it was assumed that re-reflected energy component Er,C can be neglected. How the several energy components were determined is described in Section 3.3.
3.2 Materials
3.2.1 Dimensions of matresses There is a long tradition in growth, harvesting and braiding of branches of willow trees for specific functions in hydraulic engineering. Braided brushwood mats are used for stabilizing foreshores underwater. However, these mattresses are known to remain buoyant for about two months, which can potentially make them suitable for initiation of floating wetlands. However, the current design should be adapted if buoyancy for longer periods is required. The used mattresses were fabricated by Van Schaik bv. The size of a single mattress was approximately 2.2 m x 4.0 x 0.45 m (Bstr x w x D). The average (wet) mass of one mattress was 367 kg. For Test Series 200, six mattress elements were used (Photo C4), for Test Series 300, two mattress elements were used (Photo C6). Geometric parameters were determined by hand measurements. An overview of dimensions of the mattresses is given in Table A.4, Figure B.1 and Figure B.2.
3.2.2 Fixation of mattresses The mattresses were fixed to each other by using strong ropes. In the first trial tests, this was done by connecting the joints that were located at the edges of the mattress element. This is indicated with blue lines in the lower picture of Figure B.2. However, forces on the ropes were too high and caused severe damage to the mattresses. Therefore, the design was adapted and mattresses were connected using the joints more in the middle of the mattress element. This is shown with the red lines in the lower picture of Figure B.2.
The mattresses were also fixated to the flume wall by ropes. In the first trial tests, the ropes were attached to the joints at the seaward side (side of waveboard) of the mattresses. This is indicated with the blue line in the lower picture of Figure B.2. However, this also resulted in damage to the mattresses. Therefore, ropes were attached to other joints as indicated with the red lines in the lower picture of Figure B.2.
3.3 Instrumentation: wave measurements Wave characteristics were measured by means of three wave gauges in front of the mattresses and three wave gauges behind the mattresses. The location of the wave gauges is given in Table A.3 . Wave gauges at the seaward side of the mattresses (GHM11, GHM12 and GHM13) are so-called mechanical wave-followers and they measure surface elevation of the water at a fixed location. Wave gauges at the landward side of the mattresses (WHM1, WHM2 and WHM3) are a pair of vertical wires at a fixed location. They determine surface elevation by measuring electrical resistance between the wires, which is a function of the water level.

July 2011, final
Large-scale physical modelling of wave damping of brushwood mattresses 7 of 21
To separate incident and reflected waves a cross-correlation technique was used as described by Mansard and Funke (1980). Signals from a set of three wave gauges were used to determine the following wave characteristics:
Hs = Hm0 significant wave height based on wave spectrum (m) Tp peak wave period (s) N number of waves (-)
so,p deepwater wave steepness , ,1, 2
2 s io p
p
Hs
gT (-)
Cr reflection coeffient (-) Ct transmission coeffient (-) Cdiss dissipation coeffient (-)
ratio between the dissipated and reflected energy diss
r
EE
(-)
p percentage of energy (%)
where the following indices are used:
1 location: at seaward side of mattresses (GHM 11, 12, 13) 2 location: at landward side of mattresses (WHM 1, 2, 3) r reflected wave rr re-reflected wave i incident wave A wave travelling from wave board through mattress towards slope B wave travelling from slope through mattress towards wave board C wave re-reflected against landward side of mattresses and travelling
from mattresses towards slope
Example: Hs,i,1 is the significant incident wave height at the seaward side of the mattresses (GHM11, GHM12 and GHM13)
Energy of waves is partly reflected by the structure (Er,A), partly dissipated (Ediss,A) and partly transmitted (Et,A). How this is determined is described in Appendix E and summarized in Figure 3.2.
Figure 3.2 Schematisation of determination of the wave energy components
Determination of relevant energy
contributions (based on Appendix E)
Separation of incident and reflected
waves (Mansard and Funke)
measurements
GHM11
GHM12
GHM13
WHM1
WHM2
WHM3
Ei,GHM11,12,13
Er,GHM11,12,13
Ei,A
Er,A
Ediss,A
Et,A
Er,B
Ei,B
Ediss,B
Et,B
Ei,WHM1,2,3
Er,WHM1,2,3

8 of 21 Large-scale physical modelling of wave damping of brushwood mattresses
July 2011, final
3.4 Hydraulic conditions and test programme For all test-runs, irregular waves (JONSWAP spectrum with a peak enhancement factor of = 3.3) were used. A test-run consisted of around N = 1000 waves. Variation between test-runs are realised by changing significant wave height (Hs) and / or wave steepness (so,p). The water depth was h = 4.0 m during all tests. An overview of target wave conditions is given in Table 3.2, Table 3.3 and Table 3.4.
Table 3.2 Overview of wave conditions (target values) for test series T200 (w = 12 m) so,p = 0.02 so,p = 0.03 so,p = 0.04
Hs = 0.20 m - - T201Hs = 0.40 m T204 T205 T202Hs = 0.60 m - - T203
Table 3.3 Overview of wave conditions (target values) for test series T300 (w = 4 m) so,p = 0.02 so,p = 0.03 so,p = 0.04
Hs = 0.20 m - T308 T301Hs = 0.40 m - T305 T302Hs = 0.60 m - - -
Table 3.4 Overview of wave conditions (target values) for test series T600 (no mattresses) so,p = 0.02 so,p = 0.03 so,p = 0.04
Hs = 0.20 m - - T601Hs = 0.40 m - - -Hs = 0.60 m - - T603
The test programme with measured wave conditions is given in Table A.1.
3.5 Description and visual observation
3.5.1 Test Series 200 (w = 12 m) During the first trial tests, severe damage to the mattresses was observed. Adaptations as described in Section 3.2.2 were applied to avoid more damage to the mattresses. Due to the damage, willow branches at the landward side of mattresses M1, M2, M3 and M4 (see Figure B.2 of Appendix B) came out of the structure. During following test-runs, these branches were still trapped in between mattresses as can be seen in Appendix C (Photo C.7).
It was clearly visible that individual mattresses could move independently from each other in a vertical direction (the mattresses together cannot be considered as one ‘stiff’ element). No significant bending of a single mattress was observed.
During the test-runs with steeper waves some wave breaking at the seaward side of the mattresses was observed.
It was visually observed that a wave that rolled into the mattresses resulted in some turbulence. No reflection of waves against the mattress was visually observed. For tests with shorter waves, it could clearly be seen that the transmitted wave height was significantly lower than the incident wave height. The wave crest was clearly a straight line and perpendicular to the flume wall. No ‘side effects’ due to the open area between the mattresses and the flume wall were visible. The transmitted waves broke as plunging waves

July 2011, final
Large-scale physical modelling of wave damping of brushwood mattresses 9 of 21
on the 1:4 smooth concrete slope. No reflecting wave energy from the slope was visually observed.
3.5.2 Test Series 300 (w = 4 m) Test Series 300 was performed with two individual mattresses resulting from Test Series 200. (Photo C.6). The loose branches as describes in Section 3.5.1 were not trapped in between the individual mattresses anymore and came loose, as can be seen in Photo C.8.
A wave that rolled into a mattress resulted visibly in turbulence. The transmitted wave height was lower than the incident wave height although this was less intense than in Test Series T200. All other aspects, such as wave breaking at the seaward side of the mattress, perpendicularity of the wave crest, side effects and reflection were the same as for Test Series T200.
3.5.3 Test Series 600 (no mattresses) Some wave breaking (white capping) was observed during Test Series T600.
3.6 Results: wave measurements An overview of measured wave conditions is given in Table A.1. Derived transmission, dissipation and reflection coefficients as described in Appendix E are given in Table A.2. Wave height exceedance curves and energy density spectra are given in Appendix D.


July 2011, final
Large-scale physical modelling of wave damping of brushwood mattresses 11 of 21
4 Analysis
4.1 Wave height exceedance curves and energy density spectra Wave height exceedance curves and wave energy density spectra of all test-runs are given in Appendix D. In general these curves are used to determine distribution of occurring wave heights and to detect outliers. Shown curves all show similar patterns that resemble natural wave fields. In the following analysis, a comparison between three test-runs where significant wave height (Hs) is the same but where wave steepness (so,p) differs will be made based on energy density spectra. Energy density spectra of Test T204 (so,p = 0.02), Test T205 (so,p = 0.03) and Test T202 (so,p= 0.04) are displayed in Figure 4.1, Figure 4.2 and Figure 4.3.
Figure 4.1 (so,p = 0.02, relatively long waves) shows that the wave spectrum at seaward side and landward side of the mattress is almost the same. Some reduction occurred at higher frequencies, approximately at f > 0.3 Hz. In Figure 4.3 (so,p = 0.04, relatively short waves) it can be seen that the wave energy is reduced over almost the whole frequency domain (lower limit of frequency domain is approximately f = 0.3 Hz). In Figure 4.2 (so,p = 0.03) a reduction of wave energy can be seen as well. Also in this graph reduction starts at approximately f = 0.3 Hz.
Figure 4.1 Wave spectra Test T204 (so,p = 0.02, Hs = 0.4 m)
Figure 4.2 Wave spectra Test T205 (so,p = 0.03, Hs = 0.4 m)
Figure 4.3 Wave spectra Test T202 (so,p = 0.04, Hs = 0.4 m)

12 of 21 Large-scale physical modelling of wave damping of brushwood mattresses
July 2011, final
Test-runs with same hydraulic conditions but different mattress lengths are compared as well. An overview of comparable test runs is given in Table 4.1.
Table 4.1 Overview of comparison of wave height exceedance curves and energy spectra Test Figure Wave height
Hs (m) Wave steepness
so,p (-)Mattress length
w (m) T201 vs. T301 Fig. D.1 / D.6 0.20 0.04 12 / 4T202 vs. T302 Fig. D.2 / D.7 0.40 0.04 12 / 4T205 vs. T305 Fig. D.4 / D.8 0.40 0.03 12 / 4
As an example, Test T202 (w = 12 m) and Test T302 (w = 4 m) are shown in Figure 4.4 and Figure 4.5.
Mattresses with a length (w) of 12 m influence the wave spectrum at a frequency of approximately f > 0.3 Hz, the mattresses with a length of w = 4 m influence the wave spectrum at a higher frequency of around f > 0.35 Hz.
From the above it can be concluded that the length of the mattresses w and the length of the waves L, have a significant influence on the wave damping. A shorter wave is dissipated more than a longer wave. A longer mattress will dissipate more wave energy than a shorter mattress.
Figure 4.4 Wave spectra Test T202 (Hs = 0.4 m, w = 12 m)
Figure 4.5 Wave spectra Test T302 (Hs = 0.4 m, w = 4 m)
4.2 Transmission coefficient Transmission coefficient Ct as function of significant wave height Hm0 is displayed in Figure 4.6. Transmission coefficient Ct as function of significant wave height Hm0 shows scatter for five measurement points around Hs 0.4 m. Differences between these specific tests is difference in length of mattress w (4 m; 12 m) and wave steepness so,p (0.02; 0.03; 0.04) or wave length. To account for length of mattress and wavelength, transmission coefficient Ct is plotted as function of ratio of length of mattress and local wavelength w/Lp in right panel of Figure 4.6. For each single mattress length, scatter decreased compared to the left panel of Figure 4.6.

July 2011, final
Large-scale physical modelling of wave damping of brushwood mattresses 13 of 21
0.0
0.2
0.4
0.6
0.8
1.0
0.0 0.1 0.2 0.3 0.4 0.5 0.6 0.7
wave he ight, H m0 (m)
brushwood mat tress, w = 4 m
brushwood mat tress, w = 12 m0.0
0.2
0.4
0.6
0.8
1.0
0.0 0.5 1.0 1.5 2.0 2.5 3.0
re lative length w /L p (-)
brushwood mat t ress, w = 4 m
brushwood mat t ress, w = 12 m
Figure 4.6 Transmission coefficient Ct as function of Hm0 and as function of relative mattress length w/Lp
Between Test Series T200 (w = 12 m) and Test Series T300 (w = 4 m) a difference in transmission coefficient Ct was found (see right panel of Figure 4.6). This is firstly explained by differences length of mattress w. However, when dimensionless length of mattress w/Lp is kept constant, transmission coefficient Ct between Test Series T200 and Test Series T300 still differ. This is explained by the relative thickness of mattresses. Both mattresses of 4 m and 12 m have a thickness under water d of around 0.30 m. This implies that mattresses of Test Series T300 (w = 4 m) are relatively three times thicker than those of Test Series T200 (w = 12 m). It is very likely that, for each given value of w/Lp, a relatively thicker mattress will dissipate more wave energy. This explains the transmission coefficient of Test Series T300, which is lower than the transmission coefficient of Test Series T200.
To compensate for thickness of mattress, relative thickness should be included in the dimensionless parameter displayed on horizontal axis of Figure 4.6. This is quite complicated due to the non-uniform distribution of the wave energy over the water depth. With relatively shallow water (kh << 1 where k is wave number (k = 2 /Lp)), wave energy is uniformly distributed over water depth. With relatively deep water (kh > 1), this is not the case, see Figure 4.7.
Figure 4.7 Vertical energy distribution for shallow and deep water
Figure 4.8 Schematisation of object blocking a wave
shallow kh << 1
transition kh = O(1)
z = -h
z = 0
deep kh > 1
uhor,max uhor,max uhor,max
z = 0
z = -h
z = -d
Wave with
• Wave number k (rad/m)
• Amplitude a (m)
• Frequency (rad/s)
Etransmitted Eincident
Eblocked
Etransmitted

14 of 21 Large-scale physical modelling of wave damping of brushwood mattresses
July 2011, final
Attenuation of wave energy as a function of ratio of water depth to wavelength h/Lp and ratio of water depth to protrusion depth of mattress d/h is shown in the left panel of Figure 4.9. A theoretical derivation of this figure is given in Appendix F. Ratio of blocked wave energy is noted with BL, ratio of energy passing underneath the structure is noted with t.
0.0
0.10.2
0.30.4
0.50.6
0.70.8
0.91.0
0 0.2 0.4 0.6 0.8 1BL (-)
0.0
0.1
0.2
0.3
0.4
0.5
0.6
0.7
0.8
0.9
1.0
0 0.2 0.4 0.6 0.8 1t (-)
Figure 4.9 Effect of wave and structure depth (derivation in Appendix F))
Ratio of blocked energy BL can be expressed by:
sinh 2 sinh 2 ( ) 2sinh 2 2BL
kh k h d kdkh kh
(4.1)
Where
k = wave number (= 2 /Lp) [rad/m] h = water depth at structure [m] d = protrusion depth of structure [m]
BL = ratio of energy at structure [-]
Eq. (4.1) is derived in Appendix F. This schematization assumes no vertical movement of tested mattresses. Although this is not the case for this test set-up, it might serve as a good first guess. With Eq. (4.1), BL is determined for each individual test and presented in Figure 4.10. Values of h/Lp, d/h and BL are given in Table A.1.
0.0
0.2
0.4
0.6
0.8
1.0
0.0 0.1 0.2 0.3 0.4 0.5 0.6 0.7 0.8 0.9 1.0
BL(-)
brushwood matt ress, w = 4 mbrushwood matt ress, w = 12 m
Figure 4.10 Transmission coefficient as function of blocked wave energy BL
Now it is possible to correct dimensionless parameter w/Lp with ratio of blocked wave energy BL, which is shown in Figure 4.11. It can be seen that scatter of data is very low.
h/Lp = 1.00
0.100.20
0.400.30
h/Lp = 0.10
1.00
0.200.30
0.40

July 2011, final
Large-scale physical modelling of wave damping of brushwood mattresses 15 of 21
0.0
0.2
0.4
0.6
0.8
1.0
0.0 0.2 0.4 0.6 0.8 1.0 1.2 1.4R = BL
w /L p (-)
brushwood mattress, w = 4 m
brushwood mattress, w = 12 m
trendline brushwood
Figure 4.11 Transmission coefficient C t as function of dimensionless parameter (w/Lp BL
4.3 Prediction of transmission, reflection and dissipation coefficient In Figure B.3, Figure B.4 and Figure B.5, it can be seen that reflection coefficient Cr is approximately constant for all tests. Therefore, reflection coefficient Cr is defined by:
0.1rC (4.2)
In top panels of Figure B.3, Figure B.4 and Figure B.5, dissipation coefficient Cdiss,A is shown. Data collapse of dissipation coefficient Cdiss,A significantly increases when using dimension-less parameter (w/Lp) BL. Based on analysis given in Appendix G, Eq. (4.3) is used as a starting point for determination a fitting line:
1 fxdissC e (4.3)
with x chosen as:
BLp
wxL
(4.4)
gives
1BL
p
wfL
dissC e (4.5)
f is chosen as 2.4 which gives the best fit. Result of measured dissipation coefficient and trend line based on Eq. (4.5) and f = 2.4 is given in Figure 4.12.
0.0
0.2
0.4
0.6
0.8
1.0
0.0 0.2 0.4 0.6 0.8 1.0 1.2 1.4R =
BLw /L
p (-)
brushwood mat t ress, w = 4 mbrushwood mat t ress, w = 12 mtrendline brushwood
0.0
0.2
0.4
0.6
0.8
1.0
0.0 0.2 0.4 0.6 0.8 1.0 1.2 1.4R =
BLw /L
p (-)
brushwood matt ress, w = 4 mbrushwood matt ress, w = 12 mtrendline brushwood
Figure 4.12 Measured dissipation and reflection coefficients and derived trend line
Now transmission coefficient Ct can be derived by

16 of 21 Large-scale physical modelling of wave damping of brushwood mattresses
July 2011, final
2 21t diss rC C C (4.6)
Rewriting gives:
2BL
p
wfL
t rC e C (4.7)
Resulting trend line based on Eq. (4.7) with f = 2.4 and Cr = 0.1 is given in Figure 4.11.
4.4 Summary prediction model To predict wave transmission through brushwood mattresses, following equations are suggested:
Wave number 2
p
kL
(4.8)
Blocked energy ratio sinh 2 sinh 2 ( ) 2sinh 2 2BL
kh k h d kdkh kh
(4.9)
Dissipation coefficient 1BL
p
wfL
dissC e with f = 2.4 (4.10)
Reflection coefficient 0.1rC (4.11)
Transmission coefficient 2BL
p
wfL
t rC e C (4.12)
Transmitted wave height 0, 0,m t t m iH C H (4.13)
With
Cdiss = dissipation coefficient [-]Cr = reflection coefficient [-]Ct = transmission coefficient [-]d = water depth [m] f = coefficient, = 2.4 [-]h = depth of structure under water [m] Hm0,t = transmitted significant wave height [m] Hm0,i = incident significant wave height [m] k = wave number [rad/m] Lp = local peak wave length [m] w = length of structure [m]
BL = wave energy blocking ratio [-]
First, wave number k is determined with use of Eq. (4.8) which served as input for determination of blocking wave energy ratio parameter BL with use of Eq. (4.9). Now transmission coefficient Ct and transmitted wave height Hm0,t can be determined using Eq. (4.12) and Eq. (4.13).

July 2011, final
Large-scale physical modelling of wave damping of brushwood mattresses 17 of 21
4.5 Restrictions of wave damping prediction model In previous sections a calculation method is given. This method is based on the assumption that drag forces generated by porosity of structure, which contribute to energy losses wave, cause wave damping (dissipative system as described in Chapter 2).
When using this prediction model one should realize that the theoretical model as described is based on empirical data where: 1. Anchoring / mooring did not play a significant role with respect to wave damping. If
anchors will be applied, actual wave damping effect is assumed to be higher than the model predicts. Anchor forces might, however, also lead to more damage to the mattresses.
2. There was no significant stiffness in the mattresses implying that the mattresses had no significant restoring force. Restoring forces might increase wave damping characteristics. If restoring forces are significant, (e.g. mattresses are stiffly connected or one large mattress was used) actual damping wave damping effect might be higher than the model predicts.
3. Porosity did not significantly change during test series. In actual situation porosity characteristics might change due to degradation or biological activity. It is not clear what influence of porosity is with respect to wave damping characteristics.
4. Data has a limited range. The range of tested parameters is given in Table 4.2. Relevant dimensionless parameters are given in Table 4.3.
Table 4.2 Range of tested conditions Parameter range water depth h = 4.00 m mattress depth under water d = 0.3 m mattress length 4 m w 12 m wave length 5.0 Lp 17.6 significant wave height 0.20 Hs 0.60 m
Table 4.3 Range of tested conditions (dimensionless) Parameter range ratio mattress length and wave length 0.3 w/Lp 2.4 ratio mattress depth and water depth d/h = 0.075 ratio water depth and wave length 0.2 h/Lp 0.8 wave steepness based on deep water peak period 0.021 so,p 0.042 wave steepness based on local water peak period 0.024 sp 0.044 ratio blocked wave energy 0.2 BL 0.5
4.6 Example of using prediction model An example, which illustrates how to use the prediction method as given in this report, is given below. Required hydraulic and geometric input conditions are given in Table 4.4 and Table 4.5. Results and warnings are given in Table 4.6 and Table 4.7.
Table 4.4 Hydraulic conditions of test case parameter value
water depth h 6.0 m significant wave height Hm0 1.0 m local peak wave length Lp 33.3 m

18 of 21 Large-scale physical modelling of wave damping of brushwood mattresses
July 2011, final
Table 4.5 Mattress conditions of tests case parameter value
thickness (under water) d 0.60 m length of mattress w 100 m
Table 4.6 Results of test case parameter equation result
wave number k (4.8) 0.19 rad/m energy blocking ratio BL (4.9) 0.173 transmission coefficient Ct (4.12) 0.53 transmitted wave height Hmo,tr (4.13) 0.53 m
Table 4.7 Warnings given for test case parameter warning
ratio mattress length and wave length w/Lp Outside range of tested conditions ratio mattress depth and water depth d/h Outside range of tested conditionsratio water depth and wave length h/Lp Outside range of tested conditionsRatio blocked wave energy BL Outside range of tested conditions
Appendix H gives an impression of the developed calculation tool.
4.7 Strength aspects Focus of this research project was on wave damping aspects of brushwood mattresses. However, it was observed that some damage occurred to brushwood mattresses during the test program. When constructing a prototype mattress, attention should be paid to constructional details of the mattress.
To keep the mattress at its place anchorage is required. This anchorage will give large forces on the mattresses. For several types of floating breakwaters this anchor forces are very high and might lead to damage.

July 2011, final
Large-scale physical modelling of wave damping of brushwood mattresses 19 of 21
5 Conclusions and recommendations
5.1 Conclusions To obtain a first quantification of wave damping properties of floating wetlands a prediction tool based on large-scale flume experiments and based on a theoretical approach is developed. Mattress characteristics (depth under water d and mattress length w) and hydraulic characteristics (water depth h and wavelength Lp) are identified as important parameters with respect to wave damping. Results are summarized in Figure 5.1 and Eq. (5.1) and Eq. (5.2).
0.0
0.2
0.4
0.6
0.8
1.0
0.0 0.2 0.4 0.6 0.8 1.0 1.2 1.4R = BLw /L p (-)
brushwood matt ress, w = 4 m
brushwood matt ress, w = 12 m
trendline brushwood
0.0
0.10.2
0.3
0.4
0.5
0.6
0.7
0.8
0.91.0
0 0.2 0.4 0.6 0.8 1BL (-)
Figure 5.1 Transmission coefficient Ct as function of mattress length w, wave length Lp and ratio of blocked wave energy BL
sinh 2 sinh 2 ( ) 2( , , )sinh 2 2BL
kh k h d kdk h dkh kh
(5.1)
2BL
p
wfL
t rC e C (5.2)
Where f = 2.4 is empirical derived and reflection coefficient Cr = 0.1
Measured transmission coefficient Ct varied between 0.25 and 0.90. Tested conditions are summarized in Table 4.2 and Table 4.3 and indicated the validation range of the prediction model.
Several theoretical wave-damping mechanisms, such as reflection, restoring forces due to stiffness of mattress and turbulence are discussed. For all tests, reflection coefficient Cr was approximately 0.1. It is very likely that significant wave-damping physical process in this test set-up is mainly determined by turbulence and less by reflections or restoring forces (no significant bending of mattress as a whole was possible due to type of connection of individual elements).
5.2 Recommendations
5.2.1 Wave damping characteristics A first estimate of wave damping characteristics can be made based on results of this study. However, caution should be taken when up scaling the results to field situations. It is strongly recommended to test a larger range (longer elements and larger waves, other water depths)
h/Lp = 1.0
h/Lp = 0.10
0.90
0.80

20 of 21 Large-scale physical modelling of wave damping of brushwood mattresses
July 2011, final
in a large-scale flume before applying this in a prototype situation. (example: physical experiment with a mattress length (w) of 50 m and a depth under water (d) of 0.60 m with wave heights between Hs = 0.40 m and Hs = 1.30 m, with varying depths).
5.2.2 Other engineering aspects: strength and anchorage The focus of this study was primarily on wave damping characteristics. However, during testing, several problems with respect to strength of mattresses occurred. Although this could be solved relatively easily with tie-wraps or steel rope, it is strongly recommended to perform an additional analysis with respect to strength of mattresses and test new designs in physical models before applying them to the field.
When applying floating breakwaters, anchorage requires special attention. Anchorage is relevant with respect to wave damping. It is very likely that this will improve wave damping characteristics but might also give severe damage to mattresses. It is recommended to study this aspect (desk study / physical model) before applying brushwood mattresses on large scales in the field.

July 2011, final
Large-scale physical modelling of wave damping of brushwood mattresses 21 of 21
6 References
Lochner, R. Faber, O. and Penny, W., The Civil Engineer in War, Vol. 2, Docks and harbours,The institution of Civil engineers, London, England, 1948, pp, 256-290
Mansard, E.P.D. and Funke, E.R., 1980, The measurement of incident waves and reflected spectra using a least square method, 17th Int. Conf. of Coastal Engineering, Sydney.
PIANC, 1994, Floating Breakwaters, A practical Guide for design and construction”, report of working group no. 13 of the permanent Technical Committee II, supplement to bulletin No. 85 (1994), ISBN 2-87223-052-1
Van der Linden, M., 1985, Golfdempende constructies (in Dutch), Delftse Universitaire Pers, ISBN 90-6275-263-2 SISO 699.2 UDC 627-235
Volker, W., Harms, M. 1979, Design criteria for floating tire breakwaters, Journal of the waterway port coastal and ocean division, proceedings of the American Society of Civil Engineers, Vol. 105, No. WW2, May 1979


July 2011, final
Large-scale physical modelling of wave damping floating willow mattresses A
A Tables
Table A.1 Measured wave conditions
Table A.2 Reflection, transmission and dissipation coefficients
Table A.3 Coordinates of all objects
Table A.4 Characteristics of mattresses


Table A.1: Measured wave conditions
wat
er d
epth
str
uctu
ral l
engt
h
stru
ctur
al d
epth
inci
dent
wav
e he
ight
inci
dent
wav
e pe
riod
dee
p w
ater
wav
e le
ngth
wav
e le
ngth
wav
e nu
mbe
r
inci
dent
wav
e st
eepn
ess
nr.
of in
cide
nt w
aves
refle
cted
wav
e he
ight
inci
dent
wav
e he
ight
inci
dent
wav
e pe
riod
inci
dent
wav
e st
eepn
ess
nr.
of in
cide
nt w
aves
refle
cted
wav
e he
ight
dim
. wid
th
dim
. wav
e le
ngth
rela
tive
dept
h of
str
uctu
re
ene
rgy
bloc
king
ratio
ene
rgy
tran
smis
sion
ratio
dim
ensi
onle
ss p
aram
eter
h w d H s,i,1 T p,i,1 L o,p,i L p,i k s o,i,1 N i,1 H s,r,1 H s,i,2 T p,i,2 s o,i,2 N i,2 H s,r,2 w/L p,i L p,i/h d/h BL TR BL(w/L p,i) (m) (m) (m) (m) (s) (m) (m) (m) (-) (-) (m) (m) (s) (-) (-) (m) (-) (-) (-) (-) (-) (-)
T201 4.00 12.0 0.3 0.197 1.78 4.95 4.95 1.27 0.040 984 0.025 0.054 1.95 0.009 856 0.012 2.43 1.24 0.075 0.53 0.47 1.29T202 4.00 12.0 0.3 0.410 2.51 9.87 9.75 0.64 0.042 1101 0.047 0.267 2.53 0.027 966 0.027 1.23 2.44 0.075 0.31 0.69 0.38T204 4.00 12.0 0.3 0.419 3.56 19.78 17.61 0.36 0.021 1166 0.050 0.376 3.56 0.019 1058 0.042 0.68 4.40 0.075 0.16 0.84 0.11T205 4.00 12.0 0.3 0.419 2.89 13.06 12.58 0.50 0.032 1151 0.048 0.329 2.90 0.025 1006 0.033 0.95 3.14 0.075 0.24 0.76 0.22T203 4.00 12.0 0.3 0.612 3.09 14.89 14.06 0.45 0.041 1162 0.075 0.502 3.09 0.034 1024 0.048 0.85 3.52 0.075 0.21 0.79 0.18T301 4.00 4.0 0.3 0.199 1.80 5.07 5.06 1.24 0.039 979 0.024 0.110 1.86 0.020 912 0.017 0.79 1.27 0.075 0.52 0.48 0.41T302 4.00 4.0 0.3 0.406 2.52 9.91 9.79 0.64 0.041 1099 0.047 0.343 2.53 0.034 1003 0.034 0.41 2.45 0.075 0.31 0.69 0.12T305 4.00 4.0 0.3 0.418 2.88 12.94 12.48 0.50 0.032 1045 0.049 0.377 2.90 0.029 952 0.040 0.32 3.12 0.075 0.24 0.76 0.08T308 4.00 4.0 0.3 0.207 2.04 6.48 6.47 0.97 0.032 1026 0.023 0.141 2.07 0.021 941 0.016 0.62 1.62 0.075 0.44 0.56 0.27T601 4.00 0.0 0.0 0.196 1.79 4.99 4.99 1.26 0.039 986 0.024 0.189 1.79 0.038 987 0.020 0.00 1.25 0.000 0.00 1.00 0.00T603 4.00 0.0 0.0 0.601 3.09 14.86 14.04 0.45 0.040 1148 0.095 0.604 3.08 0.041 1128 0.085 0.00 3.51 0.000 0.00 1.00 0.00
basic parameters dimensionless parameters
Test
WHM's seaward side of matresses (GHM 11, 12, 13) WHM's landward side of matresses (WHM 1, 2, 3)
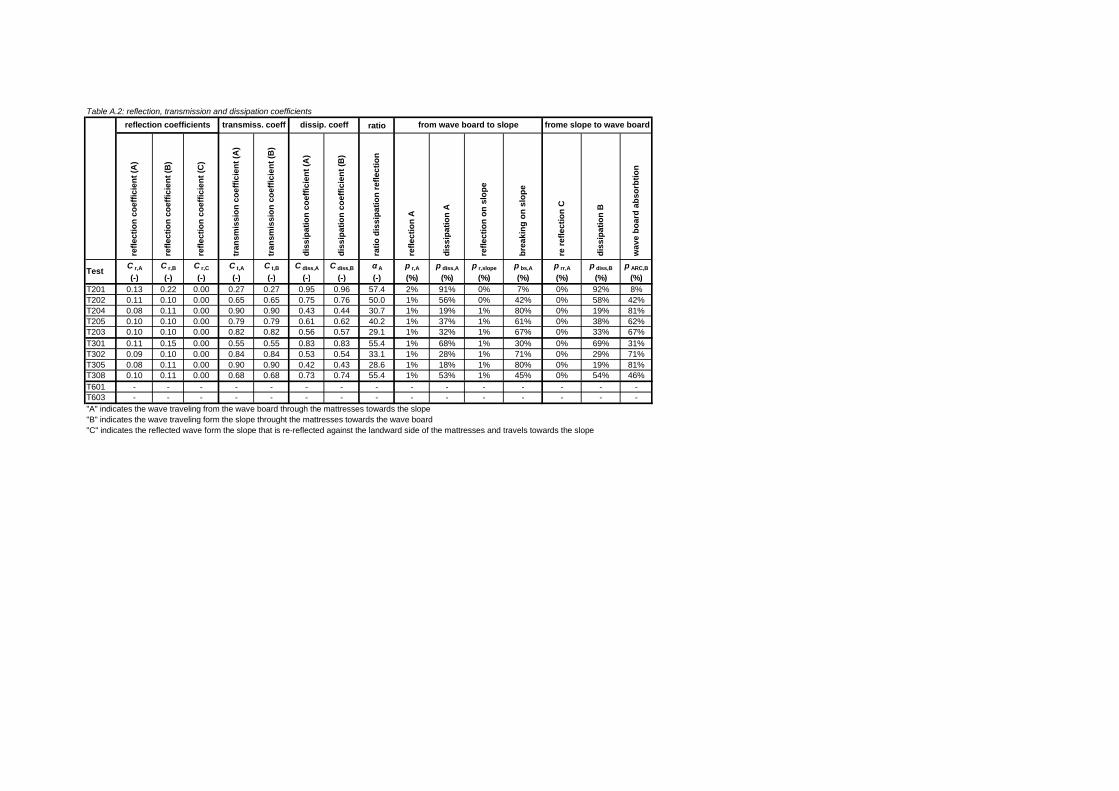
Table A.2: reflection, transmission and dissipation coefficients
ratio re
flect
ion
coef
ficie
nt (A
)
refle
ctio
n co
effic
ient
(B)
refle
ctio
n co
effic
ient
(C)
tran
smis
sion
coe
ffici
ent (
A)
tran
smis
sion
coe
ffici
ent (
B)
dis
sipa
tion
coef
ficie
nt (A
)
dis
sipa
tion
coef
ficie
nt (B
)
ratio
dis
sipa
tion
refle
ctio
n
refle
ctio
n A
dis
sipa
tion
A
refle
ctio
n on
slo
pe
bre
akin
g on
slo
pe
re re
flect
ion
C
dis
sipa
tion
B
wav
e bo
ard
abso
rbtio
n
C r,A C r,B C r,C C t,A C t,B C diss,A C diss,B A p r,A p diss,A p r,slope p bs,A p rr,A p diss,B p ARC,B
(-) (-) (-) (-) (-) (-) (-) (-) (%) (%) (%) (%) (%) (%) (%)T201 0.13 0.22 0.00 0.27 0.27 0.95 0.96 57.4 2% 91% 0% 7% 0% 92% 8%T202 0.11 0.10 0.00 0.65 0.65 0.75 0.76 50.0 1% 56% 0% 42% 0% 58% 42%T204 0.08 0.11 0.00 0.90 0.90 0.43 0.44 30.7 1% 19% 1% 80% 0% 19% 81%T205 0.10 0.10 0.00 0.79 0.79 0.61 0.62 40.2 1% 37% 1% 61% 0% 38% 62%T203 0.10 0.10 0.00 0.82 0.82 0.56 0.57 29.1 1% 32% 1% 67% 0% 33% 67%T301 0.11 0.15 0.00 0.55 0.55 0.83 0.83 55.4 1% 68% 1% 30% 0% 69% 31%T302 0.09 0.10 0.00 0.84 0.84 0.53 0.54 33.1 1% 28% 1% 71% 0% 29% 71%T305 0.08 0.11 0.00 0.90 0.90 0.42 0.43 28.6 1% 18% 1% 80% 0% 19% 81%T308 0.10 0.11 0.00 0.68 0.68 0.73 0.74 55.4 1% 53% 1% 45% 0% 54% 46%T601 - - - - - - - - - - - - - - -T603 - - - - - - - - - - - - - - -"A" indicates the wave traveling from the wave board through the mattresses towards the slope"B" indicates the wave traveling form the slope throught the mattresses towards the wave board"C" indicates the reflected wave form the slope that is re-reflected against the landward side of the mattresses and travels towards the slope
frome slope to wave boarddissip. coeff from wave board to slope
Test
reflection coefficients transmiss. coeff
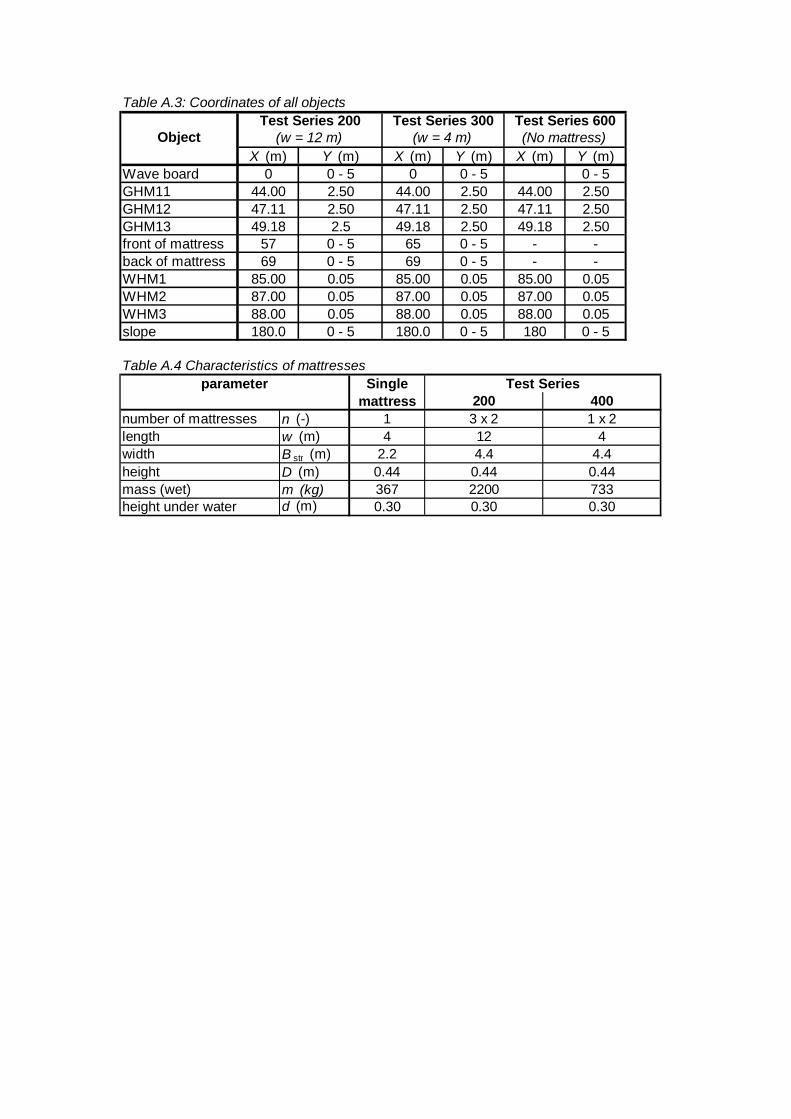
Table A.3: Coordinates of all objects
X (m) Y (m) X (m) Y (m) X (m) Y (m)Wave board 0 0 - 5 0 0 - 5 0 - 5GHM11 44.00 2.50 44.00 2.50 44.00 2.50GHM12 47.11 2.50 47.11 2.50 47.11 2.50GHM13 49.18 2.5 49.18 2.50 49.18 2.50front of mattress 57 0 - 5 65 0 - 5 - -back of mattress 69 0 - 5 69 0 - 5 - -WHM1 85.00 0.05 85.00 0.05 85.00 0.05WHM2 87.00 0.05 87.00 0.05 87.00 0.05WHM3 88.00 0.05 88.00 0.05 88.00 0.05slope 180.0 0 - 5 180.0 0 - 5 180 0 - 5
(w = 12 m) (w = 4 m) (No mattress)ObjectTest Series 200 Test Series 300 Test Series 600
Table A.4 Characteristics of mattresses
200 400number of mattresses n (-) 1 3 x 2 1 x 2length w (m) 4 12 4width B str (m) 2.2 4.4 4.4height D (m) 0.44 0.44 0.44mass (wet) m (kg) 367 2200 733height under water d (m) 0.30 0.30 0.30
Test Seriesparameter Single mattress

July 2011, final
Large-scale physical modelling of wave damping floating willow mattresses B
B Figures
Figure B.1 Overview of test set-up
Figure B.2 Detail of mattresses
Figure B.3 Transmission, reflection and dissipation coefficient as function of significant wave height Hm0
Figure B.4 Transmission, reflection and dissipation coefficient as function of relative mattress length w/Lp
Figure B.5 Transmission, reflection and dissipation coefficient as function of (w/Lp BL


Deltares 1200193-005 Fig. B.1
Overview of test set-up

Dimensions of matresses (overview)
Dimensions of matresses (detail)
Connection of matresses with ropes
Deltares 1200193-005 Fig. B.2
Detail of matresses

Deltares 1200193-005 Fig. B.3
Transmission, reflection and dissipation coefficient as function of the significant wave height H m0
0.0
0.1
0.2
0.3
0.4
0.5
0.6
0.7
0.8
0.9
1.0
0.00 0.10 0.20 0.30 0.40 0.50 0.60 0.70
wave height, H m0 (m)
tran
smis
sion
coe
ffici
ent C
t (-)
w = 12 mw = 4 m
0.0
0.1
0.2
0.3
0.4
0.5
0.6
0.7
0.8
0.9
1.0
0.00 0.10 0.20 0.30 0.40 0.50 0.60 0.70
wave height, H m0 (m)
refle
ctio
n co
effic
ient
Cr (
-)
w = 12 mw = 4 m
0.00.10.20.30.40.50.60.70.80.91.0
0.00 0.10 0.20 0.30 0.40 0.50 0.60 0.70
wave height, H m0 (m)
diss
ipat
ion
coef
ficie
nt C
diss
,A (-
)
w = 12 mw = 4 m

Deltares 1200193-005 Fig. B.4
Transmission, reflection and dissipation coefficient as function of the relative mattress length w /L p
0.0
0.1
0.2
0.3
0.4
0.5
0.6
0.7
0.8
0.9
1.0
0.0 0.5 1.0 1.5 2.0 2.5 3.0
relative length w /L p (-)
tran
smis
sion
coe
ffici
ent C
t (-)
w = 12 mw = 4 m
0.00.10.20.30.40.50.60.70.80.91.0
0.0 0.5 1.0 1.5 2.0 2.5 3.0
relative length w /L p (-)
refle
ctio
n co
effic
ient
Cr (
-) w = 12 mw = 4 m
0.00.10.20.30.40.50.60.70.80.91.0
0.0 0.5 1.0 1.5 2.0 2.5 3.0
relative length w /L p (-)
diss
ipat
ion
coef
ficie
nt C
diss
,A (-
)
w = 12 mw = 4 m

Deltares 1200193-005 Fig. B.5
Transmission, reflection and dissipation coefficient as function of the relative mattress length and vertical distribution of wave
energy (w /L p
0.0
0.1
0.2
0.3
0.4
0.5
0.6
0.7
0.8
0.9
1.0
0.0 0.2 0.4 0.6 0.8 1.0 1.2 1.4
R = BLw /L p (-)
tran
smis
sion
coe
ffici
ent C
t (-)
w = 12 mw = 4 m
0.00.10.20.30.40.50.60.70.80.91.0
0.0 0.2 0.4 0.6 0.8 1.0 1.2 1.4
R = BLw/Lp (-)
refle
ctio
n co
effic
ient
Cr (
-) w = 12 mw = 4 m
0.00.10.20.30.40.50.60.70.80.91.0
0.0 0.2 0.4 0.6 0.8 1.0 1.2 1.4
R = BLw /L p (-)
diss
ipat
ion
coef
ficie
nt C
diss
,A (-
)
w = 12 mw = 4 m


July 2011, final
Large-scale physical modelling of wave damping floating willow mattresses C
C Photographs
Photo C.1 Construction of mattresses (1)
Photo C.2 Construction of mattresses (2)
Photo C.3 Mattresses after construction
Photo C.4 Mattresses during wave experiments
Photo C.5 Mattresses during wave experiment (2)
Photo C.6 Mattresses with a total length of 4 m
Photo C.7 Damage on mattresses after a test (1)
Photo C.8 Damage on mattresses after a test (2)


Construction of mattresses (1)
Deltares 1200193-005 Fig. C.1

Construction of mattresses (2)
(Test Series 200)
Deltares 1200193-005 Fig. C.2

Mattresses after construction
(Test Series 200)
Deltares 1200193-005 Fig. C.3

Mattresses during wave experiments
(Test Series 200)
Deltares 1200193-005 Fig. C.4

Mattresses during wave experiment (2)
(Test Series 200)
Deltares 1200193-005 Fig. C.5

Matresses with a total length of 4 m
Test Series T300
Deltares 1200193-005 Fig. C.6

Damage on mattresses after a test (1)
Deltares 1200193-005 Fig. C.7

Damage on mattresses after a test (2)
Deltares 1200193-005 Fig. C.8

July 2011, final
Large-scale physical modelling of wave damping floating willow mattresses D
D Exceedance curves and energy density spectra
Figure D.1 Exceedance curve and energy density spectra for Test T201
Figure D.2 Exceedance curve and energy density spectra for Test T202
Figure D.3 Exceedance curve and energy density spectra for Test T204
Figure D.4 Exceedance curve and energy density spectra for Test T205
Figure D.5 Exceedance curve and energy density spectra for Test T203
Figure D.6 Exceedance curve and energy density spectra for Test T301
Figure D.7 Exceedance curve and energy density spectra for Test T302
Figure D.8 Exceedance curve and energy density spectra for Test T305
Figure D.9 Exceedance curve and energy density spectra for Test T308
Figure D.10 Exceedance curve and energy density spectra for Test T601
Figure D.11 Exceedance curve and energy density spectra for Test T603


July 2011, final
Large-scale physical modelling of wave damping floating willow mattresses E
E Theoretical background: determination of reflected, transmitted and dissipated wave energy
This section describes an approach to determine the ratio between the reflected energy (Er)and the dissipated energy (Ediss).
It is assumed that wave measurements with three wave gauges are performed before and after the floating structure. By using three wave gauges, the incident and reflected wave (energy) can be measured using the technique as described in Mansard and Funke (1980). Wave measurements were performed at two locations: one location in front of the structure (Location 1) and one location behind the structure (Location 2). In total four parameters were measured: incident wave energy at Location 1 (Ei,WHM1) and Location 2 (Ei,WHM2) and the reflected wave energy at Location 1 (Er,WHM1) and Location 2 (Er,WHM2).
When the wave approaches the floating structure, the energy is partly reflected (Er) partly dissipated (Ediss) and partly transmissed (Et). This is illustrated in Figure E.1. How the wave measurements (Ei,WHM1, Ei,WHM2, Er,WHM1 and Er,WHM2) leads to individual values for reflected wave energy (Er,A, Er,B), transmissed wave energy (Et,A, Et,B) and dissipated wave energy (Ediss,A, Ediss,B) is explained below.
The relation between energy and wave heights is the following:
t tt
i i
E HCE H
(4.1)
r rr
i i
E HCE H
(4.2)
dissdiss
i
ECE
(4.3)
It is assumed that the waves are fully absorbed by the wave paddle. Besides this, it is assumed that the waves that reflect from the damping slope are not re-reflected at the floating structure (Er,C = 0).
Figure E.1 Schematisation of the model set-up for an irregular wave field
Ediss,A
Et,A
Er,WHM1
Ei,WHM2
Er,WHM2
Ei
Ei = incident wave energy
Ediss = dissipated wave energy
Er = reflected wave energy
Etr = transmitted wave energy
Ei, WHM1 =incoming wave energy at WHM1
Ei, WHM2 =incoming wave energy at WHM2
Er, WHM1 = reflected wave energy at WHM1
Er, WHM2 = reflected wave energy at WHM2
Ei,WHM1
Er,A
slopeEr,B
Ediss,B
Er,C=0
Et,B
waveboard

E
July 2011, final
Large-scale physical modelling of wave damping floating willow mattresses
Based on Figure E.1, the following equations are derived:
, 1i i WHME E (4.4)
, , , 2t A r C i WHME E E (4.5)
, , , 1r A t B r WHME E E (4.6)
, , ,i r A diss A t AE E E E (4.7)
, , 2r B r WHME E (4.8)
, , , ,r B r C diss B t BE E E E (4.9)
, 0r CE (assumption) (4.10)
Unfortunately, it is not possible to solve these equations. An additional equation is required based on the assumption that the transmission coefficient Ct is in both directions the same:
, ,t A t BC C (4.11)
,,
t At A
i
EC
E(4.12)
,,
,
t Bt B
r B
EC
E(4.13)
Combining Equation (4.11) until Equation (4.13) gives:
, , ,t A r B t B iE E E E (4.14)
Now it is possible to solve the equations:
(based on Eq. (4.14)): , , , 2 2,
, 1
t A r B i WHM rWHMt B
i i WHM
E E E EE
E E(4.15)
(based on Eq. (4.9): , 2 2, , , , , 2
, 1
i WHM rWHMdiss B r B r C t B r WHM
i WHM
E EE E E E E
E(4.16)
(based on Eq.(4.6): , 2 2, , 1 , , 1
, 1
i WHM rWHMr A r WHM t B r WHM
i WHM
E EE E E E
E(4.17)
(based on Eq.(4.7): , 2 2
, , , , 1 , 1 , 2, 1
i WHM rWHMdiss A i r A t A i WHM r WHM i WHM
i WHM
E EE E E E E E E
E(4.18)

July 2011, final
Large-scale physical modelling of wave damping floating willow mattresses E
,
,
diss A
r A
EE
(4.19)
All relevant parameters are now expressed as a function of measurable parameters. An overview of the resulting formulae is given in Table E.1.
Table E.1 Overview determination incident, transmitted and reflected wave energy for an irregular wave field
, 1i i WHME E
, , 2t A i WHME E
, 2 2,
, 1
i WHM rWHMt B
i WHM
E EE
E
, 2 2, , 1
, 1
i WHM rWHMr A r WHM
i WHM
E EE E
E
, , 2r B r WHME E
, 0r CE
, 2 2, , 1 , 1 , 2
, 1
i WHM rWHMdiss A i WHM r WHM i WHM
i WHM
E EE E E E
E
, 2 2, , 2
, 1
i WHM rWHMdiss B r WHM
i WHM
E EE E
E
,
,
diss A
r A
EE


July 2011, final
Large-scale physical modelling of wave damping floating willow mattresses F
F Theoretical derivation of
Ratio of non-blocked energy TR is defined by:
1transmitted blockedtr
incident incident
E EE E
(5.1)
Kinetic energy is assumed to be proportional with maximum horizontal velocity in orbital motion:
2,maxhorE u (5.2)
With, according to linear wave theory
,maxcosh ( )
sinhhork h zu a
khor 2 2
,max cosh ( )horu k h z (5.3)
Eq. (5.3) is rewritten as
2,max( ) cosh 2 ( ) 1horE z u k h z (5.4)
Figure F.1 Schematisation of fixed structure blocking wave energy
Combining Eq. (5.1) and Eq. (5.4) gives:
00 0
0 0 0
1cosh 2 ( ) 1 sinh 2 ( )21 1 11cosh 2 ( ) 1 sinh 2 ( )2
d d dtr
h h h
Edz k h z dz k h z zk
Edz k h z dz k h z zk
(5.5)
or 1 1sinh 2 ( 0) 0 sinh 2 ( )
2 211 1sinh 2 ( 0) 0 sinh 2 ( )2 2
tr
k h k h d dk k
k h k h h hk k
(5.6)
z = 0
z = -h
z = -d
Wave with
• Wave number k (rad/m)
• Amplitude a (m)
• Frequency (rad/s)
Etransmitted Eincident
Eblocked
Etransmitted
Fixed structure

F
July 2011, final
Large-scale physical modelling of wave damping floating willow mattresses
or
sinh 2 sinh 2 ( ) 21sinh 2 2tr
kh k h d kdkh kh
(5.7)
or
sinh 2 ( ) 2 2sinh 2 2trk h d kd kh
kh kh(5.8)
Eq. (5.8)is also found with Eq. (5.9) as starting point:
0
d
htr
h
Edz
Edz(5.9)
The ratio of blocked energy is determined by:
1bl tr (5.10)
With Eq. (5.6), the energy transmission ratio parameter tr is written as a function of wave number k, depth h and structure depth d:
( , , )tr f k d h (5.11)
Energy component RatioBlocked energy by structure sinh 2 sinh 2 ( ) 2
sinh 2 2blkh k h d kd
kh khTransmitted energy sinh 2 ( ) 2 2
sinh 2 2trk h d kd kh
kh kh
With
wave number k (rad/m) 2kL
(5.12)
wave length L (m) 2tanh( )ohL L
L(5.13)
deep water wave length Lo (m) 2
2ogTL (5.14)
water depth h (m) structure depth d (m)

July 2011, final
Large-scale physical modelling of wave damping floating willow mattresses F
G Theoretical determination of dissipation coefficient Cdiss
To included length effect of a porous structure into the dissipation coefficient Cdiss a porous medium with a length w is assumed to have n segments with length x as illustrated in Figure G.1.
Figure G.1 Dissipation of energy on a porous segment
Dissipated energy is described by:
E D x (6.1)
Where D is dissipated energy per unit of length. Dissipated energy is assumed to be proportional with incoming energy E:
D f E (6.2)
Combining Eq. (6.1) and Eq. (6.2) gives
E f E x (6.3)
Rewriting gives:
E f Ex
(6.4)
With infinitesimal small x this is rewritten as:
E f Ex
(6.5)
General solution of Eq (6.5) is given by:
0f xE E e (6.6)
or
0
f xE eE
(6.7)
Dissipation coefficient Cdiss is defined as:
x
E E+ E
E

F
July 2011, final
Large-scale physical modelling of wave damping floating willow mattresses
0
0 0 0
1dissdiss
E E E ECE E E
(6.8)
Combining Eq. (6.7) and Eq. (6.8) gives
1 fxdissC e (6.9)
Eq. (6.9) is graphical presented in Figure G.2.
0.0
0.2
0.4
0.6
0.8
1.0
0 0.5 1 1.5 2 2.5 3
x
f = 0.1f = 0.5f = 1f = 10
Figure G.2 Graphical presentation of dissipation coefficient based on Eq. (6.9)

July 2011, final
Large-scale physical modelling of wave damping floating willow mattresses F
H Calculation tool
A calculation tool is developed. An impression is given in Figure H.1 and Figure H.2. User fills in mattress (w, d) and hydraulic conditions (h, Hm0, Lp). All relevant parameters will be calculated. The prediction model tool also compares several dimensionless parameters with dimensionless parameters that were applied during physical model tests.
Determination of wave transmission coefficients of brush wood matresses version 29 July 2011P. van Steeg, Deltares
InputMattress conditions
length of mattress w 100 m WARNING: outside range of tested conditions depth of mattress in water d 0.6 m WARNING: outside range of tested conditions coefficient f 2.4 -
Hydraulic conditionswater depth at mattress h 6 m WARNING: outside range of tested conditionssignificant wave height H m0 1 m WARNING: outside range of tested conditions local wave length L p 33.3 m WARNING: outside range of tested conditions
Output Formula
wave number k 0.19 rad/m Eq. 1
energy blocking ratio BL 0.173 - Eq. 2
dim. parameter R 0.52 - Eq. 3
reflection coefficient C r 0.10 - Eq. 4
dissipation coefficient C diss 0.84 - Eq. 5
transmission coefficient C t 0.53 - Eq. 6
transmitted wave height H mo,tr 0.53 m Eq. 7
Output (Dimensionless parameter)ratio mattress length and wave length
w/L p 3.0 -WARNING: outside range of tested conditions
ratio mattress depth and water depth d/h 0.10 -
WARNING: outside range of tested conditions
ratio water depth and wave length h/L p 0.18 -WARNING: outside range of tested conditions
wave steepness based on local water peak period s p 0.03 -
ratio blocked wave energy BL 0.17 - WARNING: outside range of tested conditions
Page 1/2 www.deltares.nl
- This sheet can be used for a first estimate of wave transmission of a floating brushwood mattress. Used formulas in this sheet are based on empirical data obtained with large scale physical modelling in Deltares Deltaflume. The amount of empirical data obtained in this flume is limited. Therefore, care should be taken when using this sheet for situations which are different than tested. For detailed modelling it is strongly recommended to perform additional analysis or physical model tests.- A description of the physical model tests and foundation of the formulas used in this sheet is given in Deltares report "Large scale physical modelling of wave damping of brushwood
sinh 2 s in h 2 ( ) 2s in h 2 2bl
kh k h d kdkh kh
B Lp
wRL
2
p
kL
, ,mo tr tr mo iH C H
2BL
p
wfL
t rC e C
0.1rC
1BL
p
wfL
dissC e
Figure H.1 Impression of calculation tool (page 1/2)

F
July 2011, final
Large-scale physical modelling of wave damping floating willow mattresses
page 2/2 www.deltares.nl
0.0
0.2
0.4
0.6
0.8
1.0
0.0 0.2 0.4 0.6 0.8 1.0 1.2 1.4 1.6 1.8 2.0
relative length R = BL(w /L p) (-)
Delta Flume tests w = 4 mDelta Flume tests w = 12 mEquation 6Result of calculation
w/Lp
h/Lp
BL
0 0.5 1 1.5 2 2.5 3 3.5
BL, h /L p, w/L p,
d/h
sp
0 0.02 0.04 0.06 0.08 0.1 0.12 0.14 0.16 0.18 0.2
d /h , s p
Black line indicates test range conditions of flume test on which the prediction model is based.Red marker indicates calculated parameter based on input prediction model
Figure H.2 Impression of calculation tool (page 2/2)


![MSMR wave modelling revised[1] - drs.nio.org](https://static.fdocuments.net/doc/165x107/61bd1e1e61276e740b0f8878/msmr-wave-modelling-revised1-drsnioorg.jpg)