LARGE SCALE LAND ACQUISITION
34
LARGE SCALE LAND ACQUISITION: THE NEED FOR GOOD LAND GOVERNANCE THE NEED FOR GOOD LAND GOVERNANCE Klaus Deininger, World Bank As, June 27, 2011
Transcript of LARGE SCALE LAND ACQUISITION
LARGE SCALE LAND ACQUISITION:
THE NEED FOR GOOD LAND GOVERNANCETHE NEED FOR GOOD LAND GOVERNANCE
Klaus Deininger, World Bank
As, June 27, 2011

The global picture

100
120
140
160
800
1000
1200
Commodity price rise triggers land demand
Daewoo to cultivate Madagascar land for free0
20
40
60
80
100
0
200
400
600
Mar-07 Sep-07 Mar-08 Sep-08 Mar-09 Sep-09 Mar-10
Rice price (US $/t)

Investor demand in Africa unprecedented
RegionRegionRegionRegion Area cult. (M ha)Area cult. (M ha)Area cult. (M ha)Area cult. (M ha) ∆∆∆∆/yr /yr /yr /yr DemandDemandDemandDemand in 2009in 2009in 2009in 2009
1961 2007 Mn. ha
SSA 134.6 218.5 1.79 39.7
EAP 183.9 262.8 1.68 8.0
LAC 103 168 1.39 3.2
ECA 291.5 241.7 -1.06 4.6
MENA 77.9 89.0 0.24 1.4
SAS 197.9 213.5 0.33 0.7
ROW 368.7 355.5 -0.28 0.2
TotalTotalTotalTotal 1,3571,3571,3571,357 1,5491,5491,5491,549 4.09 57.857.857.857.8

Past experience not encouraging...
0.6
0.7
0.8
0.9
1
Sudan: Sorghum & sesame yields (t/ha)
1970-2005 (vs. > 4t/ha in Australia)
0
0.1
0.2
0.3
0.4
0.5
1970/71 1980/81 1990/91 2000/2001
Sorghum
1970s oil price shock as a major determinant; inflow from Middle East
Land transfers very large (5.5 Mn ha official; up to 11 Mn ha encroached)
Productivity & welfare impacts very limited due to conflict & soil mining
Sesame

… & neglect of rights a danger again
Dependent variable Interest Implementation
Suitable land non-forest 0.2987** 0.3916***
Determinants of a country attracting investor interest/actual implementation
Suitable land non-forest 0.2987** 0.3916***
Suitable land forest 0.0396 0.0770
Yield gap -0.2774 -1.7457**
Land rights recognition -0.691*** -0.3416*
Investment protection +0.0058* 0.0033
Pseudo R2 0.339 0.268

Actual land transfers lower but still largeActual land transfers lower but still largeActual land transfers lower but still largeActual land transfers lower but still large
Country All projects Share domestic (%)
1000 ha # Median (ha) Projects Area
Ethiopia 1,190 406 700
Total area transferred, no of projects and share of domestic investors, 2004-2009
Ethiopia 1,190 406 700 94.3 48.9
Liberia 1,602 17 59,374 11.8 7.3
Mozambique 2,670 405 2,225 67.7 52.5
Sudan 3,965 132 7,980 68.2 77.8
Investment is often not predominantly foreign.Many ventures did not start production – limiting potentially positive impacts.

Need to look at potential
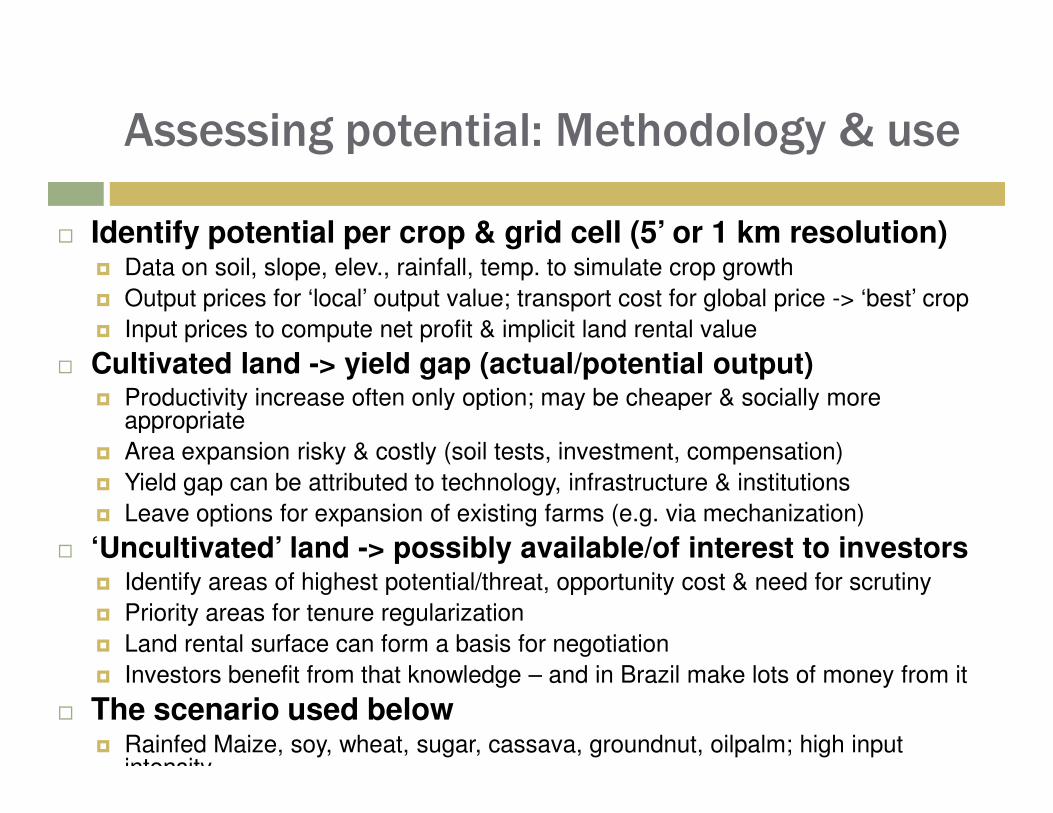
Assessing potential: Methodology & use
� Identify potential per crop & grid cell (5’ or 1 km resolution)� Data on soil, slope, elev., rainfall, temp. to simulate crop growth
� Output prices for ‘local’ output value; transport cost for global price -> ‘best’ crop
� Input prices to compute net profit & implicit land rental value
� Cultivated land -> yield gap (actual/potential output)� Productivity increase often only option; may be cheaper & socially more
appropriate� Productivity increase often only option; may be cheaper & socially more
appropriate
� Area expansion risky & costly (soil tests, investment, compensation)
� Yield gap can be attributed to technology, infrastructure & institutions
� Leave options for expansion of existing farms (e.g. via mechanization)
� ‘Uncultivated’ land -> possibly available/of interest to investors� Identify areas of highest potential/threat, opportunity cost & need for scrutiny
� Priority areas for tenure regularization
� Land rental surface can form a basis for negotiation
� Investors benefit from that knowledge – and in Brazil make lots of money from it
� The scenario used below� Rainfed Maize, soy, wheat, sugar, cassava, groundnut, oilpalm; high input
intensity

Potential output values


Land ‘availability’ by countryHigh potential, non-cult., -forested, -protected land <
25/km2
1000 haRelativ
e 1000 ha Relative
Sudan 46,025 2.82 Tanzania 8,659 0.94
Brazil 45,472 0.73 Bolivia 8,317 2.92
Russian Fed. 38,434 0.32 Cent. Afr. Rep. 7,940 4.23
Argentina 29,500 1.05 Paraguay 7,269 1.34
World total 445 Mn ha (< 25/km2)306 Mn ha (< 10/km2)198 Mn ha (< 5/km2)
Key Argentina 29,500 1.05 Paraguay 7,269 1.34
Australia 26,167 0.57 Colombia 4,971 0.68
D.R. Congo 22,498 1.53 Ethiopia 4,726 0.34
Mozambique 16,256 2.85 Cameroon 4,655 0.68
Madagascar 16,244 4.63 Kenya 4,615 0.99
Chad 14,816 1.92 Mexico 4,360 0.17
Zambia 13,020 2.83 Mali 3,908 0.47
Indonesia 10,486 0.32 Papua N.G. 3,771 5.93
Angola 9,684 3.31 Burkina Faso 3,713 0.77
Uruguay 9,269 4.56 Belarus 3,691 0.61
Venezuela 8,966 2.29 South Africa 3,555 0.23
United States 8,756 0.05 Congo 3,476 6.79
Canada 8,684 0.17 Ukraine 3,442 0.10
Key characteristicsHighly concentrated• > 90% in 32 countries • Half of these in Africa
Large rel. to current area• > double in 11 countries• > triple in 6 countries
Sheer size is instructive• Multiple constraints likely• Need sophisticated investors• Potential social dislocation

Expansion potential by crop
Current production ‘Available’ land
Area (1000 ha) Yield (t/ha) Total < 6 h
USA 31,826 9.66 1,647 1,538
Argentina 3,412 6.45 9,469 7,704
Australia 68 5.69 18,870 2,890
Top countries with maize expansion potential (<25/km2)Latin America’s
advantages• Technology & land for expansion
Human capital• Infrastructure & market access• Institutions:
Property rights secureAustralia 68 5.69 18,870 2,890
Uruguay 81 4.15 2,735 2,225
Brazil 14,445 4.09 11,388 10,406
Russian Fed. 1,732 3.86 2,458 2,170
Venezuela 740 3.47 4,640 3,919
Zambia 664 2.18 5,716 2,383
Sudan 31 2.02 31,889 14,390
Madagascar 250 1.48 6,753 4,654
Chad 235 0.96 9,131 3,736
Mozambique 1,400 0.92 7,592 4,206
World
Property rights secureThriving land marketsTransparencyContract enforcementFinancial markets
Africa’s opportunity• Borrow technology• Focus on regional markets• Expand from existing production • Rel. low opportunity cost of land *
Challenges to be overcome• Institutions
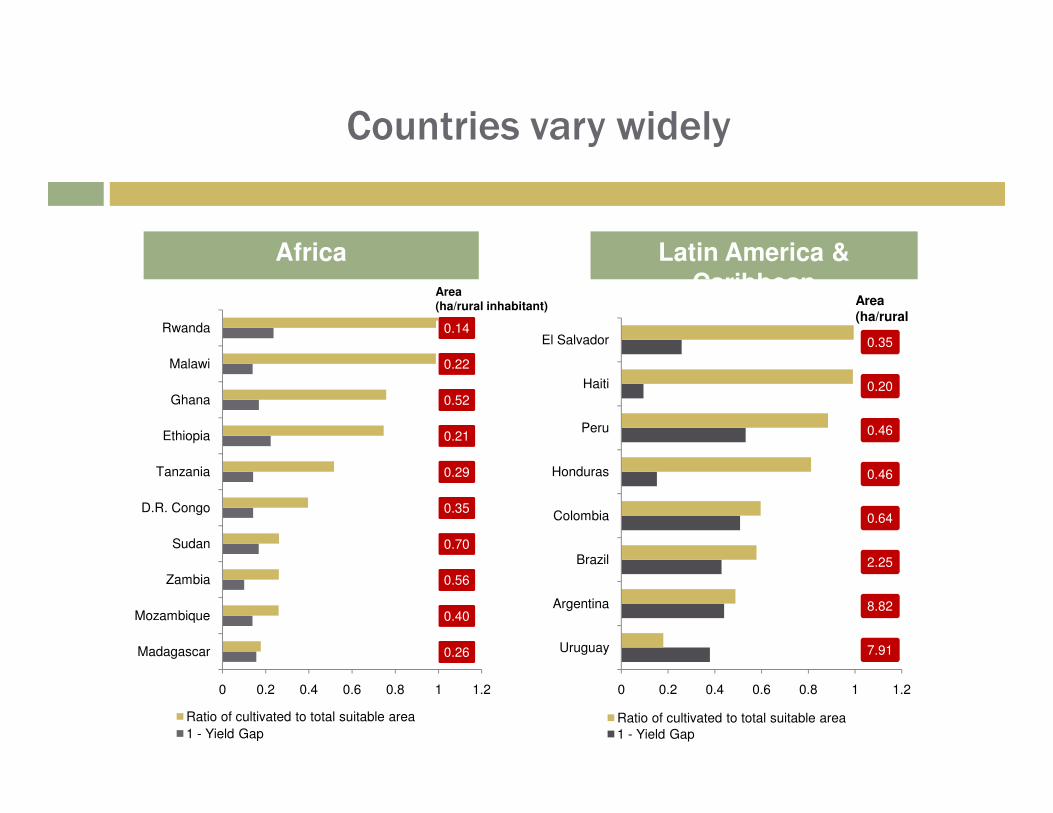
Countries vary widely
Africa Latin America & Caribbean
Ghana
Malawi
Rwanda 0.14
0.22
0.52
Area (ha/rural inhabitant)
Haiti
El Salvador
0.20
0.35
Area (ha/rural
0 0.2 0.4 0.6 0.8 1 1.2
Madagascar
Mozambique
Zambia
Sudan
D.R. Congo
Tanzania
Ethiopia
Ghana
Ratio of cultivated to total suitable area
1 - Yield Gap
0.52
0.21
0.29
0.35
0.70
0.56
0.40
0.26
0 0.2 0.4 0.6 0.8 1 1.2
Uruguay
Argentina
Brazil
Colombia
Honduras
Peru
Ratio of cultivated to total suitable area1 - Yield Gap
7.91
8.82
2.25
0.64
0.46
0.46

.. and so do appropriate actions
� Type 1 (Korea, China, Vietnam, India)� Significant gains from technology & institutional change by smallholders in the
past
� Intensification & (private sector) value addition as only sources of on-farm growth
� Off-farm employment a main engine for increases in farm sizes via (rental) marketsmarkets
� Type 2 (Brazil, Argentina, Peru)� Technological barriers to large farm expansion low - big recent investment
inflows
� Land markets function relatively well, currently danger of bubbles
� Regulation needed to avoid distributional, environmental & social externalities
� Type 3 (Malawi, Rwanda, El Salvador)� High yield gap often a consequence of past underinvestment in agriculture
� Land is a key safety net; danger of people being pushed out with no alternative
� Private investment to complement public initiative; contract farming
� Type 4 (Sudan, Tanzania, Zambia, Mozambique)� Mechanization & larger farm size can be sustainable; incentive for private sector
� Institutions (property rights & land markets) a key challenge

PHL
KAZ
LTUPOL
ROMRUS
TKM
UKR
ARGBRA
SLV
MEXURY
AGOBEN
BDI
COGZAR
GHA
MWI
MOZ
NGA
RWA
SDN
TZA
ZMB
Type 3 Type 4
.6.8
1
Yie
ld G
ap
CHN
MYS
VNM
EGY
JOR
INDPAKHUN
SVN
ARGBRA
CHL COL
GUYPER
Type 1 Type 2
.2.4
-10 -5 0 5
Suitable relative to cultivated area (in logarithms)
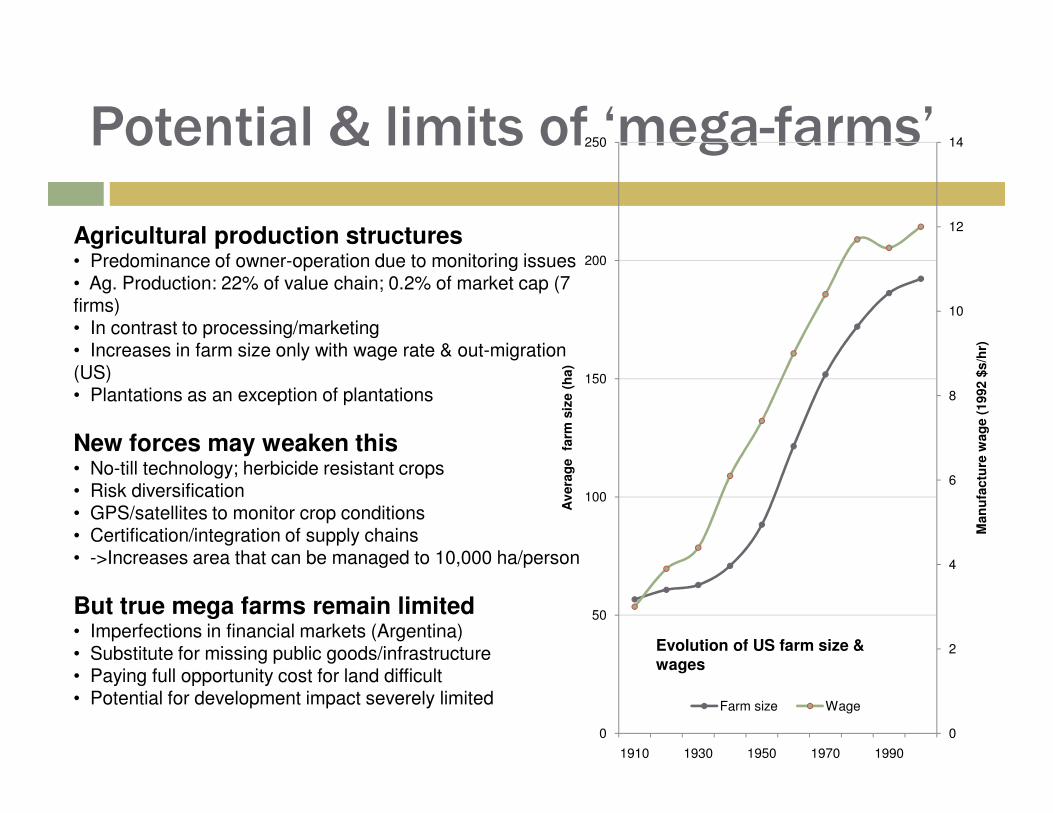
Potential & limits of ‘mega-farms’
8
10
12
14
150
200
250
Man
ufa
ctu
re w
ag
e (
1992 $
s/h
r)
Av
era
ge
farm
siz
e (
ha)
Agricultural production structures• Predominance of owner-operation due to monitoring issues• Ag. Production: 22% of value chain; 0.2% of market cap (7 firms) • In contrast to processing/marketing• Increases in farm size only with wage rate & out-migration (US)• Plantations as an exception of plantations
0
2
4
6
0
50
100
1910 1930 1950 1970 1990
Man
ufa
ctu
re w
ag
e (
1992 $
s/h
r)
Av
era
ge
farm
siz
e (
ha)
Farm size Wage
Evolution of US farm size & wages
New forces may weaken this• No-till technology; herbicide resistant crops• Risk diversification • GPS/satellites to monitor crop conditions• Certification/integration of supply chains • ->Increases area that can be managed to 10,000 ha/person
But true mega farms remain limited• Imperfections in financial markets (Argentina)• Substitute for missing public goods/infrastructure• Paying full opportunity cost for land difficult• Potential for development impact severely limited
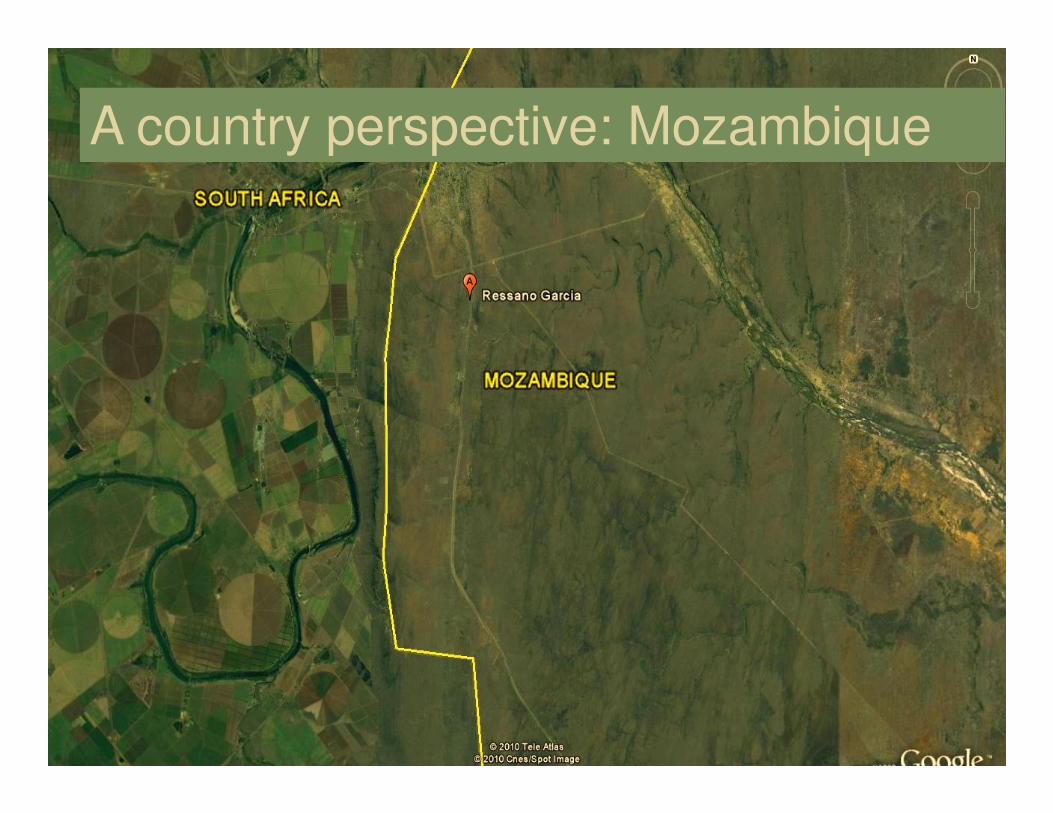
A country perspective: Mozambique

Setting & results thus far
Enormous unexploited potential• Ideal market access Beira (transport)• Recognition of community rights via 97 law• ‘Available’ land three times what is cultivated• Hypothetical land values > $ 3,000/ha
Drive to attract investment backfired• ‘Applications’ for 13 mn. ha in 18 months• Land audit: Half of what was given is un- or underutilized
AAAAAA
• Land audit: Half of what was given is un- or underutilized
Underlying reasons? • Gaping holes in land right recognition (only 10%)• Lack of strategy (potential, clustering, partnerships, climate)• Weak & non-transparent processes (consultation, contracts)• Environmental issues (EIAs lacking, weak, or not enforced)• Weak ex-ante assessment of economic viability, • Lease rates low & administratively set ($0.8/ha) • Liquidation of failed ventures near-impossible
Main lesson • Attracting speculators is easy - getting capable/serious
Residual land values; high input scenario

Identify resource availability• Zoning to assess agro-ecological suitability • Link to local land use planning• Provide basis for complementary inv. (possy. WB)• Identify unproductive concessions & initiate return
Drive to recognize rights• Improve quality & consistency of data• Community land delimitation/demarcation • Local structures & decision-making authority
Actions taken
Overlaps:1.4 m ha; 418 cases
• Local structures & decision-making authority• Review of ways to cancel non-utilized concessions• Increase lease rates a bit• Land policy forum for range of issues incl. transfer
Increased transparency • Investment authority established; decentralized • Formats for investment proposals• More stringent monitoring (but limited gov’t capacity) • Better regulation of consultation process

Parallels in other case study countries
� Gaps in legal & policy framework� Requires expropriation/extinction of existing rights (e.g. ZMB)
� Unclear/duplicative institutional responsibility (e.g. ETH)
� Low land payments/participation; non-collection (e.g. LBR)
� Requirements for liquidating non-profitable investments rarely considered
� Weak institutional capacity & implementation� Weak institutional capacity & implementation� Lack of information & consultation -> Neglect of property rights
� Neglect of economic/technical viability (e.g. GHA)
� Limited capacity to do or monitor ESIAs (e.g. SDN)
� Weak land administration -> Boundary conflicts, overlap
� Agreements are not written/monitored
� Communities with little voice, capacity, and ability to resist� Negative effects shifted to locals who receive damage but no benefits
� Non-viable projects encroach on local rights to make ends meet
� Vulnerable & women left out –poor people subsidize (foreign) ‘speculators’
� Historical examples of this leading to political backlash, conflict

Challenges – and opportunities
� Characteristics of the land sector� Specificity of time & place -> laws & practice political & context-
dependent
� Technical complexity -> need for wide range of expertise
� Institutional fragmentation -> coordination problems
� Evolution over time -> Not a static pictureEvolution over time -> Not a static picture
� No comprehensive & coherent vision or indicators� Programs often ad hoc, sporadic, without focus/continuity/strategy
� Fragmented indicators, non-comparable over time & link to actions not clear
� Actions not clear & value judgments often buried in fine print
� Implications� Support often ad hoc & based on traditional sectors
� Limited inclusion in other programs (CAADP, DPLs)
� Cross-country learning from good practice difficult
� Ability to measure progress or impact constrained
� Roadmap with critical path & mechanism to ascertain progress essential
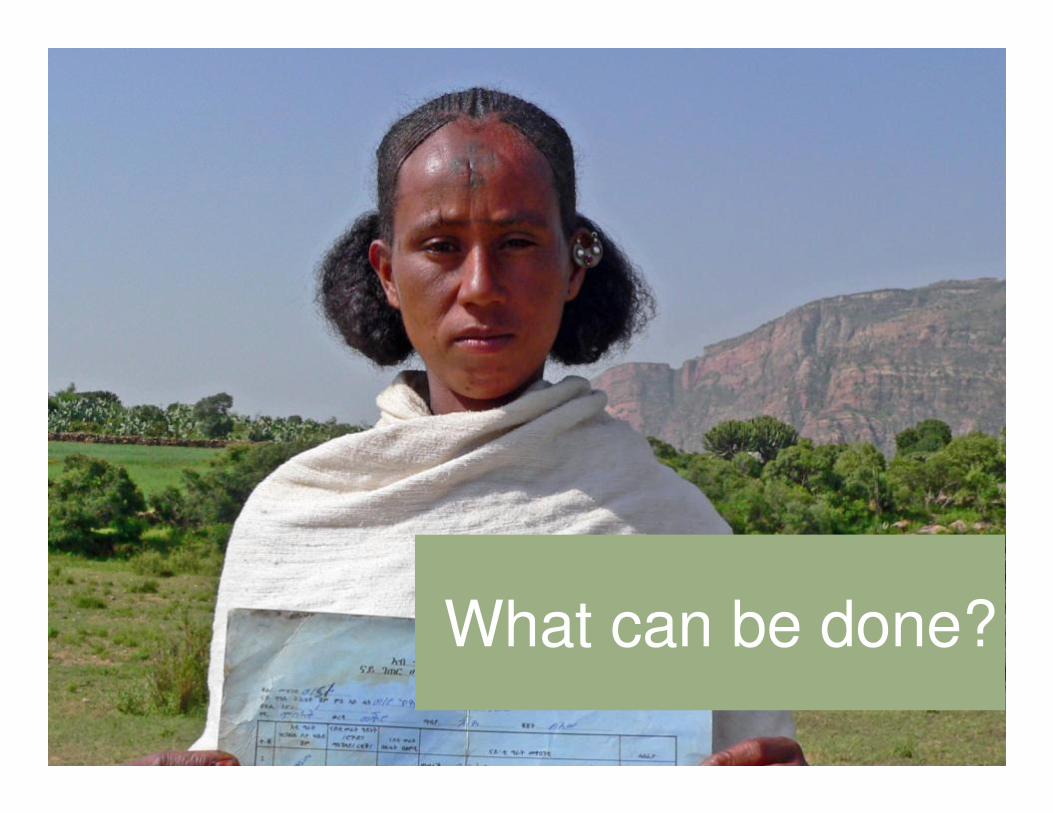
What can be done?

Key country responsibilities
� Strategy and general framework: � How to provide critical infrastructure
� Leveling the playing field in the policy arena for an inclusive ag. growth strategy
� How to identify & disseminate information on land availability in high potential areas
� Quantifying and maximizing food security & employment benefits (direct & indirect)indirect)
� Ways (zoning, safeguards, taxes) to promote rational & sustainable land use
� Negotiation and structuring of actual deals� Recognition of land & resource rights at project & aggregate level
� Mechanisms to encourage fair & inclusive negotiations with enforceable results
� Contractual arrangements and partnerships to share benefits & incentives
� Effective ways of liquidating non-performing enterprises
� Monitoring and disclosure� Providing reliable country-level data on large-scale land transfers
� Standards and mechanisms for project-level reporting, disclosure, and verification
� Ideally to feed into multi-stakeholder processes at country level (EITI example)

Use stakeholders’ comparative advantage
1. Government: Improve land governance� Identify areas with potential & provide complementary public goods
� Recognize, register, and help enforce property rights (incl. valuation)
� Improve & streamline institutional framework for markets to operate
2. Private sector: Get things done on the ground� Close the yield gap by transferring technology & providing market access
� Document potential for benefit sharing
� Extend coverage/disclosure of existing approaches (e.g. Equator Principles)
3. Civil society & academics: Contribute to greater transparency� Advise, monitor, implement to build civil society & community capacity
� Give communities voice; empower them to negotiate & push enforcement
� Publicize promising examples; link back to policy
4. Global community: Capacity building support to interested governments � Technical support & complementary infrastructure, institutional capacity
� Assistance in negotiation to overcome imbalances
� Fora to monitor impact & share examples of good practice

But what is good land governance?
� Legal & institutional framework� Laws & institutions recognize existing rights and allows users to exercise
them at low cost, in line with their aspiration, in ways that benefit society as a whole. Policies are clearly stated & their implementation regularly monitored.
� Land use planning & taxation� Land use planning and taxation avoid negative externalities at reasonable � Land use planning and taxation avoid negative externalities at reasonable
cost and support effective decentralization
� Management of state land� State land is clearly identified and managed efficiently to provide public
goods; expropriation is used as a last resort for public purposes only with quick payment of fair compensation and effective appeals mechanisms; divestiture of state lands is done in a transparent way that maximizes public benefit
� Public provision of land information� Land information accessible at reasonable cost, comprehensive, current,
and reliable
� Dispute resolution & conflict management� Interested parties have access to institutions that have well-defined
mandates to authoritatively resolve dispute and effectively manage conflict

How can this be made operational?
� Step 1: Identify ‘ideal’ role of institutions in land sector� Create legal & institutional framework to define property rights to
land, allow cost-effective enforcement & encourage investment
� Provide reliable & complete information on land rights to allow low-cost verification, transfer, and use of land as collateral
� Regulate agents’ behavior to avoid negative externalities & allow effective public service provision effective public service provision
� Step 2: Put the issue on the agenda in a monitorable way� Assessment of key areas: Broad-based, rely on existing info
� Monitoring: Focus on key priorities to measure progress
� Research: Identify causal linkages to improve overall outcomes
� Step 3: Link to regional/global efforts� Political commitment at highest level (AU LPI; FAO VG)
� Focus on scope for transferability of innovations/arrangements
� Potential for cross country assessment in the long term
� A land center can have significant benefit

Assessment: The LGAF methodology
� Land Governance Assessment Framework (LGAF) principles� Constructive rather than evaluative: Good practice virtually everywhere
� Local expertise & ownership rather than imposition of outside experts
� Non-political: Aims to be objective, replicable, actionable
� Pilot application in 5 countries - detailed manual prepared
� Scope for additional modules (e.g. large scale, forest, markets)
� Step 1: Put together background information � Step 1: Put together background information � Tenure typology and key issues for each tenure type
� Information on all the dimensions based on existing data (by experts)
� Preliminary ranking & identification based on existing information
� Identification of tentative policy priorities
� Step 2: Validate ranking & identify priority actions� Ranking panels with participation by a broad range of stakeholders
� Priority recommendations based on this input
� Peer review to strengthen links among assessment, monitoring, research
� Country-level validation workshop & publication of results
� Step 3: Agree on a process for follow-up� Policy measures (rule-based indic’s): Easily monitored by experts on regular basis
� Outcome-based indicators: Not more than 5-10 but requires significant effort

Monitoring: Combine admin, survey data
� Types of indicators and data sources � Rule-based (are ‘good’ institutions in place?) – expert opinion
� Coverage & customer satisfaction: Admin. (rel. to universe); selectivity
� Outcome based: Household surveys – link to research
� Potential administrative indicators� Share of economically relevant land area mapped
� No. of registered land transfers & women’s rights
� Tax revenue receipts by different entities
� Volume (no., area, value) of expropriation cases
� No. and incidence of land-related conflicts
� Challenges� Although they should be routine measures, few of these currently available
� Admin. data to provide disaggregation & repetition
� Survey data to link to outcomes
� Setting them up has some cost - requires political & technical support
� But can link into existing processes, e.g. reporting to African Heads of State

Research to push the frontier
� Why is research needed? � Define minimum standards & peer network for evaluations to be credible
� Document causal links between actions and higher-level outcomes
� Quantify payoffs from or WTP for specific deliverables (survey standards approp’e?)
� Identify ways of achieving outcomes better/more effectively
� Explore transferability of approaches across countries� Explore transferability of approaches across countries
� Possible approaches (& trade-offs)� ‘Basic’ analysis of productivity determinants & land market functioning
� Analysis of past policy changes or programs with clear roll-out
� Slight modifications of existing approaches (e.g. paralegals)
� New ways of delivering services
� Advantages of a link to land governance� Understanding of institutional arrangements a precondition for relevant research
� Potential synergies enormous (quality control, data access)
� Debate on land is political; local capacity & input essential to make case for reform
� Lack of researches’ input in policy debate has harmed both sides

Partnership for good land governance
� Structure and objectives � Core partners WB, FAO, IFAD, UN-Habitat, IFPRI; advisory comm (CSOs/FOs;
private sector; academic networks; donors & foundations; regional political bodies (AU, OAS, APEC, UN-ECE)
� Build on and provide input into existing initiatives in this area
� Act as a catalyst to bring together actors for an effective follow-up
� Create the preconditions for significant expansion of (Bank) support to the sector� Create the preconditions for significant expansion of (Bank) support to the sector
� Specific activities� Application of diagnostic assessment in Nigeria, South Africa, Ghana, Rwanda,
Malawi, Georgia, Madagascar, Mali, Cameroon, DRC, Senegal, Ukraine
� Integration of tenure typology & admin data for monitoring indicators in 3 countries
� In-country workshops to validate followed by Africa-wide workshop later this year
� Support to operational approaches
� The CLTS can make important contributions� The entire idea originated in a grant from the Norwegian Governance TF
� Substantive review of assessments; household surveys; research
� Operational support in implementation of programs

Summing up
� Land acquisitions pose a potent & qualitatively new challenge� Interest not in individual plots close to infrastructure/foreigners
� Potentially large amounts of money/land involved (funds, REDD)
� Many contractual models & production arrangements untested
� Can create tremendous opportunities – but also has risks� Case studies: From female empowerment to destruction of livelihoods
� Rights for local communities & direct negotiation
� Objective basis for what land can be worth
� Assistance to compensate for knowledge gaps
� Transparency of deals, disclosure & local monitoring of impacts
� Good land governance is a key government responsibility
� Serious investors will go where the framework is right (reputational risk)
� Provides a unique opportunity for collaboration

Thank you!
![Land Acquisition Act, 1894...Land Acquisition Act, 1894 ၁၈၉၄ ၁၉၆၀ ၀ Burma Land Acquisition Manual, 1947 ၁၉၃၄ ၃1 THE LAND ACQUISITION ACT [ACT I, 1894] (1st](https://static.fdocuments.net/doc/165x107/6002be9f983db76f6a708206/land-acquisition-act-1894-land-acquisition-act-1894-.jpg)