Large-scale deployment of biomass resources for energy and materials
40
Macro-econoMics biobased synthesis report analysis of the econoMic iMpact of large-scale deployMent of bioMass resources for energy and Materials in the netherlands
-
Upload
alois-clemens -
Category
Documents
-
view
219 -
download
1
description
What are the options for large-scale biomass resources deployment in the Netherlands
Transcript of Large-scale deployment of biomass resources for energy and materials

Macro-econoMics biobased synthesis report
analysis of the econoMic iMpact of large-scale deployMent of bioMass resources for energy and Materials in the netherlands

2 Macro-econoMics biobased synthesis report

analysis of the econoMic iMpact of large-scale deployMent of bioMass resources for energy and Materials in the netherlands
Macro-econoMics biobased synthesis report

4 Macro-econoMics biobased synthesis report analysis of the econoMic iMpact of large-scale deployMent of bioMass resources for energy and Materials in the netherlands 5
Authors
Ric Hoefnagels
Veronika Dornburg
André Faaij
Martin Banse, Agricultural Economics Research Institute (LEI)
Copernicus Institute
Utrecht University
Department of Science, Technology and Society
Heidelberglaan 2
3584 CS Utrecht
The Netherlands
Telephone: +31-30-2537600
Fax: +31-30-2537601
Website: http://www.chem.uu.nl/nws/www/nws.html

analysis of the econoMic iMpact of large-scale deployMent of bioMass resources for energy and Materials in the netherlands 5
prefaceThe Bio-based Raw Materials Platform (PGG), part of the Energy Transition in
The Netherlands, commissioned the Agricultural Economics Research Institute
(LEI) and the Copernicus Institute of Utrecht University to conduct research on the
macro-economic impact of large scale deployment of biomass for energy and
materials in the Netherlands. Two model approaches were applied based on a
consistent set of scenario assumptions: a bottom-up study including techno-
economic projections of fossil and bio-based conversion technologies and a top-
down study including macro-economic modelling of (global) trade of biomass and
fossil resources. The results of the top-down and bottom-up modelling work are
reported separately. The results of the synthesis of the modelling work are
presented in this report.

analysis of the econoMic iMpact of large-scale deployMent of bioMass resources for energy and Materials in the netherlands 76 Macro-econoMics biobased synthesis report analysis of the econoMic iMpact of large-scale deployMent of bioMass resources for energy and Materials in the netherlands 7

analysis of the econoMic iMpact of large-scale deployMent of bioMass resources for energy and Materials in the netherlands 7analysis of the econoMic iMpact of large-scale deployMent of bioMass resources for energy and Materials in the netherlands 7
table of contents
preface 5
table of contents 7
1 introduction 8Objective and scope 9
Outline 10
2 Method 122.1 Bottom-up scenarios 13
2.1.1 Input data 15
2.1.2 Bottom-up biomass blending shares and model interaction 15
2.2 Modelling approach under the Macro-economic Model LEITAP 17
2.2.1 The GTAP-E model 17
2.2.2 Assumptions for different scenarios 19
2.3 Integration of the LEITAP projections into the bottom-up model 22
2.3.1 Transport fuels 22
2.3.2 Electricity 23
2.3.3 Chemicals 23
3 results of the bottoM-up projections (part i) 25
4 results of the top-down projections (part ii) 30
5 discussion 325.1 Results 32
5.1.1 Biomass use in the models 32
5.1.2 Costs of bio-based substitution 34
5.2 Methodology 34
6 conclusions 36
references 38
appendices 40

8 Macro-econoMics biobased synthesis report analysis of the econoMic iMpact of large-scale deployMent of bioMass resources for energy and Materials in the netherlands 9
1 introductionThe transition to a more sustainable energy system leading to a strongly reduced
dependency on fossil fuels and significant greenhouse gas (GHG) emission
reductions is an unsurpassed challenge. In the Netherlands, this challenge is
addressed by the ‘Energy Transition’, in which stakeholder platforms have
formulated strategies and pathways for different key themes to realise the required
changes. One of these platforms deals with ‘bio-based raw materials’ (Platform
Groene Grondstoffen, or PGG), tackling the large-scale and sustainable use of
biomass for energy and material applications. As a longer term vision, the platform
has targeted 30% replacement of fossil fuels by biomass resources (assuming a
stabilised energy use), divided over: 17% of the heating demand, 25% of electricity
demand, 25% of feedstock use for chemicals and 60% of transport fuels.
Such proposed changes will require large investments in infrastructure and
conversion capacity. In addition, the technologies that may facilitate such large-
scale use of biomass partly require further development (including biomass
production and supplies), which will need financial support. Another major
implication is that such a strategy means a considerable shift in the use and
production of primary energy carriers. Imported (coal, oil, natural gas) or
indigenous (natural gas) fossil fuels are to be replaced by imported biomass (e.g. as
pre-treated material or biofuel) as well as indigenous biomass resources which are
available (e.g. residues and waste streams) or can be produced (agriculture, algae).
As a consequence, economic activity will shift to different sectors of the economy.
In addition to investments in infrastructure and technology development, a ‘bio-
based strategy’ will also generate new economic activity. This is particularly true
when biomass is produced within the Netherlands (compared to imports of fossil
fuels). However, even imported biomass, which is further processed in the
Netherlands, may generate a higher added value to the national economy when
compared to imported oil and natural gas. The latter require limited further
processing compared to biorefineries, for example. If this could be realised, this can
have very significant (positive) impacts on the trade balance of the country, given
the large annual expenditures on imported energy (see also the Roadmap on
Sustainable Biomass Import prepared for the PGG, [Faaij, 2006]). In addition, fossil
energy prices are likely to continue rising in the medium to longer term [IEA 2006b;
IEA 2007], while there is substantial potential for reducing the production and
supply costs of biomass cropping systems.
Provided the Netherlands can build and maintain a leading position in the relevant
areas, other benefits include export opportunities of technology and knowledge and
reduced GHG emissions (with an equivalent value that may be determined by the
international carbon market). The latter is inherently considerable, given the
projected role of biomass in replacing fossil fuels (30% of total fossil fuels replaced).
Furthermore, developing biomass as a new key pillar of the (national) energy and
material supply will increase diversity in the energy supply mix and could therefore

analysis of the econoMic iMpact of large-scale deployMent of bioMass resources for energy and Materials in the netherlands 9
contribute substantially to improved energy security. A more stable energy supply
(particularly compared to international supplies of oil and natural gas) also has a
positive impact on (macro-) economic development.
With respect to the use of biomaterials, new biochemicals in particular may also
lead to considerable (energy) savings in the production chain, as highlighted by
[Sanders et al., 2006] and [Bruggink, 2006] outlined for the PGG. Such indirect
savings and potentially higher value chemicals will contribute positively to
economic growth. Another opportunity for the Netherlands may lay in a
strengthened role as a logistic hub for Europe in the bio-based arena, as such
developments will also take place throughout the rest of Europe.
However, the real (net) impact of building a large bio-based industry in the
Netherlands over the coming 3-4 decades will depend strongly on the cost
developments of key biomass conversion technologies (such as biorefinery concepts,
2nd-generation biofuel production technology and advanced power generation) and
the prices at which biomass resources can be made available. Those costs will then
be evaluated against the (relative) future costs of fossil fuels (most notably oil and
gas), which are also uncertain (although likely to follow an upward trend over the
coming decades). Other economic factors, such as growth rate, sectoral change in
the (national) economy, prices for CO2 and agricultural policies (subsidies and
prices) are also unknown variables. Determining the economic value of a bio-based
strategy for the Netherlands must therefore be implemented while keeping these
uncertainties in mind. With improved understanding of the mechanisms and
uncertainties, more targeted policies and implementation strategies can be devised,
which is fundamentally important for both the market and the government. Such
information allows for optimising the (economic) benefits and minimising the risks
(costs) of implementation and development of a bio-based infrastructure and
relevant sectors. This justifies a full-blown analysis of these matters. Remarkably,
to date, such analyses are very rare.
Objective and scope
The main objective of this study is defined as:
To provide quantitative insight into the macro-economic impacts of the large-scale
deployment of biomass-based resources and related infrastructure and production
capacity for the supply of energy and materials.
More specifically, the sub-objectives are:
Quantitative descriptions of scenarios for biomass use in the Netherlands in –
2010 to 2030, under different premises of technological development and
biomass trade. These descriptions include biomass resource availability,
production and costs, main conversion options for energy and materials and are
relative to a baseline scenario.
A description of the impact of biomass use in the scenarios with regard to –
biomass use for energy and materials, fossil primary energy saving, total costs

10 Macro-econoMics biobased synthesis report analysis of the econoMic iMpact of large-scale deployMent of bioMass resources for energy and Materials in the netherlands 11
for bio-based production and net costs and GHG emission reduction for fossil-
based substitution by biomass. These impacts are calculated using bottom-up
information on technologies for biomass production and use, taking into account
future technological learning.
A quantification of the macro-economic impact of large-scale biomass –
deployment in the Netherlands. GDP, employment, trade balances with the most
detailed possible breakdown (including current methods and data) of macro-
economic impacts with respect to GDP impact, sectoral effects (e.g. agriculture,
chemical industry, energy sector, etc.), employment effects and trade balance of
bio-based scenarios.
Insights into the uncertainty of key parameters and the impact of these –
variables on the final results. The selected variables include fossil fuel and CO2
prices. The variables ‘technology change’ and ‘international cooperation’ are
taken into account in the scenario projections.
A thorough and clear interpretation of results that can be used to formulate
sound policy strategies, which allows for optimising the (economic) benefits and
minimising the risks (costs) of implementation and development of a bio-based
economy.
This study focuses on bio-based production of electricity, liquid fuels for road
transport and bio-based chemicals. Bio-based production of heat is only taken into
account for industrial CHP plants in the energy and greenhouse gas balances.
Stand-alone production of heat from biomass in industries and households is not
taken into account, as the LEITAP model is not capable of modelling this commodity
directly.
A limited selection of biomass conversion technologies is represented in this study.
For chemicals, the bio-based production is aggregated and represented by three
conversion options to represent C1 chemicals, C2 chemicals and specialised
chemicals. Direct production of functionalised chemicals from biorefineries are not
included in this study, due to limitations to represent these multiple output options
in the LEITAP top-down model, as well as limited data available on the (economic)
performance of these technologies.
The bottom-up scenarios are based on a set of pre-defined technology portfolios for
biomass conversion. No optimisation modelling tools are used for this study. The
results do not support information on economic, energetic or environmental optimal
combinations of technologies or feedstocks. It should be noted that a full
optimisation study would also require the addition and comparison of competing
energy and GHG mitigation technologies, such as wind or photovoltaics (PV), but
also electric or fuel cell vehicles. This is beyond the scope of this study.
Outline
The structure of this report is as follows. Section 2 describes the methodology of
this study, section 2.3 summarises the results of the bottom-up scenarios and

analysis of the econoMic iMpact of large-scale deployMent of bioMass resources for energy and Materials in the netherlands 11
projections. The results of the top-down projections using the CGE model LEITAP
are summarised in section 4. Section 5 deals with the discussion of the results via
an assessment of the bottom-up and top-down results and section 6 lists the
conclusions of this study.

analysis of the econoMic iMpact of large-scale deployMent of bioMass resources for energy and Materials in the netherlands 1312 Macro-econoMics biobased synthesis report analysis of the econoMic iMpact of large-scale deployMent of bioMass resources for energy and Materials in the netherlands 13
2 MethodIn order to quantify the impact of biomass for bioenergy and bio-based materials in
the Netherlands, this study combines a bottom-up model with a top-down model.
Detailed bottom-up technology projections of biomass conversion options in
combination with an advanced multi-sector and multi-region macroeconomic
computable general equilibrium (CGE) model, support understanding of both the
impact on the macro-economy as the required technological development, fossil
energy avoided and greenhouse gas emissions avoided.
To address for change in bio-based production sectors, the CGE model LEITAP is
extended for bioenergy in the sectors electricity generation, petrol and bulk and
specialised chemicals. The bottom-up model comprises scenarios of a bio-based
economy for the electricity, transport fuels and chemicals sectors in the
Netherlands projected to 2030. Figure 1 summarises the approach and interaction
between the bottom-up model and the top-down model. A description of the
individual modelling approaches is given in section 2.1 and 2.2 and in more detail in
the individual bottom-up and top-down reports. This synthesis report presents the
combined results of the study in which projections of final energy demand and
biomass shares of the LEITAP model are used as input parameters for the bottom-
up model.
Figure 1 Model system for macro-economic modelling using bottom-up input data for bioenergy
and bio-based chemicals
4
2 Method In order to quantify the impact of biomass for bioenergy and biobased materials in the Netherlands, this study combines a bottom-up model with a top-down model. Detailed bottom-up technology projections of biomass conversion options in combination with an advanced multi-sector and multi-region macroeconomic computable general equilibrium (CGE) model, support understanding of both the impact on the macro-economy as the required technological development, fossil energy avoided and greenhouse gas emissions avoided. To address for change in biobased production sectors, the CGE model LEITAP is extended for bioenergy in the sectors electricity generation, petrol and bulk and specialty chemicals. The bottom-up model comprises scenarios of a biobased economy for the electricity, transport fuels and chemicals sectors in the Netherlands projected to 2030. Figure 1 summarizes the approach and interaction between the bottom-up model and the top-down model. A description of the individual modeling approaches is given in section 2.1 and 2.2 and in more detail in the individual bottom-up and top-down reports. This synthesis report presents the combined results of the study in which projections of final energy demand and biomass shares of the LEITAP model are used as input parameters for the bottom-up model.
Figure 1 Model system for macro-economic modeling using bottom-up input data for bioenergy and
biobased chemicals. Figure is partly based on Schäfer et al. (2005).
The model interaction in this study is essentially in one direction, i.e. the results of the bottom-up model are translated into biobased blending shares for the electricity, transport fuels and chemical sectors and applied to the LEITAP model as mandatory biobased blending shares in these sectors. Further model adjustments were based on comparing the final results of the bottom-up model and the top-down model, e.g. technology
Cost and supply
of biomass
Technology
database
Projections of
final energy
demand
Baseline
situation
Top-down
Economic
modeling
(LEITAP)
Bottom-up
modeling
(Excel based)
Bottom-up results
BU-report
Top-down results
TD-report
Biomass blending
shares
Feedstock types
Productivity factors
Split model
specialty/bulk
chemicals
Synthesis
results
Synthesis report
Figure is partly based on Schäfer et al. [2005]
The model interaction in this study is essentially in one direction, i.e. the results of
the bottom-up model are translated into bio-based blending shares for the
electricity, transport fuels and chemical sectors and applied to the LEITAP model as
analysis of the econoMic iMpact of large-scale deployMent of bioMass resources for energy and Materials in the netherlands 13analysis of the econoMic iMpact of large-scale deployMent of bioMass resources for energy and Materials in the netherlands 13
mandatory bio-based blending shares in these sectors. Further model adjustments
were based on comparisons using the final results of the bottom-up model and the
top-down model, e.g. technology substitution. Final projections of the LEITAP
model are used as input for the bottom-up model in order to generate the synthesis
results. This report summarises both the bottom-up results based on the WLO
projections and the results based on the LEITAP projections as explained in section
2.3.
A bilateral and iterative exchange between the models, represented by the dotted
lines in Figure 1, would improve consistency between the bottom-up and top-down
models. However, these calibration steps are not conducted for this study due to
time constraints. The discussion section deals with the differences between the
outcomes of the bottom-up and top-down models and discusses possible further
steps to improve the linkage between the models.
2.1 Bottom-up scenarios
To make future projections of biomass for bioenergy and bio-based materials
through to 2030 for the Netherlands, this study includes four scenarios. Emphasis
in these scenarios is on technological development of (biomass) conversion
technologies and on international cooperation including international trade of
biomass (Figure 2). The two national scenarios include limited sources of biomass
available from EU27+1 countries. The two international scenarios include global
biomass sources available for the Netherlands, such as palm oil, sugar cane and
eucalyptus. Other than international cooperation, the two national and
international scenarios include one scenario with low technological development
and one with high technological development. For the low-tech scenarios
(NatLowTech and IntLowTech) we assume biomass conversion technologies to be
used until 2030 that are already commercially available, while for the high-tech
scenario (NatHighTech and IntHighTech) we assume that advanced (2nd-generation)
technologies substitute current technologies from 2010 onwards. The IntHighTech
scenario includes one projection with bio-based synthesis gas in the chemical
industry and one scenario with both bio-based synthesis gas and substitution of
bulk and specialised petrochemicals (IntHighTech AC)2. Projections of socio-
economic change and final energy demands were derived from the WLO-scenarios
(Welfare and Environment) [Janssen et al., 2006].
1 EU27+Norway,SwitzerlandandUkraine.
2 TheIntHighTechACscenarioisaimedtobemoreconsistentwiththegoalofthePGGtosubstitute
25%offossil-basedrawmaterialsinthechemicalindustrywithbiomass.Thisscenarioincludes
bothbulkC1andC2chemicalsaswellasspecialisedchemicals.Blendingtargetsarederivedfrom
Rabouetal.[2006].Itshouldbenotedhoweverthat,asopposedtoRabouetal.,thisstudydoes
notincludebio-basedoptionswithdirectextractionandproductionoffunctionalisedchemicals
(biorefineryconcept).
14 Macro-econoMics biobased synthesis report analysis of the econoMic iMpact of large-scale deployMent of bioMass resources for energy and Materials in the netherlands 15
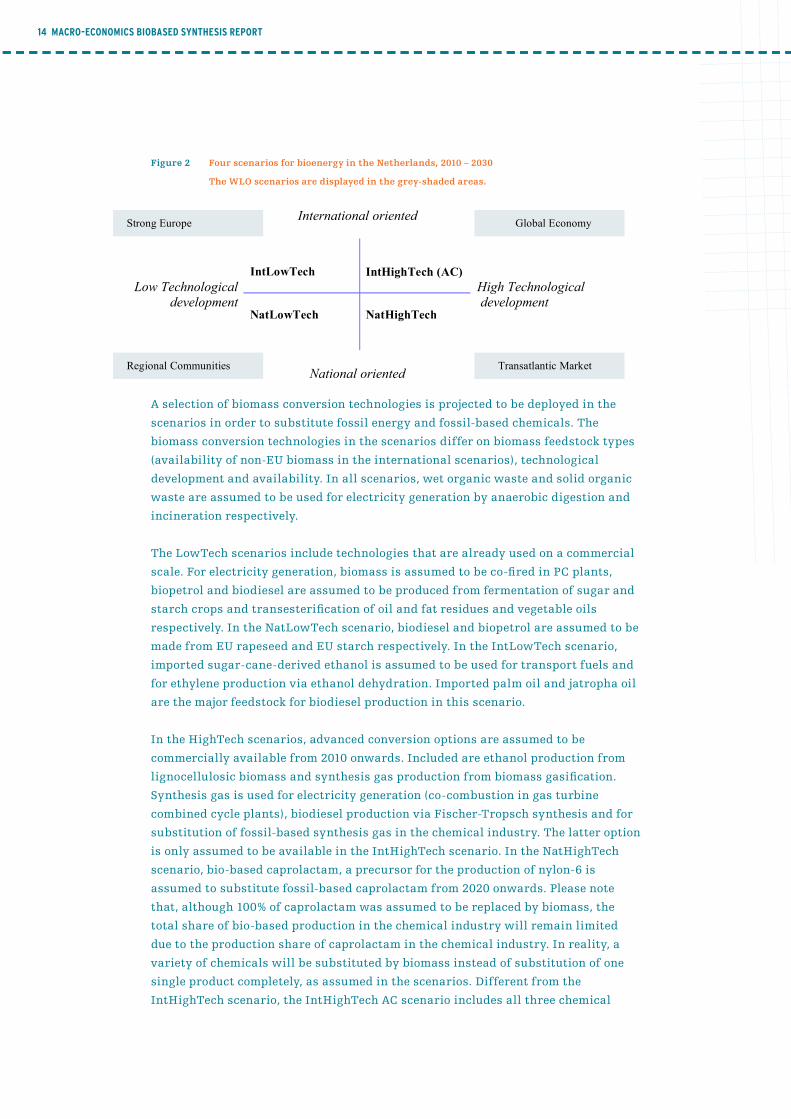
Figure 2 Four scenarios for bioenergy in the Netherlands, 2010 – 2030
The WLO scenarios are displayed in the grey-shaded areas.
6
Strong Europe International oriented
Global Economy
IntLowTech
IntHighTech (AC)
Low Technological
development
NatLowTech
NatHighTech
High Technological
development
Regional Communities
National oriented Transatlantic Market
Figure 2 Four scenarios for bioenergy in the Netherlands, 2010 – 2030. The WLO-scenarios are
displayed in the gray shaded areas.
A selection of biomass conversion technologies is projected to be deployed in the scenarios in order to substitute fossil energy and fossil based chemicals. The biomass conversion technologies in the scenarios differ on biomass feedstock types (availability of non-EU biomass in the international scenarios), technological development and availability. In all scenarios, wet organic waste and solid organic waste are assumed to be used for electricity generation by anaerobic digestion and incineration respectively. The LowTech scenarios include technologies that are already used on commercial scale. For electricity generation, biomass are assumed to be co-fired in PC plants, biogasoline and biodiesel are assumed to be produced from fermentation of sugar and starch crops and transesterification of oil and fat residues and vegetable oils respectively. In the NatLowTech scenario, biodiesel and biogasoline are assumed to be made from EU rapeseed and EU starch respectively. In the IntLowTech scenario, imported sugar cane derived ethanol is assumed to be used for transport fuels and for ethylene production via ethanol dehydration. Imported palm oil and jatropha oil are the major feedstock for biodiesel production in this scenario. In the HighTech scenarios, advanced conversion options are assumed to be commercially available from 2010 onwards. Included are ethanol production from lignocellulosic biomass and synthesis gas production from biomass gasification. Synthesis gas is used for electricity generation (co-combustion in gas turbine combined cycle plants), biodiesel production via Fischer-Tropsch synthesis and for substitution of fossil based synthesis gas in the chemical industry. The latter option is only assumed to be available in the IntHighTech scenario. In the NatHighTech scenario, biobased caprolactam, a precursor for the production of nylon-6 is assumed to substitute fossil based caprolactam from 2020 onwards. Please note that, although 100% of caprolacam was assumed to be replaced by biomass, the total share of biobased production in the chemical industry will remain limited as of the production share of caprolactam in the chemical industry. In reality, a variety of chemicals will be substituted by biomass instead of substitution of one single product completely as assumed in the scenarios. Different from the IntHighTech scenario, the IntHighTech AC scenario includes all three chemical representative routes in order to substitute 25% of fossil raw materials in the chemical industry as aimed by the PGG. The bottom-up model is a simple excel spreadsheet model with exogenous inputs of final energy demand from existing scenarios, a detailed technology dataset for bioenergy and
A selection of biomass conversion technologies is projected to be deployed in the
scenarios in order to substitute fossil energy and fossil-based chemicals. The
biomass conversion technologies in the scenarios differ on biomass feedstock types
(availability of non-EU biomass in the international scenarios), technological
development and availability. In all scenarios, wet organic waste and solid organic
waste are assumed to be used for electricity generation by anaerobic digestion and
incineration respectively.
The LowTech scenarios include technologies that are already used on a commercial
scale. For electricity generation, biomass is assumed to be co-fired in PC plants,
biopetrol and biodiesel are assumed to be produced from fermentation of sugar and
starch crops and transesterification of oil and fat residues and vegetable oils
respectively. In the NatLowTech scenario, biodiesel and biopetrol are assumed to be
made from EU rapeseed and EU starch respectively. In the IntLowTech scenario,
imported sugar-cane-derived ethanol is assumed to be used for transport fuels and
for ethylene production via ethanol dehydration. Imported palm oil and jatropha oil
are the major feedstock for biodiesel production in this scenario.
In the HighTech scenarios, advanced conversion options are assumed to be
commercially available from 2010 onwards. Included are ethanol production from
lignocellulosic biomass and synthesis gas production from biomass gasification.
Synthesis gas is used for electricity generation (co-combustion in gas turbine
combined cycle plants), biodiesel production via Fischer-Tropsch synthesis and for
substitution of fossil-based synthesis gas in the chemical industry. The latter option
is only assumed to be available in the IntHighTech scenario. In the NatHighTech
scenario, bio-based caprolactam, a precursor for the production of nylon-6 is
assumed to substitute fossil-based caprolactam from 2020 onwards. Please note
that, although 100% of caprolactam was assumed to be replaced by biomass, the
total share of bio-based production in the chemical industry will remain limited
due to the production share of caprolactam in the chemical industry. In reality, a
variety of chemicals will be substituted by biomass instead of substitution of one
single product completely, as assumed in the scenarios. Different from the
IntHighTech scenario, the IntHighTech AC scenario includes all three chemical
analysis of the econoMic iMpact of large-scale deployMent of bioMass resources for energy and Materials in the netherlands 15
representative routes in order to substitute 25% of fossil raw materials in the
chemical industry, as targeted by the PGG.
The bottom-up model is a simple Excel spreadsheet model with exogenous inputs of
final energy demand from existing scenarios, a detailed technology dataset for
bioenergy and bio-based materials and scenario-dependent assumption on the use
of biomass by these different technologies. Scenarios include cost estimates and
supply potentials for fossil-based and bio-based energy carriers.
2.1.1 Input data
The baseline situation includes a detailed assessment of current biomass use for
bioenergy. It was not feasible to quantify the current use of biomass for bio-based
chemicals as these statistics are not reported. The baseline situation also includes
information on the structure of the electricity sector (vintage). This data is used to
model the replacement rate of retired capacities in the electricity generation sector.
Projections of final energy demand for electricity, transport fuels and chemicals
are used to estimate the demand for primary fossil energy carriers and the
substitution potential of biomass. The bottom-up projections include final energy
demand projections from the WLO scenarios [Janssen, Okker et al., 2006]. The final
energy demands in the LEITAP projections are modelled endogenously.
The technology database includes the technology characterisation and aggregation
per sector and commodity. A selection of representative technologies was made for
the current situation and for the various scenarios until 2030 (see part I for a more
detailed description). This implies that technologies were also considered that are
not yet commercialised. Data on cost and performance of these technologies was
collected from bottom-up engineering studies. Future projections of cost were made
using economies of scale, technological learning and innovation factors. The Excel
model includes a detailed database of these technologies, but in order to assess the
results for the data calibration process with the production functions in the top-
down model, the technologies in this study are aggregated to single commodity
options.
For the bottom-up estimations of cost and supply of biomass in the scenarios,
existing studies were used that estimate the cost and supply relations for biomass
energy crops produced in the EU27+ region [Wit et al., 2007] and the global supply
potential [Hoogwijk et al., 2005]. Furthermore, domestic supply of primary,
secondary and tertiary residues are taken into account. The projected supply of
residues are based on PGG publications [Rabou et al., 2006; Kip et al., 2007] and
[Koppejan et al., 2005]. For evaluation, the results are compared with the cost and
supply of biomass that result from the top-down model outcomes.
2.1.2 Bottom-up biomass blending shares and model interaction
The amount of fossil energy that can be substituted by biomass depends mainly on
cost and supply of biomass and the techno-economic performance of biomass
16 Macro-econoMics biobased synthesis report analysis of the econoMic iMpact of large-scale deployMent of bioMass resources for energy and Materials in the netherlands 17
conversion technologies. The blending targets, i.e. the fossil energy fractions of
fossil resources that can be replaced by biomass, are different per scenario and are
based on policy objectives and the performance on technologies in the different
scenarios.
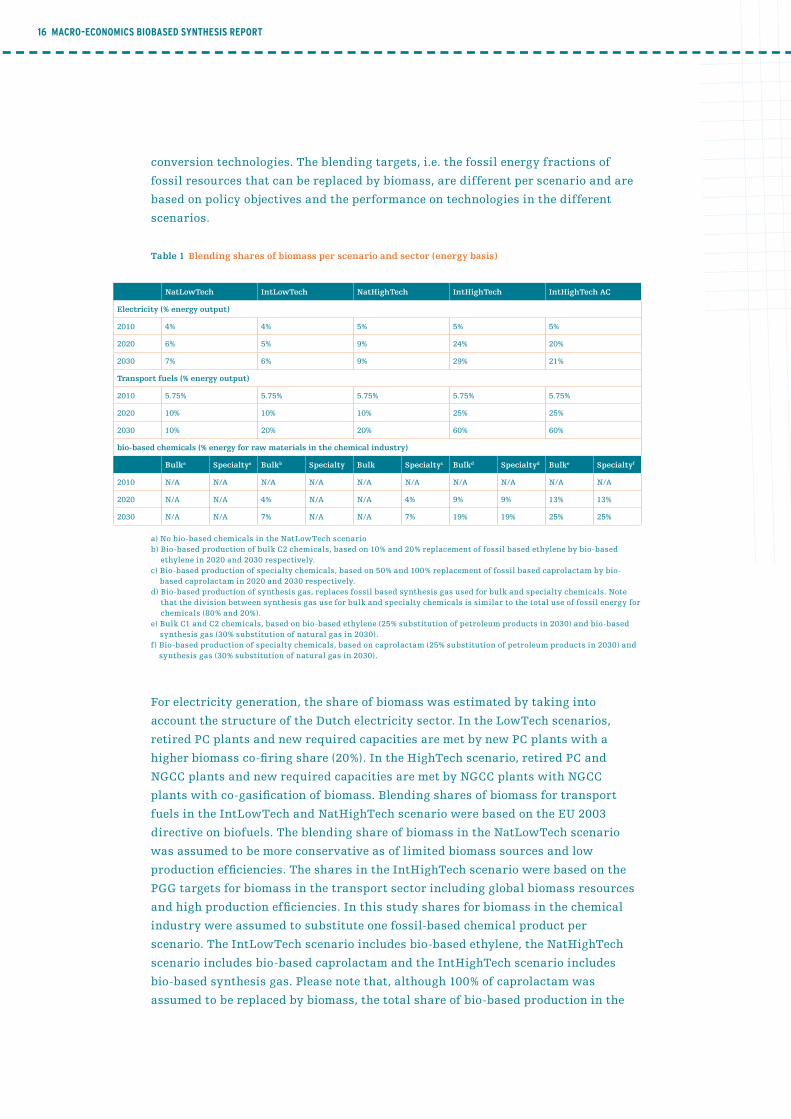
Table 1 Blending shares of biomass per scenario and sector (energy basis)
NatLowTech IntLowTech NatHighTech IntHighTech IntHighTech AC
Electricity (% energy output)
2010 4% 4% 5% 5% 5%
2020 6% 5% 9% 24% 20%
2030 7% 6% 9% 29% 21%
Transport fuels (% energy output)
2010 5.75% 5.75% 5.75% 5.75% 5.75%
2020 10% 10% 10% 25% 25%
2030 10% 20% 20% 60% 60%
bio-based chemicals (% energy for raw materials in the chemical industry)
Bulka Specialtya Bulkb Specialty Bulk Specialtyc Bulkd Specialtyd Bulke Specialtyf
2010 N/A N/A N/A N/A N/A N/A N/A N/A N/A N/A
2020 N/A N/A 4% N/A N/A 4% 9% 9% 13% 13%
2030 N/A N/A 7% N/A N/A 7% 19% 19% 25% 25%
a) No bio-based chemicals in the NatLowTech scenariob) Bio-based production of bulk C2 chemicals, based on 10% and 20% replacement of fossil based ethylene by bio-based
ethylene in 2020 and 2030 respectively.c) Bio-based production of specialty chemicals, based on 50% and 100% replacement of fossil based caprolactam by bio-
based caprolactam in 2020 and 2030 respectively.d) Bio-based production of synthesis gas, replaces fossil based synthesis gas used for bulk and specialty chemicals. Note
that the division between synthesis gas use for bulk and specialty chemicals is similar to the total use of fossil energy for chemicals (80% and 20%).
e) Bulk C1 and C2 chemicals, based on bio-based ethylene (25% substitution of petroleum products in 2030) and bio-based synthesis gas (30% substitution of natural gas in 2030).
f) Bio-based production of specialty chemicals, based on caprolactam (25% substitution of petroleum products in 2030) and synthesis gas (30% substitution of natural gas in 2030).
For electricity generation, the share of biomass was estimated by taking into
account the structure of the Dutch electricity sector. In the LowTech scenarios,
retired PC plants and new required capacities are met by new PC plants with a
higher biomass co-firing share (20%). In the HighTech scenario, retired PC and
NGCC plants and new required capacities are met by NGCC plants with NGCC
plants with co-gasification of biomass. Blending shares of biomass for transport
fuels in the IntLowTech and NatHighTech scenario were based on the EU 2003
directive on biofuels. The blending share of biomass in the NatLowTech scenario
was assumed to be more conservative as of limited biomass sources and low
production efficiencies. The shares in the IntHighTech scenario were based on the
PGG targets for biomass in the transport sector including global biomass resources
and high production efficiencies. In this study shares for biomass in the chemical
industry were assumed to substitute one fossil-based chemical product per
scenario. The IntLowTech scenario includes bio-based ethylene, the NatHighTech
scenario includes bio-based caprolactam and the IntHighTech scenario includes
bio-based synthesis gas. Please note that, although 100% of caprolactam was
assumed to be replaced by biomass, the total share of bio-based production in the

analysis of the econoMic iMpact of large-scale deployMent of bioMass resources for energy and Materials in the netherlands 17
chemical industry will remain limited due to the production share of caprolactam
in the chemical industry. In reality, a variety of chemicals will be substituted by
biomass instead of substitution of one single product completely, as assumed in the
scenarios. The IntHighTech AC includes all three chemical representative routes in
order to substitute 25% of fossil raw materials in the chemical industry as targeted
by the PGG.
2.2 Modelling approach under the Macro-economic Model LEITAP
2.2.1 The GTAP-E model
The methodological improvements of standard economic model such as the
standard GTAP model are crucial for an economic modelling of biomass demand in
the bio-based industries. The starting point for the analysis here was the standard
version of the general equilibrium model GTAP which has been extended for energy
and biomass markets necessary to model biomass demand.3 An important aspect for
this study is related to the question, how the shift in technologies in the bio-based
industries is implemented for the different scenarios described in part I of the
study. The main difference between the scenarios are the degree of openness of the
economy, i.e. National versus International scenarios, and the shift from Low to
High technologies.
The implementation of biofuels builds on a modified version of the GTAP multi-
sector multi-region CGE model [Hertel, 1997]. This multi-region model allows the
capture of inter-country effects, since the enhanced biofuel use influences demand
and supply, and therefore prices on world markets and hence will affect trade flows,
production, and GDP. The multi-sector dimension enables to study the link between
energy, transport, and agricultural markets. The model is extended through the
introduction of energy substitution into production by allowing energy and capital
to be either substitutes or complements (GTAP-E; Burniaux and Truong, 2002).
Compared to the standard presentation of production technology, the GTAP-E model
aggregates all energy-related inputs for the petrol sector – such as crude oil, gas,
electricity, coal, and petrol products – in the nested structure under the value added
side. At the highest level the energy-related inputs and the capital inputs are
modelled as an aggregated ‘capital-energy’ composite (Figure 3, left panel).4
To introduce the demand for biofuels, the nested constant elasticity of substitution
(CES) function of the GTAP-E model has been adjusted and extended to model the
substitution between different categories of oil (oil from biofuel crops and crude
oil), ethanol, and petroleum products in the value added nest of the petroleum
sector. The model presents the fuel production at the level of non-coal inputs
3 ForfurtherinformationandanapplicationoftheextendedLEITAPmodelseealsoBanseetal.
[2008].
4 Theunderlyingtechnologiesfortheotherbio-basedsectorsareoutlinedanddiscussedinpartIIof
thestudy.
analysis of the econoMic iMpact of large-scale deployMent of bioMass resources for energy and Materials in the netherlands 1918 Macro-econoMics biobased synthesis report analysis of the econoMic iMpact of large-scale deployMent of bioMass resources for energy and Materials in the netherlands 19
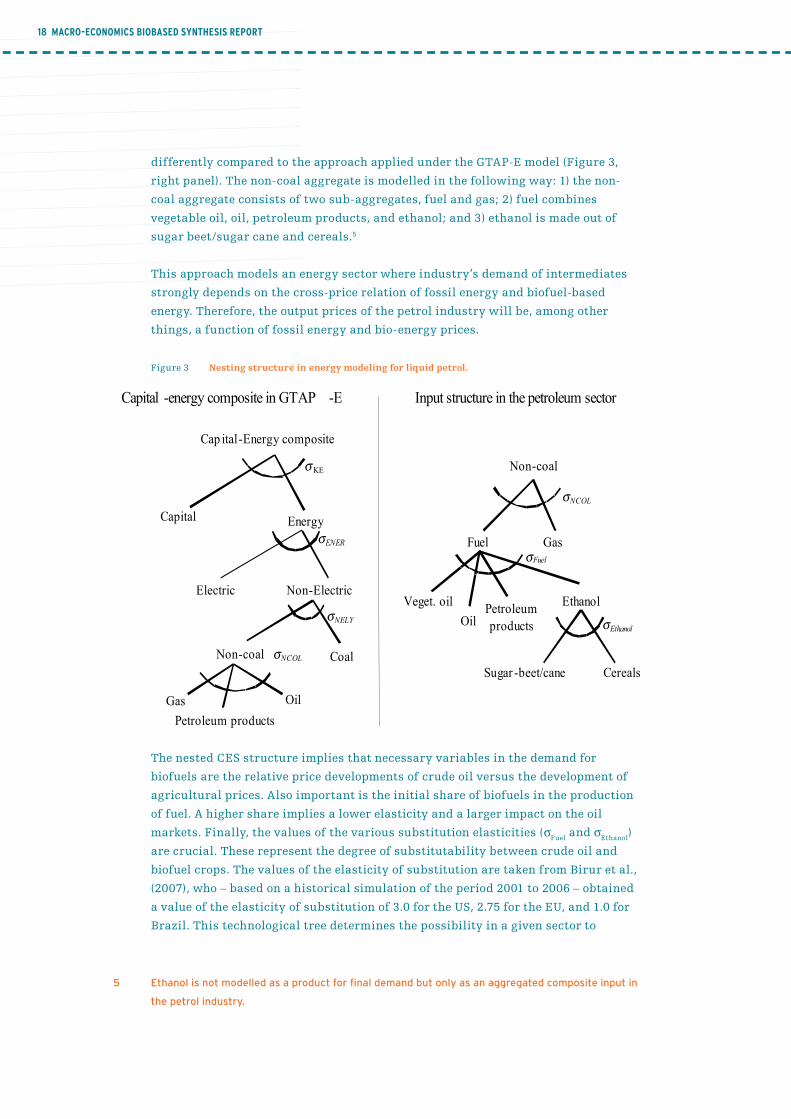
differently compared to the approach applied under the GTAP-E model (Figure 3,
right panel). The non-coal aggregate is modelled in the following way: 1) the non-
coal aggregate consists of two sub-aggregates, fuel and gas; 2) fuel combines
vegetable oil, oil, petroleum products, and ethanol; and 3) ethanol is made out of
sugar beet/sugar cane and cereals.5
This approach models an energy sector where industry’s demand of intermediates
strongly depends on the cross-price relation of fossil energy and biofuel-based
energy. Therefore, the output prices of the petrol industry will be, among other
things, a function of fossil energy and bio-energy prices.
Figure 3 Nesting structure in energy modeling for liquid petrol.
Figure 3 Nesting structure in energy modelling for liquid petrol
10
This approach models an energy sector where industry’s demand of intermediates strongly depends on the cross-price relation of fossil energy and biofuel-based energy. Therefore, the output prices of the petrol industry will be, among other things, a function of fossil energy and bio-energy prices.
The nested CES structure implies that necessary variables of the demand for biofuels are the relative price developments of crude oil versus the development of agricultural prices. Also important is the initial share of biofuels in the production of fuel. A higher share implies a lower elasticity and a larger impact on the oil markets. Finally, the values of the various substitution elasticities (�Fuel and �Ethanol) are crucial. These represent the degree of substitutability between crude oil and biofuel crops. The values of the elasticity of substitution are taken from Birur et al., (2007), who—based on a historical simulation of the period 2001 to 2006—obtained a value of the elasticity of substitution of 3.0 for the US, 2.75 for the EU, and 1.0 for Brazil. This technological tree determines the possibility in a given sector to substitute for different production factors (labor, capital, land and natural resources) and energy inputs. Apart from the already mentioned elasticities of substitution between these individual inputs or aggregates of inputs the initial cost shares play an important role in the demand for energy inputs or production factors. If a sector has only a little initial cost share, even strong shifts in relative price will not cause drastic shifts in the composition of intermediate inputs. As an example, if the initial share of bio-
σENER
Electric
Coal
σNELY
Gas
σNCOL Non-coal
Capital Energy
σ KE
Non-Electric
Gas
σNCOL
Fuel
σEthanol
Sugar -beet/cane Cereals
Ethanol Veget. oil
σFuel
Petroleum
products Oil
Capital -energy composite in GTAP -E Input structure in the petroleum sector
Non-coal
Cap ital-Energy composite
Oil
Petroleum products
Figure 3 Nesting structure in energy modeling for liquid petrol. The nested CES structure implies that necessary variables in the demand for
biofuels are the relative price developments of crude oil versus the development of
agricultural prices. Also important is the initial share of biofuels in the production
of fuel. A higher share implies a lower elasticity and a larger impact on the oil
markets. Finally, the values of the various substitution elasticities (σFuel
and σEthanol
)
are crucial. These represent the degree of substitutability between crude oil and
biofuel crops. The values of the elasticity of substitution are taken from Birur et al.,
(2007), who – based on a historical simulation of the period 2001 to 2006 – obtained
a value of the elasticity of substitution of 3.0 for the US, 2.75 for the EU, and 1.0 for
Brazil. This technological tree determines the possibility in a given sector to
5 Ethanolisnotmodelledasaproductforfinaldemandbutonlyasanaggregatedcompositeinputin
thepetrolindustry.

analysis of the econoMic iMpact of large-scale deployMent of bioMass resources for energy and Materials in the netherlands 19analysis of the econoMic iMpact of large-scale deployMent of bioMass resources for energy and Materials in the netherlands 19
substitute for different production factors (labour, capital, land and natural
resources) and energy inputs. Apart from the aforementioned elasticities of
substitution between these individual inputs or aggregates of inputs, the initial cost
shares play an important role in the demand for energy inputs or production
factors. If a sector has only a small initial cost share, even strong shifts in relative
price will not cause drastic shifts in the composition of intermediate inputs. As an
example, if the initial share of bio-based inputs in a sector is relatively small it will
also remain small, even under strong shifts between fossil and bio-based input
prices.6
In addition, prices for outputs of the petroleum industry will depend on any
subsidies/tax exemptions affecting the price ratio between fossil energy and
bioenergy. Finally, and most important for current bioenergy policies, the level of
demand for bio-based output will be determined by any enforcement of national
targets through, for example, mandatory inclusion rates or the provision of input
subsidies to the bio-based industries.
In this study biomass policies are modelled as mandatory blending obligations
fixing the share of bio-based inputs in transport fuel, natural gas, electricity and
chemicals. It should be mentioned that this mandatory blending is budget neutral
from a government point of view. To achieve this in a CGE model two policies were
implemented. First, the share of biomass inputs in the bio-based industries are
specified and made exogenous such that it can be set at a certain target. An input
specific subsidy on biomass is specified endogenously to achieve the necessary
biomass share. The input subsidy is needed to change the relative price ratio
between biomass and fossil energy inputs. If the bioenergy share is lower than the
target, a specific subsidy on biomass inputs is introduced to make them more
competitive. Second, to implement this incentive instrument as a ‘budget-neutral’
instrument, it is counter-financed by an end-user tax on consumption of output
from bio-based sectors. The end-user taxes on bio-based products are made
endogenous to generate the necessary budget to finance the subsidy on biomass
inputs necessary to fulfil the mandatory blending. Due to the end-user tax,
consumers pay for the mandatory blending as end-user prices of blended petrol,
electricity, gas or chemicals increase. The higher price results from the use of more
expensive biomass inputs relative to fossil energy inputs in the production of bio-
based products.
2.2.2 Assumptions for different scenarios
One of the main goals of this study is to show the consequences of different degrees
of biomass use in the Dutch economy, under alternative technology assumptions and
different degree of openness. The macro-economic model has to be adjusted to
represent these differences between the scenarios.
6 Thisfeatureofthemacro-economicmodelappliedforthisstudywillbediscussedfurtherbelow.
TheinitialdatabaseandtheadjustmentsweappliedtoitareoutlinedinpartIIofthereport.

20 Macro-econoMics biobased synthesis report analysis of the econoMic iMpact of large-scale deployMent of bioMass resources for energy and Materials in the netherlands 21
In terms of openness, we vary the trade elasticities (Armington elasticities) which
determine the degree that domestic producers/consumers react to changes in the
ratio of domestic and international prices. Under the ‘National’ scenarios we apply
lower values while under the ‘International’ scenarios the level are doubled
compared with those applied for the ‘National’ scenarios. The higher trade
elasticities under the ‘International’ scenario will lead to a stronger increase in
imports if domestic demand expands.
Alternative technologies (LowTech vs. HighTech): The main difference between the
HighTech and the LowTech scenarios is the different degree of the substitutability
between biomass and fossil inputs in the bio-based industries. We assume that
under the LowTech scenario production of the bio-based industries is mainly based
on current (1st-generation biomass) technologies, while under HighTech scenarios
the use of 1st-generation biomass is mainly substituted by 2nd-generation biomass.
Therefore, we assume that under the LowTech scenarios mainly 1st-generation
biofuels than can be substituted with fossil fuels based on a technology with
relatively low efficiency of biomass conversion which is a consequence of low
elasticities of substitution between biomass and fossil inputs, and the assumption
of ‘neutral’ technical progress. However, especially under the LowTech scenarios,
the efficiency of biomass conversion is assumed to be low, which leads to a relative
low elasticity between fossil and biomass energy inputs and consequently also to
low cost shares of biomass inputs in the bio-based industries.
Apart from the assumption of the higher degree of substitutability of biomass with
fossil inputs under the HighTech scenario we also assume that the conversion
efficiency is higher compared with the LowTech scenarios. This is implemented in
the macro-economic model by different assumptions on the rate of input
augmenting technical progress. Under the LowTech scenario we assume that the
technical progress is ‘neutral’ without affecting the composition of intermediate
demand in different sectors. A graphical presentation is given in the following
Figure 4. In the initial situation a bio-based industry produces the output Q1
(illustrated by the isoquant Q1) with a mix of fossil and biomass inputs of v1 and r1,
respectively. The quantity of demanded inputs is determined by the price ratio of
fossil and biomass input, p.
analysis of the econoMic iMpact of large-scale deployMent of bioMass resources for energy and Materials in the netherlands 21
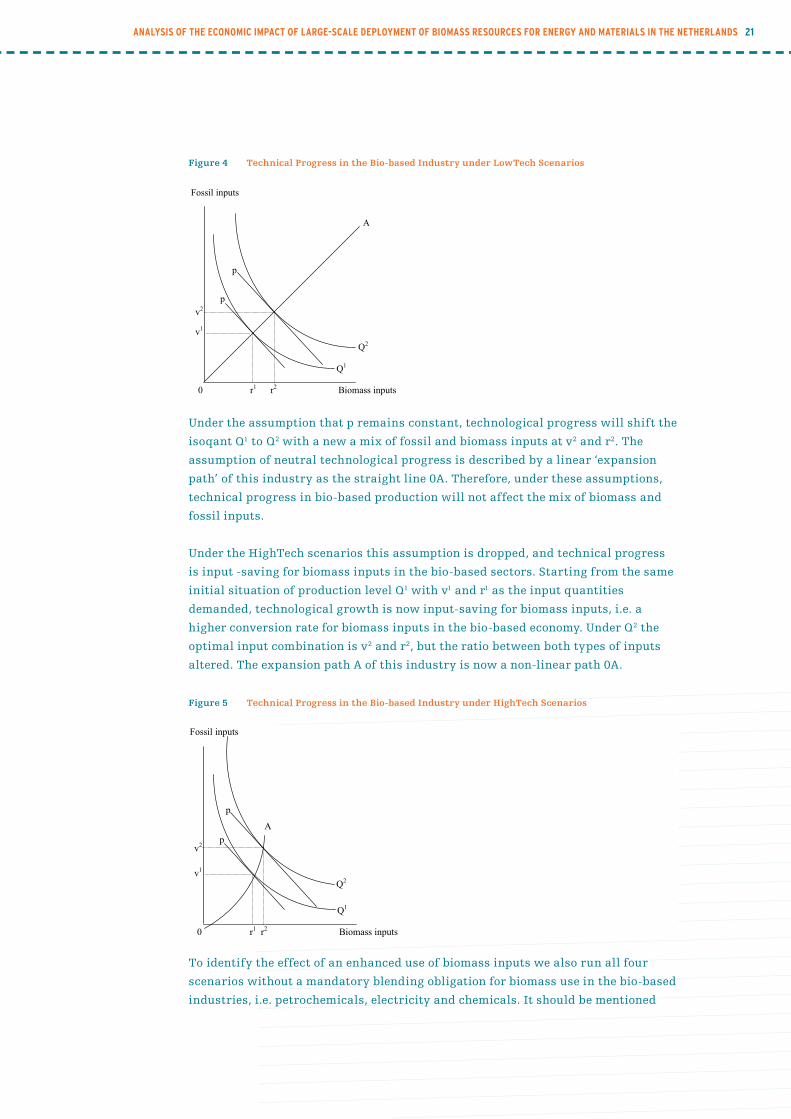
Figure 4 Technical Progress in the Bio-based Industry under LowTech Scenarios
12
generation biomass) technologies, while under HighTech scenarios the use of 1st generation biomass use is mainly substituted by 2nd generation biomass. Therefore, we assume that under the LowTech scenarios mainly 1st generation biofuels than can be substituted with fossil fuels based on a technology with relatively low efficiency of biomass conversion which is a consequence of first, low elasticities of substitution between biomass and fossil inputs and second, the assumption of ‘neutral’ technical progress. However, especially under the LowTech scenarios the efficiency of biomass conversion is assumed to be low which leads to a relative low elasticity between fossil and biomass energy inputs and consequently also to low cost shares of biomass inputs in the bio-based industries. Apart from the assumption of the higher degree of substitutability of biomass with fossil inputs under the HighTech scenario we also assume that the conversion efficiency is higher compared with the LowTech scenarios. This is implemented in the macro-economic model by different assumptions on the rate of input augmenting technical progress. Under the LowTech scenario we assume that the technical progress is ‘neutral’ without affecting the composition of intermediate demand in different sectors. A graphical presentation is given in the following Figure 4. In the initial situation a bio-based industry produces the output Q1 (illustrated by the isoquant Q1) with a mix of fossil and biomass inputs of v1 and r1, respectively. The quantity of demanded inputs is determined by the price ratio of fossil and biomass input, p.
Figure 4 Technical Progress in the Bio-based Industry under LowTech Scenarios.
Q2
Fossil inputs
0 r1 r2 Biomass inputs
A
Q1
v2
v1
p
p
Under the assumption that p remains constant, technological progress will shift the
isoqant Q1 to Q2 with a new a mix of fossil and biomass inputs at v2 and r2. The
assumption of neutral technological progress is described by a linear ‘expansion
path’ of this industry as the straight line 0A. Therefore, under these assumptions,
technical progress in bio-based production will not affect the mix of biomass and
fossil inputs.
Under the HighTech scenarios this assumption is dropped, and technical progress
is input -saving for biomass inputs in the bio-based sectors. Starting from the same
initial situation of production level Q1 with v1 and r1 as the input quantities
demanded, technological growth is now input-saving for biomass inputs, i.e. a
higher conversion rate for biomass inputs in the bio-based economy. Under Q2 the
optimal input combination is v2 and r2, but the ratio between both types of inputs
altered. The expansion path A of this industry is now a non-linear path 0A.
Figure 5 Technical Progress in the Bio-based Industry under HighTech Scenarios
13
Under the assumption that p remains constant, technological progress will shift the isoqant Q1 to Q2 with a new a mix of fossil and biomass inputs at v2 and r2. The assumption of neutral technological progress is described by a linear ‘expansion path’ of this industry as the straight line 0A. Therefore, under these assumptions, technical progress in bio-based production will not affect the mix of biomass and fossil inputs. Under the HighTech scenarios this assumption is dropped, and technical progress is input saving for biomass inputs in the bio-based sectors. Starting for the same initial situation of production level Q1 with v1 and r1 as the input quantities demanded, technological growth is now input-saving for biomass inputs, i.e. a higher conversion rate for biomass inputs in the bio-based economy. Under Q2 the optimal input combination is v2 and r2, but the ratio between both types of inputs altered. The expansion path A of this industry is now a non-linear path 0A.
Figure 5 Technical Progress in the Bio-based Industry under HighTech Scenarios.
To identify the effect of an enhanced use of biomass inputs we also run all four scenarios without a mandatory blending obligation for biomass use in the bio-based industries, i.e. petrochemicals, electricity and chemicals. It should be mentioned that even without a mandatory blending the use of biomass inputs changes due to changes in relative prices (biomass crops vs. fossil fuel). Especially in the HighTech scenarios it can be assumed that the required subsidies for the biomass use will strongly decline due to the high technological progress we assume for these scenarios.
Q2
Fossil inputs
0 r1 r2 Biomass inputs
A
Q1
v2
v1
p
p
To identify the effect of an enhanced use of biomass inputs we also run all four
scenarios without a mandatory blending obligation for biomass use in the bio-based
industries, i.e. petrochemicals, electricity and chemicals. It should be mentioned

22 Macro-econoMics biobased synthesis report analysis of the econoMic iMpact of large-scale deployMent of bioMass resources for energy and Materials in the netherlands 23
that even without a mandatory blending the use of biomass inputs changes due to
changes in relative prices (biomass crops vs. fossil fuel). Especially in the HighTech
scenarios it can be assumed that the required subsidies for the biomass use will
strongly decline due to the high technological progress we assume for these scenarios.
2.3 Integration of the LEITAP projections into the bottom-up model
The results of the bottom-up study, as in the bottom-up reports, includes projections
of energy demand and growth in the chemical industry sectors based on the WLO
scenarios as displayed in Figure 1. For this report, the projection results of the top-
down LEITAP are translated into physical input parameters for the bottom-up
model. This section describes how the data is translated from monetary outputs of
the LEITAP model to physical input parameters. The results of the synthesis of both
models are presented in section 3.
2.3.1 Transport fuels
Figure 6 Biofuels in the bottom-up scenarios (left bars) and the top-down scenarios (right bars)
14
2.3 Integration of the LEITAP projections in the bottom-up model
The results of the bottom-up study, as in the bottom-up reports includes projections of energy demand and growth in the chemical industry sectors based on the WLO-scenarios as displayed in figure 1. For this report, the projection results of the top-down LEITAP and translated into physical input parameters for the bottom-up model. This section describes how the data is translated from monetary outputs of the LEITAP model to physical input parameters. The results of the synthesis of both models are presented in section 3.
2.3.1 Transport fuels
Figure 6 displays the projections of biofuel per feedstock type. The right bars summerize the results of the LEITAP projections, the left bars summerize the results of the bottom-up projections based on the WLO-scenarios. There are two important differences between these projections. The results of the HighTech scenarios of the bottom-up study, only include transport fuels from lignocellulosic feedstock whereas the LEITAP projections still include a large share of oil crops and some sugar and starch crops. Furthermore, the total production of biofuels in the LowTech scenarios and the NatHighTech scenarios is 14 to 35% higher in
the LEITAP projections as a result of the higher demand for transport fuels relative to the WLO-projections used for the bottom-up results. For this report, both the final demand as the shares of crop types of the LEITAP results are integrated in the bottom-up model. All sugar crops are assumed to be sugar cane, the ratio for ethanol and FT-diesel from woody biomass is assumed to be similar to the initial bottom-up projections.
2.3.2 Electricity
Figure 7 presents the results of the bottom-up and LEITAP projections for electricity generation. Note that the results of the LEITAP projections are translated to physical units to make the results comparable. The replacement of retired existing capacities is assumed to be similar to the bottom-up scenarios (section 3.2 of the bottom-up report). The final demand is based on projections of the LEITAP model and is, apart from the NatLowTech scenario, lower than the WLO projections which are used for the bottom-up results. Also co-production of electricity is slightly lower in the top-down projections as
0
50
100
150
200
250
300
350
400
450
NatLo
wTe
ch
IntLow
Tech
NatHighT
ech
IntH
ighT
ech
IntH
ighT
echA
C
Bio
fuel (P
J)
Veget. Oils
Woody crops
Sugar
Grain
TD-projections
BU-projections
Figure 6 Biofuels in the bottom-up scenarios (left bars) and
the top-down scenarios (right bars).
Figure 6 displays the projections of biofuel per feedstock type. The bars on the right
summarise the results of the LEITAP projections, the bars on the left summarise
the results of the bottom-up projections based on the WLO scenarios. There are two
important differences between these projections. The results of the HighTech
scenarios of the bottom-up study, only include transport fuels from lignocellulosic
feedstock whereas the LEITAP projections still include a large share of oil crops and
some sugar and starch crops. Furthermore, the total production of biofuels in the
LowTech scenarios and the NatHighTech scenarios is 14-35% higher in the LEITAP
projections as a result of the higher demand for transport fuels relative to the WLO
projections used for the bottom-up results. For this report, both the final demand as
the shares of crop types of the LEITAP results are integrated in the bottom-up

analysis of the econoMic iMpact of large-scale deployMent of bioMass resources for energy and Materials in the netherlands 23
model. All sugar crops are assumed to be sugar cane, while the ratio for ethanol and
FT-diesel from woody biomass is assumed to be similar to the initial bottom-up
projections.
2.3.2 Electricity
Figure 7 presents the results of the bottom-up and LEITAP projections for
electricity generation. Note that the results of the LEITAP projections are translated
into physical units to make the results comparable. The replacement of retired
existing capacities is assumed to be similar to the bottom-up scenarios (section 3.2
of the bottom-up report). The final demand is based on projections of the LEITAP
model and, apart from the NatLowTech scenario, is lower than the WLO projections,
which are used for the bottom-up results. Also co-production of electricity is
slightly lower in the top-down projections as these scenarios include more 1st-
generation technologies for biofuel production without co-generation of electricity
(Figure 6).
Figure 7 Electricity generation in the bottom-up scenarios (left bars)
and the top-down scenarios (right bars)
15
these scenarios include more 1st generation technologies for biofuel production without co-generation of electricity (Figure 6).
-30
20
70
120
170
220
Na
tLo
wT
ech
IntL
ow
Te
ch
NatH
ighT
ech
IntH
ighT
ech
IntH
ighT
ech
AC
TWh
Co-gen. fuel/chem. prod.
Biomass co-gasif ication
Gas new
Gas (old)
Biomass co-f iring
Coal (new )
Coal (old)
Decentral (gas CHP)
Other renew ables
Biomass digestion
MSW incineration
Nuclear
Import/export
TD-projections
BU-projections
Figure 7 Electricity generation in the bottom-up scenarios (left bars) and the top-down scenarios
(right bars).
2.3.3 Chemicals
For chemicals, the projected growth of the chemical industries is used to estimate the demand for energy and biomass in the scenarios. Figure 8 shows the size of the chemical industries as projected using the WLO-scenarios (left bars) and the LEITAP projections (right bars). The variation between the scenarios is much larger for the WLO-based bottom-up scenarios than the LEITAP projections. This is mainly the result of efficiency improvements in the high-tech scenarios and different socio-economic assumptions7.
7 GDP and population growth are equal for all LEITAP scenario projections. In the WLO-scenarios, these
parameters vary significantly over the four WLO-scenarios.
2.3.3 Chemicals
For chemicals, the projected growth of the chemical industries is used to estimate
the demand for energy and biomass in the scenarios. Figure 8 shows the size of the
chemical industries as projected using the WLO scenarios (left bars) and the
LEITAP projections (right bars). The variation between the scenarios is much larger
for the WLO-based bottom-up scenarios than the LEITAP projections. This is
mainly the result of efficiency improvements in the high-tech scenarios and
different socio-economic assumptions7.
7 GDPandpopulationgrowthareequalforallLEITAPscenarioprojections.IntheWLOscenarios,
theseparametersvarysignificantlyoverthefourWLOscenarios.

analysis of the econoMic iMpact of large-scale deployMent of bioMass resources for energy and Materials in the netherlands 2524 Macro-econoMics biobased synthesis report analysis of the econoMic iMpact of large-scale deployMent of bioMass resources for energy and Materials in the netherlands 25
Figure 8 Final energy demand of the chemical industry sectors in the bottom-up (left bars) and top-
down (right bars) scenarios
16
-100
100
300
500
700
900
1100
1300
1500
IntL
ow
Te
ch
NatH
ighT
ech
IntH
ighT
ech
IntH
ighT
ech
AC
Fin
al
en
erg
y (
PJ
) Replaced by biomass
Natural gas
Petroleum products
Electricity
Others
TD-projections
BU-projections
Figure 8 Final energy demand of the chemical industry sectors in the bottom-up (left bars) and top-
down (right bars) scenarios.
The projections of the LEITAP model for biofuels, electricity generation and chemicals (Figure 6 through Figure 9) are integrated in the bottom-up model to generate the results of section 3. The initial results, based on the WLO-projections, are also included for reason of comparison. In general, the projections of energy demand in the LEITAP results are higher for the NatLowTech scenario and lower for the other scenarios. This is in particular true for electricity demand and energy demand in the chemical industries of the IntHighTech scenarios. The total demand for bioenergy and the total amount of fossil energy and GHGs avoided is therefore in the IntHighTech scenarios as covered in the section 3.
The projections of the LEITAP model for biofuels, electricity generation and
chemicals (Figure 6 through Figure 9) are integrated into the bottom-up model to
generate the results of section 3. The initial results, based on the WLO projections,
are also included for comparison.
In general, the projections for energy demand in the LEITAP results are higher for
the NatLowTech scenario and lower for the other scenarios. This is particularly
true for electricity demand and energy demand in the chemical industries of the
IntHighTech scenarios. The total demand for bioenergy and the total amount of
fossil energy and GHGs avoided is therefore in the IntHighTech scenarios as
covered in section 3.
analysis of the econoMic iMpact of large-scale deployMent of bioMass resources for energy and Materials in the netherlands 25analysis of the econoMic iMpact of large-scale deployMent of bioMass resources for energy and Materials in the netherlands 25
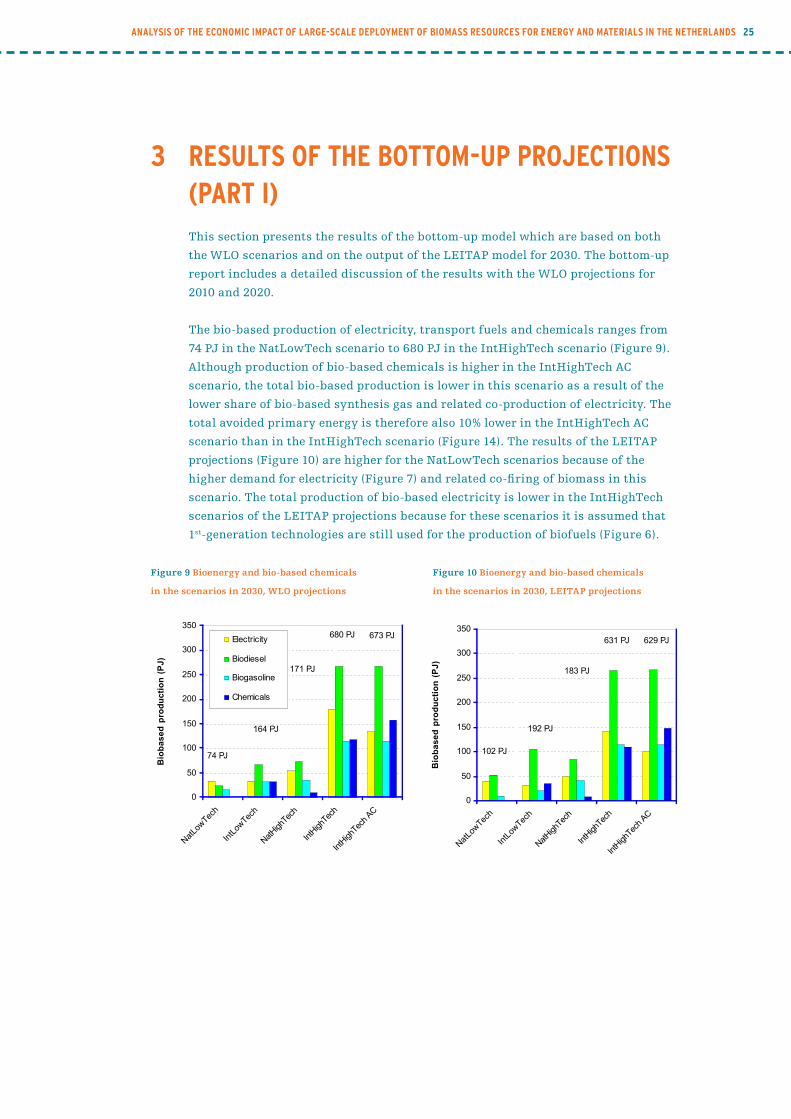
3 results of the bottoM-up projections (part i)This section presents the results of the bottom-up model which are based on both
the WLO scenarios and on the output of the LEITAP model for 2030. The bottom-up
report includes a detailed discussion of the results with the WLO projections for
2010 and 2020.
The bio-based production of electricity, transport fuels and chemicals ranges from
74 PJ in the NatLowTech scenario to 680 PJ in the IntHighTech scenario (Figure 9).
Although production of bio-based chemicals is higher in the IntHighTech AC
scenario, the total bio-based production is lower in this scenario as a result of the
lower share of bio-based synthesis gas and related co-production of electricity. The
total avoided primary energy is therefore also 10% lower in the IntHighTech AC
scenario than in the IntHighTech scenario (Figure 14). The results of the LEITAP
projections (Figure 10) are higher for the NatLowTech scenarios because of the
higher demand for electricity (Figure 7) and related co-firing of biomass in this
scenario. The total production of bio-based electricity is lower in the IntHighTech
scenarios of the LEITAP projections because for these scenarios it is assumed that
1st-generation technologies are still used for the production of biofuels (Figure 6).
Figure 9 Bioenergy and bio-based chemicals Figure 10 Bioenergy and bio-based chemicals
in the scenarios in 2030, WLO projections in the scenarios in 2030, LEITAP projections
17
3 Results of the bottom-up projections (part I) This section presents the results of the bottom-up model which are based on both the WLO-scenarios and based on the output of the LEITAP model for 2030. The bottom-up report includes a detailed discussion of the results with the WLO-projections for 2010 and 2020. The biobased production of electricity, transport fuels and chemicals ranges from 74 PJ in the NatLowTech scenario to 680 PJ in the IntHighTech scenario (Figure 9). Although production of biobased chemicals is higher in the IntHighTech AC scenario, the total biobased production is lower in this scenario as a result of the lower share of biobased synthesis gas and related co-production of electricity. The total avoided primary energy is therefore also 10% lower in the IntHighTech AC scenario than in the IntHighTech scenario (Figure 14 ). The results of the LEITAP-projections (Figure 10) are higher for the NatLowTech scenarios because of the higher demand for electricity (Figure 7) and related co-firing of biomass in this scenario. The total production of biobased electricity is lower in the IntHighTech scenarios of the LEITAP projections because for these scenarios it is assumed that 1st generation technologies are still used for the production of bioduels (Figure 6).
171 PJ
680 PJ 673 PJ
74 PJ
164 PJ
0
50
100
150
200
250
300
350
Nat
LowTec
h
IntL
owTec
h
NatHighT
ech
IntH
ighT
ech
IntH
ighT
ech AC
Bio
ba
se
d p
rod
uc
tio
n (
PJ
)
Electricity
Biodiesel
Biogasoline
Chemicals
Figure 9 Bioenergy and biobased chemicals in the
scenarios in 2030, WLO-projections.
183 PJ
631 PJ 629 PJ
102 PJ
192 PJ
0
50
100
150
200
250
300
350
Nat
LowTec
h
IntL
owTec
h
NatHighT
ech
IntH
ighT
ech
IntH
ighT
ech AC
Bio
ba
se
d p
rod
uc
tio
n (
PJ
)
Figure 10 Bioenergy and biobased chemicals in the
scenarios in 2030, LEITAP-projections.

26 Macro-econoMics biobased synthesis report analysis of the econoMic iMpact of large-scale deployMent of bioMass resources for energy and Materials in the netherlands 27
Figure 11 Required biomass from residues and Figure 12 Required biomass from residues and
energy crops per sector in 2030, WLO projections energy crops per sector in 2030, LEITAP projections
18
The required biomass for bioenergy and biobased materials in the NatLowTech scenario can almost entirely be met by domestic residues. For the production of biofuels, energy crops are required as 1st generation technologies in this scenario limit the use of residues for biofuels to fat and oil residues. In the IntLowTech scenario, a 10% higher blending share for biofuels and the production of biobased chemicals (bulk C2) increases the required biomass to almost 300 PJ. Although blending shares for biofuels are similar in the IntLowTech and the NatHighTech scenario, the lower conversion efficiency of FT-diesel in the IntHighTech scenario relative to biodiesel form vegetable oil in the IntLowTech scenario explains the higher demand for biomass in the NatHighTech scenario. The difference between the two IntHighTech scenarios is limited. For the IntHighTech AC scenario, more biomass is required to produce biobased chemicals (Figure 11). The result of the projections based on the LEITAP-scenarios (Figure 12) indicates that less biomass is required for the HighTech scenarios. Biodiesel from vegetable oil requires less biomass in terms of energy than biofuel from lignocellulosic biomass. Part of the higher demand for lignocellulosic biomass is compensated by co-production of electricity which is higher in the results of the WLO based bottom-up projections. The Greenhouse gas (GHG) emission reduction by substituting fossil energy by biomass ranges from 8 Mton CO2 eq. in 2030 for the NatLowTech scenario to 56 Mton CO2 eq. in the IntLowTech scenario The total avoided GHG emissions in the IntLowTech scenario and NatHighTech scenario were almost identical (Figure 15). Although advanced biodiesel production (FT-synthesis) improved the mitigation potential of transport fuels, there was little difference in the GHG mitigation performance of ethanol from sugar cane
390 PJ
1448 PJ1436 PJ
295 PJ
149 PJ
0
100
200
300
400
500
600
700
800
Nat
LowTec
h
IntL
owTec
h
NatHighT
ech
IntH
ighT
ech
IntH
ighT
ech AC
Bio
ma
ss
(P
J)
Crops
Residues
Chemicals
Biodiesel
Biogasoline
Electricity
Figure 11 Required biomass from residues and
energy crops per sector in 2030, WLO-projections.
326 PJ
1143 PJ1085 PJ
310 PJ178 PJ
0
100
200
300
400
500
600
700
800
Nat
LowTec
h
IntL
owTec
h
NatHighT
ech
IntH
ighT
ech
IntH
ighT
ech AC
Bio
ma
ss
(P
J)
Figure 12 Required biomass from residues and
energy crops per sector in 2030, LEITAP-
projections
The required biomass for bioenergy and bio-based materials in the NatLowTech
scenario can almost entirely be met by domestic residues. For the production of
biofuels, energy crops are required as 1st-generation technologies in this scenario
limit the use of residues for biofuels to fat and oil residues. In the IntLowTech
scenario, a 10% higher blending share for biofuels and the production of bio-based
chemicals (bulk C2) increases the required biomass to almost 300 PJ. Although
blending shares for biofuels are similar in the IntLowTech and the NatHighTech
scenario, the lower conversion efficiency of FT-diesel in the IntHighTech scenario
relative to biodiesel from vegetable oil in the IntLowTech scenario explains the
higher demand for biomass in the NatHighTech scenario. The difference between
the two IntHighTech scenarios is limited. For the IntHighTech AC scenario, more
biomass is required to produce bio-based chemicals (Figure 11). The result of the
projections based on the LEITAP-scenarios (Figure 12) indicates that less biomass is
required for the HighTech scenarios. Biodiesel from vegetable oil requires less
biomass in terms of energy than biofuel from lignocellulosic biomass. Part of the
higher demand for lignocellulosic biomass is compensated by co-production of
electricity which is higher in the results of the WLO-based bottom-up projections.
The greenhouse gas (GHG) emission reduction due to substituting fossil energy with
biomass ranges from 8 Mton CO2 eq. in 2030 for the NatLowTech scenario to 56
Mton CO2 eq. in the IntLowTech scenario. The total avoided GHG emissions in the
IntLowTech scenario and NatHighTech scenario were almost identical (Figure 15).
Although advanced biodiesel production (FT synthesis) improved the mitigation
potential of transport fuels, there was little difference in the GHG mitigation
performance of ethanol from sugar cane and lignocellulosic biomass8. Despite the
use of more efficient electricity generation technologies (co-gasification), the
8 Itshouldbenotedthoughthattheeffectofindirectlandusechangewasnottakenintoaccount.

analysis of the econoMic iMpact of large-scale deployMent of bioMass resources for energy and Materials in the netherlands 27
difference in GHG emissions avoided for the IntLowTech and NatHighTech scenario
was limited because biomass replaced mainly carbon-intensive coal in the low-tech
scenarios, while for the high-tech scenarios, relatively clean gas technologies were
assumed to be replaced by biomass. The projections, based on the LEITAP results
show a difference of ~10 Mton for CO2 mitigation in 2030 (Figure 14) as a result of
the lower demand for electricity, but mainly due to the moderate environmental
performance of biodiesel from vegetable oil still used on a large scale in these
scenarios.
Figure 13 Avoided non-renewable primary energy Figure 14 Avoided non-renewable primary energy
by biomass in the scenarios in 2030, WLO projections by biomass in the scenarios in 2030, LEITAP
projections
20
The total expenditures for bioenergy and biobased chemicals range from 1,073 M€ in the NatLowTech scenario to 9,655 M€ in the IntHighTech AC scenario in 2030. Cost for biofuel production from vegetable oil and sugar/starch crops are dominated by feedstock cost as, especially for biodiesel from vegetable oil, little conversion processes are required to produce biodiesel. The additional costs for substitution of fossil fuels with
203 PJ
220 PJ
113 PJ
833 PJ747 PJ
0
50
100
150
200
250
300
350
Nat
LowTec
h
IntL
owTec
h
NatHighT
ech
IntH
ighT
ech
IntH
ighT
ech AC
Av
oid
ed
pri
ma
ry e
ne
rgy
(P
J)
Electricity
Biodiesel
Biogasoline
Chemicals
Figure 13 Avoided non-renewable primary energy
by biomass in the scenarios in 2030, WLO-
projections.
198 PJ
238 PJ
146 PJ
758 PJ685 PJ
0
50
100
150
200
250
300
350
Nat
LowTec
h
IntL
owTec
h
NatHighT
ech
IntH
ighT
ech
IntH
ighT
ech AC
Av
oid
ed
pri
ma
ry e
ne
rgy
(P
J)
Figure 14 Avoided non-renewable primary energy
by biomass in the scenarios in 2030, LEITAP-
projections.
53 Mton
15 Mton
9 Mton
56 Mton
15 Mton
0
5
10
15
20
25
Nat
LowTec
h
IntL
owTec
h
NatHighT
ech
IntH
ighT
ech
IntH
ighT
ech AC
GH
G m
itig
ati
on
(M
ton
CO
2 e
q.)
Electricity
Biodiesel
Biogasoline
Chemicals
Figure 15 GHG emissions avoided per scenario in
2030, WLO-projections.
44 Mton
15 Mton
10 Mton
46 Mton
13 Mton
0
5
10
15
20
25
Nat
LowTec
h
IntL
owTec
h
NatHighT
ech
IntH
ighT
ech
IntH
ighT
ech AC
GH
G m
itig
ati
on
(M
ton
CO
2 e
q.)
Figure 16 GHG emissions avoided per scenario in
2030, LEITAP-projections.
Figure 15 GHG emissions avoided per scenario in Figure 16 GHG emissions avoided per scenario in
2030, WLO-projections 2030, LEITAP-projections
20
The total expenditures for bioenergy and biobased chemicals range from 1,073 M€ in the NatLowTech scenario to 9,655 M€ in the IntHighTech AC scenario in 2030. Cost for biofuel production from vegetable oil and sugar/starch crops are dominated by feedstock cost as, especially for biodiesel from vegetable oil, little conversion processes are required to produce biodiesel. The additional costs for substitution of fossil fuels with
203 PJ
220 PJ
113 PJ
833 PJ747 PJ
0
50
100
150
200
250
300
350
Nat
LowTec
h
IntL
owTec
h
NatHighT
ech
IntH
ighT
ech
IntH
ighT
ech AC
Av
oid
ed
pri
ma
ry e
ne
rgy
(P
J)
Electricity
Biodiesel
Biogasoline
Chemicals
Figure 13 Avoided non-renewable primary energy
by biomass in the scenarios in 2030, WLO-
projections.
198 PJ
238 PJ
146 PJ
758 PJ685 PJ
0
50
100
150
200
250
300
350
Nat
LowTec
h
IntL
owTec
h
NatHighT
ech
IntH
ighT
ech
IntH
ighT
ech AC
Av
oid
ed
pri
ma
ry e
ne
rgy
(P
J)
Figure 14 Avoided non-renewable primary energy
by biomass in the scenarios in 2030, LEITAP-
projections.
53 Mton
15 Mton
9 Mton
56 Mton
15 Mton
0
5
10
15
20
25
Nat
LowTec
h
IntL
owTec
h
NatHighT
ech
IntH
ighT
ech
IntH
ighT
ech AC
GH
G m
itig
ati
on
(M
ton
CO
2 e
q.)
Electricity
Biodiesel
Biogasoline
Chemicals
Figure 15 GHG emissions avoided per scenario in
2030, WLO-projections.
44 Mton
15 Mton
10 Mton
46 Mton
13 Mton
0
5
10
15
20
25
Nat
LowTec
h
IntL
owTec
h
NatHighT
ech
IntH
ighT
ech
IntH
ighT
ech AC
GH
G m
itig
ati
on
(M
ton
CO
2 e
q.)
Figure 16 GHG emissions avoided per scenario in
2030, LEITAP-projections.
The total expenditures for bioenergy and bio-based chemicals range from 1,073 M€
in the NatLowTech scenario to 9,655 M€ in the IntHighTech AC scenario in 2030.
Costs for biofuel production from vegetable oil and sugar/starch crops are
dominated by feedstock cost as, especially for biodiesel from vegetable oil, few

28 Macro-econoMics biobased synthesis report analysis of the econoMic iMpact of large-scale deployMent of bioMass resources for energy and Materials in the netherlands 29
conversion processes are required to produce biodiesel. The additional costs for
substitution of fossil fuels with biomass depend on the difference between the fossil
reference9 technologies and the biomass substitutes and ranged from 300 M€ in the
NatLowTech scenario to 2,731 M€ in the IntHighTech scenario (Figure 17). Figure 19
shows the additional cost projections based on the LEITAP scenarios. These are
over 1000 M€ lower than in the bottom-up projections based on the WLO projections
as a result of 1st-generation biofuels that are still used on a large scale in these
projections. The additional costs for bio-based production are lower in the
IntHighTech AC scenario than in the IntHighTech scenario because production
costs of both bio-based specialty chemicals (such as bulk C2 chemicals) are closer
to, or even lower than, the fossil-based variant than bio-based synthesis gas. It
should be noted that the additional costs are sensitive to fossil fuel prices. If fossil
fuel prices (crude oil, coal and natural gas) increase by 50%, biomass is already
competitive in the international scenarios, and limited additional costs are made
for the production of electricity and FT-diesel (Figure 18). It should be noted,
however, that the bottom-up model is limited in reflecting higher fossil fuel prices.
The model does not include cost escalations for higher fossil energy prices that also
result, for example, in increased costs of energy crop production and capital costs
of bioenergy technologies that are also linked to fossil fuel prices. The projections
in Figure 18 might therefore be too optimistic.
Figure 17 Additional cost for bio-based substitution Figure 18 Additional cost for bio-based substitution
in the scenarios in 2030. in the scenarios in 2030.
Oil price = 50 US$/bbl, coal = 2€/GJ, Oil price = 75 US$/bbl, coal = 3€/GJ,
natural gas = 6€/GJ, WLO-projections natural gas = 9€/GJ, WLO-projections
21
biomass depend on the difference between the fossil reference9 technologies and the biomass substitutes and ranged from 300 M€ in the NatLowTech scenario to 2,731 M€ in the IntHighTech scenario (Figure 17). Figure 19 shows the additional cost projections based on the LEITAP scenarios. These are over 1000 M€ lower than in the bottom-up projections based on the WLO-projections as a result of 1st generation biofuels that are still used on large scale in these projections. The additional cost for biobased production are lower in the IntHighTech AC scenario than in the IntHighTech scenario because production cost of both biobased specialty chemicals as bulk C2 chemicals are closer to or even lower than the fossil based variant than biobased synthesis gas. It should be noted that the additional cost are sensitive to fossil fuel prices. If fossil fuel prices (crude oil, coal and natural gas) increase with 50%, biomass is already competitive in the International scenarios and limited additional costs are made for the production of electricity and FT-diesel (Figure 18). It should be noted however that the bottom-up model is limited in reflecting higher fossil fuel prices. The model does not include cost escalations for higher fossil energy prices that also result in e.g. increased cost of energy crop production and capital costs of bioenergy technologies that are also linked to fossil fuel prices. The projections in Figure 18 might therefore be too optimistic.
9 Oil price = 50 US$2006/bbl, Natural gas price = 6 €/GJ and coal price = 2 €/GJ.
308 M!300 M!
2731 M!
702 M!
2436 M!
-900
-400
100
600
1100
1600
Nat
LowTec
h
IntL
owTec
h
NatHighT
ech
IntH
ighT
ech
IntH
ighT
ech AC
Ad
dit
ion
al
ex
pe
nd
itu
res
(M!
/a)
Electricity
Biodiesel
Biogasoline
Chemicals
Figure 17 Additional cost for biobased substitution
in the scenarios in 2030. Oil price = 50 US$/bbl, coal
= 2 €/GJ, natural gas = 6 €/GJ, WLO-projections.
-311 M!81 M!
169 M!-29 M!
-491 M!
-900
-400
100
600
1100
1600
Nat
LowTec
h
IntL
owTec
h
NatHighT
ech
IntH
ighT
ech
IntH
ighT
ech AC
Ad
dit
ion
al
ex
pe
nd
itu
res
(M!
/a)
Figure 18 Additional cost for biobased substitution
in the scenarios in 2030. Oil price = 75 US$/bbl,
coal = 3 €/GJ, natural gas = 9 €/GJ, WLO-
projections.
GHG mitigation costs differ per scenario as a result of different biomass conversion
technologies used and their techno-economic performance. Mitigation costs, with
fossil fuel prices as in Figure 17, are estimated to be 19 €/tonne CO2 eq. in 2006 and
increase to 35 €/tonne CO2 eq. in the NatLowTech scenario in 2030. This increase is
mainly the result of the poor mitigation performance of biodiesel from rapeseed and
9 Oilprice=50US$2006/bbl,Naturalgasprice=6€/GJandcoalprice=2€/GJ.

analysis of the econoMic iMpact of large-scale deployMent of bioMass resources for energy and Materials in the netherlands 29
starch crops. Lower feedstock prices and better GHG mitigation performances of
biodiesel from palm oil and jatropha oil and ethanol from sugar cane result in
mitigation cost of 21 €/tonne CO2 eq. in the IntLowTech scenario in 2030. The
mitigation costs are highest in the high-tech scenarios, with 46 €/tonne CO2 eq. for
the NatHighTech and IntHighTech AC scenarios and 49 €/tonne CO2 e for the
IntHighTech scenario. The main reasons for the higher mitigation costs in the high-
tech scenarios are better environmental performances of the reference technologies
for electricity generation10 and the use of advanced and capital intensive conversion
technologies.
The results based on the LEITAP projections (Figure 19 and Figure 20) already
indicate that, if optimised for costs, biodiesel production from palm oil or jatropha
and imported ethanol from sugar cane from Brazil is cheaper than the production of
FT-diesel and ethanol from lignocellulosic biomass. The mitigation costs of the
LEITAP projections for 2030, based on an oil price of 50 US$/bbl, are estimated to
be 50-52 €/tonne CO2 eq. in the NatLowTech and NatHighTech scenarios, 27 €/tonne
CO2 eq. for the IntLowTech scenario and 36 – 38 €/tonne CO
2 eq. for the IntHighTech
scenarios. It should be noted, however, that the costs of vegetable oils, in particular,
are sensitive to fluctuations in supply and demand which could increase costs
again.
10 Biomassco-gasifiedinNGCCplantsreplacesnaturalgaswithrelativelylowGHGemissions,
whilebiomassreplacescarbon-intensivecoalinthelow-techscenarios.
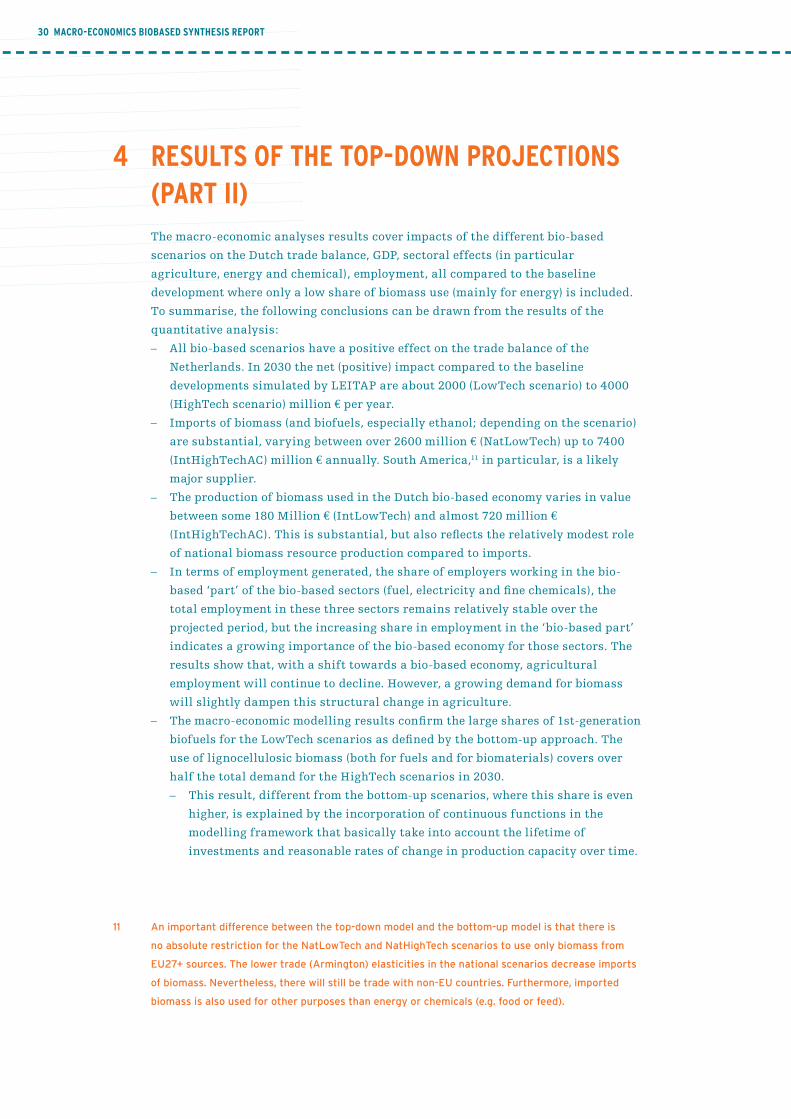
analysis of the econoMic iMpact of large-scale deployMent of bioMass resources for energy and Materials in the netherlands 3130 Macro-econoMics biobased synthesis report analysis of the econoMic iMpact of large-scale deployMent of bioMass resources for energy and Materials in the netherlands 31
4 results of the top-down projections (part ii)The macro-economic analyses results cover impacts of the different bio-based
scenarios on the Dutch trade balance, GDP, sectoral effects (in particular
agriculture, energy and chemical), employment, all compared to the baseline
development where only a low share of biomass use (mainly for energy) is included.
To summarise, the following conclusions can be drawn from the results of the
quantitative analysis:
All bio-based scenarios have a positive effect on the trade balance of the –
Netherlands. In 2030 the net (positive) impact compared to the baseline
developments simulated by LEITAP are about 2000 (LowTech scenario) to 4000
(HighTech scenario) million € per year.
Imports of biomass (and biofuels, especially ethanol; depending on the scenario) –
are substantial, varying between over 2600 million € (NatLowTech) up to 7400
(IntHighTechAC) million € annually. South America,11 in particular, is a likely
major supplier.
The production of biomass used in the Dutch bio-based economy varies in value –
between some 180 Million € (IntLowTech) and almost 720 million €
(IntHighTechAC). This is substantial, but also reflects the relatively modest role
of national biomass resource production compared to imports.
In terms of employment generated, the share of employers working in the bio- –
based ‘part’ of the bio-based sectors (fuel, electricity and fine chemicals), the
total employment in these three sectors remains relatively stable over the
projected period, but the increasing share in employment in the ‘bio-based part’
indicates a growing importance of the bio-based economy for those sectors. The
results show that, with a shift towards a bio-based economy, agricultural
employment will continue to decline. However, a growing demand for biomass
will slightly dampen this structural change in agriculture.
The macro-economic modelling results confirm the large shares of 1st-generation –
biofuels for the LowTech scenarios as defined by the bottom-up approach. The
use of lignocellulosic biomass (both for fuels and for biomaterials) covers over
half the total demand for the HighTech scenarios in 2030.
This result, different from the bottom-up scenarios, where this share is even –
higher, is explained by the incorporation of continuous functions in the
modelling framework that basically take into account the lifetime of
investments and reasonable rates of change in production capacity over time.
11 Animportantdifferencebetweenthetop-downmodelandthebottom-upmodelisthatthereis
noabsoluterestrictionfortheNatLowTechandNatHighTechscenariostouseonlybiomassfrom
EU27+sources.Thelowertrade(Armington)elasticitiesinthenationalscenariosdecreaseimports
ofbiomass.Nevertheless,therewillstillbetradewithnon-EUcountries.Furthermore,imported
biomassisalsousedforotherpurposesthanenergyorchemicals(e.g.foodorfeed).
analysis of the econoMic iMpact of large-scale deployMent of bioMass resources for energy and Materials in the netherlands 31analysis of the econoMic iMpact of large-scale deployMent of bioMass resources for energy and Materials in the netherlands 31
With the base scenario assumptions, the share of lignocellulosic based –
biomass applications would increase further after 2030 and overall costs
would go down. Furthermore, this share is sensitive to the rate of
technological progress (learning) of new technologies. A more conservative
progress would lead to lower shares and vice versa.
Required support levels to ensure the realisation of the projected shares of –
biofuel shares in the different scenario’s differ strongly between the scenarios
(following data are all versus a reference oil price of 75 U$/bbl (in 2006 US$):
The NatLowTech scenario requires (for a modest share of 10%) a subsidy of –
about half a billion per year (and around 0.40 €/litres of biofuel).
IntLowTech this is reduced to 350 million – € annually and 0.12 €/litres of
biofuel for a 20% share (especially due to cheaper imports such as ethanol).
Costs increase again for the NatHighTech scenario (due to higher feedstock
costs).
IntHighTech achieves the 60% share of biofuels in 2030 with some 300 –
million € per year subsidies (and a low 0.034 €/litres biofuel subsidy). This
subsidy is only required for the 1st-generation biofuel part and to some
extent for 2nd-generation biodiesel; in this scenario competitive production
costs are achieved for 2nd-generation ethanol production, given the
technology assumptions and base oil price of 75U$/bbl.
In addition to the IntHighTech scenario, the IntHighTechAC scenario –
includes bio-based production of natural gas and petroleum products and in
both the specialty and bulk chemical industries. Under the (extreme) high
blending shares assumed under IntHighTechAC imports of biomass is
projected to increase to more than 5 billion € with most of imports from
South American countries. Additional income and employment under the
IntHighTechAC scenario is mainly created in the petrol sector; while around
¼ is generated in the in electricity and chemical sectors.
These results are highly sensitive to the oil price; with lower oil prices, –
required support increases and vice versa. In addition, the scenarios assume
a fixed (and high) diesel demand in the transport sector. When this could be
replaced by 2nd-generation bioethanol or cheaper synfuels than Fischer-
Tropsch diesel (such as methanol or DME), costs would go down and be
competitive at the 75 U$/barrel reference oil price. This implies, however,
also more adjustments investments in the transport sector (e.g. engine
adjustments, fuel distribution).
Shares of additional income across the bio-based industries in 2030 for the –
IntHighTech Scenario) due to biomass expansion amount 19% for electricity
production using biomass, 78.5% for production of biofuels and, 2.5% due to the
production of the assumed biomass derived chemicals.
32 Macro-econoMics biobased synthesis report analysis of the econoMic iMpact of large-scale deployMent of bioMass resources for energy and Materials in the netherlands 33
5 discussion This section covers the discussion of the results of the top-down and bottom-up
projections and the used methodology to link these models. Part I and part II of this
study discuss the individual results. The emphasis of this discussion section is on a
comparison of the bottom-up and top-down results (5.1) and the methodology of
linking the bottom-up with the top-down model and potential improvements that
can be made to improve consistency between the models (5.2).
5.1 Results
The results, presented in detail in part I and part II of this study, include a set of
bottom-up and top-down projections of biomass for bioenergy and bio-based
materials, the (macro) economic impact, the required resources and the avoided
fossil energy and greenhouse gas emissions. The results of the bottom-up and top-
down projections are compared for biomass use, i.e. the total biomass required to
generate bioenergy and bio-based chemicals, the produced bioenergy and bio-based
materials and bio-based materials and the additional costs/benefits. Although the
bottom-up and the top-down projections are generated for similar biomass blending
targets, the difference in modelling approaches results in different outputs.
The top-down results are expressed as total expenditures or sales for inputs and
outputs per sector (in M$ weighted indices). The mix of goods produced in sectors is
aggregated to a total value. These can be disaggregated for the baseline year for
which statistical data on physical quantities (e.g. kton, PJ) and technology
portfolios are available. For top-down projections however, difficulties arise in
disaggregating as both quantitative as qualitative changes are implicit to the total
economic growth or decline in each sector. The translation of the bottom-up
projections in monetary units back to physical quantities that are used for the
bottom-up model is therefore partly based on the baseline situation for which both
physical and economic data is available. The bottom-up results that are based on
the LEITAP projections therefore still include data from the WLO scenarios (e.g.
diesel/petrol ratio, electricity generation technologies) as these could not be derived
from LEITAP. A further disaggregation of sector/commodities in the top-down
model would improve the exchangeability of data between the bottom-up and top-
down models.
5.1.1 Biomass use in the models
Both the top-down and the bottom-up model include a range of similar biomass
energy crops for bioenergy and bio-based materials. The main difference between
the models is that the bottom-up model also includes a detailed set of residues from
domestic sources. The bottom-up projections show that a significant share, ranging
from 15% in the IntHighTech scenarios to almost 70% in the NatLowTech scenario,
can be met by domestic residues as displayed in Figure 11. The integration of
biomass options from (domestic) residues would decrease the demand for dedicated
crop production resulting in lower bio-based production costs and required imports
analysis of the econoMic iMpact of large-scale deployMent of bioMass resources for energy and Materials in the netherlands 33
of biomass for bioenergy and bio-based materials.
The biomass required for the production of transport fuels as projected with the
top-down model for 2030 ranges from 100 PJ in the NatLowTech scenario to around
360 and 455 PJ for the IntHighTech and the IntHighTech AC scenario respectively
(Figure 13 in report II). It should be noted, however, that part of the bio-based
ethanol in the IntHighTech AC scenario substitutes naphtha for ethylene production
rather than petrol for road transport. For the bottom-up projections, we projected
the demand for transport fuel to be 910 PJ in the IntHighTech scenarios in 2030.
The difference in demand can be explained by the use of 1st-generation conversion
options in the top-down model, whereas all transport fuels are produced from
lignocellulosic biomass, with lower conversion efficiencies, in the bottom-up
projections (42% in the bottom-up scenarios) relative to biodiesel from vegetable oil
(~100%). For the HighTech bottom-up scenarios, it was assumed that 2nd-generation
biomass conversion technologies would substitute 1st-generation technologies from
2010 onwards to achieve a 100% market share in 2030. Figure 12 shows that if the
bottom-up model uses similar shares of 1st and 2nd-generation biofuel production
technologies, the demand for biomass for transport fuels is 620 PJ in the
IntHighTech and 670 PJ in the IntHighTech AC scenario.
As discussed above and in part II of this study, the applied macro-economic model
does not allow a sudden shift from one technology to another, and the shift to
advanced technologies might require a longer transition period (as assumed for the
bottom-up scenarios). Comparing the outcome of the top-down, macro-economic
model with the estimate of the bottom-up approach one could expect a larger share
of 2nd-generation biomass, especially for the HighTech scenarios in the bottom-up
scenarios as only a limited delay in transition is assumed. Under the IntHighTech
scenario 1st-generation biomass (oilseeds) still contributes for a significant part to
total biomass use in the petroleum industry in the top-down model. This outcome is
explained by the underlying technology assumption of the LEITAP model. Due to
the fact that technology changes follow a path of substituting an existing
technology (based on 1st-generation biomass) with a new and modern one (based on
2nd-generation biomass) the model seems to react a bit ‘sticky’. Thus, LEITAP does
not allow for drastic changes in the composition of the feedstock in the biomass
sector.12 Thus, even in the IntHighTech scenario, 1st-generation biomass crops such
as oilseeds continue to contribute to biofuel production at a significant level. Based
on the economic model applied for this study the achieved results indicate that an
economy fully based on 2nd-generation biomass inputs would require a longer
timeframe for adjustment.
12 Othermodellingapproachessuchasalinear-programmingmodelwouldallowfortheseimmediate
shiftsinthemixof1stand2nd-generationbiomass.However,thesemodellingapproacheswould
neglectotherimportantfeaturessuchastheendogenousdevelopmentofrelativepricesbetween
differentinputs.

34 Macro-econoMics biobased synthesis report analysis of the econoMic iMpact of large-scale deployMent of bioMass resources for energy and Materials in the netherlands 35
Due to the remaining use of 1st-generation biomass crops, even under the HighTech
scenario some subsidies are still necessary to meet the blending target.
The ‘persistent’ contribution of 1st-generation biomass also has consequences for
the calculation of social costs of an enforced utilisation of biomass crops in the bio-
based industries (see Table 1 in part II).
It should be noted though that also bottom-up optimisation models, e.g. Biotrans
(Londo et al. 2008), show 1st-generation crops still to have a major share13 for road
transport fuels in Europe in 2030. The bottom-up assumptions on technology
substitution in the High-tech scenarios might therefore be too drastic.
5.1.2 Costs of bio-based substitution
The additional costs of substituting fossil energy carriers with biomass are
expressed in the top-down mode by subsidies required. These are projected for
transport fuels to be 578 M€ in the NatLowTech scenario, 346 M€ in the IntLowTech
scenario, 828 M€ in the NatHighTech scenario and 293 M€ in the IntHighTech
scenario. These results show the sensitivity of the model to international trade
barriers, but also to technological development. If we compare these projections
with the additional costs of the bottom-up projections (Figure 17 through Figure
20), required subsidies are mainly for FT-diesel. This can be explained by the high
demand for diesel whereas costs for FT-diesel production are also higher than
conventional diesel at crude oil prices of 50-75 US$/bbl. Furthermore, the top-down
model does not include additional capital and O&M cost required for 2nd-generation
technologies. The subsidy levels, as projected with the top-down model are
therefore expected to be too optimistic for the HighTech scenarios that include
advanced and capital intensive conversion technologies.
5.2 Methodology
This study is built on a new and innovative approach that links the results of a
bottom-up approach with the outcome of a macro-economic, general equilibrium
model to analyse the impact of an enhanced use of biomass inputs in the bio-based
sectors of the Dutch economy. This approach combines the details of a technology-
based analysis with the complexity of a model which enables to trace the impact of
changes in relative prices for the overall economy.
The results – presented in part I and II of this study – shows the need for this kind
of integrated assessment of a move towards a more bio-based oriented economy
which is built on various uncertainties, e.g. availability of large-scale technologies
or the development of crude oil prices. The approach of linking bottom-up
engineering models and macro-economic top-down models is not new, and
numerous efforts are being made in order to combine the strength of these
modelling approaches. For example, the bottom-up linear optimisation model
MARKAL (MArket ALlocation) is coupled to (among others) the CGE model MACRO
13 Dependingonscenarioconditions.
analysis of the econoMic iMpact of large-scale deployMent of bioMass resources for energy and Materials in the netherlands 35
[Messner et al., 2000], TIMES and GEMINI-E3 [Loulou, 2005] and EPPA [Schäfer and
Jacoby, 2005]. Introducing bottom-up engineering data in a top-down model is also
reported by McFarland et al. [2004] and Faber et al. [2007]. However, developing
scenarios with a top-down model and imposing these detailed scenarios in an
extended CGE model for multi-sector and large-scale deployment of biomass is
innovative.
The models were linked by imposing blending shares of biomass in the sectors
electricity, road transport fuels and chemicals. The final LEITAP model results were
integrated into the top-down model to enhance the consistency between the models.
However limited calibration steps were conducted in order to achieve full
consistency between the models. We planned more iterative feedbacks between the
two different models, which would also help to calibrate the productivity growth
path and the different level of substitution elasticities of the macro-economic model
in a better way, but this proved to be infeasible due to time limitations. This could
be an area of further research in a follow-up study.
The level of aggregation in the top-down model also limits the possibilities for
introducing advanced bio-based conversion options, especially for the chemical
industries. For this research, the chemical sector was divided into bulk and
specialty chemicals by assuming shares of 80% bulk and 20% specialties as limited
data was available, mainly for the structure of the specialty chemical industries.
The available bio-based chemicals in this study are limited to three representative
options for natural gas replacement (synthesis gas), replacement of base chemicals
from petroleum products (ethylene) and direct replacement of functionalised
chemicals (caprolactam). Although more advanced biorefinery options could be
available in 2030, a full assessment of the macro-economic impact of these
technologies and advanced energy crops (e.g. GMO) are beyond the scope of the
current model capabilities and this study. Further research with a disaggregation
of the chemical industries and petrol sectors [e.g. Choumert, Paltsev et al., 2006] in
the LEITAP model supported with detailed bottom-up, physical and economic data
on the structure of these sectors could improve the understanding of the macro-
economic impact of biomass for the chemical industry sectors.
Full consistency between the top-down and the bottom-up model could be improved
by introducing an iteration process with data calibration. Full linkage of the results
could provide more understanding of the technological progress and technology
substitution and the related cost that are implicit to the top-down projections.
Furthermore, the impact on the environment, e.g. biodiversity and spatial land-use
effects could be linked to the physical outputs not covered in this study. Therefore,
further research is required, which extends the approach of combined assessment
of technological and economic with environmental effects.

36 Macro-econoMics biobased synthesis report analysis of the econoMic iMpact of large-scale deployMent of bioMass resources for energy and Materials in the netherlands 37
6 conclusionsOverall, the results of the work show that pursuing a significant role for bio-based
options and value chains in the Netherlands can have major positive impacts on
reducing GHG emissions, replacing fossil fuels, as well as economic activity in the
agricultural and energy sectors. However, the magnitude of such benefits depend
strongly on the development pathway and the strategies followed.
The baseline scenario in this study (NatLowTech) results, in 2030, only in 74 PJ
bioenergy and replacing 113 PJ fossil energy. GHG mitigation amounts 9 Mton, with
an overall support required of over 300 M€ per year (versus an oil price of 50 U$/
barrel). In contrast, the IntHighTech scenario results in the supply of 680 PJ bio-
energy (and materials), avoidance of 833 PJ fossil energy (around one-quarter of
total national energy use) and 56 Mton of avoided GHG emissions. The latter is more
than a quarter of current CO2 emissions from the Netherlands, making a bio-based
strategy the largest mitigation option currently considered. Required financial
support versus an oil price of 50 U$/barrel amounts to 2730 M€. IntLowTech and
NatHighTech give fairly comparable results (both avoid 15 Mton of GHG emissions
and the primary energy avoided amounts to over 200 PJ). NatHighTech requires
higher support levels, some 700 M€ vs 310 M€ vs. 50 U$ barrel), especially due to the
more expensive biomass feedstocks utilised. The IntHighTech AC scenario,
including a higher blending share of chemicals (25% vs 19% for the IntHighTech
scenario) requires more biomass than the IntHighTech scenario, but mitigates less
GHG emissions and primary fossil energy. However, it also requires lower support
levels (2430 M€ ) than the IntHighTech scenario, as bio-based substitutes for
petroleum products are more competitive than bio-based substitutes for natural gas.
However, in macro-economic terms the differences between the scenarios are less
pronounced for impacts on trade balance (overall positive, more so for the HighTech
scenario’s) and employment (all positive). Clearly, the support levels needed to
realise the different shares of biomass use for electricity, fuels and materials differ
strongly between the scenarios, with the (per unit of energy or GHG mitigation
achieved) highest economic efficiency for the IntHighTech scenario, followed by the
NatHighTech scenario. This stresses the importance of technology development to
reduce costs and increase efficiency, and the sensitivity of the results for this factor
of the HighTech scenarios. In addition, the sensitivity towards the oil price (fossil
energy prices in general) is high: if oil prices move to well over 75 U$ barrel, the
IntHighTech scenario becomes fully competitive. This is (to some extent) also true
for the IntLowTech scenario (especially compared to imports of sugar-cane-based
ethanol and vegetable oils). However, if this is assumed to be is a worldwide trend,
price mechanisms would also increase biofuel costs following increasing demand.
Another factor that would make a key difference is the pricing of CO2. Results
obtained suggest that mitigation costs lay between 40-50 €/ton CO2 eq avoided in
2030 for all high-tech scenarios (versus an oil price of 50 U$/barrel). This can be
considered attractive under the condition that far-reaching targets (20% reduction

analysis of the econoMic iMpact of large-scale deployMent of bioMass resources for energy and Materials in the netherlands 37
in 2020 and moving to 50-80% reduction in 2050) are seriously pursued, both in the
Netherlands and in Europe as a whole.
Realising high ambitions for a bio-based economy in the Netherlands whilst
minimising the required financial support and maximising the macro-economic
benefits would require: accelerating technology development with the emphasis on
2nd-generation biofuels (feedstock and technology), biochemical options and efficient
power generation.
An open market approach, allowing for large-scale imports; this is the only way to
achieve high shares of biomass use in the biofuels and bio-electricity sectors.
‘Smart’ temporisation of implementation over time, following technology
development speeds (thus avoiding high levels of financial support for expensive
bioenergy options). Stabilising policies that maintain a stable investment climate
and that dampen the impacts of inevitable fluctuations in oil and CO2
prices over
the coming years. Following such a strategy and subsequently achieving the more
ambitious scenarios sketched in this study will result in a situation that public
investments needed in the shorter term are compensated by the macro-economic
benefits that can be achieved.
Projections of the macro-economic impact of bioenergy and bio-based materials are
important for exploring different futures and effects of certain limitations and
opportunities. However, a full understanding of the role of biomass as a CO2 and
fossil-fuel mitigation option can only be explored for a full set of competing
mitigation options such as wind, PV or other type of vehicles, including fuel cells or
plug-in hybrids. It should be noted, however, that this would also demand a further
disaggregation of the sector/commodities in the CGE model, in combination with
the use of a bottom-up dedicated energy optimisation model, such as Markal, using
an integral approach.
In relation to biomass and bioenergy conversion technologies, this study was
particularly limited when modelling bio-based chemicals. The difference between
the IntHighTech and IntHightech AC scenario indicates that the LEITAP model is
sensitive to fossil-based substitution of different products. At the same time, the
CGE model is limited in representing technologies that produce multiple products
such as biorefineries. Other studies indicate that the production of chemicals in
biorefineries (via extraction) substantially increases the added value of energy
crops and mitigation potential. It would therefore be interesting to explore the
potential of this concept in a macro-economic model by increasing the added value
for domestic energy crops by using biorefinery concepts, if sufficient data is
available.

38 Macro-econoMics biobased synthesis report analysis of the econoMic iMpact of large-scale deployMent of bioMass resources for energy and Materials in the netherlands 39
referencesBanse, M., A. Tabeau, G. Woltjer, G. and H. van Meijl (2008). Will EU Biofuel Policies
Affect Global Agricultural Markets? European Review of Agricultural Economics
35(2):117-141.
Birur, D.K., T.W. Hertel, and W. E. Tyner, (2007), The Biofuel Boom: Implications for
World Food Markets, Paper presented at the Food Economy Conference, The Hague,
October 18-19.
Bruggink, A. (2006). New Resources for the Chemical Industry (Nieuwe bronnen
voor de chemie, in Dutch), Bio-based Raw Materials Platform (PGG).
Burniaux, J.-M. and T.P. Truong (2002), GTAP-E: An Energy-Environmental Version
of the GTAP Model. GTAP Technical Paper, No. 16. Revised Version.
Choumert, F., S. Paltsev, et al. (2006). Improving the Refining Sector in EPPA.
Technical Note No. 9. Camebridge MA, MIT.
Faaij, A. P. C. (2006). Roadmap on Sustaibable Biomass Import. Utrecht, Copernicus
Insitute, Utrecht University.
F.O. Licht (2007). Licht Interactive Data.
Hertel, T., (1997), Global Trade Analysis. Modelling and Applications, Cambridge
University Press.
Hoogwijk, M., A. Faaij, et al. (2005). “Potential of biomass energy out to 2100, for
four IPCC SRES land-use scenarios.” Biomass and Bioenergy 29(4): 225-257.
IEA (2006b). World Energy Outlook 2006 Paris, International Energy Agency (IEA).
IEA (2007). World Energy Outlook 2007 - China and India Insights. Paris,
International Energy Agency (IEA).
Janssen, L., R. Okker, et al. (2006). “Welvaart en Leefomgeving.”
from http://www.welvaartenleefomgeving.nl/.
Kip, H., E. Lammers, et al. (2007). ELEKTRICITEIT UIT BIOMASSA - PLATFORM
DUURZAME ELEKTRICITEITSVOORZIENING WERKGROEP TRANSITIEPAD
BIO-ELEKTRICITEIT.
Kopetz, H., J.M. Jossart, H. Ragossnig, Ch. Metschina, (2007). European Biomass
Statistics 2007. A statistical report on the contribution of biomass to the energy
system in the EU 27. European Biomass Association (AEBIOM), Brussels

analysis of the econoMic iMpact of large-scale deployMent of bioMass resources for energy and Materials in the netherlands 39
Koppejan, J. and P. D. M. d. Boer-Meulman (2005). De Verwachte Beschikbaarheid
van Biomassa in 2010, SenterNovem.
Londo, H. M., S. M. Lensink, et al. (2008). Biofuels cost developments in the EU27+
until 2030, ECN and Copernicus Institute - Utrecht University.
Loulou, R. (2005). “The slow convergence of Top-Down and Bottom-Up Energy
Models.”
Retrieved November 2008, 2008, from www.gerad.ca/25ans/images/loulou.ppt
McFarland, J. R., J. M. Reilly, et al. (2004). “Representing energy technologies in
top-down economic models using bottom-up information.” Energy Economics 26(4):
685-707.
Messner, S. and L. Schrattenholzer (2000). “MESSAGE-MACRO: linking an energy
supply model with a macroeconomic module and solving it iteratively.” Energy 25(3):
267-282.
Rabou, L. P. L. M., E. P. Deurwaarder, et al. (2006). Biomass in the Dutch Energy
Infrastructure in 2030, ECN and WUR.
Sanders, J. P. M., E. R. W. Engelen, et al. (2006). Duurzame productie en
ontwikkeling van biomassa, zowel in Nederland als in het buitenland - Uitwerking
van transitiepad 1: Duurzame Productie en Ontwikkeling van Biomassa, Platform
Groene Grondstoffen.
Schäfer, A. and H. D. Jacoby (2005). “Technology detail in a multisector CGE model:
transport under climate policy.” Energy Economics 27(1): 1-24.
Wit, M. A. d., A. Faaij, et al. (2007). Biomass Resources Potential and Related Costs -
the cost supply potential of biomass resources in the EU-27, Switzerland, Norway
and the Ukraine. Report on Work Package 3 of the EU REFUEL project, Copernicus
Insitute - Utrecht University and International Insitute of Applied System Analysis.

analysis of the econoMic iMpact of large-scale deployMent of bioMass resources for energy and Materials in the netherlands 4040 Macro-econoMics biobased synthesis report
appendices
Appendix I: Bottom-up scenarios –
Appendix II: Macro-economic scenarios –


![The QUIC Transport Protocol:Design and Internet-Scale Deployment · · 2017-11-13Design and Internet-Scale Deployment Adam Langley, ... [40, 62], they have not seen wide deployment](https://static.fdocuments.net/doc/165x107/5ae9a9947f8b9ad73f8c23db/the-quic-transport-protocoldesign-and-internet-scale-deployment-and-internet-scale.jpg)