Large Residential Washers - USITC
326
Large Residential Washers: Extension of Action Investigation No. TA-201-076 (Extension) Publication 5144 December 2020 U.S. International Trade Commission Washington, DC 20436
Transcript of Large Residential Washers - USITC

Large Residential Washers: Extension of Action
Investigation No. TA-201-076 (Extension)
Publication 5144 December 2020
U.S. International Trade Commission
Washington, DC 20436

U.S. International Trade Commission
COMMISSIONERS
Jason E. Kearns, Chair Randolph J. Stayin, Vice Chair
David S. Johanson Rhonda K. Schmidtlein
Amy A. Karpel
Catherine Defilippo Director of Operations
Staff assigned
Christopher W. Robinson, Investigator Fernando Gracia, Industry Analyst
Lauren Gamache, Economist Emily Kim, Accountant Onslow Hall, Statistician
Russell Duncan, Statistician Karl von Schriltz, Attorney
Nathanael Comly, Supervisory Investigator
Address all communications to Secretary to the Commission
United States International Trade Commission Washington, DC 20436

U.S. International Trade Commission
Washington, DC 20436 www.usitc.gov
Large Residential Washers: Extension of Action
Investigation No. TA-201-076 (Extension)
Publication 5144 December 2020


CONTENTS Page
i
Determination ................................................................................................................................. 1 Views of the Commission ............................................................................................................... 3
Part I: Introduction and overview ........................................................................................ I-1
Background ................................................................................................................................ I-1
WTO proceedings ...................................................................................................................... I-2
Previous and related investigations .......................................................................................... I-3
Antidumping and countervailing duty investigations on LRWs from Korea and Mexico ..... I-3
Antidumping duty investigation on LRWs from China .......................................................... I-7
Antidumping and countervailing duty investigations on certain raw materials ................... I-8
Section 232 investigations (Commerce) ................................................................................ I-9
Section 301 proceeding ....................................................................................................... I-11
Global developments .............................................................................................................. I-12
U.S. developments .................................................................................................................. I-14
Summary data ......................................................................................................................... I-15
U.S. market participants .......................................................................................................... I-15
U.S. producers ..................................................................................................................... I-15
U.S. importers ...................................................................................................................... I-18
U.S. purchasers ........................................................................................................................ I-19
The product ............................................................................................................................. I-19
Scope of the safeguard remedy .......................................................................................... I-19
Tariff-rate quota under the safeguard measure ................................................................. I-21
Tariff treatment ................................................................................................................... I-22
The like or directly competitive product ............................................................................. I-23
Description and applications ............................................................................................... I-24
Product features .................................................................................................................. I-28
Manufacturing processes .................................................................................................... I-31
Production process .............................................................................................................. I-33

CONTENTS Page
ii
Part II: Conditions of competition in the U.S. market........................................................... II-1
U.S. market characteristics....................................................................................................... II-1
Channels of distribution ........................................................................................................... II-1
Geographic distribution ........................................................................................................... II-3
Supply and demand considerations ......................................................................................... II-3
Changes in U.S. supply .......................................................................................................... II-3
Changes in U.S. demand ....................................................................................................... II-5
Part III: U.S. producers’ production, shipments, and employment ...................................... III-1
U.S. producers’ profiles ........................................................................................................... III-1
Developments in the U.S. LRWs industry ................................................................................ III-5
U.S. production, capacity, and capacity utilization ................................................................. III-9
Foreign-trade zone production activities .......................................................................... III-11
Alternative products .......................................................................................................... III-13
U.S. producers’ shipments .................................................................................................... III-15
U.S. producers’ commercial U.S. shipments of covered parts .......................................... III-16
U.S. producers’ commercial U.S. shipments by product type ........................................... III-17
U.S. producers’ inventories ................................................................................................... III-20
U.S. producers’ imports......................................................................................................... III-21
U.S. employment, wages, and productivity .......................................................................... III-24

CONTENTS Page
iii
Part IV: Financial experience of U.S. producers ...................................................................... 1
Background .................................................................................................................................. 1
Operations on washers ............................................................................................................... 1
Net sales quantity and value ................................................................................................. 11
Cost of goods sold and gross profit or loss ............................................................................ 12
Selling, general & administrative expenses and operating income or loss .......................... 14
Other expenses and net income or loss ................................................................................ 15
Variance analysis ................................................................................................................... 18
Capital expenditures and research and development expenses .............................................. 19
Assets and return on assets ...................................................................................................... 21
Part V: U.S. imports, apparent U.S. consumption, and market shares ................................. V-1
U.S. Imports .......................................................................................................................... V-1
Covered parts ....................................................................................................................... V-6
U.S. imports of non-covered extra-wide washers ................................................................ V-8
Monthly imports ................................................................................................................... V-9
Imports within and exceeding the tariff-rate quota .......................................................... V-12
U.S. importers’ U.S. shipments by product type ................................................................ V-14
U.S. importers’ inventories ................................................................................................. V-18
U.S. importers’ imports subsequent to June 30, 2020 ....................................................... V-21
Apparent U.S. consumption and U.S. market shares ......................................................... V-22
U.S. producers’ and U.S. importers’ U.S. shipments by product type ............................... V-27

CONTENTS Page
iv
The foreign industry .............................................................................................. VI-1
The industry in North America ................................................................................................ VI-1
The Industry in Canada ........................................................................................................ VI-1
The Industry in Mexico ........................................................................................................ VI-1
The industry in Asia ................................................................................................................. VI-7
The industry in China ........................................................................................................... VI-8
The industry in Korea ........................................................................................................ VI-15
The industry in Thailand .................................................................................................... VI-21
The industry in Vietnam .................................................................................................... VI-26
Other residential washer industries ...................................................................................... VI-31
Changes in operations ....................................................................................................... VI-32
Operations on LRWs .......................................................................................................... VI-32
Alternative products .......................................................................................................... VI-34
Exports ............................................................................................................................... VI-35
Global exports ....................................................................................................................... VI-37
Part VII: Pricing data ......................................................................................................... VII-1
Factors affecting prices .......................................................................................................... VII-1
Raw material costs ............................................................................................................. VII-1
Transportation costs ........................................................................................................... VII-2
Pricing practices ..................................................................................................................... VII-2
Pricing methods, discounts, and promotional prices ......................................................... VII-2
Price data ................................................................................................................................ VII-2
Price trends ....................................................................................................................... VII-25
Price comparisons ............................................................................................................ VII-27
Part VI:

CONTENTS Page
v
Part VIII: Adjustment efforts ............................................................................................ VIII-1
Adjustment plans .................................................................................................................. VIII-1
GE Appliances’ adjustment plan ........................................................................................... VIII-1
Updated offerings .............................................................................................................. VIII-1
Human capital investment ................................................................................................ VIII-1
Business process innovation ............................................................................................. VIII-2
GE Appliances’ post-relief efforts ......................................................................................... VIII-2
Whirlpool’s adjustment plan ................................................................................................. VIII-3
Plans to update and expand product lineup ..................................................................... VIII-3
Plans to enhance manufacturing and logistics efficiencies ............................................... VIII-5
Whirlpool’s post-relief efforts ............................................................................................... VIII-6
Significance of relief ............................................................................................................ VIII-12
Product availability .......................................................................................................... VIII-14
Appendixes
A. Federal Register notices .................................................................................................. A-1
B. List of hearing witnesses ................................................................................................. B-1
C. Summary data ................................................................................................................. C-1
D. Select data from safeguard investigation ....................................................................... D-1
E. Section 232 and section 301 proceedings ....................................................................... E-1
F. U.S. imports using official import statistics………………………………………………………………… F-1
G. Price data by country source …………………………………………………………………………………….. G-1
H. Price data by firm ……………………………………………………………………………………………………… H-1
Note.—Information that would reveal confidential operations of individual concerns may not be published. Such information is identified by brackets in confidential reports and is deleted and replaced with asterisks (***) in public reports.


UNITED STATES INTERNATIONAL TRADE COMMISSION
Investigation No. TA-201-076 (Extension)
Large Residential Washers: Extension of Action
DETERMINATION
On the basis of the information in this investigation, the United States International Trade Commission (“Commission”) determines, pursuant to section 204(c) of the Trade Act of 1974 (“the Act”) (19 U.S.C. 2254(c)), that action under section 203 of the Act with respect to imports of large residential washers continues to be necessary to prevent or remedy serious injury and that there is evidence that the domestic large residential washers industry is making a positive adjustment to import competition.
BACKGROUND
Following receipt of a petition filed on behalf of Whirlpool Corporation, Benton Harbor, Michigan, the Commission, effective August 3, 2020, instituted investigation No. TA-201-076 (Extension) under section 204(c) of the Act to determine whether the action taken by the President under section 203 of the Act with respect to large residential washers and covered parts, provided for in subheadings 8450.20.00, 8450.11.00, 8450.90.60, and 8450.90.20 of the Harmonized Tariff Schedule of the United States (HTS), continues to be necessary to prevent or remedy serious injury and whether there is evidence that the domestic industry is making a positive adjustment to import competition. Notice of the institution of the Commission’s investigation and of a public hearing to be held in connection therewith was given by posting copies of the notice in the Office of the Secretary, U.S. International Trade Commission, Washington, D.C., and by publishing notice in the Federal Register on August 12, 2020 (85 FR 48724). In light of the restrictions on access to the Commission building due to the COVID-19 pandemic, the Commission conducted its hearing by video conference on November 5, 2020. All persons who requested the opportunity were permitted to participate.


1
Views of the Commission
I. Summary of Determination and Recommendations
Pursuant to section 204(c) of the Trade Act of 1974 (Trade Act) (19 U.S.C. § 2254(c)), the Commission makes an affirmative determination in this investigation. Specifically, the Commission determines that action under section 203 of the Trade Act with respect to imports of large residential washers (“LRWs”) continues to be necessary to prevent or remedy serious injury and that there is evidence that the domestic LRW industry is making a positive adjustment to import competition.
Having made an affirmative determination, the Commission recommends that the President take the following action –
(1) extend the action for an additional two years, or until February 7, 2023, maintaining the tariff rate quota (“TRQ”) on imports of LRWs with an in-quota volume level of 1.2 million units, an in-quota tariff rate of 15 percent in the fourth year, decreasing to 14 percent in the fifth year, and an above-quota tariff rate of 35 percent in the fourth year, decreasing to 30 percent in the fifth year;1
(2) maintain the separate tariff rate quota on imports of covered parts with a tariff of 35 percent on imports above 110,000 units in the fourth year and a tariff of 30 percent on imports above 130,000 units in the fifth year; and
(3) continue to administer the annual quota on a quarterly basis.
II. Background The Commission instituted this investigation effective August 3, 2020, following receipt of a petition from Whirlpool Corporation (“Whirlpool”), a domestic producer of LRWs and the petitioner in the original safeguard investigation under section 202 of the Trade Act.2 Pursuant to section 204(c) of the Trade Act, Whirlpool requested that the Commission determine that (1) there is evidence that the domestic industry is making a positive adjustment to import competition, and (2) action under section 203 of the Trade Act continues to be necessary to prevent or remedy serious injury to the domestic LRWs industry.3 Whirlpool also requested that the Commission recommend that the President continue the TRQ on imported LRWs for up to three additional years, or until February 7, 2024, with only minimal liberalization of the in-quota and over-quota tariff rates.4
The Commission held a public hearing virtually on November 5, 2020, and all persons who requested the opportunity were permitted to participate in person or by counsel. In
1 Commissioner Johanson recommends an in-quota tariff rate of 14 percent in the fourth year,
decreasing to 12 percent in the fifth year. He otherwise joins the majority recommendations. 2 Large Residential Washers: Extension of Action, 85 Fed. Reg. 48724 (Aug. 12, 2020). 3 Petition at 1, 6. 4 Petition at 6-7.

2
addition to Whirlpool, Haier U.S. Appliance Solutions, Inc., d/b/a/ GE Appliances (“GE”), a domestic producer of LRWs, appeared in support of extension of relief. Appearing in opposition to extension of relief were the Government of Korea; LG Electronics USA, Inc., a domestic producer and importer of LRWs, and LG Electronics, Inc., a foreign producer of LRWs (collectively, “LG”); and Samsung Electronics Co., Ltd., Samsung Electronics Digital Appliances Mexico, S.A. de C.V., Samsung Electronics HCMC CE Complex, Ltd., Suzhou Samsung Electronics Co., Ltd., Suzhou Samsung Electronics Co., Ltd. - Export, and Thai Samsung Electronics Co., Ltd., which are foreign producers of LRWs, and Samsung Electronics Home Appliance America, LLC, and Samsung Electronics America, Inc., which domestically produce and import LRWs (collectively “Samsung”).
The safeguard action currently in effect is the result of a proclamation issued by the President on January 23, 2018, following a unanimous determination by the Commission that increased imports were a substantial cause of serious injury to the domestic LRW industry.5 In his proclamation, the President imposed a safeguard measure on imports of LRWs and covered parts in the form of TRQs, effective February 7, 2018, for a period of three years and one day.6 The measure imposes a quota of 1.2 million LRW units annually, subject to an in-quota tariff of 20 percent in the first year, 18 percent in the second year, and 16 percent in the third year. Imports of LRWs in excess of this quota are subject to additional tariffs, in the amount of 50 percent in the first year, 45 percent in the second year, and 40 percent in the third year. With respect to covered parts, imports in excess of 50,000 units were subject to an additional 50 percent tariff in the first year, imports in excess of 70,000 units were subject to a tariff of 45 percent in the second year, and imports in excess of 90,000 units are subject to a tariff of 40 percent in the third year, while no additional tariff would apply to goods within the in-quota quantity. The TRQ contains no individual country allocations, and the in-quota volume of imports that receives lower-duty (in the case of LRWs) or duty-free (in the case of covered parts) treatment originally reset annually. The President subsequently modified the safeguard
5 Large Residential Washers, Inv. No. TA-201-076, USITC Pub. 4745 (Dec. 2017) at 1 (“Original
Safeguard Determination”). 6 To Facilitate Positive Adjustment to Competition From Imports of Large Residential Washers,
Proclamation No. 9694, 83 Fed. Reg. 3553 (Jan. 25, 2018). The scope of the safeguard measure covers certain LRWs but excludes stacked washer-dryers; commercial washers; top loading washers with a permanent split capacitor motor, belt drive, and flat wrap spring clutch (“PSC/belt drive TL washers”); front loading washers with a controlled induction motor and belt drive (“CIM/belt drive FL washers”) (collectively, “belt driven washers”), and front load washers with a cabinet width of more than 28.5 inches (“extra-wide FL washers”). CR/PR at I-19-21. The scope of the measure also covers certain parts used in LRWs, including cabinets, tubs, baskets, and any combination of the three parts (collectively, “covered parts”). Id. The merchandise subject to the measure is provided for in subheadings 8450.20.00, 8450.11.00, 8450.90.60, and 8450.90.20 of the Harmonized Tariff Schedule of the United States. Id. at I-22-23.
The safeguard measure excludes imports from Canada and imports from WTO Member developing countries (as long as imports from a developing country do not exceed 3 percent of total imports and imports from all developing countries with an import share of less than 3 percent do not collectively exceed 9 percent of total imports). Id. at I-21.

3
measure by amending the TRQ to require quarterly, rather than annual, limits in the third year of relief, beginning on February 7, 2020.7
As required by section 204(a)(1) of the Trade Act, the Commission has monitored developments with respect to the domestic industry since the action first took effect. As part of this effort, the Commission monitored the progress and specific efforts made by workers and firms in the domestic industry to make a positive adjustment to import competition. As required by section 204(a)(2) of the Trade Act, the Commission completed a mid-term review of the safeguard measure on LRWs and, in August 2019, issued a report on the results of its monitoring of developments in the domestic industry producing LRWs.8
In addition to the safeguard measure, imports of LRWs from China and Mexico are subject to antidumping duty orders. Effective February 15, 2013, Commerce issued antidumping and countervailing duty orders on imports of LRWs from Korea and Mexico following the Commission’s determinations that such imports, which Commerce had determined to be unfairly traded, had materially injured the domestic industry.9 Effective February 6, 2017, Commerce issued an antidumping duty order on imports of LRWs from China following the Commission’s determination that such imports, which Commerce had determined to be unfairly traded, materially injured the domestic industry.10 In 2019, Commerce revoked the antidumping and countervailing duty orders on imports of LRWs from Korea following negative five-year review determinations by the Commission, but continued the antidumping duty order on imports of LRWs from Mexico following affirmative five-year review determinations by Commerce and the Commission.11
LRWs are automatic clothes washing appliances capable of cleaning fabrics using water and detergent in conjunction with wash, rinse, and spin cycles typically programmed into the unit.12 They are produced in either top load (“TL”) or front load (“FL”) configurations.13 TL LRWs possess drums that spin on a vertical axis and are loaded with clothing through a door on the top of the unit.14 FL LRWs possess drums that spin on a horizontal or tilted axis and are loaded with clothing through a door in the front of the unit.15 Single-family households are the principal consumers of LRWs.16
7 Proclamation No. 9979, To Further Facilitate Positive Adjustment to Competition from Imports
of Large Residential Washers, 85 Fed. Reg. 5,125, 5,125 (Jan. 28, 2020). 8 Large Residential Washers: Monitoring Developments in the Domestic Industry, Inv. No. 204-
TA-013 (Monitoring), USITC Pub. 4941 (Aug. 2019) (“LRWs Monitoring Report”). 9 78 Fed. Reg. 11148 (Feb. 15, 2013); 78 Fed. Reg. 11154 (Feb. 15, 2013); 78 Fed. Reg. 10636
(Feb. 14, 2013); LRWs from Korea and Mexico, Inv. Nos. 701-TA-488 and 731-TA-1199-1200 (Final), USITC Pub. 4378 (Feb. 2013).
10 82 Fed. Reg. 9371 (Feb. 6, 2017); 82 Fed. Reg. 9223 (Feb. 3, 2017); LRWs from China, Inv. No. 731-TA-1306 (Final), USITC Pub. 4666 (Jan. 2017).
11 84 Fed. Reg. 19763 (May 6, 2019); LRWs from Korea and Mexico, Inv. Nos. 701–TA–488 and 731–TA–1199–1200 (Review), USITC Pub. 4882 (Apr. 2019).
12 Confidential Report (“CR”)/ Public Report (“PR”) at I-24. 13 CR/PR at I-24. 14 CR/PR at I-24. 15 CR/PR at I-27. 16 CR/PR at I-24.

4
TL LRWs can wash clothes using either an agitator or an impeller.17 Agitator-based TL LRWs are characterized by their use of a pole-shaped agitator inside the drum, which cleans clothes by swirling them through detergent and water.18 Due to the interior volume occupied by the agitator, agitator-based LRWs generally offer less capacity than other types of LRWs.19 Impeller-based TL LRWs are characterized by their use of a fan-shaped impeller at the base of the drum, which cleans clothes by lifting and dropping them into a small quantity of water and high efficiency (“HE”) detergent.20 They reduce energy consumption by spinning clothes at high speed, thereby extracting more water and allowing clothes to spend less time in a dryer.21
FL LRWs typically offer higher performance and greater efficiency with respect to water usage than TL LRWs.22 Like impeller-based TL LRWs, FL LRWs reduce energy consumption by spinning clothes at high speeds that extract more water and reduce drying time.23
III. The Nature of the Determination Required
Section 204(c)(1) provides that the Commission, upon the request of the President or the concerned industry, is to “investigate to determine” –
whether action under section 203 continues to be necessary to prevent or remedy serious injury and whether there is evidence that the industry is making a positive adjustment to import competition.24
Neither the statute nor the legislative history of the Uruguay Round Agreements Act (“URAA”) further describes the nature of the determination the Commission must make under section 204(c), or sets out factors to be considered in making that determination.25
However, the term “positive adjustment” is defined in section 201(b) of the Trade Act. A positive adjustment to import competition is considered to have occurred when –
(A) the domestic industry – (i) is able to compete successfully with imports after actions taken under section 204 terminate, or (ii) the domestic industry experiences an orderly transfer of resources to other productive pursuits; and
(B) dislocated workers in the industry experience an orderly transition to productive
17 CR/PR at I-25. 18 CR/PR at I-26. 19 CR/PR at I-26. 20 CR/PR at I-26-27. 21 CR/PR at I-27. 22 CR/PR at I-27. 23 CR/PR at I-27. 24 19 U.S.C. § 2254(c)(1). 25 See Statement of Administrative Action for the URAA, H.R. Rep. No. 103-316, vol. I at 293
(1994) (“SAA”). This investigation marks only the second time the Commission has been requested to make a determination under section 204(c) of the Trade Act of 1974. 19 U.S.C. § 2254(c). The Commission’s only prior determination under section 204(c) of the Trade Act was in Wheat Gluten. See Wheat Gluten: Extension of Action, Inv. No. TA-204-004, USITC Pub. 3407 (Apr. 2001).

5
pursuits.26
The statute further provides that the domestic industry may be considered to have made a positive adjustment “even though the industry is not of the same size and composition” as the industry at the time the investigation was instituted under section 202(b).27
IV. Basis for Affirmative Determination
In making its affirmative determination, the Commission considered import volumes and prices under the TRQ, the domestic industry’s performance during the remedy period, foreign industry developments, and evidence concerning the extent to which the industry has been able to make a positive adjustment to import competition. The Commission also considered the basis for its affirmative serious injury determination in 2017, the adjustment plans and commitments submitted by domestic producers that year, and the Commission’s report on the results of its monitoring of developments in the domestic industry producing LRWs. Based on all the evidence on the record of this investigation, we find that the safeguard measure on imports of LRWs continues to be necessary to prevent or remedy serious injury, and that there is evidence that the domestic industry is making a positive adjustment to import competition.
A. The Commission’s Original Serious Injury Determination
In the original investigation in 2017, the Commission determined that LRWs were being imported in such increased quantities as to be a substantial cause of serious injury to the domestic LRW industry.28 The Commission found that imports increased during the period of investigation, which was 2012-2016 and January-March of 2016 and 2017 (the “interim” periods), both in absolute terms and relative to domestic production.29 Subject import volume had “increased steadily” in each year during 2012-2016, nearly doubling over that period from *** units in 2012 to *** units in 2016.30 The Commission also found that the absolute volume of subject imports remained “substantial” in interim 2017, at *** units, though lower than the comparable period in 2016, at *** units, due to “supply disruptions related to LG and
26 19 U.S.C. § 2251(b)(1). 27 19 U.S.C. § 2251(b)(2). 28 The Commission defined the like or directly competitive domestic product as all domestically
produced LRWs and covered parts as well as out-of-scope PSC/belt drive TL washers and CIM/belt drive FL washers. Original Safeguard Determination, USITC Pub. 4745 at 10. Consistent with its definition of the like product, the Commission defined the domestic industry as all domestic producers of LRWs, PSC/belt drive TL washers, CIM/belt drive FL washers, and covered parts: Whirlpool, GE, Alliance, and Staber. Id. at 19. In this extension proceeding, Whirlpool, GE, and Alliance, as well as LG and Samsung, completed domestic producers’ questionnaire responses. CR/PR at III-1, Table I-7. Staber ***. Id. at I-15 n.42, Table I-7.
29 Original Safeguard Determination, USITC Pub. 4745 at 20; Confidential Views, LRWs, Inv. No. TA-201-076, EDIS Document No. 630635 at 29 (“Confidential Original Safeguard Determination”).
30 Original Safeguard Determination, USITC Pub. 4745 at 20; Confidential Original Safeguard Determination at 29.

6
Samsung’s transfer of production from China to Thailand and Vietnam and Samsung’s “recall” of 2.8 million units for safety concerns.31
The Commission found that the domestic industry was seriously injured.32 As the Commission explained, the domestic industry had invested heavily in the development and production of competitive new LRWs during the period of investigation, and should have been well positioned to capitalize on the increase in apparent U.S. consumption during the period.33 Instead, the Commission found, “the domestic industry’s financial performance declined precipitously during the period of investigation, necessitating cuts to capital investment and R&D spending that imperil{ed} the industry’s competitiveness.”34 Between 2012 and 2016, the industry’s operating losses had increased by *** percent to reach a total of $*** during the period.35 As a result, domestic producers reduced capital investment and research and development spending by *** percent in 2016 relative to 2015 levels and by *** percent relative to 2012 levels, delaying and cancelling planned investments in new platforms and products.36 Noting the extent to which LRW sales are driven by innovation and features, the Commission concluded that there was a “significant overall impairment in the position of” the domestic industry.37
The Commission further found that imports were a substantial cause of the domestic industry’s serious injury.38 As the Commission explained, the domestic industry’s increasing operating and net losses resulted directly from the declining prices on sales of domestically produced LRWs during a time of increasing costs, which placed the industry in a cost-price squeeze. 39 The Commission found that the significant increase in low-priced imports of LRWs was the only explanation for the industry’s declining prices, given strong demand growth, increasing costs, and the competitiveness of domestic LRWs. 40 Specifically, the Commission found that the large and increasing volume of subject imports, at prices that undercut domestic
31 Original Safeguard Determination, USITC Pub. 4745 at 30, 38; Confidential Original Safeguard
Determination at 29, 58-59. 32 Original Safeguard Determination, USITC Pub. 4745 at 33; Confidential Original Safeguard
Determination at 50. 33 Original Safeguard Determination, USITC Pub. 4745 at 33; Confidential Original Safeguard
Determination at 50. 34 Original Safeguard Determination, USITC Pub. 4745 at 33; Confidential Original Safeguard
Determination at 50. 35 Original Safeguard Determination, USITC Pub. 4745 at 33; Confidential Original Safeguard
Determination at 50-51. 36 Original Safeguard Determination, USITC Pub. 4745 at 36; Confidential Original Safeguard
Determination at 55. 37 Original Safeguard Determination, USITC Pub. 4745 at 33; Confidential Original Safeguard
Determination at 57. 38 Original Safeguard Determination, USITC Pub. 4745 at 38; Confidential Original Safeguard
Determination at 57-58. 39 Original Safeguard Determination, USITC Pub. 4745 at 38; Confidential Original Safeguard
Determination at 58. 40 Original Safeguard Determination, USITC Pub. 4745 at 38; Confidential Original Safeguard
Determination at 58.
7
like product prices to a significant degree, depressed and suppressed domestic prices during the period of investigation.41 Given the moderate to high degree of substitutability and the importance of price to purchasers, the Commission explained, the pervasively lower prices of subject imports forced domestic producers to defend their market share by lowering their prices, despite increasing demand and production costs.42
The Commission found that imports were an important cause of serious injury not less than any other cause, rejecting two alleged alternative causes of injury argued by respondents.43 First, the Commission found that the record did not support respondents’ claim that Whirlpool and GE purposefully compensated for losses on sales of LRWs with profits on sales of matching dryers.44 Second, the Commission rejected respondents’ claim that the “deterioration” of U.S. brands in the eyes of consumers was a cause of injury, finding that domestically produced LRWs were comparable to subject imports in terms of non-price factors.45
The facts and analysis from the original investigation form the background for our consideration of the current petition for the extension of relief.
B. The Industry’s 2017 Adjustment Plans and Commitments.
The Commission also examined the adjustment plans presented by Whirlpool and GE, and the commitments made by LG and Samsung to construct new LRW production facilities in the United States, in the course of the original investigation.
In its adjustment plan, Whirlpool stated that “appropriate safeguard relief” would enable Whirlpool to “promptly activate its unused production capacity to meet increased sales volumes.”46 With these “efficiency improvements and improved economics,” Whirlpool claimed that it would “revisit . . . all projects that were canceled, curtailed, or rejected,” valued at $*** million, and “evaluate significant new projects” valued at $*** million.47 Specifically, Whirlpool indicated that it would evaluate investments in the following LRW projects: the launch of its “jumbo” capacity “AMAX” front load LRWs platform, with an estimated investment of $*** million; *** known as the “ATLANTIS 2.0 Project,” with an investment of $*** million; completing the launch of its “jumbo” capacity “ADVANTAGE” top load LRWs, with an incremental investment of approximately $*** million; launch of a *** washers platform, with
41 Original Safeguard Determination, USITC Pub. 4745 at 42-43; Confidential Original Safeguard
Determination at 65-66. 42 Original Safeguard Determination, USITC Pub. 4745 at 40, 43; Confidential Original Safeguard
Determination at 61, 65. 43 Original Safeguard Determination, USITC Pub. 4745 at 51; Confidential Original Safeguard
Determination at 68-69. 44 See Original Safeguard Determination, USITC Pub. 4745 at 45-47; Confidential Original
Safeguard Determination at 69-72. 45 See Original Safeguard Determination, USITC Pub. 4745 at 47-51; Confidential Original
Safeguard Determination at 72-79. 46 Original Safeguard Determination, USITC Pub. 4745 at 68-69; Confidential Original Safeguard
Determination at 104 (citing Whirlpool’s Adjustment Plan at 1). 47 CR/PR at VIII-3-4.

8
an investment of $***; and a complete update of its VMAX top load platform, with an investment of $***.48 Whirlpool also indicated that it would consider investing in the domestic production of LRWs that ***, with an investment of $***, and *** LRWs with an investment of $***.49 Whirlpool also expected that safeguard relief would allow it to ***, supporting an investment of up to $***.50
In addition to investments in new products, Whirlpool planned to “***,” including ***.”51 Whirlpool would also evaluate a ***.52
In its adjustment plan, GE stated that if relief were imposed, it intended to invest *** in updated offerings, human capital investment, and business process innovation.53 In terms of updated offerings, GE “would plan to invest ***” to expand its range of LRW platforms and ***.54
LG and Samsung planned to construct new LRW production facilities in the United States, which they characterized as commitments regarding actions they intend to take to facilitate positive adjustment to import competition.55 Specifically, LG planned to open a $250 million LRW production facility in 2019 in Clarksville, Tennessee, and Samsung planned to open a $380 million LRW production facility in Newberry, South Carolina, in early 2018.56 LG projected that its U.S. plant would supply *** percent of its U.S. sales in 2020, while Samsung projected that its U.S. plant would supply *** percent of its U.S. sales in 2019 and 2020.57
C. Whether Action Continues to be Necessary to Prevent or Remedy Serious Injury
In making its determination, the Commission considered the volume and prices of
imports since the safeguard action was taken; the current condition of the domestic industry and changes in the various indicators of the industry’s health since the action was taken, including changes related to industry adjustment efforts; and developments in foreign industries and markets, including production, capacity, and exports to third country markets. Based on our evaluation of these and other factors, we find that action continues to be necessary to prevent or remedy serious injury to the domestic LRW industry.
48 CR/PR at VIII-3-4. 49 CR/PR at VIII-4. 50 CR/PR at VIII-4. 51 CR/PR at VIII-5-6. 52 CR/PR at VIII-7. 53 CR/PR at VIII-1-2. 54 CR/PR at VIII-1. 55 Original Safeguard Determination, USITC Pub. 4745 at 70; Confidential Original Safeguard
Determination at 106-7. 56 Original Safeguard Determination, USITC Pub. 4745 at 70; Confidential Original Safeguard
Determination at 107. 57 Original Safeguard Determination, USITC Pub. 4745 at 70; Confidential Original Safeguard
Determination at 107.
9
1. Imports under the TRQ
Imports of LRWs declined during the remedy period, from *** units in 2017 to *** units in 2018 and *** units in 2019, a level *** percent lower than in 2017.58 Imports of LRWs were *** units in January-June 2020 (“interim 2020”), compared to *** units in January-June 2019 (“interim 2019”).59 Imports in interim 2020 were *** those of interim 2019 due to the President’s imposition of a quarterly allocation for the TRQ effective January 23, 2020.60
Imports filled the TRQ throughout the remedy period with above-quota imports in every period ***.61 In the first two years of the TRQ, imports filled the annual quota quickly, as LG and Samsung competed for a share of the quota volume.62 The first year quota, which opened on February 7, 2018, was filled by the third quarter of 2018 and the second year quota, which opened on February 7, 2019, was filled by the second quarter of 2019.63 After filling the quota in one period, LG and Samsung used their inventories of imports to satisfy demand until the quota reset in the following period.64 For the third year of the safeguard, the annual quota was allocated on a quarterly basis and thus importation was more evenly distributed in 2020 among the quarters covered by the period of investigation.
Importers’ end-of-period inventories in December 2017, at ***, were over *** times higher than in December 2016, when they amounted to *** units.65 In anticipation of the implementation of the safeguard measure in February 2018, LG and Samsung accelerated their importation of LRWs in late 2017 and early 2018 in order to build inventories of imported LRWs that could be used to maintain their market presence after the measure’s imposition.66 Drawing from these large inventories, importers were able to maintain a far higher level of U.S. shipments and market share in 2018 than would have been possible had inventories remained at historic levels.67
58 CR/PR at V-1, Table V-1. 59 CR/PR at Table V-1. 60 CR/PR at V-1 n.2. 61 CR/PR at Tables V-6-8. We note that the quarterly allocation of the annual quota in 2020,
which began on February 7, 2020, does not perfectly coincide with the quarters for which data were collected (i.e., January-March 2020, April-June 2020, and July-September 2020). See CR/PR at Table V-8. ***. See id.
62 Hearing Tr. at 206 (Porter); LG’s Responses to Commissioner Questions at 41 (“{S}ince the allocation of the quota is ‘first past the post’ the producer that ships most quickly at the onset of a new quota period will gain the greatest share of that quota . . . so there is a race to get in as much product as possible early in the quota period.”). LG and Samsung *** importers of LRWs during the period of investigation. See CR/PR at Table I-9.
63 CR/PR at V-12. 64 CR/PR at V-19 n.14; Hearing Tr. at 206 (Porter). 65 Confidential LRWs Monitoring Report at Table III-23. 66 CR/PR at V-19 n.14; LRWs Monitoring Report, USITC Pub. 4941 at 3, III-20 n.41; Confidential
LRWs Monitoring Report, Inv. No. 204-TA-013 (Monitoring), EDIS Document No. 717671 at 3, III-49 n.41. By 2017, LG and Samsung had shifted their source of most imported LRWs from China to Thailand and Vietnam, which were not subject to any U.S. trade remedy actions. See CR/PR at III-5, Table V-1.
67 Importer’s end-of-period inventories in 2017 were *** higher than during the original investigation, when importers’ end-of-period inventories increased steadily from *** units in 2012 to

10
As importers depleted their initial inventory stockpile, their inventories and shipments of imported LRWs declined towards the 1.2 million-unit level permitted under the TRQ at the in-quota tariff rate. Importers’ end-of-period inventories dropped from *** units in 2017 to *** units in 2018 and *** units in 2019.68 Their U.S. shipments of imported LRWs declined from *** units in 2017 to *** units in 2018 and *** units in 2019, a level *** percent lower than in 2017.69 Importers’ U.S. shipments of LRWs were *** units in interim 2020, compared to *** units in interim 2019.70 As a share of apparent U.S. consumption, imports of LRWs declined from *** percent in 2017 to *** percent in 2018 and *** percent in 2019; the share was *** percent in interim 2020 compared to *** percent in interim 2019.71
Although LG and Samsung had invested in domestic production of LRW with their new plants in the United States, the record shows that LG and Samsung have remained reliant on imports of LRWs during the remedy period. In every period, they rapidly filled the quota available at the lower in-quota tariff rate while importing additional volumes of LRWs at the higher above-quota tariff rate.72 Although LG and Samsung projected in the original safeguard investigation that their U.S. plants would supply over *** percent of their U.S. shipments by 2020,73 their U.S. plants supplied only *** percent of their U.S. shipments in the first half of 2020, as the plants continued to ramp up production.74 Both LG and Samsung intend to continue importing LRWs even after their U.S. plants are fully utilized and, as discussed in section IV.C.3 below, are likely to rely on such imports to grow their market share.75 Thus, imports of LRWs have remained at higher than anticipated levels during the relief period and are likely to remain substantial after expiration of the measure.
We have also examined the prices of imports during the period of relief. We received usable quarterly net U.S. f.o.b. selling price data for ten LRW products from four domestic producers and two importers, although not all firms reported pricing for all products for all quarters.76 Reported pricing data accounted for approximately *** percent of U.S. producers’ U.S. shipments of LRWs and *** percent of U.S. shipments of imported LRWs during the period
*** units in 2016. Original Safeguard Determination, USITC Pub. 4745 at Table III-9; Confidential Original Safeguard Determination at Table III-9.
68 CR/PR at Table V-10. 69 CR/PR at Table V-12. 70 CR/PR at Table V-12. 71 CR/PR at Table V-12. 72 CR/PR at V-12, Tables V-6-8. 73 Original Safeguard Determination, USITC Pub. 4745 at 70; Confidential Original Safeguard
Determination at 107. 74 LG’s Prehearing Brief at 22. 75 See LG’s Responses to Commissioner Questions at 5; Samsung’s Responses to Commissioner
Questions at 10; Hearing Tr. at 165 (Higby) (“At this time, imports remain important to SEHA's ability to provide adequate supply and a full range of products for the U.S. market.”), 152 (Toohey) (“Even after our U.S. factory is producing at 100 percent of its capacity, which is expected next year, we will still need to complement our U.S. production with imports, many of which will be higher priced, higher featured washers that come primarily from Korea.”).
76 CR/PR at VII-4.

11
of investigation.77 In the original investigation, the Commission found a moderate to high degree of substitutability between imports and domestically produced LRWs and that price was an important factor in purchasing decisions.78 There is nothing on the record of this investigation that would indicate that these conditions of competition have fundamentally changed.79
The pricing data of the record of this investigation show that imported LRWs continued to be priced lower than domestically produced LRWs after imposition of the safeguard measure, though to a lesser degree and on a lower volume of imports.80 In 2017, prior to imposition of the measure, imports of LRWs were priced lower than domestically produced LRWs in *** of *** quarterly comparisons, or *** percent of comparisons, by a weighted average margin of *** percent.81 There were *** units of imported LRWs in quarterly comparisons in which imports were priced lower than domestic LRWs in 2017, equivalent to *** percent of reported sales of imported pricing products during that year.82 After imposition of the measure, during the January 2018-June 2020 period, imports of LRWs were priced lower than domestically produced LRWs in *** of *** quarterly comparisons, or *** percent of comparisons, by a weighted average margin of *** percent. 83 There were *** units of imported LRWs in quarterly comparisons in which imports were priced lower than domestic
77 CR/PR at VII-4. 78 Original Safeguard Determination, USITC Pub. 4745 at 27; Confidential Original Safeguard
Determination at 40. 79 See Hearing Tr. at 45-47 (Utley) (“{R}etailers consider washers offered by major manufacturers
to be comparable . . . Each manufacturer offers the same four features and consumers cross-shop among many different washer types . . . given this comparability among washers . . . , price is the most important purchasing factor for retailers.”), 212 (Toohey) (“{T}here are some models like our flagship model that we only import . . . there are models that we can import that are at the lower end of the price platform but are some of our high volumes.”), 213 (Higby) (“It’s both the high end and there is some on the lower end that is imported.”), 253 (Schmidtlein, Murata) (When Commissioner Schmidtlein asked “who” Samsung’s imported “machines compete with,” a Samsung official responded “Whirlpool, LG, you know, Electrolux market.”).
80 Over the period of investigation, import prices declined with respect to *** pricing products, by between *** and *** percent, and increased with respect to *** pricing products, by *** and *** percent. CR/PR at Table VII-11. Domestic prices declined with respect to all *** pricing products for which data were collected, by between *** and *** percent. Id. Although the average unit value of the domestic industry’s U.S. shipments increased during the period of investigation, id. at Table III-5, the increase was driven in part by a change in the domestic industry’s product mix in favor of higher-value front load and Energy Star rated LRWs over the relief period. See id. at Table III-7 (higher-value front load and Energy Star rated LRWs’ share of the domestic industry’s U.S. shipments rose from *** percent in 2017 to *** percent in 2019 and *** percent in interim 2020).
81 CR/PR at Tables VII-1-10, VII-12. 82 CR/PR at Table VII-12. 83 CR/PR at Tables VII-1-10, VII-12. Imports of LRWs were even priced lower than domestically
produced LRWs from LG and Samsung in *** of *** quarterly comparisons, corresponding to *** units. See CR/PR at Tables VII-1-10, H-1-8.

12
LRWs during the remedy period, equivalent to *** percent of reported sales of imported pricing products during the period.84
Thus, imported LRWs remained lower priced than domestically produced LRWs in most quarterly comparisons despite the 16 to 20 percent in-quota tariff and despite LG’s and Samsung’s ramping up of new U.S. plants.85 Indeed, the record shows that LG’s and Samsung’s new U.S. plants would not deter LG and Samsung from importing LRWs at low prices because ***.86 For this reason, LG and Samsung could continue to import substantial volumes of LRWs at prices that undercut those of Whirlpool and GE after expiration of the measure without undermining their own U.S. production. Given LG’s and Samsung’s history of filling quotas quickly, maintaining large inventories of imported LRWs, and selling imported LRWs at low prices, we find it likely that they will continue to import LRWs in substantial volumes and at low prices after expiration of the measure.87
In the original investigation, the Commission found that increasing volumes of low-priced imports depressed and suppressed prices for the domestic like product, causing financial losses that forced the domestic industry to curtail the capital and research and development
84 CR/PR at Table VII-12. 85 In the original investigation, the Commission found that, over the entire period of
investigation, imports were priced lower than domestically produced LRWs in 70 of 92 quarterly comparisons, or 76.1 percent of comparisons, by a weighted-average margin of 14.2 percent. Original Safeguard Determination, USITC Pub. 4745 at 42; Confidential Original Safeguard Determination at 64.
86 The record shows that domestically produced LRWs from LG and Samsung were generally priced *** than imported LRWs. During the remedy period, January 2018-June 2020, imports of LRWs were priced higher than domestically produced LRWs from LG and Samsung in *** quarterly comparisons, corresponding to *** units, and lower in *** quarterly comparisons, corresponding to *** units. CR/PR at Tables VII-1-10, H-1-8; see also LG’s Prehearing Brief at 70-72 (showing that ***). By contrast, during the same period, imports of LRWs were priced lower than domestically produced LRWs from Whirlpool and GE in *** quarterly comparisons, corresponding to *** units, and higher in *** quarterly comparisons, corresponding to *** units. CR/PR at Tables VII-1-10, H-1-8. LG and Samsung reportedly price particular LRW models the same whether they are domestically produced or imported, which would make the prices on domestically produced LRWs equally low as the prices on equivalent imported LRWs. Hearing Tr. at 235 (Porter) (stating that LG prices LRW models “the same” whether imported or domestically produced), 235 (Fox) (stating that when there is overlap between LRW models imported and domestically produced, Samsung prices them “the same”).
87 The Commission notes that both Samsung and LG have stated that they will continue to import LRWs into the United States, even after their plants complete their ramp-up phase. Samsung states that “{w}hile overall import volume will continue to fall, Samsung plans to continue to supplement production at SEHA with imports of specialized models. Samsung intends to focus import sourcing on ***. Currently ***. In addition, there are ***.” Samsung’s Responses to Commissioner Questions at 10. LG states that its future imports can be categorized as follows: (1) low volume, fully featured LRWs developed and initially built at LG’s specialty new model production facility in Korea; (2) other small volume models, such as lower capacity models produced in other countries, primarily for non-U.S. markets, but sold by LG in the U.S. to fill out its product range; and (3) supplemental volume for models being made in the U.S., but for which U.S. capacity is insufficient to meet local demand. LG’s Responses to Commissioner Questions at 16.

13
expenditures essential to the industry’s competitiveness.88 Given LG’s and Samsung’s continued reliance on low-priced imports to supplement U.S. production and the likelihood that they will continue to import substantial volumes of low-priced imports, we find it likely that the domestic industry will confront intense low-priced import competition after expiration of the measure.
2. Developments with Respect to the Domestic Industry’s Condition
We also examined the various indicators of the industry’s performance over the period of relief to determine whether relief continues to be necessary. These data show that although the industry’s performance improved according to many measures, these improvements largely resulted from the commencement of production and shipments by LG’s and Samsung’s new U.S. plants in 2018, which continued to ramp up during the remedy period.89 At the same time, ***, while the overall industry’s financial performance remained weak.90 For the reasons discussed below, we find that the domestic industry considered as a whole does not currently exhibit the level of performance that would indicate that relief is no longer necessary.
Demand for LRWs as measured by apparent U.S. consumption declined from *** units in 2017 to *** units in 2018 before increasing to *** units in 2019, a level *** percent lower than in 2017.91 Apparent U.S. consumption was *** units in interim 2020, down from *** units in interim 2019.92 LRW demand declined irregularly during the 2017-19 period due to reduced levels of new housing starts and remodeling and fewer replacement purchases.93 Apparent U.S. consumption was lower in interim 2020 than in interim 2019 due to the COVID-19 pandemic, which disrupted U.S. production of LRWs and caused the temporary closure of many retail stores carrying LRWs.94 By the third quarter of 2020, domestic producers had largely overcome the pandemic-related disruptions to their operations and retail stores reopened.95
88 See Original Safeguard Determination, USITC Pub. 4745 at 33, 38, 44; Confidential Original
Safeguard Determination at 50, 58, 67. 89 See CR/PR at Table III-3. Samsung commenced production at its U.S. plant in January 2018
and LG commenced production at its U.S. plant in October 2018. Id. at Figure I-1. 90 See CR/PR at Tables III-3, V-12, C-1. 91 CR/PR at Tables V-12, C-1. A majority of responding domestic producers (3 of 5) and half of
responding importers (2 of 4) reported that demand had declined during the period of investigation, although all responding purchasers (12 of 12) reported that demand had increased. Id. at Table II-3.
92 CR/PR at Table V-12. 93 See LRWs Monitoring Report, USITC Pub. 4941 at 2; Confidential LRWs Monitoring Report at 2;
CR/PR at II-6, Figure II-1; Hearing Tr. at 177 (Klett). 94 CR/PR at II-7 & n.9, II-9, III-4, Tables III-2, IV-7; Hearing Tr. at 97-98 (Liotine), 153-55 (Toohey).
The decline in apparent U.S. consumption during the interim 2020 reflects in part the reduced ability of producers to bring product to market because of upstream supply chain difficulties and retail store closings during the early part of this year. However, petitioners and respondents also state that the COVID-19 pandemic actually led to stronger consumer demand due to “nesting” and home improvements while people are spending more time at home. CR/PR at II-7; LG’s Prehearing Brief at 84; Samsung’s Prehearing Brief at 4, 47; Whirlpool Q3 Earnings Call Transcript (Oct. 21, 2020) at 10, appended as Exhibit 11 to Samsung’s Prehearing Brief; LG’s Posthearing Brief at 14.
95 Hearing Tr. at 98 (Liotine), 113-14, 132-33 (Levy); Whirlpool’s Responses to Commissioner Questions at II-18.

14
During the period of relief, the domestic industry’s capacity and production increased overall as Samsung and LG ramped up their new U.S. production facilities, but the industry experienced relatively *** and generally declining rates of capacity utilization.96 Its capacity increased during the period, from *** units in 2017 to *** units in 2018 to *** units in 2019, a level *** percent higher than in 2017.97 The industry’s capacity was *** units in interim 2020, up from *** units in interim 2019. 98 The industry’s production decreased from *** units in 2017 to *** units in 2018 before increasing to *** units in 2019, a level *** percent higher than in 2017.99 The industry’s production was *** units in interim 2020, down from *** units in interim 2019.100 Consequently, the domestic industry’s rate of capacity utilization decreased from *** percent in 2017 to *** percent in 2018 before increasingly to *** percent in 2019, a level *** percentage points lower than in 2017.101 The industry’s rate of capacity utilization was *** percent in interim 2020, down from *** percent in interim 2019.102
The domestic industry’s employment and hours worked increased throughout the period of investigation, reflecting hiring by ***, although the industry’s productivity generally declined as production lagged.103 The domestic industry’s employment increased from *** production and related workers (“PRWs”) in 2017 to *** PRWs in 2018 and *** PRWs in 2018, and was *** PRWs in interim 2020, up from *** PRWs in interim 2019.104
The domestic industry’s U.S. shipments increased from *** units in 2017 to *** units in 2018 and *** units in 2019.105 The industry’s shipments were higher in interim 2020, at *** units than in interim 2019, at *** units.106 The industry’s U.S. shipments as a share of apparent U.S. consumption also increased, from *** percent in 2017 to *** percent in 2018 and *** percent in 2019.107 The industry’s market share was *** percent in interim 2020, up from *** percent in interim 2019.108
96 CR/PR at Tables III-3, IV-1. 97 CR/PR at Table III-3, C-1. 98 CR/PR at Table III-3. 99 CR/PR at II-5-6, Tables III-3, C-1. 100 CR/PR at Table III-3. 101 CR/PR at Table III-3, C-1. 102 CR/PR at Table III-3. 103 CR/PR at III-24, Table III-11. The industry’s total hours worked increased from *** hours in
2017 to *** hours in 2018 and *** hours in 2019, but was *** hours in interim 2020, down from *** hours in interim 2019. Id. The domestic industry’s productivity, measured in units per 1,000 hours, declined from *** units in 2017 to *** units in 2018 then rose to *** units in 2019. Id. Productivity in units per 1,000 hours was *** units in interim 2020, up from *** units in interim 2019. Id.
104 CR/PR at Table III-11. 105 CR/PR at Table III-5. 106 CR/PR at Tables III-5, IV-7. 107 CR/PR at Table V-12. 108 CR/PR at Table V-12. The increase in market share is attributable in part to a decline in
imports, but also to the new U.S.-based production by LG and Samsung. LG’s interim 2020 U.S. shipments were *** percent higher than in interim 2019, and Samsung’s were *** percent higher. CR/PR at III-15.

15
The domestic industry’s revenues increased during the period of investigation, from $*** in 2017, to $*** in 2018, and $*** in 2019.109 Revenues were flat, at $***, between interim 2019 and interim 2020.110
Apart from 2019, the industry sustained *** operating and net losses throughout the period of relief. The domestic industry’s operating loss initially worsened from $*** in 2017 (equivalent to negative *** percent of net sales) to $*** in 2018 (equivalent to negative *** percent of net sales) as the industry continued to face competition from substantial volumes of low-priced imports, weakened demand, increased costs, and ***.111 In 2019, however, the industry’s operating loss narrowed to $*** (equivalent to negative *** percent of net sales), as demand recovered somewhat, domestic producers gained market share and ***.112 This improvement was reversed with the onset of the COVID-19 pandemic, reflected in increased operating losses of $*** in interim 2020 (equivalent to negative *** percent of net sales), compared to $*** in interim 2019 (equivalent to negative *** percent of net sales).113
The domestic industry’s capital expenditures increased from $*** in 2017 to $*** in 2018, primarily reflecting ***, before declining to $*** in 2019; they were $*** in interim 2020, down from $*** in interim 2019.114 The domestic industry’s research and development expenditures, made primarily by ***, decreased *** from $*** in 2017 to $*** in 2018 and $*** in 2019; they were $*** in interim 2020, compared to $*** in interim 2019.115 The domestic industry’s return on assets exhibited a trend similar to that of the industry’s operating and net income, improving from negative *** percent in 2017 and negative *** percent in 2018 to negative *** percent in 2019.116
109 CR/PR at Table IV-1. 110 CR/PR at Table IV-1. 111 CR/PR at Tables IV-1, 3. 112 CR/PR at Table IV-1. Gross profit fluctuated from *** in 2017 to *** in 2018 and *** in 2019.
It was *** in interim 2019 and *** in interim 2020. CR/PR at Table IV-1. 113 CR/PR at Tables IV-1, IV-7. Similarly, the domestic industry’s net loss worsened from $*** in
2017 to $*** in 2018 before improving to $*** in 2019; it was $*** in interim 2020, worse than the $*** in interim 2019. Id. at Table IV-1.
We are unpersuaded by LG’s claim that Whirlpool’s financial performance on sales of LRWs is somehow inconsistent with the financial performance of Whirlpool’s North American segment. See LG’s Prehearing Brief at 40-42; Hearing Tr. at 183-85 (Anderson), Confidential Slides 5-6. Rejecting a similar argument in the original investigation, the Commission explained that the focus of its analysis was LRWs and the results of Whirlpool’s North American segment were based primarily on sales of products other than LRWs, which accounted for only 13.1 to 13.5 percent of the North America segment’s total revenue during the 2012-16 period. Confidential Original Determination at 51 n.210; LRWs, USITC Pub. 4745 at 34 n.210. The Commission also noted that Whirlpool’s domestic producers’ questionnaire response, including all financial information, was verified and found to be accurate in LRWs from China. Id. Whirlpool used the same methodology to report the financial performance of its LRW operations in this proceeding. Hearing Tr. at 278 (Levy). For the same reasons as in the original investigation, we reject LG’s claim that Whirlpool’s reported financial performance is unreliable.
114 CR/PR at Tables IV-8, 9. 115 CR/PR at Table IV-8. 116 CR/PR at Table IV-10.
16
While the statute requires that we examine “the domestic industry,” we also find it appropriate to consider the differing performance of two groups of producers, the continuous producers (Whirlpool and GE) and the start-up producers (LG and Samsung) as the two groups are differently situated and faced different impacts from imports over the period.117 118 In particular, the ramping up of LG’s and Samsung’s new U.S. plants masked some of the
117 The term “continuous producers” refers to those U.S. produces that have been producing
LRWs since before the petition for section 201 relief was filed in 2017, including Whirlpool, GE, and Alliance. During the period of investigation, Whirlpool and GE accounted for the *** majority of production by the continuous producers. See CR/PR at Table III-3.
118 In this proceeding, the parties take disparate positions on how to define the “domestic industry” for purpose of evaluating petitioner’s extension request. Whirlpool argues that “the Commission’s analysis should focus on the statutory objective of the safeguard — i.e., to remedy the serious injury that Samsung and LG inflicted on the Continuous U.S. Producers . . . Thus, while the overall domestic industry now includes Samsung and LG’s U.S LRW production facilities, for purposes of this extension proceeding, it is critical that the Commission focus on the progress and performance of the Continuous U.S. Producers who were seriously injured by Samsung and LG’s imports during the original safeguard period of investigation.” Whirlpool’s Prehearing Brief at 9. In contrast, Samsung and LG aver that the domestic industry’s adjustment to import competition is complete, as most clearly evidenced by “those foreign producers that accounted for virtually all exports of covered LRWs to the United States set*** up U.S. factories to replace those exports.” See LG’s Prehearing Brief at 2; see also LG’s Posthearing Brief at 2-3; Samsung’s Posthearing Brief at 5-7. As argued by Samsung, “the domestic industry, ‘as a whole’ is the relevant category when evaluating whether the Safeguard action taken by the President has achieved its objectives of facilitating efforts to make a positive adjustment . . . .” Samsung’s Responses to Commissioner Questions at 13.
In conducting its analysis, the Commission evaluates the domestic industry as constituted at the present time and not solely as it was composed at the time of the Commission’s original “serious injury” determination. Nothing in the statute governing extension proceedings limits the Commission’s analysis to the continuous producers. To the contrary, the statute defines “domestic industry” as “the producers as a whole of the like or directly competitive article,” which would include both continuous producers and new entrants. 19 U.S.C. § 2252(c)(6)(A)(i). In addition, the Commission notes that pursuant to 19 U.S.C. § 2251(b)(2), a domestic industry may be considered to have made a positive adjustment “even though the industry is not the same size and composition” as the industry at the time the original investigation was instituted. This is consistent with the Commission’s approach in Wheat Gluten, the only prior occasion in which the Commission evaluated a request made under section 204(c) of the Trade Act of 1974. Wheat Gluten: Extension of Action, Inv. No. TA-204-004, USITC Pub. 3407 (Apr. 2001) at 6 (in determining whether to extend the safeguard measure, the Commission “reviewed the evidence in the investigation record relating to the present condition of the industry and the factors affecting competition, as well as the evidence in the record concerning whether the domestic industry is making a positive adjustment to import competition.”). However, under the statute, the Commission has the discretion to consider any factors it deems relevant to its determination of whether the domestic industry has made a positive adjustment to imports. Thus, we recognize that the “continuous producers” and the “new entrants” were situated differently during the safeguard period. Moreover, the “continuous producers” accounted for the large majority of domestic production throughout the relief period. Thus, we have reviewed the experience of these producer groupings severally as part of our evaluation of the domestic industry as a whole.

17
deteriorating performance of the continuous producers Whirlpool and GE, which accounted for approximately *** percent of U.S. production during the relief period.119 Between 2017 and 2019, the continuous producers suffered a *** percent decline in production and a *** percent decline in U.S. shipments.120 The continuous producers’ performance worsened *** between the interim periods due to the COVID-19 pandemic, with their production *** percent lower and their U.S. shipments *** percent lower in interim 2020 compared to interim 2019.121 According to Whirlpool, the pandemic reduced demand by forcing many appliance retailers to temporarily close, and created unprecedented production challenges.122 Specifically, Whirlpool states that the pandemic resulted in hundreds of worker absences, the need to redesign the plant to account for worker safety, and significant supply chain disruptions, which significantly reduced productivity and lengthened lead times during interim 2020.123
The continuous producers’ declining production and U.S. shipments contributed to weak financial performance during the remedy period, reducing the internally generated funds available for implementation of their adjustment plans. GE sustained operating losses during each full and interim year of the period, totaling $***.124 Whirlpool recorded operating profits during 2018 (equivalent to *** percent of net sales) and 2019 (equivalent to *** percent of net sales); however, it recorded operating losses in 2017 and interim 2020, equivalent to negative *** and *** percent of net sales in those periods, respectively.125 Only in 2019 did Whirlpool earn healthy profits sufficient to advance its adjustment plans.126 Due to their weak performance during the remedy period, Whirlpool’s and GE’s efforts to adjust to import competition remain incomplete,127 rendering them vulnerable to unfettered competition from low-priced imports after expiration of the measure.
LG and Samsung also faced unanticipated challenges in ramping up their new U.S. plants during the remedy period, which slowed their progress considerably. LG stated that it set “optimistic” production targets that remain unmet due to “more bumps in the road” than anticipated, including ***.128 Samsung also set “ambitious targets” that remain unmet due to difficulty finding workers and the learning curve for producing a large number of parts in-
119 Whirlpool and GE accounted for *** percent of domestic production during the relief period,
and *** percent of domestic production in 2019. See CR/PR at Tables I-7, III-3. 120 CR/PR at Table C-1. The continuous producers’ production declined from *** units in 2017 to
*** units in 2019, while their U.S. shipments declined from *** units in 2017 to *** units in 2019. Id. 121 CR/PR at Table C-1. The continuous producers’ production was *** units in interim 2020,
down from *** units in interim 2019, while their U.S. shipments were *** units in interim 2020, down from *** units in interim 2019. Id.
122 Hearing Tr. at 43, 96 (Liotine); Whirlpool’s Responses to Commissioner Questions at II-15-17. 123 Hearing Tr. at 43, 97-98 (Liotine), 113 (Levy), 142-43 (Liotine); Whirlpool’s Hearing Exhibit 12;
Whirlpool’s Responses to Commissioner Questions at II-17-18. 124 CR/PR at Table IV-3. 125 CR/PR at Table IV-3. 126 CR/PR at Table IV-3 (Whirlpool’s operating income to net sales ratio was *** percent in
2019); Hearing Tr. at 40 (Liotine). 127 See Hearing Tr. at 43 (Liotine), 52 (Magnus), 67-68 (Levy); Whirlpool’s Posthearing Brief at II-
21-24. 128 Hearing Tr. at 151 (Myers); LG’s Responses to Commissioner Questions at 1-4.

18
house.129 Consequently, LG and Samsung supplied only *** percent of their U.S. shipments from their U.S. plants in the first half of 2020, far below the *** percent they projected during the original investigation.130 Thus, the slower-than-anticipated ramping up of LG’s and Samsung’s new U.S. plants contributed to their continuing dependence on imported LRWs during the remedy period.
Based on the preceding analysis, we find the weak performance of the continuous producers, which account for the bulk of the domestic industry, and the slower-than-expected ramping up of the new entrant’s plants support extension of the measure. The weak financial performance of the industry as a whole, and especially that of the continuous producers, materially hindered the industry’s efforts to make a positive adjustment to import competition during the remedy period.
3. Foreign Industry Developments
As noted above, low-priced imports increased significantly during the period examined in the original investigation, depressing and suppressing domestic prices and causing the industry to suffer substantial financial losses. During this same period, LG and Samsung demonstrated the ability to rapidly ramp up substantial volumes of LRW production at existing foreign plants for export to the United States. Specifically, LG and Samsung shifted production from Korea and Mexico to China in ***, in advance of the antidumping and countervailing duty orders imposed on LRWs from Korea and Mexico, and from China to Thailand and Vietnam in ***, in advance of the antidumping duty order imposed on LRWs from China.131
LG and Samsung continue to produce LRWs in China, Korea, Mexico (with respect to Samsung), Thailand, and Vietnam, and are capable of increasing their exports of LRWs to the United States substantially.132 In the aggregate, the LRW industries in these countries possessed LRW capacity of *** units in 2019, including excess capacity of *** units, and *** units in interim 2020, including excess capacity of *** units.133 The excess capacity in these countries was equivalent to *** percent of apparent U.S. consumption in 2019 and *** percent of apparent U.S. consumption in interim 2020.134 Apart from substantial excess capacity, the LRW industries in these countries export a substantial share of their total shipments to third country markets, ranging from *** to *** percent in 2019 and from *** to *** percent in
129 Hearing Tr. at 196 (Komaroni); Samsung’s Responses to Commissioner Questions at 3. 130 Compare LG’s Prehearing Brief at 22 with Original Safeguard Determination, USITC Pub. 4745
at 70; Confidential Original Safeguard Determination at 107. The new entrants’ production increased from *** units in 2018 to *** in 2019 and was *** units in interim 2020, up from *** units in interim 2019. CR/PR at Table C-1. The new entrants’ U.S. shipments increased from *** units in 2018 to *** units in 2019 and were *** units in interim 2020, up from *** units in interim 2019. Id.
131 CR/PR at I-12; Original Safeguard Determination, USITC Pub. 4745 at 25; Confidential Original Safeguard Determination at 36-38.
132 See CR/PR at Tables VI-1, 6, 11, 16, and 21. 133 CR/PR at Tables VI-3, 8, 13, 18, 23. We note that LG and Samsung appear capable of
increasing their capacity to produce LRWs in Thailand and Vietnam ***. See Whirlpool’s Responses to Commissioner Questions at II-30-31.
134 Compare CR/PR at Tables VI-3, 8, 13, 18, 23 with id. at Table V-12.

19
interim 2020, that could be redirected to the U.S. market after expiration of the measure.135 Responding LRW producers in these countries also reported the ability to shift production from out-of-scope products to LRWs at their facilities used to produce LRWs, which possessed an overall capacity of *** units in 2019 and *** units in interim 2020.136 Although LRWs imported from China and Mexico are subject to antidumping duty orders, LRWs imported from the three largest foreign suppliers of LRWs to the United States (Korea, Thailand, and Vietnam) are subject to no U.S. trade remedies other than the safeguard measure, and these three countries accounted for the *** of reported LRW capacity.137
Thus, foreign LRW industries maintain the ability to increase their exports of LRWs to the United States substantially by utilizing excess capacity, redirecting exports from third country markets, and shifting production from out-of-scope products to LRWs. In addition, LG and Samsung have demonstrated an ability to rapidly increase LRW capacity and production at their existing foreign LRW production facilities, as they have previously ramped up production for the U.S. market and shifted sourcing from their various facilities in China, Korea, Mexico (with respect to Samsung), Thailand, and Vietnam, and could do so again as a means of increasing exports to the United States.138
We recognize that LG’s and Samsung’s new U.S. plants will permit them to satisfy a certain portion of U.S. demand for their LRWs with domestic production instead of imports.139 However, given LG’s and Samsung’s history of using low-priced imported LRWs to rapidly increase their U.S. market share,140 their ability to rapidly increase their exports of LRWs to the United States, and the capacity limitations of their U.S. plants, we find it likely that LG and Samsung would seek to increase their penetration of the U.S. market after expiration of the measure using low-priced imported LRWs.
135 The percentage of total shipments exported to third country markets was *** percent in
2019 and *** percent in interim 2020 for Mexico, *** percent in 2019 and *** percent in interim 2020 for China, *** percent in 2019 and *** percent in interim 2020 for Korea, *** percent in 2019 and *** percent in interim 2020 for Thailand, and *** percent in 2019 and *** percent in interim 2020 for Vietnam. CR/PR at Tables VI-3, 8, 13, 18, 23.
136 CR/PR at VI-5 n.5, VI-12 n.12, VI-18 n.17, VI-24 n.20, VI-29 n.24, Tables IV-4, 9, 14, 19, 24. Some of LG’s and Samsung’s foreign production facilities have recently shifted from production of LRWs for the U.S. market to production of out-of-scope products for home and third country markets. See id. at Tables VI-7, 17, 22.
137 CR/PR at I-4-5, 7, Tables VI-3, 8, 13, 18, 23. In 2019, the LRW industries in Korea, Thailand, and Vietnam accounted for *** of the LRW capacity reported by producers in China, Korea, Mexico, Thailand, and Vietnam. Id. at Tables VI-3, 8, 13, 18, 23.
138 LG stated that moving substantial LRW production capacity to China, Thailand, and Vietnam ***, ranging from $*** for LRW production in Thailand to $*** for LRW production in China. LG’s Responses to Commissioner Questions at 19.
139 See LG’s Responses to Commissioner Questions at 5; Samsung’s Responses to Commissioner Questions at 10.
140 In the original investigation, imports of LRWs increased as a share of apparent U.S. consumption from *** percent in 2012 to *** percent in 2016. Original Safeguard Determination, USITC Pub. 4745 at 38-39; Confidential Original Safeguard Determination at 59.

20
We are unpersuaded by LG’s and Samsung’s argument that their new U.S. plants somehow dictate negative determinations in this proceeding.141 As support, LG and Samsung rely on previous five-year reviews of antidumping and countervailing duty orders in which the Commission made negative determinations based in part on the finding that major importers had constructed U.S. production facilities that made them unlikely to import subject merchandise in an injurious manner after revocation of the orders under review.142 The facts on the record of this case, however, are distinguishable from those at issue in the previous cases. In the LRWs from Korea and Mexico five-year reviews, the Commission did not base its negative determination with respect to Korea solely on LG’s and Samsung’s new U.S. plants, as LG suggests.143 In making negative determinations, the Commission also relied on the limited excess capacity available in Korea, the fact that Samsung no longer produced LRWs in Korea for export to the United States, and the restraining effect of the safeguard measure on imports from Korea.144 The Commission also noted that Samsung had shifted production for the U.S. market away from Korea to Thailand and Vietnam and that any imports in the future would likely come from those facilities, rather than Korea.145 In this case, by contrast, the record shows that LG’s and Samsung’s total combined foreign LRW operations possess substantial excess capacity and other means to increase exports to the United States significantly, and there are no trade remedies other than the safeguard measure restraining imports from Thailand, Vietnam, and Korea.
The record also shows that LG’s and Samsung’s new U.S. plants did not actually prevent LG and Samsung from importing large volumes of low-priced LRWs during the remedy period. To the contrary, LG and Samsung remained dependent on imported LRWs, rapidly filling the TRQ in each period and importing substantial volumes of LRWs at high above-quota tariff rates, and plan to continue importing LRWs.146 Nor did LG’s and Samsung’s new plants deter them from importing large volumes of LRWs at prices that were pervasively lower than prices for comparable LRWs produced domestically by Whirlpool and GE, given that ***.147 Further, while LG and Samsung intended *** percent of U.S. shipments of LRW to be domestically produced in 2020, by interim 2020 only *** percent of their U.S. shipments were of
141 See LG’s Prehearing Brief at 59-63; Samsung’s Posthearing Brief at 10-11; Hearing Tr. at 234
(Shor). 142 See LG’s Prehearing Brief at 60-63 (citing LRWs from Korea and Mexico, USITC Pub. 4882 at
20-21; Sorbitol from France, Inv. No. 731-TA-44 (Third Review), USITC Pub. 4164 (June 2010) at 17-18, 21, 25; Stainless Steel Sheet and Strip from Germany, Italy, Japan, Korea, Mexico, and Taiwan, Inv. Nos. 701-TA-382 and 731-TA-798-803 (Second Review), USITC Pub. 4244 (July) at 32; Orange Juice from Brazil, Inv. No. 731-TA-1089, USITC Pub. 4311 (Apr. 2012) at 18; Certain Bearings From China, France, Germany, Hungary, Italy, Japan, Romania, Singapore, Sweden, and the United Kingdom, Inv. Nos. AA1921-143, 731 -TA-341, 731 -TA-343-345, 731 -TA-391-397, and 731-TA-399 (Review), USITC Pub. 3309 (June 2000) at 29). We note that each Commission determination is sui generis and we are not bound in this case by the Commission’s analyses in these previous cases.
143 See LG’s Prehearing Brief at 60-61. 144 LRWs from Korea and Mexico, USITC Pub. 4882 at 39-43, 49. 145 LRWs from Korea and Mexico, USITC Pub. 4882 at 41. 146 See Section IV.C.1, above. 147 See Section IV.C.1, above.

21
domestically produced LRW.148 Given this, and the likelihood that LG and Samsung will seek to expand their market share after expiration of the measure using imported LRWs, we find that the domestic industry is likely to face intense import competition after expiration of the measure notwithstanding LG’s and Samsung’s new U.S. plants.
In conclusion, based our analysis of the volume of imports under the TRQ, the condition of the domestic industry, and foreign industry developments, and given LG’s and Samsung’s continued reliance on low-priced subject imports and the likelihood that they will continue to import substantial volumes of low-priced imports, we find it likely that the domestic industry will confront intense-low priced import competition after expiration of the measure. Increasing volumes of low-priced imports are likely to cause further financial losses that will force the domestic industry to curtail the capital and research and development expenditures essential to complete a positive adjustment to import competition.149
For all of the foregoing reasons, we find that action continues to be necessary to prevent or remedy serious injury.
148 Compare LG’s Prehearing Brief at 22 with Original Safeguard Determination, USITC Pub. 4745
at 70; Confidential Original Safeguard Determination at 107. 149 In the original investigation, the Commission found that increasing volumes of low-priced
imports depressed and suppressed prices for the domestic like product, causing financial losses that forced the domestic industry to curtail the capital and research and development expenditures essential to the industry’s competitiveness. See Original Safeguard Determination, USITC Pub. 4745 at 33, 38, 44; Confidential Original Safeguard Determination at 50, 58, 67.

22
D. Evidence the Industry Is Making a Positive Adjustment to Import Competition
The domestic industry is making progress in its efforts to make a positive adjustment to import competition.150 Whirlpool and GE implemented various aspects of their respective adjustment plans, developing and introducing new models and enhancing their production facilities,151 and LG and Samsung constructed and began ramping up their new U.S. LRW production facilities.152
Whirlpool developed and launched several new platforms and products during the relief period, including Janus front load LRWs and VMAX 2.0 top load LRWs.153 Specifically, ***.154 ***.155 ***156 ***.157 ***.158 ***.159
Whirlpool also made partial progress in implementing certain elements of its adjustment plan aimed at enhancing the productivity of its LRW production facility in Clyde, Ohio, including aspects of its Factory Master Plan aimed at achieving “world class manufacturing.”160 Specifically, ***.161 ***.
GE also implemented elements of its adjustment plan during the relief period. ***.162 ***.163 ***.164 While counsel to GE stated that its “large residential washer business has
150 In relevant part, a positive adjustment to import competition is considered to have occurred
when the domestic industry “is able to compete successfully with imports after actions taken under section 204 terminate . . . .” See 19 U.S.C. § 2251(b)(1). As previously noted, the operative statute provides that the domestic industry may be considered to have made a positive adjustment “even though the industry is not of the same size and composition” as the industry at the time the investigation was instituted under section 202(b). See 19 U.S.C. § 2251(b)(2).
151 Following the Commission’s vote on serious injury in the original safeguard investigation, Whirlpool and GE submitted proposed adjustment plans for implementation in the event of appropriate import relief. These adjustment plans are reproduced in their entirety in the CR/PR at Part VIII.
152 In February 2019, the Commission instituted a proceeding (as required by statute) to report to the President and the Congress on the results of its monitoring of developments with respect to the domestic LRWs industry since the imposition of the safeguard relief. The Commission’s report was issued in August 2019. The Commission summarized its findings: “Since the safeguard measures were put in place, there have been a number of significant developments, including decreased imports, generally increased prices, some improvement in the financial performance of continuously operating producers, increased production by two new U.S. producers, increased employment in the industry, and progress implementing adjustment plans.” LRWs Monitoring Report, USITC Pub. 4941 at 1.
153 Hearing Tr. at 41, 47, 75 (Liotine). 154 CR/PR at VIII-7-8. 155 CR/PR at VIII-8-9. 156 CR/PR at VIII-8. 157 CR/PR at VIII-8. 158 CR/PR at VIII-9. 159 CR/PR at VIII-10 160 Hearing Tr. at 50, 60, 124 (Liotine). 161 CR/PR at VIII-11; Whirlpool’s Responses to Commissioner Questions at II-23. 162 CR/PR at VIII-2. 163 CR/PR at VIII-2. 164 CR/PR at VIII-2.

23
benefited and is still benefiting from the safeguard relief,” he further noted that GE’s “efforts to make a positive adjustment to import competition, and execution on the adjustment plan that was provided in this proceeding are continuing efforts.”165
Finally, LG and Samsung constructed their new U.S. LRW production facilities, which were announced prior to imposition of the safeguard measure, and continue to ramp up production at the plants.166 LG invested $*** in a new plant in Clarksville, Tennessee with an annual capacity of 1.2 million units.167 LG claims that its U.S. plant possesses a much higher degree of vertical integration than other LG LRW plants, producing major subcomponents including inner drums, drum/tubs, cabinet covers, control panel assemblies, and cabinet base assemblies.168 After commencing commercial production in October 2018, LG produced *** units in 2018, *** units in 2019, and *** units in interim 2020, up from *** units in interim 2019.169 LG expects to fully utilize its capacity at the plant in 2021.170
Samsung invested over $*** in a new plant in Newberry, South Carolina, and projects that production and capacity will approach *** units in 2021.171 After commencing commercial production in January 2018, Samsung produced *** units in 2018, *** units in 2019, and *** units in interim 2020, up from *** units in interim 2019.172
Thus, the record shows that during the nearly three years that the safeguard measure has been in place, the domestic industry has implemented many aspects of the adjustment plans and commitments submitted during the original investigation, introducing innovative new LRW products and upgrading and expanding its production capacity. Most responding purchasers reported that domestic producers have introduced new or innovative products, improved their product quality, and expanded their marketing efforts, among other efforts to adjust to import competition.173 As discussed in section IV.C.2 above, however, the continuous producers’ weak performance during the remedy period prevented the industry from making additional necessary adjustments, particularly Whirlpool’s plans to increase the productivity of
165 Hearing Tr. at 52 (Magnus); see also GE Summary of Hearing Testimony (November 4, 2020),
EDIS Document No. 724033 at 2. 166 CR/PR at Table III-1. 167 CR/PR at III-3, Table III-2; LG’s Prehearing Brief at 12; Hearing Tr. at 151 (Myers). 168 LG’s Prehearing Brief at 13, 15-16. 169 CR/PR at III-3, Table III-3. 170 Hearing Tr. at 151, 194-95 (Myers). As noted above, while LG and Samsung intended ***
percent of U.S. shipments of LRW to be domestically produced in 2020, by interim 2020 only *** percent of their U.S. shipments were of domestically produced LRW.
171 CR/PR at Table III-2; Samsung’s Prehearing Brief at 17. 172 CR/PR at Table III-3. 173 In this proceeding, purchasers were asked if domestic producers took certain actions since
February 7, 2018. Eleven of 12 responding purchasers reported that domestic producers had introduced a new or innovative product; 8 purchasers reported that domestic producers had improved product quality and expanded their marketing efforts, including e-commerce; and 6 purchasers reported that domestic producers had made other efforts to positively adjust to imports, including the opening of LG and Samsung’s new production plants. CR/PR at VIII-15.

24
its LRW production facility.174 At the same time, LG and Samsung experienced difficulties that prevented them from fully ramping up their new U.S. plants by 2019 and 2020, as planned. Accordingly, we find evidence that the domestic industry is making a positive adjustment to import competition, but also find that the industry’s adjustment remains incomplete.
V. Recommendations
Duration of extension. After considering the information on the record of this investigation and the arguments of the parties, we recommend that the President extend the relief action for two additional years. We believe that this is a requisite amount of additional time that the domestic industry needs to complete its positive adjustment to import competition. In making this recommendation to extend the safeguard, the Commission has taken into consideration the extent to which the domestic industry has completed its positive adjustment to import competition, the condition of the domestic industry, and the likelihood that imports of low-priced imports will continue. In the original investigation, the Commission had anticipated that by limiting import volume to 1.2 million units per year for three years, the domestic industry would realize significantly higher sales volumes and somewhat higher prices, translating into higher revenues and operating income.175 However, as previously discussed, the domestic industry did not fully realize these anticipated outcomes. In addition, the Commission has taken into consideration the fact that, due at least in part to the stockpiling of low-priced imports in anticipation of the safeguard measure, shipments of imports were much higher and the domestic industry’s sales volumes much lower than anticipated in 2018, which contributed to the industry’s weak financial performance that year. Furthermore, the Commission has taken into consideration that, although the industry’s financial performance improved in 2019, the COVID-19 pandemic resulted in lost production and reduced sales, driving the industry’s financial performance to levels below that in 2018. While we recognize that the industry’s financial performance is likely to improve with increasing consumption in the second half of 2020, the industry’s weak performance in 2018 and the first half of 2020, caused in part by these factors, impacted its ability to derive the full benefit of the safeguard measures and complete its adjustment to import competition. An additional two years of relief, through February 7, 2023, should provide the domestic industry with sufficient time to complete its positive adjustment. Such an extension should enable Whirlpool to implement those additional adjustment efforts that had to be deferred. Specifically, Whirlpool should be able to complete its plans to invest $*** in the development of new lineups of mass market top load LRWs, known as Whirlpool 2021 and Maytag 2022, for introduction through 2022.176 Whirlpool should be able to go forward with its plans to invest
174 See Hearing Tr. at 43 (Liotine), 52 (Magnus), 67-68 (Levy); Whirlpool’s Posthearing Brief at II-
21-24. 175 Original Safeguard Determination, USITC Pub. 4745 at 73; Confidential Original Safeguard
Determination at 112-13. We also note that Whirlpool’s and GE’s original adjustment plans were predicated on the assumption that the industry would receive three full years of safeguard relief from low-priced import competition.
176 Whirlpool’s Responses to Commissioner Questions at II-22.

25
$*** in an industry-leading multi-load LRW platform, for introduction by 2023.177 Whirlpool should also be able to go forward with the remaining elements of its Factory Master Plan, investing $*** in ***.178 We find that Whirlpool’s investments in these new models and enhancements to its productive capacity are essential to the domestic industry’s positive adjustment to import competition, given that Whirlpool accounts for *** of the industry’s production.179 A two-year extension of the safeguard remedy would also encourage LG and Samsung to complete the ramping up of their new U.S. plants. On this point, we note that LG currently projects that domestically produced LRWs will account for only *** percent of its sales in 2021 in the event that its U.S. plant is fully utilized, rather than the *** percent it envisioned during the original investigation.180 Increased domestic production by these companies would improve the overall health of the domestic industry.181
For all of these reasons, we find that two years of continued relief would provide the domestic industry with the additional time necessary to prevent or remedy serious injury and to complete its adjustment to import competition.
Amount of relief. With respect to LRWs, we recommend that the President continue to progressively liberalize the action by decreasing the in-quota tariff rate to 15 percent in the fourth year and 14 percent in the fifth year and the above-quota tariff rate to 35 percent in the fourth year and 30 percent in the fifth year.182 The volume of imports of LRWs subject to the in-quota tariff rate would remain 1.2 million units per year, administered on a quarterly basis.
With respect to covered parts, we recommend that the President continue to progressively liberalize the action by increasing the quota on such parts to 110,000 units in the fourth year, with an above-quota tariff of 35 percent, and to 130,000 units in the fifth year, with an above-quota tariff of 30 percent. No additional tariff would apply to goods within the in-quota quantity, as under the original measure.
177 Whirlpool’s Responses to Commissioner Questions at II-23. 178 Whirlpool’s Responses to Commissioner Questions at II-23-24. 179 Like Whirlpool, GE states that its adjustment remains incomplete and would benefit from an
extension of the safeguard measure. GE’s Posthearing Brief at 2. 180 See LG’s Responses to Commissioner Questions at 5; Original Safeguard Determination, USITC
Pub. 4745 at 70; Confidential Safeguard Determination at 107. We also note that in *** of *** quarterly comparisons, imports of LRWs were priced lower than domestically produced LRWs from LG and Samsung. CR/PR at Tables VII-1-10, H-1-8.
181 See LG’s Responses to Commissioner Questions at 20 (***); Samsung’s Responses to Commissioner Questions at 7.
182 Commissioner Johanson recommends an in-quota tariff rate of 14 percent in the fourth year, decreasing to 12 percent in the fifth year. He otherwise joins the majority recommendations.


I-1
Part I: Introduction and overview
Background
On June 5, 2017, a petition, as amended, was properly filed under section 202(a) of the Trade Act of 1974 (“The Trade Act”) (19 U.S.C. § 2552(a)) by Whirlpool Corporation (“Whirlpool”). The petition alleged that large residential washers (“LRWs”) were being imported into the United States in such increased quantities as to be a substantial cause of serious injury, or threat thereof, to the domestic industry producing an article like or directly competitive with the imported article. The Commission conducted an investigation under section 202(b)(1)(A) of the Act. Following receipt of the report from the U.S. International Trade Commission (“USITC” or “Commission”) in December 2017 under section 202 of the Act (19 U.S.C. § 2252) containing an affirmative serious injury determination and remedy recommendations, the President, on January 23, 2018, pursuant to section 203 of the Act (19 U.S.C. § 2253), issued Proclamation 9694.1 The Proclamation imposed a safeguard measure in the form of a tariff-rate quota on imports of large residential washers for a period of 3 years and 1 day, effective February 7, 2018.2 On February 15, 2019, the Commission instituted a proceeding for the purpose of preparing the report to the President and the Congress required by section 204(a)(2) of the Trade Act of 1974 (“the Act”)3 on the results of its monitoring of developments with respect to the domestic LRWs industry since the imposition of tariff-rate quotas on imports of large residential washers. 4 On August 7, 2019, the Commission issued its report of its monitoring of developments with respect to the domestic LRWs industry.5 Effective January 23, 2020, the
1 83 FR 3553, January 25, 2018. 2 The measure providing import relief covers (a) washers provided for in subheadings 8450.11.00 and
8450.20.00 in the Annex to Proclamation 9694; (b) all cabinets, or portions thereof, designed for use in washers, and all assembled baskets designed for use in washers that incorporate, at a minimum, a side wrapper, a base, and a drive hub, provided for in subheading 8450.90.60 in the Annex to Proclamation 9694; (c) all assembled tubs designed for use in washers that incorporate, at a minimum, a tub and a seal, provided for in subheading 8450.90.20 in the Annex to Proclamation 9694; (d) any combination of the foregoing parts or subassemblies, provided for in subheadings 8450.90.20 or 8450.90.60. Also see HTS 9903.45.01 and 9903.45.02.
3 19 U.S.C. § 2254(a)(2). 4 84 FR 5715, February 22, 2019. 5 Large Residential Washers: Monitoring Developments in the Domestic Industry (Inv. No. TA-204-
013), USITC Publication 4941, August 2019 (“Monitoring Publication”).

I-2
President issued Proclamation 9979, implementing the quarterly allocation of the tariff-rate quota on imports of LRWs.6 The Commission instituted this investigation on August 3, 2020, following receipt of a petition filed by Whirlpool, requesting extension of the relief action currently in place on imports of large residential washers and parts thereof.7 The purpose of this investigation is to determine whether the action taken by the President under section 203 of the Act with respect to LRWs, provided for in subheading 8450.20.00 of the Harmonized Tariff Schedule of the United States (“HTS”), continues to be necessary to prevent or remedy serious injury and whether there is evidence that the domestic industry is making a positive adjustment to import competition. The following tabulation provides information relating to the background and schedule of this proceeding.8 9
Effective date Action
August 3, 2020 Petition filed with the Commission; Institution of Commission’s investigation (85 FR 48724 August 12, 2020)
November 5, 2020 Commission’s hearing November 25, 2020 Commission’s vote December 8, 2020 Commission’s determination and report to the President
WTO proceedings
On May 14, 2018, Korea requested consultations with the United States concerning imposition of the safeguard measure on large residential washers pursuant to the World Trade Organization (“WTO”) dispute settlement understanding. On May 25, 2018, Thailand requested to join the consultations. Subsequently, the United States informed the Dispute Settlement Body (“DSB”) that it had accepted Thailand’s request to join the consultations. On August 14, 2018, Korea requested the establishment of a panel and at its meeting on September 26, 2018, the DSB established a panel.10 After the United States and Korea were unable to agree on panelists, the Director-General determined the composition of the panel on July 1, 2019, at
6 85 FR 5125, January 28, 2020. 7 85 FR 48724, August 12, 2020. 8 Pertinent Federal Register notices are referenced in appendix A, and may be found at the
Commission’s website (www.usitc.gov). 9 Appendix B contains a list of witnesses who participated in the hearing. 10 WTO, “DS546: United States—Safeguard measure on imports of large residential washers,”
October 16, 2018, retrieved March 7, 2019.

I-3
Korea’s request.11 Korea, the United States, and third parties have submitted their first written submissions to the Panel. Due to the COVID-19 pandemic, however, the Panel agreed with the parties to postpone the first panel meeting until such time as it can be held in person.12
Previous and related investigations
Antidumping and countervailing duty investigations on LRWs from Korea and Mexico On December 30, 2011, Whirlpool filed a petition alleging that an industry in the United States is materially injured and threatened with material injury by reason of imports from Korea and Mexico of large residential washers that are sold in the United States at less-than-fair-value (“LTFV”) and subsidized by the Government of Korea. On December 26 and 27, 2012, the Department of Commerce (“Commerce”) determined that imports of certain LRWs from Korea and Mexico, respectively, were being sold at LTFV and that countervailable subsidies were being provided to producers and exporters of LRWs from Korea.13 On February 8, 2013, the Commission determined that the domestic industry was materially injured by reason of imports of certain LRWs from Korea and Mexico sold at LTFV and subsidized by the
11 WTO, “WT/DS546/5: United States – Safeguard measure on imports of large residential washers,” July 2, 2019, retrieved July 16, 2019.
12 DS546 - Panel's Communication re Parties' Joint Response of 17 June 2020, dated June 19, 2020. 13 77 FR 75988, December 26, 2012; 77 FR 76288, December 27, 2012. Dumping margins ranged from
9.29 to 82.41 percent for imports from Korea and 36.52 to 72.41 percent for imports from Mexico. The subsidy rates ranged from 1.85 to 72.30 percent for imports from Korea.

I-4
Government of Korea.14 Effective February 15, 2013, Commerce issued antidumping and countervailing duty orders on those imports.15 16 On January 2, 2018, the Commission gave notice that it had instituted reviews on the antidumping and countervailing duties orders on LRWs from Korea and the antidumping duty orders on LRWs from Mexico.17 In April 24, 2019, the Commission completed full five-years review of the subject orders and determined that revocation of the antidumping and countervailing duty orders on large residential washers from Korea would not be likely to lead to continuation or recurrence of material injury to an industry in the United States within a reasonably foreseeable time, and that revocation of the antidumping duty order on large residential washers from Mexico would be likely to lead to continuation or recurrence of material injury to an industry in the United States within a reasonably foreseeable time.18 Effective February 15, 2019, Commerce revoked the antidumping and countervailing duty orders on LRWs from Korea, and effective May 6, 2019, Commerce issued a continuation of the antidumping duty order on imports of LRWs from Mexico.19
14 78 FR 10636, February 14, 2013. 15 The scope of the antidumping and countervailing duty orders on LRWs from Korea and Mexico is
broader than the scope of the safeguard measure on LRWs in that the orders covered three products specifically excluded from the safeguard measure: (1) top load LRWs with a permanent split capacitor motor, belt drive, and flat wrap spring clutch; (2) front load LRWs with a controlled induction motor and belt drive; and (3) front load LRWs with a cabinet width of more than 28.5 inches. Specifically, products covered by the orders are all large residential washers and certain subassemblies thereof. For purposes of the orders, the term ‘‘large residential washers’’ denotes all automatic clothes washing machines, regardless of the orientation of the rotational axis, except as noted below, with a cabinet width (measured from its widest point) of at least 24.5 inches (62.23 cm) and no more than 32.0 inches (81.28 cm).
Also covered in the scope of these orders are certain subassemblies used in large residential washers, namely: (1) all assembled cabinets designed for use in large residential washers which incorporate, at a minimum: (a) at least three of the six cabinet surfaces and (b) a bracket; (2) all assembled tubs designed for use in large residential washers which incorporate, at a minimum: (a) a tub and (b) a seal; (3) all assembled baskets designed for use in large residential washers which incorporate, at a minimum: (a) a side wrapper, (b) a base, and (c) a drive hub; and (4) any combination of the foregoing subassemblies.
Excluded from the scope are stacked washer-dryers and commercial washers. Also excluded from the scope are automatic clothes washing machines with a vertical rotational axis and a rated capacity of less than 3.70 cubic feet.
16 78 FR 11148, February 15, 2013; 78 FR 11154, February 15, 2013. 17 83 FR 145, January 2, 2018. 18 Large Residential Washers from Korea and Mexico (Inv. Nos. 701–TA–488 and 731–TA–1199–1200
(Review), USITC Publication 4882, April 2019 (“USITC Publication 4882”). 19 84 FR 19763, May 6, 2019.

I-5
There have been five administrative reviews regarding the antidumping duty order on LRWs from Korea, one administrative review regarding the countervailing duty order on LRWs from Korea, and five completed administrative reviews regarding the antidumping duty order on LRWs from Mexico.20 The results of the reviews are shown in tables I-1-I-3.
Table I-1 LRWs: Administrative reviews of the countervailing duty order on imports of LRWs from Korea
Date results published Period of review Producer or exporter Subsidy rate (percent)
September 15, 2015 80 FR 55336
6/5/2012-12/31/2013
Daewoo Electronics Corporation 81.91 Samsung Electronics Co., Ltd 34.77
Source: Cited Federal Register notices. Table I-2 LRWs: Administrative reviews of the antidumping duty order on imports of LRWs from Korea
Date results published Period of review Producer or exporter
Weighted average margin (percent)
September 12, 2017 82 FR 42788
2/1/2015-1/31/2016 LG Electronics, Inc. 0.00
September 12, 2016 81 FR 62715
2/1/2014-1/31/2015 LG Electronics, Inc. 1.62
September 15, 2015 80 FR 55595
8/3/2012- 1/31/2014
Daewoo Electronics Corporation 79.11 LG Electronics, Inc. 1.52 Samsung Electronics Co., Ltd 82.35
November 5, 2015 80 FR 685081
8/3/2012- 1/31/2014 LG Electronics, Inc. 1.38
January 31, 2018 83 FR 4467
2/1/2016- 1/31/2017 LG Electronics, Inc. 0.64
February 26, 2019 84 FR 6131
2/1/2017- 1/31/2018 LG Electronics, Inc. 0.0
1 Amended final results of the antidumping duty administrative review. Source: Cited Federal Register notices.
20 On May 2, 2019, Commerce initiated an administrative review of the antidumping duty order on large residential washers from Mexico, for one company, Electrolux Home Products Corp. N.V. and Electrolux Home Products de Mexico, S.A. de C.V. (“Electrolux”). On February 27, 2020, Commerce preliminarily determined that a weighted-average margin of 3.53 percent exists for Electrolux for the period February 1, 2018 through January 31, 2019. 85 FR 11338, February 27, 2020.

I-6
Table I-3 LRWs: Administrative reviews of the antidumping duty order on imports of LRWs from Mexico
Date results published Period of review Producer or exporter
Weighted average margin (percent)
September 15, 2015 80 FR 55335
8/3/2012-1/31/2014
Electrolux Home Products Corp. NV/Electrolux Home Products de Mexico, S.A. de C.V.(“Electrolux”) 6.45
November 5, 2015 80 FR 685101
8/3/2012-1/31/2014 Electrolux 6.22
September 12, 2016 81 FR 62714
2/1/2014-1/31/2015 Electrolux 2.47
July 12, 2017 82 FR 32169
2/1/2015- 1/31/2016 Electrolux 3.67
March 19, 2018 83 FR 119632
2/1/2016- 1/31/2017 Electrolux 72.41
October 1, 2019 84 FR 52063
2/1/2017- 1/31/2018 Electrolux 2.25
February 27, 2020 85 FR 11338,
2/1/2018-1/31/2019 Electrolux 3.533
1 Amended final results of the antidumping duty administrative review. 2 On April 18, 2018, Electrolux requested NAFTA binational panel review of Commerce’s final results of the fourth administrative review of the antidumping duty order on LRWs from Mexico. That panel review is currently pending. North American Free Trade Agreement (NAFTA), Article 1904 Binational Panel Review: Notice of Request for Panel Review, 83 FR 19221, May 2, 2018. 3 Preliminary result Source: Cited Federal Register notices.

I-7
Antidumping duty investigation on LRWs from China
On December 16, 2015, Whirlpool filed a petition alleging that an industry in the United States was materially injured and threatened with material injury by reason of LTFV imports of LRWs from China. Following notification of a final determination by Commerce that imports of LRWs from China were being sold at LTFV, the Commission determined on January 30, 2017, that a domestic industry was materially injured by reason of LTFV imports of LRWs from China.21 Commerce published an antidumping duty order on LRWs from China on February 6, 2017.22 23 Dumping margins are shown in Table I-4.24
21 82 FR 9223, February 3, 2017. 22 Commerce has not completed any administrative reviews of this order. 23 82 FR 9371, February 6, 2017. 24 The scope of the antidumping duty order on LRWs from China is identical to the scope of the
safeguard measure on LRWs. Products covered by this order are all large residential washers and certain subassemblies thereof. For purposes of this order, the term “large residential washers” denotes all automatic clothes washing machines, regardless of the orientation of the rotational axis, with a cabinet width (measured from its widest point) of at least 24.5 inches (62.23 cm) and no more than 32.0 inches (81.28 cm), except as noted below.
Also covered in the scope of this order are certain parts used in large residential washers, namely: (1) All cabinets, or portions thereof, designed for use in large residential washers; (2) all assembled tubs designed for use in large residential washers which incorporate, at a minimum: (a) a tub and (b) a seal; (3) all assembled baskets designed for use in large residential washers which incorporate, at a minimum: (a) a side wrapper; (b) a base, and (c) a drive hub; and (4) any combination of the foregoing parts or subassemblies.
Excluded from the scope are stacked washer-dryers and commercial washers. Also excluded from the scope are automatic clothes washing machines that meet all of the following
conditions: (1) Have a vertical rotational axis; (2) are top loading; and (3) have a drive train consisting, inter alia, of (a) a permanent split capacitor (“PSC”) motor, (b) a belt drive, and (c) a flat wrap spring clutch.
Also excluded from the scope are automatic clothes washing machines that meet all of the following conditions: (1) Have a horizontal rotational axis; (2) are front loading; and (3) have a drive train consisting, inter alia, of (a) a controlled induction motor (“CIM”), and (b) a belt drive.
Also excluded from the scope are automatic clothes washing machines that meet all of the following conditions: (1) Have a horizontal rotational axis; (2) are front loading; and (3) have cabinet width (measured from its widest point) of more than 28.5 inches (72.39 cm). 82 FR 9371, February 6, 2017.

I-8
Table I-4 LRWs: Commerce’s dumping margins for producers/exporters in China
Country Manufacturer/exporter Dumping margin (percent)
China LG Electronics/Nanjing LG-Panda Appliances 38.43
Samsung Electronics /Suzhou Samsung Electronics 57.37 All others 49.72
Source: 82 FR 9371, February 6, 2017. The Commission and Commerce are scheduled to conduct a five-year review of this order beginning in January 2022.
Antidumping and countervailing duty investigations on certain raw materials
In the second half of 2016, Commerce issued antidumping duty and countervailing duty orders on cold-rolled steel, such as that used in the production of LRWs. In total, these orders covered imports of cold-rolled steel from six countries.25 In 2017, Commerce issued antidumping and countervailing duty orders on stainless steel sheet and strip from China; this product is also used in the production of LRWs.26
25 On July 7, 2016, the Commission completed and filed its determinations that an industry in the United States is materially injured by reason of imports of cold-rolled steel flat products from China and Japan that have been found by Commerce to be sold in the United States at LTFV, and that have been found by Commerce to be subsidized by the government of China. https://www.usitc.gov/press_room/news_release/2016/er0622ll621.htm
On September 12, 2016, the Commission completed and filed its determinations that an industry is materially injured by reason of imports of cold-rolled steel flat products from Brazil, India, Korea, and the United Kingdom that have been found by Commerce to be sold in the United States at LTFV, and to be subsidized by the governments of Brazil and Korea. The Commission further determined that an industry in the United States is threatened with material injury by reason of imports of cold-rolled steel flat products that have been found by Commerce to be subsidized by the government of India. https://www.usitc.gov/press_room/news_release/2016/er0902ll649.htm
26 On March 24, 2017, the Commission completed and filed its determinations that an industry is materially injured by reason of imports of stainless steel sheet and strip from China that have been found by Commerce to be sold in the United States at LTFV, and to be subsidized by the government of China.
In addition, on September 20, 2017, the Commission determined that revocation of an existing countervailing duty order on imports of stainless steel sheet and strip from Korea and existing antidumping duty orders on imports of stainless steel sheet and strip from Japan, Korea, and Taiwan would be likely to lead to a continuation or recurrence of material injury to an industry in the United States within a reasonably foreseeable time; these orders remain in effect. https://www.usitc.gov/press_room/news_release/2017/er0303ll732.htm

I-9
Section 232 investigations (Commerce)27 Steel
The relevant HTS subheadings within the scope of this safeguard remedy, 8450.20.00, 8450.11.00, 8450.90.20, and 8450.90.60 were not included in the enumeration of certain steel products subject to the additional 25-percent ad valorem duties under Section 232 of the Trade Expansion Act of 1962, as amended.28 However, stainless steel sheet and cold-rolled steel, raw materials for producing LRWs, were included among the articles subject to the additional 25-percent ad valorem national-security duties.29 30 31 Table I-5 presents a summary of Section 232 tariffs on U.S. imports of steel, by country.
27 See Appendix E for additional details. 28 Adjusting Imports of Steel Into the United States, Presidential Proclamation 9705, March 8, 2018;
83 FR 11625, March 15, 2018. 29 Ibid. 30 See U.S. notes 16(a) and 16(b), subchapter III of chapter 99. HTS (2019) Revision 9, USITC
publication No. 4937, July 2019, pp. 99-III-5 – 99-III-7, 99-III-72 – 99-III-78. 31 LG Electronics stated that the Section 232 tariffs have not affected its ability to source steel, nor
have they affected its U.S. LRW operations. LG reported that it ***. Large Residential Washers: Monitoring Developments in the Domestic Industry, Inv. No. TA-204-013, August 2019. Confidential Report, p. I-8.

I-10
Table I-5a Steel mill articles: Section 232 tariffs summary
Country Effective date Ad valorem duty rate Absolute quotas
Argentina May 31, 2018 Exempt 180,000 metric tons Australia May 31, 2018 Exempt Exempt Brazil May 31, 2018 Exempt 4,193,157 metric tons Canada May 20, 2019 Exempt Exempt European Union May 31, 2018 25% N/A Korea April 30, 2018 Exempt 2,631,012 metric tons Mexico May 20, 2019 Exempt Exempt Turkey May 21, 2019 25% N/A All other countries March 8, 2018 25% N/A
Table I-5b Aluminum products: Section 232 tariffs summary
Country Effective date Ad valorem duty rate Absolute quotas
Argentina May 31, 2018 Exempt 180,939 metric tons Australia May 31, 2018 Exempt Exempt Canada August 16, 2020 10%t N/A Mexico May 20, 2019 Exempt Exempt All other countries March 8, 2018 10% N/A
Source: U.S. Customs and Border Patrol websites: https://www.cbp.gov/trade/programs-administration/entry-summary/232-tariffs-aluminum-and-steel, https://www.cbp.gov/trade/quota/bulletins/qb-20-602-2020-2qtr-absolute-quota-steel-mill-articles-argentina-brazil-and-south-korea, https://www.cbp.gov/trade/quota/bulletins/qb-20-703-2020-aluminum-absolute-quota-3rd-quarter-argentina-0, accessed October 6, 2020.

I-11
Aluminum
The relevant HTS subheadings within the scope of this safeguard remedy, 8450.20.00, 8450.11.00, 8450.90.20, and 8450.90.60, were not included in the enumeration of such aluminum products that are subject to the additional 10-percent ad valorem national-security duties under Section 232 of the Trade Expansion Act of 1962, as amended.32 However, aluminum castings, a raw material for producing parts of LRWs, such as transmissions, were included among the articles subject to the additional duties.33 34 35
Section 301 proceeding36
Large residential washers imported from China provided for in HTS subheadings 8450.11.00, 8450.20.00, 8450.90.20, and 8450.90.60, are not subject to Section 301 duties.37 However, certain LRW components imported from China are subject to additional ad valorem duties under Section 301 of the Trade Act of 1974.38 All five U.S. producers source a variety of LRW components that are subject to the Section 301 measures.39
32 Presidential Proclamation 9704 of March 8, 2018; 83 FR 11619, December 19, 2018. 33 Ibid. 34 See U.S. notes 19(a), 19(b), 19(c), 19(d), and 19(e), subchapter III of chapter 99. HTS (2019)
Revision 9, USITC publication No. 4937, July 2019, pp. 99-III-12 – 99-III-13, 99-III-79 – 99-III-80. 35 LG Electronics stated that it ***. LG reported that it submitted an exclusion request for this special
aluminum on January 17, 2019, and received approval for such request on June 5, 2019. LG’s one-year exclusion is for alloyed aluminum ingots with a magnesium (Mg) content of 2.6-3.0%; a silicon (Si) content of 9.9-10.5%; a zinc (Zn) content of 0.5% or less; and a copper (Cu) content of 0.15% or less, by weight. This product is imported under HTS 7601.20.9090. Large Residential Washers: Monitoring Developments in the Domestic Industry, Inv. No. TA-204-013, August 2019. Confidential Report, p. I-10.
36 See Appendix E for additional details. 37 83 FR 40823, August 16, 2018. 38 Notice of Modification of Section 301 Action: China’s Acts, Policies, and Practices Related to
Technology Transfer, Intellectual Property, and Innovation, Office of the United States Trade Representative, https://ustr.gov/sites/default/files/enforcement/301Investigations/Notice_of_Modification-January_2020.pdf, retrieved October 4, 2020.
39 For further details see Part VII – Factors affecting prices.

I-12
Global developments40
In 2012 and 2013, LG and Samsung shifted LRW production for the U.S. market from Korea to China. Samsung also moved LRW production from Mexico to China. As a result, China became the largest global supplier of LRWs during 2014-16. More recently, LG and Samsung shifted LRW production from China to Thailand and Vietnam.41 Table I-6 presents the largest global export sources of washing machines during 2017-19. In 2017, China was the leading global exporter of washing machines, followed by Vietnam and Thailand. Exports from these countries to the United States began to decline following the issuance of antidumping duty orders on LRWs from Korea and Mexico and the countervailing duty order on LRWs from Korea in 2013 and the issuance of an antidumping order on LRWs from China in 2017.
40 See Part VI for additional details. 41 Samsung has stated that its factories in Mexico and Korea produced washers for not only the U.S.
market but also other countries. Each factory has kept most its facilities and continues to use them to produce washers for other markets, as well as other laundry products. Samsung reported that the equipment in those factories was largely retained, and that Samsung reviews the efficiency of its global operations. Samsung also states that moving equipment is unusual, and would be much more difficult for the types of metal presses and injection molding equipment installed at its new plant in Newberry, South Carolina. Monitoring Publication, p. I-9.

I-13
Table I-6 Household- or laundry-type washing machines, with a dry linen capacity exceeding 10 Kg: Global exports by major sources, 2017-19
Exporter Calendar year
2017 2018 2019 Value (1,000 dollars) United States 331,102 328,096 343,858 China 539,501 596,765 738,176 Vietnam 735,929 493,483 498,299 Thailand 435,734 392,758 425,229 Korea 545,742 380,016 342,237 Mexico 393,144 312,174 158,393 Czech Republic 99,393 107,873 96,225 Germany 82,861 77,996 76,098 Sweden 63,587 84,259 71,300 Spain 61,763 67,775 60,654 Italy 28,393 29,073 60,447 Poland 13,507 11,964 44,439 All other exporters 147,632 161,437 153,651
All reporting exporters 3,478,286 3,043,669 3,069,004 Share of value (percent) United States 9.5 10.8 11.2 China 15.5 19.6 24.1 Vietnam 21.2 16.2 16.2 Thailand 12.5 12.9 13.9 Korea 15.7 12.5 11.2 Mexico 11.3 10.3 5.2 Czech Republic 2.9 3.5 3.1 Germany 2.4 2.6 2.5 Sweden 1.8 2.8 2.3 Spain 1.8 2.2 2.0 Italy 0.8 1.0 2.0 Poland 0.4 0.4 1.4 All other exporters 4.2 5.3 5.0
All reporting exporters 100.0 100.0 100.0 Note.--Data are likely overstated and include non-covered products (commercial washers and stacked washer-dryers). Note.--Shares and ratios shown as "0.0" represent values greater than zero, but less than "0.05" percent. Source: Official exports statistics under HS subheading 8450.20 reported by various national statistical authorities in the Global Trade Atlas database, accessed September 28, 2020 and official global imports statistics from Vietnam under HS subheading 8450.20 as reported by Vietnam Industry and Trade Information Center in the Global Trade Atlas database, accessed September 28, 2020.

I-14
U.S. developments
A timeline of key developments in the United States pertinent to this proceeding is presented below (Figure I-1). For additional details regarding industry events in the United States, see Part III of this report.
Figure I-1 LRWs: U.S. developments
Source: Compiled from various cited sources.
2016•June
•GE Appliances announced the completion of the sale of its appliance division to Haier for $5.6 billion.
2017•February
•Commerce issued antidumping duty order on LRWs from China.
•LG announced it would build a $250 million home appliance production facility in Clarksville, TN, with LRW production beginning in 2019.
•June•U.S. International
Trade Commission instituted a Section 201 safeguard investigation on global imports of LRWs.
•Samsung announced it would open a $380 million home apliance manufcturing plant in Newberry, SC.
2018•January
•Samsung began production of LRWs in Newberry, SC.
•January and February•President of the
United States issued Presidential Proclamation implementing the safeguard measure, a tariff-rate quota for three years and one day on imports of washers and certain washer parts.
•October•LG began U.S.
production of LRWs in Clarksville, TN.
2019•April 30
•USITC voted on full five-year (sunset) reviews on LRWs from Korea and Mexico. In accordance with the Commission's determinations, Commerce issued a continuation of the antidumping duty order on LRWs from Mexico and revocations of the antidumping and countervailing duty orders on LRWs from Korea.
2020•January
•President of the United States issued a Presidential Proclamation modifying the tariff rate quota applicable to imports of washers by allocating the within-quota quantities for the third year on a quarterly basis.

I-15
Summary data
A summary of data collected in this proceeding is presented in appendix C, table C-1. Table C-1 also separately presents select data for (i) continuously operating U.S. producers (Alliance, GE Appliances, and Whirlpool) and (ii) new entrants (LG and Samsung). Except as noted, U.S. industry data are based on the questionnaire responses of five U.S. producers of washers that are believed to have accounted for virtually all domestic production of LRWs in 2019. U.S. import data and related information are based on the questionnaire responses of five U.S. importers of LRWs that are believed to have accounted for virtually all U.S. imports of LRWs.
U.S. market participants
U.S. producers
The Commission issued U.S. producers’ questionnaires to six firms, all of which provided the Commission with information on their LRW operations. 42 These firms are believed to account for virtually all U.S. production of LRWs in 2019. Table I-7 lists U.S. producers of LRWs, their positions on the extension, production locations, and share of total U.S. production of LRWs in 2019.43
42 Staber Industries, Inc. stated that it produced and shipped *** LRWs in 2018, *** in 2019, and *** in 2020 through September. Email from ***, June 28, 2020.
43 ***, counsel to GE subsequently stated that GE supports extension of the safeguard measure. Hearing transcript, p. 63, (Magnus).

I-16
Table I-7 LRWs: U.S. producers, positions on the extension, U.S. production locations, and shares of 2019 reported U.S. production
Firm
Position on extension of safeguard
Production location(s)
Share of production (percent)
Alliance *** Ripon, WI Manitowoc, WI ***
GE Appliances *** Louisville, KY *** LG *** Clarksville, TN *** Samsung *** Newberry, SC *** Whirlpool *** Clyde, Ohio ***
Continuous manufactures *** New entrants *** Total ***
Source: Compiled from data submitted in response to Commission questionnaires.
U.S. producers’ ownership and related or affiliated firms
The Commission asked U.S. producers to identify their owners and any related or affiliated firms involved in the production or importation of LRWs and their responses are presented in table I-8. As shown,***. In addition, as discussed in greater detail in Part III, two U.S. producers (***) directly imported the covered merchandise, and *** imported residential washers (***) not covered by the safeguard measure.

I-17
Table I-8 LRWs: U.S. producers' ownership, related and/or affiliated firms
Item / Firm Firm Name Affiliated/Ownership Ownership: *** *** *** *** *** *** *** *** *** *** *** *** Related importers/exporters: *** *** *** *** *** ***
*** *** *** *** ***
*** *** *** ***
Related producers: *** *** *** *** *** ***
*** *** *** *** *** ***
*** *** *** *** *** *** *** *** *** *** *** *** ***
*** *** *** *** *** *** *** *** ***
Source: Compiled from data submitted in response to Commission questionnaires.

I-18
U.S. importers
The Commission issued U.S. importers’ questionnaires to 16 firms believed to be importers of LRWs, including all U.S. producers of LRWs. Usable questionnaire responses were received from six firms, representing virtually all U.S. imports of LRWs.44 Tables I-9 and I-10 list the responding U.S. importers of LRWs, their locations, and their shares of U.S. imports in 2019.45
Table I-9 LRWs: U.S. importers, sources of imports of LRWs, U.S. headquarters, and shares of imports in 2019
Firm
Headquarters Share of imports by source (percent)
China Korea Mexico Thailand Vietnam
All other sources
All import
sources Electrolux Charlotte, NC *** *** *** *** *** *** *** GE Appliances Louisville, KY *** *** *** *** *** *** *** LG Alabama Huntsville, AL *** *** *** *** *** *** ***
LG USA Englewood Cliffs, NJ *** *** *** *** *** *** ***
Midea America Corp Parsippany, NJ *** *** *** *** *** *** ***
Samsung Ridgefield Park, NJ *** *** *** *** *** *** ***
Total *** *** *** *** *** *** *** Note.--Shares and ratios shown as "0.0" represent values greater than zero, but less than "0.05" percent. Source: Compiled from data submitted in response to Commission questionnaires.
44 Five firms (***) certified that they did not import LRWs from any source at any time since January 1, 2017.
45 ***.

I-19
Table I-10 LRWs: U.S. importers, their headquarters, and share of total imports by product type, 2019
Firm Headquarters
Share of select other residential washers by product (percent)
Share of covered imports
plus non-covered
residential washers (percent)
Top load PSC/belt/clutch
washers
Front load
CIM/belt washers
Extra wide
washers Electrolux Charlotte, NC *** *** *** *** GE Appliances Louisville, KY *** *** *** *** LG Alabama Huntsville, AL *** *** *** *** LG USA Englewood Cliffs, NJ *** *** *** *** Midea America Corp Parsippany, NJ *** *** *** *** Samsung Ridgefield Park, NJ *** *** *** ***
Total *** *** *** *** Note.--Shares and ratios shown as "0.0" represent values greater than zero, but less than "0.05" percent. Source: Compiled from data submitted in response to Commission questionnaires.
U.S. purchasers
The Commission received 12 usable questionnaire responses from firms that had purchased LRWs during January 2017-June 2020.46 In general, responding U.S. purchasers were located across the United States and included retailers with locations throughout the country.
The product
Scope of the safeguard remedy
The President’s remedy covers the following merchandise:47
(a) automatic clothes washing machines, regardless of the orientation of the rotational axis, each with a cabinet width (measured from its widest point) of at least 62.23 cm and no more than 81.28 cm; (b) all cabinets, or portions thereof, designed for use in washers, and all assembled baskets designed for use in washers that incorporate, at a minimum, a side wrapper, a base, and a drive hub; (c) all assembled tubs designed for use in washers that incorporate, at a minimum, a tub and a seal;
46 The following firms provided purchaser questionnaire responses: ***. 47 83 FR 3553, January 25, 2018.

I-20
(d) any combination of the foregoing parts or subassemblies. Specifically excluded from the scope are (A) all stacked washer-dryers and all commercial washers:
(i) The term "stacked washer-dryers" denotes distinct washing and drying machines that are built on a unitary frame and share a common console that controls both the washer and the dryer. (ii) The term "commercial washer" denotes an automatic clothes washing machine designed for the "pay per use" segment meeting either of the following two definitions: (aa) (I) it contains payment system electronics;
(II) it is configured with an externally mounted steel frame at least 15.24 cm high that is designed to house a coin/token operated payment system (whether or not the actual coin/token operated payment system is installed at the time of importation); (III) it contains a push button user interface with a maximum of six manually selectable wash cycle settings, with no ability of the end user to otherwise modify water temperature, water level or spin speed for a selected wash cycle setting; and (IV) the console containing the user interface is made of steel and is assembled with security fasteners; or
(bb) (I) it contains payment system electronics; (II) the payment system electronics are enabled (whether or not the payment acceptance device has been installed at the time of importation) such that, in normal operation, the unit cannot begin a wash cycle without first receiving a signal from a bona fide payment acceptance device such as an electronic credit card reader; (III) it contains a push button user interface with a maximum of six manually selectable wash cycle settings, with no ability of the end user to otherwise modify water temperature, water level or spin speed for a selected wash cycle setting; and (IV) the console containing the user interface is made of steel and is assembled with security fasteners.
(B) automatic clothes washing machines that meet all of the following conditions:
(i) they have a vertical rotational axis, (ii) they are top loading; and (iii) they have a drive train consisting, inter alia, of (aa) a permanent split capacitor motor, (bb) a belt drive and (cc) a flat wrap spring clutch.
(C) automatic clothes washing machines that meet all of the following conditions:

I-21
(i) they have a horizontal rotational axis; (ii) they are front loading; and (iii) they have a drive train consisting, inter alia, of (aa) a controlled induction motor and (bb) a belt drive.
(D) automatic clothes washing machines that meet all of the following conditions:
(i) they have a horizontal rotational axis; (ii) they are front loading; and (iii) they have cabinet width (measured from its widest point) of more than 72.39 cm.
Tariff-rate quota under the safeguard measure
In Presidential Proclamation 9694 of January 23, 2018, the President imposed a safeguard measure in the form of a tariff-rate quota (“TRQ”) on imports of LRWs for a period of three years and one day, beginning February 7, 2018.48 Imports of LRWs and covered parts from Canada are excluded from the measure. Imports of LRWs and covered parts from WTO Member developing countries are also excluded from the measure, as long as imports from a developing country do not exceed 3 percent of total imports and imports from all developing countries with an import share of less than 3 percent do not collectively exceed 9 percent of total imports. No individual country allocations were established for the in-quota quantity under the TRQ. The in-quota amount is reset on an annual basis. Under the safeguard measure, imports of LRWs in excess of 1.2 million units annually were to be subject to an additional tariff of 50 percent in the first year, 45 percent in the second year, and 40 percent in the third year, with an in-quota tariff of 20 percent in the first year, 18 percent in the second year, and 16 percent in the third year.49 With respect to covered parts, imports in excess of 50,000 units were to be subject to an additional tariff of 50 percent in the first year, imports in excess of 70,000 units were to be subject to a tariff of 45 percent in the second year, and imports in excess of 90,000 units were to be subject to a tariff of 40 percent in the third year, while no additional duty would apply to goods within the in-quota quantity.50
48 83 FR 3553, January 25, 2018. 49 Ibid. 50 Ibid. Covered parts include (1) all cabinets or portions thereof; (2) all assembled tubs,
incorporating at a minimum a tub and a seal; (3) all assembled baskets incorporating at a minimum a side wrapper, a base, and a drive hub, and (4) any combination of the foregoing parts or subassemblies. Ibid.

I-22
Subsequently, in Presidential Proclamation 9979 of January 23, 2020, the President modified the TRQ for the third quota year by allocating, on a quarterly basis, within-quota quantities of 300,000 washers per quarter, beginning February 7, 2020.51 52 Table I-11 presents the safeguard measures on LRWs and covered parts.
Table I-11 LRWs: Safeguard measures on LRWs and covered parts
Item February 7, 2018 - February 6, 2019
February 7, 2019 - February 6, 2020
February 7, 2020 - February 7, 2021
Duty on first 1.2 million units of imported finished washers (percent) 20.0 18.0 16.0 Duty on all subsequent imports of finished washers (percent) 50.0 45.0 40.0
Duty covered parts (percent) 50.0 45.0 40.0 Covered parts excluded from duty (units) 50,000 70,000 90,000
Note.— Beginning February 7, 2020, the third quota year is allocated on a quarterly basis, with within-quota quantities of 300,000 washers per quarter. Source: 83 FR 3553, January 25, 2018; 85 FR 5125, January 28, 2020.
Tariff treatment
Based on the scope of the safeguard measure, information available to the Commission indicates that the merchandise subject to this proceeding is provided for in the Harmonized Tariff Schedule of the United States (“HTS”) subheading 8450.20.00 and is imported under statistical reporting numbers 8450.20.0040 and 8450.20.0080, while specified parts of LRWs are provided for in subheadings 8450.90.20 or 8450.90.60. The general duty rate for subheading 8450.20.00 is 1.0 percent ad valorem. The general duty rate for subheading 8450.11.00 is 1.4 percent ad valorem. Parts and subassemblies covered by the scope of the orders are classified under HTS subheading 8450.90.20, which provides for tubs and tub assemblies, and HTS subheading 8450.90.60, which provides for other parts. Both 8450.90.20
51 To Further Facilitate Positive Adjustment to Competition From Imports of Large Residential Washers, 85 FR 5125, January 28, 2020.
52 The quarterly TRQ for the third quota year (February 7, 2020 – February 7, 2021) allocates the 1.2 million units as follows: 300,000 units from February 7, 2020 – May 6, 2020; 300,000 units from May 7, 2020 – August 6, 2020; 300,000 units from August 7, 2020 – November 6, 2020; 300,000 units from November 7, 2020 – February 6, 2021. 85 FR 5125, January 28, 2020.

I-23
and 9450.90.60 have a general duty rate of 2.6 percent ad valorem.53 Decisions on the tariff classification and treatment of imported goods are within the authority of U.S. Customs and Border Protection.
Table I-12 LRWs: Summary of duties
Measure Detail AD China The dumping margins are shown in table I-4.
AD/CVD Korea (Administrative
Reviews)
Orders revoked. The results of the administrative reviews are shown in tables I-1 and I-2.
AD Mexico (Administrative
Reviews) The results of the administrative reviews are shown in table I-3.
Section 232 - Steel
HTS subheadings within the safeguard remedy, 8450.20.00, 8450.11.00, 8450.90.20, and 8450.90.60 were not included in the enumeration of iron and steel provisions that are subject to the additional 25-percent ad valorem duties under Section 232 of the Trade Expansion Act of 1962, as amended. However, stainless steel sheet and cold-rolled steel, raw materials for producing LRWs, were included among the articles subject to the additional 25-percent ad valorem duties.
Section 232 - Aluminum
HTS subheadings within the safeguard remedy, 8450.20.00, 8450.11.00, 8450.90.20, and 8450.90.60 were not included in the enumeration of aluminum provisions that are subject to the additional 10-percent ad valorem duties under Section 232 of the Trade Expansion Act of 1962, as amended. However, aluminum castings, a raw material for producing certain LRWs parts, such as the transmission, was included among the articles subject to the additional 10-percent ad valorem duties.
Section 301
Products from China provided for in HTS subheadings 8450.11.00, 8450.20.00, 8450.90.20, and 8450.90.60 are not subject to any additional ad valorem duties under Section 301 of the Trade Act of 1974. However, certain inputs into LRWs are subject to these duties.
The like or directly competitive product
To determine whether an article is being imported into the United States in such increased quantities as to be a substantial cause of serious injury or the threat thereof, the Commission first defines “the domestic industry producing an article like or directly competitive with the imported article.”54 When assessing what constitutes the product(s) that is/are like or directly competitive with the imported article(s), the Commission takes into
53 Harmonized Tariff Schedule of the United States (2020, Revision 21). Eligible goods imported under U.S. free trade agreements or the Caribbean Basin Economic Recovery Act (“CBERA”), or from most beneficiary developing countries under the Generalized System of Preferences (“GSP”) program, may receive duty-free entry. Ecuador and/or Thailand are excluded from GSP eligibility under certain applicable HTS subheadings.
54 19 U.S.C. § 2252(b)(1)(A).

I-24
account such factors as (1) the physical properties of the article, (2) its customs treatment, (3) its manufacturing process (i.e., where and how it is made), (4) its uses, and (5) the marketing channels through which the product is sold. In its safeguard determination, the Commission found that domestically produced LRWs, top load PSC/belt/clutch washers, front load CIM/belt washers, and covered parts are like the imported LRWs and covered parts within the scope of the investigation. Accordingly, the Commission defined the like or directly competitive domestic product as all domestically produced LRWs, top load PSC/belt/clutch washers, front load CIM/belt washers, and covered parts.55
Description and applications56
LRWs are home appliances that remove soil from fabric, using water and detergent as the principal cleaning agents. All units feature wash, rinse, and spin cycles; have a cabinet width of at least 24.5 inches (62.23 cm) and no more than 32.0 inches (81.28 cm); and feature a rotational axis that is either vertical or horizontal. All LRWs feature a metal drum or basket into which laundry is loaded, a plastic tub that holds water, a motor, a pump, and a user interface and control unit to set wash cycles. Single-family households are the principal consumers of LRWs.
Configurations of LRWs in the U.S. market
In the U.S. market, LRWs are currently typically produced and sold in two configurations, either with a vertical axis, generally referred to as “top load” LRWs, or with a horizontal axis, generally referred to as “front load” LRWs. The primary distinctions between these configurations of LRWs are based on the location of the loading door, the orientation of the axis, and the cleaning mechanics. Both configurations can be equipped with various features, for instance, water heaters, different washing cycles, steam cleaning capabilities, and cabinet finishing. A general description of these LRW configurations follows.
Top load LRWs
A top load LRW features a top loading door for loading clothes and contains a basket that spins on a vertical axis (see figure I-2). Top load LRWs come equipped with a broad array of product features and are sold at a wide range of price points. In order to further facilitate
55 Large Residential Washers, Inv. No. TA-201-076, USITC Publication 4745, December 2017, p. 17 (“Original Safeguard Publication”).
56 Unless otherwise noted, this section is from the Monitoring Publication.

I-25
cleaning motion, an agitator or impeller is placed in the center of the basket. The difference between these two cleaning technologies is explained further below.
Figure I-2 LRWs: Top load washers
Source: Whirlpool. The washer on the left is more likely to contain an “agitator” as its means of moving clothes, water, and detergent around the basket whereas the washer on the right is more likely to contain an “impeller.”
Cleaning technology: agitator vs. impeller
A top load LRW contains either an agitator or an impeller, both of which facilitate the cleaning movement of clothes, water, and detergent inside the basket of the machine. Figure I-3 presents an example of an agitator and an impeller.
I \

I-26
Figure I-3: LRWs: An example of an agitator and an impeller
Source: Whirlpool. An agitator (left). An impeller (right).
Agitator
An agitator is a center post that projects from the bottom of the wash basket and is equipped with fins or vanes that create a washing action by rotating back and forth. When a top load LRW with an agitator is set to clean a load of clothes, it first fills its tub with water and then creates the back and forth washing motion through the use of its agitator. The force of the agitator and its motion tend to treat fabrics more harshly than LRWs with impellers, because the agitator often twists and tangles clothes. LRWs with agitators tend to use more water and result in more energy being used to clean and dry a load than LRWs with impellers. Specifically, the agitator needs more water to operate effectively and generally spins clothes more slowly during the spin cycle, requiring longer use of a dryer and thus resulting in higher overall energy consumption. Because of the higher water and electricity consumption used by LRWs with an agitator, they are less likely to meet energy standards for “high-efficiency” or meet the Energy Star standard, although some agitator-based LRWs have qualified for Energy Star certification. LRWs with an agitator generally occupy the “value” segment of the market at lower price points. In anticipation of the more stringent energy efficiency standards that took effect on March 7, 2015, discussed below, Whirlpool redesigned its agitator-based top load LRWs to utilize shallow fill technology and HE agitators (or “agi-pellers”), which combine aspects of agitators and impellers.
Impeller
An impeller is a somewhat flat, rotating hub which does not contain a center post. It creates washing motion by rotating and creating currents in the water. Due to the lack of a center post, impellers occupy less space in the basket; consequently, top load LRWs with impellers generally have higher capacities than agitator-based LRWs.
, , •. I
I .,. . ~. \ •l • .'\ ·
t~'
..__ ... .......
.· . _ . ·. ·. : :_·.:·. . . _ ■ • • • • •
. . . . .. ·> :.· . '
'
I-27
During the cleaning cycle of a top load LRW with an impeller, the tub fills only partly with water. Because so little water is used in the tub, a special detergent designated “HE” must be used. The HE detergent is formulated to create fewer suds, thereby minimizing the water necessary to rinse. Top load LRWs with an impeller also spin at higher speeds than top load LRWs with an agitator, thereby extracting more water before clothes go into the dryer, and thus reducing overall energy consumption. Because of the lower water and electricity consumption, many LRWs with an impeller qualified as “high efficiency” and were Energy Star certified under the energy efficiency standards prior to March 7, 2015. Even after the more stringent energy efficiency standards became effective on January 1, 2018, and February 5, 2018, these LRWs are more likely to meet high efficiency energy standards or meet the Energy Star standard, although not all models meet these standards.
Front load LRWs
Front load LRWs feature a front loading door for loading clothes and a drum that spins on a horizontal axis. (see figure I-4). Front load LRWs are typically positioned at the premium end of the LRW market in terms of price and performance. They often come equipped with a broad variety of product features. The drums of front load LRWs fill only partly with water and clean clothes through a process of lifting them to the top of the tub and dropping them into the water by a “baffle” and using the centrifugal force of the spinning drum. Front load LRWs generally consume the least amount of water during the wash cycle and feature the fastest spinning speeds of all types of LRWs. Very fast spin cycles mean better moisture extraction compared even with top load LRWs with an impeller, thereby reducing drying time and overall energy consumption. Because of the lower water and electricity consumption, all front load LRWs qualified as “high efficiency” and were Energy Star certified under the energy efficiency standards before and after January 1, 2018, and February 5, 2018. Generally, front load LRWs work most effectively with low-foaming, HE detergent. Most front load LRW load capacities are roughly equivalent to top load LRWs with an impeller but tend to have higher load capacities than top load LRWs with an agitator. Although front load LRWs were known to develop mold and odors, causing some consumers to prefer top load washing machines, such problems have now been largely addressed by the industry.

I-28
Figure I-4 LRWs: Front load washer
Source: Lowe’s.
Product features57
Product features have become increasingly prevalent in the LRW marketplace, and are seen by many manufacturers as a means of maintaining competitiveness. These features can include energy efficiency, capacity, appearance (color, cabinet finishing, decorative elements, etc.), and new innovations such as noise reduction and steam cleaning. A number of the features of LRWs are explained below.
Energy efficiency
Consumers may prefer energy efficiency as a factor in buying LRWs. Energy efficiency standards for LRWs are promulgated by three entities: (1) the Consortium for Energy Efficiency (“CEE”),58 (2) the U.S. Environmental Protection Agency (“EPA”), and (3) the U.S. Department of Energy (“DOE”). All of these entities establish standards for identifying energy efficient LRWs based largely on two factors: (1) energy utilization and (2) water consumption of the washer.
57 Unless otherwise noted, this section is from the Monitoring Publication. 58 The CEE is a nonprofit agency that encourages greater adoption of energy-efficient products and
services through the development of various initiatives. According to the CEE web site, members include utility companies, environmental groups, research organizations, and state energy offices in the United States and Canada. The agency also solicits input from manufacturers and both the U.S. Department of Energy and the Environmental Protection Agency. http://www.cee1.org/content/about, retrieved October 6, 2020.
I-29
More specifically, energy utilization is calculated using the “integrated modified energy factor” (“IMEF”), which represents the number of cubic feet of laundry that can be washed with one kilowatt-hour of electricity taking into consideration the total energy consumption of the entire laundry cycle, which includes both washing and drying. The higher the IMEF number, the more laundry may be washed and dried with the same one kilowatt-hour of energy, and the higher the energy efficiency of the washer. Water consumption is calculated using the “integrated water factor” (“IWF”), which is defined as the gallons of water needed to wash each cubic foot of laundry.59 The lower the IWF number, the less water is used to clean each cubic foot of laundry, and the higher the water efficiency of the washer. Based on the relative IMEF and IWF measures, the CEE categorizes LRWs into tiers of energy efficiency, with the third and advanced tiers reserved for the most energy efficient washers. Also using IMEF and IWF measures, the EPA and the DOE assign the “Energy Star” classification to LRWs. In general, the EPA and DOE revise Energy Star standards periodically based on several factors, including changes to the Federal minimum efficiency standards,60 technological advances which generate greater energy efficiencies, and product availability.61 Additionally, the EPA may revise these standards when the market share for Energy Star rated LRWs reach or exceed 50 percent for a particular category of LRW.62 Major changes in U.S. energy efficiency standards for residential washers occurred in January 2011, March 2015, and January and February 2018. As shown in table I-9, the newer efficiency standards require large
59 Prior to March 2015, CEE and Energy Star standards were calculated using the “modified energy factor” (“MEF”), which represents the number of cubic feet of laundry that can be washed with one kilowatt-hour of electricity and the “water factor” (“WF”)—the gallons of water needed to wash each cubic foot of laundry. Consortium for Energy Efficiency, Inc.,“Super Efficient Home Appliance Initiative - January 2017,” January 2017, https://library.cee1.org/content/cee-super-efficient-home-appliance-initiative-january-2017/, retrieved October 6, 2020.
60 Pursuant to the Energy Policy and Conservation Act of 1975, the U.S. Department of Energy (“DOE”) sets minimum energy efficiency standards for approximately 50 categories of appliances and equipment used in homes, businesses, and other applications, including LRWs. https://energy.gov/eere/buildings/appliance-and-equipment-standards-program, October 6, 2020. See U.S. Department of Energy, Energy Efficiency & Renewable Energy, Saving Energy and Money with Appliance and Equipment Standards in the United States, fact sheet, January 2017,
https://energy.gov/eere/buildings/downloads/appliance-and-equipment-standards-fact-sheet for fact sheet at
https://energy.gov/sites/prod/files/2017/01/f34/Appliance%20and%20Equipment%20Standards%20Fact%20Sheet-011917_0.pdf, retrieved October 6, 2020.
61 https://energy.gov/eere/buildings/energy-star, retrieved October 6, 2020. 62 Ibid.

I-30
increases in the efficiency of top load LRWs to decrease the volume of water that can be used in the LRW wash and rinse cycles and to increase energy efficiency.
Table I-13 LRWs: Energy efficiency standards
Standard
Efficiency levels January 1, 2018 and
February 5, 20181
Efficiency levels March 7, 20152
Efficiency levels January 1, 2011 to
March 6, 20153 IMEF IWF IMEF IWF MEF WF
Federal minimum— Top load
1.57
6.5 1.29 8.4 1.26 9.5
Front load (4) (4) 1.84 4.7 1.26 9.5 Energy Star— Top load
2.06 4.3 2.06 4.3 2.0 6.0
Front load 2.76 3.2 2.38 3.7 2.0 6.0 CEE Tier 1 2.76 3.2 2.38 3.7 2.0 6.0 CEE Tier 2 2.92 3.2 2.74 3.2 2.2 4.5 CEE Tier 3 (5) (5) 2.92 3.2 2.4 4.0 CEE Advanced Tier 3.10 3.0 (5) (5) (5) (5) 1 Federal energy efficiency minimums for residential clothes washers compliance dates began on January 1, 2018, and Energy Star standards and CEE standards on February 5, 2018. 2 Federal energy efficiency minimums for residential clothes washers, ENERGY STAR, and CEE standards compliance dates began March 7, 2015. 3 Federal energy efficiency minimums, Energy Star standards, and CEE ratings compliance dates began effective January 1, 2011. 4 Not applicable. 5 Not published. Source: U.S. Department of Energy, Consortium for Energy Efficiency, Super Efficient Home Initiative, Energy Conservation Program: Energy Conservation Standards for Residential Clothes Washers, 77 F.R. 59719, October 1, 2012; Monitoring Publication.
Capacity
Capacity refers to the volume of clothes an LRW can wash per load. Capacity is among the most sought after features for consumers, especially for large households. Capacity ranges for different types of LRWs vary. For example, top load LRWs with an agitator feature the lowest capacity and range from 2.5-3.9 cubic feet (“cf.”), while the capacity of front load LRWs and top load LRWs with an impeller range from 3.3-4.3 cf. and 3.5-6.2 cf., respectively. The DOE requires manufacturers to certify and declare the capacity of their LRWs at the time of sale. Producers of LRWs endeavor to increase the capacity of their LRWs offerings. In 2014, Samsung began producing a 5.6 cf. LRW. Maytag/Whirlpool and Kenmore currently have the

I-31
largest capacity LRW on the market at 6.2 cf.63 LG has the second-largest capacity LRW on the market at 5.8 cf, followed by Samsung at 5.6 cf.64 65
Appearance
The appearance of LRWs can vary greatly. Color, cabinet finish, and decorative elements are examples of LRW features that may differ. LRWs are available in a variety of colors, but white appears on many models. For example, in October 2020, Lowe’s online shopping website that includes search filters listed 64 washers in white, 14 in a stainless look, 7 in black stainless steel, 7 in slate, 6 in black, and fewer washers available in red and bronze.66 The Home Depot’s online shopping Internet website listed 102 residential washers (front load and top load) in white; 23 washers in stainless finishes (including 18 in black stainless, 4 in stainless steel, and one stainless look); 15 washers in gray; 4 washers in slate; and fewer than 3 washers each in black, champagne, chrome, metallic carbon, and silver.67
Manufacturing processes68 Development of product platforms
Generally, the manufacture of LRWs begins with the design and production of a LRW “platform.” A platform is the basic frame from which multiple models are built with a variety of features. In Large Residential Washers from China, all producers of LRWs (Whirlpool, GE, LG, and Samsung) reported using “platforms” to develop product models.69 Samsung and LG view platforms as encompassing a broad engineering design that may be developed around a research and design project. A platform would have certain parameters for items such as drive systems, size, and design structure. Thus, models produced within a platform may have a particular width, such as 28 inches, but different features.
63 Maytag website, https://www.maytag.com/blog/washers-and-dryers/large-capacity-washing-machines.html?trackid=1431608645, retrieved October 6, 2020. Kenmore website, https://www.kenmore.com/products/laundry/washers/, retrieved October 6, 2020.
64 LG website, https://www.lg.com/us/front-load-washers, retrieved October 6, 2020. 65 Samsung website, https://www.samsung.com/us/home-appliances/washers/all-
washers/?capacity=%3E+5.0+cu.+ft., retrieved October 6, 2020. 66 Lowe’s, “Washing Machines,” https://www.lowes.com/pl/Washing-machines-Washers-dryers-
Appliances/4294857977, retrieved October 6, 2020. 67 The Home Depot, https://www.homedepot.com/b/Appliances-Washers-Dryers-Washing-
Machines/N-5yc1vZc3ov, retrieved October 6, 2020. 68 Unless otherwise noted, this section is from the Monitoring Publication. 69 Large Residential Washers from China, Inv. No. 731-TA-1306 (Final), USITC Publication 4666,
January 2017.

I-32
Whirlpool and GE stated that a platform is expected to last for an extended period of time, such as 10 to 20 years or longer. A platform may be upgraded during its lifecycle. Samsung stated, and LG agreed, that a platform likely will have a lifecycle of 5 to 30 years, but may be upgraded every 2 to 5 years. LRW manufacturers may have several platforms in operation at a given time. For example, Whirlpool has two to four platforms for its top load LRWs and one to two platforms for its front load LRWs. New platforms will overlap with the lifecycle of older platforms.
Development of product models and “stock keeping units” (“SKUs”)
A “model” is an LRW defined by various features or functionality. In Large Residential Washers from China, Whirlpool, GE, LG, and Samsung agreed that a particular LRW model will typically have a lifecycle of 1-3 years.70 Whirlpool, GE, LG, and Samsung also noted that terms “model” and “SKU” are generally synonymous. Whirlpool noted, however, that a model might have more than one SKU because that model is produced in more than one location or in different colors.
Production process Whirlpool
Whirlpool produces all the LRWs that it sells in the United States in its Clyde, Ohio, manufacturing plant, which covers 2.4 million square feet. Whirlpool produces all LRWs using the same manufacturing technology and processes. LRWs are produced through several distinct manufacturing processes that involve a wide variety of materials, which may be purchased in large quantities as cut, shaped, or painted pieces, or as component systems (figure I-5). The components for each module originate within five areas in Whirlpool’s production plant, including materials receiving, cabinet assembly, fabrication support, plastics forming, and machining.
70 Large Residential Washers from China, Inv. No. 731-TA-1306 (Final), USITC Publication 4666, January 2017, p. I-19.
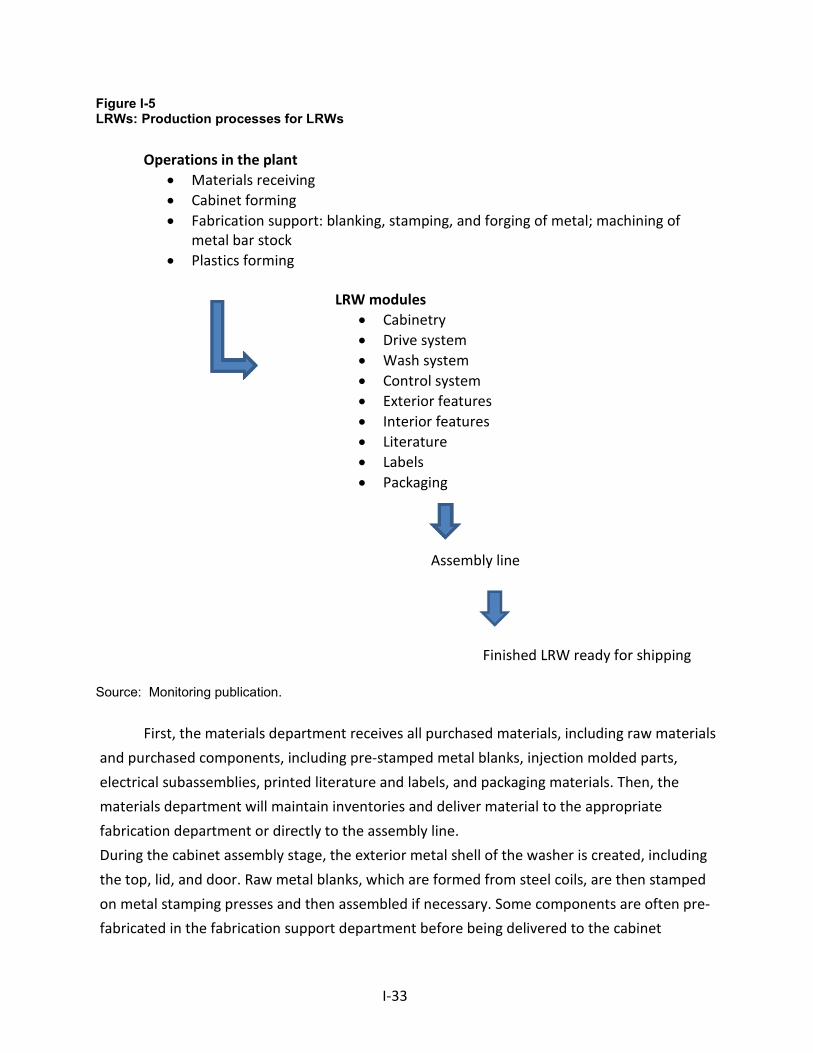
I-33
Figure I-5 LRWs: Production processes for LRWs
Operations in the plant • Materials receiving • Cabinet forming • Fabrication support: blanking, stamping, and forging of metal; machining of
metal bar stock • Plastics forming
LRW modules
• Cabinetry • Drive system • Wash system • Control system • Exterior features • Interior features • Literature • Labels • Packaging
Assembly line
Finished LRW ready for shipping
Source: Monitoring publication.
First, the materials department receives all purchased materials, including raw materials and purchased components, including pre-stamped metal blanks, injection molded parts, electrical subassemblies, printed literature and labels, and packaging materials. Then, the materials department will maintain inventories and deliver material to the appropriate fabrication department or directly to the assembly line. During the cabinet assembly stage, the exterior metal shell of the washer is created, including the top, lid, and door. Raw metal blanks, which are formed from steel coils, are then stamped on metal stamping presses and then assembled if necessary. Some components are often pre-fabricated in the fabrication support department before being delivered to the cabinet
L

I-34
assemblers. Cabinets and lids are then fabricated and processed through the paint department. Completed, painted cabinets and lids are then delivered to the final assembly lines. Washer doors are typically purchased as an assembly and delivered to the assembly line to be attached to the cabinet. Next, the fabrication support department processes raw materials such as steel bar stock and coil sheet steel. Purchased steel bar stock is formed and machined into components of the wash systems and drive. Cold-rolled sheet steel is cut to the appropriate size, stamped, and formed using custom dies designed by the petitioner. The formed parts are cleaned and painted as necessary. Such fabricated steel components are used in the cabinet, drive and the wash unit assembly. The plastics forming department processes raw plastic pellets or granules primarily into the plastic tubs used for the wash unit modules. The granules are melted and then injected into plastic molding equipment. The equipment uses molds to obtain the required geometry. Once the tubs are created through this process, they are delivered to the final assembly departments. The wash system module consists of a basket (drum) and plastic tube joined together. This combines products from the fabrication and the plastics forming operations. The shell of the basket is made of steel that is stamped to shape and welded together. The fabrication of the basket is automated. The metal shell of the basket is fastened to the tube and shell to form the wash module. LRW modules are designed in-house by Whirlpool and then produced by specialty producers. These include the drive system, LRW controls, literature, and labels. The drive system components, which include the motor, transmission, seals, metal, and plastic housings, are designed and sized by Whirlpool engineers. These components are purchased from specialized producers and then combined in other departments. The controls as well as interior and exterior feature components are designed by Whirlpool engineers and then supplied by specialty manufacturers. The company owns the dies for all feature components. Whirlpool also designs its own electronics hardware and software and then contracts with global suppliers for the production of electronic devices and assemblies. Whirlpool produces cabinets, basket drums, and tubs at the Clyde facility. Whirlpool purchases electrical components, electronics, motors, and harnesses from third party suppliers. Whirlpool sources its electronics from Mexico and Asia and sources its motors from the United States, Mexico, and overseas. Whirlpool stated that *** percent of its LRW

I-35
components are sourced from the United States and that Whirlpool’s Clyde facility is a Foreign Trade Zone.71 The final assembly consists of integrating the purchased parts and the self-produced subassemblies on an assembly line. All components are presented to the assembly line, including the cabinet, wash unit, drive, control systems, interior and exterior features, literature, labels, and packaging. All these components are assembled in a defined order to construct the finished washer. The final product undergoes testing and inspection and is visually inspected for fit and finish. The finished and inspected product is then transferred to the packaging area where labels are applied, literature is included, and the washer is packaged. Before the unit is automatically shrink-wrapped or packaged in a corrugated box, an external protective packaging is applied manually to the unit. The packaged unit is then shipped to a distribution center.
Samsung
Samsung began commercial production of LRWs at its Newberry, South Carolina facility in January 2018. This facility has over 1.5 million square feet. Samsung’s Newberry operations are ***.72 Samsung ***. ***. Samsung has a variety of equipment that is used during the production of both its top loading and front loading LRWs, ***. According to Samsung, ***. Samsung uses ***.
71 Monitoring Publication, p. I-27. 72 Large Residential Washers: Monitoring Developments in the Domestic Industry, Inv. No. TA-204-
013, August 2019. Confidential Report, p. I-28.

I-36
The front load washer has a *** while the top load washer has a ***. The backs of the LRW tubs produced in Newberry are ***.
LG
LG announced its decision to build its U.S. washing machine factory in February 2017. Construction of the million-square-foot facility in Clarksville, Tennessee, began in August 2017. Initial production began in October 2018, and LG ***.73 The main factory building is approximately 1 million square feet with 4 additional support buildings for security, utilities, EPS, and hazardous materials storage and recycling. LG currently has two main assembly and sub assembly lines for its top load and front load washers. It also has four parts production departments: press, injection, paint, and EPS. Its press department includes ***. The press department produces *** different parts and has an automated quick die change-out, which typically takes about ***. LG’s plastic injection department includes ***. LG’s main assembly line includes ***. LG notes that its main assembly line is operated using an intelligent manufacturing system, which is the highest level of systems integration and automation of any LG LRW facility, all of which is controlled from an integrated control center. LG’s EPS department includes *** EPS machines that produce in-house packaging material. LG’s operations in Clarksville employ approximately 550-600 employees.74
73 Ibid, p. I-29. 74 Monitoring Publication, p. I-29.

II-1
Part II: Conditions of competition in the U.S. market
U.S. market characteristics
Four firms account for the vast majority of U.S. supply of LRWs: GE Appliances, LG, Samsung, and Whirlpool. LG and Samsung primarily imported LRWs during 2017, but in 2018 and 2019, the majority of their shipments were domestically produced. LRWs are sold mostly to retailers. Suppliers of LRWs compete on the basis of price, as well as discounts and flooring space at retailers.1 Apparent U.S. consumption of LRWs decreased during January 2017-June 2020. Overall, apparent U.S. consumption in 2019 was *** percent lower than in 2017.
In this proceeding, most U.S. producers and importers reported that there had not been significant changes in the product range, product mix, or marketing of LRWs since February 7, 2018 and that they did not anticipate future changes. *** reported that the safeguard measures restricted its supply of imported LRWs, thereby limiting its ability to offer a full range of LRW products, and also reported that in 2019, it updated its LRW models to better suit ***.
Channels of distribution
U.S. producers sold mainly to retailers (table II-1). Importers of LRWs from Korea, Thailand, and Vietnam also sold mainly to retailers, while importers of LRWs from China sold slightly over half of their imports to retailers with almost all of the remainder to distributors. One importer, ***, reported *** imported LRWs from Mexico, all of which were shipped to ***.
1 Original Safeguard Publication, p. V-1.
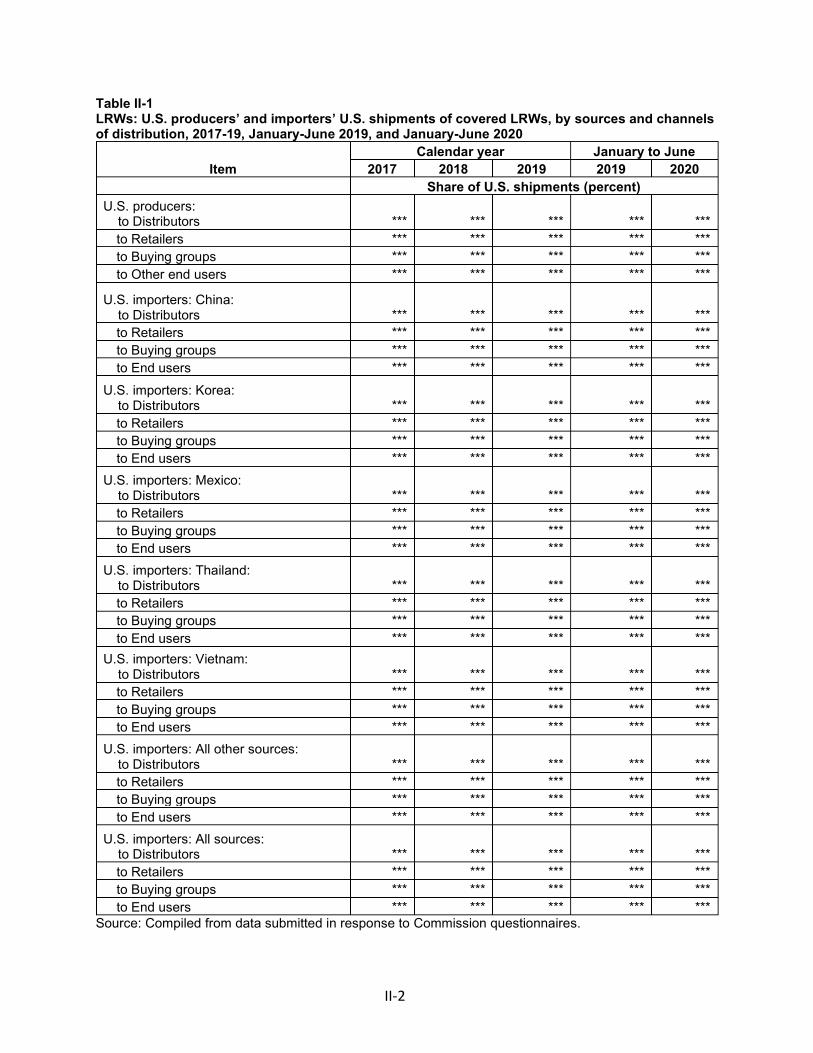
II-2
Table II-1 LRWs: U.S. producers’ and importers’ U.S. shipments of covered LRWs, by sources and channels of distribution, 2017-19, January-June 2019, and January-June 2020
Item Calendar year January to June
2017 2018 2019 2019 2020 Share of U.S. shipments (percent) U.S. producers: to Distributors *** *** *** *** ***
to Retailers *** *** *** *** *** to Buying groups *** *** *** *** *** to Other end users *** *** *** *** ***
U.S. importers: China: to Distributors *** *** *** *** ***
to Retailers *** *** *** *** *** to Buying groups *** *** *** *** *** to End users *** *** *** *** ***
U.S. importers: Korea: to Distributors *** *** *** *** ***
to Retailers *** *** *** *** *** to Buying groups *** *** *** *** *** to End users *** *** *** *** ***
U.S. importers: Mexico: to Distributors *** *** *** *** ***
to Retailers *** *** *** *** *** to Buying groups *** *** *** *** *** to End users *** *** *** *** ***
U.S. importers: Thailand: to Distributors *** *** *** *** ***
to Retailers *** *** *** *** *** to Buying groups *** *** *** *** *** to End users *** *** *** *** ***
U.S. importers: Vietnam: to Distributors *** *** *** *** ***
to Retailers *** *** *** *** *** to Buying groups *** *** *** *** *** to End users *** *** *** *** ***
U.S. importers: All other sources: to Distributors *** *** *** *** ***
to Retailers *** *** *** *** *** to Buying groups *** *** *** *** *** to End users *** *** *** *** ***
U.S. importers: All sources: to Distributors *** *** *** *** ***
to Retailers *** *** *** *** *** to Buying groups *** *** *** *** *** to End users *** *** *** *** ***
Source: Compiled from data submitted in response to Commission questionnaires.

II-3
Geographic distribution
U.S. producers and importers reported selling LRWs to all regions in the United States during the safeguard investigation.2 U.S. producers and importers reported during the monitoring proceeding that there had not been any changes in the U.S. geographical market areas in which LRWs were sold since February 7, 2018.3
Supply and demand considerations
Changes in U.S. supply
Table II-2 summarizes supply information for U.S. and foreign producers of LRWs. Table II-2 LRWs: Supply factors that affect the ability to increase shipments to the U.S. market
Item
Capacity (units)
Capacity utilization (percent)
Inventories as a ratio to
total shipments (percent)
Shipments by market in 2019
(percent)
Able to shift to
alternate products
2017 2019 2017 2019 2017 2019
Home market
shipments
Exports to non-
U.S. markets
No. of firms
reporting “yes”
United States *** *** *** *** *** *** *** *** *** China *** *** *** *** *** *** *** *** *** Korea *** *** *** *** *** *** *** *** *** Mexico *** *** *** *** *** *** *** *** *** Thailand *** *** *** *** *** *** *** *** *** Vietnam *** *** *** *** *** *** *** *** *** All other sources *** *** *** *** *** *** *** *** *** All foreign sources 10,857,033 9,463,585 75.1 64.0 2.6 6.3 *** *** 13 of 16
Note: Responding U.S. producers accounted for virtually all of U.S. production of LRWs in 2019. Responding foreign producer/exporter firms accounted for more than 75 percent of U.S. imports of LRWs from Korea, and virtually all imports from Thailand and Vietnam during 2019. There were no imports from China or Mexico in 2019. For additional data on the number of responding firms and their share of U.S. production and of U.S. imports from each subject country, please refer to Part I, “U.S. market participants” and Part VI. Source: Compiled from data submitted in response to Commission questionnaires.
2 Original Safeguard Investigation, p. V-2. 3 Monitoring Publication, p. II-9. Geographic shipment information was not collected from firms
during the extension investigation.

II-4
Domestic production
Based on available information, U.S. producers of LRWs have the ability to respond to changes in demand with moderately large changes in the quantity of shipments of U.S.-produced LRWs to the U.S. market. The main contributing factor to this degree of responsiveness of supply is substantial unused capacity. Factors mitigating responsiveness of supply include limited inventories, limited ability to shift shipments from alternate markets, and limited ability to shift production to or from alternate products.
U.S. producers’ capacity utilization decreased as capacity increases outpaced production increases from 2017 to 2019. Reported major export markets are Canada, Asia, and Europe. Most U.S. producers reported that they cannot produce other products on the same equipment as LRWs, although *** reported that *** on the same equipment. Factors affecting U.S. producers’ ability to shift production include the investment of time and money and specialized equipment. *** stated that some employees may be capable of shifting to a different production line, but the products produced on those lines are not easily shifted.
Four of five U.S. producers and all purchasers reported that the availability of U.S.-produced LRWs in the U.S. market had changed since February 7, 2018, as did two of four responding importers. Firms reported that availability of domestically produced LRWs increased due to LG and Samsung’s new production facilities but also noted that shutdowns related to COVID-19 disrupted the supply chain for both domestically produced and imported LRWs. U.S. producer and importer *** reported that the pandemic increased U.S. demand for LRWs and that as a result, the producer added shifts and increased its production.
Imports
Based on available information, producers of LRWs from outside the United States have the ability to respond to changes in demand with large changes in the quantity of shipments of LRWs to the U.S. market. The main contributing factors to this degree of responsiveness of supply are the availability of substantial unused capacity and a demonstrated ability to increase capacity quickly, along with substantial non-U.S. export markets.
As shown in table II-2, Korean, Mexican, Thai, and Vietnamese producers reported levels of capacity utilization at or above the level of U.S. producers in 2019, while Chinese producers reported capacity utilization that was lower. Foreign industries in every country but Thailand and Vietnam possessed ***. Foreign producers generally reported

II-5
substantial export shipments to countries other than the United States, but very low inventories as a share of shipments.
Two of three responding U.S. producers, 2 of 3 importers, and 9 of 12 purchasers reported that the availability of imports had changed since February 7, 2018, citing the safeguard measures that restricted imports and supply chain disruptions related to the COVID-19 pandemic.4
Supply constraints
Two of five U.S. producers reported that they had refused, declined, or been unable to supply LRWs since February 7, 2018. The remaining producer (***) reported that while it had not declined to supply LRWs, it increased its lead times during Q2 2020 due to COVID-19-related shutdowns, and *** reported similar constraints. Similarly, *** reported that while it had *** to meet demand, its ability to meet all U.S. demand for LRWs is inhibited by the safeguard measures and that its ***.
Most purchasers (10 of 12) reported that they had been declined supply since February 7, 2018. Purchaser *** cited Whirlpool, GE, and Frigidaire specifically, but other purchasers (***) reported that almost every supplier has had difficulty making timely shipments or fulfilling orders. Purchasers (***) specifically noted that the supply of LRWs was not sufficient to match demand during the COVID-19 pandemic, and *** reported that there have been availability issues across all brands, imported or domestically produced, due to the pandemic.
Petitioner and respondents reported that COVID-19 presented temporary production and supply chain challenges during the first half of 2020.5
Changes in U.S. demand
During the safeguard investigation, the Commission found that about two‐thirds of demand for LRWs is driven by consumers needing to replace existing washers at the end of
4 *** reported that effects from COVID-19 were minimal for imported LRWs. 5 Petitioner prehearing brief, p. 12; Respondent LG prehearing brief, pp. 30, 50, 83, 90; Hearing
transcript, p. 113 (Levy).

II-6
their functional lives, known as “replacement demand,”6 with the balance driven by home sales, renovations, and new construction. Most responding domestic producers, importers, and purchasers reported that U.S. demand for LRWs increased during January 2012-June 2017, due to improved U.S. economic performance, increased activity in the housing market, and the satisfaction of pent-up replacement demand from the last recession.7 Respondents argued that that a “softness” in the replacement market was expected for 2018 and 2019.8
The U.S. housing market has fluctuated since 2017, showing some declines over 2018 and early 2019 followed by a sharp increase in late 2019. During 2020, there was a sharp decrease in early 2020, but housing starts rose again to nearly late 2019 levels by August. Overall, U.S. housing starts increased by 17.3 percent from January 2017 to September 2020 (figure II-1).
Figure II-1 U.S. housing starts: New privately owned housing units started, monthly, seasonally adjusted annual rate, January 2017-September 2020
Source: U.S. Census Bureau, http://www.census.gov/construction/nrc/historical_data/index.html, retrieved November 12, 2020.
6 Petitioner stated that LRWs are replaced approximately every eight to ten years and estimated that approximately 60 to 70 percent of overall demand is for LRW replacement. Hearing transcript, p. 95 (Liotine).
7 Original Safeguard Publication, p. 23. 8 Hearing transcript, p. 262 (Klett).
0
200
400
600
800
1,000
1,200
1,400
1,600
1,800
2017 2018 2019 2020
Num
ber o
f uni
ts (t
hous
ands
)
II-7
Demand trends
Firms were asked how demand within the United States and outside of the United States had changed since February 7, 2018. Three of five U.S. producers and two of four importers reported that there had been a decrease in U.S. demand while all responding purchasers reported that U.S. demand had increased (table II-3).9 Three U.S. producers and two importers reported that demand outside of the United States had fluctuated and purchasers’ responses were mixed. U.S. producer/importer *** and purchaser *** both indicated that the COVID-19 pandemic led to increased demand for LRWs in the United States. Petitioner and respondents also stated that the COVID-19 pandemic led to strong demand due to “nesting” and home improvements while people are spending more time at home.10
Firms were also asked how they expected demand within and outside of the United States to change in the future. Two of five U.S. producers (***) anticipate fluctuating demand, *** anticipates an increase in demand, and *** anticipates a decrease in demand for LRWs to follow a general decrease in economic health. Most purchasers anticipate an increase in demand for LRWs in the future.
9 Petitioner stated that demand for LRWs declined during the first half of 2020, because its customers that are major retailers, such as Best Buy, PC Richards, and Bray and Scharff were closed temporarily due to COVID-19 shutdowns. Hearing transcript, p. 96 (Liotine) and Petitioner’s posthearing brief, pp. II-16-17.
10 Respondent LG prehearing brief, p. 84; Respondent Samsung prehearing brief, pp. 4, 47; Whirlpool Q3 Earnings Call Corrected Transcript (Oct. 22, 2020), p. 10; Respondent LG posthearing brief, p.14.
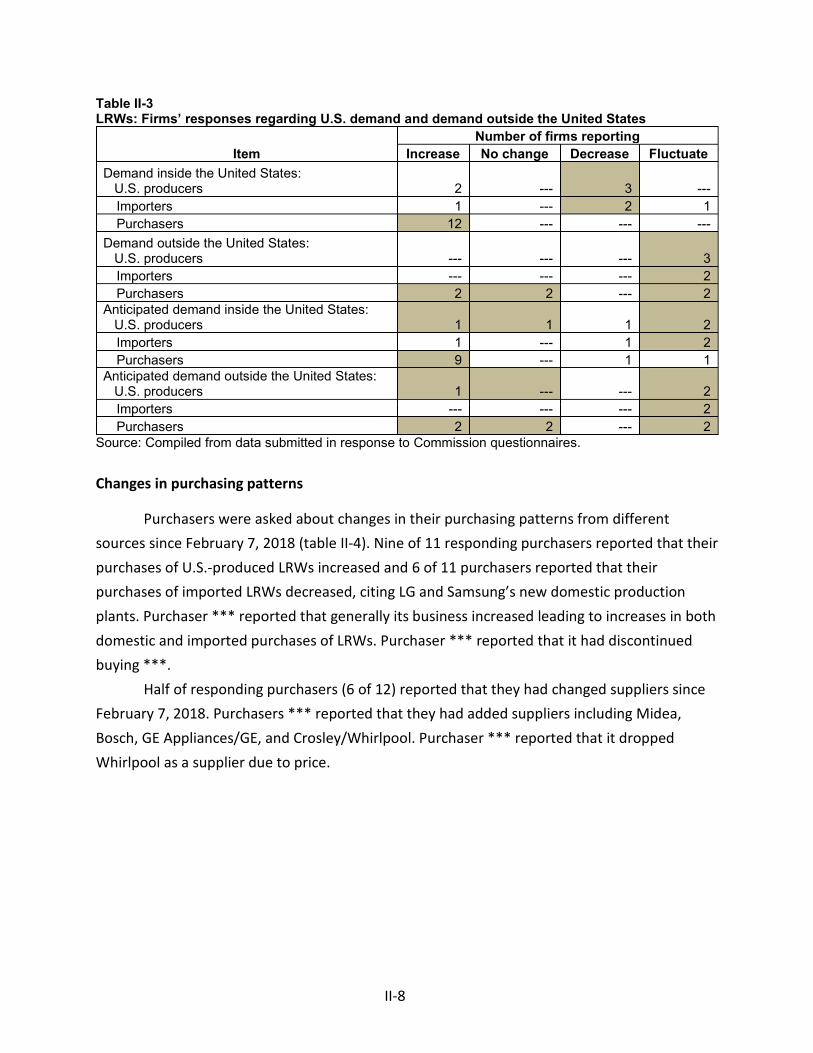
II-8
Table II-3 LRWs: Firms’ responses regarding U.S. demand and demand outside the United States
Item Number of firms reporting
Increase No change Decrease Fluctuate Demand inside the United States: U.S. producers 2 --- 3 ---
Importers 1 --- 2 1 Purchasers 12 --- --- ---
Demand outside the United States: U.S. producers --- --- --- 3
Importers --- --- --- 2 Purchasers 2 2 --- 2
Anticipated demand inside the United States: U.S. producers 1 1 1 2
Importers 1 --- 1 2 Purchasers 9 --- 1 1
Anticipated demand outside the United States: U.S. producers 1 --- --- 2
Importers --- --- --- 2 Purchasers 2 2 --- 2
Source: Compiled from data submitted in response to Commission questionnaires.
Changes in purchasing patterns
Purchasers were asked about changes in their purchasing patterns from different sources since February 7, 2018 (table II-4). Nine of 11 responding purchasers reported that their purchases of U.S.-produced LRWs increased and 6 of 11 purchasers reported that their purchases of imported LRWs decreased, citing LG and Samsung’s new domestic production plants. Purchaser *** reported that generally its business increased leading to increases in both domestic and imported purchases of LRWs. Purchaser *** reported that it had discontinued buying ***.
Half of responding purchasers (6 of 12) reported that they had changed suppliers since February 7, 2018. Purchasers *** reported that they had added suppliers including Midea, Bosch, GE Appliances/GE, and Crosley/Whirlpool. Purchaser *** reported that it dropped Whirlpool as a supplier due to price.

II-9
Table II-4 LRWs: Changes in purchase patterns of U.S. and imported LRWs
Source of purchases Did not
purchase Decreased Increased Constant Fluctuated United States --- --- 9 1 1 All import sources --- 6 1 1 3 Sources unknown 4 --- 1 1 2
Source: Compiled from data submitted in response to Commission questionnaires. Firms were asked if there had been any changes in the business cycles or conditions of
competition for LRWs since February 7, 2018. Three U.S. producers reported that there had been changes: *** reported that increasing raw material costs and safeguard measures have raised prices and that incumbent domestic suppliers have benefited; *** reported that demand for LRWs decreased after the implementation of the safeguard measures and as a result of the COVID-19 pandemic. *** reported that there had been changes resulting from the COVID-19 pandemic, although the impact was felt differently by LRW suppliers.11 Eight purchasers reported that there had been changes since February 7, 2018, citing increases in demand and supply chain issues due to COVID-19 resulting in shortages. *** reported that Sears store closures directed more business in its direction and *** reported that COVID-19-related closures of retailers shifted more business towards ***. Purchasers *** and *** reported that there are fewer promotions connected to LRW sales.
Purchasers were asked to describe the significance of the tariff rate quota imposed by the President on February 7, 2018, in terms of its effect on their purchasing operations for LRWs. Five purchasers (***) reported that the increased costs were passed on to customers, with *** stating that “it has driven the price of laundry through the roof and has put a burden on people in low income brackets.” Three purchasers (***) reported that shortages resulted from the safeguard measures, but that LG and Samsung’s new U.S. production plants alleviated those shortages until the COVID-19 pandemic. Two purchasers (*** reported that it shifted its purchases to more U.S.-produced LRWs.
Purchasers were also asked if domestic producers took certain actions to make a positive adjustment to import competition since February 7, 2018. Eleven of 12 purchasers
11 Importer *** questionnaire Attachment.

II-10
reported that domestic producers had introduced new or innovative products; eight purchasers reported that domestic producers had improved product quality and expanded their marketing efforts, including e-commerce; and six purchasers reported that domestic producers had made other efforts to positively adjust to imports, including the opening of LG and Samsung’s new production plants. Most responding purchasers, eight of 12, reported that U.S. producers had not made improvements to customer service.

III-1
Part III: U.S. producers’ production, shipments, and employment
In the safeguard investigation of LRWs, the Commission defined the domestic industry as all domestic producers of LRWs, PSC/belt drive top load washers, CIM/belt drive front load washers, and covered parts, consistent with its definition of the like or directly competitive domestic product.1 The information in this section of the report was compiled from responses to the Commission’s domestic producers’ questionnaire by five firms, which accounted for virtually all U.S. production of washers during 2019. The list of responding domestic producers, each company’s position on the safeguard measures, production locations, and share of reported production of LRWs during 2019 is presented in Part I of this report at table I-7.
U.S. producers’ profiles
Alliance2 Alliance is a privately held corporation that was founded in 1908 and is headquartered
in Ripon, Wisconsin. The company has manufacturing facilities in the United States, China, and the Czech Republic. The company produces washers and dryers for coin-operated laundries, multi-housing laundries, and also residential washers. Alliance manufactures products under the brands Speed Queen, Huebsch, IPSO, Primus, and UniMac. It produces and markets its residential washers under the Speed Queen brand name. Alliance reported ***, and an acquisition of Primus Company. In June 2015, Alliance announced that it had obtained $400 million in financing to assist in growing the company in both North America and Europe. In June 2015, Alliance undertook a $46 million expansion, including installation of a 1,500 ton transfer press for its Speed Queen residential washing machines. In May 2016, Alliance announced a
1 Large Residential Washers, Inv. No. TA-201-076, USITC Publication 4745, December 2017, p. 27. In the safeguard investigation, the Commission found that domestically produced LRWs, PSC/belt drive top load washers, CIM/belt drive front load washers, and covered parts were like the imported LRWs and covered parts within the scope of the investigation. See id., pp. 13-25. Accordingly, the Commission defined the like or directly competitive domestic product as all domestically produced LRWs, PSC/belt drive top load washers, CIM/belt drive front load washers, and covered parts. Id., p. 25. The term “domestic industry” is defined in section 202(c)(6)(A)(i) of the Trade Act, 19 U.S.C. § 2252(c)(6)(A)(i), as “the domestic producers as a whole of the like or directly competitive article or those producers whose collective production of the like or directly competitive article constitutes a major proportion of the total domestic production of such article.”
2 Unless otherwise noted, information is from USITC Publication 4882.

III-2
$62.6 million expansion of its manufacturing campus, adding 225,000 square feet for a new North America sales and marketing headquarters and the conversion of an existing warehouse into a manufacturing facility. In March 2018, Alliance also announced an investment of approximately $50 million to build a new manufacturing plant in Thailand, with construction to begin in April 2018 and production to begin in early 2019.3 In August 2019, Alliance purchased an existing 330,000 square foot plant in Manitowoc, Wisconsin and planned to invest $30 million in the facility to produce washing machine parts for its Ripon facility beginning in September 2019.4
General Electric5 GE Appliances was a division of General Electric (“GE”) until June 2016, when GE
Appliances was sold to the Chinese company Qingdao Haier Co., Ltd. (“Haier”). In 2010, GE Appliances initiated a $150 million investment at its Louisville, Kentucky
facility (“Appliance Park”) to produce top load and front load LRWs in the United States. In 2012, GE Appliances began producing a broader range of top load LRWs at Appliance Park, where it had previously produced only top load LRWs with a capacity of under 3.7 cubic feet. In 2013, GE Appliances began production of front load LRWs at Appliance Park.
GE has been in the process of a multi-year restructuring where the company has sought to focus on its core industrial businesses and thereby reduce the number of its consumer and financial business segments. As part of this restructuring, in September 2014, GE announced that it was selling its appliances division to AB Electrolux of Stockholm, Sweden. The U.S. Department of Justice filed to stop the merger in July 2015, arguing that it would lead to less competition and higher prices for buyers of appliances. On December 7, 2015, GE announced that it had terminated its agreement to sell its appliances division to Electrolux and would now pursue other options to sell the division. On January 15, 2016, GE announced that it had entered into a definitive agreement to sell its appliances division to Haier. On June 6, 2016, GE announced that it had completed the sale of its appliances division, GE Appliances, to Haier for $5.6 billion. The deal included the stake of 48.4 percent that GE Appliances owns in Mabe, a
3 “Inauguration of our new factory in Thailand,” Alliance Laundry Systems, May 20, 2019. https://alliancelaundry.com/inauguration-de-notre-nouvelle-usine-en-thailande/. (accessed October 9, 2020). “Alliance Laundry Systems Thailand Plant Construction,” Alliance Laundry Systems, July 24, 2019. https://www.youtube.com/watch?v=tKMJuBueN_Y. (accessed October 9, 2020).
4 “Alliance Laundry Systems Purchases Former Manitowoc Crane Facility,” PRNewswire, August 6, 2019. https://www.prnewswire.com/news-releases/alliance-laundry-systems-purchases-former-manitowoc-crane-facility-300896691.html (accessed October 14, 2020).
5 Unless otherwise noted, information is from USITC Publication 4882.
III-3
Mexican appliances company that manufacturers washers. In October 2018, Haier announced that it would invest $200 million to expand GE Appliance’s washer and dishwasher operations in Appliance Park. Thus, GE Appliances is currently a wholly owned subsidiary of Haier. The Haier Group is a large multinational manufacturer and distributor of electronics and home appliances headquartered in Qingdao, China. In 2017, Haier announced that it would expand its washer production in China by building a plant in Hefei, the capital of East China’s Anhui province, which has the ability to produce three million units annually. In 2019, Haier opened a plant in Naberezhnye Chelny, Russia, with capacity to produce 500,000 units of “small” residential washers annually.
LG Electronics6 LG Electronics, Inc. is headquartered in Seoul, Korea and operates four business units:
(1) home entertainment, (2) mobile communications, (3) home appliances and air solutions, and (4) vehicle components. LG produces an array of products such as washing machines, flat panel televisions, mobile cellular devices, air conditioners, and refrigerators. The firm employs 75,000 employees worldwide and has reported global sales of $47.9 billion in 2016.
Since 2012, LG has produced LRWs within its home appliances and air solutions business unit in Korea and at its affiliates in China, Thailand, and Vietnam. The company began exports of LRWs from Thailand and Vietnam in ***.
In February 2017, LG announced that it would open a U.S. production plant for LRWs in Clarksville, Tennessee. LG reported that it began production of subject LRWs at its Tennessee factory in late 2018. Initial production began in October 2018, with plans to be ***. Although LG ***, LG produced *** units in 2019 and *** units in January-June 2020. In August 2020, LG announced that the Tennessee plant had produced 1 million washing machines to date.
Samsung7 Samsung Electronics, Inc. is headquartered in Gyeonggi-do, Korea and operates nine
business units: (1) visual display, (2) digital appliances, (3) printing solutions, (4) health and medical equipment, (5) mobile communications, (6) network businesses, (7) memory, (8) system LSI, and (9) LED business. It produces an array of products, such as washing machines, flat panel televisions, printers, photocopiers, medical equipment, mobile cellular devices, computer networking devices, and refrigerators. The firm reported global revenue of 230.4
6 Unless otherwise noted, information is from USITC Publication 4882 and Certain Large Residential Washers from Korea and Mexico, Investigation Nos. 701-TA-488 and 731-TA-1199-1200 (Review), Confidential report, INV-RR-008, March 15, 2019.
7 Unless otherwise noted, this section is from USITC Publication 4882.

III-4
trillion Korean won ($196.5 billion) in 2019. Samsung produces LRWs in its digital appliances business unit. The firm produces LRWs in Korea, Mexico, China (Suzhou Samsung Electronics Co., Ltd. and Suzhou Samsung Electronics Co, Ltd. – Export), Thailand, and Vietnam.
In June 2017, Samsung announced that it would open a production site for LRWs in Newberry, South Carolina. Samsung’s Newberry operation is a fully integrated LRW manufacturing facility employing *** workers as of June 2020. In 2018, Samsung produced *** LRWs in Newberry, and produced *** LRWs in 2019.8 Samsung stated that it believed its Newberry plant will be fully operational ***. Samsung closed its Newberry plant temporarily multiple times in 2020 due to COVID-19.9
Whirlpool10 Whirlpool, founded in 1898 and headquartered in Benton Harbor, Michigan, is a
manufacturer and marketer of home appliances. It reported net sales of approximately $21 billion for 2018. Globally, the firm employed approximately 92,000 employees and had 41 manufacturing facilities in 14 countries as of 2018. The firm reported its principal products are laundry appliances, refrigerators and freezers, cooking appliances, dishwashers, mixers and other portable household appliances. The firm reports earnings by geographic segment, which consist of North America, Latin America, EMEA (Europe, Middle East and Africa) and Asia. The North American segment produces, markets, and distributes home appliances and portable appliances under a variety of brand names, primarily Whirlpool, Maytag, KitchenAid, Jenn-Air, Amana, Roper, Admiral, Affresh, Gladiator, Inglis, Estate, Acros, and Supermatic, and distributes primarily to retailers, distributors, and builders.
In 2010, Whirlpool began production of front load LRWs in the United States after investing $100 million to expand its existing facility in Clyde, Ohio. Prior to 2010, Whirlpool supplied front load LRWs to the U.S. market from Whirlpool’s facilities in Germany and Mexico.11 A wholly owned subsidiary, Whirlpool Overseas Manufacturing S.a.r.l. (“Whirlpool Mexico”), ceased exports of LRWs to the United States in July 2012, and currently produces
8 Samsung’s U.S. producer questionnaire response at II-4 and II-11. 9 Samsung closes washing machine plant in the US once again, April 8, 2020,
https://www.sammobile.com/news/samsung-closes-washing-machine-plant-usa-once-again/, retrieved October 8, 2020.
10 Unless otherwise noted, this section is from USITC Publication 4882. 11 Large Residential Washers from China, Inv. No. 731-TA-1306 (Final), USITC Publication No. 4666,
January 2017, pp. III-2 – III-3.

III-5
LRWs for sale in non-U.S. markets. Whirlpool also has LRW production in Brazil, China, and Colombia. The company maintains a large home appliance presence in Europe which includes residential washer production, but not LRW production.
Developments in the U.S. LRWs industry
Since January 1, 2017, there have been several developments affecting the LRW industry. First, two new U.S. producers commenced production. Samsung began producing LRWs in Newberry, South Carolina in January 2018, and LG began producing LRWs in Clarksville, Tennessee in October 2018. Second, stricter energy efficiency and water use standards for LRWs went into effect in 2018. In addition, LG and Samsung shifted their source of imported LRWs from China to Thailand and Vietnam around the time that an antidumping duty order was imposed on LRWs from China in early February 2017. In January 2018, the President imposed a safeguard measure on imports of LRWs, effective February 7, 2018, in the form of a tariff-rate quota and quarterly allocation of the tariff-rate quota took effect January 23, 2020. In May 2019, Commerce revoked the antidumping and countervailing duty orders on LRWs from Korea, while continuing the antidumping duty order on LRWs from Mexico, pursuant to the Commission’s determinations in the five-year reviews of the orders. Finally, as discussed in greater detail in Part I and appendix E, tariffs were imposed on imports of certain inputs into LRW production following investigations under Section 232 and Section 301. Table III-1 presents major developments in the domestic LRW industry since January 1, 2017.

III-6
Table III-1 LRW: Important industry events since January 1, 2017
Year Month Entity Event
2017
January GE Appliances
Reached tentative agreement with the union for a new contract; the union subsequently approved the four-year contract.
February
Commerce Antidumping duty order issued on LRWs from China.
LG
Announced it would build a $250 million home appliance production facility near Clarksville, Tennessee, including for washing machines, opening in 2019.
June
USITC Instituted a section 201 safeguard investigation on global imports of LRWs.
Samsung
Announced it would invest $380 million in an appliance production facility, including washing machines, in Newberry, South Carolina, with LRW production possible in 2018.
December USITC Delivered its safeguard recommendations to the President.
2018
January 1
U.S. Department of Commerce
Notice of initiation of five-year (sunset) reviews of certain LRWs from Korea and Mexico by Commerce (83 FR 100, January 2, 2018)
January 2 USITC Notice of institution of five-year reviews of certain LRWs from Korea and Mexico by Commission (83 FR 145)
January
EnergyStar and CEE
New energy and water efficiency standards for LRWs became effective and surpass levels of 2015 requirements.
Samsung Began U.S. production of LRWs at plant in Newberry, South Carolina.
January 23 and February 7
President of the United States
Issued Presidential Proclamation imposing the safeguard measure, a tariff-rate quota for three years and one day on imports of LRWs and certain parts thereof.
April 18
North America Free Trade Agreement
Electrolux filed an appeal with NAFTA Secretariat of Commerce’s final antidumping duty administrative review determination regarding LRWs from Mexico (83 FR 19221).
May 10 Commerce Published final results of expedited five-year review of the antidumping duty order on LRWs from Mexico (83 FR 21764)
May 14 World Trade Organization
South Korea requested consultations under WTO dispute settlement process with the United States concerning the safeguard measures (DS546).
August 14 World Trade Organization
South Korea requested the establishment of a Dispute Settlement Body (“DSB”) panel (DS546).
September 26
World Trade Organization Established a DSB panel (DS546).
October 18 Commerce Published final results of full five-year review of the antidumping duty order on LRWs from Korea (83 FR 52803)
October LG Began U.S production of LRWs at plant in Clarksville, Tennessee
2019
February 7 Commerce Tariff rate quota reset.
April 30 USITC
Published determinations in full five-year (sunset) reviews: LRWs from Korea and Mexico (84 FR 18319)--affirmative (Mexico) and negative (Korea).
May 8
U.S. Department of Commerce
Published continuation of antidumping order on LRWs from Mexico and terminated antidumping and countervailing duty orders on LRWs from Korea.
Table continued on next page.

III-7
Table III-1--Continued LRW: Important industry events since January 1, 2017
Year Month Entity Event
2020 January 23, 2020
President of the United States
Issued presidential proclamation implementing quarterly allocation of the tariff-rate quota.
Source: Compiled from various sources.
Domestic producers were asked to report whether their firm had experienced any plant openings, relocations, expansions, acquisitions, consolidations, closures, or prolonged shutdowns because of strikes or equipment failure; curtailment of production because of shortages of materials or other reasons, including revision of labor agreements; or any other change in the character of their operations or organization relating to the production of LRWs products since January 1, 2017. All of the domestic producers indicated that they had experienced such changes as presented in table III-2.

III-8
Table III-2 LRWs: U.S. producers’ reported changes in operations, since January 1, 2017
Item / Firm Reported changed in operations Plant openings: *** *** *** *** *** *** Expansions: *** *** *** *** *** *** *** *** Prolonged shutdowns or curtailments: *** *** *** *** *** ***
Table continued on next page.

III-9
Table III-2--Continued LRWs: U.S. producers’ reported changes in operations, since January 1, 2017
Item / Firm Reported changed in operations Revised labor agreements: *** *** Other: *** ***
Source: Compiled from data submitted in response to Commission questionnaires.
U.S. production, capacity, and capacity utilization
Table III-3 and figure III-1 present U.S. producers’ production, capacity, and capacity utilization. Samsung began U.S. production in January 2018 and LG began U.S. production in October 2018. U.S. capacity increased in each year with the majority of the increase in 2018, ending *** percent higher in 2019 than in 2017. Capacity was *** percent higher in January-June 2020 than in January-June 2019. U.S. production decreased *** percent from 2017 to 2018, then increased *** percent from 2018 to 2019, ending *** percent higher in 2019 than in 2017, but was *** percent lower in January-June 2020 than in January-June 2019. Capacity utilization declined by *** percentage points during 2017-19; and was *** percentage points lower in January-June 2020 than in January-June 2019. All operating firms increased capacity between 2017 and 2019.
I
I
I

III-10
Table III-3 LRWs: U.S. producers' capacity, production, and capacity utilization, 2017-19, January to June 2019, and January to June 2020
Item Calendar year January to June
2017 2018 2019 2019 2020 Capacity (units) Alliance *** *** *** *** *** GE Appliances *** *** *** *** *** LG *** *** *** *** *** Samsung *** *** *** *** *** Whirlpool *** *** *** *** ***
All firms *** *** *** *** *** Production (units) Alliance *** *** *** *** *** GE Appliances *** *** *** *** *** LG *** *** *** *** *** Samsung *** *** *** *** *** Whirlpool *** *** *** *** ***
All firms *** *** *** *** *** Capacity utilization (percent) Alliance *** *** *** *** *** GE Appliances *** *** *** *** *** LG *** *** *** *** *** Samsung *** *** *** *** *** Whirlpool *** *** *** *** ***
All firms *** *** *** *** *** Share of production (percent) Alliance *** *** *** *** *** GE Appliances *** *** *** *** *** LG *** *** *** *** *** Samsung *** *** *** *** *** Whirlpool *** *** *** *** ***
All firms *** *** *** *** *** Note.—Information presented in this table encompasses both LRWs as specified by the safeguard measure and (1) top load PSC/belt/clutch washers and (2) front load CIM/belt washers.
Note: Shares and ratios shown as "0.0" represent values greater than zero, but less than "0.05" percent.
Source: Compiled from data submitted in response to Commission questionnaires.

III-11
Figure III-1 LRWs: U.S. producers' capacity, production, and capacity utilization, 2017-19, January to June 2019, and January to June 2020
* * * * * * *
Note.—Information presented in this figure encompasses both LRWs as specified by the safeguard measure and (1) top load PSC/belt/clutch washers and (2) front load CIM/belt washers.
Source: Compiled from data submitted in response to Commission questionnaires.
Foreign-trade zone production activities
In 2012, Whirlpool applied to the Foreign-Trade Zone Board to create a foreign trade subzone that would encompass its entire Clyde, Ohio, manufacturing facility.12 Whirlpool reported that, commencing in 2013, it admitted into the foreign-trade zone (“FTZ”) duty free various non-covered LRW parts from various countries of origin, for use in the production of
12 Foreign-trade zones are secure areas under the supervision of U.S. Customs and Border Protection (“CBP”) that are considered outside the customs territory of the United States for the purposes of duty payment. Authority for establishing these facilities is granted by the Foreign-Trade Zones Board under the Foreign-Trade Zones Act of 1934, as amended (19 U.S.C. 81a-81u), and the Board’s regulations (15 C.F.R. Part 400). The Executive Secretariat of the Board is located within Enforcement and Compliance division of the U.S. Department of Commerce. 76th Annual Report of the Foreign-Trade Zones Board to the U.S. Congress of the United States, August 2015, p. 1. Whirlpool’s FTZ subzone is 8I, located in Clyde, Ohio. It is a subzone of FTZ 8, Toledo—Lucas County Port Authority.

III-12
LRWs.13 Doing so allowed Whirlpool to minimize tariff liability.14 Pursuant to FTZ regulations, production activities15 must be approved by the FTZ board and U.S. Customs entries must be made for finished goods that utilized foreign components in their production when they leave the FTZ for U.S. consumption. According to these same FTZ regulations, the country of origin of the finished good for Customs purposes is the country of origin of the highest-value foreign component, regardless of the number of foreign components or U.S. content.16
GE Appliances maintains an FTZ at its Louisville, Kentucky manufacturing facility. GE Appliances admitted into the FTZ ***.17 18
*** imports for consumption withdrawn from the FTZ are the complete LRWs produced in the FTZ, manufactured using imports of non-covered LRW parts.19 Due to the nature of these shipments, U.S. shipments of LRWs exiting Whirlpool’s or GE Appliances’ FTZs have not been deemed U.S. imports and are treated as U.S.-produced LRWs.
13 Non-covered other parts reported by Whirlpool include: ***. 14 Whirlpool reported that tariff savings occur when the foreign components admitted into the FTZ
have a higher duty rate than a finished washer. In those cases, the foreign components will be classified as the finished washer when they are withdrawn from the FTZ and will be subject to the lower duty applicable to finished washers. Monitoring Publication, p. III-5, fn. 5.
15 Under FTZ regulations, “manufacturing” means any production activities that result in a substantial transformation of a foreign article to a new and different article having a different name, character, and use, or which causes a change in its HTS classification of the merchandise or in its eligibility for entry for consumption. Foreign-Trade Zones Manual, U.S. Customs and Border Protection, Publication no. 0000-0559A (2011), p. 102.
16 Large Residential Washers from China, Inv. No. 731-TA-1306 (Preliminary), USITC Publication 4591, February 2016, p. III-7, fn. 29.
17 Large Residential Washers: Monitoring Developments in the Domestic Industry, Inv. No. TA-204-013, August 2019. Confidential report, p. III-8, fn. 8.
18 GE Appliances reported that its FTZ admissions included ***. GE Appliances explained that its FTZ admissions ***.
19 See ***.

III-13
Alternative products
*** produced using the same equipment, machinery, or employees. ***. As shown in table III-4, over *** percent of the production using shared capacity by U.S. producers during January 2017 to June 2020 consisted of LRWs and belt drive residential washers. Overall capacity utilization between 2017 and 2019 declined by *** percentage points, as overall capacity increased by *** percent and total production increased by *** percent. Table III-4 presents data on U.S. producers' overall capacity and production on the same equipment.

III-14
Table III-4 LRWs: U.S. producers' overall capacity and production on the same equipment of the domestic like product (“DLP”) and other products, 2017-19, January to June 2019, and January to June 2020
Item Calendar year January to June 2017 2018 2019 2019 2020 Quantity (units) Overall capacity *** *** *** *** *** Production: LRWs *** *** *** *** ***
Exclusion 2 PSC/belt drive top *** *** *** *** *** Exclusion 3 CIM/belt front *** *** *** *** ***
DLP select residential washers *** *** *** *** *** Commercial washers *** *** *** *** *** Stacked washers *** *** *** *** *** Extra-wide washers *** *** *** *** *** Other products *** *** *** *** ***
Products other than DLP *** *** *** *** *** Total production on same machinery *** *** *** *** ***
Ratios and shares (percent) Overall capacity utilization *** *** *** *** *** Share of production: LRWs *** *** *** *** ***
Exclusion 2 PSC/belt drive top *** *** *** *** *** Exclusion 3 CIM/belt front *** *** *** *** ***
DLP select residential washers *** *** *** *** *** Commercial washers *** *** *** *** *** Stacked washers *** *** *** *** *** Extra-wide washers *** *** *** *** *** Other products *** *** *** *** ***
Products other than DLP *** *** *** *** *** Total production on same machinery *** *** *** *** ***
Note: Shares and ratios shown as "0.0" represent values greater than zero, but less than "0.05" percent. Source: Compiled from data submitted in response to Commission questionnaires.

III-15
U.S. producers’ shipments
Table III-5 presents U.S. producers’ U.S. shipments, export shipments, and total shipments. Three firms (***) reported exports, mainly to Canada and *** to Europe and Asia. U.S. shipments, by quantity, increased in each year during 2017 to 2019, ending *** percent higher in 2019 than in 2017. *** increased their U.S. shipments through 2019 after beginning production operations in 2018. LG’s January-June 2020 U.S. shipments were *** percent higher than in January-June 2019, and Samsung realized *** percent higher U.S. shipments over the same partial-year period. Alliance’s and Whirlpool’s U.S. shipments *** from 2017 to 2019 by *** and *** percent, respectively.
Table III-5 LRWs: U.S. producers' U.S. shipments, export shipments, and total shipments, 2017-19, January to June 2019, and January to June 2020
Item Calendar year January to June
2017 2018 2019 2019 2020 Quantity (units) U.S. shipments *** *** *** *** *** Export shipments *** *** *** *** ***
Total shipments *** *** *** *** *** Value (1,000 dollars) U.S. shipments *** *** *** *** *** Export shipments *** *** *** *** ***
Total shipments *** *** *** *** *** Unit value (dollars per unit) U.S. shipments *** *** *** *** *** Export shipments *** *** *** *** ***
Total shipments *** *** *** *** *** Share of quantity (percent) U.S. shipments *** *** *** *** *** Export shipments *** *** *** *** ***
Total shipments *** *** *** *** *** Share of value (percent) U.S. shipments *** *** *** *** *** Export shipments *** *** *** *** ***
Total shipments *** *** *** *** *** Note.—Information presented in this table encompasses both LRWs as specified by the safeguard measure and (1) top load PSC/belt/clutch washers and (2) front load CIM/belt washers. Note: Shares and ratios shown as "0.0" represent values greater than zero, but less than "0.05" percent. Source: Compiled from data submitted in response to Commission questionnaires.

III-16
U.S. producers’ commercial U.S. shipments of covered parts
Table III-6 presents U.S. producers’ commercial U.S. shipments of covered parts, the vast majority of which were reported by ***.
Table III-6 LRWs: U.S. producers' commercial shipments of covered parts, by source, 2017-19, January to June 2019, and January to June 2020
Item Calendar year January to June
2017 2018 2019 2019 2020 Quantity (units) Alliance *** *** *** *** *** GE Appliances *** *** *** *** *** LG *** *** *** *** *** Samsung *** *** *** *** *** Whirlpool *** *** *** *** ***
All firms *** *** *** *** *** Value (1,000 dollars) Alliance *** *** *** *** *** GE Appliances *** *** *** *** *** LG *** *** *** *** *** Samsung *** *** *** *** *** Whirlpool *** *** *** *** ***
All firms *** *** *** *** *** Unit value (dollars per unit) Alliance *** *** *** *** *** GE Appliances *** *** *** *** *** LG *** *** *** *** *** Samsung *** *** *** *** *** Whirlpool *** *** *** *** ***
All firms *** *** *** *** *** Share of quantity (percent) Alliance *** *** *** *** *** GE Appliances *** *** *** *** *** LG *** *** *** *** *** Samsung *** *** *** *** *** Whirlpool *** *** *** *** ***
All firms *** *** *** *** *** Share of value (percent) Alliance *** *** *** *** *** GE Appliances *** *** *** *** *** LG *** *** *** *** *** Samsung *** *** *** *** *** Whirlpool *** *** *** *** ***
All firms *** *** *** *** *** Note: Shares and ratios shown as "0.0" represent values greater than zero, but less than "0.05" percent.
Source: Compiled from data submitted in response to Commission questionnaires.

III-17
U.S. producers’ commercial U.S. shipments by product type
U.S. producers were asked to provide data on commercial U.S. shipments of LRWs by product type. As discussed in Part I, LRWs can be configured as either top loading or front loading machines and may be Energy Star compliant or not.
Top load LRWs accounted for the vast majority of U.S. producers’ commercial U.S. shipments of LRWs (table III-7 and figure III-3). Nevertheless, while the quantity of U.S. producers’ commercial U.S. shipments of top load LRWs increased by *** percent during 2017-19, their share of total commercial U.S. shipments decreased from *** percent in 2017 to *** percent in 2019, and was *** percent in January-June 2020 compared with *** percent in January-June 2019. The quantity of U.S. producers’ commercial U.S. shipments of front load LRWs increased both absolutely and relatively from 2017 to 2019, as such shipments increased by *** percent and accounted for *** percent of total U.S. commercial shipments in 2019 (up from *** percent in 2017). Front load LRWs accounted for *** percent of U.S. producers’ commercial U.S. shipments in January-June 2020 compared with *** percent in January-June 2019.
The average unit value of U.S. producers’ commercial U.S. shipments of front load washers, which was higher than for top load washers, decreased by *** percent between 2017 and 2019 and was *** percent lower in January-June 2020 than in January-June 2019, while the average unit value of top load washers increased by *** percent between 2017 and 2019, and was *** percent higher in January-June 2020 than in January-June 2019.

III-18
Table III-7 LRWs: U.S. producers' commercial U.S. shipments by product type, 2017-19, January to June 2019, and January to June 2020
Item Calendar year January to June
2017 2018 2019 2019 2020 Quantity (units) U.S. producers: Front-load: Energy Star *** *** *** *** ***
Front-load: Non-Energy Star *** *** *** *** *** All front-load *** *** *** *** ***
Top-load: Agitator: Energy Star *** *** *** *** *** Top-load: Agitator: Non-Energy Star *** *** *** *** *** Top-load: w/o Agitator: Energy Star *** *** *** *** *** Top-load: w/o Agitator: Non-Energy Star *** *** *** *** ***
All top-load *** *** *** *** *** All Energy Star *** *** *** *** *** All non-Energy Star *** *** *** *** ***
Total *** *** *** *** *** Value (units) U.S. producers: Front-load: Energy Star *** *** *** *** ***
Front-load: Non-Energy Star *** *** *** *** *** All front-load *** *** *** *** ***
Top-load: Agitator: Energy Star *** *** *** *** *** Top-load: Agitator: Non-Energy Star *** *** *** *** *** Top-load: w/o Agitator: Energy Star *** *** *** *** *** Top-load: w/o Agitator: Non-Energy Star *** *** *** *** ***
All top-load *** *** *** *** *** All Energy Star *** *** *** *** *** All non-Energy Star *** *** *** *** ***
Total *** *** *** *** *** Unit value (dollars per unit)
U.S. producers: Front-load: Energy Star *** *** *** *** ***
Front-load: Non-Energy Star *** *** *** *** *** All front-load *** *** *** *** ***
Top-load: Agitator: Energy Star *** *** *** *** *** Top-load: Agitator: Non-Energy Star *** *** *** *** *** Top-load: w/o Agitator: Energy Star *** *** *** *** *** Top-load: w/o Agitator: Non-Energy Star *** *** *** *** ***
All top-load *** *** *** *** *** All Energy Star *** *** *** *** *** All non-Energy Star *** *** *** *** ***
Total *** *** *** *** *** Table continued on next page.

III-19
Table III-7--Continued LRWs: U.S. producers' commercial U.S. shipments by product type, 2017-19, January to June 2019, and January to June 2020
Item Calendar year January to June
2017 2018 2019 2019 2020 Share of quantity (percent) U.S. producers: Front-load: Energy Star *** *** *** *** ***
Front-load: Non-Energy Star *** *** *** *** *** All front-load *** *** *** *** ***
Top-load: Agitator: Energy Star *** *** *** *** *** Top-load: Agitator: Non-Energy Star *** *** *** *** *** Top-load: w/o Agitator: Energy Star *** *** *** *** *** Top-load: w/o Agitator: Non-Energy Star *** *** *** *** ***
All top-load *** *** *** *** *** All Energy Star *** *** *** *** *** All non-Energy Star *** *** *** *** ***
Total *** *** *** *** *** Share of value (percent) U.S. producers: Front-load: Energy Star *** *** *** *** ***
Front-load: Non-Energy Star *** *** *** *** *** All front-load *** *** *** *** ***
Top-load: Agitator: Energy Star *** *** *** *** *** Top-load: Agitator: Non-Energy Star *** *** *** *** *** Top-load: w/o Agitator: Energy Star *** *** *** *** *** Top-load: w/o Agitator: Non-Energy Star *** *** *** *** ***
All top-load *** *** *** *** *** All Energy Star *** *** *** *** *** All non-Energy Star *** *** *** *** ***
Total *** *** *** *** ***
Producers' share of overall commercial shipments in
market for each product type (percent) U.S. producers: Front-load: Energy Star *** *** *** *** ***
Front-load: Non-Energy Star *** *** *** *** *** All front-load *** *** *** *** ***
Top-load: Agitator: Energy Star *** *** *** *** *** Top-load: Agitator: Non-Energy Star *** *** *** *** *** Top-load: w/o Agitator: Energy Star *** *** *** *** *** Top-load: w/o Agitator: Non-Energy Star *** *** *** *** ***
All top-load *** *** *** *** *** All Energy Star *** *** *** *** *** All non-Energy Star *** *** *** *** ***
Total *** *** *** *** *** Note.--Shares and ratios shown as "0.0" represent values greater than zero, but less than "0.05" percent.
Source: Compiled from data submitted in response to Commission questionnaires.

III-20
Figure III-3 LRWs: U.S. producers' commercial U.S. shipments, 2017-19, January to June 2019, and January to June 2020
* * * * * * *
Source: Compiled from data submitted in response to Commission questionnaires.
U.S. producers’ commercial U.S. shipments of top load LRWs with an agitator but without Energy Star certification increased from 2017 to 2019 by *** percent but were *** percent lower in January-June 2020 than in January-June 2019. Commercial U.S. shipments of top load LRWs with an agitator and Energy Star certification declined between 2017 and 2019 by *** percent, but were *** percent higher in January-June 2020 than in January-June 2019. U.S. producers’ commercial U.S. shipments of top load LRWs without an agitator that were Energy Star certified increased from 2017 to 2019 by *** percent and were *** percent higher in January-June 2020 than in January-June 2019.
The share of LRWs that were Energy Star certified increased by *** percentage points from 2017 to 2019 and was *** percentage points higher in January-June 2020 than in January-June 2019.
U.S. producers’ inventories
Table III-8 presents U.S. producers’ end-of-period inventories and the ratio of these inventories to U.S. producers’ production, U.S. shipments, and total shipments. Inventories and the associated ratios generally declined between January 2017 and June 2020: Inventories decreased by *** percent from 2017 to 2019 and were *** lower in January-June 2020

III-21
than in January-June 2019. Relative to production, the ratio of inventories declined from *** percent in 2017 to *** percent in 2019, and was *** percentage points lower in January-June 2020 than in January-June 2019.
Table III-8 LRWs: U.S. producers' inventories, 2017-19, January to June 2019, and January to June 2020
Item Calendar year January to June
2017 2018 2019 2019 2020 Quantity (units) U.S. producers' end-of-period inventories *** *** *** *** *** Ratio (percent) Ratio of inventories to.-- U.S. production *** *** *** *** ***
U.S. shipments *** *** *** *** *** Total shipments *** *** *** *** ***
Note.—Information presented in this table encompasses both LRWs as specified by the safeguard measure and (1) top load PSC/belt/clutch washers and (2) front load CIM/belt washers. Source: Compiled from data submitted in response to Commission questionnaires.
U.S. producers’ imports
U.S. producers’ imports of LRWs are presented in table III-9. All firms except *** imported LRWs. U.S. imports by ***, declined during 2017-19, and were lower in January-June 2020 than in January-June 2019. *** imports of *** increased each year during 2017-19 and were higher in January-June 2020 than in January-June 2019. The ratio of *** imports to the firm’s U.S. production ranged from a low of *** percent in 2017 to a high of *** percent in January-June 2020.

III-22
Table III-9 LRWs: U.S. producers' imports, 2017-19, January to June 2019, and January to June 2020
Item Calendar year January to June
2017 2018 2019 2019 2020 Quantity (units) *** U.S. production *** *** *** *** *** *** U.S. imports from.-- China *** *** *** *** ***
Korea *** *** *** *** *** Thailand *** *** *** *** *** Vietnam *** *** *** *** ***
All imports sources of LRWs *** *** *** *** ***
*** *** *** *** *** *** All import sources *** *** *** *** ***
Ratio (percent) *** ratio to U.S. production of imports from.-- China *** *** *** *** ***
Korea *** *** *** *** *** Thailand *** *** *** *** *** Vietnam *** *** *** *** ***
All imports sources of LRWs *** *** *** *** ***
*** *** *** *** *** *** All import sources *** *** *** *** ***
Narrative *** reason for importing *** *** reason for importing ***
Table continued on next page.

III-23
Table III-9--Continued LRWs: U.S. producers' imports, 2017-19, January to June 2019, and January to June 2020
Item Calendar year January to June
2017 2018 2019 2019 2020 Quantity (units) *** U.S. production *** *** *** *** *** *** U.S. imports from.-- China *** *** *** *** ***
Korea *** *** *** *** *** Thailand *** *** *** *** *** Vietnam *** *** *** *** *** All other sources (***) *** *** *** *** ***
All imports sources *** *** *** *** *** Ratio (percent) *** ratio to U.S. production of imports from.-- China *** *** *** *** ***
Korea *** *** *** *** *** Thailand *** *** *** *** *** Vietnam *** *** *** *** *** All other sources (***) *** *** *** *** ***
All imports sources *** *** *** *** *** Narrative
*** reason for importing *** Quantity (units) *** U.S. production *** *** *** *** ***
*** *** *** *** *** *** *** Ratio (percent)
*** *** *** *** *** *** Narrative
*** reason for importing *** Note: ***.
Note: Shares and ratios shown as "0.0" represent values greater than zero, but less than "0.05" percent.
Source: Compiled from data submitted in response to Commission questionnaires.

III-24
U.S. employment, wages, and productivity
Table III-10 shows U.S. producers’ employment-related data. Each of the employment factors except hours worked per PRW and productivity increased between 2017 and 2019. The total number of PRWs increased by *** from 2017 to 2019. PRWs for ***, increased by *** from 2017 to 2019 but were *** lower in January-June 2020 than in January-June 2019. The number of PRWs for *** increased from *** in 2017 to *** in 2019; and were higher in January-June 2020 than in January-June 2019, by ***.
Table III-10 LRWs: U.S. producers' employment related data, 2017-19, January to June 2019, and January to June 2020
Item Calendar year January to June
2017 2018 2019 2019 2020 Production and related workers (PRWs) (number) *** *** *** *** *** Total hours worked (1,000 hours) *** *** *** *** *** Hours worked per PRW (hours) *** *** *** *** *** Wages paid ($1,000) *** *** *** *** *** Hourly wages (dollars per hour) *** *** *** *** *** Productivity (units per 1,000 hours) *** *** *** *** *** Unit labor costs (dollars per unit) *** *** *** *** ***
Note.—Information presented in this table encompasses both LRWs as specified by the safeguard measure and (1) top load PSC/belt/clutch washers and (2) front load CIM/belt washers.
Source: Compiled from data submitted in response to Commission questionnaires.

IV-1
Part IV: Financial experience of U.S. producers
Background
Five U.S. producers reported usable financial results on their washers operations: Alliance, GE Appliances, LG, Samsung, and Whirlpool. *** accounted for the majority of the quantity of total net sales in 2019 (*** percent), followed by *** (*** percent), *** (*** percent), *** (*** percent), and *** (*** percent).1 2 *** U.S. producers reported their financial results on the basis of generally accepted accounting principles (“GAAP”) and for calendar-year periods. U.S. producers’ net sales quantity consisted of commercial sales (*** percent), transfers to related firms (*** percent), and internal consumption (*** percent) in 2019.3 Non-commercial sales are included but not presented separately in this section of the report.
Operations on washers
Table IV-1 presents aggregated data on U.S. producers’ operations in relation to washers. Table IV-2 shows the changes in average unit values (“AUVs”) of selected financial indicators. Table IV-3 presents selected company-specific financial data.
1 ***. U.S. producers’ questionnaire response of ***, question II-2a. 2 ***. Emails from ***, September 25 and October 6, 2020. 3 ***. Email from ***, October 6, 2020. ***. Email from ***, October 5, 2020.

IV-2
Table IV-1 LRWs: Results of operations of U.S. producers, 2017-19, January to June 2019, and January to June 2020
Item Calendar year January to June
2017 2018 2019 2019 2020 Quantity (units) Total net sales *** *** *** *** *** Value (1,000 dollars) Total net sales *** *** *** *** *** Cost of goods sold.-- Raw materials *** *** *** *** ***
Direct labor *** *** *** *** *** Other factory costs *** *** *** *** ***
Total COGS *** *** *** *** *** Gross profit *** *** *** *** *** SG&A expense *** *** *** *** *** Operating income or (loss) *** *** *** *** *** Other expense/(income), net *** *** *** *** *** Net income or (loss) *** *** *** *** *** Depreciation/amortization *** *** *** *** *** Cash flow *** *** *** *** *** Ratio to net sales (percent) Cost of goods sold.-- Raw materials *** *** *** *** ***
Direct labor *** *** *** *** *** Other factory costs *** *** *** *** ***
Average COGS *** *** *** *** *** Gross profit *** *** *** *** *** SG&A expense *** *** *** *** *** Operating income or (loss) *** *** *** *** *** Net income or (loss) *** *** *** *** ***
Table continued on following page.
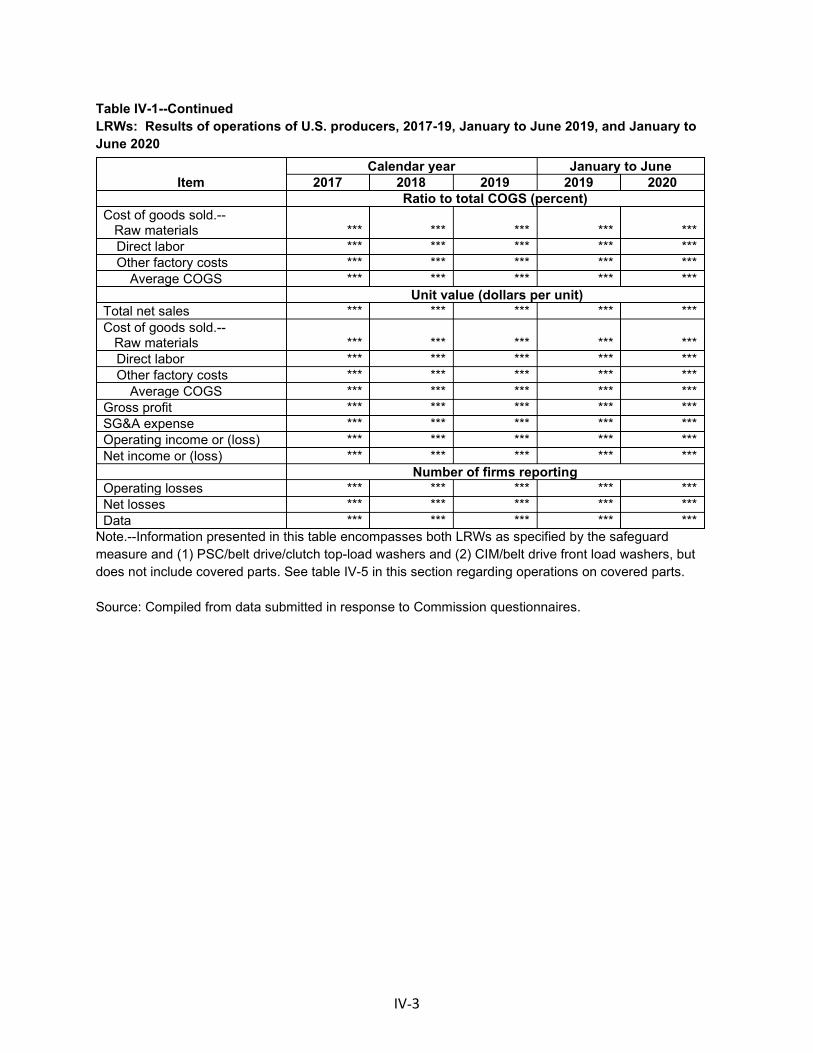
IV-3
Table IV-1--Continued LRWs: Results of operations of U.S. producers, 2017-19, January to June 2019, and January to June 2020
Item Calendar year January to June
2017 2018 2019 2019 2020 Ratio to total COGS (percent) Cost of goods sold.-- Raw materials *** *** *** *** ***
Direct labor *** *** *** *** *** Other factory costs *** *** *** *** ***
Average COGS *** *** *** *** *** Unit value (dollars per unit)
Total net sales *** *** *** *** *** Cost of goods sold.-- Raw materials *** *** *** *** ***
Direct labor *** *** *** *** *** Other factory costs *** *** *** *** ***
Average COGS *** *** *** *** *** Gross profit *** *** *** *** *** SG&A expense *** *** *** *** *** Operating income or (loss) *** *** *** *** *** Net income or (loss) *** *** *** *** *** Number of firms reporting Operating losses *** *** *** *** *** Net losses *** *** *** *** *** Data *** *** *** *** ***
Note.--Information presented in this table encompasses both LRWs as specified by the safeguard measure and (1) PSC/belt drive/clutch top-load washers and (2) CIM/belt drive front load washers, but does not include covered parts. See table IV-5 in this section regarding operations on covered parts.
Source: Compiled from data submitted in response to Commission questionnaires.

IV-4
Table IV-2 LRWs: Changes in AUVs, between calendar years and between partial year periods
Item Between calendar years
Between partial year
period 2017-19 2017-18 2018-19 2019-20
Change in AUVs (percent) Total net sales *** *** *** *** Cost of goods sold.-- Raw materials *** *** *** ***
Direct labor *** *** *** *** Other factory costs *** *** *** ***
Average COGS *** *** *** *** Change in AUVs (dollars per unit)
Total net sales *** *** *** *** Cost of goods sold.-- Raw materials *** *** *** ***
Direct labor *** *** *** *** Other factory costs *** *** *** ***
Average COGS *** *** *** *** Gross profit *** *** *** *** SG&A expense *** *** *** *** Operating income or (loss) *** *** *** *** Net income or (loss) *** *** *** ***
Note.--Information presented in this table encompasses both LRWs as specified by the safeguard measure and (1) PSC/belt drive/clutch top-load washers and (2) CIM/belt drive front load washers, but does not include covered parts.
Source: Compiled from data submitted in response to Commission questionnaires.

IV-5
Table IV-3 LRWs: Select results of operations of U.S. producers, by company, 2017-19, January to June 2019, and January to June 2020
Item Calendar year January to June
2017 2018 2019 2019 2020 Total net sales (units) *** *** *** *** *** *** *** *** *** *** *** *** *** *** *** *** *** *** *** *** *** *** *** *** *** *** *** *** *** ***
Continuous *** *** *** *** *** Non-continuous *** *** *** *** ***
All firms *** *** *** *** *** Total net sales (1,000 dollars) *** *** *** *** *** *** *** *** *** *** *** *** *** *** *** *** *** *** *** *** *** *** *** *** *** *** *** *** *** ***
Continuous *** *** *** *** *** Non-continuous *** *** *** *** ***
All firms *** *** *** *** *** Cost of goods sold (1,000 dollars) *** *** *** *** *** *** *** *** *** *** *** *** *** *** *** *** *** *** *** *** *** *** *** *** *** *** *** *** *** ***
Continuous *** *** *** *** *** Non-continuous *** *** *** *** ***
All firms *** *** *** *** *** Table continued on following page.
IV-6
Table IV-3--Continued LRWs: Select results of operations of U.S. producers, by company, 2017-19, January to June 2019, and January to June 2020
Item Calendar year January to June
2017 2018 2019 2019 2020 Gross profit or (loss) (1,000 dollars) *** *** *** *** *** *** *** *** *** *** *** *** *** *** *** *** *** *** *** *** *** *** *** *** *** *** *** *** *** ***
Continuous *** *** *** *** *** Non-continuous *** *** *** *** ***
All firms *** *** *** *** *** SG&A expenses (1,000 dollars) *** *** *** *** *** *** *** *** *** *** *** *** *** *** *** *** *** *** *** *** *** *** *** *** *** *** *** *** *** ***
Continuous *** *** *** *** *** Non-continuous *** *** *** *** ***
All firms *** *** *** *** *** Operating income or (loss) (1,000 dollars) *** *** *** *** *** *** *** *** *** *** *** *** *** *** *** *** *** *** *** *** *** *** *** *** *** *** *** *** *** ***
Continuous *** *** *** *** *** Non-continuous *** *** *** *** ***
All firms *** *** *** *** *** Table continued on following page.

IV-7
Table IV-3--Continued LRWs: Select results of operations of U.S. producers, by company, 2017-19, January to June 2019, and January to June 2020
Item Calendar year January to June
2017 2018 2019 2019 2020 Net income or (loss) (1,000 dollars) *** *** *** *** *** *** *** *** *** *** *** *** *** *** *** *** *** *** *** *** *** *** *** *** *** *** *** *** *** ***
Continuous *** *** *** *** *** Non-continuous *** *** *** *** ***
All firms *** *** *** *** *** COGS to net sales ratio (percent)
*** *** *** *** *** *** *** *** *** *** *** *** *** *** *** *** *** *** *** *** *** *** *** *** *** *** *** *** *** ***
Continuous *** *** *** *** *** Non-continuous *** *** *** *** ***
All firms *** *** *** *** *** Gross profit or (loss) to net sales ratio (percent) *** *** *** *** *** *** *** *** *** *** *** *** *** *** *** *** *** *** *** *** *** *** *** *** *** *** *** *** *** ***
Continuous *** *** *** *** *** Non-continuous *** *** *** *** ***
All firms *** *** *** *** *** Table continued on following page.

IV-8
Table IV-3--Continued LRWs: Select results of operations of U.S. producers, by company, 2017-19, January to June 2019, and January to June 2020
Item Calendar year January to June
2017 2018 2019 2019 2020 SG&A expense to net sales ratio (percent) *** *** *** *** *** *** *** *** *** *** *** *** *** *** *** *** *** *** *** *** *** *** *** *** *** *** *** *** *** ***
Continuous *** *** *** *** *** Non-continuous *** *** *** *** ***
All firms *** *** *** *** *** Operating income or (loss) to net sales ratio (percent) *** *** *** *** *** *** *** *** *** *** *** *** *** *** *** *** *** *** *** *** *** *** *** *** *** *** *** *** *** ***
Continuous *** *** *** *** *** Non-continuous *** *** *** *** ***
All firms *** *** *** *** *** Net income or (loss) to net sales ratio (percent) *** *** *** *** *** *** *** *** *** *** *** *** *** *** *** *** *** *** *** *** *** *** *** *** *** *** *** *** *** ***
Continuous *** *** *** *** *** Non-continuous *** *** *** *** ***
All firms *** *** *** *** *** Table continued on following page.

IV-9
Table IV-3--Continued LRWs: Select results of operations of U.S. producers, by company, 2017-19, January to June 2019, and January to June 2020
Item Calendar year January to June
2017 2018 2019 2019 2020 Unit net sales value (dollars per unit) *** *** *** *** *** *** *** *** *** *** *** *** *** *** *** *** *** *** *** *** *** *** *** *** *** *** *** *** *** ***
Continuous *** *** *** *** *** Non-continuous *** *** *** *** ***
All firms *** *** *** *** *** Unit raw materials (dollars per unit) *** *** *** *** *** *** *** *** *** *** *** *** *** *** *** *** *** *** *** *** *** *** *** *** *** *** *** *** *** ***
Continuous *** *** *** *** *** Non-continuous *** *** *** *** ***
All firms *** *** *** *** *** Unit direct labor (dollars per unit) *** *** *** *** *** *** *** *** *** *** *** *** *** *** *** *** *** *** *** *** *** *** *** *** *** *** *** *** *** ***
Continuous *** *** *** *** *** Non-continuous *** *** *** *** ***
All firms *** *** *** *** *** Table continued on following page.

IV-10
Table IV-3--Continued LRWs: Select results of operations of U.S. producers, by company, 2017-19, January to June 2019, and January to June 2020
Item Calendar year January to June
2017 2018 2019 2019 2020 Unit other factory costs (dollars per unit) *** *** *** *** *** *** *** *** *** *** *** *** *** *** *** *** *** *** *** *** *** *** *** *** *** *** *** *** *** ***
Continuous *** *** *** *** *** Non-continuous *** *** *** *** ***
All firms *** *** *** *** *** Unit COGS (dollars per unit) *** *** *** *** *** *** *** *** *** *** *** *** *** *** *** *** *** *** *** *** *** *** *** *** *** *** *** *** *** ***
Continuous *** *** *** *** *** Non-continuous *** *** *** *** ***
All firms *** *** *** *** *** Unit gross profit or (loss) (dollars per unit) *** *** *** *** *** *** *** *** *** *** *** *** *** *** *** *** *** *** *** *** *** *** *** *** *** *** *** *** *** ***
Continuous *** *** *** *** *** Non-continuous *** *** *** *** ***
All firms *** *** *** *** *** Table continued on following page.

IV-11
Table IV-3--Continued LRWs: Select results of operations of U.S. producers, by company, 2017-19, January to June 2019, and January to June 2020
Item Calendar year January to June
2017 2018 2019 2019 2020 Unit SG&A expenses (dollars per unit) *** *** *** *** *** *** *** *** *** *** *** *** *** *** *** *** *** *** *** *** *** *** *** *** *** *** *** *** *** ***
Continuous *** *** *** *** *** Non-continuous *** *** *** *** ***
All firms *** *** *** *** *** Unit operating income or (loss) (dollars per unit) *** *** *** *** *** *** *** *** *** *** *** *** *** *** *** *** *** *** *** *** *** *** *** *** *** *** *** *** *** ***
Continuous *** *** *** *** *** Non-continuous *** *** *** *** ***
All firms *** *** *** *** *** Unit net income or (loss) (dollars per unit) *** *** *** *** *** *** *** *** *** *** *** *** *** *** *** *** *** *** *** *** *** *** *** *** *** *** *** *** *** ***
Continuous *** *** *** *** *** Non-continuous *** *** *** *** ***
All firms *** *** *** *** *** Note.--Information presented in this table encompasses both LRWs as specified by the safeguard measure and (1) PSC/belt drive/clutch top-load washers and (2) CIM/belt drive front load washers, but does not include covered parts.
Source: Compiled from data submitted in response to Commission questionnaires.
Net sales quantity and value
As shown in table IV-1, the quantity and value of net sales reported by U.S. producers increased from 2017 to 2019. In January-June 2020, net sales quantity and value were somewhat higher compared to January-June 2019. As shown in table IV-3, ***

IV-12
***. The U.S. producers’ net sales average unit value (“AUV”) increased from 2017 to 2019
and was higher in January-June 2020 than in January-June 2019. ***.4
Cost of goods sold and gross profit or loss
Raw material costs ranged from *** percent of total COGS in January-June 2019 to *** percent in 2017 (see table IV-1). Raw materials consist of stainless steel, carbon and non-stainless alloy steel, plastics, computer and electrical components, and other material inputs such as ***.5 As shown in table IV-1, the industry’s unit raw material costs irregularly increased from 2017 to 2019 and were higher in January-June 2020 compared to January-June 2019. As shown in table IV-3, ***.6 Table IV-4 presents a break-out of the raw material costs, by type, for calendar year 2019.
4 ***. Email from ***, October 6, 2020. ***. Email from ***, October 6, 2020. 5 ***. U.S. producers’ questionnaire response of ***, question III-9c. 6 ***. U.S. producer’s questionnaire responses of ***, question III-7.

IV-13
Table IV-4 LRWs: Raw material costs, by type, 2019
Raw materials
Calendar 2019
Value (1,000 dollars) Share of value
(percent) Steel, stainless *** *** Non-stainless alloy steel *** *** Plastic *** *** Computer components *** *** Other material inputs *** ***
Total, raw materials *** *** Source: Compiled from data submitted in response to Commission questionnaires.
On an overall basis, other factory costs (“OFC”) accounted for the second largest share of COGS ranging from *** percent (2017) to *** percent (January-June 2019) of total COGS, followed by direct labor, which represented between *** percent (2017) and *** percent (January-June 2020) of total COGS. As shown in table IV-1, the industry’s unit OFC increased from 2017 to 2019, but was lower in January-June 2020 compared to January-June 2019. The industry’s unit direct labor costs increased from 2017 to 2019 and was higher in January-June 2020 than January-June 2019. As shown in table IV-3, ***.7
The average cost of goods sold (“COGS”) to net sales ratio declined irregularly from *** percent in 2017 to *** percent in 2019 and was somewhat lower in January-June 2020 (*** percent) compared to January-June 2019 (*** percent). The industry’s unit COGS
7 ***. Email from ***, October 6, 2020. ***. Email from ***, October 6, 2020.

IV-14
increased from 2017 to 2019 and was somewhat higher in January-June 2020 compared to January-June 2019.8
As seen in table IV-1, gross profit irregularly increased from $*** in 2017 to $*** in 2019 and was higher when comparing January-June 2020 ($***) to January-June 2019 ($***) because the increase in revenue exceeded the increase in COGS during both the full year and interim periods. Gross profit ratio (total gross profit divided by total net sales value) increased irregularly from *** percent in 2017 to *** percent in 2019 and was higher in January-June 2020 (*** percent) compared to January-June 2019 (*** percent). As shown in table IV-3. ***.
Selling, general & administrative expenses and operating income or loss
The U.S. industry’s total selling, general & administrative (“SG&A”) expenses and corresponding SG&A expense ratio (total SG&A expenses divided by net sales value) declined overall from 2017 to 2019 but were higher in January-June 2020 than January-June 2019. The industry’s SG&A expenses irregularly declined from 2017 to 2019 and were higher in January-June 2020 compared to January-June 2019. SG&A expenses usually include sales commissions, shipping supplies, delivery charges, rent/mortgage on buildings, utilities, insurance, and salaries other than those related to production such as accounting, IT, marketing, human resources, etc.9 10
8 ***. *** posthearing brief, Part II-Answers to Commissioner questions, p. 19. 9 ***. Email from ***, October 13, 2020. 10 ***. *** posthearing brief, Part II-Answers to Commissioner questions, p. 28.
IV-15
The U.S. industry’s operating loss and operating loss ratio (total operating loss divided by total net sales value) improved overall from 2017 to 2019 but were higher (worse) in January-June 2020 compared to January-June 2019. As shown in table IV-3, ***.
Other expenses and net income or loss
Classified below the operating income level are interest expense, other expense, and other income. In table IV-1, these items are aggregated and only the net amount is shown. The net “all other expenses” increased from 2017 to 2019 but were lower in January-June 2020 compared to January-June 2019.
The U.S. industry’s net loss and net loss ratio (total net loss divided by total net sales value) irregularly declined (improved) from 2017 to 2019 but were higher (worse) in January-June 2020 than in January-June 2019. As shown in table IV-3, ***. 11
Table IV-3 presents profitability comparisons between U.S. producers in continuous operations since before the period of investigation (***) and new entrants with non-continuous operations (***). The profitability of both continuous operations and non-continuous operations improved by all measures during the full year 2017-19 period. In January-June 2020, the profitability of continuous operations worsened while the profitability of non-continuous operations improved by all measures compared to January-June 2019.
11 ***. Email from ***, October 7, 2020.

IV-16
Table IV-5 presents U.S. producers’ operations on commercially sold covered parts, and table IV-6 presents U.S. producers’ operations in relation to washers including covered parts. Due to the small volume of commercially sold covered parts, the inclusion of covered parts makes no difference to the U.S. producers’ overall operating income as a share of net sales.
Table IV-5 LRWs: Results of operations on commercially sold covered parts of U.S. producers, 2017-19, January to June 2019, and January to June 2020
Item Calendar year January to June
2017 2018 2019 2019 2020 Net sales quantity (units) *** *** *** *** *** *** *** *** *** *** *** *** *** *** *** *** *** *** *** *** *** *** *** *** *** *** *** *** *** ***
All firms *** *** *** *** *** Net sales value (1,000 dollars) *** *** *** *** *** *** *** *** *** *** *** *** *** *** *** *** *** *** *** *** *** *** *** *** *** *** *** *** *** ***
All firms *** *** *** *** *** Operating income (1,000 dollars)
*** *** *** *** *** *** *** *** *** *** *** *** *** *** *** *** *** *** *** *** *** *** *** *** *** *** *** *** *** ***
All firms *** *** *** *** *** Source: Compiled from data submitted in response to Commission questionnaires.

IV-17
Table IV-6 LRWs: Results of operations of U.S. producers, by full units and commercially sold covered parts, 2017-19, January to June 2019, and January to June 2020
Item Calendar year January to June
2017 2018 2019 2019 2020 Net sales quantity (units) Complete LRWs *** *** *** *** *** Commercially sold covered parts *** *** *** *** ***
LRWs and parts *** *** *** *** *** Share of net sales quantity (percent) Complete LRWs *** *** *** *** *** Commercially sold covered parts *** *** *** *** ***
LRWs and parts *** *** *** *** *** Net sales value (1,000 dollars) Complete LRWs *** *** *** *** *** Commercially sold covered parts *** *** *** *** ***
LRWs and parts *** *** *** *** *** Share of net sales value (percent) Complete LRWs *** *** *** *** *** Commercially sold covered parts *** *** *** *** ***
LRWs and parts *** *** *** *** *** Operating income or (loss) (1,000 dollars) Complete LRWs *** *** *** *** *** Commercially sold covered parts *** *** *** *** ***
LRWs and parts *** *** *** *** *** Unit net sales value (dollars per unit) Complete LRWs *** *** *** *** *** Commercially sold covered parts *** *** *** *** ***
LRWs and parts *** *** *** *** *** Unit net operating income (dollars per unit) Complete LRWs *** *** *** *** *** Commercially sold covered parts *** *** *** *** ***
LRWs and parts *** *** *** *** *** Operating income or (loss) to net sales ratio (percent) Complete LRWs *** *** *** *** *** Commercially sold covered parts *** *** *** *** ***
LRWs and parts *** *** *** *** *** Source: Compiled from data submitted in response to Commission questionnaires.

IV-18
Table IV-7 provides the U.S. producers’ narrative responses regarding effects on financial performance of COVID-19.
Table IV-7 LRWs: Narratives relating to effects on financial performance of COVID-19
Firm Narrative *** *** *** *** *** *** *** *** *** ***
Source: Compiled from data submitted in response to Commission questionnaires
Variance analysis
A variance analysis is most useful for products that do not have substantial changes in product mix over the reporting period and the methodology is most sensitive at the plant or firm level, rather than the aggregated industry level. Because of the wide variation in product mix and unit values between firms in this proceeding and *** and *** not reporting usable financial data for all periods, a variance analysis is not presented.

IV-19
Capital expenditures and research and development expenses
Table IV-8 presents U.S. producers’ capital expenditures and research and development (“R&D”) expenses related to their washers operations and table IV-9 presents corresponding narrative descriptions.12
Table IV-8 LRWs: Capital expenditures and research and development expenses for U.S. producers, by firm, 2017-19, January to June 2019, and January to June 2020
Item
Calendar year January to June 2017 2018 2019 2019 2020
Capital expenditures (1,000 dollars) *** *** *** *** *** *** *** *** *** *** *** *** *** *** *** *** *** *** *** *** *** *** *** *** *** *** *** *** *** ***
Continuous *** *** *** *** *** Non-continuous *** *** *** *** ***
All firms *** *** *** *** *** Research and development expenses (1,000 dollars) *** *** *** *** *** *** *** *** *** *** *** *** *** *** *** *** *** *** *** *** *** *** *** *** *** *** *** *** *** ***
Continuous *** *** *** *** *** Non-continuous *** *** *** *** ***
All firms *** *** *** *** *** Note.--Information presented in this table encompasses both LRWs as specified by the safeguard measure and (1) PSC/belt drive/clutch top-load washers and (2) CIM/belt drive front load washers, but does not include covered parts. Source: Compiled from data submitted in response to Commission questionnaires.
12 ***. *** posthearing brief, Part II-Answers to Commissioner questions, p. 24.

IV-20
Table IV-9 LRWs: Nature and focus of capital expenditures and R&D expenses for U.S. producers, by firm, 2017-19, January to June 2019, and January to June 2020
Firm Nature and focus of capital expenditures *** *** *** *** *** *** *** *** *** *** Nature and focus of R&D expenses *** *** *** *** *** *** *** *** *** ***
Source: Compiled from data submitted in response to Commission questionnaires.
IV-21
Assets and return on assets
Table IV-10 presents data on the U.S. producers’ total assets and their operating return on assets related to operations on washers.13 Table VI-11 presents the firms’ narrative responses regarding substantial changes in reported net assets. Table IV-10 LRWs: Value of assets used in production, warehousing, and sales, and return on asset for U.S. producers by firm, 2017-19
Firm Calendar years
2017 2018 2019 Total net assets (1,000 dollars) *** *** *** *** *** *** *** *** *** *** *** *** *** *** *** *** *** *** *** ***
Continuous *** *** *** Non-continuous *** *** ***
All firms *** *** *** Operating return on assets (percent) *** *** *** *** *** *** *** *** *** *** *** *** *** *** *** *** *** *** *** ***
Continuous *** *** *** Non-continuous *** *** ***
All firms *** *** *** Note.--Information presented in this table encompasses both LRWs as specified by the safeguard measure and (1) PSC/belt drive/clutch top-load washers; (2) CIM/belt drive front load washers, but does not include covered parts. Source: Compiled from data submitted in response to Commission questionnaires.
13 With respect to a company’s overall operations, staff notes that a total asset value (i.e., the bottom line number on the asset side of a company’s balance sheet) reflects an aggregation of a number of assets which are generally not product specific. Accordingly, high-level allocation factors were required in order to report a total asset value for washers.

IV-22
Table IV-11 LRWs: Description of assets for U.S. producers, by firm, 2017-19
Firm Substantial changes in net assets *** *** *** *** *** *** *** *** *** ***
Source: Compiled from data submitted in response to Commission questionnaires

V-1
Part V: U.S. imports, apparent U.S. consumption, and market shares U.S. Imports
Table V-1 and figure V-1 present information on U.S. imports of residential washers, including in-scope LRWs and out-of-scope residential washers, based on responses to the Commission’s questionnaires.1 Total U.S. imports of LRWs decreased *** percent by quantity and *** percent by value from 2017 to 2019. Total U.S. imports of residential washers decreased by *** percent by quantity and by *** percent by value from 2017 to 2019. The quantities of U.S. imports of LRWs and residential washers were *** and *** percent lower, respectively, in January-June 2020 than in January-June 2019, and were *** and *** percent lower by value.2 The average unit value of imports of LRWs increased by *** percent from 2017 to 2019, while the average unit value of total imports of residential washers increased by *** percent over the same period. The average unit value of LRWs and residential washers were both *** percent lower in January-June 2020 than in January-June 2019.
U.S. imports of LRWs followed a similar downward trend for each main source. Imports of LRWs from China declined by *** percent, by quantity, between 2017 and 2019, after the issuance of an antidumping order on LRWs from China on February 6, 2017, and were *** percent lower in 2019 than in 2018. U.S. imports of LRWs from China were *** units in January-June 2020 compared to *** in January-June 2019.3 U.S. imports of LRWs from Korea decreased by *** percent between 2017 and 2019, and were *** percent lower in
1 Appendix G presents imports based on official imports statistics. 2 In 2019, *** percent of imports of LRWs for the year were imported from January to June. During
the Monitoring investigation, LG explained that competition with Samsung to import LRWs within the annual quota drove a substantial increase in import quantities in January-March 2019 as compared with January-March 2018. Monitoring Publication, p. III-15, fn. 35. Effective January 23, 2020, the President issued Proclamation 9979, implementing quarterly allocation for the quota. To Further Facilitate Positive Adjustment to Competition From Imports of Large Residential Washers, January 28, 2020, 85 FR 5125. Accordingly, the lower volume of imports in January-June 2020 compared to January-June 2019 reflects that importers could use only half of the annual quota in the first half of 2020. See hearing transcript, p. 285, (Porter).
3 ***.

V-2
January-June 2020 than in January-June 2019. There were no imports of LRWs from Mexico.4 U.S. imports of LRWs from Thailand decreased by *** percent between 2017 and 2019 and were *** percent lower in January-June 2020 than in January-June 2019. Imports of LRWs from Vietnam decreased by *** percent from 2017 to 2019, and were *** percent lower in January-June 2020 than in January-June 2019. The imports reported for all other sources are attributable to ***, which imported *** of covered parts from *** in 2019.5
The average unit value of imports from Korea, which were the highest of LRWs imported from any source, decreased by *** percent from 2017 to 2019. Imports of covered parts from Korea were *** percent higher in January-June 2020 than in January-June 2019.6 As a result, average unit values of imports from Korea were *** percent lower in January-June 2020 than in January-June 2019.7 The average unit value of imports from Thailand increased by *** percent from 2017 to 2019, and were *** percent lower in January-June 2020 than in January-June 2019. The average unit value of imports from Vietnam increased by *** percent from 2017 to 2019, and were *** percent higher in January-June 2020 than in January-June 2019. *** imported out-of-scope top load PSC/belt/clutch washers from *** in 2017 and 2018. *** imported front load CIM/belt washers from ***. *** imports of front load CIM/belt washers from *** increased by *** percent from 2017 to 2019, and were *** percent higher than in January-June 2020 than in January-June 2019. *** imports of front load CIM/belt washers from *** decreased by *** percent from 2017 to 2019 and were *** percent lower January-June 2020 than in January-June 2019.
Table V-1 and figure V-1 present information on U.S. imports of residential washers, including LRWs and out-of-scope residential washers, based on responses to the Commission’s questionnaires.8
4 ***. Email from ***, September 30, 2020. 5 ***. 6 ***. 7 ***. LG’s posthearing brief, exh. 1, p. 40. 8 Appendix F presents imports of LRWs based on official imports statistics.

V-3
Table V-1 Residential washers: U.S. imports by source, 2017-19, January to June 2019, and January to June 2020
U.S. imports Calendar year January to June
2017 2018 2019 2019 2020 Quantity (units) U.S. imports of covered LRWs and parts from.-- China *** *** *** *** ***
Korea *** *** *** *** *** Mexico *** *** *** *** *** Thailand *** *** *** *** *** Vietnam *** *** *** *** *** All other sources *** *** *** *** ***
All import sources: covered LRWs and parts *** *** *** *** *** U.S. imports from all sources of.noncovered-- Top-load PSC/belt/clutch washers *** *** *** *** ***
Front-load CIM/belt washers *** *** *** *** *** Non-covered residential
washers *** *** *** *** *** U.S. imports of all residential washers *** *** *** *** *** Value (1,000 dollars) U.S. imports of covered LRWs and parts from.-- China *** *** *** *** ***
Korea *** *** *** *** *** Mexico *** *** *** *** *** Thailand *** *** *** *** *** Vietnam *** *** *** *** *** All other sources *** *** *** *** ***
All import sources: covered LRWs and parts *** *** *** *** *** U.S. imports from all sources of.noncovered-- Top-load PSC/belt/clutch washers *** *** *** *** ***
Front-load CIM/belt washers *** *** *** *** *** Non-covered residential
washers *** *** *** *** *** U.S. imports of all residential washers *** *** *** *** ***
Table continued on next page.

V-4
Table V-1--Continued Residential washers: U.S. imports by source, 2017-19, January to June 2019, and January to June 2020
U.S. imports Calendar year January to June
2017 2018 2019 2019 2020 Unit value (dollars per unit) U.S. imports of covered LRWs and parts from.-- China *** *** *** *** ***
Korea *** *** *** *** *** Mexico *** *** *** *** *** Thailand *** *** *** *** *** Vietnam *** *** *** *** *** All other sources *** *** *** *** ***
All import sources: covered LRWs and parts *** *** *** *** *** U.S. imports from all sources of non-covered-- Top-load PSC/belt/clutch washers *** *** *** *** ***
Front-load CIM/belt washers *** *** *** *** *** Non-covered residential washers *** *** *** *** ***
U.S. imports of all residential washers *** *** *** *** *** Share of quantity (percent) U.S. imports of covered LRWs and parts from.-- China *** *** *** *** ***
Korea *** *** *** *** *** Mexico *** *** *** *** *** Thailand *** *** *** *** *** Vietnam *** *** *** *** *** All other sources *** *** *** *** ***
All import sources: covered LRWs and parts *** *** *** *** *** U.S. imports from all sources of non-covered-- Top-load PSC/belt/clutch washers *** *** *** *** ***
Front-load CIM/belt washers *** *** *** *** *** Non-covered residential washers *** *** *** *** ***
U.S. imports of all residential washers *** *** *** *** *** Table continued on next page.

V-5
Table V-1--Continued Residential washers: U.S. imports by source, 2017-19, January to June 2019, and January to June 2020
U.S. imports Calendar year January to June
2017 2018 2019 2019 2020 Share of value (percent)
U.S. imports of covered LRWs and parts from.-- China *** *** *** *** ***
Korea *** *** *** *** *** Mexico *** *** *** *** *** Thailand *** *** *** *** *** Vietnam *** *** *** *** *** All other sources *** *** *** *** ***
All import sources: covered LRWs and parts *** *** *** *** *** U.S. imports from all sources of non-covered-- Top-load PSC/belt/clutch washers *** *** *** *** ***
Front-load CIM/belt washers *** *** *** *** *** Non-covered residential washers *** *** *** *** ***
U.S. imports of all residential washers *** *** *** *** *** Ratio to U.S. production
U.S. imports of covered LRWs and parts from.-- China *** *** *** *** ***
Korea *** *** *** *** *** Mexico *** *** *** *** *** Thailand *** *** *** *** *** Vietnam *** *** *** *** *** All other sources *** *** *** *** ***
All import sources: covered LRWs and parts *** *** *** *** *** U.S. imports from all sources of non-covered-- Top-load PSC/belt/clutch washers *** *** *** *** ***
Front-load CIM/belt washers *** *** *** *** *** Non-covered residential washers *** *** *** *** ***
U.S. imports of all residential washers *** *** *** *** *** Note.--Shares and ratios shown as "0.0" represent values greater than zero, but less than "0.05" percent. Note.--Information presented in this table encompasses both LRWs as specified by the safeguard measure and (1) top load PSC/belt/clutch washers and (2) front load CIM/belt washers. Covered imports include LRWs and covered parts from non-excluded sources as specified by the safeguard measure; non-covered imports include LRWs from excluded sources as well as (1) top load PSC/belt/clutch washers and (2) front load CIM/belt washers, regardless of source. Source: Compiled from data submitted in response to Commission questionnaires.

V-6
Figure V-1 Residential washers: U.S. imports, 2017-19, January to June 2019, and January to June 2020
* * * * * * *
Source: Compiled from data submitted in response to Commission questionnaires.
Covered parts
Tables V-2 and V-3 present U.S. imports and importers’ U.S. shipments of covered parts, respectively, by source during January 2017-June 2020, reported by ***.9 From 2017 to 2019, most of the parts were imported by ***. ***.
9 ***.

V-7
Table V-2 LRWs: U.S. imports of covered parts, by source, 2017-19, January to June 2019, and January to June 2020
U.S. imports Calendar year January to June
2017 2018 2019 2019 2020 Quantity (units) U.S. imports of covered parts from.-- China *** *** *** *** ***
Korea *** *** *** *** *** Mexico *** *** *** *** *** Thailand *** *** *** *** *** Vietnam *** *** *** *** *** All other import sources *** *** *** *** ***
All import sources *** *** *** *** *** Value (1,000 dollars)
U.S. imports of covered parts from.-- China *** *** *** *** ***
Korea *** *** *** *** *** Mexico *** *** *** *** *** Thailand *** *** *** *** *** Vietnam *** *** *** *** *** All other import sources *** *** *** *** ***
All import sources *** *** *** *** *** Unit value (dollars per unit)
U.S. imports of covered parts from.-- China *** *** *** *** ***
Korea *** *** *** *** *** Mexico *** *** *** *** *** Thailand *** *** *** *** *** Vietnam *** *** *** *** *** All other import sources *** *** *** *** ***
All import sources *** *** *** *** *** Source: Compiled from data submitted in response to Commission questionnaires.

V-8
Table V-3 LRWs: U.S. importers' U.S. shipments of covered parts, by source, 2017-19, January to June 2019, and January to June 2020
U.S. imports Calendar year January to June
2017 2018 2019 2019 2020 Quantity (units) U.S. shipments of U.S. imports of covered parts from.-- China *** *** *** *** ***
Korea *** *** *** *** *** Mexico *** *** *** *** *** Thailand *** *** *** *** *** Vietnam *** *** *** *** *** All other import sources *** *** *** *** ***
All import sources *** *** *** *** *** Value (1,000 dollars)
U.S. shipments of U.S. imports of covered parts from.-- China *** *** *** *** ***
Korea *** *** *** *** *** Mexico *** *** *** *** *** Thailand *** *** *** *** *** Vietnam *** *** *** *** *** All other import sources *** *** *** *** ***
All import sources *** *** *** *** *** Unit value (dollars per unit)
U.S. shipments of U.S. imports of covered parts from.-- China *** *** *** *** ***
Korea *** *** *** *** *** Mexico *** *** *** *** *** Thailand *** *** *** *** *** Vietnam *** *** *** *** *** All other import sources *** *** *** *** ***
All import sources *** *** *** *** *** Source: Compiled from data submitted in response to Commission questionnaires.
U.S. imports of non-covered extra-wide washers
Table V-4 presents U.S. imports of non-covered extra-wide washers,10 the vast majority of which were imported from Korea by ***, with the remainder imported from China by ***.
10 The Commission collected data on large residential washers and covered parts consistent with the scope of the safeguard remedy. The Commission also collected data for three forms of residential washers excluded from the scope of the safeguard remedy. The first two residential washers (top load PSC/belt/clutch washers and front load CIM/belt washers), were found by the Commission to be like or
(continued...)

V-9
Table V-4 LRWs: U.S. imports of non-covered extra-wide washers, 2017-19, January to June 2019, and January to June 2020
U.S. imports Calendar year January to June
2017 2018 2019 2019 2020 Extra-wide washers Quantity (units) *** *** *** *** *** Value (1,000 dollars) *** *** *** *** *** Unit value (dollars per unit) *** *** *** *** *** Share of quantity (percent) *** *** *** *** *** Share of value (percent) *** *** *** *** *** Ratio to U.S. production *** *** *** *** ***
Source: Compiled from data submitted in response to Commission questionnaires.
Monthly imports
Table V-5 and figure V-2 present monthly U.S. imports of residential washers (LRWs and excluded washers) by source during January 2017-June 2020.11 12 During this timeframe, U.S. imports peaked roughly from October 2017 to January 2018, preceding the imposition of the U.S. safeguard measure on LRWs, effective February 7, 2018.
directly competitive with LRWs. The third type of residential washers (extra-wide washers) was included in the scope of prior proceedings covering similar products from Korea and Mexico.
11 These data do not include covered parts. 12 Monthly imports from China likely include FTZ withdrawals. For further details, see Part III -
Foreign-trade zone production activities.

V-10
Table V-5 Residential washers: U.S. imports by month, January 2017 through June 2020
U.S. imports China Korea Mexico Thailand Vietnam
All other
sources
All import
sources Quantity (units)
2017.-- January 393,205 19,462 21,944 27,240 166,092 7,289 635,232
February 381,667 31,215 24,809 48,569 121,784 14,020 622,064 March 416,380 27,026 23,760 61,131 104,791 7,426 640,514 April 290,629 29,576 23,457 87,151 132,105 9,478 572,396 May 390,506 32,981 27,644 123,536 110,441 7,522 692,630 June 244,823 39,180 33,287 136,626 127,704 15,398 597,018 July 360,822 23,207 30,607 123,679 145,168 8,754 692,237 August 382,426 24,559 31,232 116,706 123,401 17,190 695,514 September 234,358 23,151 21,502 125,100 128,940 5,338 538,389 October 435,920 31,915 21,125 236,600 152,819 4,416 882,795 November 163,302 93,512 22,931 211,086 160,440 9,199 660,470 December 293,382 76,256 28,516 268,313 210,951 7,229 884,647
2018.-- January 467,142 23,756 19,275 170,362 123,246 1,270 805,051
February 418,585 13,298 31,673 15,793 19,108 3,614 502,071 March 265,338 12,302 30,618 8,189 7,085 12,611 336,143 April 357,399 12,367 27,160 25,291 42,029 5,353 469,599 May 304,457 16,889 31,463 70,787 66,040 4,484 494,120 June 423,315 13,232 25,416 67,922 71,076 4,155 605,116 July 385,320 21,396 31,300 105,305 80,717 5,690 629,728 August 365,789 40,930 34,902 122,759 121,753 2,038 688,171 September 233,024 51,083 24,879 132,455 144,030 4,876 590,347 October 278,596 17,583 31,071 14,561 19,770 3,570 365,151 November 109,919 11,168 60,512 43 156 2,541 184,339 December 81,631 10,097 64,777 107 2,806 3,928 163,346
2019.-- January 85,311 10,387 57,018 266 1,686 3,040 157,708
February 39,640 41,000 57,295 208,594 242,125 2,052 590,706 March 60,039 48,233 68,490 196,418 155,432 6,463 535,075 April 72,819 37,782 53,617 152,041 124,570 3,635 444,464 May 81,667 12,350 70,208 77 6 3,216 167,524 June 112,623 8,573 68,475 625 --- 7,422 197,718 July 52,192 14,729 37,642 218 --- 5,164 109,945 August 86,605 3,777 68,797 141 --- 5,455 164,775 September 39,571 4,807 58,761 265 --- 9,631 113,035 October 35,315 8,946 88,725 89 3,650 10,584 147,309 November 23,524 7,697 199,895 148 13,549 6,425 251,238 December 34,889 4,766 28,070 78 8,173 7,845 83,821
Table continued on next page.
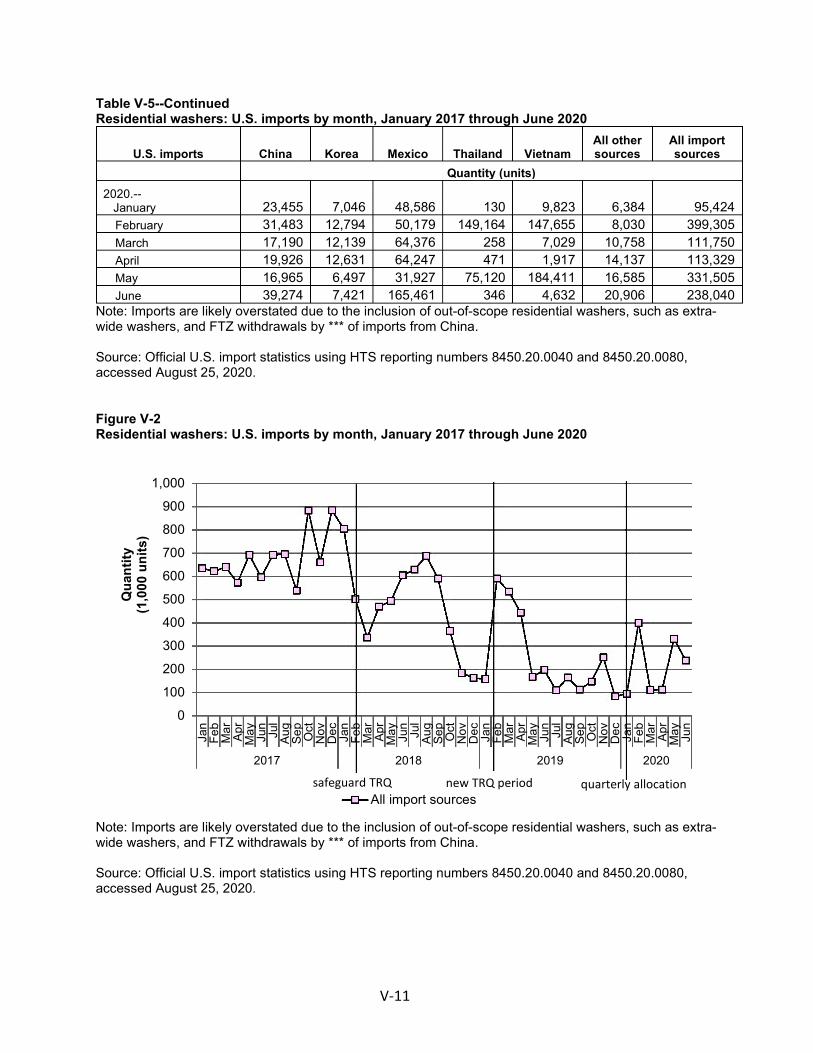
V-11
Table V-5--Continued Residential washers: U.S. imports by month, January 2017 through June 2020
U.S. imports China Korea Mexico Thailand Vietnam All other sources
All import sources
Quantity (units) 2020.-- January 23,455 7,046 48,586 130 9,823 6,384 95,424
February 31,483 12,794 50,179 149,164 147,655 8,030 399,305 March 17,190 12,139 64,376 258 7,029 10,758 111,750 April 19,926 12,631 64,247 471 1,917 14,137 113,329 May 16,965 6,497 31,927 75,120 184,411 16,585 331,505 June 39,274 7,421 165,461 346 4,632 20,906 238,040
Note: Imports are likely overstated due to the inclusion of out-of-scope residential washers, such as extra-wide washers, and FTZ withdrawals by *** of imports from China. Source: Official U.S. import statistics using HTS reporting numbers 8450.20.0040 and 8450.20.0080, accessed August 25, 2020.
Figure V-2 Residential washers: U.S. imports by month, January 2017 through June 2020
Note: Imports are likely overstated due to the inclusion of out-of-scope residential washers, such as extra-wide washers, and FTZ withdrawals by *** of imports from China. Source: Official U.S. import statistics using HTS reporting numbers 8450.20.0040 and 8450.20.0080, accessed August 25, 2020.
0
100
200
300
400
500
600
700
800
900
1,000
Jan
Feb
Mar Ap
rM
ay Jun
Jul
Aug
Sep
Oct
Nov
Dec Jan
Feb
Mar Ap
rM
ay Jun
Jul
Aug
Sep
Oct
Nov
Dec Jan
Feb
Mar Ap
rM
ay Jun
Jul
Aug
Sep
Oct
Nov
Dec Jan
Feb
Mar Ap
rM
ay Jun
2017 2018 2019 2020
Qua
ntity
(1,0
00 u
nits
)
All import sourcessafeguard TRQ new TRQ period quarterly allocation
-0-

V-12
Imports within and exceeding the tariff-rate quota
Tables V-6 through V-8 present imports of LRWs and covered parts within and exceeding the tariff-rate quota by quarter.13 Because the tariff rate quota took effect February 7, 2018, LRWs and/or covered parts may have been imported from January 1, 2018 to February 6, 2018 without being considered in-quota or above quota. In 2018, the vast majority of in-quota imports entered in the first three quarters of the year. In 2019, importation of LRWs shifted to slightly earlier in the year, with the majority of in-quota imports entering in the first quarter, and the vast majority entering in quarters one and two. In 2020, after the shift to quarterly allocation of the tariff-rate quota effective January 23, 2020, importation was more evenly distributed among the first three quarters, with the most merchandise entering in quarter one, followed by quarter two.
13 Note that reported in-quota imports of covered parts never exceeded the annual TRQ (year 1: 50,000, year 2: 70,000, year 3: 90,000), even though above-quota imports of covered parts were reported. *** Email from ***, October 19, 2020. *** stated, ***.” Email from ***, October 19, 2020.

V-13
Table V-6 LRWs: U.S. imports by quota, January 2018 through December 2018
Item Period
Jan-Mar 18 Apr-Jun 18 Jul-Sept 18 Oct-Dec 18 Total Quantity (units)
U.S. imports of LRWs.-- In-quota *** *** *** *** ***
Above-quota *** *** *** *** *** Other *** *** *** *** *** Total *** *** *** *** ***
U.S. imports of covered parts.-- In-quota *** *** *** *** ***
Above-quota *** *** *** *** *** Other *** *** *** *** *** Total *** *** *** *** ***
U.S. imports of covered merchandise.-- In-quota *** *** *** *** ***
Above-quota *** *** *** *** *** Other *** *** *** *** *** Total *** *** *** *** ***
Source: Compiled from data submitted in response to Commission questionnaires.
Table V-7 LRWs: U.S. imports by quota, January 2019 through December 2019
Item Period
Jan-Mar 19 Apr-Jun 19 Jul-Sept 19 Oct-Dec 19 Total Quantity (units)
U.S. imports of LRWs.-- In-quota *** *** *** *** ***
Above-quota *** *** *** *** *** Other *** *** *** *** *** Total *** *** *** *** ***
U.S. imports of covered parts.-- In-quota *** *** *** *** ***
Above-quota *** *** *** *** *** Other *** *** *** *** *** Total *** *** *** *** ***
U.S. imports of covered merchandise.-- In-quota *** *** *** *** ***
Above-quota *** *** *** *** *** Other *** *** *** *** *** Total *** *** *** *** ***
Source: Compiled from data submitted in response to Commission questionnaires.
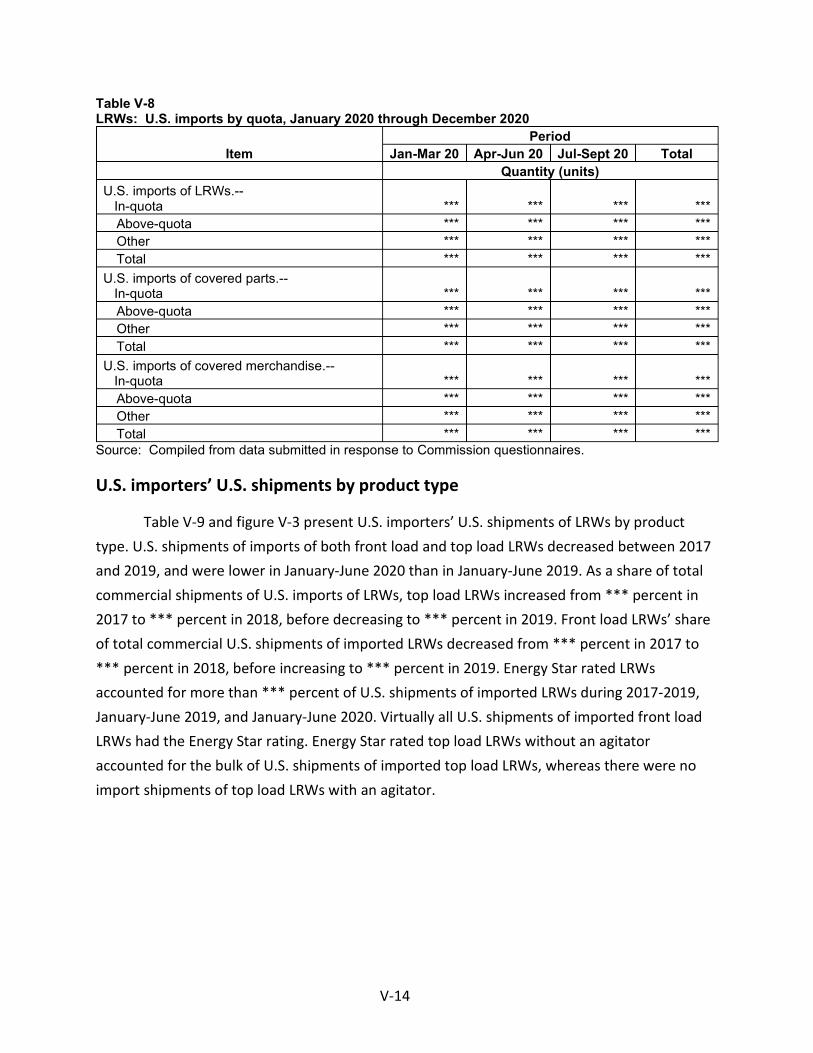
V-14
Table V-8 LRWs: U.S. imports by quota, January 2020 through December 2020
Item Period
Jan-Mar 20 Apr-Jun 20 Jul-Sept 20 Total Quantity (units)
U.S. imports of LRWs.-- In-quota *** *** *** ***
Above-quota *** *** *** *** Other *** *** *** *** Total *** *** *** ***
U.S. imports of covered parts.-- In-quota *** *** *** ***
Above-quota *** *** *** *** Other *** *** *** *** Total *** *** *** ***
U.S. imports of covered merchandise.-- In-quota *** *** *** ***
Above-quota *** *** *** *** Other *** *** *** *** Total *** *** *** ***
Source: Compiled from data submitted in response to Commission questionnaires.
U.S. importers’ U.S. shipments by product type
Table V-9 and figure V-3 present U.S. importers’ U.S. shipments of LRWs by product type. U.S. shipments of imports of both front load and top load LRWs decreased between 2017 and 2019, and were lower in January-June 2020 than in January-June 2019. As a share of total commercial shipments of U.S. imports of LRWs, top load LRWs increased from *** percent in 2017 to *** percent in 2018, before decreasing to *** percent in 2019. Front load LRWs’ share of total commercial U.S. shipments of imported LRWs decreased from *** percent in 2017 to *** percent in 2018, before increasing to *** percent in 2019. Energy Star rated LRWs accounted for more than *** percent of U.S. shipments of imported LRWs during 2017-2019, January-June 2019, and January-June 2020. Virtually all U.S. shipments of imported front load LRWs had the Energy Star rating. Energy Star rated top load LRWs without an agitator accounted for the bulk of U.S. shipments of imported top load LRWs, whereas there were no import shipments of top load LRWs with an agitator.

V-15
Table V-9 LRWs: U.S. importers' U.S. shipments by product type, 2017-19, January to June 2019, and January to June 2020
U.S. shipments Calendar year January to June
2017 2018 2019 2019 2020 Quantity (units) U.S. importer's U.S. shipments: Front-load: Energy Star *** *** *** *** ***
Front-load: Non-Energy Star *** *** *** *** *** All front-load *** *** *** *** ***
Top-load: Agitator: Energy Star *** *** *** *** *** Top-load: Agitator: Non-Energy Star *** *** *** *** *** Top-load: w/o Agitator: Energy Star *** *** *** *** *** Top-load: w/o Agitator: Non-Energy
Star *** *** *** *** *** All top-load *** *** *** *** *** All Energy Star *** *** *** *** *** All non-Energy Star *** *** *** *** ***
All complete LRWs *** *** *** *** *** Value (1,000 dollars) U.S. importer's U.S. shipments: Front-load: Energy Star *** *** *** *** ***
Front-load: Non-Energy Star *** *** *** *** *** All front-load *** *** *** *** ***
Top-load: Agitator: Energy Star *** *** *** *** *** Top-load: Agitator: Non-Energy Star *** *** *** *** *** Top-load: w/o Agitator: Energy Star *** *** *** *** *** Top-load: w/o Agitator: Non-Energy
Star *** *** *** *** *** All top-load *** *** *** *** *** All Energy Star *** *** *** *** *** All non-Energy Star *** *** *** *** ***
All complete LRWs *** *** *** *** *** Table continued on next page.

V-16
Table V-9--Continued LRWs: U.S. importers' commercial U.S. shipments by product type, 2017-19, January to June 2019, and January to June 2020
U.S. shipments Calendar year January to June
2017 2018 2019 2019 2020 Unit value (dollars per unit) U.S. importer's U.S. shipments: Front-load: Energy Star *** *** *** *** ***
Front-load: Non-Energy Star *** *** *** *** *** All front-load *** *** *** *** ***
Top-load: Agitator: Energy Star *** *** *** *** *** Top-load: Agitator: Non-Energy Star *** *** *** *** *** Top-load: w/o Agitator: Energy Star *** *** *** *** *** Top-load: w/o Agitator: Non-Energy
Star *** *** *** *** *** All top-load *** *** *** *** *** All Energy Star *** *** *** *** *** All non-Energy Star *** *** *** *** ***
All complete LRWs *** *** *** *** *** Share of quantity (percent) U.S. importer's U.S. shipments: Front-load: Energy Star *** *** *** *** ***
Front-load: Non-Energy Star *** *** *** *** *** All front-load *** *** *** *** ***
Top-load: Agitator: Energy Star *** *** *** *** *** Top-load: Agitator: Non-Energy Star *** *** *** *** *** Top-load: w/o Agitator: Energy Star *** *** *** *** *** Top-load: w/o Agitator: Non-Energy
Star *** *** *** *** *** All top-load *** *** *** *** *** All Energy Star *** *** *** *** *** All non-Energy Star *** *** *** *** ***
All complete LRWs *** *** *** *** *** Table continued on next page.

V-17
Table V-9--Continued LRWs: U.S. importers' U.S. shipments by product type, 2017-19, January to June 2019, and January to June 2020
U.S. shipments Calendar year January to June
2017 2018 2019 2019 2020 Share of value (percent) U.S. importer's U.S. shipments: Front-load: Energy Star *** *** *** *** ***
Front-load: Non-Energy Star *** *** *** *** *** All front-load *** *** *** *** ***
Top-load: Agitator: Energy Star *** *** *** *** *** Top-load: Agitator: Non-Energy Star *** *** *** *** *** Top-load: w/o Agitator: Energy Star *** *** *** *** *** Top-load: w/o Agitator: Non-Energy
Star *** *** *** *** *** All top-load *** *** *** *** *** All Energy Star *** *** *** *** *** All non-Energy Star *** *** *** *** ***
All complete LRWs *** *** *** *** ***
Importers' share of overall commercial shipments in
market for each product type (percent) U.S. importer's U.S. shipments: Front-load: Energy Star *** *** *** *** ***
Front-load: Non-Energy Star *** *** *** *** *** All front-load *** *** *** *** ***
Top-load: Agitator: Energy Star *** *** *** *** *** Top-load: Agitator: Non-Energy Star *** *** *** *** *** Top-load: w/o Agitator: Energy Star *** *** *** *** *** Top-load: w/o Agitator: Non-Energy
Star *** *** *** *** *** All top-load *** *** *** *** *** All Energy Star *** *** *** *** *** All non-Energy Star *** *** *** *** ***
All complete LRWs *** *** *** *** *** Note.--Shares and ratios shown as "0.0" represent values greater than zero, but less than "0.05" percent. Source: Compiled from data submitted in response to Commission questionnaires.

V-18
Figure V-3 LRWs: U.S. importers' U.S. shipments by product type, 2017-19, January to June 2019, and January to June 2020
* * * * * * *
Source: Compiled from data submitted in response to Commission questionnaires.
U.S. importers’ inventories
Table V-10 presents data for U.S. importers’ end-of-period inventories of imports of LRWs held in the United States. From all sources, end-of-period inventories declined by *** percent from 2017 to 2019, and were *** percent lower in January-June 2020 than in January-June 2020. Inventories sourced from Korea decreased by *** percent from 2017 to 2019 and were *** percent lower in January-June 2020 than in January-June 2019. Inventories sourced from Thailand decreased by *** percent from 2017 to 2019 and were *** percent lower in January-June 2020 than in January-June 2019. Inventories sourced from Vietnam decreased by *** percent from 2017 to 2019 and were *** percent lower in January-June 2020 than in January-June 2019. Only inventories sourced from China, which remained relatively *** in terms of absolute volume, trended the other direction, as they increased by *** percent from 2017 to 2019 but were *** percent lower in January-June 2020 than in January-June 2019.

V-19
*** held over *** percent of the inventories in all periods from January 2017 to June 2020.14 From 2017 to 2019, *** increased its share of inventories held from *** percent in 2017, to *** percent in 2018, to *** percent in 2019.
14 LG previously stated that an inventory buildup occurred in late 2017 and early 2018, prior to the safeguard measures imposition, for strategic inventory building purposes in order to maintain LG and Samsung LRWs on the retail floor. LG stated that exporters accelerated their LRW shipments to the United States early in the safeguard quota period in 2019, before the above quota levels with higher tariff rates were reached, and that these LRWs were held in inventory to be shipped out over the remainder of the quota period. Monitoring Publication, p. III-20, fn. 41.

V-20
Table V-10 LRWs: U.S. importers' end-of-period inventories of imports by source, 2017-19, January to June 2019, and January to June 2020
Item Calendar year January to June
2017 2018 2019 2019 2020 Inventories (units); Ratios (percent)
Imports from China Inventories *** *** *** *** *** Ratio to U.S. imports *** *** *** *** *** Ratio to U.S. shipments of imports *** *** *** *** ***
Ratio to total shipments of imports *** *** *** *** *** Imports from Korea Inventories *** *** *** *** *** Ratio to U.S. imports *** *** *** *** *** Ratio to U.S. shipments of imports *** *** *** *** ***
Ratio to total shipments of imports *** *** *** *** *** Imports from Mexico Inventories *** *** *** *** *** Ratio to U.S. imports *** *** *** *** *** Ratio to U.S. shipments of imports *** *** *** *** ***
Ratio to total shipments of imports *** *** *** *** *** Imports from Thailand Inventories *** *** *** *** *** Ratio to U.S. imports *** *** *** *** *** Ratio to U.S. shipments of imports *** *** *** *** ***
Ratio to total shipments of imports *** *** *** *** *** Imports from Vietnam Inventories *** *** *** *** *** Ratio to U.S. imports *** *** *** *** *** Ratio to U.S. shipments of imports *** *** *** *** ***
Ratio to total shipments of imports *** *** *** *** *** Imports from all import sources: Inventories *** *** *** *** *** Ratio to U.S. imports *** *** *** *** *** Ratio to U.S. shipments of imports *** *** *** *** ***
Ratio to total shipments of imports *** *** *** *** *** Source: Compiled from data submitted in response to Commission questionnaires.

V-21
U.S. importers’ imports subsequent to June 30, 2020
The Commission requested importers to indicate whether they had imported or arranged for imports of LRWs and covered parts for delivery after June 30, 2020 (table V-11). Two importers reported arranged imports of complete LRWs: *** reported arranged imports from Korea Thailand and Vietnam; *** reported arranged imports from Thailand and Vietnam. *** also reported arranged imports of covered parts from all sources of *** units and *** units, respectively.
Table V-11 LRWs: Arranged imports of LRWs and covered parts, July 2020 to June 2021
Item
Period Jul-Sept
2020 Oct-Dec
2020 Jan-Mar
2021 Apr-Jun
2021 Total Quantity (units)
Arranged U.S. imports of LRWs from.-- China *** *** *** *** ***
Korea *** *** *** *** *** Mexico *** *** *** *** *** Thailand *** *** *** *** *** Vietnam *** *** *** *** ***
All other sources *** *** *** *** *** All import sources *** *** *** *** ***
Arranged U.S. imports of covered parts from.-- China *** *** *** *** ***
Korea *** *** *** *** *** Mexico *** *** *** *** *** Thailand *** *** *** *** *** Vietnam *** *** *** *** ***
All other sources *** *** *** *** *** All import sources *** *** *** *** ***
Arranged U.S. imports of LRWs and covered parts from.-- China *** *** *** *** ***
Korea *** *** *** *** *** Mexico *** *** *** *** *** Thailand *** *** *** *** *** Vietnam *** *** *** *** ***
All other sources *** *** *** *** *** All import sources *** *** *** *** ***
Source: Compiled from data submitted in response to Commission questionnaires.

V-22
Apparent U.S. consumption and U.S. market shares
Data concerning apparent U.S. consumption of LRWs are shown in table V-12 and figure V-4. U.S. producers’ U.S. shipments increased during 2017-19 by *** percent, by quantity, and *** percent, by value, and were *** and *** percent higher, respectively, in January-June 2020 than in January-June 2019. U.S. shipments of imports of LRWs decreased by *** percent, by quantity, and *** percent, by value, during 2017-19, and were lower by *** and *** percent, respectively, in January-June 2020 than in January-June 2019. These trends resulted in an overall decline in apparent U.S. consumption between 2017 and 2019, by *** percent in terms of volume but a *** percent increase in terms of value. Apparent U.S. consumption was *** percent lower in terms of quantity and *** percent lower in terms of value in January-June 2020 compared to January-June 2019. Although U.S. shipments declined for most categories of washers from 2017 to 2019, U.S. shipments of imported non-covered washers increased by *** percent over the period, and were *** percent higher in January-June 2020 than in January-June 2019.
The U.S. producers’ share of apparent U.S. consumption increased by *** percentage points from 2017 to 2019 and was *** percentage points higher in January-June 2020 than in January to June 2019, by quantity. By value, the U.S. producers’ share of apparent U.S. consumption increased by *** percentage points from 2017 to 2019 and was *** percentage points higher in January-June 2020 than in January to June 2019. U.S. imports of LRWs as a share of apparent U.S. consumption declined by *** percentage points from 2017 to 2019 and was *** percentage points lower in January-June 2020 than in January-June 2019, by quantity. The market share represented by imports from each major source country declined over both the 2017-19 period and the January-June partial year comparison period, by both quantity and value. The market share represented by imported non-covered washers, however, increased by *** percentage points over the 2017-19 period, and was *** percentage points higher in January-June 2020 than in January-June 2019.

V-23
Table V-12 LRWs: Apparent U.S. consumption, 2017-19, January to June 2019, and January to June 2020
Item Calendar year January to June
2017 2018 2019 2019 2020 Quantity (units) U.S. producers' U.S. shipments.-- Continuously operating producers *** *** *** *** ***
Non-continuously operating producers *** *** *** *** ***
All producers *** *** *** *** *** U.S. importers' U.S. shipments from.-- China *** *** *** *** ***
Korea *** *** *** *** *** Mexico *** *** *** *** *** Thailand *** *** *** *** *** Vietnam *** *** *** *** ***
All other sources *** *** *** *** *** All import sources *** *** *** *** ***
U.S. importers' U.S. shipments from all sources of.-- Top-load PSC/belt/clutch washers *** *** *** *** ***
Front-load CIM/belt washers *** *** *** *** *** All import sources: Non-
covered residential washers *** *** *** *** *** All import sources: All washers *** *** *** *** *** Apparent U.S. consumption *** *** *** *** ***
Table continued on next page.

V-24
Table V-12--Continued LRWs: Market shares, 2017-19, January to June 2019, and January to June 2020
Item Calendar year January to June
2017 2018 2019 2019 2020 Value (1,000 dollars) U.S. producers' U.S. shipments.-- Continuously operating producers *** *** *** *** ***
Non-continuously operating producers *** *** *** *** *** All producers *** *** *** *** ***
U.S. importers' U.S. shipments from.-- China *** *** *** *** ***
Korea *** *** *** *** *** Mexico *** *** *** *** *** Thailand *** *** *** *** *** Vietnam *** *** *** *** ***
All other sources *** *** *** *** *** All import sources *** *** *** *** ***
U.S. importers' U.S. shipments from all sources of.-- Top-load PSC/belt/clutch washers *** *** *** *** ***
Front-load CIM/belt washers *** *** *** *** *** All import sources: Non-covered
residential washers *** *** *** *** *** All import sources: All washers *** *** *** *** *** Apparent U.S. consumption *** *** *** *** ***
Table continued on next page.
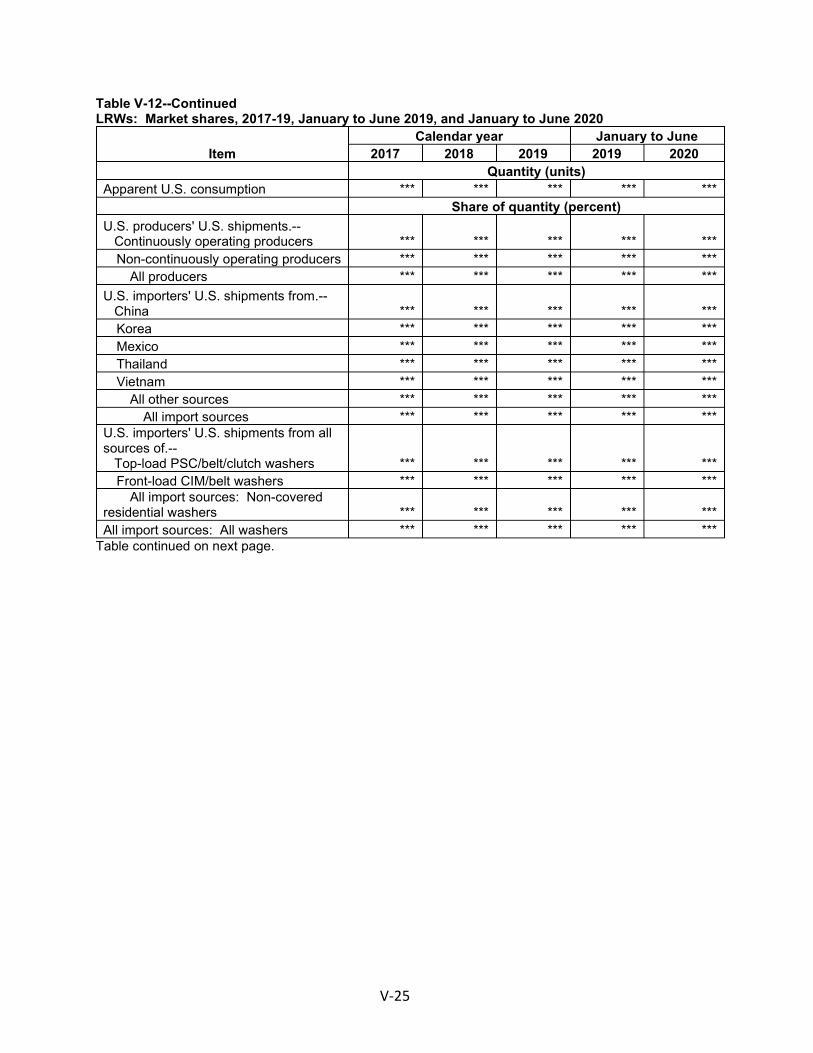
V-25
Table V-12--Continued LRWs: Market shares, 2017-19, January to June 2019, and January to June 2020
Item Calendar year January to June
2017 2018 2019 2019 2020 Quantity (units) Apparent U.S. consumption *** *** *** *** *** Share of quantity (percent) U.S. producers' U.S. shipments.-- Continuously operating producers *** *** *** *** ***
Non-continuously operating producers *** *** *** *** *** All producers *** *** *** *** ***
U.S. importers' U.S. shipments from.-- China *** *** *** *** ***
Korea *** *** *** *** *** Mexico *** *** *** *** *** Thailand *** *** *** *** *** Vietnam *** *** *** *** ***
All other sources *** *** *** *** *** All import sources *** *** *** *** ***
U.S. importers' U.S. shipments from all sources of.-- Top-load PSC/belt/clutch washers *** *** *** *** ***
Front-load CIM/belt washers *** *** *** *** *** All import sources: Non-covered
residential washers *** *** *** *** *** All import sources: All washers *** *** *** *** ***
Table continued on next page.

V-26
Table V-12--Continued LRWs: Market shares, 2017-19, January to June 2019, and January to June 2020
Item Calendar year January to June
2017 2018 2019 2019 2020 Value (1,000 dollars) Apparent U.S. consumption *** *** *** *** *** Share of value (percent) U.S. producers' U.S. shipments.-- Continuously operating producers *** *** *** *** ***
Non-continuously operating producers *** *** *** *** *** All producers *** *** *** *** ***
U.S. importers' U.S. shipments from.-- China *** *** *** *** ***
Korea *** *** *** *** *** Mexico *** *** *** *** *** Thailand *** *** *** *** *** Vietnam *** *** *** *** ***
All other sources *** *** *** *** *** All import sources *** *** *** *** ***
U.S. importers' U.S. shipments from all sources of.-- Top-load PSC/belt/clutch washers *** *** *** *** ***
Front-load CIM/belt washers *** *** *** *** *** All import sources: Non-covered
residential washers *** *** *** *** *** All import sources: All washers *** *** *** *** ***
Note.—Information presented in this table encompasses both LRWs as specified by the safeguard measure and (1) top load PSC/belt/clutch washers and (2) front load CIM/belt washers. Note.--Shares and ratios shown as "0.0" represent values greater than zero, but less than "0.05" percent. Source: Compiled from data submitted in response to Commission questionnaires.

V-27
Figure V-4 LRWs: Apparent U.S. consumption, 2017-19, January to June 2019, and January to June 2020
* * * * * * *
Source: Compiled from data submitted in response to Commission questionnaires.
U.S. producers’ and U.S. importers’ U.S. shipments by product type
Table V-13 and figure V-5 present data for U.S. producers’ and U.S. importers’ U.S. shipments by washer type (i.e., front load or top load) for 2019, by quantity. U.S. producers’ U.S. shipments of LRWs were *** percent top load and *** percent front load. By comparison, U.S. importers’ U.S. shipments were *** percent front load and *** percent top load. U.S. producers’ market share for top load washers was *** percent and their market share for front load washers was *** percent. Importers’ U.S. shipments of front load washers were primarily sourced from Vietnam (*** percent market share) whereas importers’ shipments of top load washers were primarily sourced from Thailand (*** percent market share).

V-28
Table V-13 LRWs: U.S. producers' and U.S. importers' U.S. shipments by washer type, 2019
Source
U.S. shipments Front load washers
Top load washers All types
Quantity (units) U.S. producers *** *** *** U.S. importers.-- China *** *** ***
Korea *** *** *** Mexico *** *** *** Thailand *** *** *** Vietnam *** *** *** All other sources *** *** ***
All import sources *** *** *** Combined U.S. producers and U.S. importers *** *** ***
Share across (percent) U.S. producers *** *** *** U.S. importers.-- China *** *** ***
Korea *** *** *** Mexico *** *** *** Thailand *** *** *** Vietnam *** *** *** All other sources *** *** ***
All import sources *** *** *** Combined U.S. producers and U.S. importers *** *** ***
Share down (percent) U.S. producers *** *** *** U.S. importers.-- China *** *** ***
Korea *** *** *** Mexico *** *** *** Thailand *** *** *** Vietnam *** *** *** All other sources *** *** ***
All import sources *** *** *** Combined U.S. producers and U.S. importers *** *** ***
Note.--Shares and ratios shown as "0.0" represent values greater than zero, but less than "0.05" percent. Source: Compiled from data submitted in response to Commission questionnaires.

V-29
Figure V-5 LRWs: Share of U.S. shipments by washer type, 2019
* * * * * * *
Source: Compiled from data submitted in response to Commission questionnaires.
Table V-14 and figure V-6 present data for U.S. producers’ and U.S. importers’ U.S. shipments by Energy Star rating for 2019, by quantity. U.S. producers’ U.S. shipments consisted of *** percent Energy Star washers and *** percent non-Energy Star washers in 2019. By comparison, *** percent of U.S importers’ U.S. shipments were Energy Star washers and *** were non-Energy Star washers. Importers’ U.S. shipments of energy star washers were sourced primarily from Vietnam, while their shipments of non-energy star washers were sourced primarily from Thailand.

V-30
Table V-14 LRWs: U.S. producers' and U.S. importers' U.S. shipments by Energy Star rating, 2019
Source
U.S. shipments
Energy Star washers
Non-Energy Star
washers All types Quantity (units)
U.S. producers *** *** *** U.S. importers.-- China *** *** ***
Korea *** *** *** Mexico *** *** *** Thailand *** *** *** Vietnam *** *** *** All other sources *** *** ***
All import sources *** *** *** Combined U.S. producers and U.S. importers *** *** ***
Share across (percent) U.S. producers *** *** *** U.S. importers.-- China *** *** ***
Korea *** *** *** Mexico *** *** *** Thailand *** *** *** Vietnam *** *** *** All other sources *** *** ***
All import sources *** *** *** Combined U.S. producers and U.S. importers *** *** ***
Share down (percent) U.S. producers *** *** *** U.S. importers.-- China *** *** ***
Korea *** *** *** Mexico *** *** *** Thailand *** *** *** Vietnam *** *** *** All other sources *** *** ***
All import sources *** *** *** Combined U.S. producers and U.S. importers *** *** ***
Note: Shares and ratios shown as "0.0" represent values greater than zero, but less than "0.05" percent. Source: Compiled from data submitted in response to Commission questionnaires.

V-31
Figure V-6 LRWs: U.S. producers' and U.S. importers' U.S. shipments by energy rating, 2019
* * * * * * *
Source: Compiled from data submitted in response to Commission questionnaires.


VI-1
The foreign industry
The industry in North America
The Industry in Canada
The Commission did not receive any questionnaire responses from producers or exporters of LRWs in Canada. There is no known production of LRWs in Canada.1
The Industry in Mexico
The Commission issued foreign producers’ or exporters’ questionnaires to five firms believed to produce and/or export LRWs from Mexico. Usable responses were received from four firms: Controladora Mabe, S.A. de C.V. (“Mabe”); Electrolux Home Products de Mexico, S.A. de C.V. (“Electrolux Mexico”); Samsung Electronics Digital Appliances Mexico, S.A. de C.V. (“Samsung Mexico”); and Whirlpool Overseas Manufacturing Sarl (“Whirlpool Mexico”).2 There were no imports of LRWs from Mexico from January 2017 to June 2020. According to estimates requested of the responding producers in Mexico, the production of LRWs in Mexico reported in questionnaires accounts for at least *** percent of overall 2019 production of LRWs in Mexico.3 Table VI-1 presents information on the responding producers in Mexico.
1 ***. 2 Daewoo México, the other Mexican firm that was issued a questionnaire, did not provide a
response. 3 Estimate is based on responses of ***.
Part VI:

VI-2
Table VI-1 LRWs: Summary data on firms in Mexico, 2019
Firm Production
(units)
Share of reported
production (percent)
Exports to the United States (units)
Share of reported exports to the United States
(percent)
Total shipments
(units)
Share of firm's total
shipments exported
to the United States
(percent) Electrolux *** *** *** *** *** *** Mabe *** *** *** *** *** *** Samsung Mexico *** *** *** *** *** *** Whirlpool Mexico *** *** *** *** *** ***
All firms *** *** *** *** *** *** Note.--Shares and ratios shown as "0.0" represent values greater than zero, but less than "0.05" percent. Source: Compiled from data submitted in response to Commission questionnaires.
Changes in operations
As presented in table VI-2 producers in Mexico reported several operational and organizational changes since January 1, 2017. Table VI-2 LRWs: Reported changes in operations by producers in Mexico, since January 1, 2017
Item / Firm Reported changed in operations Expansions: *** *** Revised labor agreements: *** *** Other: *** ***
Source: Compiled from data submitted in response to Commission questionnaires.
Operations on LRWs4
In 2019, the responding firms in Mexico produced *** LRWs and exported *** percent of their total shipments to the U.S. market. Production decreased by *** percent from 2017 to 2019 while exports to the United States remained ***. Capacity in Mexico increased *** percent from *** units in 2017 to *** units in 2019. Capacity
4 Operations data does not include covered parts.
I
I
I
I

VI-3
utilization decreased *** percentage points from 2017 to 2019 and was *** percentage points lower in January-June 2020 than in January-June 2019.
Electrolux Mexico reported that ***. Mabe is a subsidiary company of Chinese company Qingdao Haier Shareholding Co. Ltd.,
which is also the owner of Haier USA (GE Appliances). Mabe stated that its ***. Mabe reported that ***. Mabe reported that its production of LRWs *** from *** units in 2017 to *** units in 2019. In 2019, ***.
Samsung Mexico reported that its production of LRWs *** from *** units in 2017 to *** units in 2019. It also reported that its LRWs production capacity decreased from *** units in 2017 to *** units in 2019. Samsung Mexico reported that ***. Samsung Mexico reported that home market shipments comprised *** percent of its shipments in 2019 (down from *** percent in 2017) and exports to all other markets (namely Chile, Colombia, Ecuador, and Peru) comprised the remaining *** percent of shipments in 2019.
Whirlpool Mexico reported that ***. Whirlpool Mexico reported that its production of LRWs *** from *** units in 2017 to *** units in 2019. Whirlpool Mexico reported *** in home market shipments from *** units in 2017 to *** units in 2019. Whirlpool Mexico reported that home market shipments comprised *** percent of its shipments in 2017 and *** percent of its shipments in 2019.
Table VI-3 presents information on the LRWs operations of the responding producers and exporters in Mexico.

VI-4
Table VI-3 LRWs: Data on industry in Mexico, 2017-19, January to June 2019, and January to June 2020
Item
Actual experience Calendar year January to June
2017 2018 2019 2019 2020 Quantity (units) Capacity *** *** *** *** *** Production *** *** *** *** *** End-of-period inventories *** *** *** *** *** Shipments: Home market shipments: Internal consumption/ transfers *** *** *** *** ***
Commercial home market shipments *** *** *** *** ***
Total home market shipments *** *** *** *** *** Export shipments to:
United States *** *** *** *** *** European Union *** *** *** *** *** Canada *** *** *** *** *** Mexico *** *** *** *** *** Asia *** *** *** *** *** All other markets *** *** *** *** *** All other markets other than the
US *** *** *** *** *** Total exports *** *** *** *** ***
Total shipments *** *** *** *** *** Ratios and shares (percent) Capacity utilization *** *** *** *** *** Inventories/production *** *** *** *** *** Inventories/total shipments *** *** *** *** *** Share of shipments: Home market shipments: Internal consumption/ transfers *** *** *** *** ***
Commercial home market shipments *** *** *** *** ***
Total home market shipments *** *** *** *** *** Export shipments to:
United States *** *** *** *** *** European Union *** *** *** *** *** Canada *** *** *** *** *** Mexico *** *** *** *** *** Asia *** *** *** *** *** All other markets *** *** *** *** *** All other markets other than the
US *** *** *** *** *** Total exports *** *** *** *** ***
Total shipments *** *** *** *** *** Note.--Shares and ratios shown as "0.0" represent values greater than zero, but less than "0.05" percent. Source: Compiled from data submitted in response to Commission questionnaires.

VI-5
Alternative products
As shown in table VI-4, responding Mexico firms produced other products on the same equipment and machinery used to produce LRWs. *** reported production of other products on shared equipment. In 2019, *** percent of *** production was ***, while *** accounted for *** percent of production.5 *** reported that ***.
5 All responding Mexico firms except *** reported the ability to switch production between LRWs and other products using the same equipment and/or labor.

VI-6
Table VI-4 LRWs: Overall capacity and production on the same equipment as in-scope production by producers in Mexico, 2017-19, January to June 2019, and January to June 2020
Item Calendar year January to June
2017 2018 2019 2019 2020 Quantity (units) Overall capacity *** *** *** *** *** Production: LRWs *** *** *** *** ***
Covered parts *** *** *** *** *** Subtotal covered
merchandise *** *** *** *** *** PSC/belt drive TL washers *** *** *** *** *** CIM/belt drive FL washers *** *** *** *** *** Subtotal covered
merchandise and non-covered belt drive washers *** *** *** *** ***
Commercial washers *** *** *** *** *** Stacked washers *** *** *** *** *** Extra-wide washers *** *** *** *** *** Other products *** *** *** *** ***
Total production on same machinery *** *** *** *** *** Ratios and shares (percent) Overall capacity utilization *** *** *** *** *** Share of production: LRWs *** *** *** *** ***
Covered parts *** *** *** *** *** Covered merchandise *** *** *** *** ***
PSC/belt drive TL washers *** *** *** *** *** CIM/belt drive FL washers *** *** *** *** *** Subtotal covered
merchandise and non-covered belt drive washers *** *** *** *** ***
Commercial washers *** *** *** *** *** Stacked washers *** *** *** *** *** Extra-wide washers *** *** *** *** *** Other products *** *** *** *** ***
Total production on same machinery *** *** *** *** ***
Note.--Shares and ratios shown as "0.0" represent values greater than zero, but less than "0.05" percent. Source: Compiled from data submitted in response to Commission questionnaires.
Exports
According to GTA, the leading export markets for washers from Mexico are the United States, Canada, and Colombia (table VI-5). In 2019, the United States was the top export market
I

VI-7
for washers from Mexico, by value, accounting for 69.2 percent of total exports (all out-of-scope washers), followed by Colombia, accounting for 10.8 percent.
Table VI-5 Washers: Mexico exports by destination market, 2017-19
Destination market Calendar year
2017 2018 2019 Value (1,000 dollars) United States 222,898 158,969 109,544 Colombia 29,091 28,617 17,122 Chile 37,531 17,388 11,569 Guatemala 6,574 8,369 4,760 Peru 9,934 14,768 3,282 El Salvador 5,432 5,313 3,276 Panama 5,623 7,319 3,155 Ecuador 12,254 10,079 2,658 Honduras 3,992 3,338 914 All other destination markets 59,815 58,013 2,112
All destination markets 393,144 312,174 158,393 Share of value (percent) United States 56.7 50.9 69.2 Colombia 7.4 9.2 10.8 Chile 9.5 5.6 7.3 Guatemala 1.7 2.7 3.0 Peru 2.5 4.7 2.1 El Salvador 1.4 1.7 2.1 Panama 1.4 2.3 2.0 Ecuador 3.1 3.2 1.7 Honduras 1.0 1.1 0.6 All other destination markets 15.2 18.6 1.3
All destination markets 100.0 100.0 100.0 Note.--These GTA data for HS 8450.20, which covers household- or laundry-type washing machines, each with a dry linen capacity exceeding 10kg. This heading includes LRWs, stacked washer/dryer units having an integral frame, washing machines with payment systems for vended laundry operations, and washing machines for commercial laundry operations. Source: Official exports statistics under HS subheading 8450.20 as reported by INEGI in the Global Trade Atlas database, accessed September 28, 2020.
The industry in Asia
The Commission received foreign producers’/exporters’ responses from LRW producers in China, Korea, Thailand, and Vietnam. There is no known production of LRWs in Asia outside of these countries.
VI-8
The industry in China
The Commission issued foreign producers’ or exporters’ questionnaires to four firms believed to produce and/or export LRWs from China. Usable responses to the Commission’s questionnaire were received from all four of these firms: Nanjing LG PANDA Appliances Co., Ltd. (“LG China”), Whirlpool (China) Co., Ltd. (“Whirlpool China”), Suzhou Samsung Electronics Co., Ltd. (“Samsung China”), and Suzhou Samsung Electronics Co., Ltd.-Export (“Samsung China Export”).6 According to estimates requested of the responding China producers, the production of LRWs in China reported in questionnaires accounts for approximately *** percent of overall production of LRWs in China. There were no reported U.S. imports of LRWs from China or exports to the U.S in 2019.7 Table VI-6 presents information on the LRWs operations of the responding producers and exporters in China.
6 In China, other major residential washer producers include Hisense Kelon Electrical Holdings Co. Ltd. of the Hisense Group, Midea Group, TCL Corporation, and the Haier Group.
7 ***.

VI-9
Table VI-6 LRWs: Summary data on firms in China, 2019
Firm Production
(units)
Share of reported
production (percent)
Exports to the United
States (units)
Share of reported
exports to the United
States (percent)
Total shipments
(units)
Share of firm's total
shipments exported
to the United States
(percent) LG China *** *** *** *** *** *** Samsung China *** *** *** *** *** *** Samsung China Export *** *** *** *** *** *** Whirlpool China *** *** *** *** *** ***
All firms *** *** *** *** *** *** Note.--Shares and ratios shown as "0.0" represent values greater than zero, but less than "0.05" percent. Source: Compiled from data submitted in response to Commission questionnaires.
Changes in operations
As presented in table VI-7 producers in China reported several operational and organizational changes since January 1, 2017. ***. *** reported that after retooling, its LRWs production capacity decreased from *** units in 2017 to *** units in 2019. Table VII-7 LRWs: Reported changes in operations by producers in China, since January 1, 2017
Item / Firm Reported changed in operations Relocations: *** *** Consolidations: *** *** Other: *** ***
Source: Compiled from data submitted in response to Commission questionnaires.
Operations on LRWs8
Production of LRWs for the four responding firms decreased from *** units in 2017 to *** in 2019. Production capacity decreased by *** percent from 2017 to 2019
8 Operations data does not include covered parts.
I
I
I
I

VI-10
and the industry’s capacity utilization rate also decreased by *** percentage points from 2017 to 2019.9 ***. Exports of LRWs to all destination markets comprised between *** and *** percent of their share of commercial shipments.
*** reported that its production of LRWs *** from *** units in 2017 to *** in 2019. ***. Samsung China stated that it ***. ***. Table VI-8 presents information on the LRWs operations of responding producers and exporters in China. 10
9 Only ***. 10 *** reported production greater than capacity in some periods. Staff adjusted capacity to equal
production where production exceeded capacity.

VI-11
Table VI-8 LRWs: Data on industry in China, 2017-19, January to June 2019, and January to June 2020
Item
Actual experience Calendar year January to June
2017 2018 2019 2019 2020 Quantity (units) Capacity *** *** *** *** *** Production *** *** *** *** *** End-of-period inventories *** *** *** *** *** Shipments: Home market shipments: Internal consumption/ transfers *** *** *** *** ***
Commercial home market shipments *** *** *** *** ***
Total home market shipments *** *** *** *** *** Export shipments to:
United States *** *** *** *** *** European Union *** *** *** *** *** Canada *** *** *** *** *** Mexico *** *** *** *** *** Asia *** *** *** *** *** All other markets *** *** *** *** *** All other markets other than the US *** *** *** *** ***
Total exports *** *** *** *** *** Total shipments *** *** *** *** ***
Ratios and shares (percent) Capacity utilization *** *** *** *** *** Inventories/production *** *** *** *** *** Inventories/total shipments *** *** *** *** *** Share of shipments: Home market shipments: Internal consumption/ transfers *** *** *** *** ***
Commercial home market shipments *** *** *** *** ***
Total home market shipments *** *** *** *** *** Export shipments to:
United States *** *** *** *** *** European Union *** *** *** *** *** Canada *** *** *** *** *** Mexico *** *** *** *** *** Asia *** *** *** *** *** All other markets *** *** *** *** *** All other markets other than the US *** *** *** *** ***
Total exports *** *** *** *** *** Total shipments *** *** *** *** ***
Note.--Shares and ratios shown as "0.0" represent values greater than zero, but less than "0.05" percent. Source: Compiled from data submitted in response to Commission questionnaires.

VI-12
Alternative products
As shown in table VI-9, responding China firms produced other products on the same equipment and machinery used to produce LRWs.11 *** and *** both reported that their principal “other products” were ***. The vast majority of production on shared equipment from 2017 to 2019 was of other products, with the share of production of other products increasing from *** percent in 2017 to *** percent in 2019.
11 All responding China firms reported the ability to switch production between LRWs and other products using the same equipment and/or labor.
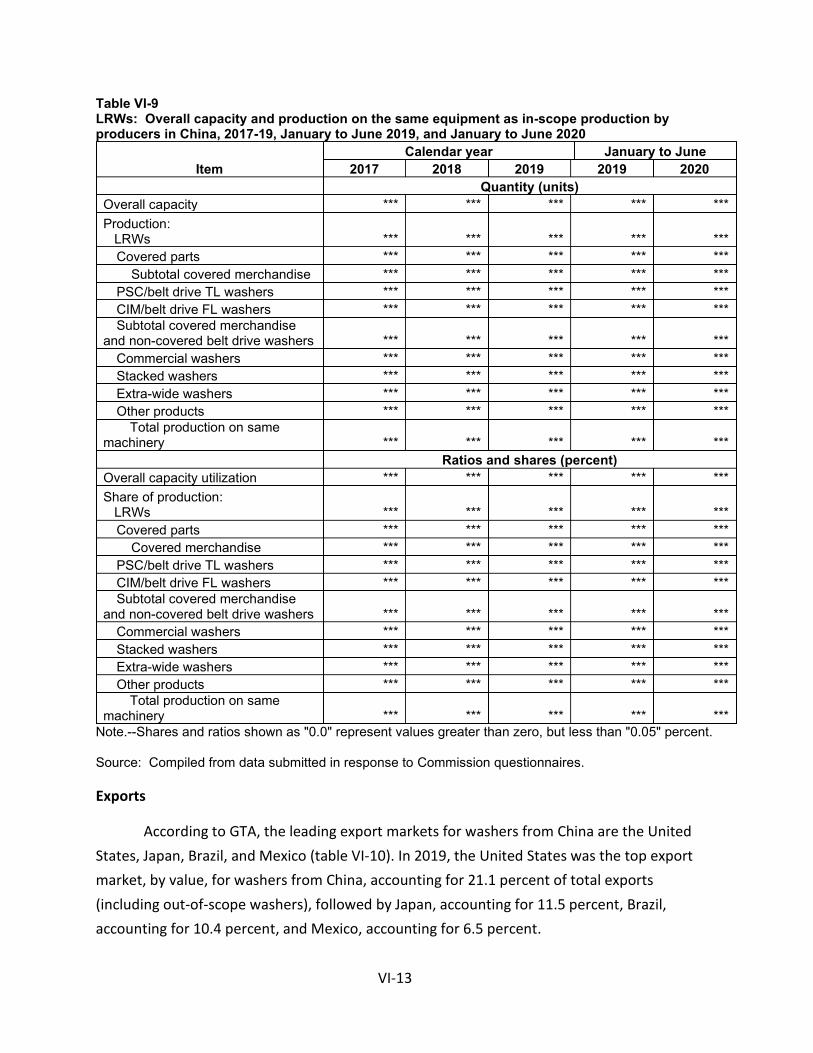
VI-13
Table VI-9 LRWs: Overall capacity and production on the same equipment as in-scope production by producers in China, 2017-19, January to June 2019, and January to June 2020
Item Calendar year January to June
2017 2018 2019 2019 2020 Quantity (units) Overall capacity *** *** *** *** *** Production: LRWs *** *** *** *** ***
Covered parts *** *** *** *** *** Subtotal covered merchandise *** *** *** *** ***
PSC/belt drive TL washers *** *** *** *** *** CIM/belt drive FL washers *** *** *** *** *** Subtotal covered merchandise
and non-covered belt drive washers *** *** *** *** *** Commercial washers *** *** *** *** *** Stacked washers *** *** *** *** *** Extra-wide washers *** *** *** *** *** Other products *** *** *** *** ***
Total production on same machinery *** *** *** *** *** Ratios and shares (percent) Overall capacity utilization *** *** *** *** *** Share of production: LRWs *** *** *** *** ***
Covered parts *** *** *** *** *** Covered merchandise *** *** *** *** ***
PSC/belt drive TL washers *** *** *** *** *** CIM/belt drive FL washers *** *** *** *** *** Subtotal covered merchandise
and non-covered belt drive washers *** *** *** *** *** Commercial washers *** *** *** *** *** Stacked washers *** *** *** *** *** Extra-wide washers *** *** *** *** *** Other products *** *** *** *** ***
Total production on same machinery *** *** *** *** ***
Note.--Shares and ratios shown as "0.0" represent values greater than zero, but less than "0.05" percent. Source: Compiled from data submitted in response to Commission questionnaires.
Exports
According to GTA, the leading export markets for washers from China are the United States, Japan, Brazil, and Mexico (table VI-10). In 2019, the United States was the top export market, by value, for washers from China, accounting for 21.1 percent of total exports (including out-of-scope washers), followed by Japan, accounting for 11.5 percent, Brazil, accounting for 10.4 percent, and Mexico, accounting for 6.5 percent.
I

VI-14
Table VI-10 Washers: China exports by destination market, 2017-19
Destination market Calendar year
2017 2018 2019 Value (1,000 dollars) United States 60,551 106,777 155,987 Japan 45,454 57,084 85,054 Brazil 55,785 44,571 76,902 Mexico 36,668 53,410 48,068 Iraq 18,960 12,220 24,171 Saudi Arabia 10,610 9,680 22,527 Algeria 2,666 18,070 20,808 Taiwan 12,233 12,157 19,129 South Africa 11,164 19,286 18,895 All other destination markets 285,408 263,511 266,633
All destination markets 539,501 596,765 738,176 Share of value (percent) United States 11.2 17.9 21.1 Japan 8.4 9.6 11.5 Brazil 10.3 7.5 10.4 Mexico 6.8 8.9 6.5 Iraq 3.5 2.0 3.3 Saudi Arabia 2.0 1.6 3.1 Algeria 0.5 3.0 2.8 Taiwan 2.3 2.0 2.6 South Africa 2.1 3.2 2.6 All other destination markets 52.9 44.2 36.1
All destination markets 100.0 100.0 100.0 Note.--These GTA data for HS 8450.20, which covers household- or laundry-type washing machines, each with a dry linen capacity exceeding 10kg. This heading includes LRWs, stacked washer/dryer units having an integral frame, washing machines with payment systems for vended laundry operations, and washing machines for commercial laundry operations. Source: Official exports statistics under HS subheading 8450.20 as reported by China Customs in the Global Trade Atlas database, accessed September 28, 2020.

VI-15
The industry in Korea
The Commission issued foreign producers’ or exporters’ questionnaires to three firms believed to produce and/or export LRWs from Korea. Usable responses were received from two firms: LG Electronics Inc. (“LG Korea”) and Samsung Electronics Co., Ltd. (“Samsung Korea”).12 According to estimates requested of the responding producers in Korea, the production of LRWs in Korea reported in questionnaires accounts for *** percent of overall 2019 production of LRWs in Korea. These firms’ reported exports to the United States accounted for approximately *** percent of reported U.S. imports of LRWs from Korea in 2019.13 Table VI-11 presents information on the LRWs operations of the responding producers and exporters in Korea. 14
Table VI-11 LRWs: Summary data on firms in Korea, 2019
Firm Production
(units)
Share of reported
production (percent)
Exports to the United States (units)
Share of reported exports to the United States
(percent)
Total shipments
(units)
Share of firm's total
shipments exported
to the United States
(percent) LG Korea *** *** *** *** *** *** Samsung Korea *** *** *** *** *** ***
All firms *** *** *** *** *** *** Source: Compiled from data submitted in response to Commission questionnaires.
Changes in operations
Table VI-12 presents changes in operations as reported by producers and exporters in Korea since January 1, 2017.
12 Daewoo Electronics, the other Korean firm that was issued a questionnaire, did not provide a response. As of the Monitoring report, Daewoo had not exported any LRWs from Korea to the United States since 2016. Large Residential Washers: Monitoring Developments in the Domestic Industry, Inv. No. TA-204-013, Confidential Staff Report, August 2019, App. D-10.
13 Staff believe that responding Korea producers and exporters account for virtually all exports of LRWs from Korea to the United States. However, reported export data for ***.
14 *** reported production greater than capacity in some periods. Staff adjusted capacity to equal production where production exceeded capacity.

VI-16
Table VI-12 LRWs: Reported changes in operations by producers in Korea, since January 1, 2017
Item / Firm Reported changed in operations Expansions: *** ***
Source: Compiled from data submitted in response to Commission questionnaires.
Operations on LRWs15
In 2017, Samsung Korea and LG Korea produced *** LRWs and exported *** percent of their total shipments to the U.S. market. In 2019, these two firms produced *** LRWs and exported *** percent of their total shipments to the U.S. market. ***. Capacity in Korea increased from *** units in 2017 to *** units in 2019, an increase of *** percent. Capacity utilization decreased from *** percent in 2017 to *** percent in 2019. Capacity in Korea was *** units January-June 2020 compared to *** units in January-June 2019, a decrease of *** percent.
Table VI-13 presents information on the LRWs operations of the responding producers and exporters in Korea.
15 Operations data does not include covered parts.
I
I

VI-17
Table VI-13 LRWs: Data on industry in Korea, 2017-19, January to June 2019, and January to June 2020
Item
Actual experience Calendar year January to June
2017 2018 2019 2019 2020 Quantity (units) Capacity *** *** *** *** *** Production *** *** *** *** *** End-of-period inventories *** *** *** *** *** Shipments: Home market shipments: Internal consumption/ transfers *** *** *** *** ***
Commercial home market shipments *** *** *** *** ***
Total home market shipments *** *** *** *** *** Export shipments to:
United States *** *** *** *** *** European Union *** *** *** *** *** Canada *** *** *** *** *** Mexico *** *** *** *** *** Asia *** *** *** *** *** All other markets *** *** *** *** *** All other markets other than the
US *** *** *** *** *** Total exports *** *** *** *** ***
Total shipments *** *** *** *** *** Ratios and shares (percent) Capacity utilization *** *** *** *** *** Inventories/production *** *** *** *** *** Inventories/total shipments *** *** *** *** *** Share of shipments: Home market shipments: Internal consumption/ transfers *** *** *** *** ***
Commercial home market shipments *** *** *** *** ***
Total home market shipments *** *** *** *** *** Export shipments to:
United States *** *** *** *** *** European Union *** *** *** *** *** Canada *** *** *** *** *** Mexico *** *** *** *** *** Asia *** *** *** *** *** All other markets *** *** *** *** *** All other markets other than the
US *** *** *** *** *** Total exports *** *** *** *** ***
Total shipments *** *** *** *** *** Note.--Shares and ratios shown as "0.0" represent values greater than zero, but less than "0.05" percent. Source: Compiled from data submitted in response to Commission questionnaires.

VI-18
Alternative products
As shown in table VI-14, responding Korea firms produced other products on the same equipment and machinery used to produce LRWs.16
16 ***.

VI-19
Table VI-14 LRWs: Overall capacity and production on the same equipment as in-scope production by producers in Korea, 2017-19, January to June 2019, and January to June 2020
Item Calendar year January to June
2017 2018 2019 2019 2020 Quantity (units) Overall capacity *** *** *** *** *** Production: LRWs *** *** *** *** ***
Covered parts *** *** *** *** *** Subtotal covered
merchandise *** *** *** *** *** PSC/belt drive TL washers *** *** *** *** *** CIM/belt drive FL washers *** *** *** *** *** Subtotal covered merchandise
and non-covered belt drive washers *** *** *** *** ***
Commercial washers *** *** *** *** *** Stacked washers *** *** *** *** *** Extra-wide washers *** *** *** *** *** Other products *** *** *** *** ***
Total production on same machinery *** *** *** *** *** Ratios and shares (percent) Overall capacity utilization *** *** *** *** *** Share of production: LRWs *** *** *** *** ***
Covered parts *** *** *** *** *** Covered merchandise *** *** *** *** ***
PSC/belt drive TL washers *** *** *** *** *** CIM/belt drive FL washers *** *** *** *** *** Subtotal covered merchandise
and non-covered belt drive washers *** *** *** *** ***
Commercial washers *** *** *** *** *** Stacked washers *** *** *** *** *** Extra-wide washers *** *** *** *** *** Other products *** *** *** *** ***
Total production on same machinery *** *** *** *** ***
Source: Compiled from data submitted in response to Commission questionnaires.

VI-20
Exports
According to GTA, the leading export markets for washers from Korea are the United States and Taiwan (table VI-15). During 2019, the United States was the top export market for LRWs from Korea, accounting for 33.3 percent, followed by the Taiwan, accounting for 14.0 percent.
Table VI-15 Washers: Korea exports by destination market, 2017-19
Destination market Calendar year
2017 2018 2019 Value (1,000 dollars) United States 263,023 139,828 114,026 Taiwan 29,224 44,263 47,951 Saudi Arabia 23,425 15,303 19,216 Mexico 16,597 20,967 15,521 Canada 14,315 12,087 11,171 Peru 10,447 8,086 10,886 China 18,179 12,683 10,317 Philippines 7,958 9,932 9,183 Thailand 7,032 6,434 9,175 All other destination markets 155,541 110,434 94,792
All destination markets 545,742 380,016 342,237 Share of value (percent) United States 48.2 36.8 33.3 Taiwan 5.4 11.6 14.0 Saudi Arabia 4.3 4.0 5.6 Mexico 3.0 5.5 4.5 Canada 2.6 3.2 3.3 Peru 1.9 2.1 3.2 China 3.3 3.3 3.0 Philippines 1.5 2.6 2.7 Thailand 1.3 1.7 2.7 All other destination markets 28.5 29.1 27.7
All destination markets 100.0 100.0 100.0 Note.--These GTA data for HS 8450.20, which covers household- or laundry-type washing machines, each with a dry linen capacity exceeding 10kg. This heading includes LRWs, stacked washer/dryer units having an integral frame, washing machines with payment systems for vended laundry operations, and washing machines for commercial laundry operations. Source: Official exports statistics under HS subheading 8450.20 as reported by Korea Customs and Trade Development Institution in the Global Trade Atlas database, accessed September 28, 2020.

VI-21
The industry in Thailand
The Commission issued foreign producers’ or exporters’ questionnaires to two firms believed to produce and/or export LRWs from Thailand. Usable responses were received from both of these firms: Thai Samsung Electronics Co., Ltd. (“Samsung Thailand”) and LG Electronics Thailand Co., Ltd. (“LG Thailand”). According to estimates requested of the responding producers in Thailand, the production of LRWs in Thailand reported in questionnaires accounts for *** percent of overall 2019 production of LRWs in Thailand. These firms’ exports to the United States accounted for virtually all of U.S. imports of LRWs from Thailand in 2019. Table VI-16 presents information on the LRWs operations of the responding producers and exporters in Thailand.
Table VI-16 LRWs: Summary data on firms in Thailand, 2019
Firm Production
(units)
Share of reported
production (percent)
Exports to the United States (units)
Share of reported exports to the United States
(percent)
Total shipments
(units)
Share of firm's total
shipments exported
to the United States
(percent) LG Thailand *** *** *** *** *** *** Samsung Thailand *** *** *** *** *** ***
All firms *** *** *** *** *** *** Source: Compiled from data submitted in response to Commission questionnaires.

VI-22
Changes in operations
As presented in table VI-17 producers in Thailand reported operational and organizational changes since January 1, 2017.
Table VI-17 LRWs: Reported changes in operations by producers in Thailand, since January 1, 2017
Item / Firm Reported changed in operations Relocations: *** *** Expansions: *** ***
Operations on LRWs17
In 2019, the responding firms in Thailand produced *** units of LRWs and exported *** percent of their total shipments to the U.S. market. Production decreased by *** percent from 2017 to 2019 and was *** percent lower in January-June 2020 than in January-June 2019. Capacity in Thailand also decreased by *** percent from 2017 to 2019 and was *** percent lower in January-June 2020 than in January-June 2019. Capacity utilization increased from *** percent in 2017 to *** percent in 2019, but was *** percent in January-June 2020 compared with *** percent in January-June 2019. The share of total shipments represented by exports decreased from *** percent in 2017 to *** percent in 2019, and was *** percent in January-June 2020 compared with *** percent in January-June 2019.
Table VI-18 presents information on the LRWs operations of the responding producers and exporters in Thailand. 18
17 Operations data does not include covered parts. 18 *** reported production greater than capacity in some periods. Staff adjusted capacity to equal
production where production exceeded capacity.
I
I
I

VI-23
Table VI-18 LRWs: Data on industry in Thailand, 2017-19, January to June 2019, and January to June 2020
Item
Actual experience Calendar year January to June
2017 2018 2019 2019 2020 Quantity (units) Capacity *** *** *** *** *** Production *** *** *** *** *** End-of-period inventories *** *** *** *** *** Shipments: Home market shipments: Internal consumption/ transfers *** *** *** *** ***
Commercial home market shipments *** *** *** *** *** Total home market shipments *** *** *** *** ***
Export shipments to: United States *** *** *** *** ***
European Union *** *** *** *** *** Canada *** *** *** *** *** Mexico *** *** *** *** *** Asia *** *** *** *** *** All other markets *** *** *** *** *** All other markets other than the US *** *** *** *** ***
Total exports *** *** *** *** *** Total shipments *** *** *** *** ***
Ratios and shares (percent) Capacity utilization *** *** *** *** *** Inventories/production *** *** *** *** *** Inventories/total shipments *** *** *** *** *** Share of shipments: Home market shipments: Internal consumption/ transfers *** *** *** *** ***
Commercial home market shipments *** *** *** *** *** Total home market shipments *** *** *** *** ***
Export shipments to: United States *** *** *** *** ***
European Union *** *** *** *** *** Canada *** *** *** *** *** Mexico *** *** *** *** *** Asia *** *** *** *** *** All other markets *** *** *** *** *** All other markets other than the US *** *** *** *** ***
Total exports *** *** *** *** *** Total shipments *** *** *** *** ***
Note.--Shares and ratios shown as "0.0" represent values greater than zero, but less than "0.05" percent. Source: Compiled from data submitted in response to Commission questionnaires.

VI-24
Alternative products
As shown in table VI-19, responding Thailand firms produced other products on the same equipment and machinery used to produce LRWs.19
Table VI-19 LRWs: Overall capacity and production on the same equipment as in-scope production by producers in Thailand, 2017-19, January to June 2019, and January to June 2020
Item Calendar year January to June
2017 2018 2019 2019 2020 Quantity (units) Overall capacity *** *** *** *** *** Production: LRWs *** *** *** *** ***
Covered parts *** *** *** *** *** Subtotal covered merchandise *** *** *** *** ***
PSC/belt drive TL washers *** *** *** *** *** CIM/belt drive FL washers *** *** *** *** *** Subtotal covered merchandise
and non-covered belt drive washers *** *** *** *** *** Commercial washers *** *** *** *** *** Stacked washers *** *** *** *** *** Extra-wide washers *** *** *** *** *** Other products *** *** *** *** ***
Total production on same machinery *** *** *** *** *** Ratios and shares (percent) Overall capacity utilization *** *** *** *** *** Share of production: LRWs *** *** *** *** ***
Covered parts *** *** *** *** *** Covered merchandise *** *** *** *** ***
PSC/belt drive TL washers *** *** *** *** *** CIM/belt drive FL washers *** *** *** *** *** Subtotal covered merchandise
and non-covered belt drive washers *** *** *** *** *** Commercial washers *** *** *** *** *** Stacked washers *** *** *** *** *** Extra-wide washers *** *** *** *** *** Other products *** *** *** *** ***
Total production on same machinery *** *** *** *** ***
Note.--Shares and ratios shown as "0.0" represent values greater than zero, but less than "0.05" percent. Source: Compiled from data submitted in response to Commission questionnaires.
19 ***.

VI-25
Exports
According to GTA, the leading export markets for washers from Thailand are the United States, Korea, and Australia (table VI-20). In 2019, the United States was the top export market for washers from Thailand, accounting for 19.8 percent of total exports, followed by Korea, accounting for 9.1 percent, and Australia, which accounted for 7.8 percent.
Table VI-20 Washers: Thailand exports by destination market, 2017-19
Destination market Calendar year
2017 2018 2019 Value (1,000 dollars) United States 183,583 74,518 84,365 Korea 27,813 33,413 38,853 Australia 9,625 27,608 33,276 Colombia 17,381 17,987 18,970 Taiwan 9,148 13,738 17,586 Canada 3,426 10,261 17,586 Ecuador 18,399 20,281 17,192 Vietnam 24,490 18,221 15,737 Peru 12,305 13,618 15,528 All other destination markets 129,564 163,113 166,136
All destination markets 435,734 392,758 425,229 Share of value (percent) United States 42.1 19.0 19.8 Korea 6.4 8.5 9.1 Australia 2.2 7.0 7.8 Colombia 4.0 4.6 4.5 Taiwan 2.1 3.5 4.1 Canada 0.8 2.6 4.1 Ecuador 4.2 5.2 4.0 Vietnam 5.6 4.6 3.7 Peru 2.8 3.5 3.7 All other destination markets 29.7 41.5 39.1
All destination markets 100.0 100.0 100.0 Note: These GTA data are for HS 8450.20, which covers household- or laundry-type washing machines, each with a dry linen capacity exceeding 10kg. This heading includes LRWs, stacked washer/dryer units having an integral frame, washing machines with payment systems for vended laundry operations, and washing machines for commercial laundry operations. Source: Official exports statistics under HS subheading 8450.20 as reported by Thai Customs Department in the Global Trade Atlas database, accessed September 28, 2020.

VI-26
The industry in Vietnam
The Commission issued foreign producers’ or exporters’ questionnaires to two firms believed to produce and/or export LRWs from Vietnam. Usable responses were received from two firms: LG Electronics Vietnam Haiphong Co., Ltd. (“LG Vietnam”) and Samsung Electronics HCMC CE Complex Co., Ltd (“Samsung Vietnam”). According to estimates requested of the responding producers in Vietnam, the production of LRWs in Vietnam reported in questionnaires accounts for *** percent of overall 2019 production of LRWs in Vietnam. These firms’ exports to the United States accounted for virtually all U.S. imports of LRWs from Vietnam in 2019. Table VI-21 presents information on the LRWs operations of the responding producers and exporters in Vietnam.
Table VI-21 LRWs: Summary data on firms in Vietnam, 2019
Firm Production
(units)
Share of reported
production (percent)
Exports to the United States (units)
Share of reported exports to the United States
(percent)
Total shipments
(units)
Share of firm's total
shipments exported
to the United States
(percent) LG Vietnam *** *** *** *** *** *** Samsung Vietnam *** *** *** *** *** ***
All firms *** *** *** *** *** *** Source: Compiled from data submitted in response to Commission questionnaires.

VI-27
Changes in operations
As presented in table VI-22, producers in Vietnam reported one operational change since January 1, 2017.
Table VI-22 LRWs: Reported changes in operations by producers in Vietnam, since January 1, 2017
Item / Firm Reported changed in operations Relocations: *** ***
Source: Compiled from data submitted in response to Commission questionnaires.
Operations on LRWs20
In 2019, the responding firms in Vietnam produced *** units of LRWs and exported *** percent of their total shipments to the U.S. market. Production decreased by *** percent from 2017 to 2019 and was *** percent lower in January-June 2020 than in January-June 2019. Capacity in Vietnam also decreased by *** percent from 2017 to 2019 and was *** percent lower in January-June 2020 than in January-June 2019.21 Capacity utilization decreased from *** percent in 2017 to *** percent in 2019, and was *** percent in January-June 2020 compared with *** percent in January-June 2019. The share of total shipments represented by exports remained above *** percent from January 2017 to June 2020, but the share of shipments represented by exports to the U.S. decreased from *** percent in 2017 to *** percent in 2019, and was *** percent in January-June 2020 compared with *** percent in January-June 2019.
Table VI-23 presents information on the LRWs operations of the responding producers and exporters in Vietnam. 22
20 Operations data does not include covered parts. 21 This decrease is largely due to *** which reported transferring production to LG Thailand and
converting to out-of-scope production. 22 *** reported production greater than capacity in some periods. Staff adjusted capacity to equal
production where production exceeded capacity.
I
I

VI-28
Table VI-23 LRWs: Data on industry in Vietnam, 2017-19, January to June 2019, and January to June 2020
Item
Actual experience Calendar year January to June
2017 2018 2019 2019 2020 Quantity (units) Capacity *** *** *** *** *** Production *** *** *** *** *** End-of-period inventories *** *** *** *** *** Shipments: Home market shipments: Internal consumption/ transfers *** *** *** *** ***
Commercial home market shipments *** *** *** *** ***
Total home market shipments *** *** *** *** *** Export shipments to:
United States *** *** *** *** *** European Union *** *** *** *** *** Canada *** *** *** *** *** Mexico *** *** *** *** *** Asia *** *** *** *** *** All other markets *** *** *** *** *** All other markets other than the
US *** *** *** *** *** Total exports *** *** *** *** ***
Total shipments *** *** *** *** *** Ratios and shares (percent) Capacity utilization *** *** *** *** *** Inventories/production *** *** *** *** *** Inventories/total shipments *** *** *** *** *** Share of shipments: Home market shipments: Internal consumption/ transfers *** *** *** *** ***
Commercial home market shipments *** *** *** *** ***
Total home market shipments *** *** *** *** *** Export shipments to:
United States *** *** *** *** *** European Union *** *** *** *** *** Canada *** *** *** *** *** Mexico *** *** *** *** *** Asia *** *** *** *** *** All other markets *** *** *** *** *** All other markets other than the
US *** *** *** *** *** Total exports *** *** *** *** ***
Total shipments *** *** *** *** *** Note.--Shares and ratios shown as "0.0" represent values greater than zero, but less than "0.05" percent. Source: Compiled from data submitted in response to Commission questionnaires.
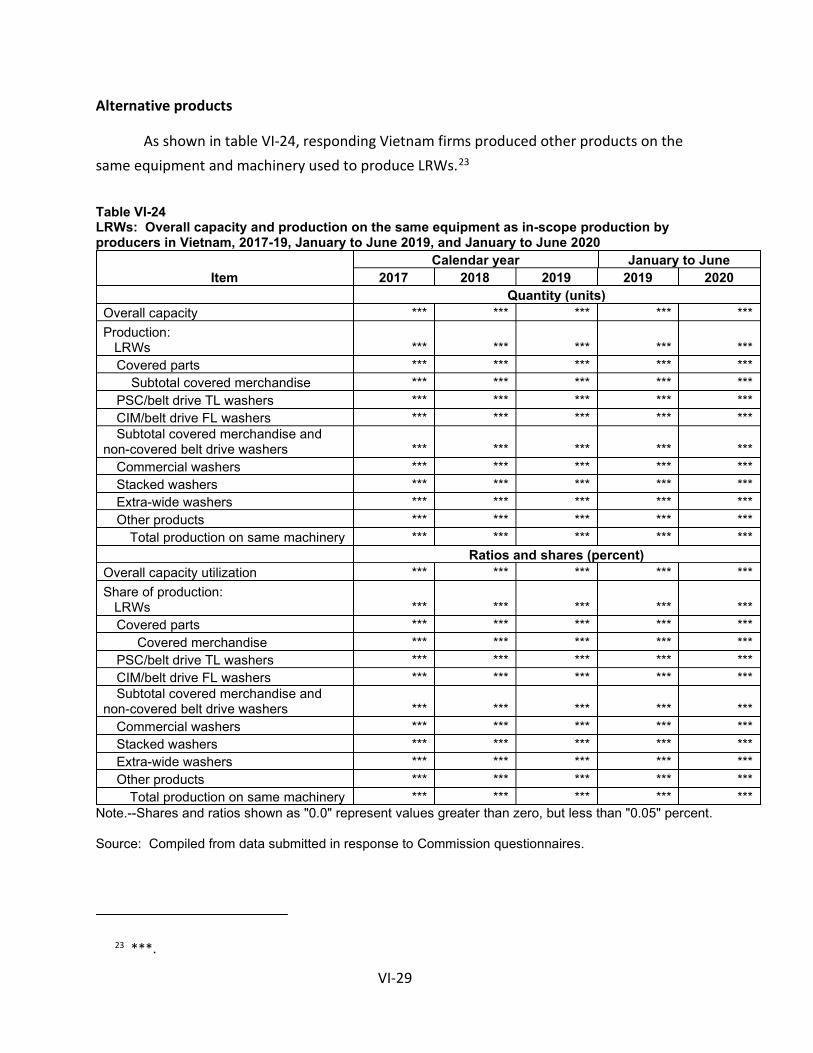
VI-29
Alternative products
As shown in table VI-24, responding Vietnam firms produced other products on the same equipment and machinery used to produce LRWs.23
Table VI-24 LRWs: Overall capacity and production on the same equipment as in-scope production by producers in Vietnam, 2017-19, January to June 2019, and January to June 2020
Item Calendar year January to June
2017 2018 2019 2019 2020 Quantity (units) Overall capacity *** *** *** *** *** Production: LRWs *** *** *** *** ***
Covered parts *** *** *** *** *** Subtotal covered merchandise *** *** *** *** ***
PSC/belt drive TL washers *** *** *** *** *** CIM/belt drive FL washers *** *** *** *** *** Subtotal covered merchandise and
non-covered belt drive washers *** *** *** *** *** Commercial washers *** *** *** *** *** Stacked washers *** *** *** *** *** Extra-wide washers *** *** *** *** *** Other products *** *** *** *** ***
Total production on same machinery *** *** *** *** *** Ratios and shares (percent) Overall capacity utilization *** *** *** *** *** Share of production: LRWs *** *** *** *** ***
Covered parts *** *** *** *** *** Covered merchandise *** *** *** *** ***
PSC/belt drive TL washers *** *** *** *** *** CIM/belt drive FL washers *** *** *** *** *** Subtotal covered merchandise and
non-covered belt drive washers *** *** *** *** *** Commercial washers *** *** *** *** *** Stacked washers *** *** *** *** *** Extra-wide washers *** *** *** *** *** Other products *** *** *** *** ***
Total production on same machinery *** *** *** *** *** Note.--Shares and ratios shown as "0.0" represent values greater than zero, but less than "0.05" percent. Source: Compiled from data submitted in response to Commission questionnaires.
23 ***.

VI-30
Exports
According to GTA, the leading export markets for washers from Vietnam are the United States, Canada, and South Korea (table VI-25). In 2019, the United States was the top export market for washers from Vietnam, accounting for 37.3 percent of total exports, followed by Korea, accounting for 31.5 percent.
Table VI-25 Washers: Vietnam exports by destination market, 2017-19
Destination market Calendar year
2017 2018 2019 Value (1,000 dollars) United States 620,442 246,799 186,052 Korea 51,417 103,867 157,129 Canada 41,992 66,406 72,615 Colombia 5,114 17,245 20,285 Peru 3,852 7,539 11,118 Mexico 2,081 17,342 8,560 France 2,094 6,687 8,232 Australia 1,717 5,637 3,965 Chile 2,213 4,784 3,571 All other destination markets 5,007 17,177 26,773
All destination markets 735,929 493,483 498,299 Share of value (percent) United States 84.3 50.0 37.3 Korea 7.0 21.0 31.5 Canada 5.7 13.5 14.6 Colombia 0.7 3.5 4.1 Peru 0.5 1.5 2.2 Mexico 0.3 3.5 1.7 France 0.3 1.4 1.7 Australia 0.2 1.1 0.8 Chile 0.3 1.0 0.7 All other destination markets 0.7 3.5 5.4
All destination markets 100.0 100.0 100.0 Note: These GTA data are for HS 8450.20, which covers household- or laundry-type washing machines, each with a dry linen capacity exceeding 10kg. This heading includes LRWs, stacked washer/dryer units having an integral frame, washing machines with payment systems for vended laundry operations, and washing machines for commercial laundry operations. Source: Official imports statistics of imports from Vietnam (constructed export statistics for Vietnam) under HS subheading 8450.20 as reported by various statistical reporting authorities in the Global Trade Atlas database, accessed September 28, 2020.

VI-31
Other residential washer industries
Whirlpool, LG, Samsung, and Electrolux are global producers of LRWs. These companies export residential washers from various production facilities to markets that include the United States, Canada, Mexico, Latin America, Australia, Saudi Arabia, Bahrain, Qatar, the United Arab Emirates, and Iraq. These companies also produce out-of-scope residential washers as well as residential dryers.
The major producers of LRWs also compete in other countries against regional producers of residential washers. In Europe, such companies include Miele & Cie. KG, BSH Hausgeräte GmbH of the Bosch Group (Germany), and the Gorenje Group (Slovenia). Much of the European residential washer production has relocated from Western Europe to Eastern Europe (principally to Poland, Slovakia, and Serbia). In Japan, Panasonic is a major residential washer producer, but has shifted production to Southeast Asia. In Turkey, the company Arçelik A.Ş. is a major regional Middle East producer of residential washers.24
One Brazilian LRWs producer, Whirlpool S.A. (“Whirlpool Brazil”), and one Colombian LRWs producer, Whirlpool Corporation on behalf of Haceb Whirlpool Industrial SAS ("Whirlpool-Colombia"), provided the Commission with foreign producers’/exporters’ questionnaire responses. According to estimates requested of the responding producers in Brazil and Colombia, the production of LRWs in Brazil and Colombia reported in questionnaires accounts for at least *** and *** percent, respectively, of overall 2019 production of LRWs in Brazil and Colombia. There were no reported U.S. imports of LRWs from Brazil or Colombia and these firms reported no exports of LRWs to the United States. Table VI-26 presents information on the LRWs operations of the responding producers and exporters in Brazil and Colombia.
24 Large Residential Washers from Korea and Mexico, Inv. No. 701-TA-488 and 731-TA-1199-1200 (Review), USITC Publication 4882, April 2019.

VI-32
Table VI-26 LRWs: Summary data on firms in Brazil and Colombia, 2019
Firm Production
(units)
Share of reported
production (percent)
Exports to the United States (units)
Share of reported exports to the United States
(percent)
Total shipments
(units)
Share of firm's total
shipments exported
to the United States
(percent) Whirlpool Brazil *** *** *** *** *** *** Whirlpool Colombia *** *** *** *** *** ***
All firms *** *** *** *** *** *** Source: Compiled from data submitted in response to Commission questionnaires.
Changes in operations
Neither producer in Brazil or Colombia reported any operational and organizational changes since January 1, 2017.
Operations on LRWs25
Table VI-27 presents information on the LRWs operations of the responding producers and exporters in Brazil and Colombia. *** reported entirely *** shipments. ***. Combined, these firms’ reported capacity utilization rate ranged from *** percent to *** percent from January 2017 to June 2020.
.
25 Operations data does not include covered parts.

VI-33
Table VI-27 LRWs: Data on industries in Brazil and Colombia, 2017-19, January to June 2019, and January to June 2020
Item
Actual experience Calendar year January to June
2017 2018 2019 2019 2020 Quantity (units) Capacity *** *** *** *** *** Production *** *** *** *** *** End-of-period inventories *** *** *** *** *** Shipments: Home market shipments: Internal consumption/ transfers *** *** *** *** ***
Commercial home market shipments *** *** *** *** ***
Total home market shipments *** *** *** *** *** Export shipments to:
United States *** *** *** *** *** European Union *** *** *** *** *** Canada *** *** *** *** *** Mexico *** *** *** *** *** Asia *** *** *** *** *** All other markets *** *** *** *** *** All other markets other than the US *** *** *** *** ***
Total exports *** *** *** *** *** Total shipments *** *** *** *** ***
Ratios and shares (percent) Capacity utilization *** *** *** *** *** Inventories/production *** *** *** *** *** Inventories/total shipments *** *** *** *** *** Share of shipments: Home market shipments: Internal consumption/ transfers *** *** *** *** ***
Commercial home market shipments *** *** *** *** ***
Total home market shipments *** *** *** *** *** Export shipments to:
United States *** *** *** *** *** European Union *** *** *** *** *** Canada *** *** *** *** *** Mexico *** *** *** *** *** Asia *** *** *** *** *** All other markets *** *** *** *** *** All other markets other than the US *** *** *** *** ***
Total exports *** *** *** *** *** Total shipments *** *** *** *** ***
Note.--Shares and ratios shown as "0.0" represent values greater than zero, but less than "0.05" percent. Source: Compiled from data submitted in response to Commission questionnaires
I

VI-34
Alternative products
As shown in table VI-28, responding Brazil and Colombia firms produced other products on the same equipment and machinery used to produce LRWs.26
26 ***

VI-35
Table VI-28 LRWs: Overall capacity and production on the same equipment as in-scope production by producers in Brazil and Colombia, 2017-19, January to June 2019, and January to June 2020
Item Calendar year January to June
2017 2018 2019 2019 2020 Quantity (units) Overall capacity *** *** *** *** *** Production: LRWs *** *** *** *** ***
Covered parts *** *** *** *** *** Subtotal covered merchandise *** *** *** *** *** PSC/belt drive TL washers *** *** *** *** *** CIM/belt drive FL washers *** *** *** *** *** Subtotal covered merchandise and
non-covered belt drive washers *** *** *** *** *** Commercial washers *** *** *** *** *** Stacked washers *** *** *** *** *** Extra-wide washers *** *** *** *** *** Other products *** *** *** *** ***
Total production on same machinery *** *** *** *** *** Ratios and shares (percent) Overall capacity utilization *** *** *** *** *** Share of production: LRWs *** *** *** *** ***
Covered parts *** *** *** *** *** Covered merchandise *** *** *** *** *** PSC/belt drive TL washers *** *** *** *** *** CIM/belt drive FL washers *** *** *** *** *** Subtotal covered merchandise and
non-covered belt drive washers *** *** *** *** *** Commercial washers *** *** *** *** *** Stacked washers *** *** *** *** *** Extra-wide washers *** *** *** *** *** Other products *** *** *** *** ***
Total production on same machinery *** *** *** *** *** Note.--Shares and ratios shown as "0.0" represent values greater than zero, but less than "0.05" percent. Source: Compiled from data submitted in response to Commission questionnaires.
Exports
According to GTA, the leading export markets for washers from Brazil are Paraguay and Mexico (table VI-29); and the leading export markets for Colombia are Ecuador and Bolivia (table VI-30).

VI-36
Table VI-29 LRWs: Brazil exports by destination market, 2017-19
Destination market Calendar year
2017 2018 2019 Value (1,000 dollars) United States 470 306 194 Paraguay 2,709 2,321 2,916 Mexico 860 1,693 1,923 Honduras 763 1,533 1,749 Bolivia 848 933 1,076 Ecuador 614 1,111 988 Peru 797 389 810 Argentina 1,468 1,176 778 Guatemala 742 998 702 All other destination markets 5,363 6,332 3,333
All destination markets 14,634 16,793 14,469 Share of value (percent) United States 3.2 1.8 1.3 Paraguay 18.5 13.8 20.2 Mexico 5.9 10.1 13.3 Honduras 5.2 9.1 12.1 Bolivia 5.8 5.6 7.4 Ecuador 4.2 6.6 6.8 Peru 5.4 2.3 5.6 Argentina 10.0 7.0 5.4 Guatemala 5.1 5.9 4.9 All other destination markets 36.6 37.7 23.0
All destination markets 100.0 100.0 100.0 Note.--Shares and ratios shown as "0.0" represent values greater than zero, but less than "0.05" percent. United States is shown at the top, all remaining top export destinations shown in descending order of 2019 data. Source: Official exports statistics under HS subheading 8450.20 as reported by SECEX – Foreign Trade Secretariat in the Global Trade Atlas database, accessed October 8, 2020.

VI-37
Table VI-30 LRWs: Colombia exports by destination market, 2017-19
Destination market Calendar year
2017 2018 2019 Value (1,000 dollars) United States --- 0 1 Ecuador 3,183 3,832 4,342 Bolivia 649 422 623 Mexico 5 524 364 El Salvador 368 106 268 Guatemala 1,367 1,242 251 Costa Rica 482 543 207 Venezuela 239 260 180 Paraguay 365 101 178 All other destination markets 1,733 842 708
All destination markets 8,391 7,873 7,120 Share of value (percent) United States --- 0.0 0.0 Ecuador 37.9 48.7 61.0 Bolivia 7.7 5.4 8.7 Mexico 0.1 6.7 5.1 El Salvador 4.4 1.4 3.8 Guatemala 16.3 15.8 3.5 Costa Rica 5.7 6.9 2.9 Venezuela 2.8 3.3 2.5 Paraguay 4.3 1.3 2.5 All other destination markets 20.7 10.7 9.9
All destination markets 100.0 100.0 100.0 Note.--Shares and ratios shown as "0.0" represent values greater than zero, but less than "0.05" percent. United States is shown at the top, all remaining top export destinations shown in descending order of 2019 data. Source: Official exports statistics under HS subheading 8450.20 as reported by Direccion de Impuestos y Aduanas Nacionales de Colombia – DIAN in the Global Trade Atlas database, accessed October 8, 2020.

VI-38
Global exports
Table VI-31 presents global exports of washing machines by exporting country. Table VI-31 Washers: Global exports by exporter, 2017-19
Exporter Calendar year
2017 2018 2019 Value (1,000 dollars) United States 331,102 328,096 343,858 China 539,501 596,765 738,176 Vietnam 735,929 493,483 498,299 Thailand 435,734 392,758 425,229 Korea 545,742 380,016 342,237 Mexico 393,144 312,174 158,393 Czech Republic 99,393 107,873 96,225 Germany 82,861 77,996 76,098 Sweden 63,587 84,259 71,300 Spain 61,763 67,775 60,654 Italy 28,393 29,073 60,447 Poland 13,507 11,964 44,439 All other exporters 147,632 161,437 153,651
All reporting exporters 3,478,286 3,043,669 3,069,004 Share of value (percent) United States 9.5 10.8 11.2 China 15.5 19.6 24.1 Vietnam 21.2 16.2 16.2 Thailand 12.5 12.9 13.9 Korea 15.7 12.5 11.2 Mexico 11.3 10.3 5.2 Czech Republic 2.9 3.5 3.1 Germany 2.4 2.6 2.5 Sweden 1.8 2.8 2.3 Spain 1.8 2.2 2.0 Italy 0.8 1.0 2.0 Poland 0.4 0.4 1.4 All other exporters 4.2 5.3 5.0
All reporting exporters 100.0 100.0 100.0 Note.--Data are likely overstated and include non-covered products (commercial washers and stacked washer-dryers). Source: Official exports statistics under HS subheading 8450.20 reported by various national statistical authorities in the Global Trade Atlas database, accessed September 28, 2020 and official global imports statistics from Vietnam under HS subheading 8450.20 as reported by Vietnam Industry and Trade Information Center in the Global Trade Atlas database, accessed September 28, 2020.

VII-1
Part VII: Pricing data
Factors affecting prices
Raw material costs
Raw materials used to produce LRWs include cold-rolled and stainless steel, copper, aluminum, plastic, propylene, crude oil, and rubber.1 Raw material costs, as a share of U.S. producers’ total COGS declined from *** percent in 2017 to *** percent in 2019. Raw material costs as a share of total COGS were *** percentage points higher in January-June 2020 than in January-June 2019.
The price of steel fluctuated during January 2017 through October 2020 (figure VII-1). The prices of cold-rolled sheet and coil steel increased irregularly and peaked in mid-2018 before declining irregularly through October 2020 to prices that were lower than in January 2017. The price changes for stainless steel cold-rolled sheet were less pronounced than those for cold-rolled steel coil but followed similar trends.
Figure VII-1 Raw material costs: U.S. price indexes of cold-rolled steel coil and stainless steel cold-rolled sheet, monthly, January 2017-October 2020
* * * * * * *
1 Original Safeguard Publication, p. V-1.

VII-2
Transportation costs
Transportation costs for LRWs shipped from subject countries to the United States averaged 7.5 percent for all import sources during 2019. These estimates were derived from official import data and represent the transportation and other charges on imports.2 During the original safeguard investigation, three responding U.S. producers and three importers reported that they typically arrange transportation to their customers.3
Pricing practices
Pricing methods, discounts, and promotional prices
During the safeguard investigation, the Commission found that typical negotiations between LRW suppliers and retailers revolve around prices and margins. Suppliers offer a minimum advertised price (“MAP”) for each LRW model, above which they will support retailers with advertising funds. Suppliers and retailers then negotiate a margin for each model, which is the difference between the MAP and the retailer’s acquisition cost net of all discounts and rebates. During special promotional periods such as Black Friday (the day after Thanksgiving), suppliers reduce the MAPs of certain models to promotional prices and generally provide the retailer with lower wholesale prices and additional discounts and rebates so as to preserve the retailer’s margins on the models. During the monitoring phase of the investigation, most responding firms had not changed their pricing methods, discount practices, or share of sales on a contract or spot basis since February 7, 2018.4
Price data
The Commission requested U.S. producers and importers to provide quarterly data for the total quantity and f.o.b. value of the following LRWs products shipped to unrelated U.S. customers during January 2017-June 2020.5
2 The estimated transportation costs were obtained by subtracting the customs value from the c.i.f. value of the imports for 2019 and then dividing by the customs value based on the HTS subheading 8450.20.0040 and 8450.20.0080.
3 Original Safeguard Publication, p. V-21. 4 Monitoring Publication, p. III-22. 5 Products 1-6 were requested in the safeguard investigation and monitoring proceeding, products 7-
8 were added in the monitoring proceeding, and products 9-10 were added in this proceeding at the request of LG and Samsung.

VII-3
Product 1.--Front loading, Energy Star rated washer; direct drive; rated DOE capacity greater than or equal to 3.7 cubic feet but less than 4.2 cubic feet; water heater included; steam cycle(s) included; no LCD display; white finish.
Product 2.--Front loading, Energy Star rated washer; direct drive; rated DOE capacity
greater than or equal to 4.2 cubic feet but less than 4.7 cubic feet; no water heater included; no steam cycle(s) included; no LCD display; white finish.
Product 3.--Top loading, Energy Star rated washer; impeller; rated DOE capacity greater
than or equal to 4.7 cubic feet but less than 5.2 cubic feet; no water heater included; no steam cycle included; lid includes clear or tinted window; white finish.
Product 4.--Top loading, Energy Star rated; impeller; rated DOE capacity greater than or
equal to 4.7 cubic feet but less than 5.2 cubic feet; water heater included; steam cycle included; lid includes clear or tinted window; white finish.
Product 5.--Front loading, Energy Star rated washer; direct drive; rated DOE capacity
greater than or equal to 4.2 cubic feet but less than 4.7 cubic feet; water heater included; steam cycle(s) included; no LCD display; white finish.
Product 6.--Top loading, Energy Star rated washer; direct drive; impeller; rated DOE
capacity greater than or equal to 4.2 cubic feet but less than 4.7 cubic feet; no water heater included; no steam cycle(s) included; solid opaque lid; white finish.
Product 7.--Front loading, Energy Star rated washer; direct drive; rated DOE capacity
greater than or equal to 4.7 cubic feet but less than 5.2 cubic feet; water heater included; steam cycle(s) included; no LCD display; white finish.
Product 8.--Front loading, Energy Star rated washer; direct drive; rated DOE capacity
greater than or equal to 4.7 cubic feet but less than 5.2 cubic feet; water heater included; steam cycle(s) included; no LCD display; non-white finish.
Product 9.-- Top loading, Energy Star rated washer; impeller; rated DOE capacity greater
than or equal to 4.7 cubic feet but less than 5.2 cubic feet; no water heater included; no steam cycle included; lid includes clear or tinted window; non-white finish.
Product 10.-- Front loading, Energy Star rated washer; direct drive; rated DOE capacity
greater than 4.2 cubic feet but less than 4.7 cubic feet; water heater included; steam cycle(s) included; no LCD display; non-white finish.

VII-4
Four U.S. producers (***) and two importers (***) provided usable pricing data for sales of the requested products, although not all firms reported pricing for all products for all quarters.6 7 Pricing data reported by these firms accounted for approximately *** percent of U.S. producers’ shipments of LRWs and *** percent of U.S. shipments of imported LRWs.
Price data for products 1-10 are presented in tables VII-1 to VII-10 and figures VII-2 to VII-11. Prices by firm are presented in appendix G and prices by country source are presented in appendix H.
6 Per-unit pricing data are calculated from total quantity and total value data provided by U.S. producers and importers. The precision and variation of these figures may be affected by rounding, limited quantities, and producer or importer estimates.
7 Two of four U.S. producers (***) reported prices that included sales to OEMs, ***. *** reported that ***.

VII-5
Table VII-1 LRWs: Weighted-average f.o.b. prices and quantities of domestic and imported product 1, by quarter, January 2017-June 2020
Period
United States Imported Price
(dollars per unit)
Quantity (units)
Price (dollars per unit)
Quantity (units)
2017: Jan.-Mar. *** *** *** *** Apr.-Jun. *** *** *** *** Jul.-Sep. *** *** *** *** Oct.-Dec. *** *** *** *** 2018: Jan.-Mar. *** *** *** *** Apr.-Jun. *** *** *** *** Jul.-Sep. *** *** *** *** Oct.-Dec. *** *** *** *** 2019: Jan.-Mar. *** *** *** *** Apr.-Jun. *** *** *** *** Jul.-Sep. *** *** *** *** Oct.-Dec. *** *** *** *** 2020: Jan.-Mar. *** *** *** *** Apr.-Jun. *** *** *** ***
Note: Product 1: Front loading, Energy Star rated washer; direct drive; rated DOE capacity greater than or equal to 3.7 cubic feet but less than 4.2 cubic feet; water heater included; steam cycle(s) included; no LCD display; white finish. Note: *** reported that the sales reported during Jul.-Sep. 2018 through Jan.-Mar. 2019 reflect sales of a *** at a low price. Source: Compiled from data submitted in response to Commission questionnaires.

VII-6
Table VII-2 LRWs: Weighted-average f.o.b. prices and quantities of domestic and imported product 2, by quarter, January 2017-June 2020
Period
United States Imported Price
(dollars per unit)
Quantity (units)
Price (dollars per unit)
Quantity (units)
2017: Jan.-Mar. *** *** *** *** Apr.-Jun. *** *** *** *** Jul.-Sep. *** *** *** *** Oct.-Dec. *** *** *** *** 2018: Jan.-Mar. *** *** *** *** Apr.-Jun. *** *** *** *** Jul.-Sep. *** *** *** *** Oct.-Dec. *** *** *** *** 2019: Jan.-Mar. *** *** *** *** Apr.-Jun. *** *** *** *** Jul.-Sep. *** *** *** *** Oct.-Dec. *** *** *** *** 2020: Jan.-Mar. *** *** *** *** Apr.-Jun. *** *** *** ***
Note: Product 2: Front loading, Energy Star rated washer; direct drive; rated DOE capacity greater than or equal to 4.2 cubic feet but less than 4.7 cubic feet; no water heater included; no steam cycle(s) included; no LCD display; white finish. Source: Compiled from data submitted in response to Commission questionnaires.

VII-7
Table VII-3 LRWs: Weighted-average f.o.b. prices and quantities of domestic and imported product 3, by quarter, January 2017-June 2020
Period
United States Imported Price
(dollars per unit)
Quantity (units)
Price (dollars per unit)
Quantity (units)
2017: Jan.-Mar. *** *** *** *** Apr.-Jun. *** *** *** *** Jul.-Sep. *** *** *** *** Oct.-Dec. *** *** *** *** 2018: Jan.-Mar. *** *** *** *** Apr.-Jun. *** *** *** *** Jul.-Sep. *** *** *** *** Oct.-Dec. *** *** *** *** 2019: Jan.-Mar. *** *** *** *** Apr.-Jun. *** *** *** *** Jul.-Sep. *** *** *** *** Oct.-Dec. *** *** *** *** 2020: Jan.-Mar. *** *** *** *** Apr.-Jun. *** *** *** ***
Note: Product3: Top loading, Energy Star rated washer; impeller; rated DOE capacity greater than or equal to 4.7 cubic feet but less than 5.2 cubic feet; no water heater included; no steam cycle included; lid includes clear or tinted window; white finish. Source: Compiled from data submitted in response to Commission questionnaires.

VII-8
Table VII-4 LRWs: Weighted-average f.o.b. prices and quantities of domestic and imported product 4, by quarter, January 2017-June 2020
Period
United States Imported Price
(dollars per unit)
Quantity (units)
Price (dollars per unit)
Quantity (units)
2017: Jan.-Mar. *** *** *** *** Apr.-Jun. *** *** *** *** Jul.-Sep. *** *** *** *** Oct.-Dec. *** *** *** *** 2018: Jan.-Mar. *** *** *** *** Apr.-Jun. *** *** *** *** Jul.-Sep. *** *** *** *** Oct.-Dec. *** *** *** *** 2019: Jan.-Mar. *** *** *** *** Apr.-Jun. *** *** *** *** Jul.-Sep. *** *** *** *** Oct.-Dec. *** *** *** *** 2020: Jan.-Mar. *** *** *** *** Apr.-Jun. *** *** *** ***
Note: Product 4: Top loading, Energy Star rated; impeller; rated DOE capacity greater than or equal to 4.7 cubic feet but less than 5.2 cubic feet; water heater included; steam cycle included; lid includes clear or tinted window; white finish. Source: Compiled from data submitted in response to Commission questionnaires.

VII-9
Table VII-5 LRWs: Weighted-average f.o.b. prices and quantities of domestic and imported product 5, January 2017-June 2020
Period
United States Imported Price
(dollars per unit)
Quantity (units)
Price (dollars per unit)
Quantity (units)
2017: Jan.-Mar. *** *** *** *** Apr.-Jun. *** *** *** *** Jul.-Sep. *** *** *** *** Oct.-Dec. *** *** *** *** 2018: Jan.-Mar. *** *** *** *** Apr.-Jun. *** *** *** *** Jul.-Sep. *** *** *** *** Oct.-Dec. *** *** *** *** 2019: Jan.-Mar. *** *** *** *** Apr.-Jun. *** *** *** *** Jul.-Sep. *** *** *** *** Oct.-Dec. *** *** *** *** 2020: Jan.-Mar. *** *** *** *** Apr.-Jun. *** *** *** ***
Note: Product 5: Front loading, Energy Star rated washer; direct drive; rated DOE capacity greater than or equal to 4.2 cubic feet but less than 4.7 cubic feet; water heater included; steam cycle(s) included; no LCD display; white finish. Source: Compiled from data submitted in response to Commission questionnaires.
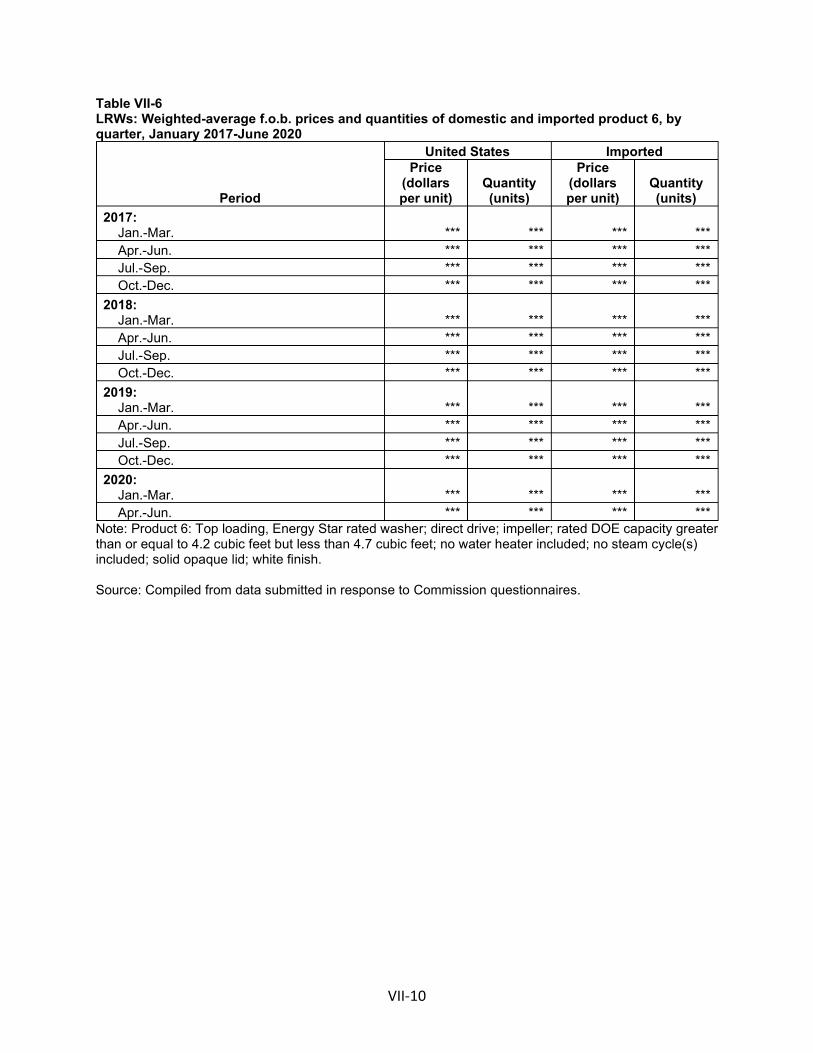
VII-10
Table VII-6 LRWs: Weighted-average f.o.b. prices and quantities of domestic and imported product 6, by quarter, January 2017-June 2020
Period
United States Imported Price
(dollars per unit)
Quantity (units)
Price (dollars per unit)
Quantity (units)
2017: Jan.-Mar. *** *** *** *** Apr.-Jun. *** *** *** *** Jul.-Sep. *** *** *** *** Oct.-Dec. *** *** *** *** 2018: Jan.-Mar. *** *** *** *** Apr.-Jun. *** *** *** *** Jul.-Sep. *** *** *** *** Oct.-Dec. *** *** *** *** 2019: Jan.-Mar. *** *** *** *** Apr.-Jun. *** *** *** *** Jul.-Sep. *** *** *** *** Oct.-Dec. *** *** *** *** 2020: Jan.-Mar. *** *** *** *** Apr.-Jun. *** *** *** ***
Note: Product 6: Top loading, Energy Star rated washer; direct drive; impeller; rated DOE capacity greater than or equal to 4.2 cubic feet but less than 4.7 cubic feet; no water heater included; no steam cycle(s) included; solid opaque lid; white finish. Source: Compiled from data submitted in response to Commission questionnaires.

VII-11
Table VII-7 LRWs: Weighted-average f.o.b. prices and quantities of domestic and imported product 7, by quarter, January 2017-June 2020
Period
United States Imported Price
(dollars per unit)
Quantity (units)
Price (dollars per unit)
Quantity (units)
2017: Jan.-Mar. *** *** *** *** Apr.-Jun. *** *** *** *** Jul.-Sep. *** *** *** *** Oct.-Dec. *** *** *** *** 2018: Jan.-Mar. *** *** *** *** Apr.-Jun. *** *** *** *** Jul.-Sep. *** *** *** *** Oct.-Dec. *** *** *** *** 2019: Jan.-Mar. *** *** *** *** Apr.-Jun. *** *** *** *** Jul.-Sep. *** *** *** *** Oct.-Dec. *** *** *** *** 2020: Jan.-Mar. *** *** *** *** Apr.-Jun. *** *** *** ***
Note: Product 7: Front loading, Energy Star rated washer; direct drive; rated DOE capacity greater than or equal to 4.7 cubic feet but less than 5.2 cubic feet; water heater included; steam cycle(s) included; no LCD display; white finish. Source: Compiled from data submitted in response to Commission questionnaires.

VII-12
Table VII-8 LRWs: Weighted-average f.o.b. prices and quantities of domestic and imported product 8, by quarter, January 2017-June 2020
Period
United States Imported Price
(dollars per unit)
Quantity (units)
Price (dollars per unit)
Quantity (units)
2017: Jan.-Mar. *** *** *** *** Apr.-Jun. *** *** *** *** Jul.-Sep. *** *** *** *** Oct.-Dec. *** *** *** *** 2018: Jan.-Mar. *** *** *** *** Apr.-Jun. *** *** *** *** Jul.-Sep. *** *** *** *** Oct.-Dec. *** *** *** *** 2019: Jan.-Mar. *** *** *** *** Apr.-Jun. *** *** *** *** Jul.-Sep. *** *** *** *** Oct.-Dec. *** *** *** *** 2020: Jan.-Mar. *** *** *** *** Apr.-Jun. *** *** *** ***
Note: Product 8: Front loading, Energy Star rated washer; direct drive; rated DOE capacity greater than or equal to 4.7 cubic feet but less than 5.2 cubic feet; water heater included; steam cycle(s) included; no LCD display; non-white finish. Source: Compiled from data submitted in response to Commission questionnaires.

VII-13
Table VII-9 LRWs: Weighted-average f.o.b. prices and quantities of domestic and imported product 9, by quarter, January 2017-June 2020
Period
United States Imported Price
(dollars per unit)
Quantity (units)
Price (dollars per unit)
Quantity (units)
2017: Jan.-Mar. *** *** *** *** Apr.-Jun. *** *** *** *** Jul.-Sep. *** *** *** *** Oct.-Dec. *** *** *** *** 2018: Jan.-Mar. *** *** *** *** Apr.-Jun. *** *** *** *** Jul.-Sep. *** *** *** *** Oct.-Dec. *** *** *** *** 2019: Jan.-Mar. *** *** *** *** Apr.-Jun. *** *** *** *** Jul.-Sep. *** *** *** *** Oct.-Dec. *** *** *** *** 2020: Jan.-Mar. *** *** *** *** Apr.-Jun. *** *** *** ***
Note: Product 9: Top loading, Energy Star rated washer; impeller; rated DOE capacity greater than or equal to 4.7 cubic feet but less than 5.2 cubic feet; no water heater included; no steam cycle included; lid includes clear or tinted window; non-white finish. Source: Compiled from data submitted in response to Commission questionnaires.

VII-14
Table VII-10 LRWs: Weighted-average f.o.b. prices and quantities of domestic and imported product 10, by quarter, January 2017-June 2020
Period
United States Imported Price
(dollars per unit)
Quantity (units)
Price (dollars per unit)
Quantity (units)
2017: Jan.-Mar. *** *** *** *** Apr.-Jun. *** *** *** *** Jul.-Sep. *** *** *** *** Oct.-Dec. *** *** *** *** 2018: Jan.-Mar. *** *** *** *** Apr.-Jun. *** *** *** *** Jul.-Sep. *** *** *** *** Oct.-Dec. *** *** *** *** 2019: Jan.-Mar. *** *** *** *** Apr.-Jun. *** *** *** *** Jul.-Sep. *** *** *** *** Oct.-Dec. *** *** *** *** 2020: Jan.-Mar. *** *** *** *** Apr.-Jun. *** *** *** ***
Note: Product 10: Front loading, Energy Star rated washer; direct drive; rated DOE capacity greater than 4.2 cubic feet but less than 4.7 cubic feet; water heater included; steam cycle(s) included; no LCD display; non-white finish. Source: Compiled from data submitted in response to Commission questionnaires.

VII-15
Figure VII-2 LRWs: Weighted-average prices and quantities of domestic and imported product 1, by quarter, January 2017-June 2020
* * * * * * *
.

VII-16
Figure VII-3 LRWs: Weighted-average prices and quantities of domestic and imported product 2, by quarter, January 2017-June 2020
* * * * * * *

VII-17
Figure VII-4 LRWs: Weighted-average prices and quantities of domestic and imported product 3, by quarter, January 2017-June 2020
* * * * * * *

VII-18
Figure VII-5 LRWs: Weighted-average prices and quantities of domestic and imported product 4, by quarter, January 2017-June 2020
* * * * * * *
VII-19
Figure VII-6 LRWs: Weighted-average prices and quantities of domestic and imported product 5, by quarter, January 2017-June 2020
* * * * * * *

VII-20
Figure VII-7 LRWs: Weighted-average prices and quantities of domestic and imported product 6, by quarter, January 2017-June 2020
* * * * * * *

VII-21
Figure VII-8 LRWs: Weighted-average prices and quantities of domestic and imported product 7, by quarter, January 2017-June 2020
* * * * * * *

VII-22
Figure VII-9 LRWs: Weighted-average prices and quantities of domestic and imported product 8, by quarter, January 2017-June 2020
* * * * * * *

VII-23
Figure VII-10 LRWs: Weighted-average prices and quantities of domestic and imported product 9, by quarter, January 2017-June 2020
* * * * * * *
VII-24
Figure VII-11 LRWs: Weighted-average prices and quantities of domestic and imported product 10, by quarter, January 2017-June 2020
* * * * * * *

VII-25
Price trends
In general, prices decreased during January 2017-June 2020. Table VII-11 summarizes the price trends, by country and by product.8 As shown in the table, domestic price decreases ranged from *** percent to *** percent during January 2017-June 2020 while import price decreases ranged from *** percent to *** percent. Import prices increased for 2 of the 10 pricing products, ranging from *** percent to *** percent.
8 Respondents claimed that because new models and new features are common in the LRW market, a particular model has a “life cycle pricing” that slowly declines over time as new models replace it. Hearing transcript, p. 243 (Anderson). The Commission found respondents’ lifecycle theory unsupported by the record in both LRWs from Korea and Mexico and LRWs from China. See LRWs from Korea and Mexico, Inv. Nos. 701-TA-488 and 731-TA-1199-1200 (Final), USITC Pub. 4378 (Feb. 2013) at 36 n.272; LRWs from China, Inv. No. 731-TA-1306 (Final), USITC Pub. 4666 (Jan. 2017) at 31 n.187.

VII-26
Table VII-11 LRWs: Summary of weighted-average f.o.b. prices for U.S.-produced and imported products 1-10
Item Number of quarters
Low price (dollars per unit)
High price (dollars per unit)
Change in price over
period1 (percent)
Product 1: United States *** *** *** ***
Imported *** *** *** *** Product 2: United States *** *** *** ***
Imported *** *** *** *** Product 3: United States *** *** *** ***
Imported *** *** *** *** Product 4: United States *** *** *** ***
Imported *** *** *** *** Product 5: United States *** *** *** ***
Imported *** *** *** *** Product 6: United States *** *** *** ***
Imported *** *** *** *** Product 7: United States *** *** *** ***
Imported *** *** *** *** Product 8: United States *** *** *** ***
Imported *** *** *** *** Product 9: United States *** *** *** ***
Imported *** *** *** *** Product 10: United States *** *** *** ***
Imported *** *** *** *** Note: Percentage change from the first quarter in which data were available to the last quarter in which price data were available. Source: Compiled from data submitted in response to Commission questionnaires.

VII-27
Indexed U.S. producer prices during January 2017 through June 2020 are shown in figure VII-12 and indexed import prices are shown in figure VII-13. Generally, U.S. prices and prices of imported LRWs increased slightly during early 2018 through early 2019, at which point prices decreased to levels approximately at or below those in 2017.
Figure VII-12 LRWs: Indexed U.S. producer prices for products 1-10, January 2017-June 2020
Source: Compiled from data submitted in response to Commission questionnaires.
0
20
40
60
80
100
120
140
Jan-
Mar
Apr-J
un
Jul-S
ep
Oct
-Dec
Jan-
Mar
Apr-J
un
Jul-S
ep
Oct
-Dec
Jan-
Mar
Apr-J
un
Jul-S
ep
Oct
-Dec
Jan-
Mar
Apr-J
un
2017 2018 2019 2020
Inde
xed
pric
es(J
an.-M
ar. 2
017
= 10
0)
U.S. producers
Product 2 Product 3 Product 4 Product 5Product 7 Product 8 Product 10

VII-28
Figure VII-13 LRWs: Indexed U.S. importer prices for products 1-10, January 2017-June 2020
Source: Compiled from data submitted in response to Commission questionnaires.
Price comparisons
As shown in table VII-12, prices for imported LRWs were below those for U.S.-produced product in 79 of 99 comparisons (corresponding to *** units of imports) and above those for U.S.-produced product in 20 instances (corresponding to *** of imports). Before the implementation of the safeguard measure (January 2017-December 2017), prices for imported LRWs were below those for U.S.-produced LRWs in 26 of 29 comparisons (*** units). During the January 2018-June 2020 period, prices for imported product were below U.S.-produced LRWs in 49 of 70 comparisons (*** units).
0
20
40
60
80
100
120
140
Jan-
Mar
Apr-J
un
Jul-S
ep
Oct
-Dec
Jan-
Mar
Apr-J
un
Jul-S
ep
Oct
-Dec
Jan-
Mar
Apr-J
un
Jul-S
ep
Oct
-Dec
Jan-
Mar
Apr-J
un
2017 2018 2019 2020
Inde
xed
pric
es(J
an.-M
ar. 2
017
= 10
0)Subject U.S. importers
Product 1 Product 2 Product 3 Product 4Product 5 Product 6 Product 7 Product 8
\
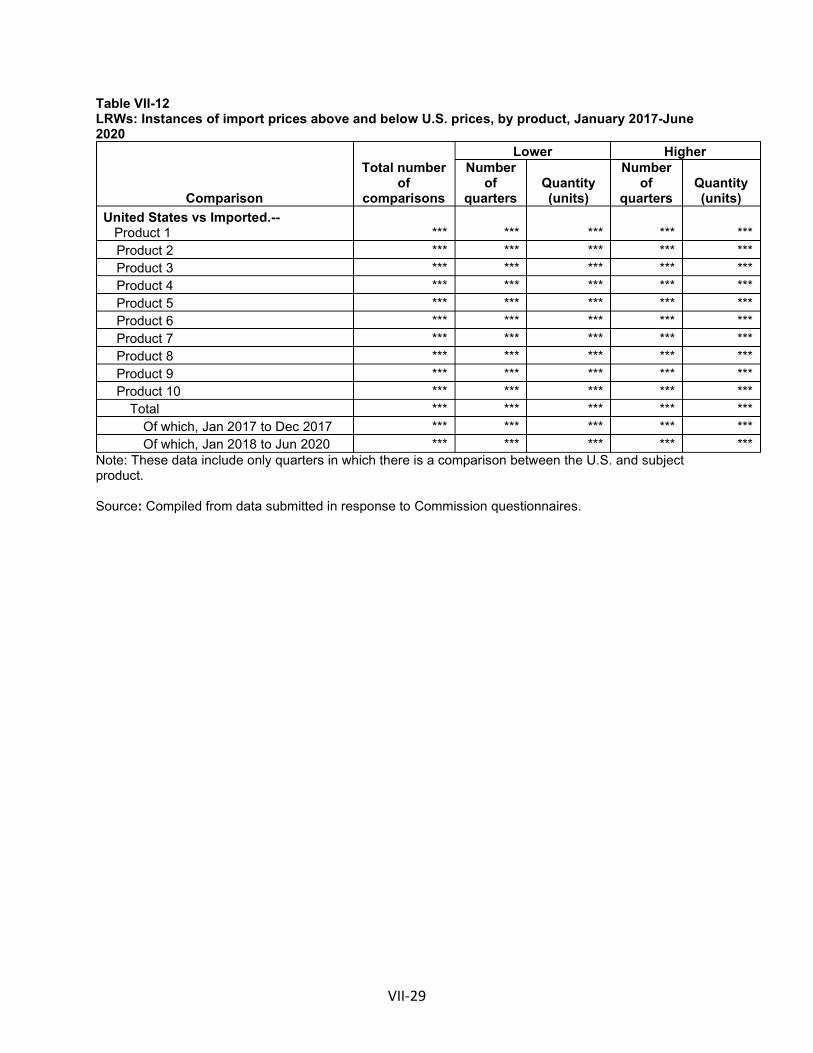
VII-29
Table VII-12 LRWs: Instances of import prices above and below U.S. prices, by product, January 2017-June 2020
Comparison
Total number of
comparisons
Lower Higher Number
of quarters
Quantity (units)
Number of
quarters Quantity (units)
United States vs Imported.-- Product 1 *** *** *** *** ***
Product 2 *** *** *** *** *** Product 3 *** *** *** *** *** Product 4 *** *** *** *** *** Product 5 *** *** *** *** *** Product 6 *** *** *** *** *** Product 7 *** *** *** *** *** Product 8 *** *** *** *** *** Product 9 *** *** *** *** *** Product 10 *** *** *** *** ***
Total *** *** *** *** *** Of which, Jan 2017 to Dec 2017 *** *** *** *** *** Of which, Jan 2018 to Jun 2020 *** *** *** *** ***
Note: These data include only quarters in which there is a comparison between the U.S. and subject product. Source: Compiled from data submitted in response to Commission questionnaires.

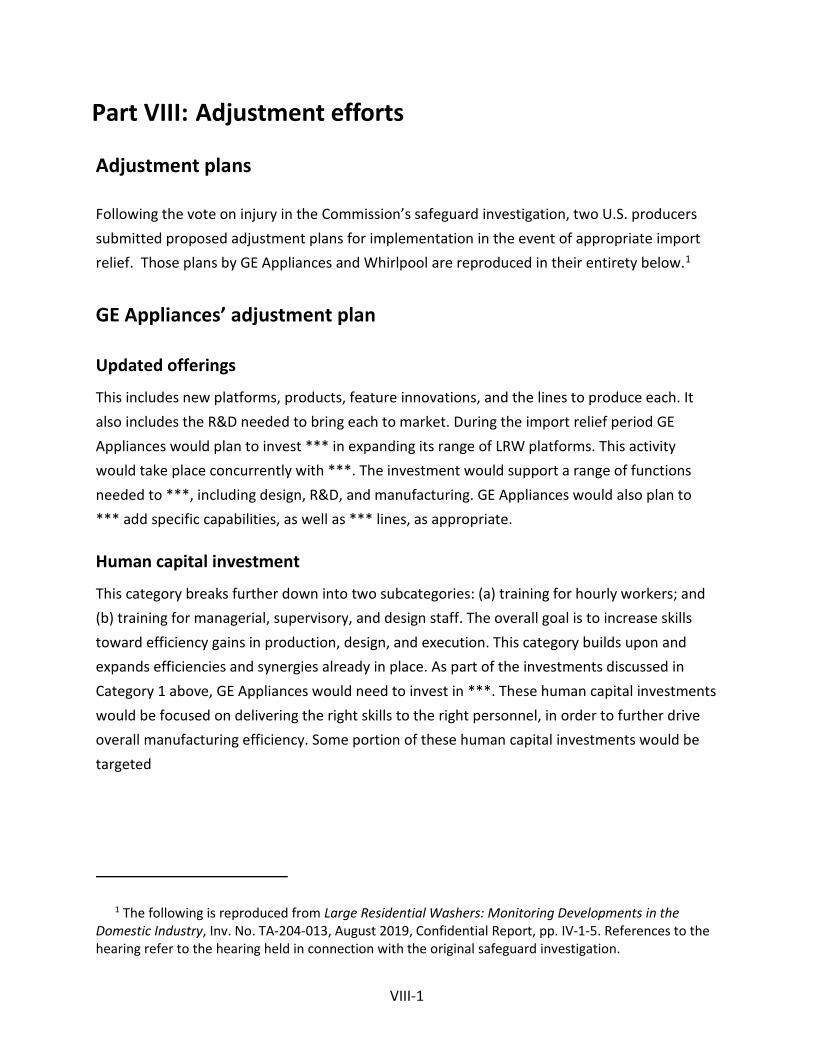
VIII-1
Part VIII: Adjustment efforts
Adjustment plans
Following the vote on injury in the Commission’s safeguard investigation, two U.S. producers submitted proposed adjustment plans for implementation in the event of appropriate import relief. Those plans by GE Appliances and Whirlpool are reproduced in their entirety below.1
GE Appliances’ adjustment plan
Updated offerings
This includes new platforms, products, feature innovations, and the lines to produce each. It also includes the R&D needed to bring each to market. During the import relief period GE Appliances would plan to invest *** in expanding its range of LRW platforms. This activity would take place concurrently with ***. The investment would support a range of functions needed to ***, including design, R&D, and manufacturing. GE Appliances would also plan to *** add specific capabilities, as well as *** lines, as appropriate.
Human capital investment
This category breaks further down into two subcategories: (a) training for hourly workers; and (b) training for managerial, supervisory, and design staff. The overall goal is to increase skills toward efficiency gains in production, design, and execution. This category builds upon and expands efficiencies and synergies already in place. As part of the investments discussed in Category 1 above, GE Appliances would need to invest in ***. These human capital investments would be focused on delivering the right skills to the right personnel, in order to further drive overall manufacturing efficiency. Some portion of these human capital investments would be targeted
1 The following is reproduced from Large Residential Washers: Monitoring Developments in the Domestic Industry, Inv. No. TA-204-013, August 2019, Confidential Report, pp. IV-1-5. References to the hearing refer to the hearing held in connection with the original safeguard investigation.

VIII-2
toward expanding and further developing the technical staff that drive the design and innovation of new products and features, toward building upon an already competitive position in product offerings.
Business process innovation
Closely tied to Human Capital Investment (Category 2, above), this category focuses on continued and increased innovation toward product design and feature innovation, while continuing to drive out costs at every opportunity. GE Appliances would plan to complement investments in the other two categories with innovation-targeted investments of ***. The purpose of these investments is to increase efficiency ***. Remaining oriented toward relieving the tension between the need to innovate and the necessity of controlling costs via developing *** is key to continuing to deliver quality, innovative products in a cost-effective manner.
GE Appliances’ post-relief efforts
GE Appliances was asked to describe (1) any efforts made by your firm and/or its workers since February 7, 2018 to compete more effectively, (2) the year in which the effort was made, (3) the expenditure involved (in thousands of dollars), and (4) the specific competitive advantage acquired (i.e., increased production, cost reduction, quality improvement, increased market share or sales, etc.). GE Appliances provided the following answer:
“***.”2
2 Domestic Producers’ Questionnaire Response of GE Appliances at Question II-2e.

VIII-3
GE Appliances was also asked to discuss reasons why any specific adjustment actions included in the above plans have not been implemented. ***.
Whirlpool’s adjustment plan3
Plans to update and expand product lineup
Revisiting Project Opportunities That Were Canceled or Curtailed During the POI
At the hearing and in its questionnaire responses, Whirlpool described several washer product projects — valued at $*** — that were canceled, curtailed, or rejected due to the serious injury caused by imports. Whirlpool remains committed to revisiting all of these investment opportunities upon the issuance of safeguard relief.
AMAX Project: In 2016, Whirlpool was forced to abort its plan to produce “jumbo” capacity front load washers. The estimated value of this investment is $***, and it represents more than *** direct jobs on a new flexible production line. Whirlpool intends to revisit the business case for this project when safeguard relief is granted.
ATLANTIS 2.0 Project: Earlier this year, Whirlpool was forced to reject a $*** investment proposal for *** — including ***. While the current pricing environment does not support a return on this proposed investment, Whirlpool expects that effective safeguard relief will enable it to revisit the business case for the project, which would facilitate increased production and corresponding job growth.
ADVANTAGE Project: In 2016, Whirlpool was forced to curtail the launch of its “jumbo” capacity top load washers — the most innovative washers in the industry — because the uneconomic pricing environment made it virtually impossible to even floor these models. If safeguard relief is granted, Whirlpool intends to revisit the business opportunity to complete this product launch. The incremental value of this investment is approximately $*** and will lead to increased capacity utilization.
3 See also Domestic Producers’ Questionnaire Response of Whirlpool at Attachment 1.

VIII-4
Evaluating Plans to Launch New Product Platforms and Innovations to Drive Future Competitiveness.
If an appropriate safeguard remedy is implemented, Whirlpool stands ready to evaluate new product platform investments totaling more than ***. These platform investments — which would ensure that ***— would promote Whirlpool’s continued future competitiveness in the washer industry and lead to greater choice with respect to washer features and innovation.
*** Projects: At the hearing, Samsung touted the uniqueness of its “FlexWash” model, which was launched in March 2017, i.e., the last month of the safeguard investigation’s POI. Whirlpool has ***. First, Whirlpool has ***. Second, Whirlpool is also ***.
*** Washers: At the hearing, LG touted the purported uniqueness of its “SideKick” pedestal washer model. But Whirlpool ***. Import competition at uneconomic price levels has ***.
*** Washers: Whirlpool expects that, with the benefit of safeguard relief, it should be able to *** to develop new designs and tooling. This investment would likely add up to *** direct jobs and significantly increase ***.
*** Platform: Finally, if safeguard relief is granted, Whirlpool will review a ***.

VIII-5
Plans to enhance manufacturing and logistics efficiencies
While the Clyde plant is already the most efficient washer plant in the world — and manufacturers from the auto sector and other industries commonly “benchmark” to Clyde in order to gauge their own efficiency — Whirlpool is always pursuing manufacturing improvements in order to remain as cost competitive as possible. To that end, appropriate safeguard relief will create an environment in which Whirlpool can explore new opportunities for incremental improvements in its manufacturing and logistics that ensure Clyde remains a cutting edge facility in the future.
If safeguard relief is granted, Whirlpool will ***. The details include: ***. Each aspect of this plan has been deferred as the economics of the washers business has
crumbled in the last few years due to increasing volumes of low-priced imports. If safeguard relief is imposed, Whirlpool estimates that ***.4 These opportunities will also ensure that Clyde manufacturing continues to remain on the cutting edge when it comes to ***. The implementation of these opportunities will itself create American jobs but, more importantly, also ensure Clyde and its employees can deliver sustained manufacturing and product leadership going forward.
Finally, Whirlpool will evaluate the opportunity for a ***. Once again, these opportunities will deliver smart automation and a connected workplace that drives further efficiencies and equips Clyde’s workforce for sustainable success in the future.
4 Although not yet in the planning, further efficiencies may potentially be realized through ***.

VIII-6
Whirlpool’s post-relief efforts
Whirlpool was asked to describe (1) any efforts made by your firm and/or its workers since February 7, 2018 to compete more effectively, (2) the year in which the effort was made, (3) the expenditure involved (in thousands of dollars), and (4) the specific competitive advantage acquired (i.e., increased production, cost reduction, quality improvement, increased market share or sales, etc.). Whirlpool was also asked to discuss reasons why any specific adjustment actions included in the above plans have not been implemented. Whirlpool’s answer is reproduced in its entirety below:5
* * * * * * *
5 Domestic Producers’ Questionnaire Response of Whirlpool at Attachment 2.

VIII-7
* * * * * * *

VIII-8
* * * * * * *

VIII-9
* * * * * * *

VIII-10
* * * * * * *

VIII-11
* * * * * * *

VIII-12
Significance of relief
U.S. producers were asked to describe the significance of the tariff-rate quota imposed by the President effective on February 7, 2018. Firms were asked to explain how they separated the effects of the safeguard from other factors. Table VIII-1 presents the answers of responding U.S. producers.

VIII-13
Table VIII-1 LRWs: U.S. producers’ reported significance of the safeguard measures
Category Firm Significance of the safeguard measure. Production capacity, production, shipments, inventories, and employment
Alliance *** GE Appliances
***
LG *** Samsung *** Whirlpool ***
Table continued on next page.

VIII-14
Table VIII-1--Continued LRWs: U.S. producers’ reported significance of the safeguard measures
Category Firm Significance of the safeguard measure. Return on investment, ability to generate capital to finance the modernization of domestic plant(s) and equipment, or ability to maintain existing levels of expenditures for research and development
Alliance *** GE Appliances *** LG *** Samsung *** Whirlpool
*** Changes in your firm’s collective bargaining agreements
Alliance *** GE Appliances *** LG *** Samsung *** Whirlpool ***
Source: Compiled from data submitted in response to Commission questionnaires.
Product availability
U.S. producers and importers were also asked if they had made any efforts to increase product availability to their customers, either in terms of the quantity of products available or by increasing your product offerings (e.g., new size ranges, qualities, features, products, etc.) since February 7, 2018.
*** reported: “***.”

VIII-15
*** reported that it has ***, as discussed in its response to questions concerning adjustment efforts, but “***.” *** reported: “***.”
*** reported: “***.” Purchasers were also asked if domestic producers took certain actions since February 7, 2018. Eleven of 12 purchasers reported that domestic producers had introduced a new or innovative product; eight purchasers reported that domestic producers had improved product quality and expanded their marketing efforts, including e-commerce; and six purchasers reported that domestic producers had made other efforts to positively adjust to imports, including the opening of LG and Samsung’s new production plants. Eight of 12 responding purchasers reported that U.S. producers had not made improvements to customer service.


A-1
APPENDIX A
FEDERAL REGISTER NOTICES

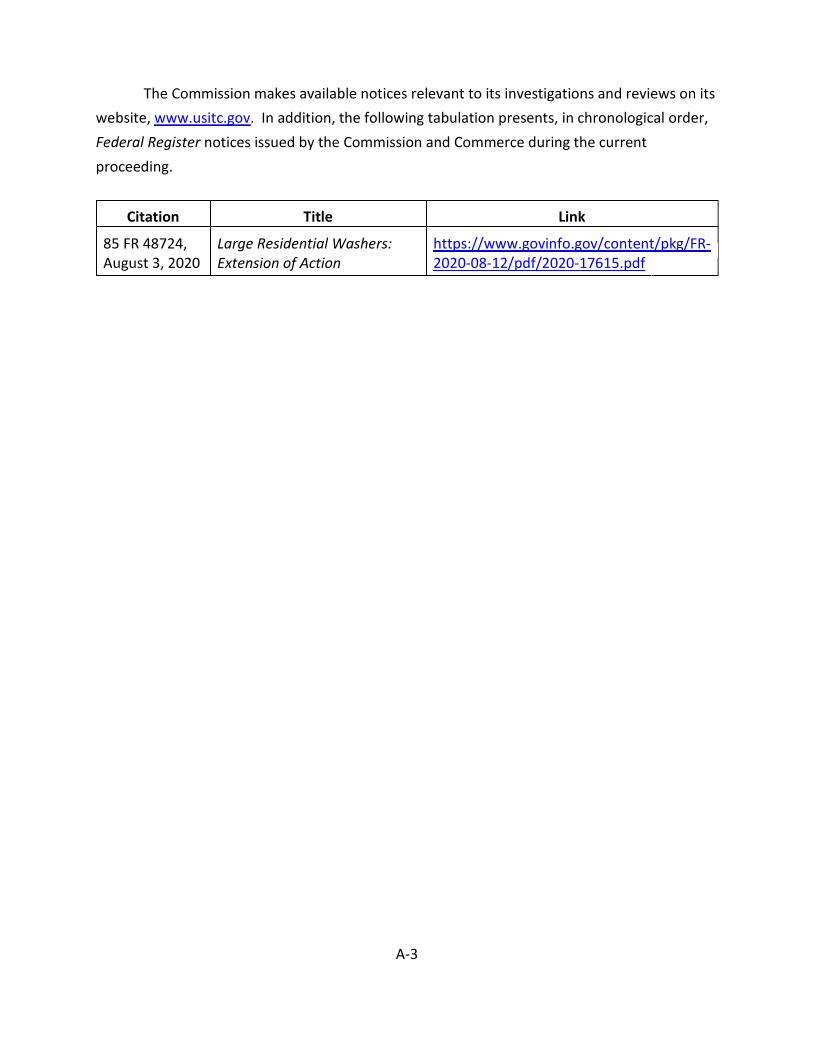
A-3
The Commission makes available notices relevant to its investigations and reviews on its website, www.usitc.gov. In addition, the following tabulation presents, in chronological order, Federal Register notices issued by the Commission and Commerce during the current proceeding.
Citation Title Link
85 FR 48724, August 3, 2020
Large Residential Washers: Extension of Action
https://www.govinfo.gov/content/pkg/FR-2020-08-12/pdf/2020-17615.pdf


B-1
APPENDIX B
LIST OF HEARING WITNESSES


B-3
CALENDAR OF PUBLIC HEARING
Those listed below appeared in the United States International Trade Commission’s hearing via videoconference:
Subject: Large Residential Washers
Inv. No.: TA-201-076 (Extension)
Date and Time: November 5, 2020 - 9:30 a.m.
CONGRESSIONAL APPEARANCES:
The Honorable Sherrod Brown, United States Senator, Ohio
The Honorable Rob Portman, United States Senator, Ohio
The Honorable Ralph Norman, U.S. Representative, 5th District, South Carolina
STATE GOVERNMENT WITNESS:
The Honorable Henry McMaster, Governor, South Carolina
EMBASSY WITNESS:
Embassy of the Republic of Korea Washington, DC
Peob Min Ryu, Director General for Trade Legal Affairs and Public Relations Ministry of Trade, Industry and Energy
OPENING REMARKS:
In Support of Extension (Myles S. Getlan, Cassidy Levy Kent (USA) LLP) In Opposition to Extension (Lynn M. Fischer Fox, Arnold & Porter Kaye Scholer LLP)

B-4
IN SUPPORT OF EXTENSION:
Cassidy Levy Kent (USA) LLP Washington, DC on behalf of
Whirlpool Corporation
Joseph Liotine, President, North America, Whirlpool Corporation
Anna J. Utley, Senior Director, Laundry, Whirlpool Corporation
Jack A. Levy ) Myles S. Getlan ) – OF COUNSEL Mary Jane Alves )
TRADEWINS LLC Washington, DC on behalf of
Haier US Appliance Solutions d/b/a GE Appliances
John R. Magnus ) – OF COUNSEL
IN OPPOSITION TO EXTENSION:
Curtis, Mallet-Prevost, Colt & Mosle LLP Washington, DC on behalf of
LG Electronics USA, Inc. LG Electronics, Inc.
(collectively “LGE”)
John Toohey, Senior Director of Strategy, LGEUS
Theodore Myers, Innovation Team Leader, LGEUS-TN
Daniel Klett, Principal, Capital Trade Inc.
Charles Anderson, Principal, Capital Trade, Inc.
Brian Westenbroek, Project Manager, Capital Trade, Inc.
Daniel L. Porter ) James P. Durling ) – OF COUNSEL Ana Amador )

B-5
IN OPPOSITION TO EXTENSION (continued):
Arnold & Porter Kaye Scholer LLP Washington, DC on behalf of
Samsung Electronics Co., Ltd.; Samsung Electronics Home Appliances America, LLC; Samsung Electronics Digital Appliances Mexico, S.A. de C.V.; Samsung Electronics HCMC CE Complex Co., Ltd.; Suzhou Samsung Electronics Co., Ltd.; Suzhou Samsung Electronics Co., Ltd. – Export; Thai Samsung Electronics Co., Ltd.; and Samsung Electronics America, Inc.
(collectively “Samsung”)
Thomas Komaromi, General Counsel, Samsung Electronics Home Appliances America
Shane Higby, Vice President of Marketing, Home Appliances, Samsung Electronics America
Scott C. Thompson, Principal Director, Public Policy, Office of U.S. Public Affairs, Samsung Electronics America
Kenneth Murata, Vice President of Litigation & Regulatory, Samsung Electronics America
J. David Park ) Lynn M. Fischer Fox ) Michael T. Shor ) – OF COUNSEL Daniel R. Wilson ) Leslie C. Bailey )
REBUTTAL/CLOSING REMARKS:
In Support of Extension (Jack A. Levy, Cassidy Levy Kent (USA) LLP) In Opposition to Extension (Daniel L. Porter, Curtis, Mallet-Prevost, Colt & Mosle LLP)
- END -


C-1
APPENDIX C
SUMMARY DATA

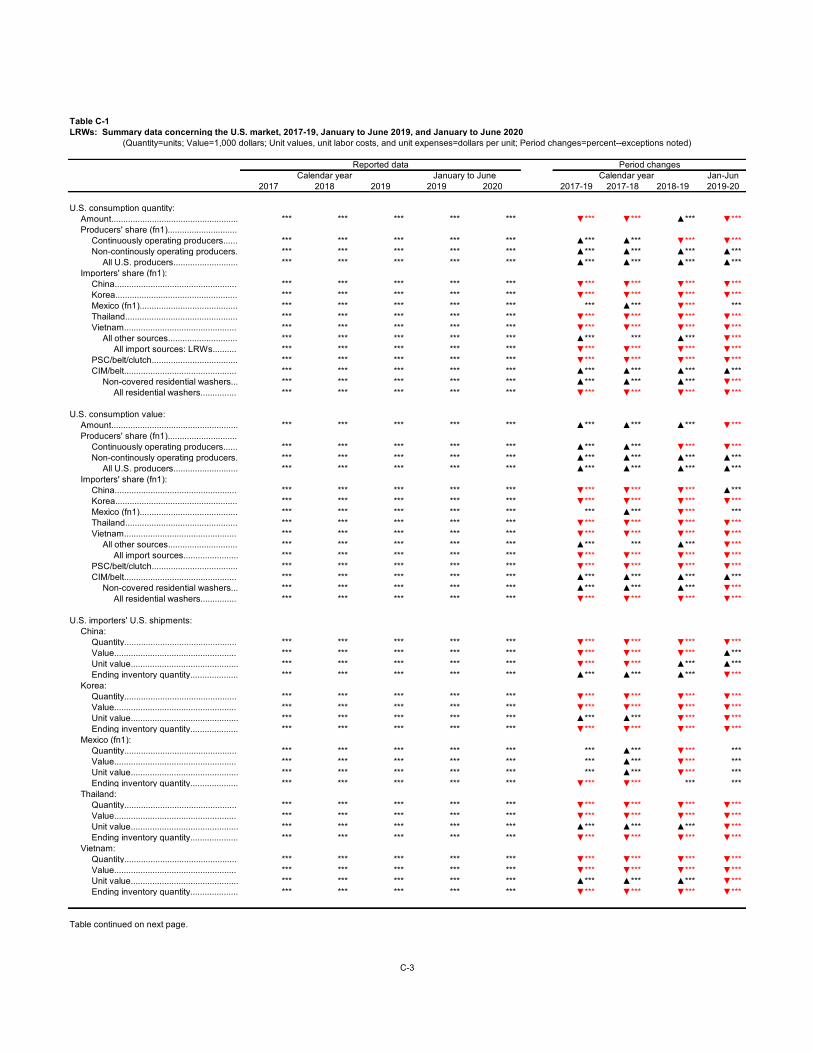
Table C-1LRWs: Summary data concerning the U.S. market, 2017-19, January to June 2019, and January to June 2020
Jan-Jun2017 2018 2019 2019 2020 2017-19 2017-18 2018-19 2019-20
U.S. consumption quantity:Amount..................................................... *** *** *** *** *** ▼*** ▼*** ▲*** ▼*** Producers' share (fn1).............................
Continuously operating producers...... *** *** *** *** *** ▲*** ▲*** ▼*** ▼*** Non-continously operating producers. *** *** *** *** *** ▲*** ▲*** ▲*** ▲***
All U.S. producers........................... *** *** *** *** *** ▲*** ▲*** ▲*** ▲*** Importers' share (fn1):
China................................................... *** *** *** *** *** ▼*** ▼*** ▼*** ▼*** Korea................................................... *** *** *** *** *** ▼*** ▼*** ▼*** ▼*** Mexico (fn1)......................................... *** *** *** *** *** *** ▲*** ▼*** *** Thailand............................................... *** *** *** *** *** ▼*** ▼*** ▼*** ▼*** Vietnam............................................... *** *** *** *** *** ▼*** ▼*** ▼*** ▼***
All other sources............................. *** *** *** *** *** ▲*** *** ▲*** ▼*** All import sources: LRWs.......... *** *** *** *** *** ▼*** ▼*** ▼*** ▼***
PSC/belt/clutch.................................... *** *** *** *** *** ▼*** ▼*** ▼*** ▼*** CIM/belt............................................... *** *** *** *** *** ▲*** ▲*** ▲*** ▲***
Non-covered residential washers... *** *** *** *** *** ▲*** ▲*** ▲*** ▼*** All residential washers............... *** *** *** *** *** ▼*** ▼*** ▼*** ▼***
U.S. consumption value:Amount..................................................... *** *** *** *** *** ▲*** ▲*** ▲*** ▼*** Producers' share (fn1).............................
Continuously operating producers...... *** *** *** *** *** ▲*** ▲*** ▼*** ▼*** Non-continously operating producers. *** *** *** *** *** ▲*** ▲*** ▲*** ▲***
All U.S. producers........................... *** *** *** *** *** ▲*** ▲*** ▲*** ▲*** Importers' share (fn1):
China................................................... *** *** *** *** *** ▼*** ▼*** ▼*** ▲*** Korea................................................... *** *** *** *** *** ▼*** ▼*** ▼*** ▼*** Mexico (fn1)......................................... *** *** *** *** *** *** ▲*** ▼*** *** Thailand............................................... *** *** *** *** *** ▼*** ▼*** ▼*** ▼*** Vietnam............................................... *** *** *** *** *** ▼*** ▼*** ▼*** ▼***
All other sources............................. *** *** *** *** *** ▲*** *** ▲*** ▼*** All import sources....................... *** *** *** *** *** ▼*** ▼*** ▼*** ▼***
PSC/belt/clutch.................................... *** *** *** *** *** ▼*** ▼*** ▼*** ▼*** CIM/belt............................................... *** *** *** *** *** ▲*** ▲*** ▲*** ▲***
Non-covered residential washers... *** *** *** *** *** ▲*** ▲*** ▲*** ▼*** All residential washers............... *** *** *** *** *** ▼*** ▼*** ▼*** ▼***
U.S. importers' U.S. shipments:China:
Quantity............................................... *** *** *** *** *** ▼*** ▼*** ▼*** ▼*** Value................................................... *** *** *** *** *** ▼*** ▼*** ▼*** ▲*** Unit value............................................. *** *** *** *** *** ▼*** ▼*** ▲*** ▲*** Ending inventory quantity.................... *** *** *** *** *** ▲*** ▲*** ▲*** ▼***
Korea:Quantity............................................... *** *** *** *** *** ▼*** ▼*** ▼*** ▼*** Value................................................... *** *** *** *** *** ▼*** ▼*** ▼*** ▼*** Unit value............................................. *** *** *** *** *** ▲*** ▲*** ▼*** ▼*** Ending inventory quantity.................... *** *** *** *** *** ▼*** ▼*** ▼*** ▼***
Mexico (fn1):Quantity............................................... *** *** *** *** *** *** ▲*** ▼*** *** Value................................................... *** *** *** *** *** *** ▲*** ▼*** *** Unit value............................................. *** *** *** *** *** *** ▲*** ▼*** *** Ending inventory quantity.................... *** *** *** *** *** ▼*** ▼*** *** ***
Thailand:Quantity............................................... *** *** *** *** *** ▼*** ▼*** ▼*** ▼*** Value................................................... *** *** *** *** *** ▼*** ▼*** ▼*** ▼*** Unit value............................................. *** *** *** *** *** ▲*** ▲*** ▲*** ▼*** Ending inventory quantity.................... *** *** *** *** *** ▼*** ▼*** ▼*** ▼***
Vietnam:Quantity............................................... *** *** *** *** *** ▼*** ▼*** ▼*** ▼*** Value................................................... *** *** *** *** *** ▼*** ▼*** ▼*** ▼*** Unit value............................................. *** *** *** *** *** ▲*** ▲*** ▲*** ▼*** Ending inventory quantity.................... *** *** *** *** *** ▼*** ▼*** ▼*** ▼***
Table continued on next page.
C-3
(Quantity=units; Value=1,000 dollars; Unit values, unit labor costs, and unit expenses=dollars per unit; Period changes=percent--exceptions noted)
Reported data Period changesCalendar year January to June Calendar year

Table C-1--ContinuedLRWs: Summary data concerning the U.S. market, 2017-19, January to June 2019, and January to June 2020
Jan-Jun2017 2018 2019 2019 2020 2017-19 2017-18 2018-19 2019-20
All other sources:Quantity............................................... *** *** *** *** *** ▲*** *** ▲*** ▼*** Value................................................... *** *** *** *** *** ▲*** *** ▲*** ▼*** Unit value............................................. *** *** *** *** *** ▲*** *** ▲*** ▼*** Ending inventory quantity.................... *** *** *** *** *** *** *** *** ***
All import sources:Quantity............................................... *** *** *** *** *** ▼*** ▼*** ▼*** ▼*** Value................................................... *** *** *** *** *** ▼*** ▼*** ▼*** ▼*** Unit value............................................. *** *** *** *** *** ▲*** ▲*** ▲*** ▼*** Ending inventory quantity.................... *** *** *** *** *** ▼*** ▼*** ▼*** ▼***
Top-load PSC/belt/clutch washers:Quantity............................................... *** *** *** *** *** ▼*** ▼*** ▼*** ▼*** Value................................................... *** *** *** *** *** ▼*** ▼*** ▼*** ▼*** Unit value............................................. *** *** *** *** *** ▼*** ▼*** ▼*** ▼*** Ending inventory quantity.................... *** *** *** *** *** ▼*** ▼*** ▼*** ***
Front-load CIM/belt washers:Quantity............................................... *** *** *** *** *** ▲*** ▲*** ▲*** ▲*** Value................................................... *** *** *** *** *** ▲*** ▲*** ▲*** ▲*** Unit value............................................. *** *** *** *** *** ▲*** ▼*** ▲*** ▼*** Ending inventory quantity.................... *** *** *** *** *** ▲*** ▲*** ▲*** ▲***
Non-covered residential washers:Quantity............................................... *** *** *** *** *** ▲*** ▲*** ▲*** ▼*** Value................................................... *** *** *** *** *** ▲*** ▲*** ▲*** ▼*** Unit value............................................. *** *** *** *** *** ▲*** ▲*** ▲*** ▲*** Ending inventory quantity.................... *** *** *** *** *** ▲*** ▲*** ▼*** ▼***
All residential washers:Quantity............................................... *** *** *** *** *** ▼*** ▼*** ▼*** ▼*** Value................................................... *** *** *** *** *** ▼*** ▼*** ▼*** ▼*** Unit value............................................. *** *** *** *** *** ▲*** ▲*** ▲*** ▼*** Ending inventory quantity.................... *** *** *** *** *** ▼*** ▼*** ▼*** ▼***
U.S. producers':Average capacity quantity....................... *** *** *** *** *** ▲*** ▲*** ▲*** ▲*** Production quantity.................................. *** *** *** *** *** ▲*** ▼*** ▲*** ▼*** Capacity utilization (fn1)........................... *** *** *** *** *** ▼*** ▼*** ▲*** ▼*** U.S. shipments: ful units
Quantity............................................... *** *** *** *** *** ▲*** ▲*** ▲*** ▲*** Value................................................... *** *** *** *** *** ▲*** ▲*** ▲*** ▲*** Unit value............................................. *** *** *** *** *** ▲*** ▲*** ▲*** ▲***
U.S. shipments: covered partsQuantity............................................... *** *** *** *** *** ▲*** ▲*** ▲*** ▼*** Value................................................... *** *** *** *** *** ▲*** ▲*** ▲*** ▼*** Unit value............................................. *** *** *** *** *** ▼*** ▼*** ▼*** ▼***
U.S. shipments: full units and covered partsQuantity............................................... *** *** *** *** *** ▲*** ▲*** ▲*** ▲*** Value................................................... *** *** *** *** *** ▲*** ▲*** ▲*** ▲*** Unit value............................................. *** *** *** *** *** ▲*** ▲*** ▲*** ▲***
Export shipments:Quantity............................................... *** *** *** *** *** ▼*** ▼*** ▼*** ▼*** Value................................................... *** *** *** *** *** ▼*** ▼*** ▲*** ▼*** Unit value............................................. *** *** *** *** *** ▲*** ▲*** ▲*** ▼***
Ending inventory quantity........................ *** *** *** *** *** ▼*** ▼*** ▲*** ▼*** Inventories/total shipments (fn1)............. *** *** *** *** *** ▼*** ▼*** ▼*** ▼*** Production workers.................................. *** *** *** *** *** ▲*** ▲*** ▲*** ▲*** Hours worked (1,000s)............................ *** *** *** *** *** ▲*** ▲*** ▲*** ▼*** Wages paid ($1,000)............................... *** *** *** *** *** ▲*** ▲*** ▲*** ▼*** Hourly wages (dollars per hour).............. *** *** *** *** *** ▲*** ▲*** ▲*** ▲*** Productivity (units per 1,000 hours)......... *** *** *** *** *** ▼*** ▼*** ▲*** ▲*** Unit labor costs........................................ *** *** *** *** *** ▲*** ▲*** ▼*** ▲***
Table continued on next page.
C-4
(Quantity=units; Value=1,000 dollars; Unit values, unit labor costs, and unit expenses=dollars per unit; Period changes=percent--exceptions noted)
Reported data Period changesCalendar year January to June Calendar year

Table C-1--ContinuedLRWs: Summary data concerning the U.S. market, 2017-19, January to June 2019, and January to June 2020
Jan-Jun2017 2018 2019 2019 2020 2017-19 2017-18 2018-19 2019-20
Net sales:Quantity............................................... *** *** *** *** *** ▲*** ▲*** ▲*** ▲*** Value................................................... *** *** *** *** *** ▲*** ▲*** ▲*** ▲*** Unit value............................................. *** *** *** *** *** ▲*** ▲*** ▲*** ▲***
Cost of goods sold (COGS)..................... *** *** *** *** *** ▲*** ▲*** ▲*** ▲*** Gross profit or (loss) (fn3)........................ *** *** *** *** *** ▲*** ▼*** ▲*** ▲*** SG&A expenses...................................... *** *** *** *** *** ▼*** ▲*** ▼*** ▲*** Operating income or (loss) (fn3).............. *** *** *** *** *** ▲*** ▼*** ▲*** ▼*** Net income or (loss) (fn3)........................ *** *** *** *** *** ▲*** ▼*** ▲*** ▼*** Capital expenditures................................ *** *** *** *** *** ▼*** ▲*** ▼*** ▼*** Research and development expenses... *** *** *** *** *** ▼*** ▼*** ▼*** ▼*** Net assets................................................ *** *** *** *** *** ▲*** ▲*** ▲*** *** Unit COGS............................................... *** *** *** *** *** ▲*** ▲*** ▲*** ▲*** Unit SG&A expenses............................... *** *** *** *** *** ▼*** ▲*** ▼*** ▲*** Unit operating income or (loss) (fn3)....... *** *** *** *** *** ▲*** ▼*** ▲*** ▼*** Unit net income or (loss) (fn3)................. *** *** *** *** *** ▲*** ▼*** ▲*** ▼*** COGS/sales (fn1).................................... *** *** *** *** *** ▼*** ▲*** ▼*** ▼*** Operating income or (loss)/sales (fn1).... *** *** *** *** *** ▲*** ▼*** ▲*** ▼*** Net income or (loss)/sales (fn1).............. *** *** *** *** *** ▲*** ▼*** ▲*** ▼***
Table continued on next page.
C-5
(Quantity=units; Value=1,000 dollars; Unit values, unit labor costs, and unit expenses=dollars per unit; Period changes=percent--exceptions noted)
Reported data Period changesCalendar year January to June Calendar year

Table C-1--ContinuedLRWs: Summary data concerning the U.S. market, 2017-19, January to June 2019, and January to June 2020
Jan-Jun2017 2018 2019 2019 2020 2017-19 2017-18 2018-19 2019-20
Continuously operating U.S. producers':Average capacity quantity....................... *** *** *** *** *** ▲*** ▲*** ▼*** ▼*** Production quantity.................................. *** *** *** *** *** ▼*** ▼*** ▼*** ▼*** Capacity utilization (fn1)........................... *** *** *** *** *** ▼*** ▼*** ▲*** ▼*** U.S. shipments: ful units
Quantity............................................... *** *** *** *** *** ▼*** ▼*** ▼*** ▼*** Value................................................... *** *** *** *** *** ▲*** ▲*** ▲*** ▼*** Unit value............................................. *** *** *** *** *** ▲*** ▲*** ▲*** ▼***
U.S. shipments: covered partsQuantity............................................... *** *** *** *** *** ▲*** ▲*** ▲*** ▼*** Value................................................... *** *** *** *** *** ▲*** ▲*** ▲*** ▼*** Unit value............................................. *** *** *** *** *** ▼*** ▼*** ▼*** ▲***
U.S. shipments: full units and covered partsQuantity............................................... *** *** *** *** *** ▼*** ▼*** ▼*** ▼*** Value................................................... *** *** *** *** *** ▲*** ▲*** ▲*** ▼*** Unit value............................................. *** *** *** *** *** ▲*** ▲*** ▲*** ▼***
Export shipments:Quantity............................................... *** *** *** *** *** ▼*** ▼*** ▼*** ▼*** Value................................................... *** *** *** *** *** ▼*** ▼*** ▲*** ▼*** Unit value............................................. *** *** *** *** *** ▲*** ▲*** ▲*** ▼***
Ending inventory quantity........................ *** *** *** *** *** ▼*** ▼*** ▼*** ▼*** Inventories/total shipments (fn1)............. *** *** *** *** *** ▼*** ▼*** ▼*** ▼*** Production workers.................................. *** *** *** *** *** ▲*** ▲*** ▼*** ▼*** Hours worked (1,000s)............................ *** *** *** *** *** ▼*** ▼*** ▼*** ▼*** Wages paid ($1,000)............................... *** *** *** *** *** ▼*** ▼*** ▼*** ▼*** Hourly wages (dollars per hour).............. *** *** *** *** *** ▲*** ▼*** ▲*** ▲*** Productivity (units per 1,000 hours)......... *** *** *** *** *** ▲*** ▼*** ▲*** ▼*** Unit labor costs........................................ *** *** *** *** *** ▲*** ▲*** ▼*** ▲*** Net sales:
Quantity............................................... *** *** *** *** *** ▼*** ▼*** ▼*** ▼*** Value................................................... *** *** *** *** *** ▲*** ▲*** ▲*** ▼*** Unit value............................................. *** *** *** *** *** ▲*** ▲*** ▲*** ▼***
Cost of goods sold (COGS)..................... *** *** *** *** *** ▲*** ▲*** ▼*** ▼*** Gross profit or (loss) (fn3)........................ *** *** *** *** *** ▲*** ▲*** ▲*** ▼*** SG&A expenses...................................... *** *** *** *** *** ▼*** ▲*** ▼*** ▲*** Operating income or (loss) (fn3).............. *** *** *** *** *** ▲*** ▲*** ▲*** ▼*** Net income or (loss) (fn3)........................ *** *** *** *** *** ▲*** ▲*** ▲*** ▼*** Capital expenditures................................ *** *** *** *** *** ▲*** ▲*** ▼*** ▼*** Research and development expenses... *** *** *** *** *** ▼*** ▼*** ▲*** ▲*** Net assets................................................ *** *** *** *** *** ▼*** ▼*** ▲*** *** Unit COGS............................................... *** *** *** *** *** ▲*** ▲*** ▲*** ▲*** Unit SG&A expenses............................... *** *** *** *** *** ▼*** ▲*** ▼*** ▲*** Unit operating income or (loss) (fn3)....... *** *** *** *** *** ▲*** ▲*** ▲*** ▼*** Unit net income or (loss) (fn3)................. *** *** *** *** *** ▲*** ▲*** ▲*** ▼*** COGS/sales (fn1).................................... *** *** *** *** *** ▼*** ▼*** ▼*** ▲*** Operating income or (loss)/sales (fn1).... *** *** *** *** *** ▲*** ▲*** ▲*** ▼*** Net income or (loss)/sales (fn1).............. *** *** *** *** *** ▲*** ▲*** ▲*** ▼***
Table continued on next page.
C-6
(Quantity=units; Value=1,000 dollars; Unit values, unit labor costs, and unit expenses=dollars per unit; Period changes=percent--exceptions noted)
Reported data Period changesCalendar year January to June Calendar year

Table C-1--ContinuedLRWs: Summary data concerning the U.S. market, 2017-19, January to June 2019, and January to June 2020
Jan-Jun2017 2018 2019 2019 2020 2017-19 2017-18 2018-19 2019-20
Non-continuously operating U.S. producers':Average capacity quantity....................... *** *** *** *** *** ▲*** ▲*** ▲*** ▲*** Production quantity.................................. *** *** *** *** *** ▲*** ▲*** ▲*** ▲*** Capacity utilization (fn1)........................... *** *** *** *** *** ▲*** ▲*** ▼*** ▲*** U.S. shipments: ful units
Quantity............................................... *** *** *** *** *** ▲*** ▲*** ▲*** ▲*** Value................................................... *** *** *** *** *** ▲*** ▲*** ▲*** ▲*** Unit value............................................. *** *** *** *** *** ▲*** ▲*** ▲*** ▲***
U.S. shipments: covered partsQuantity............................................... *** *** *** *** *** ▲*** ▲*** ▲*** ▲*** Value................................................... *** *** *** *** *** ▲*** ▲*** ▲*** ▲*** Unit value............................................. *** *** *** *** *** ▲*** ▲*** ▼*** ▲***
U.S. shipments: full units and covered partsQuantity............................................... *** *** *** *** *** ▲*** ▲*** ▲*** ▲*** Value................................................... *** *** *** *** *** ▲*** ▲*** ▲*** ▲*** Unit value............................................. *** *** *** *** *** ▲*** ▲*** ▲*** ▲***
Export shipments:Quantity............................................... *** *** *** *** *** *** *** *** *** Value................................................... *** *** *** *** *** *** *** *** *** Unit value............................................. *** *** *** *** *** *** *** *** ***
Ending inventory quantity........................ *** *** *** *** *** ▲*** ▲*** ▲*** ▼*** Inventories/total shipments (fn1)............. *** *** *** *** *** ▲*** ▲*** ▲*** ▼*** Production workers.................................. *** *** *** *** *** ▲*** ▲*** ▲*** ▲*** Hours worked (1,000s)............................ *** *** *** *** *** ▲*** ▲*** ▲*** ▲*** Wages paid ($1,000)............................... *** *** *** *** *** ▲*** ▲*** ▲*** ▲*** Hourly wages (dollars per hour).............. *** *** *** *** *** ▲*** ▲*** ▼*** ▲*** Productivity (units per 1,000 hours)......... *** *** *** *** *** ▲*** ▲*** ▲*** ▲*** Unit labor costs........................................ *** *** *** *** *** ▲*** ▲*** ▼*** ▼*** Net sales:
Quantity............................................... *** *** *** *** *** ▲*** ▲*** ▲*** ▲*** Value................................................... *** *** *** *** *** ▲*** ▲*** ▲*** ▲*** Unit value............................................. *** *** *** *** *** ▲*** ▲*** ▲*** ▲***
Cost of goods sold (COGS)..................... *** *** *** *** *** ▲*** ▲*** ▲*** ▲*** Gross profit or (loss) (fn3)........................ *** *** *** *** *** ▼*** ▼*** ▲*** ▲*** SG&A expenses...................................... *** *** *** *** *** ▲*** ▲*** ▲*** ▲*** Operating income or (loss) (fn3).............. *** *** *** *** *** ▼*** ▼*** ▲*** ▲*** Net income or (loss) (fn3)........................ *** *** *** *** *** ▼*** ▼*** ▲*** ▲*** Capital expenditures................................ *** *** *** *** *** ▼*** ▲*** ▼*** ▼*** Research and development expenses... *** *** *** *** *** ▲*** ▲*** ▼*** ▼*** Net assets................................................ *** *** *** *** *** ▲*** ▲*** ▲*** *** Unit COGS............................................... *** *** *** *** *** ▲*** ▲*** ▼*** ▼*** Unit SG&A expenses............................... *** *** *** *** *** ▲*** ▲*** ▼*** ▼*** Unit operating income or (loss) (fn3)....... *** *** *** *** *** ▼*** ▼*** ▲*** ▲*** Unit net income or (loss) (fn3)................. *** *** *** *** *** ▼*** ▼*** ▲*** ▲*** COGS/sales (fn1).................................... *** *** *** *** *** ▲*** ▲*** ▼*** ▼*** Operating income or (loss)/sales (fn1).... *** *** *** *** *** ▼*** ▼*** ▲*** ▲*** Net income or (loss)/sales (fn1).............. *** *** *** *** *** ▼*** ▼*** ▲*** ▲***
fn1.--Reported data are in percent and period changes are in percentage points.fn2.--Imports of washers from Mexico are not within the product description of the safeguard and are reported as part of the import expansion to match the like product
Source: Compiled from data submitted in response to Commission questionnaires.
Note.--Shares and ratios shown as “0.0” percent represent non-zero values less than “0.05” percent (if positive) and greater than “(0.05)” percent (if negative). Zeroes, null values, and undefined calculations are suppressed and shown as “---“. Period changes preceded by a “▲” represent an increase, while period changes preceded by a “▼” represent a decrease.
fn3.--Percent changes only calculated when both comparison values represent profits; The directional change in profitability provided when one or both comparison values represent a loss.
C-7
(Quantity=units; Value=1,000 dollars; Unit values, unit labor costs, and unit expenses=dollars per unit; Period changes=percent--exceptions noted)
Reported data Period changesCalendar year January to June Calendar year


APPENDIX D
SELECT DATA FROM SAFEGUARD INVESTIGATION
D-1

D-2

Table reproduced from USITC report in safeguard investigation, USITC Publication 4745
Table C-1 LRWs and covered parts: Summary data concerning LRWs and covered parts, 2012-16, January to March 2016, and January to March 2017
* * * * * * *
Table C-2 Residential washers and covered parts: Summary data concerning LRWs, covered parts, and selected out-of-scope residential washers, 2012-16, January to March 2016, and January to March 2017
* * * * * * *
Table C-3 Residential washers: Summary data concerning LRWs and selected out-of-scope residential washers, 2012-16, January to March 2016, and January to March 2017
* * * * * * *
Table C-4 LRWs: Summary data concerning LRWs, 2012-16, January to March 2016, and January to March 2017
* * * * * * *
Table C-5 Covered parts: Summary data concerning covered parts, 2012-16, January to March 2016, and January to March 2017
* * * * * * *

Table reproduced from USITC report in safeguard investigation, USITC Publication 4745
Table V-13 LRWs: Weighted-average f.o.b. prices and quantities of domestic and imported product 1, by quarters, January 2012-March 2017
* * * * * * *Table V-14 LRWs: Weighted-average f.o.b. prices and quantities of domestic and imported product 2, by quarters, January 2012-March 2017
* * * * * * *
Table V-15 LRWs: Weighted-average f.o.b. prices and quantities of domestic and imported product 3, by quarters, January 2012-March 2017
* * * * * * *
Table V-16 LRWs: Weighted-average f.o.b. prices and quantities of domestic and imported product 4, by quarters, January 2012-March 2017
* * * * * * *
Table V-17 LRWs: Weighted-average f.o.b. prices and quantities of domestic and imported product 5, by quarters, January 2012-March 2017
* * * * * * *
Table V-18 LRWs: Weighted-average f.o.b. prices and quantities of domestic and imported product 6, by quarters, January 2012-March 2017
* * * * * * *

Table reproduced from USITC safeguard proceeding
Attachment Table 2. Data Inputs for all Covered and Non‐Covered Countries
* * * * * * *
The financial impact calculations incorporate the following data on the COGS and SG&A from Table C‐2:
Attachment Table 3. Data Inputs of the Financial Impact Calculations
* * * * * * *
The PE model incorporates estimates for the U.S. supply elasticity, the import supply elasticity, the price elasticity of total industry demand in the U.S. market, and the elasticity of substitution between imports and the domestic like product.

Table reproduced from USITC safeguard proceeding
III. Estimated Economic Effects
Attachment Table 4 reports the estimated economics effects of the TRQ on large residential washers recommended by Chairman Schmidtlein and Commissioner Williamson. The estimates do not include the effects of the recommended TRQ on parts. Attachment Table 4: Tariff‐Rate Quota on Washers at 1.2 Million Units with In‐Quota Rate
Tariff Rates
Year 1: 50%
out‐of‐quota,
20% in quota
Year 2: 45%
out‐of‐quota, 18% in quota
Year 3: 40%
out‐of‐quota, 15% in quota
Domestic Supply Elasticity 6 6 6
Covered Imports Supply Elasticity 6 6 6
Non‐Covered Imports Supply Elasticity 3 3 3
Demand Elasticity ‐0.3 ‐0.3 ‐0.3
Substitution Elasticity 4 4 4
% Change in Covered Imports Quantity *** *** ***
% Change in Non‐Covered Import Quantity
*** *** ***
% Change in U.S. Quantity *** *** ***
% Change in Covered Import Prices *** *** ***
% Change in Non‐Covered Import Prices
*** *** ***
% Change in U.S. Prices *** *** ***
% Change in Market Price Index *** *** ***
Change in Industry Revenue (million $) *** *** ***
Change in Operating Income (million $) *** *** ***
Tariff Revenue (million $) *** *** ***

Table reproduced from USITC safeguard proceeding
Attachment Table 5 reports the estimated economics effects of the TRQ recommended by Vice Chairman Johanson and Commissioner Broadbent. The estimates do not include the effects of the recommended TRQ on imports of parts.
Attachment Table 5: Tariff‐Rate Quota on Washers at 1.2 Million Units without In‐Quota Rate
Tariff Rates
Year 1: 50%
out‐of‐quota,
0% in quota
Year 2: 45%
out‐of‐quota, 0% in quota
Year 3: 40%
out‐of‐quota, 0% in quota
Domestic Supply Elasticity 6 6 6
Covered Imports Supply Elasticity 6 6 6
Non‐Covered Imports Supply Elasticity 3 3 3
Demand Elasticity ‐0.3 ‐0.3 ‐0.3
Substitution Elasticity 4 4 4
% Change in Covered Imports Quantity *** *** ***
% Change in Non‐Covered Import Quantity
*** *** ***
% Change in U.S. Quantity *** *** ***
% Change in Covered Import Prices *** *** ***
% Change in Non‐Covered Import Prices
*** *** ***
% Change in U.S. Prices *** *** ***
% Change in Industry Price Index *** *** ***
Change in Industry Revenue (million $) *** *** ***
Change in Operating Income (million $) *** *** ***
Tariff Revenue (million $) *** *** ***


E-1
APPENDIX E
SECTION 232 AND SECTION 301 PROCEEDINGS


E-3
Section 232 investigations (Commerce)
Steel
On April 19, 2017, Commerce initiated an investigation under section 232 of the Trade Expansion Act of 1962 as amended (19 U.S.C. 1862), to assess the impact of steel imports on the national security of the United States.1 2 Commerce submitted the results of the investigations to the President on January 11, 2018.3 On March 8, 2018, the President announced his decision to impose 25 percent ad valorem duties on specified steel mill products from all U.S. trading partners, except Canada and Mexico.4 5
On March 22, 2018, the President authorized the suspension of tariffs on steel and aluminum products of the following countries: Argentina, Australia, Brazil, Canada, Mexico, member countries of the European Union, and Korea.6 On April 30, 2018, the President announced that the expiration of exemptions on tariffs on steel and aluminum imports from Canada, the European Union member states, and Mexico would occur on May 31, 2018.7 The President also announced the exemptions were extended permanently for Korea in return for agreeing to product-specific quotas beginning on January 1, 2019.8 Exemptions for Argentina, Australia, and Brazil were also extended until alternative restraints could be finalized.9
1 U.S. Department of Commerce website: https://www.commerce.gov/news/press-releases/2018/01/statement-department-commerce-submission-steel-section-232-report, retrieved December 11, 2018.
2 Section 232 of the Trade Expansion Act of 1962 (19 U.S.C. §1862) authorizes the Secretary of Commerce to conduct these investigations.
3 U.S. Department of Commerce website: https://www.commerce.gov/news/pressreleases/ 2018/01/statement-department-commerce-submission-steel-section-232-report, retrieved December 11, 2018.
4 Presidential Proclamation 9705 of March 8, 2018, Adjusting Imports of Steel Into the United States, 83 FR 11625.
5 For the purposes of this proclamation, “articles of iron or steel” are defined at the Harmonized Tariff Schedule (HTS) six-digit level as: 7206.10 through 7216.50, 7216.99 through 7301.10, 7302.10, 7302.40 through 7302.90, and 7304.10 through 7306.90, including any subsequent revisions to these HTS classifications.
6 Presidential Proclamation 9711 of March 22, 2018, Adjusting Imports of Steel Into the United States, 83 FR 13361.
7 Presidential Proclamation 9740 of April 30, 2018, Adjusting Imports of Steel Into the United States, 83 FR 20683.
8 Presidential Proclamation 9740 of April 30, 2018, Adjusting Imports of Steel Into the United States, 83 FR 20683.
9 Presidential Proclamation 9740 of April 30, 2018, Adjusting Imports of Steel Into the United States, 83 FR 20683.

E-4
On May 31, 2018, under a Presidential Proclamation issued under Section 232 of the Trade Expansion Act of 1962, the President announced tariffs would no longer be suspended for steel and aluminum imports from Mexico, Canada, and the European Union, effective July 1, 2018. Steel products from these countries became subject to a 25 percent ad valorem duty.10
A subsequent Presidential proclamation established absolute quotas for Argentina, Brazil, and Korea as an alternate to the 25 percent ad valorem duty for imports of steel mill articles, effective June 1, 2018 (leaving Australia as the only country exempt from both tariffs and quotas).11 12 On August 10, 2018, the President authorized adjusting the ad valorem tariff on steel imports from Turkey from 25 percent to 50 percent.13
In the President’s proclamation establishing the tariff under Section 232, the Secretary of Commerce was authorized to provide relief from the 25 percent ad valorem duties for any steel articles determined “not to be produced in the United States in a sufficient and reasonably available amount or of a satisfactory quality and is also authorized to provide such relief based upon specific national security considerations. Such relief shall be provided for any article only after a request for exclusion is made by a directly affected party located in the United States.”14
Approved exclusions are made on a product specific basis and are limited to the individual or organization that submitted the specific exclusion request, unless Commerce approves a broader application of the product based exclusion request for additional importers.15 16
10 Presidential Proclamation 9759 of May 31, 2018, Adjusting Imports of Steel into the United States, 83 FR 25857, June 5, 2018.
11 U.S. Customs and Border Protection, “QB 18-126 Absolute Quotas for Steel Mill Articles: Argentina, Brazil and Korea,” https://www.cbp.gov/trade/quota/bulletins/qb-18-126-absolute-quota-aluminum-products-argentina-brazil-south-korea, retrieved December 11, 2018.
12 U.S. Customs and Border Protection, “Section 232 Tariffs on Aluminum and Steel,” https://www.cbp.gov/trade/programs-administration/entry-summary/232-tariffs-aluminum-and-steel, retrieved December 11, 2018.
13 Presidential Proclamation 9772 of August 10, 2018, Adjusting Imports of Steel Into the United States, 83 FR 40429, August 15, 2018.
14 U.S. Department of Commerce, Bureau of Industry and Security, “Section 232 National Security Investigation of Steel Imports Information on the Exclusion and Objection Process,” https://www.bis.doc.gov/index.php/232-steel, retrieved December 11, 2018.
15 Requirements for Submissions Requesting Exclusions from the Remedies Instituted in Presidential Proclamations Adjusting Imports of Steel into the United States and Adjusting Imports of Aluminum into the United States; and the Filing Objections to Submitted Exclusion request for Steel and Aluminum, 83 FR 12106, March 19, 2018.
16 Whirlpool ***. Large Residential Washers: Monitoring Developments in the Domestic Industry, Investigation No. TA-204-013, August 2019. Confidential Report, Exhibit F.
Samsung stated that it has ***. With respect to steel, Samsung ***. Large Residential Washers: Monitoring Developments in the Domestic Industry, Investigation No. TA-204-013, August 2019. Confidential Report, Exhibit F.
(continued...)

E-5
On June 20, 2018, Commerce announced its first set of product exclusions granted from Section 232 tariffs on steel imports. Forty-two exclusion requests were granted, covering seven companies importing steel products from Japan, Sweden, Belgium, Germany, and China.17
On May 16, 2019, the President modified proclamation 9705 to remove the higher tariff on steel imports from Turkey imposed by Proclamation 9772, and to instead impose a 25 percent ad valorem tariff on steel imports from Turkey, commensurate with the tariff imposed on such articles by the Section 232 remedy imported from most other countries.18
On May 19, 2019, the President issued two Proclamations adjusting Proclamations 9704 and 9705 after the United States announced an agreement with Canada and Mexico to remove the Section 232 tariffs for steel imports from those countries.19
On January 20, 2020, the President issued Proclamation 9980 on Adjusting Imports of Derivative Aluminum Articles and Derivative Steel Articles into the United States under Section 232. The Proclamation stated that imports of derivative steel articles specified in Annex II shall be subject to an additional 25 percent ad valorem rate of duty. These rates of duty, which are in
GE stated that it ***. Large Residential Washers: Monitoring Developments in the Domestic Industry, Investigation No. TA-204-013, August 2019. Confidential Report, Exhibit F.
LG stated that it utilizes three types of steel that are all subject to Section 232 duties: ***. LG also stated that it ***. LG’s posthearing brief, att. A, p. 2. LG also states that it ***. Large Residential Washers: Monitoring Developments in the Domestic Industry, Investigation No. TA-204-013, August 2019. Confidential report, Exhibit F.
17 The seven companies receiving the exclusions are: Schick Manufacturing, Inc. of Shelton, Connecticut; Nachi America Inc. of Greenwood, Indiana; Hankev International of Buena Park, California; Zapp Precision Wire of Summerville, South Carolina; U.S. Leakless, Inc. of Athens, Alabama; Woodings Industrial Corporation of Mars, Pennsylvania; and PolyVision Corporation of Atlanta, Georgia. The exempted products were not specified. U.S. Department of Commerce, “Department of Commerce Grants First Product Exclusion Requests from Section 232 Tariffs on Steel Imports,” https://www.commerce.gov/news/press-releases/2018/06/department-commerce-grants-first-product-exclusion-requests-section-232, retrieved December 11, 2018.
18 White House website: https://www.whitehouse.gov/presidential-actions/proclamation-adjusting-imports-steel-united-states/, retrieved June 6, 2019.
19 White House website: https://www.whitehouse.gov/presidential-actions/proclamation-adjusting-imports-steel-united-states-2/, retrieved June 6, 2019.

E-6
addition to any other duties, apply to imports from all countries except Argentina, Australia, Brazil, Canada, Mexico, and South Korea.20
On August 6, 2020, the President issued a Presidential Proclamation on Adjusting Imports of Aluminum into the United States, announcing that certain aluminum articles imported under HTS subheading 7601.10 that are the products of Canada will be subject to the additional 10 percent ad valorem rate of duty, effective August 16, 2020.21
Aluminum
On April 26, 2017, Commerce initiated an investigation under section 232 of the Trade Expansion Act of 1962 as amended (19 U.S.C. 1862), to assess the impact of aluminum imports on the national security of the United States.22 23 Commerce submitted the results of the investigations to the President on January 19, 2018.24 On March 8, 2018, the President announced his decision to impose 10 percent ad valorem duties on specified aluminum products from all U.S. trading partners, except Canada and Mexico.25 26
On March 22, 2018, the President authorized the suspension of tariffs on steel and aluminum products of the following countries: Argentina, Australia, Brazil, Canada, Mexico, member countries of the European Union, and Korea.27 On April 30, 2018, the President announced that the expiration of exemptions on tariffs on steel and aluminum imports from Canada, the European Union member states, and Mexico would occur on May 31, 2018.28
20 Presidential Proclamation 9908 of January 24, 2020, Adjusting Imports of Derivative Aluminum Articles and Derivative Steel Articles Into the United States, 85 FR 5281, January 29, 2020.
21 White House website: https://www.whitehouse.gov/presidential-actions/proclamation-adjusting-imports-aluminum-united-states-080620/, retrieved October 7, 2020.
22 U.S. Department of Commerce website: https://www.commerce.gov/issues/trade-enforcement/section-232-aluminum#memo, retrieved December 19, 2018.
23 Section 232 of the Trade Expansion Act of 1962 (19 U.S.C. §1862) authorizes the Secretary of Commerce to conduct these investigations.
24 White House website: https://www.whitehouse.gov/presidential-actions/presidential-proclamation-adjusting-imports-aluminum-united-states/, retrieved December 19, 2018.
25 Presidential Proclamation 9704 of March 8, 2018, Adjusting Imports of Aluminum Into the United States, 83 FR 11619, December 19, 2018.
26 For the purposes of this proclamation, “articles of aluminum” are defined at the Harmonized Tariff Schedule (HTS) as: 7601, 7604, 7605, 7606, 7607, 7608, 7609, 7616.99.51.60, and 7616.99.51.70, including any subsequent revisions to these HTS classifications.
27 Presidential Proclamation 9710 of March 22, 2018, Adjusting Imports of Aluminum Into the United States, 83 FR 13355, December 19, 2018.
28 Presidential Proclamation 9739 of April 30, 2018, Adjusting Imports of Aluminum Into the United States, 83 FR 20677, December 19, 2018.

E-7
Exemptions for Argentina, Australia, and Brazil were also extended until alternative restraints could be finalized.29
On May 31, 2018, under a Presidential Proclamation issued under Section 232 of the Trade Expansion Act of 1962, the President announced tariffs will no longer be suspended for steel and aluminum imports from Brazil, Mexico, Canada, and the European Union, effective July 1, 2018. Aluminum products from these countries will be subject to a 10 percent ad valorem duty.30
A subsequent Presidential proclamation established absolute quotas for Argentina, as an alternate to the 10 percent ad valorem duty for imports of aluminum articles, effective June 1, 2018 (leaving Australia as the only country exempt from both tariffs and quotas).31
In the President’s proclamation establishing the tariff under Section 232, the Secretary of Commerce was authorized to provide relief from the 10 percent ad valorem duties for any steel articles determined “not to be produced in the United States in a sufficient and reasonably available amount or of a satisfactory quality and is also authorized to provide such relief based upon specific national security considerations. Such relief shall be provided for any article only after a request for exclusion is made by a directly affected party located in the United States.”32
Approved exclusions are made on a product specific basis and are limited to the individual or organization that submitted the specific exclusion request, unless Commerce approves a broader application of the product based exclusion request for additional importers.33 34
29 Ibid. 30 Presidential Proclamation 9758 of May 31, 2018, Adjusting Imports of Steel into the United States,
83 FR 25849, December 19, 2018. 31 U.S. Customs and Border Protection, “Section 232 Tariffs on Aluminum and Steel,”
https://www.cbp.gov/trade/programs-administration/entry-summary/232-tariffs-aluminum-and-steel, retrieved December 11, 2018.
32 U.S. Department of Commerce Announces Steel and Aluminum Tariff Exclusion Process https://www.commerce.gov/news/press-releases/2018/03/us-department-commerce-announces-steel-and-aluminum-tariff-exclusion, retrieved December 19, 2018.
33 Requirements for Submissions Requesting Exclusions from the Remedies Instituted in Presidential Proclamations Adjusting Imports of Steel into the United States and Adjusting Imports of Aluminum into the United States; and the Filing Objections to Submitted Exclusion request for Steel and Aluminum, 83 FR 12106, March 19, 2018.
34 LG states that it utilizes *** in its production of LRWs. At present, ***. LG notes that each LG ***, and each ***. LG states that no aluminum producer in the United States can produce the *** so it submitted an exclusion request but the outcome of the exclusion request is still pending. Large Residential Washers: Monitoring Developments in the Domestic Industry, Investigation No. TA-204-013, August 2019. Confidential Report, Exhibit F.

E-8
On June 20, 2018, Commerce announced its first set of product exclusions granted from
Section 232 tariffs on aluminum imports. Sixty-two exclusion requests were granted, with the following companies receiving the exclusions: Ball Metal Beverage Container Corp. of Broomfield, Colorado; Bemis Company, Inc. of Neenah, Wisconsin; Channel Alloys of Norwalk, Connecticut; Constellium-UACJ ABS LLC of Bowling Green, Kentucky; Cornell Dubilier Marketing of Liberty, South Carolina; Garmco, Inc. of Winter Garden, Florida; Generac Power Systems of Waukesha, Wisconsin; International Converter, LLC of Caldwell, Ohio; Mandel Metals, Inc. of Franklin Park, Illinois; ProAmpac Intermediate Inc. of Cincinnati, Ohio; Schluter Systems of Plattsburgh, New York; Trinidad/Benham Corp. of Denver, Colorado.35 The exempted products include 6020 T8 Cold finished aluminum bars, high purity etched and “formed foil, and cansheet body stock of 3104/H19 alloy.36
On May 19, 2019, the President issued two Proclamations adjusting Proclamations 9704 and 9705 after the United States announced an agreement with Canada and Mexico to remove the Section 232 tariffs for aluminum imports from those countries.37
On January 20, 2020, the President issued Proclamation 9980 on Adjusting Imports of Derivative Aluminum Articles and Derivative Steel Articles into the United States under Section 232. The Proclamation stated that imports of derivative aluminum articles in Annex I shall be subject to an additional 10 percent ad valorem rate of duty except Argentina, Australia, Canada, and Mexico.38
Section 301 proceeding
Section 301 of the Trade Act of 1974, as amended (“Trade Act”),39 authorizes the USTR, at the direction of the President, to take appropriate action to respond to a foreign country’s unfair trade practices. On August 18, 2017, the USTR initiated an investigation into certain policies and practices of the Government of China related to technology transfer, intellectual
35 U.S. Department of Commerce, Requirements for Submissions Requesting Exclusions from the Remedies Instituted in Presidential Proclamations Adjusting Imports of Steel into the United States and Adjusting Imports of Aluminum into the United States; and the Filing Objections to Submitted Exclusion request for Steel and Aluminum, Docket ID BIS-2018-0002, https://www.regulations.gov/docket?D=BIS-2018-0002, retrieved December 20, 2018.
36 S&P Global, “US Commerce grants first Section 232 aluminum product exclusion,” https://www.spglobal.com/platts/en/market-insights/latest-news/metals/071318-us-commerce-grants-first-section-232-aluminum-product-exclusions, retrieved December 20, 2018.
37 White House website: https://www.whitehouse.gov/presidential-actions/proclamation-adjusting-imports-aluminum-united-states/, retrieved June 6, 2019.
38 Presidential Proclamation 9908 of January 24, 2020, Adjusting Imports of Derivative Aluminum Articles and Derivative Steel Articles Into the United States, 85 FR 5281, January 29, 2020.
39 19 U.S.C. § 2411.
E-9
property, and innovation.40 On April 6, 2018, the USTR published its determination that the acts, policies, and practices of China under investigation are unreasonable or discriminatory and burden or restrict U.S. commerce, and are thus actionable under section 301(b) of the Trade Act.41 The USTR determined that it was appropriate and feasible to take action and proposed the imposition of an additional 25 percent duty on products from China with an annual trade value of approximately $50 billion. The additional duties were initially proposed in two tranches. Tranche 1 covered 818 tariff subheadings, with an approximate annual trade value of $34 billion.42 Tranche 2 covered 279 tariff subheadings, with an approximate annual trade value of $16 billion.
On September 21, 2018, the USTR published a notice in the Federal Register modifying its prior action in accordance with the specific direction of the President under his authority pursuant to section 307(a)(1) of the Trade Act, determining to include 5,745 full and partial tariff subheadings with an approximate annual trade value of $200 billion, while maintaining the prior action. The USTR determined that the rate of additional duty is initially 10 percent ad valorem, effective September 24, 2018.43 44
On May 9, 2019, USTR published a Notice of Modification of Action (84 FR 20459) in the Section 301 investigation increasing the duty rate to 25 percent on imports from China on the over 5,700 full and partial eight-digit subheadings of the HTSUS listed in Annex A to the USTR’s September 21, 2018 Notice, as amended. The increase in additional import duties for Chinese
40 Initiation of Section 301 Investigation; Hearing; and Request for Public Comments: China’s Acts, Policies, and Practices Related to Technology Transfer, Intellectual Property, and Innovation, 82 FR 40213, August 24, 2017.
41 Notice of Determination and Request for Public Comment Concerning Proposed Determination of Action Pursuant to Section 301: China’s Acts, Policies, and Practices Related to Technology Transfer, Intellectual Property, and Innovation, 83 FR 14906, April 6, 2018.
42 Notice of Action and Request for Public Comment Concerning Proposed Determination of Action Pursuant to Section 301: China’s Acts, Policies, and Practices Related to Technology Transfer, Intellectual Property, and Innovation, 83 FR 28710, June 20, 2018.
43 Notice of Modification of Section 301 Action: China’s Acts, Policies, and Practices Related to Technology Transfer, Intellectual Property, and Innovation, 83 FR 47974, September 21, 2018.
44 All four U.S. produces source a variety of LRW components that are subject to Section 301 measures. For further details see part III – Raw material costs. Whirlpool and GE ***. Large Residential Washers: Monitoring Developments in the Domestic Industry, Investigation No. TA-204-013, August 2019. Confidential report, Exhibit F.

E-10
goods covered by the September 21, 2018 Federal Register notice, as amended, became effective on May 10, 2019, at a rate of additional duties of 25 percent ad valorem.45 46
On August 30, 2019, in accordance with the specific direction of the President, the USTR published their determination to modify the action being taken in the Section 301 investigation by increasing the rate of additional duty from 10 to 15 percent for the products of China covered by the $300 billion tariff action (Tranche 4).47
45 Notice of Modification of Section 301 Action: China’s Acts, Policies, and Practices Related to Technology Transfer, Intellectual Property, and Innovation, 84 FR 20459, May 9, 2019.
46 Imports of products – including LRWs and certain parts – provided for in HTS subheadings 8450.11.00, 8450.20.00, 8450.90.20, and 8450.90.60 are included in the fourth list (“Fourth Tranche”) of 3,805 full and partial tariff subheadings for products originating from China, with an annual trade value of approximately $300 billion, that USTR proposed for additional duties up to 25 percent ad valorem. The President announced, on August 1, 2019, that the United States will impose additional 10 percent duties on these remaining $300 billion of products imported from China, effective September 1, 2019. See Request for Comments Concerning Proposed Modification of Action Pursuant to Section 301: China’s Acts, Policies, and Practices Related to Technology Transfer, Intellectual Property, and Innovation, Annex, Section 1, 84 FR 22564, May 17, 2019; The White House, “Remarks by President Trump Before Marine One Departure,” August 1, 2019, https://www.whitehouse.gov/briefings-statements/remarks-president-trump-marine-one-departure-56/.
47 Notice of Modification of Section 301 Action: China’s Acts, Policies, and Practices Related to Technology Transfer, Intellectual Property, and Innovation, 84 FR 45821, August 30, 2019.

F-1
APPENDIX F
U.S. IMPORTS USING OFFICIAL IMPORT STATISTICS

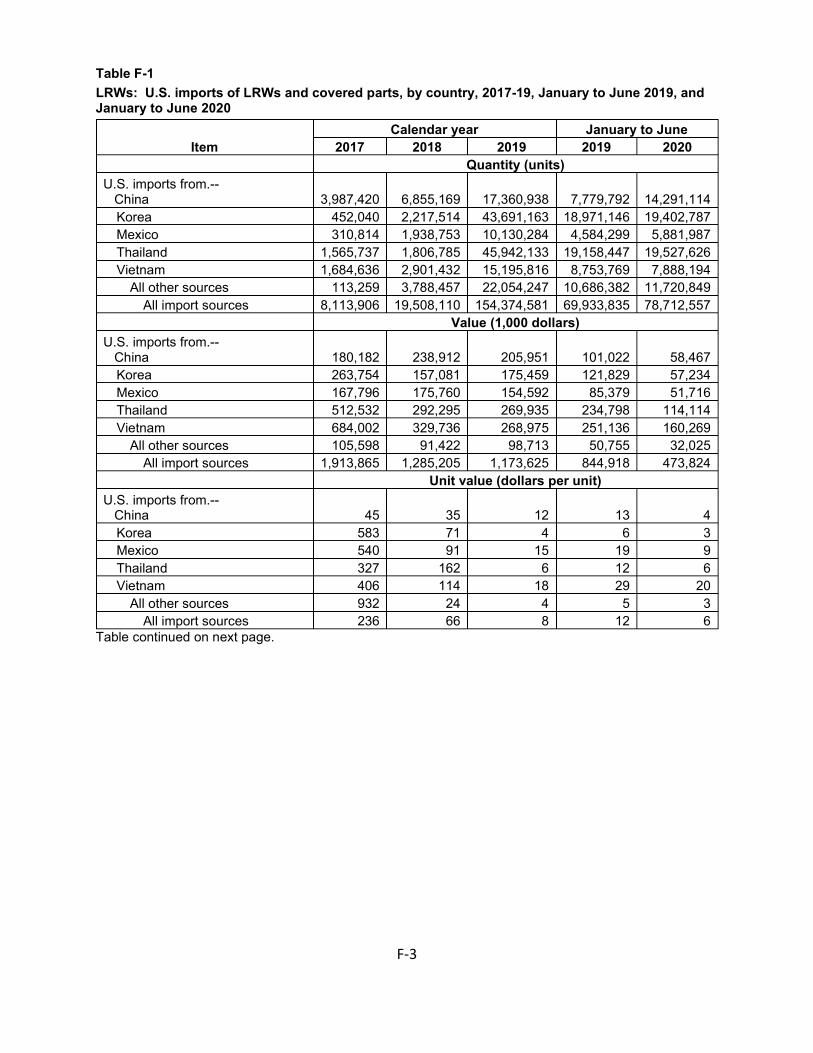
F-3
Table F-1 LRWs: U.S. imports of LRWs and covered parts, by country, 2017-19, January to June 2019, and January to June 2020
Item Calendar year January to June
2017 2018 2019 2019 2020 Quantity (units) U.S. imports from.-- China 3,987,420 6,855,169 17,360,938 7,779,792 14,291,114
Korea 452,040 2,217,514 43,691,163 18,971,146 19,402,787 Mexico 310,814 1,938,753 10,130,284 4,584,299 5,881,987 Thailand 1,565,737 1,806,785 45,942,133 19,158,447 19,527,626 Vietnam 1,684,636 2,901,432 15,195,816 8,753,769 7,888,194
All other sources 113,259 3,788,457 22,054,247 10,686,382 11,720,849 All import sources 8,113,906 19,508,110 154,374,581 69,933,835 78,712,557
Value (1,000 dollars) U.S. imports from.-- China 180,182 238,912 205,951 101,022 58,467
Korea 263,754 157,081 175,459 121,829 57,234 Mexico 167,796 175,760 154,592 85,379 51,716 Thailand 512,532 292,295 269,935 234,798 114,114 Vietnam 684,002 329,736 268,975 251,136 160,269
All other sources 105,598 91,422 98,713 50,755 32,025 All import sources 1,913,865 1,285,205 1,173,625 844,918 473,824
Unit value (dollars per unit) U.S. imports from.-- China 45 35 12 13 4
Korea 583 71 4 6 3 Mexico 540 91 15 19 9 Thailand 327 162 6 12 6 Vietnam 406 114 18 29 20
All other sources 932 24 4 5 3 All import sources 236 66 8 12 6
Table continued on next page.

F-4
Table F-1--Continued LRWs: U.S. imports of LRWs and covered parts, by country, 2017-19, January to June 2019, and January to June 2020
Item Calendar year January to June
2017 2018 2019 2019 2020 Share of quantity (percent) U.S. imports from.-- China 49.1 35.1 11.2 11.1 18.2
Korea 5.6 11.4 28.3 27.1 24.7 Mexico 3.8 9.9 6.6 6.6 7.5 Thailand 19.3 9.3 29.8 27.4 24.8 Vietnam 20.8 14.9 9.8 12.5 10.0
All other sources 1.4 19.4 14.3 15.3 14.9 All import sources 100.0 100.0 100.0 100.0 100.0
Share of value (percent) U.S. imports from.-- China 9.4 18.6 17.5 12.0 12.3
Korea 13.8 12.2 15.0 14.4 12.1 Mexico 8.8 13.7 13.2 10.1 10.9 Thailand 26.8 22.7 23.0 27.8 24.1 Vietnam 35.7 25.7 22.9 29.7 33.8
All other sources 5.5 7.1 8.4 6.0 6.8 All import sources 100.0 100.0 100.0 100.0 100.0
Note: Shares and ratios shown as "0.0" represent values greater than zero, but less than "0.05" percent. Note: Imports are likely overstated due to the inclusion of out-of-scope residential washers, such as extra-wide washers, and FTZ withdrawals by *** of imports from China. Source: Official U.S. import statistics using HTS reporting numbers 8450.20.0040, 8450.20.0080, 8450.90.2000, and 8450.90.6000, accessed August 25, 2020.
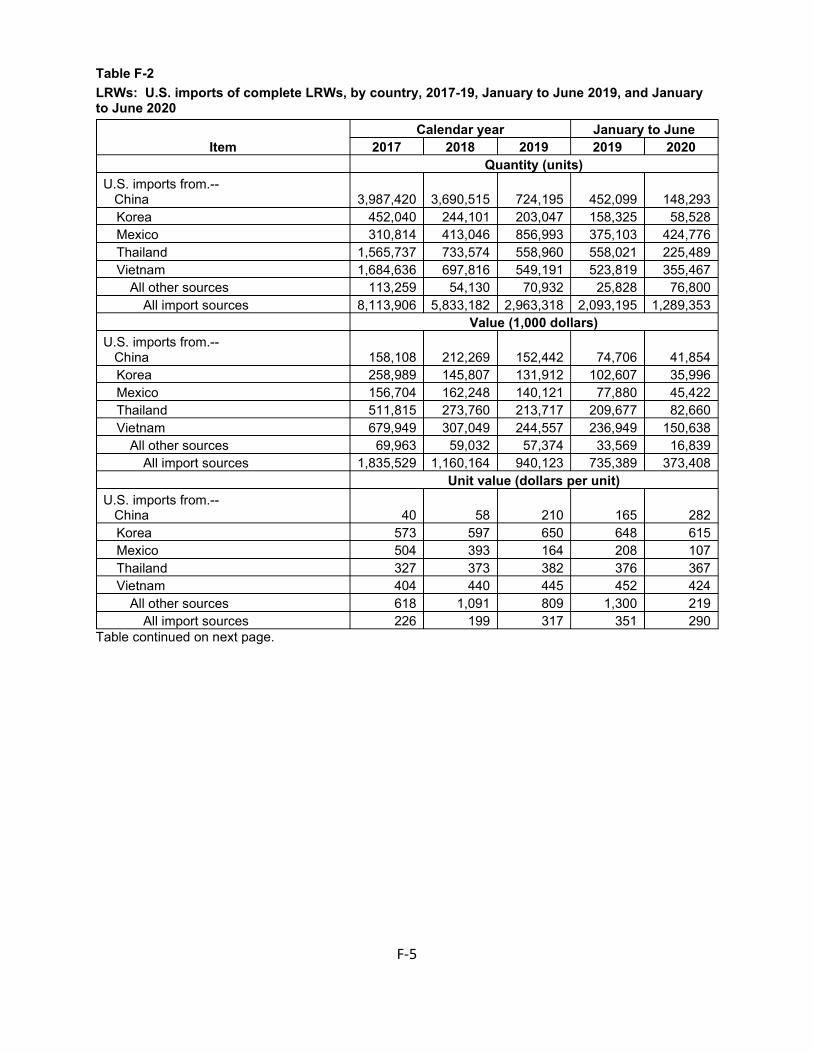
F-5
Table F-2 LRWs: U.S. imports of complete LRWs, by country, 2017-19, January to June 2019, and January to June 2020
Item Calendar year January to June
2017 2018 2019 2019 2020 Quantity (units) U.S. imports from.-- China 3,987,420 3,690,515 724,195 452,099 148,293
Korea 452,040 244,101 203,047 158,325 58,528 Mexico 310,814 413,046 856,993 375,103 424,776 Thailand 1,565,737 733,574 558,960 558,021 225,489 Vietnam 1,684,636 697,816 549,191 523,819 355,467
All other sources 113,259 54,130 70,932 25,828 76,800 All import sources 8,113,906 5,833,182 2,963,318 2,093,195 1,289,353
Value (1,000 dollars) U.S. imports from.-- China 158,108 212,269 152,442 74,706 41,854
Korea 258,989 145,807 131,912 102,607 35,996 Mexico 156,704 162,248 140,121 77,880 45,422 Thailand 511,815 273,760 213,717 209,677 82,660 Vietnam 679,949 307,049 244,557 236,949 150,638
All other sources 69,963 59,032 57,374 33,569 16,839 All import sources 1,835,529 1,160,164 940,123 735,389 373,408
Unit value (dollars per unit) U.S. imports from.-- China 40 58 210 165 282
Korea 573 597 650 648 615 Mexico 504 393 164 208 107 Thailand 327 373 382 376 367 Vietnam 404 440 445 452 424
All other sources 618 1,091 809 1,300 219 All import sources 226 199 317 351 290
Table continued on next page.

F-6
Table F-2--Continued LRWs: U.S. imports of complete LRWs, by country, 2017-19, January to June 2019, and January to June 2020
Item Calendar year January to June
2017 2018 2019 2019 2020 Share of quantity (percent) U.S. imports from.-- China 49.1 63.3 24.4 21.6 11.5
Korea 5.6 4.2 6.9 7.6 4.5 Mexico 3.8 7.1 28.9 17.9 32.9 Thailand 19.3 12.6 18.9 26.7 17.5 Vietnam 20.8 12.0 18.5 25.0 27.6
All other sources 1.4 0.9 2.4 1.2 6.0 All import sources 100.0 100.0 100.0 100.0 100.0
Share of value (percent) U.S. imports from.-- China 8.6 18.3 16.2 10.2 11.2
Korea 14.1 12.6 14.0 14.0 9.6 Mexico 8.5 14.0 14.9 10.6 12.2 Thailand 27.9 23.6 22.7 28.5 22.1 Vietnam 37.0 26.5 26.0 32.2 40.3
All other sources 3.8 5.1 6.1 4.6 4.5 All import sources 100.0 100.0 100.0 100.0 100.0
Note: Shares and ratios shown as "0.0" represent values greater than zero, but less than "0.05" percent. Note: Imports are likely overstated due to the inclusion of out-of-scope residential washers, such as extra-wide washers, and FTZ withdrawals by *** of imports from China. Source: Official U.S. import statistics using HTS reporting numbers 8450.20.0040 and 8450.20.0080, accessed August 25, 2020.

F-7
Table F-3 LRWs: U.S. imports of covered parts, by country, 2017-19, January to June 2019, and January to June 2020
Item Calendar year January to June
2017 2018 2019 2019 2020 Quantity (units) U.S. imports from.-- China --- 3,164,654 16,636,743 7,327,693 14,142,821
Korea --- 1,973,413 43,488,116 18,812,82
1 19,344,259 Mexico --- 1,525,707 9,273,291 4,209,196 5,457,211
Thailand --- 1,073,211 45,383,173 18,600,42
6 19,302,137 Vietnam --- 2,203,616 14,646,625 8,229,950 7,532,727
All other sources --- 3,734,327 21,983,315 10,660,55
4 11,644,049
All import sources --- 13,674,928 151,411,263 67,840,64
0 77,423,204 Value (1,000 dollars) U.S. imports from.-- China 22,074 26,644 53,509 26,317 16,613
Korea 4,766 11,274 43,547 19,221 21,238 Mexico 11,091 13,512 14,472 7,499 6,294 Thailand 717 18,535 56,217 25,120 31,454 Vietnam 4,053 22,687 24,418 14,187 9,631 All other sources 35,635 32,390 41,340 17,186 15,186
All import sources 78,336 125,041 233,502 109,529 100,416 Unit value (dollars per unit) U.S. imports from.-- China --- 8 3 4 1
Korea --- 6 1 1 1 Mexico --- 9 2 2 1 Thailand --- 17 1 1 2 Vietnam --- 10 2 2 1 All other sources --- 9 2 2 1
All import sources --- 9 2 2 1 Table continued on next page.

F-8
Table F-3--Continued LRWs: U.S. imports of covered parts, by country, 2017-19, January to June 2019, and January to June 2020
Item Calendar year January to June
2017 2018 2019 2019 2020 Share of quantity (percent) U.S. imports from.-- China --- 23.1 11.0 10.8 18.3
Korea --- 14.4 28.7 27.7 25.0 Mexico --- 11.2 6.1 6.2 7.0 Thailand --- 7.8 30.0 27.4 24.9 Vietnam --- 16.1 9.7 12.1 9.7 All other sources --- 27.3 14.5 15.7 15.0
All import sources --- 100.0 100.0 100.0 100.0 Share of value (percent) U.S. imports from.-- China 28.2 21.3 22.9 24.0 16.5
Korea 6.1 9.0 18.6 17.5 21.2 Mexico 14.2 10.8 6.2 6.8 6.3 Thailand 0.9 14.8 24.1 22.9 31.3 Vietnam 5.2 18.1 10.5 13.0 9.6 All other sources 45.5 25.9 17.7 15.7 15.1
All import sources 100.0 100.0 100.0 100.0 100.0 Note: Shares and ratios shown as "0.0" represent values greater than zero, but less than "0.05" percent. Note: Imports may be overstated due to FTZ withdrawals by *** of imports from China. Source: Official U.S. import statistics using HTS reporting numbers 8450.90.2000, and 8450.90.6000, accessed August 25, 2020.

G-1
APPENDIX G
PRICING DATA BY COUNTRY SOURCE


G-3
Two importers (*** and ***) reported price data for imported LRWs from China, Korea, Thailand, and Vietnam for products 1-10. Price data reported by these firms accounted for *** percent of U.S. commercial shipments from China, *** percent of commercial shipments from Korea, *** percent of commercial shipments from Thailand, and *** percent of commercial shipments from Vietnam in 2019. These price items and accompanying data are comparable to those presented in tables VII-1 to VII-10. Price and quantity data by country source are shown in tables G-1 to G-10 and in figures G-1 to G-10 (with domestic sources).

G-4
Table G-1 LRWs: Weighted-average f.o.b. prices and quantities of domestic and imported product 1, by country source, by quarter, January 2017 through June 2020
Period
United States China Korea Thailand Price
(dollars per
unit) Quantity (units)
Price (dollars
per unit)
Quantity (units)
Price (dollars
per unit)
Quantity (units)
Price (dollars
per unit)
Quantity (units)
2017: Jan.-Mar. *** *** *** *** *** *** *** *** Apr.-Jun. *** *** *** *** *** *** *** *** Jul.-Sep. *** *** *** *** *** *** *** *** Oct.-Dec. *** *** *** *** *** *** *** *** 2018: Jan.-Mar. *** *** *** *** *** *** *** *** Apr.-Jun. *** *** *** *** *** *** *** *** Jul.-Sep. *** *** *** *** *** *** *** *** Oct.-Dec. *** *** *** *** *** *** *** *** 2019: Jan.-Mar. *** *** *** *** *** *** *** *** Apr.-Jun. *** *** *** *** *** *** *** *** Jul.-Sep. *** *** *** *** *** *** *** *** Oct.-Dec. *** *** *** *** *** *** *** *** 2020: Jan.-Mar. *** *** *** *** *** *** *** *** Apr.-Jun. *** *** *** *** *** *** *** ***
Period
Vietnam
Price (dollars
per unit)
Quantity (units)
2017: Jan.-Mar. *** *** Apr.-Jun. *** *** Jul.-Sep. *** *** Oct.-Dec. *** *** 2018: Jan.-Mar. *** *** Apr.-Jun. *** *** Jul.-Sep. *** *** Oct.-Dec. *** *** 2019: Jan.-Mar. *** *** Apr.-Jun. *** *** Jul.-Sep. *** *** Oct.-Dec. *** *** 2020: Jan.-Mar. *** *** Apr.-Jun. *** ***
Source: Compiled from data submitted in response to Commission questionnaires.

G-5
Table G-2 LRWs: Weighted-average f.o.b. prices and quantities of domestic and imported product 2, by country source, by quarter, January 2017 through June 2020
Period
United States China Korea Thailand Price
(dollars per
unit) Quantity (units)
Price (dollars
per unit)
Quantity (units)
Price (dollars
per unit)
Quantity (units)
Price (dollars
per unit)
Quantity (units)
2017: Jan.-Mar. *** *** *** *** *** *** *** *** Apr.-Jun. *** *** *** *** *** *** *** *** Jul.-Sep. *** *** *** *** *** *** *** *** Oct.-Dec. *** *** *** *** *** *** *** *** 2018: Jan.-Mar. *** *** *** *** *** *** *** *** Apr.-Jun. *** *** *** *** *** *** *** *** Jul.-Sep. *** *** *** *** *** *** *** *** Oct.-Dec. *** *** *** *** *** *** *** *** 2019: Jan.-Mar. *** *** *** *** *** *** *** *** Apr.-Jun. *** *** *** *** *** *** *** *** Jul.-Sep. *** *** *** *** *** *** *** *** Oct.-Dec. *** *** *** *** *** *** *** *** 2020: Jan.-Mar. *** *** *** *** *** *** *** *** Apr.-Jun. *** *** *** *** *** *** *** ***
Period
Vietnam
Price (dollars
per unit)
Quantity (units)
2017: Jan.-Mar. *** *** Apr.-Jun. *** *** Jul.-Sep. *** *** Oct.-Dec. *** *** 2018: Jan.-Mar. *** *** Apr.-Jun. *** *** Jul.-Sep. *** *** Oct.-Dec. *** *** 2019: Jan.-Mar. *** *** Apr.-Jun. *** *** Jul.-Sep. *** *** Oct.-Dec. *** *** 2020: Jan.-Mar. *** *** Apr.-Jun. *** ***
Source: Compiled from data submitted in response to Commission questionnaires.

G-6
Table G-3 LRWs: Weighted-average f.o.b. prices and quantities of domestic and imported product 3, by country source, by quarter, January 2017 through June 2020
Period
United States China Korea Thailand Price
(dollars per
unit) Quantity (units)
Price (dollars
per unit)
Quantity (units)
Price (dollars
per unit)
Quantity (units)
Price (dollars
per unit)
Quantity (units)
2017: Jan.-Mar. *** *** *** *** *** *** *** *** Apr.-Jun. *** *** *** *** *** *** *** *** Jul.-Sep. *** *** *** *** *** *** *** *** Oct.-Dec. *** *** *** *** *** *** *** *** 2018: Jan.-Mar. *** *** *** *** *** *** *** *** Apr.-Jun. *** *** *** *** *** *** *** *** Jul.-Sep. *** *** *** *** *** *** *** *** Oct.-Dec. *** *** *** *** *** *** *** *** 2019: Jan.-Mar. *** *** *** *** *** *** *** *** Apr.-Jun. *** *** *** *** *** *** *** *** Jul.-Sep. *** *** *** *** *** *** *** *** Oct.-Dec. *** *** *** *** *** *** *** *** 2020: Jan.-Mar. *** *** *** *** *** *** *** *** Apr.-Jun. *** *** *** *** *** *** *** ***
Period
Vietnam
Price (dollars
per unit)
Quantity (units)
2017: Jan.-Mar. *** *** Apr.-Jun. *** *** Jul.-Sep. *** *** Oct.-Dec. *** *** 2018: Jan.-Mar. *** *** Apr.-Jun. *** *** Jul.-Sep. *** *** Oct.-Dec. *** *** 2019: Jan.-Mar. *** *** Apr.-Jun. *** *** Jul.-Sep. *** *** Oct.-Dec. *** *** 2020: Jan.-Mar. *** *** Apr.-Jun. *** ***
Source: Compiled from data submitted in response to Commission questionnaires.

G-7
Table G-4 LRWs: Weighted-average f.o.b. prices and quantities of domestic and imported product 4, by country source, by quarter, January 2017 through June 2020
Period
United States China Korea Thailand Price
(dollars per
unit) Quantity (units)
Price (dollars
per unit)
Quantity (units)
Price (dollars
per unit)
Quantity (units)
Price (dollars
per unit)
Quantity (units)
2017: Jan.-Mar. *** *** *** *** *** *** *** *** Apr.-Jun. *** *** *** *** *** *** *** *** Jul.-Sep. *** *** *** *** *** *** *** *** Oct.-Dec. *** *** *** *** *** *** *** *** 2018: Jan.-Mar. *** *** *** *** *** *** *** *** Apr.-Jun. *** *** *** *** *** *** *** *** Jul.-Sep. *** *** *** *** *** *** *** *** Oct.-Dec. *** *** *** *** *** *** *** *** 2019: Jan.-Mar. *** *** *** *** *** *** *** *** Apr.-Jun. *** *** *** *** *** *** *** *** Jul.-Sep. *** *** *** *** *** *** *** *** Oct.-Dec. *** *** *** *** *** *** *** *** 2020: Jan.-Mar. *** *** *** *** *** *** *** *** Apr.-Jun. *** *** *** *** *** *** *** ***
Period
Vietnam
Price (dollars
per unit)
Quantity (units)
2017: Jan.-Mar. *** *** Apr.-Jun. *** *** Jul.-Sep. *** *** Oct.-Dec. *** *** 2018: Jan.-Mar. *** *** Apr.-Jun. *** *** Jul.-Sep. *** *** Oct.-Dec. *** *** 2019: Jan.-Mar. *** *** Apr.-Jun. *** *** Jul.-Sep. *** *** Oct.-Dec. *** *** 2020: Jan.-Mar. *** *** Apr.-Jun. *** ***
Source: Compiled from data submitted in response to Commission questionnaires.

G-8
Table G-5 LRWs: Weighted-average f.o.b. prices and quantities of domestic and imported product 5, by country source, by quarter, January 2017 through June 2020
Period
United States China Korea Thailand Price
(dollars per
unit) Quantity (units)
Price (dollars
per unit)
Quantity (units)
Price (dollars
per unit)
Quantity (units)
Price (dollars
per unit)
Quantity (units)
2017: Jan.-Mar. *** *** *** *** *** *** *** *** Apr.-Jun. *** *** *** *** *** *** *** *** Jul.-Sep. *** *** *** *** *** *** *** *** Oct.-Dec. *** *** *** *** *** *** *** *** 2018: Jan.-Mar. *** *** *** *** *** *** *** *** Apr.-Jun. *** *** *** *** *** *** *** *** Jul.-Sep. *** *** *** *** *** *** *** *** Oct.-Dec. *** *** *** *** *** *** *** *** 2019: Jan.-Mar. *** *** *** *** *** *** *** *** Apr.-Jun. *** *** *** *** *** *** *** *** Jul.-Sep. *** *** *** *** *** *** *** *** Oct.-Dec. *** *** *** *** *** *** *** *** 2020: Jan.-Mar. *** *** *** *** *** *** *** *** Apr.-Jun. *** *** *** *** *** *** *** ***
Period
Vietnam
Price (dollars
per unit)
Quantity (units)
2017: Jan.-Mar. *** *** Apr.-Jun. *** *** Jul.-Sep. *** *** Oct.-Dec. *** *** 2018: Jan.-Mar. *** *** Apr.-Jun. *** *** Jul.-Sep. *** *** Oct.-Dec. *** *** 2019: Jan.-Mar. *** *** Apr.-Jun. *** *** Jul.-Sep. *** *** Oct.-Dec. *** *** 2020: Jan.-Mar. *** *** Apr.-Jun. *** ***
Source: Compiled from data submitted in response to Commission questionnaires.

G-9
Table G-6 LRWs: Weighted-average f.o.b. prices and quantities of domestic and imported product 6, by country source, by quarter, January 2017 through June 2020
Period
United States China Korea Thailand Price
(dollars per
unit) Quantity (units)
Price (dollars
per unit)
Quantity (units)
Price (dollars
per unit)
Quantity (units)
Price (dollars
per unit)
Quantity (units)
2017: Jan.-Mar. *** *** *** *** *** *** *** *** Apr.-Jun. *** *** *** *** *** *** *** *** Jul.-Sep. *** *** *** *** *** *** *** *** Oct.-Dec. *** *** *** *** *** *** *** *** 2018: Jan.-Mar. *** *** *** *** *** *** *** *** Apr.-Jun. *** *** *** *** *** *** *** *** Jul.-Sep. *** *** *** *** *** *** *** *** Oct.-Dec. *** *** *** *** *** *** *** *** 2019: Jan.-Mar. *** *** *** *** *** *** *** *** Apr.-Jun. *** *** *** *** *** *** *** *** Jul.-Sep. *** *** *** *** *** *** *** *** Oct.-Dec. *** *** *** *** *** *** *** *** 2020: Jan.-Mar. *** *** *** *** *** *** *** *** Apr.-Jun. *** *** *** *** *** *** *** ***
Period
Vietnam
Price (dollars
per unit)
Quantity (units)
2017: Jan.-Mar. *** *** Apr.-Jun. *** *** Jul.-Sep. *** *** Oct.-Dec. *** *** 2018: Jan.-Mar. *** *** Apr.-Jun. *** *** Jul.-Sep. *** *** Oct.-Dec. *** *** 2019: Jan.-Mar. *** *** Apr.-Jun. *** *** Jul.-Sep. *** *** Oct.-Dec. *** *** 2020: Jan.-Mar. *** *** Apr.-Jun. *** ***
Source: Compiled from data submitted in response to Commission questionnaires.

G-10
Table G-7 LRWs: Weighted-average f.o.b. prices and quantities of domestic and imported product 7, by country source, by quarter, January 2017 through June 2020
Period
United States China Korea Thailand Price
(dollars per
unit) Quantity (units)
Price (dollars
per unit)
Quantity (units)
Price (dollars
per unit)
Quantity (units)
Price (dollars
per unit)
Quantity (units)
2017: Jan.-Mar. *** *** *** *** *** *** *** *** Apr.-Jun. *** *** *** *** *** *** *** *** Jul.-Sep. *** *** *** *** *** *** *** *** Oct.-Dec. *** *** *** *** *** *** *** *** 2018: Jan.-Mar. *** *** *** *** *** *** *** *** Apr.-Jun. *** *** *** *** *** *** *** *** Jul.-Sep. *** *** *** *** *** *** *** *** Oct.-Dec. *** *** *** *** *** *** *** *** 2019: Jan.-Mar. *** *** *** *** *** *** *** *** Apr.-Jun. *** *** *** *** *** *** *** *** Jul.-Sep. *** *** *** *** *** *** *** *** Oct.-Dec. *** *** *** *** *** *** *** *** 2020: Jan.-Mar. *** *** *** *** *** *** *** *** Apr.-Jun. *** *** *** *** *** *** *** ***
Period
Vietnam
Price (dollars
per unit)
Quantity (units)
2017: Jan.-Mar. *** *** Apr.-Jun. *** *** Jul.-Sep. *** *** Oct.-Dec. *** *** 2018: Jan.-Mar. *** *** Apr.-Jun. *** *** Jul.-Sep. *** *** Oct.-Dec. *** *** 2019: Jan.-Mar. *** *** Apr.-Jun. *** *** Jul.-Sep. *** *** Oct.-Dec. *** *** 2020: Jan.-Mar. *** *** Apr.-Jun. *** ***
Source: Compiled from data submitted in response to Commission questionnaires.

G-11
Table G-8 LRWs: Weighted-average f.o.b. prices and quantities of domestic and imported product 8, by country source, by quarter, January 2017 through June 2020
Period
United States China Korea Thailand Price
(dollars per
unit) Quantity (units)
Price (dollars
per unit)
Quantity (units)
Price (dollars
per unit)
Quantity (units)
Price (dollars
per unit)
Quantity (units)
2017: Jan.-Mar. *** *** *** *** *** *** *** *** Apr.-Jun. *** *** *** *** *** *** *** *** Jul.-Sep. *** *** *** *** *** *** *** *** Oct.-Dec. *** *** *** *** *** *** *** *** 2018: Jan.-Mar. *** *** *** *** *** *** *** *** Apr.-Jun. *** *** *** *** *** *** *** *** Jul.-Sep. *** *** *** *** *** *** *** *** Oct.-Dec. *** *** *** *** *** *** *** *** 2019: Jan.-Mar. *** *** *** *** *** *** *** *** Apr.-Jun. *** *** *** *** *** *** *** *** Jul.-Sep. *** *** *** *** *** *** *** *** Oct.-Dec. *** *** *** *** *** *** *** *** 2020: Jan.-Mar. *** *** *** *** *** *** *** *** Apr.-Jun. *** *** *** *** *** *** *** ***
Period
Vietnam
Price (dollars
per unit)
Quantity (units)
2017: Jan.-Mar. *** *** Apr.-Jun. *** *** Jul.-Sep. *** *** Oct.-Dec. *** *** 2018: Jan.-Mar. *** *** Apr.-Jun. *** *** Jul.-Sep. *** *** Oct.-Dec. *** *** 2019: Jan.-Mar. *** *** Apr.-Jun. *** *** Jul.-Sep. *** *** Oct.-Dec. *** *** 2020: Jan.-Mar. *** *** Apr.-Jun. *** ***
Source: Compiled from data submitted in response to Commission questionnaires.

G-12
Table G-9 LRWs: Weighted-average f.o.b. prices and quantities of domestic and imported product 9, by country source, by quarter, January 2017 through June 2020
Period
United States China Korea Thailand Price
(dollars per
unit) Quantity (units)
Price (dollars
per unit)
Quantity (units)
Price (dollars
per unit)
Quantity (units)
Price (dollars
per unit)
Quantity (units)
2017: Jan.-Mar. *** *** *** *** *** *** *** *** Apr.-Jun. *** *** *** *** *** *** *** *** Jul.-Sep. *** *** *** *** *** *** *** *** Oct.-Dec. *** *** *** *** *** *** *** *** 2018: Jan.-Mar. *** *** *** *** *** *** *** *** Apr.-Jun. *** *** *** *** *** *** *** *** Jul.-Sep. *** *** *** *** *** *** *** *** Oct.-Dec. *** *** *** *** *** *** *** *** 2019: Jan.-Mar. *** *** *** *** *** *** *** *** Apr.-Jun. *** *** *** *** *** *** *** *** Jul.-Sep. *** *** *** *** *** *** *** *** Oct.-Dec. *** *** *** *** *** *** *** *** 2020: Jan.-Mar. *** *** *** *** *** *** *** *** Apr.-Jun. *** *** *** *** *** *** *** ***
Period
Vietnam
Price (dollars
per unit)
Quantity (units)
2017: Jan.-Mar. *** *** Apr.-Jun. *** *** Jul.-Sep. *** *** Oct.-Dec. *** *** 2018: Jan.-Mar. *** *** Apr.-Jun. *** *** Jul.-Sep. *** *** Oct.-Dec. *** *** 2019: Jan.-Mar. *** *** Apr.-Jun. *** *** Jul.-Sep. *** *** Oct.-Dec. *** *** 2020: Jan.-Mar. *** *** Apr.-Jun. *** ***
Source: Compiled from data submitted in response to Commission questionnaires.

G-13
Table G-10 LRWs: Weighted-average f.o.b. prices and quantities of domestic and imported product 10, by country source, by quarter, January 2017 through June 2020
Period
United States China Korea Thailand Price
(dollars per
unit) Quantity (units)
Price (dollars
per unit)
Quantity (units)
Price (dollars
per unit)
Quantity (units)
Price (dollars
per unit)
Quantity (units)
2017: Jan.-Mar. *** *** *** *** *** *** *** *** Apr.-Jun. *** *** *** *** *** *** *** *** Jul.-Sep. *** *** *** *** *** *** *** *** Oct.-Dec. *** *** *** *** *** *** *** *** 2018: Jan.-Mar. *** *** *** *** *** *** *** *** Apr.-Jun. *** *** *** *** *** *** *** *** Jul.-Sep. *** *** *** *** *** *** *** *** Oct.-Dec. *** *** *** *** *** *** *** *** 2019: Jan.-Mar. *** *** *** *** *** *** *** *** Apr.-Jun. *** *** *** *** *** *** *** *** Jul.-Sep. *** *** *** *** *** *** *** *** Oct.-Dec. *** *** *** *** *** *** *** *** 2020: Jan.-Mar. *** *** *** *** *** *** *** *** Apr.-Jun. *** *** *** *** *** *** *** ***
Period
Vietnam
Price (dollars
per unit)
Quantity (units)
2017: Jan.-Mar. *** *** Apr.-Jun. *** *** Jul.-Sep. *** *** Oct.-Dec. *** *** 2018: Jan.-Mar. *** *** Apr.-Jun. *** *** Jul.-Sep. *** *** Oct.-Dec. *** *** 2019: Jan.-Mar. *** *** Apr.-Jun. *** *** Jul.-Sep. *** *** Oct.-Dec. *** *** 2020: Jan.-Mar. *** *** Apr.-Jun. *** ***
Source: Compiled from data submitted in response to Commission questionnaires.

G-14
Figure G-1 LRWs: Weighted-average prices and quantities of domestic and imported product 1, by country source, by quarter, January 2017 through June 2020
* * * * * * *

G-15
Figure G-2 LRWs: Weighted-average prices and quantities of domestic and imported product 2, by country source, by quarter, January 2017 through June 2020
* * * * * * *

G-16
Figure G-3 LRWs: Weighted-average prices and quantities of domestic and imported product 3, by country source, by quarter, January 2017 through June 2020
* * * * * * *

G-17
Figure G-4 LRWs: Weighted-average prices and quantities of domestic and imported product 4, by country source, by quarter, January 2017 through June 2020
* * * * * * *

G-18
Figure G-5 LRWs: Weighted-average prices and quantities of domestic and imported product 5, by country source, by quarter, January 2017 through June 2020
* * * * * * *

G-19
Figure G-6 LRWs: Weighted-average prices and quantities of domestic and imported product 6, by country source, by quarter, January 2017 through June 2020
* * * * * * *

G-20
Figure G-7 LRWs: Weighted-average prices and quantities of domestic and imported product 7, by country source, by quarter, January 2017 through June 2020
* * * * * * *

G-21
Figure G-8 LRWs: Weighted-average prices and quantities of domestic and imported product 8, by country source, by quarter, January 2017 through June 2020
* * * * * * *

G-22
Figure G-9 LRWs: Weighted-average prices and quantities of domestic and imported product 9, by country source, by quarter, January 2017 through June 2020
* * * * * * *

G-23
Figure G-10 LRWs: Weighted-average prices and quantities of domestic and imported product 10, by country source, by quarter, January 2017 through June 2020
* * * * * * *


H-1
APPENDIX H
U.S. PRICING DATA BY FIRM


H-3
Price data reported by U.S. producers for U.S.-produced LRWs during January 2017-June 2020 are presented in tables H-1 through H-9 and figures H-1 through H-9. These price items and accompanying data are comparable to those presented in tables VII-1 to VII-10. There were no domestic price data reported for pricing products 1 and 6.

H-4
Table H-1 LRWs: Weighted-average f.o.b. prices and quantities of domestic product 1, by U.S. producer, by quarter, January 2017 through June 2020
Period
Alliance GE Appliances LG Samsung Price
(dollars per unit)
Quantity (units)
Price (dollars per unit)
Quantity (units)
Price (dollars per unit)
Quantity (units)
Price (dollars per unit)
Quantity (units)
2017: Jan.-Mar. *** *** *** *** *** *** *** *** Apr.-Jun. *** *** *** *** *** *** *** *** Jul.-Sep. *** *** *** *** *** *** *** *** Oct.-Dec. *** *** *** *** *** *** *** *** 2018: Jan.-Mar. *** *** *** *** *** *** *** *** Apr.-Jun. *** *** *** *** *** *** *** *** Jul.-Sep. *** *** *** *** *** *** *** *** Oct.-Dec. *** *** *** *** *** *** *** *** 2019: Jan.-Mar. *** *** *** *** *** *** *** *** Apr.-Jun. *** *** *** *** *** *** *** *** Jul.-Sep. *** *** *** *** *** *** *** *** Oct.-Dec. *** *** *** *** *** *** *** *** 2020: Jan.-Mar. *** *** *** *** *** *** *** *** Apr.-Jun. *** *** *** *** *** *** *** ***
Period
Whirlpool
Producers with continuous operations
Producers with non-continuous operations All producers
Price (dollars per unit)
Quantity (units)
Price (dollars per unit)
Quantity (units)
Price (dollars per unit)
Quantity (units)
Price (dollars per unit)
Quantity (units)
2017: Jan.-Mar. *** *** *** *** *** *** *** *** Apr.-Jun. *** *** *** *** *** *** *** *** Jul.-Sep. *** *** *** *** *** *** *** *** Oct.-Dec. *** *** *** *** *** *** *** *** 2018: Jan.-Mar. *** *** *** *** *** *** *** *** Apr.-Jun. *** *** *** *** *** *** *** *** Jul.-Sep. *** *** *** *** *** *** *** *** Oct.-Dec. *** *** *** *** *** *** *** *** 2019: Jan.-Mar. *** *** *** *** *** *** *** *** Apr.-Jun. *** *** *** *** *** *** *** *** Jul.-Sep. *** *** *** *** *** *** *** *** Oct.-Dec. *** *** *** *** *** *** *** *** 2020: Jan.-Mar. *** *** *** *** *** *** *** *** Apr.-Jun. *** *** *** *** *** *** *** ***
Source: Compiled from data submitted in response to Commission questionnaires.

H-5
Table H-2 LRWs: Weighted-average f.o.b. prices and quantities of domestic product 3, by U.S. producer, by quarter, January 2017 through June 2020
Period
Alliance GE Appliances LG Samsung Price
(dollars per unit)
Quantity (units)
Price (dollars per unit)
Quantity (units)
Price (dollars per unit)
Quantity (units)
Price (dollars per unit)
Quantity (units)
2017: Jan.-Mar. *** *** *** *** *** *** *** *** Apr.-Jun. *** *** *** *** *** *** *** *** Jul.-Sep. *** *** *** *** *** *** *** *** Oct.-Dec. *** *** *** *** *** *** *** *** 2018: Jan.-Mar. *** *** *** *** *** *** *** *** Apr.-Jun. *** *** *** *** *** *** *** *** Jul.-Sep. *** *** *** *** *** *** *** *** Oct.-Dec. *** *** *** *** *** *** *** *** 2019: Jan.-Mar. *** *** *** *** *** *** *** *** Apr.-Jun. *** *** *** *** *** *** *** *** Jul.-Sep. *** *** *** *** *** *** *** *** Oct.-Dec. *** *** *** *** *** *** *** *** 2020: Jan.-Mar. *** *** *** *** *** *** *** *** Apr.-Jun. *** *** *** *** *** *** *** ***
Period
Whirlpool
Producers with continuous operations
Producers with non-continuous operations All producers
Price (dollars per unit)
Quantity (units)
Price (dollars per unit)
Quantity (units)
Price (dollars per unit)
Quantity (units)
Price (dollars per unit)
Quantity (units)
2017: Jan.-Mar. *** *** *** *** *** *** *** *** Apr.-Jun. *** *** *** *** *** *** *** *** Jul.-Sep. *** *** *** *** *** *** *** *** Oct.-Dec. *** *** *** *** *** *** *** *** 2018: Jan.-Mar. *** *** *** *** *** *** *** *** Apr.-Jun. *** *** *** *** *** *** *** *** Jul.-Sep. *** *** *** *** *** *** *** *** Oct.-Dec. *** *** *** *** *** *** *** *** 2019: Jan.-Mar. *** *** *** *** *** *** *** *** Apr.-Jun. *** *** *** *** *** *** *** *** Jul.-Sep. *** *** *** *** *** *** *** *** Oct.-Dec. *** *** *** *** *** *** *** *** 2020: Jan.-Mar. *** *** *** *** *** *** *** *** Apr.-Jun. *** *** *** *** *** *** *** ***
Source: Compiled from data submitted in response to Commission questionnaires.

H-6
Table H-3 LRWs: Weighted-average f.o.b. prices and quantities of domestic product 4, by U.S. producer, by quarter, January 2017 through June 2020
Period
Alliance GE Appliances LG Samsung Price
(dollars per unit)
Quantity (units)
Price (dollars per unit)
Quantity (units)
Price (dollars per unit)
Quantity (units)
Price (dollars per unit)
Quantity (units)
2017: Jan.-Mar. *** *** *** *** *** *** *** *** Apr.-Jun. *** *** *** *** *** *** *** *** Jul.-Sep. *** *** *** *** *** *** *** *** Oct.-Dec. *** *** *** *** *** *** *** *** 2018: Jan.-Mar. *** *** *** *** *** *** *** *** Apr.-Jun. *** *** *** *** *** *** *** *** Jul.-Sep. *** *** *** *** *** *** *** *** Oct.-Dec. *** *** *** *** *** *** *** *** 2019: Jan.-Mar. *** *** *** *** *** *** *** *** Apr.-Jun. *** *** *** *** *** *** *** *** Jul.-Sep. *** *** *** *** *** *** *** *** Oct.-Dec. *** *** *** *** *** *** *** *** 2020: Jan.-Mar. *** *** *** *** *** *** *** *** Apr.-Jun. *** *** *** *** *** *** *** ***
Period
Whirlpool
Producers with continuous operations
Producers with non-continuous operations All producers
Price (dollars per unit)
Quantity (units)
Price (dollars per unit)
Quantity (units)
Price (dollars per unit)
Quantity (units)
Price (dollars per unit)
Quantity (units)
2017: Jan.-Mar. *** *** *** *** *** *** *** *** Apr.-Jun. *** *** *** *** *** *** *** *** Jul.-Sep. *** *** *** *** *** *** *** *** Oct.-Dec. *** *** *** *** *** *** *** *** 2018: Jan.-Mar. *** *** *** *** *** *** *** *** Apr.-Jun. *** *** *** *** *** *** *** *** Jul.-Sep. *** *** *** *** *** *** *** *** Oct.-Dec. *** *** *** *** *** *** *** *** 2019: Jan.-Mar. *** *** *** *** *** *** *** *** Apr.-Jun. *** *** *** *** *** *** *** *** Jul.-Sep. *** *** *** *** *** *** *** *** Oct.-Dec. *** *** *** *** *** *** *** *** 2020: Jan.-Mar. *** *** *** *** *** *** *** *** Apr.-Jun. *** *** *** *** *** *** *** ***
Source: Compiled from data submitted in response to Commission questionnaires.

H-7
Table H-4 LRWs: Weighted-average f.o.b. prices and quantities of domestic product 5, by U.S. producer, by quarter, January 2017 through June 2020
Period
Alliance GE Appliances LG Samsung Price
(dollars per unit)
Quantity (units)
Price (dollars per unit)
Quantity (units)
Price (dollars per unit)
Quantity (units)
Price (dollars per unit)
Quantity (units)
2017: Jan.-Mar. *** *** *** *** *** *** *** *** Apr.-Jun. *** *** *** *** *** *** *** *** Jul.-Sep. *** *** *** *** *** *** *** *** Oct.-Dec. *** *** *** *** *** *** *** *** 2018: Jan.-Mar. *** *** *** *** *** *** *** *** Apr.-Jun. *** *** *** *** *** *** *** *** Jul.-Sep. *** *** *** *** *** *** *** *** Oct.-Dec. *** *** *** *** *** *** *** *** 2019: Jan.-Mar. *** *** *** *** *** *** *** *** Apr.-Jun. *** *** *** *** *** *** *** *** Jul.-Sep. *** *** *** *** *** *** *** *** Oct.-Dec. *** *** *** *** *** *** *** *** 2020: Jan.-Mar. *** *** *** *** *** *** *** *** Apr.-Jun. *** *** *** *** *** *** *** ***
Period
Whirlpool
Producers with continuous operations
Producers with non-continuous operations All producers
Price (dollars per unit)
Quantity (units)
Price (dollars per unit)
Quantity (units)
Price (dollars per unit)
Quantity (units)
Price (dollars per unit)
Quantity (units)
2017: Jan.-Mar. *** *** *** *** *** *** *** *** Apr.-Jun. *** *** *** *** *** *** *** *** Jul.-Sep. *** *** *** *** *** *** *** *** Oct.-Dec. *** *** *** *** *** *** *** *** 2018: Jan.-Mar. *** *** *** *** *** *** *** *** Apr.-Jun. *** *** *** *** *** *** *** *** Jul.-Sep. *** *** *** *** *** *** *** *** Oct.-Dec. *** *** *** *** *** *** *** *** 2019: Jan.-Mar. *** *** *** *** *** *** *** *** Apr.-Jun. *** *** *** *** *** *** *** *** Jul.-Sep. *** *** *** *** *** *** *** *** Oct.-Dec. *** *** *** *** *** *** *** *** 2020: Jan.-Mar. *** *** *** *** *** *** *** *** Apr.-Jun. *** *** *** *** *** *** *** ***
Source: Compiled from data submitted in response to Commission questionnaires.

H-8
Table H-5 LRWs: Weighted-average f.o.b. prices and quantities of domestic product 7, by U.S. producer, by quarter, January 2017 through June 2020
Period
Alliance GE Appliances LG Samsung Price
(dollars per unit)
Quantity (units)
Price (dollars per unit)
Quantity (units)
Price (dollars per unit)
Quantity (units)
Price (dollars per unit)
Quantity (units)
2017: Jan.-Mar. *** *** *** *** *** *** *** *** Apr.-Jun. *** *** *** *** *** *** *** *** Jul.-Sep. *** *** *** *** *** *** *** *** Oct.-Dec. *** *** *** *** *** *** *** *** 2018: Jan.-Mar. *** *** *** *** *** *** *** *** Apr.-Jun. *** *** *** *** *** *** *** *** Jul.-Sep. *** *** *** *** *** *** *** *** Oct.-Dec. *** *** *** *** *** *** *** *** 2019: Jan.-Mar. *** *** *** *** *** *** *** *** Apr.-Jun. *** *** *** *** *** *** *** *** Jul.-Sep. *** *** *** *** *** *** *** *** Oct.-Dec. *** *** *** *** *** *** *** *** 2020: Jan.-Mar. *** *** *** *** *** *** *** *** Apr.-Jun. *** *** *** *** *** *** *** ***
Period
Whirlpool
Producers with continuous operations
Producers with non-continuous operations All producers
Price (dollars per unit)
Quantity (units)
Price (dollars per unit)
Quantity (units)
Price (dollars per unit)
Quantity (units)
Price (dollars per unit)
Quantity (units)
2017: Jan.-Mar. *** *** *** *** *** *** *** *** Apr.-Jun. *** *** *** *** *** *** *** *** Jul.-Sep. *** *** *** *** *** *** *** *** Oct.-Dec. *** *** *** *** *** *** *** *** 2018: Jan.-Mar. *** *** *** *** *** *** *** *** Apr.-Jun. *** *** *** *** *** *** *** *** Jul.-Sep. *** *** *** *** *** *** *** *** Oct.-Dec. *** *** *** *** *** *** *** *** 2019: Jan.-Mar. *** *** *** *** *** *** *** *** Apr.-Jun. *** *** *** *** *** *** *** *** Jul.-Sep. *** *** *** *** *** *** *** *** Oct.-Dec. *** *** *** *** *** *** *** *** 2020: Jan.-Mar. *** *** *** *** *** *** *** *** Apr.-Jun. *** *** *** *** *** *** *** ***
Source: Compiled from data submitted in response to Commission questionnaires.

H-9
Table H-6 LRWs: Weighted-average f.o.b. prices and quantities of domestic product 8, by U.S. producer, by quarter, January 2017 through June 2020
Period
Alliance GE Appliances LG Samsung Price
(dollars per unit)
Quantity (units)
Price (dollars per unit)
Quantity (units)
Price (dollars per unit)
Quantity (units)
Price (dollars per unit)
Quantity (units)
2017: Jan.-Mar. *** *** *** *** *** *** *** *** Apr.-Jun. *** *** *** *** *** *** *** *** Jul.-Sep. *** *** *** *** *** *** *** *** Oct.-Dec. *** *** *** *** *** *** *** *** 2018: Jan.-Mar. *** *** *** *** *** *** *** *** Apr.-Jun. *** *** *** *** *** *** *** *** Jul.-Sep. *** *** *** *** *** *** *** *** Oct.-Dec. *** *** *** *** *** *** *** *** 2019: Jan.-Mar. *** *** *** *** *** *** *** *** Apr.-Jun. *** *** *** *** *** *** *** *** Jul.-Sep. *** *** *** *** *** *** *** *** Oct.-Dec. *** *** *** *** *** *** *** *** 2020: Jan.-Mar. *** *** *** *** *** *** *** *** Apr.-Jun. *** *** *** *** *** *** *** ***
Period
Whirlpool
Producers with continuous operations
Producers with non-continuous operations All producers
Price (dollars per unit)
Quantity (units)
Price (dollars per unit)
Quantity (units)
Price (dollars per unit)
Quantity (units)
Price (dollars per unit)
Quantity (units)
2017: Jan.-Mar. *** *** *** *** *** *** *** *** Apr.-Jun. *** *** *** *** *** *** *** *** Jul.-Sep. *** *** *** *** *** *** *** *** Oct.-Dec. *** *** *** *** *** *** *** *** 2018: Jan.-Mar. *** *** *** *** *** *** *** *** Apr.-Jun. *** *** *** *** *** *** *** *** Jul.-Sep. *** *** *** *** *** *** *** *** Oct.-Dec. *** *** *** *** *** *** *** *** 2019: Jan.-Mar. *** *** *** *** *** *** *** *** Apr.-Jun. *** *** *** *** *** *** *** *** Jul.-Sep. *** *** *** *** *** *** *** *** Oct.-Dec. *** *** *** *** *** *** *** *** 2020: Jan.-Mar. *** *** *** *** *** *** *** *** Apr.-Jun. *** *** *** *** *** *** *** ***
Source: Compiled from data submitted in response to Commission questionnaires.

H-10
Table H-7 LRWs: Weighted-average f.o.b. prices and quantities of domestic product 9, by U.S. producer, by quarter, January 2017 through June 2020
Period
Alliance GE Appliances LG Samsung Price
(dollars per unit)
Quantity (units)
Price (dollars per unit)
Quantity (units)
Price (dollars per unit)
Quantity (units)
Price (dollars per unit)
Quantity (units)
2017: Jan.-Mar. *** *** *** *** *** *** *** *** Apr.-Jun. *** *** *** *** *** *** *** *** Jul.-Sep. *** *** *** *** *** *** *** *** Oct.-Dec. *** *** *** *** *** *** *** *** 2018: Jan.-Mar. *** *** *** *** *** *** *** *** Apr.-Jun. *** *** *** *** *** *** *** *** Jul.-Sep. *** *** *** *** *** *** *** *** Oct.-Dec. *** *** *** *** *** *** *** *** 2019: Jan.-Mar. *** *** *** *** *** *** *** *** Apr.-Jun. *** *** *** *** *** *** *** *** Jul.-Sep. *** *** *** *** *** *** *** *** Oct.-Dec. *** *** *** *** *** *** *** *** 2020: Jan.-Mar. *** *** *** *** *** *** *** *** Apr.-Jun. *** *** *** *** *** *** *** ***
Period
Whirlpool
Producers with continuous operations
Producers with non-continuous operations All producers
Price (dollars per unit)
Quantity (units)
Price (dollars per unit)
Quantity (units)
Price (dollars per unit)
Quantity (units)
Price (dollars per unit)
Quantity (units)
2017: Jan.-Mar. *** *** *** *** *** *** *** *** Apr.-Jun. *** *** *** *** *** *** *** *** Jul.-Sep. *** *** *** *** *** *** *** *** Oct.-Dec. *** *** *** *** *** *** *** *** 2018: Jan.-Mar. *** *** *** *** *** *** *** *** Apr.-Jun. *** *** *** *** *** *** *** *** Jul.-Sep. *** *** *** *** *** *** *** *** Oct.-Dec. *** *** *** *** *** *** *** *** 2019: Jan.-Mar. *** *** *** *** *** *** *** *** Apr.-Jun. *** *** *** *** *** *** *** *** Jul.-Sep. *** *** *** *** *** *** *** *** Oct.-Dec. *** *** *** *** *** *** *** *** 2020: Jan.-Mar. *** *** *** *** *** *** *** *** Apr.-Jun. *** *** *** *** *** *** *** ***
Source: Compiled from data submitted in response to Commission questionnaires.
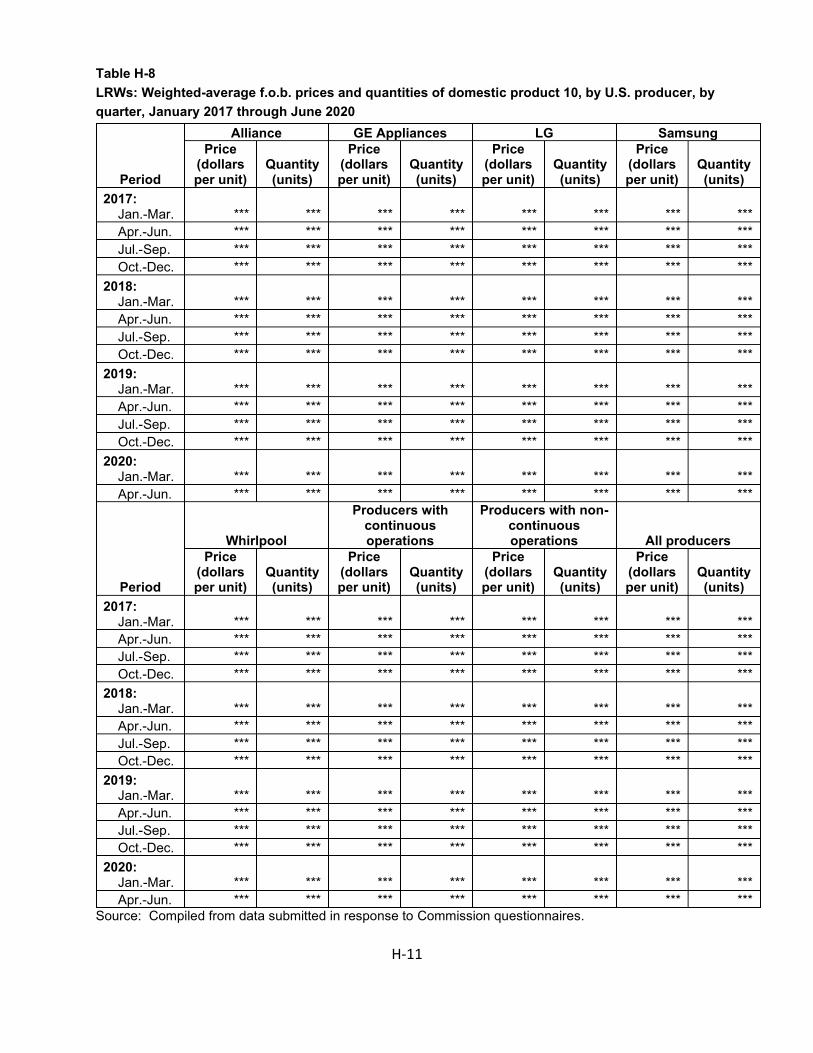
H-11
Table H-8 LRWs: Weighted-average f.o.b. prices and quantities of domestic product 10, by U.S. producer, by quarter, January 2017 through June 2020
Period
Alliance GE Appliances LG Samsung Price
(dollars per unit)
Quantity (units)
Price (dollars per unit)
Quantity (units)
Price (dollars per unit)
Quantity (units)
Price (dollars per unit)
Quantity (units)
2017: Jan.-Mar. *** *** *** *** *** *** *** *** Apr.-Jun. *** *** *** *** *** *** *** *** Jul.-Sep. *** *** *** *** *** *** *** *** Oct.-Dec. *** *** *** *** *** *** *** *** 2018: Jan.-Mar. *** *** *** *** *** *** *** *** Apr.-Jun. *** *** *** *** *** *** *** *** Jul.-Sep. *** *** *** *** *** *** *** *** Oct.-Dec. *** *** *** *** *** *** *** *** 2019: Jan.-Mar. *** *** *** *** *** *** *** *** Apr.-Jun. *** *** *** *** *** *** *** *** Jul.-Sep. *** *** *** *** *** *** *** *** Oct.-Dec. *** *** *** *** *** *** *** *** 2020: Jan.-Mar. *** *** *** *** *** *** *** *** Apr.-Jun. *** *** *** *** *** *** *** ***
Period
Whirlpool
Producers with continuous operations
Producers with non-continuous operations All producers
Price (dollars per unit)
Quantity (units)
Price (dollars per unit)
Quantity (units)
Price (dollars per unit)
Quantity (units)
Price (dollars per unit)
Quantity (units)
2017: Jan.-Mar. *** *** *** *** *** *** *** *** Apr.-Jun. *** *** *** *** *** *** *** *** Jul.-Sep. *** *** *** *** *** *** *** *** Oct.-Dec. *** *** *** *** *** *** *** *** 2018: Jan.-Mar. *** *** *** *** *** *** *** *** Apr.-Jun. *** *** *** *** *** *** *** *** Jul.-Sep. *** *** *** *** *** *** *** *** Oct.-Dec. *** *** *** *** *** *** *** *** 2019: Jan.-Mar. *** *** *** *** *** *** *** *** Apr.-Jun. *** *** *** *** *** *** *** *** Jul.-Sep. *** *** *** *** *** *** *** *** Oct.-Dec. *** *** *** *** *** *** *** *** 2020: Jan.-Mar. *** *** *** *** *** *** *** *** Apr.-Jun. *** *** *** *** *** *** *** ***
Source: Compiled from data submitted in response to Commission questionnaires.