Large Dilute Plumes: Use of Molecular Tools for Reaching ... · Molecular Tools for reaching...
22
Large Dilute Plumes: Use of Molecular Tools for reaching acceptable end states HOPE LEE 1 Mike Truex, Dawn Wellman Pacific Northwest National Laboratory June 20, 2012
Transcript of Large Dilute Plumes: Use of Molecular Tools for Reaching ... · Molecular Tools for reaching...

Large Dilute Plumes: Use of
Molecular Tools for reaching
acceptable end states
HOPE LEE
1
Mike Truex, Dawn Wellman
Pacific Northwest National Laboratory
June 20, 2012
Definitions
2
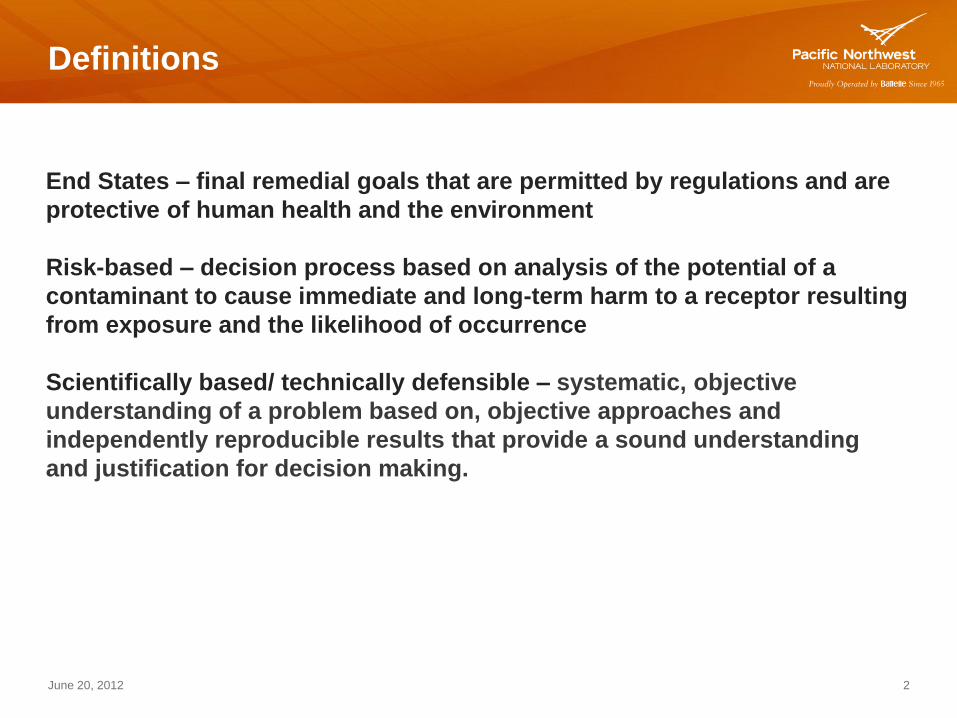
End States – final remedial goals that are permitted by regulations and are
protective of human health and the environment
Risk-based – decision process based on analysis of the potential of a
contaminant to cause immediate and long-term harm to a receptor resulting
from exposure and the likelihood of occurrence
Scientifically based/ technically defensible – systematic, objective
understanding of a problem based on, objective approaches and
independently reproducible results that provide a sound understanding
and justification for decision making.
June 20, 2012

Tradeoffs must be carefully considered among the competing
influences of cost, scientific defensibility, and the amount of
acceptable uncertainty in meeting remediation decision objectives
3
High risk, complexity, and cost with little to no regulatory acceptance
Scientific and technically defensible with minimal risk but costly and limited regulatory acceptance
High risk and complexity but less costly and regulatory acceptable
Scientifically and technically defensible with minimal risk or cost and regulatory acceptable
Decreased Uncertainty/Risk
Incre
ased C
ost
Increased Scientific and Technical Defensibility
Decre
ased R
egula
tory
Accepta
bili
ty
What is an acceptable End State?
June 20, 2012

4
U.S. DOE Environmental Management Sites
• Remediating ~ 1,800 million m3 of contaminated groundwater
• 75 million m3 of contaminated soil
Hanford Site Idaho National
Laboratory West Valley
Demonstration Project
Paducah Site
Oak Ridge
Savannah
River Site
Moab
Waste Isolation
Pilot Plant
Environmental
Technology Engineering
Center
Nevada National
Security Site
Separations
Process
Research Unit
Brookhaven National
Laboratory
Los Alamos
National
Laboratory
Lawrence Livermore
National Laboratory
SLAC
Sandia National
Laboratory
Portsmouth
Site
June 20, 2012
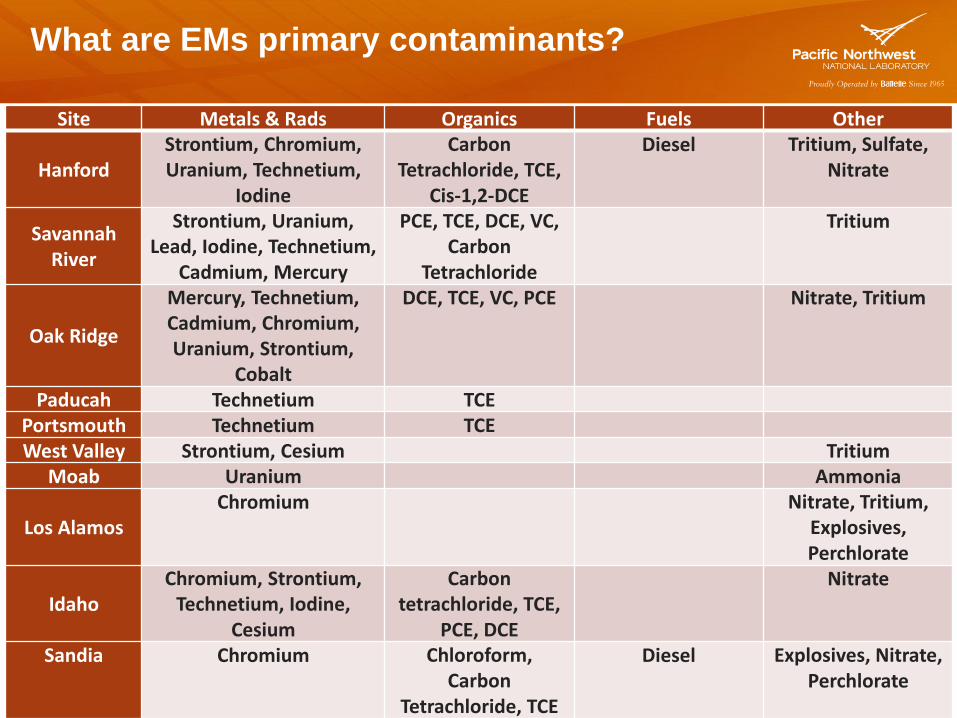
What are EMs primary contaminants?
June 20, 2012 5
Site Metals & Rads Organics Fuels Other
Hanford
Strontium, Chromium, Uranium, Technetium,
Iodine
Carbon Tetrachloride, TCE,
Cis-1,2-DCE
Diesel Tritium, Sulfate, Nitrate
Savannah River
Strontium, Uranium, Lead, Iodine, Technetium,
Cadmium, Mercury
PCE, TCE, DCE, VC, Carbon
Tetrachloride
Tritium
Oak Ridge
Mercury, Technetium, Cadmium, Chromium, Uranium, Strontium,
Cobalt
DCE, TCE, VC, PCE Nitrate, Tritium
Paducah Technetium TCE Portsmouth Technetium TCE West Valley Strontium, Cesium Tritium
Moab Uranium Ammonia
Los Alamos
Chromium Nitrate, Tritium, Explosives, Perchlorate
Idaho
Chromium, Strontium, Technetium, Iodine,
Cesium
Carbon tetrachloride, TCE,
PCE, DCE
Nitrate
Sandia Chromium Chloroform, Carbon
Tetrachloride, TCE
Diesel Explosives, Nitrate, Perchlorate

EM goals for subsurface …
June 20, 2012 6
• Reduce the life-cycle costs and accelerate the cleanup of the Cold War
environmental legacy
• Reduce the EM legacy footprint by 40 percent by the end of 2011, leading to
approximately 90 percent reduction by 2015

How do we achieve these goals?
June 20, 2012 7
DoD ALSO has set ambitious goals…
Air Force:
90% of BRAC sites “achieve accelerated site completion” by 2015.
DoD:
95% of IRP and MMRP sites achieve Remedy Complete by 2021.
• What has been done at other sites
• Interagency collaboration
• Lessons Learned
• Technology/expertise transfer
• Regulatory and stakeholder engagement
• Risk-informed understanding and defensibility
• Robust long-term management of residual contamination

Test Area North
June 20, 2012 8
• Direct injection of industrial wastewater into the aquifer from 1953-1972.
• Primary contaminant of concern is TCE.
• TCE plume is nearly 2 miles long.
• Contaminated aquifer is 200-400 ft deep.
• Aquifer is comprised of fractured basalt.

History of Decisions
June 20, 2012 9
1995 Record of Decision
• Pump and treat default
remedy
• Alternative technology
evaluations
• 100 year restoration
timeframe (2095) established
1997 Explanation of Significant
Differences
• Defined three plume zones
• Performed alternative
technology evaluations
2001 ROD Amendment
• Identified alternative remedies
for two of the three plume
zones

Three component strategy
June 20, 2012 10
• Source Area > 10,000 µg/L: In situ
bioremediation
• Medial Zone > 1000 µg/L: Pump and Treat
• Distal Zone < 1000 µg/L: Monitored Natural
Attenuation
Source Area:
• Removal of Sludge
• Injections of Lactate
• Injections of Whey Powder
Performance based optimizations of ARD
and injection strategies

Medial Zone
June 20, 2012 11

NPTF rebound data
June 20, 2012 12

NPTF Optimization Summary
June 20, 2012 13
Rebound Test
Mar 2005
Construction
Mar 2000
Pulse-Pumping Ops
Restart
Mar 2007
Full-Time Operations
Oct 2001
Standby
Nov 2007
Cold
March
2012
Pulse
pumping
2008-2010

Natural Attenuation : Distal Plume
June 20, 2012 14
• TCE concentrations decrease with distance from the source area in relation to PCE and tritium with a half-life of 9-21 years.
• A numerical model generates a plume that more closely matches field data when the model incorporates a TCE degradation term.
• Laboratory studies have shown that organisms capable of aerobic cometabolic oxidation of TCE are native to TAN. ENZYME PROBES

Plume Stability
June 20, 2012 15
• Plume was stable (although
changing) 1997-2009
• 2010 - concentrations in MW
at leading edge of plume
showed decreasing trend
• 2011 - plume is shrinking
(shown by MW data < MCLs
at leading edge of plume)

End States at TAN
June 20, 2012 16
Holistic Systems Based Approach
Interagency Project team consisted of EPA, DOE, IDEQ, and public
Scientifically defensible strategy - reevaluated when new technologies or approaches
were applicable and available (mass flux, revise SCM, molecular tools)
Optimized strategies throughout plume ($$ and performance)
e.g. PNT rebound study and shut down (estimated cost savings of 3 component
strategy 8 million over PNT for lifetime of plume)
Monitoring program modified (reduced) on year to year basis based on defensible
data (concentration, risk)

Paducah Gaseous
Diffusion Plant
June 20, 2012 17
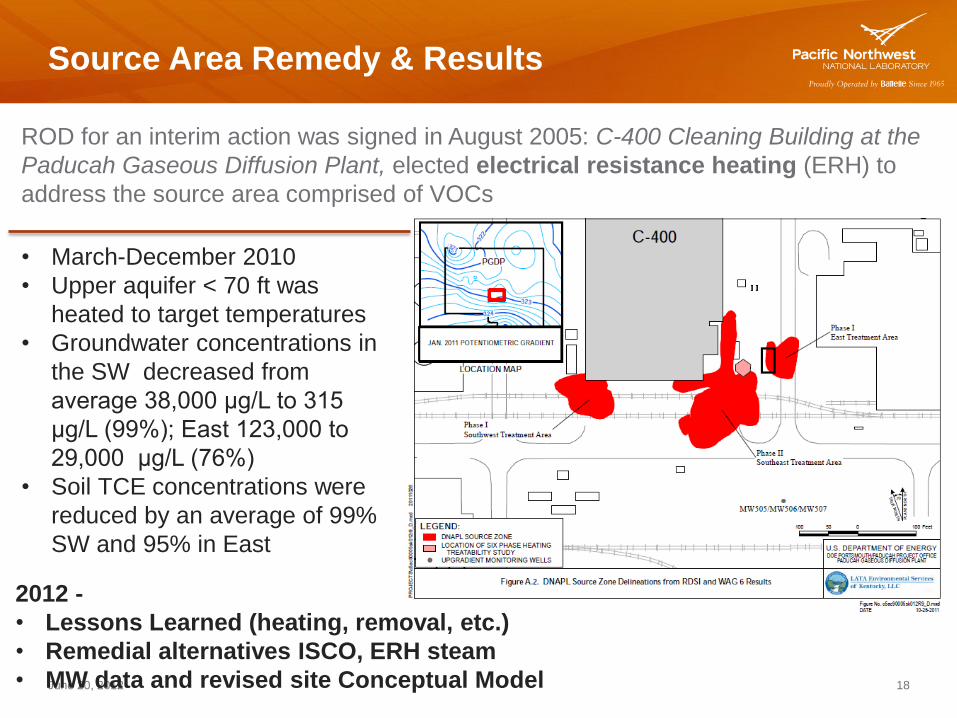
Source Area Remedy & Results
June 20, 2012 18
ROD for an interim action was signed in August 2005: C-400 Cleaning Building at the
Paducah Gaseous Diffusion Plant, elected electrical resistance heating (ERH) to
address the source area comprised of VOCs
• March-December 2010
• Upper aquifer < 70 ft was
heated to target temperatures
• Groundwater concentrations in
the SW decreased from
average 38,000 μg/L to 315
μg/L (99%); East 123,000 to
29,000 μg/L (76%)
• Soil TCE concentrations were
reduced by an average of 99%
SW and 95% in East
2012 -
• Lessons Learned (heating, removal, etc.)
• Remedial alternatives ISCO, ERH steam
• MW data and revised site Conceptual Model

Remedial Action Summary
June 20, 2012 19
Interim Actions intended to intercept
dissolved-phase mass greater than
1,000 µg/L
2000 Plume Mass
Approx. Mass = 85,000 lbs
2005 Plume Mass
Approx. Mass = 87,000 lbs
2010 Plume Mass
Approx. Mass = 27,000 lbs
Dissolved-phase mass removed via
pump and treat = 35,000 lbs
Source-based mass removed via
interim actions/treatability studies =
33,000 lbs
NW Plume Interim
Action pump and
treat started in 1995 Northeast Plume
Interim Action pump
and treat started in
1997
Optimization of
Northwest
Plume system -
August 2010

Paducah: MNA
June 20, 2012 20
Lines of Evidence:
First-order degradation rate calculations
indicate that TCE is being attenuated
along NWP flowpaths at a rate faster than
its co-contaminant 99Tc.
Molecular analyses provide evidence that
microbes capable of cometabolism of
TCE are present and actively in the
aquifer.
Geochemical conditions suggest that
organic carbon is available in the aquifer
in sufficient concentrations to support the
identified microbial populations.
SCIA well-pair data indicate aerobic co-
metabolic degradation of TCE is occurring
in the RGA within the study area.

End States at Paducah
June 20, 2012 21
Interagency Project Teams
Optimized Strategies:
Revision of SCM
Installation of suite of MWs to delineate sources
Application of new technologies, new tools
Lessons Learned
Target temperatures were not attained in middle and lower RGA
The density of vapor extraction points should be increased
The vapor treatment technology should be changed
Remedial Action Review
Thermal, PNT performance and optimization (new wells)
Opportunities ….
Acknowledgments
June 20, 2012 22
SOMERS • Amoret L. Bunn, Pacific Northwest National Laboratory
• Dawn M. Wellman, Pacific Northwest National Laboratory
• Rula A. Deeb, ARCADIS/Malcolm Pirnie
• Elisabeth L. Hawley, ARCADIS/Malcolm Pirnie
• Michael J. Truex, Pacific Northwest National Laboratory
• Mark J. Peterson, Oak Ridge National Laboratory
• Mark D. Freshley, Pacific Northwest National Laboratory
• Eric M. Pierce, Oak Ridge National Laboratory
• John McCord, Stoller Associates
• Michael H. Young, University of Texas at Austin
• Tyler J. Gilmore, Pacific Northwest National Laboratory
• Rick Miller, University of Kansas, Kansas Geological Survey
• Ann L. Miracle, Pacific Northwest National Laboratory
• Dawn Kaback, AMEC Geomatrix
• Carol Eddy-Dilek, Savannah River National Laboratory
• Joe Rossabi, Redox Technologies
• M. Hope Lee, Pacific Northwest National Laboratory
• Richard Bush, DOE Office of Legacy Management
• Paul Beam, DOE Office of Environmental Management
• Skip Chamberlain, DOE Office of Environmental Management
• Justin Marble, DOE Office of Environmental Management
• Latrincy Whitehurst, DOE Office of Environmental Management
• Kurt Gerdes, DOE Office of Environmental Management
• Yvette T. Collazo, DOE Office of Environmental Management
TAN NWI:
Joe Rothermel
Dana Swift
Kent Sorenson
Tamzen Macbeth
Kevin Harris
Michael Witt
Lance Peterson
Idaho Department of Environmental Quality, Mark
Jeffers, Gerry Winter
Environmental Protection Agency, Matt Wilkening
Paducah F&T Project Team:
DOE-PPPO Dr. Rich Bonczek
Paducah Remediation Services Bryan Clayton, Ken Davis
Portage Environmental Bruce Phillips
Kentucky Division of Waste
Management
Dr. Ed Winner, Todd Mullins,
Brian Begley,
Dr. Scott Little
USEPA Region IV David Williams
USEPA Ada Environmental
Laboratory Dr. John Wilson
KRCEE Dr. John Volpe, Steve Hampson
DOE-EM Beth Moore
Savannah River Laboratory Dr. Brian Looney
University of Oklahoma Dr. Paul Philp