
LARGE COOLING WATER PUMP UPGRADE FOR INCREASED …
33
LARGE COOLING WATER PUMP UPGRADE FOR INCREASED CAPACITY AND REDUCED IMPELLER CAVITATION Frank Visser
Transcript of LARGE COOLING WATER PUMP UPGRADE FOR INCREASED …

LARGE COOLING WATER PUMP UPGRADE FOR INCREASED CAPACITY AND
REDUCED IMPELLER CAVITATION
Frank Visser

Presenter/Author Biography
Frank Visser is Principal Engineer at Flowserve, Aftermarket Services &
Solutions, in Etten-Leur, The Netherlands. He obtained a B.S. degree
(Mechanical Engineering, 1985) from Technical College Alkmaar, The
Netherlands, and a M.S. degree (Mechanical Engineering, 1991) and Ph.D.
degree (Technical Sciences, 1996) from the University of Twente, The
Netherlands. He has received the ASME 2017 Sankaraiyer Gopalakrishnan-
Flowserve Pump Technology Award, is a member of the Royal Netherlands
Society of Engineers (KIVI), a member of the Industrial Advisory Board for
the J.M.Burgerscentrum (JMBC), National Research School for Fluid
Mechanics in the Netherlands, a member of ASME, and former Associate
Editor for ASME Journal of Fluids Engineering (two terms).
2

Short Abstract
This case study discusses the hydraulic upgrade of two sets of four (25
percent) large vertical cooling water pumps. To increase the electrical
output of subject power station, the cooling water pumps of block 1 and 2
had to be upgraded in capacity minimally thirteen percent, thereby also
attempting to minimize the occurrence of impeller cavitation.
The upgrade consisted of replacing the existing impeller and diffuser plus
casing, and installing new electric motors. To corroborate anticipated
hydraulic performance the replacement impeller and diffuser were model
tested on a 1:4 scale. The model test further served to determine final
sizing dimension of the upgrade.
3

• Background
• In-situ capacity measurement
• Impeller-diffuser CFD study
• Scaled model testing
• Start-up transient
• As built performance
Contents
4

• Up-rate of Nuclear Power Station (unit 1 & 2)
• Increase of electrical output power required an
increase of cooling water capacity (> 13%)
• Existing cooling water pumps (CWPs) are suffering
from cavitation attack
• CWP retrofit design objective:
Cooling water capacity increase of 13%+
Minimize impeller cavitation
• CWP E-motor replacement (PCWP)
System start-up transient analysis
Background
5

Per unit four (25
percent) CWP’s
running in parallel
feeding the
condenser with
seawater
Background
6

• Required to establish pre-upgrade baseline situation
Total CWPs flow rate measurement
Individual CWP’s head measurement
• Flow rate measurement with OTT-mills
6 mills on a horizontal scanning bar
4 throughflow areas scanned (curtain wall)
6x14 scanning window (14 elevations)
In-Situ Cooling Water Capacity Measurement
7
OTT-mill

In-Situ Cooling Water Capacity Measurement
8

In-Situ Cooling Water Capacity Measurement
9
Existing Up-rate
Speed 325 r/min 325 r/min
Capacity 7.8 m3/s 275 cfs > 8.81 m3/s > 311 cfs
Head 5.7 m 18.7 ft > 7.3* m > 24.0 ft
Ns,D 12700
4.64
USCU
(-)
11200
4.1
USCU
(-)
Dnom 56” 58” – 59”
* Per quadratic scaling of benchmark system head: > 1.132 5.7 m

• Geometries studied
Existing impeller / diffuser combination*
Retrofit impeller / diffuser combination*
• Objective
Determination of best cavitation point (BCP) NPSHi
Evaluate cavitation development
Head comparison
* Both the existing and retrofit design have 4 impeller blades and 7 diffuser blades
Impeller-Diffuser CFD Study
10

Impeller-Diffuser CFD Study
Methodology
Head calculation
Incipient cavitation NPSH
, ,total outlet total inletp pH
g
, mintotal inlet
i
p pNPSH
g
Mass flow averaged value:
,j total j
j
m p
m
11

Impeller-Diffuser CFD Study
12
Existing Design
Full 360⁰ model
Impeller
4 blades
Diffuser
7 blades

Impeller-Diffuser CFD Study
13
New Design
Full 360⁰ model
Impeller
4 blades
Diffuser
7 blades

Impeller-Diffuser CFD Study
14
Observations: 1) Improved incipient cavitation NPSH less cavitation 2) Final size less than 59” (1500 mm)

Impeller-Diffuser CFD Study
15 New impeller; p < pV @ design duty

• Objective Verify hydraulic performance
• Scaled model testing 1:4 model scale
4:1 speed ratio (325 1300 r/min)
Existing impeller-diffuser (350 mm)
Up-rate impeller-diffuser (360 mm)
Existing parts replicated on scale
from 3D scan
Up-rate parts modeled directly in
3D CAD
Scaled Model Testing
16

Scaled Model Testing
17
Test Loop & Test Set-up
Q, H, performance testing
Cavitation visualization
Flow visualization window with impeller mounted
Scaled Model Testing
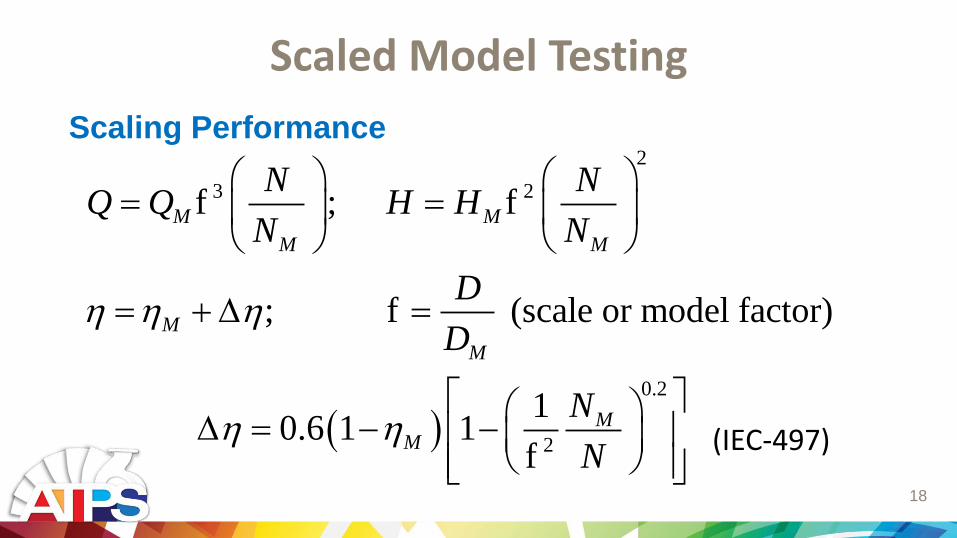
Scaling Performance
2
3 2f ; f
; f (scale or model factor)
M M
M M
M
M
N NQ Q H H
N N
D
D
0.2
2
10.6 1 1
f
MM
N
N
(IEC-497)
18

Scaled Model Testing
19

Scaled Model Testing
20
Cavitation inception 1mm bubble
0
5
10
15
20
25
30
35
40
45
50
55
60% 70% 80% 90% 100% 110% 120%
Percentage of duty flow
NP
SH
[m
]
NPSHi NPSHa
% Duty Capacity
NP
SH [
m]
Cavitation – Visual inception (1 mm cavitation bubble)
NPSHA

21
Scaled Model Testing
Cavitation at duty
capacity & rated
NPSHA
Minor development
of cavitation at blade leading edge

Cavitation 10mm bubble (3% of dia)
0
5
10
15
20
25
30
35
40
60% 70% 80% 90% 100% 110% 120%
Percentage of duty flow
NP
SH
[m
]
NPSHi NPSHa
Scaled Model Testing
22 % Duty Capacity
NP
SH [
m]
Cavitation – 10 mm cavity bubble
NPSHA

Cavitation @ 90% duty capacity
Scaled Model Testing
23
CFD Experiment

• Objective
Check motor capability (torque) to start the pumps
Determine start-up time(s)
• Entire cooling water system is modeled
Start-Up Transient
24

Start-Up Transient
25
• Start-up requirement E-motor 80% Voltage -15% Torque (tolerance per IEC 60034-1)
• Start-up scenario P1 thru P4 are started at 60 sec intervals
• Initially selected motor showed problem when starting 4th pump P4 could not be accelerated to full speed due to insufficient
motor torque P4 ended up running against closed (check) valve at
intermediate speed

Start-Up Transient
26
Motor speed-torque curve Pump curve
Rated Condition

Start-Up Transient
27

Start-Up Transient
28
Required fluid torque P4 is larger than motor torque
- Motor torque
Un 100%; T 100%
- Motor torque
Un 80%; T -15%
- Fluid torque @ zero flow
Fluid torque P4 to open check valve
Final running speed

Start-Up Transient
29
• Every next pump needs
to develop more head at
zero flow to come online
Steady state
operating points
4 pumps in operation
3 pumps in operation
2 pumps in operation
1 pump in operation

Start-Up Transient
30
Issue resolved by
changing the design of
the new motors to give
better speed-torque
characteristic
Final simulation shows
that the condenser is at
full cooling water flow
after 200 sec. (with 60
sec start-up intervals)
Cooling water flow through
condenser at start-up
140
120
100
80
60
40
20
0

As Built Performance
31
• Final design built @ 581/16” (1475 mm)
• Taking into account:
Performance pick-up due to up-scaling
Intake & discharge losses not being accounted
for in impeller/diffuser CFD study and scaled
model testing
System resistance line was lowered due to
installing power pack (actuator) on check
values less steep characteristic
Contractually required capacity increase of
113%, with +3% tolerance.

As Built Performance
32
• In-situ field performance check
Four pumps running
Three pumps running
• Pumps are over-performing (Q-H)
Pump Q-H above predicted curve
System resistance curve lowered
more than expected (power pack)
Higher condenser cooling capacity (+)
Higher driver power (), but motors
are not overloaded
At the end: Everybody Happy!

Thank you for your attention
Questions?
33


