Lao PDR Health Center Workforce Survey - World Bank...Lao PDR Health Center Workforce Survey....
68
Lao PDR Health Center Workforce Survey Findings from a nationally-representative health center and health center worker survey May 2016 Public Disclosure Authorized Public Disclosure Authorized Public Disclosure Authorized Public Disclosure Authorized
Transcript of Lao PDR Health Center Workforce Survey - World Bank...Lao PDR Health Center Workforce Survey....
Lao PDR Health Center Workforce SurveyFindings from a nationally-representative health center and health center worker survey
May 2016
Pub
lic D
iscl
osur
e A
utho
rized
Pub
lic D
iscl
osur
e A
utho
rized
Pub
lic D
iscl
osur
e A
utho
rized
Pub
lic D
iscl
osur
e A
utho
rized

LIST OF ABBREVIATIONS
CURRENCY EQUIVALENTS(Exchange Rate Effective as of April 25, 2016)
Currency Unit = LAK (Lao Kip)LAK8,141 = US$1.00
Fiscal Year=October to September
ACRONYMS AND ABBREVIATIONS
Vice President of EAP: Victoria KwakwaCountry Director: Ulrich ZachauSector Practice Director: Timothy Grant EvansCountry Manager: Sally BurninghamSector Manager: Toomas PaluPrimary Authors: Ajay Tandon Wei Aun Yap Phetdara Chanthala
BEONLSS Basic and Essential Obstetrics and Newborn Life Savings SkillsDEA Data Envelopment AnalysisEAP East Asia and the PacificGGHE General government health expenditureGNI Gross national incomeHC Health centerHRH Human resources for healthIMCI Integrated Management of Childhood Illnesses IMPC Integrated Management of Pregnancy and ChildbirthIYCF Infant and young child feedingMDGs Millennium development goalsMCG Maternal and child healthOOP Out-of-pocketRDF Revolving drug fundsUCH Universal health coverageUFGE Umbrella Facility for Gender EquityWHO World Health Organization

ACKNOWLEDGEMENTSThis policy note is part of a series designed to disseminate findings of the World Bank’s program of analytic and advisory activities for the health sector in Lao PDR. This policy note was prepared by the World Bank’s Lao PDR health team with contributions led by Ajay Tandon, Wei Aun Yap and Phetdara Chanthala and supported by Somil Nagpal, Sutayut Os-ornprasop, Emiko Masaki, Laura Rose, Banthida Komphasouk, Tomo Morimoto, Sophavanh Thitsy, Birte Sorenson, Jutta Krahn and Pema Lhazom. The team would like to thank Bou-lamphan Phouthavisouk and Jattava Vongxay for their support in reviewing, layout and final production of this note. Peer and external reviewers are Frank Haegeman (Lao-Lux), Christophe Lemiere (WB), and Anna af Ugglas (UNFPA). Valuable inputs were also provided by Chantelle Boudreaux, Eko Pambudi, and Puti Marzoeki.
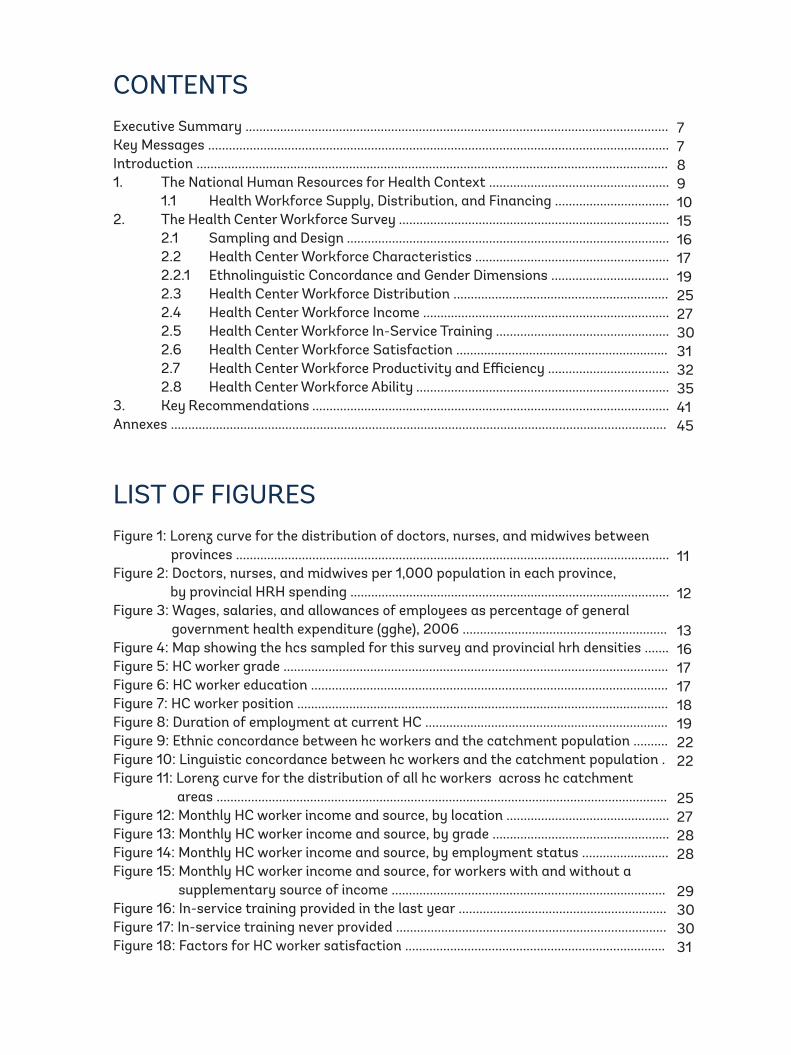
CONTENTSExecutive Summary ..........................................................................................................................Key Messages .....................................................................................................................................Introduction ........................................................................................................................................1. The National Human Resources for Health Context .................................................... 1.1 Health Workforce Supply, Distribution, and Financing .................................2. The Health Center Workforce Survey .............................................................................. 2.1 Sampling and Design ............................................................................................. 2.2 Health Center Workforce Characteristics ........................................................ 2.2.1 Ethnolinguistic Concordance and Gender Dimensions .................................. 2.3 Health Center Workforce Distribution .............................................................. 2.4 Health Center Workforce Income ....................................................................... 2.5 Health Center Workforce In-Service Training .................................................. 2.6 Health Center Workforce Satisfaction ............................................................. 2.7 Health Center Workforce Productivity and Efficiency ................................... 2.8 Health Center Workforce Ability .........................................................................3. Key Recommendations .......................................................................................................Annexes ...............................................................................................................................................
LIST OF FIGURESFigure 1: Lorenz curve for the distribution of doctors, nurses, and midwives between provinces .............................................................................................................................Figure 2: Doctors, nurses, and midwives per 1,000 population in each province, by provincial HRH spending ............................................................................................Figure 3: Wages, salaries, and allowances of employees as percentage of general government health expenditure (gghe), 2006 ...........................................................Figure 4: Map showing the hcs sampled for this survey and provincial hrh densities .......Figure 5: HC worker grade ...............................................................................................................Figure 6: HC worker education .......................................................................................................Figure 7: HC worker position ...........................................................................................................Figure 8: Duration of employment at current HC ......................................................................Figure 9: Ethnic concordance between hc workers and the catchment population ..........Figure 10: Linguistic concordance between hc workers and the catchment population .Figure 11: Lorenz curve for the distribution of all hc workers across hc catchment areas ..................................................................................................................................Figure 12: Monthly HC worker income and source, by location ...............................................Figure 13: Monthly HC worker income and source, by grade ...................................................Figure 14: Monthly HC worker income and source, by employment status .........................Figure 15: Monthly HC worker income and source, for workers with and without a supplementary source of income ...............................................................................Figure 16: In-service training provided in the last year ............................................................Figure 17: In-service training never provided ..............................................................................Figure 18: Factors for HC worker satisfaction ...........................................................................
778910151617192527303132354145
11
12
1316171718192222
25272828
29303031

Figure 19: Factors for HC worker dissatisfaction ........................................................................Figure 20: Consultations per HC worker per day ........................................................................Figure 21: Usage of HC worker working time ...............................................................................Figure 22: Usage of HC worker working time, by grade ............................................................Figure 23: Distribution of technical efficiency scores for hcs ..................................................
LIST OF BOXESBox 1: Ethnolinguistic concordance ...............................................................................................Box 2: Gender dimensions ...............................................................................................................Box 3: Dual-practice and supplementary income .....................................................................Box 4: How efficient are HCs in lao PDR? ....................................................................................Box 5: Method used for analyzing HC workforce ability ...........................................................
3132333334
2123293440

7Lao PDR Health Center Workforce Survey
EXECUTIVE SUMMARYThis policy note provides a snapshot of human resources for health (HRH) in health centers in the Lao People’s Democratic Republic (Lao PDR) based on an analysis of a health facility survey (the UFGE-CNP health center survey) that collected information from a nationally-representative sample of 120 public health centers (HCs) from 2013 to 2014. The survey was conducted as a baseline for health sector reform plans, to inform policymaking as Lao PDR scales-up programs to attain health-related MDGs, expand basic health services, and attain universal health coverage (UHC).
Key Messages
• At the national- and regional-level: The supply of critical human resources for health (HRH) was maldistributed (by geography, level, and type) and low – just over half WHO recommen-dations – although public spending on HRH, as a proportion of general government health expenditure, was within global and regional norms. A strategic review of the distribution of frontline HRH, with an adequate mandate, should be conducted and acted upon, to improve the allocative efficiency and equity of HRH.
• At the facility-level: Health centers (HCs) were staffed typically with four health workers who were relatively underutilized, with only six consultations per health worker per day on average. Investments are needed to reduce demand-side barriers (physical, cultural, and financial) to increase the extremely low utilization of essential health services, especially in rural areas, as underutilization is driving low productivity and low clinical ability.
• HC workers, comprised mainly of medical assistants and nursing professionals, with mid-level degrees, and four years of work experience at the HC, received a mean income of 1,599,000 kip (≈149 percent of monthly prorated GNI per capita), including income from supplementary sources outside the HC for 40 percent of health workers. These sources were almost entirely agriculture or small enterprise-derived, with only few related to medical ‘dual-practice’.
• Almost half (44 percent) of HC staff had never undergone any in-service training and where training was received, it was often mismatched with the type of health services being provided by the health worker. There are substantial gaps in clinical knowledge related to the manage-ment of MDG-related clinical situations, particularly for treating undernutrition and treating a woman bleeding after childbirth. Training programs and supervision will hence need to be strengthened significantly to address this critical issue.
• With regard to gender, although most (57 percent) HC workers were female, 42 percent of health staff conducting deliveries were male, which may compound the already high cultural barriers in accessing essential maternity services. With regard to language, although 85 per-cent of HC workers spoke the most common language in the community (typically Lao), only 31 percent spoke the second most common language, and 7 percent spoke the third most com-mon language.
• Poor service readiness (infrastructure, availability of medicines and equipment), in addition to poor compensation, were the main sources of dissatisfaction among health workers, sug-gesting that supply-side investments in medicines and equipment would not only improve the technical capacity of health centers but also health worker satisfaction.

8 Lao PDR Health Center Workforce Survey
1 WThis survey was co-financed by the Umbrella Facility for Gender Equity (UFGE) and the Environmentally and Socially-Sustainable Development Trust Fund.
2 World Bank (2015). Government expenditure on health in Lao PDR: Overall trends and findings from a health center survey.
3 Ministry of Health (2009). National Policy on Human Resources for Health, Vientiane.
IntroductionWhile on-track for child health and maternal health MDGs, Lao PDR continues to have some of the worst maternal and child health (MCH) outcomes, both globally and in the East Asia and Pacific (EAP) region. Under-five and infant mortality rates are high relative to GDP per capita, and utilization of essential health services is low, given significant demand-side barriers including physical access, cultural, and financial barriers. Furthermore, about a third of all children under-five remain underweight and almost half are stunted. Lao PDR is hence off-track on the nutrition-related MDG 1c. In addition to poor aggregate measures, there are significant economic, urban-rural, geographic, and ethnic group-related inequali-ties in health and nutrition outcomes.
This policy note provides a snapshot of human resources for health (HRH) in health centers in the Lao People’s Democratic Republic (Lao PDR) based on an analysis of a health facility survey (the UFGE-CNP health center survey) that collected information from a nationally-representative sample of 120 public health centers (HCs) from 2013 to 2014.1 This survey was conducted as a baseline for health sector reform plans, to inform policymaking as Lao PDR scales-up programs to attain health-related MDGs, expand basic health services, and attain universal health coverage (UHC). This note complements a related health financing note2 which includes health center financing data from the same survey. Key findings from that note include low government health spending, associated with a high reliance on out-of-pocket (OOP) spending and external financing, which translates to underfunding of HCs (especially non-wage recurrent expenditure) and dependence on OOP revenue from revolv-ing drug funds (RDFs).
The HC survey includes information on the supply, qualifications, and demographics of HRH, training, clinical abilities, productivity, income, satisfaction, ethnolinguistic charac-teristics, and gender considerations. As the Government of Lao PDR moves forward on the national strategic policy for HRH, which has four objectives – (i) strengthen leadership and management of HRH; (ii) ensure availability of an adequate number of suitably qualified health workers at all levels of the health system; (iii) ensure a competent and motivated health workforce through improved training and supervision; and (iv) ensure maximum ef-ficiency, quality, and acceptability of the health workforce through attention to equity is-sues3 - findings from this survey can help inform the actualization of these objectives.
This policy note is organized as follows: Section 1 provides stylized facts about the nation-al HRH context, including the supply, distribution, and public financing of health workers; Section 2 presents findings from the national public HC and HC worker survey, including workforce characteristics, gender and ethnolinguistic dimensions, distribution, income, training, satisfaction, productivity, and ability; and Section 3 concludes with key recom-mendations and limitations.
9Lao PDR Health Center Workforce Survey
1. The National Human Resources for Health Context
10 Lao PDR Health Center Workforce Survey
Country
Cambodia (2000)Lao PDR (WHO, 2012)Lao PDR (MoH, 2012)Zambia (2004)Timor-Leste (2011)Bhutan (2012)Indonesia (2012)Myanmar (2012)Vietnam (2011)East Asia and Pacific(2010-2012 average)Lower-Middle Income Countries(2010-2012 average)WHO international standard (2006)
Doctors per 1,000 population
0.160.180.300.120.070.260.200.611.16
Nurses and mid-wives per 1,000
population0.840.880.931.011.11
0.981.381.001.14
Ratio of nurses and midwives per
doctor5.34.83.08.415.23.86.81.61.0
4.9
7.5
Doctors, nurses, and midwives per 1,000 population
1.001.061.231.131.191.241.591.622.30
4.5
3.92.3
1.1 Health Workforce Supply, Distribution, and Financing
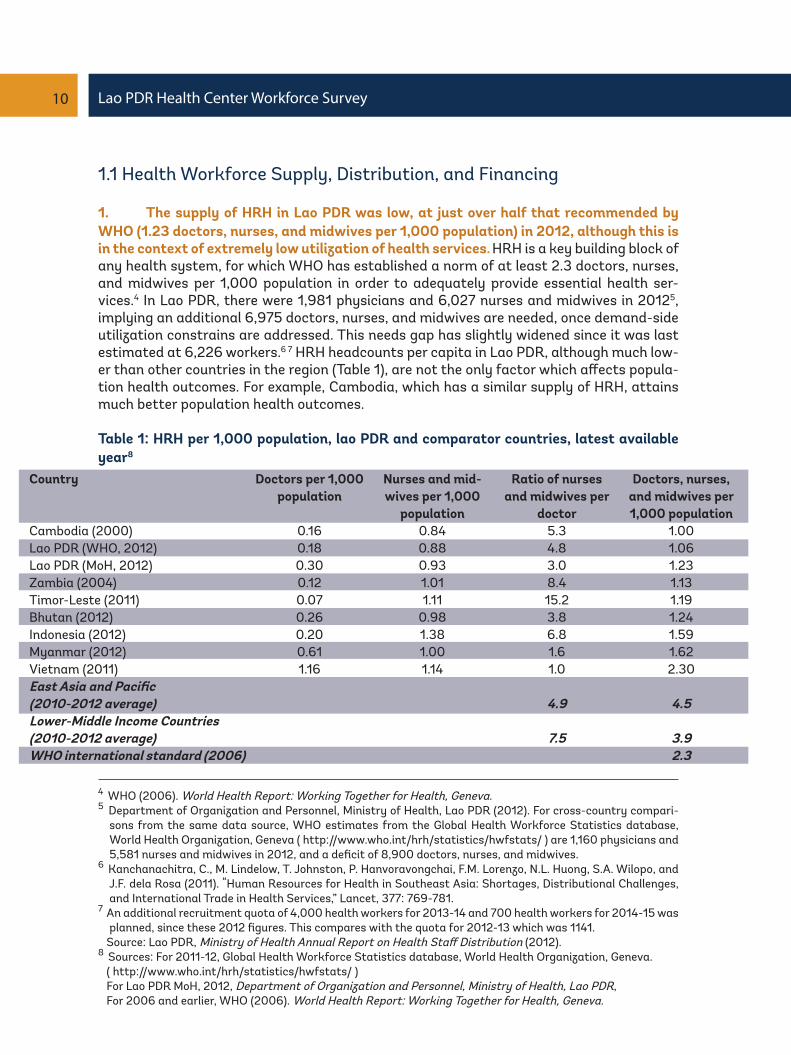
1. The supply of HRH in Lao PDR was low, at just over half that recommended by WHO (1.23 doctors, nurses, and midwives per 1,000 population) in 2012, although this is in the context of extremely low utilization of health services. HRH is a key building block of any health system, for which WHO has established a norm of at least 2.3 doctors, nurses, and midwives per 1,000 population in order to adequately provide essential health ser-vices.4 In Lao PDR, there were 1,981 physicians and 6,027 nurses and midwives in 20125, implying an additional 6,975 doctors, nurses, and midwives are needed, once demand-side utilization constrains are addressed. This needs gap has slightly widened since it was last estimated at 6,226 workers.6 7 HRH headcounts per capita in Lao PDR, although much low-er than other countries in the region (Table 1), are not the only factor which affects popula-tion health outcomes. For example, Cambodia, which has a similar supply of HRH, attains much better population health outcomes.
Table 1: HRH per 1,000 population, lao PDR and comparator countries, latest available year8
4 WHO (2006). World Health Report: Working Together for Health, Geneva.5 Department of Organization and Personnel, Ministry of Health, Lao PDR (2012). For cross-country compari-
sons from the same data source, WHO estimates from the Global Health Workforce Statistics database, World Health Organization, Geneva ( http://www.who.int/hrh/statistics/hwfstats/ ) are 1,160 physicians and 5,581 nurses and midwives in 2012, and a deficit of 8,900 doctors, nurses, and midwives.
6 Kanchanachitra, C., M. Lindelow, T. Johnston, P. Hanvoravongchai, F.M. Lorenzo, N.L. Huong, S.A. Wilopo, and J.F. dela Rosa (2011). “Human Resources for Health in Southeast Asia: Shortages, Distributional Challenges, and International Trade in Health Services,” Lancet, 377: 769-781.
7 An additional recruitment quota of 4,000 health workers for 2013-14 and 700 health workers for 2014-15 was planned, since these 2012 figures. This compares with the quota for 2012-13 which was 1141.
Source: Lao PDR, Ministry of Health Annual Report on Health Staff Distribution (2012).8 Sources: For 2011-12, Global Health Workforce Statistics database, World Health Organization, Geneva. ( http://www.who.int/hrh/statistics/hwfstats/ ) For Lao PDR MoH, 2012, Department of Organization and Personnel, Ministry of Health, Lao PDR, For 2006 and earlier, WHO (2006). World Health Report: Working Together for Health, Geneva.

11Lao PDR Health Center Workforce Survey
2. Inequalities remain with regard to the provincial distribution of critical HRH in Lao PDR. About one-third of the doctors, nurses, and midwives serve just one-fifth of the population, as visualized using a Lorenz curve which plots the cumulative share of doc-tors, nurses, and midwives, with the cumulative share of the population (Figure 1). The GINI coefficient9 for this HRH distribution was 0.16 but this does not take into consideration inequalities within provinces – past analysis on urban and rural HRH inequalities found an estimated 20 percent of the health workforce serving some 80 percent of the population living in rural areas.10
Figure 1: Lorenz curve for the distribution of doctors, nurses, and midwives between prov-inces11
9 The GINI coefficient which is a quantitative representation of inequality where 0 represents perfect equal-ity and 1 represents perfect inequality is basically the area between the red dotted line and the green line, divided by 0.5.
10 Dawson, A., T. Howes, N. Gray, and E. Kennedy (2011). Human Resources for Health in Maternal, Neonatal, and Reproductive Health at Community Level: A Profile of Lao People’s Democratic Republic, Human Resources for Health Knowledge Hub and Burnet Institute, Sydney, Australia.
11 If the distribution of these health workers were equal, it would take the form of the red dotted line, but instead is shifted further to the right, as represented by the green line. Data source: Department of Organization and Personnel, Ministry of Health, Lao PDR (2012).
12 Lao PDR Health Center Workforce Survey
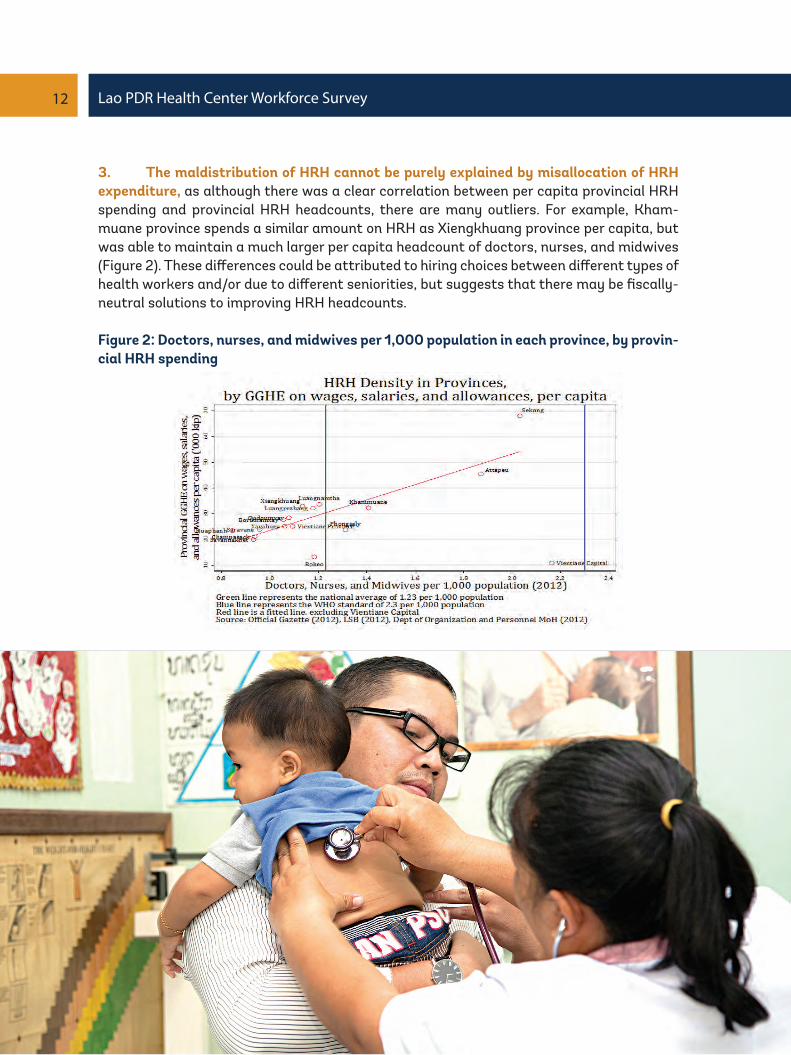
3. The maldistribution of HRH cannot be purely explained by misallocation of HRH expenditure, as although there was a clear correlation between per capita provincial HRH spending and provincial HRH headcounts, there are many outliers. For example, Kham-muane province spends a similar amount on HRH as Xiengkhuang province per capita, but was able to maintain a much larger per capita headcount of doctors, nurses, and midwives (Figure 2). These differences could be attributed to hiring choices between different types of health workers and/or due to different seniorities, but suggests that there may be fiscally-neutral solutions to improving HRH headcounts.
Figure 2: Doctors, nurses, and midwives per 1,000 population in each province, by provin-cial HRH spending
13Lao PDR Health Center Workforce Survey
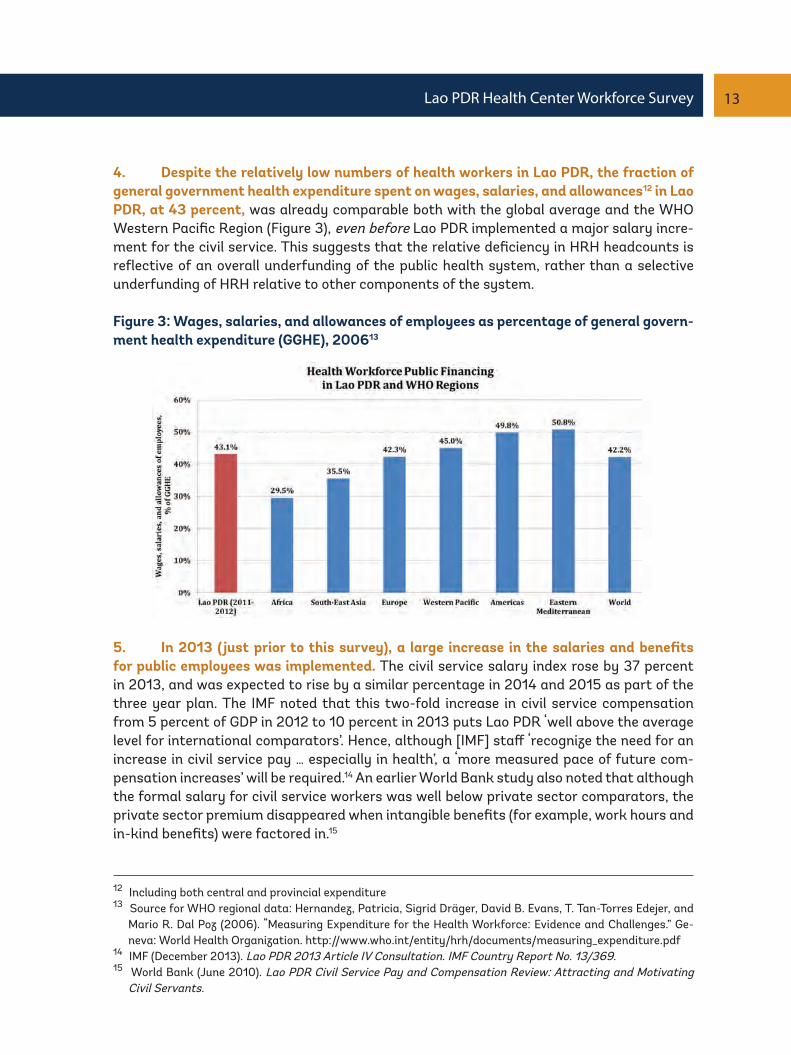
4. Despite the relatively low numbers of health workers in Lao PDR, the fraction of general government health expenditure spent on wages, salaries, and allowances12 in Lao PDR, at 43 percent, was already comparable both with the global average and the WHO Western Pacific Region (Figure 3), even before Lao PDR implemented a major salary incre-ment for the civil service. This suggests that the relative deficiency in HRH headcounts is reflective of an overall underfunding of the public health system, rather than a selective underfunding of HRH relative to other components of the system.
Figure 3: Wages, salaries, and allowances of employees as percentage of general govern-ment health expenditure (GGHE), 200613
12 Including both central and provincial expenditure13 Source for WHO regional data: Hernandez, Patricia, Sigrid Dräger, David B. Evans, T. Tan-Torres Edejer, and
Mario R. Dal Poz (2006). “Measuring Expenditure for the Health Workforce: Evidence and Challenges.” Ge-neva: World Health Organization. http://www.who.int/entity/hrh/documents/measuring_expenditure.pdf
14 IMF (December 2013). Lao PDR 2013 Article IV Consultation. IMF Country Report No. 13/369.15 World Bank (June 2010). Lao PDR Civil Service Pay and Compensation Review: Attracting and Motivating
Civil Servants.
5. In 2013 (just prior to this survey), a large increase in the salaries and benefits for public employees was implemented. The civil service salary index rose by 37 percent in 2013, and was expected to rise by a similar percentage in 2014 and 2015 as part of the three year plan. The IMF noted that this two-fold increase in civil service compensation from 5 percent of GDP in 2012 to 10 percent in 2013 puts Lao PDR ‘well above the average level for international comparators’. Hence, although [IMF] staff ‘recognize the need for an increase in civil service pay … especially in health’, a ‘more measured pace of future com-pensation increases’ will be required.14 An earlier World Bank study also noted that although the formal salary for civil service workers was well below private sector comparators, the private sector premium disappeared when intangible benefits (for example, work hours and in-kind benefits) were factored in.15

14 Lao PDR Health Center Workforce Survey
16 Department of Organization and Personnel, Ministry of Health, Lao PDR (March 2012). All types of health workers are included, including support staff.
17 WDI, 2012. Official Exchange Rate is 8,008 kip to 1 US dollar.18 World Bank (2015). Government expenditure on health in Lao PDR: Overall trends and findings from a health
center survey.
6. The implied average monthly compensation, including allowances, for government payroll health workers of 14,18916 was 1,290,000 kip in 2012, equivalent to US$1,933 per year (152 percent of GNI per capita).17 Hence although there is a long term need to increase headcounts to address HRH shortages, initial policy steps should focus on improving the technical and allocative efficiency, and quality, of the existing workforce, within the con-text of the current fiscal environment, and should certainly not be at the expense of non-wage recurrent spending on health which is already under significant pressures.18

15Lao PDR Health Center Workforce Survey
2. The Health Center Workforce Survey
16 Lao PDR Health Center Workforce Survey
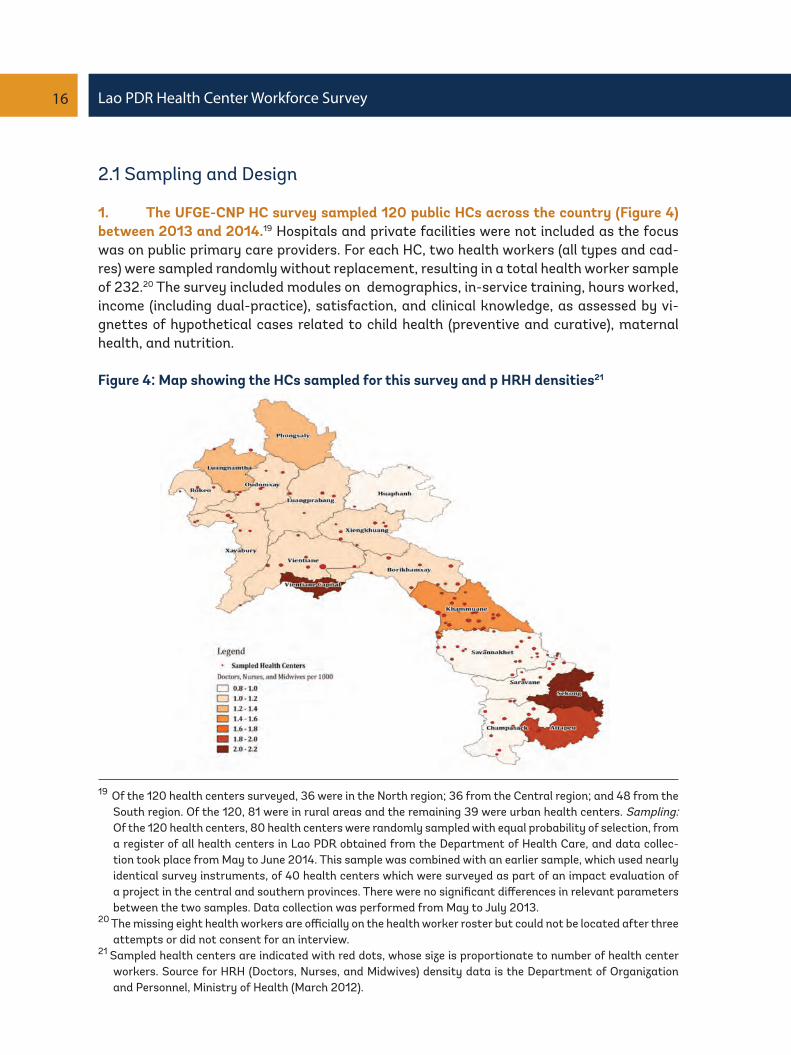
19 Of the 120 health centers surveyed, 36 were in the North region; 36 from the Central region; and 48 from the South region. Of the 120, 81 were in rural areas and the remaining 39 were urban health centers. Sampling: Of the 120 health centers, 80 health centers were randomly sampled with equal probability of selection, from a register of all health centers in Lao PDR obtained from the Department of Health Care, and data collec-tion took place from May to June 2014. This sample was combined with an earlier sample, which used nearly identical survey instruments, of 40 health centers which were surveyed as part of an impact evaluation of a project in the central and southern provinces. There were no significant differences in relevant parameters between the two samples. Data collection was performed from May to July 2013.
20 The missing eight health workers are officially on the health worker roster but could not be located after three attempts or did not consent for an interview.
21 Sampled health centers are indicated with red dots, whose size is proportionate to number of health center workers. Source for HRH (Doctors, Nurses, and Midwives) density data is the Department of Organization and Personnel, Ministry of Health (March 2012).
2.1 Sampling and Design
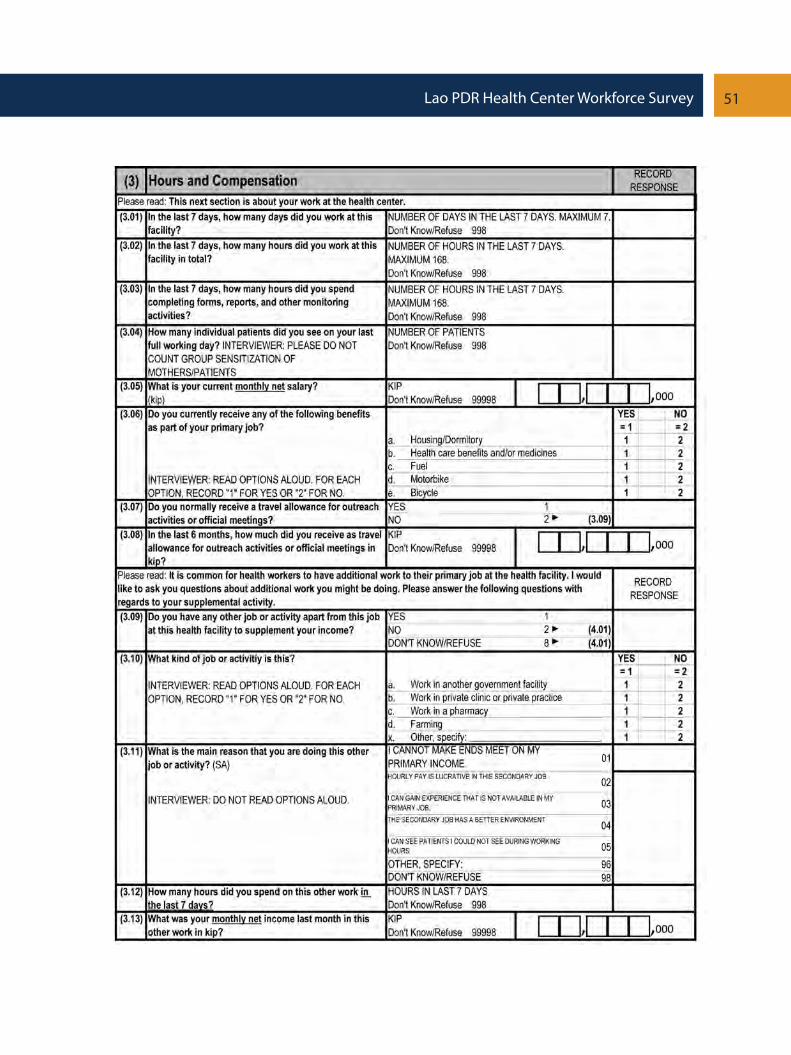
1. The UFGE-CNP HC survey sampled 120 public HCs across the country (Figure 4) between 2013 and 2014.19 Hospitals and private facilities were not included as the focus was on public primary care providers. For each HC, two health workers (all types and cad-res) were sampled randomly without replacement, resulting in a total health worker sample of 232.20 The survey included modules on demographics, in-service training, hours worked, income (including dual-practice), satisfaction, and clinical knowledge, as assessed by vi-gnettes of hypothetical cases related to child health (preventive and curative), maternal health, and nutrition.
Figure 4: Map showing the HCs sampled for this survey and p HRH densities21

17Lao PDR Health Center Workforce Survey
2.2 Health Center Workforce Characteristics
2. The median number of health workers per HC was four, typically comprising three civil servants and one volunteer22 or donor/NGO-funded health worker assigned to the HC. Considering that these were basic public primary care facilities, most HC workers were ei-ther medical assistants (30 percent) or nursing professionals (37 percent). Midwives who provide critical antenatal and obstetric services comprise 15 percent of the HC workforce, and only 4 percent of those sampled were medical doctors (Figure 5). Almost all (99 per-cent) of the HC workers had a basic, mid-level, or high-level degree (Figure 6). Most medical assistants (87 percent) are mid-level degree holders, while nurses are typically either mid-level degree holders (69 percent) or basic-level degree holders (28 percent).23
Figure 5: HC worker grade
22 Volunteers are a term used to denote health workers who have started work at a health facility, while await-ing an official civil service appointment.
23 Basic training requirements for health workers are as follows: Medical Doctors (6-year training), Gradu-ate Nurses (4-year training), Registered Nurses (3-year training), Midwives with Bachelors Degree (4-year training), Registered Midwives (3-year training), Community Midwives (2-year training), Medical Assistants (3-year training), and Paramedics (3-year training).
Figure 6: HC worker education
18 Lao PDR Health Center Workforce Survey
24 For the national census, the Lao Statistics Bureau defines urban-rural status on a village-by-village basis, based on several criteria including population size and amenities. As HCs serve multiple villages, adapted criteria based on these village-level criteria were used to generate urban-rural status at HC-level.
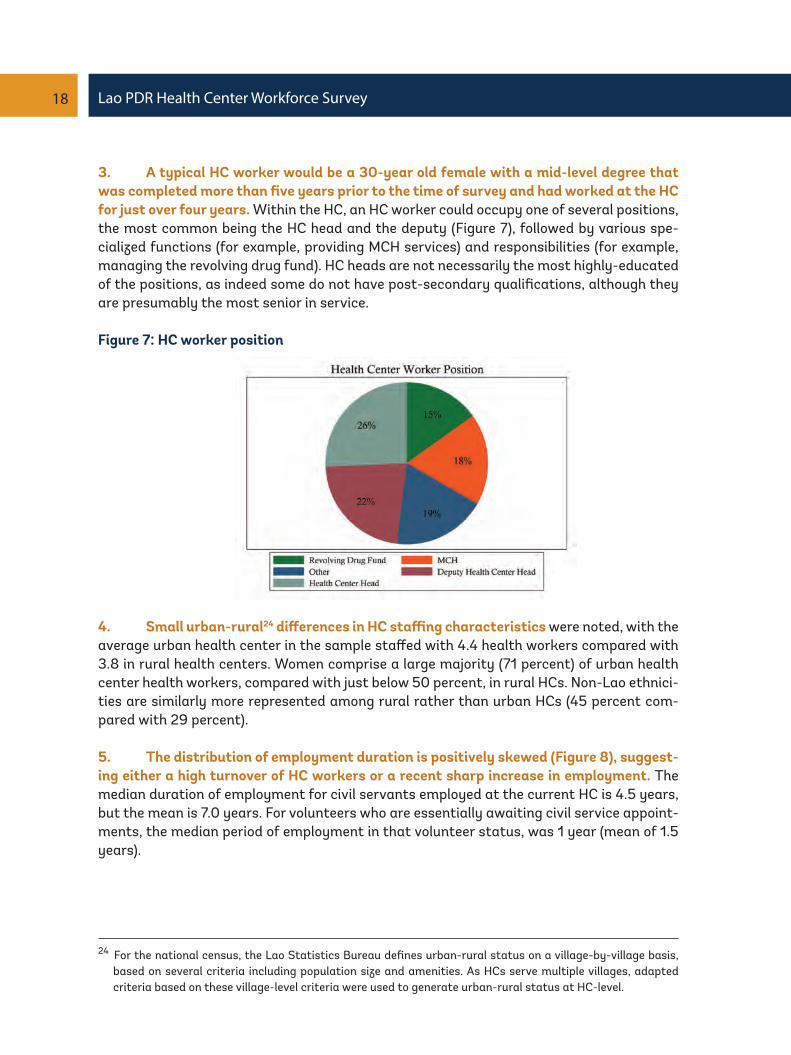
3. A typical HC worker would be a 30-year old female with a mid-level degree that was completed more than five years prior to the time of survey and had worked at the HC for just over four years. Within the HC, an HC worker could occupy one of several positions, the most common being the HC head and the deputy (Figure 7), followed by various spe-cialized functions (for example, providing MCH services) and responsibilities (for example, managing the revolving drug fund). HC heads are not necessarily the most highly-educated of the positions, as indeed some do not have post-secondary qualifications, although they are presumably the most senior in service.
Figure 7: HC worker position
4. Small urban-rural24 differences in HC staffing characteristics were noted, with the average urban health center in the sample staffed with 4.4 health workers compared with 3.8 in rural health centers. Women comprise a large majority (71 percent) of urban health center health workers, compared with just below 50 percent, in rural HCs. Non-Lao ethnici-ties are similarly more represented among rural rather than urban HCs (45 percent com-pared with 29 percent).
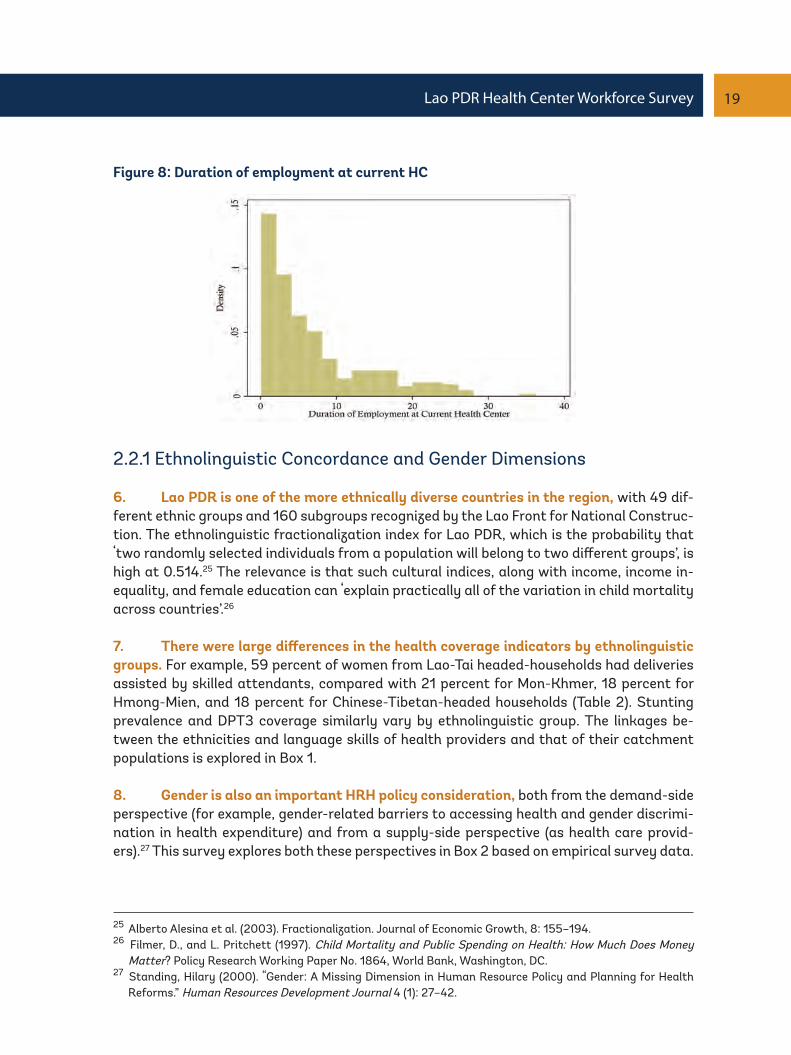
5. The distribution of employment duration is positively skewed (Figure 8), suggest-ing either a high turnover of HC workers or a recent sharp increase in employment. The median duration of employment for civil servants employed at the current HC is 4.5 years, but the mean is 7.0 years. For volunteers who are essentially awaiting civil service appoint-ments, the median period of employment in that volunteer status, was 1 year (mean of 1.5 years).
19Lao PDR Health Center Workforce Survey
Figure 8: Duration of employment at current HC
2.2.1 Ethnolinguistic Concordance and Gender Dimensions
6. Lao PDR is one of the more ethnically diverse countries in the region, with 49 dif-ferent ethnic groups and 160 subgroups recognized by the Lao Front for National Construc-tion. The ethnolinguistic fractionalization index for Lao PDR, which is the probability that ‘two randomly selected individuals from a population will belong to two different groups’, is high at 0.514.25 The relevance is that such cultural indices, along with income, income in-equality, and female education can ‘explain practically all of the variation in child mortality across countries’.26
7. There were large differences in the health coverage indicators by ethnolinguistic groups. For example, 59 percent of women from Lao-Tai headed-households had deliveries assisted by skilled attendants, compared with 21 percent for Mon-Khmer, 18 percent for Hmong-Mien, and 18 percent for Chinese-Tibetan-headed households (Table 2). Stunting prevalence and DPT3 coverage similarly vary by ethnolinguistic group. The linkages be-tween the ethnicities and language skills of health providers and that of their catchment populations is explored in Box 1.
8. Gender is also an important HRH policy consideration, both from the demand-side perspective (for example, gender-related barriers to accessing health and gender discrimi-nation in health expenditure) and from a supply-side perspective (as health care provid-ers).27 This survey explores both these perspectives in Box 2 based on empirical survey data.
25 Alberto Alesina et al. (2003). Fractionalization. Journal of Economic Growth, 8: 155–194.26 Filmer, D., and L. Pritchett (1997). Child Mortality and Public Spending on Health: How Much Does Money
Matter? Policy Research Working Paper No. 1864, World Bank, Washington, DC.27 Standing, Hilary (2000). “Gender: A Missing Dimension in Human Resource Policy and Planning for Health
Reforms.” Human Resources Development Journal 4 (1): 27–42.

20 Lao PDR Health Center Workforce Survey
Table 2: Health coverage and outcome indicators, by ethnolinguistic group28
28 Source for skilled birth attendance, DPT3 coverage, and stunting prevalence: LSIS, 2012.29 Lao PDR Population Census, 2005.
Ethnolinguistic group
Lao-ThaiMon-KhmerHmong-MienChinese-Tibetan
Percent of national population29 (%)
662293
Skilled birth attendance (%)
59211818
DPT3 coverage (%)
67492732
Moderate and severe stunting
prevalence among under-fives (%)
33566161

21Lao PDR Health Center Workforce Survey
Box 1: Ethnolinguistic Concordance
Health centers are key frontline health facilities, which provide critical MCH services, to both ur-ban and rural communities in this ethnically diverse country.
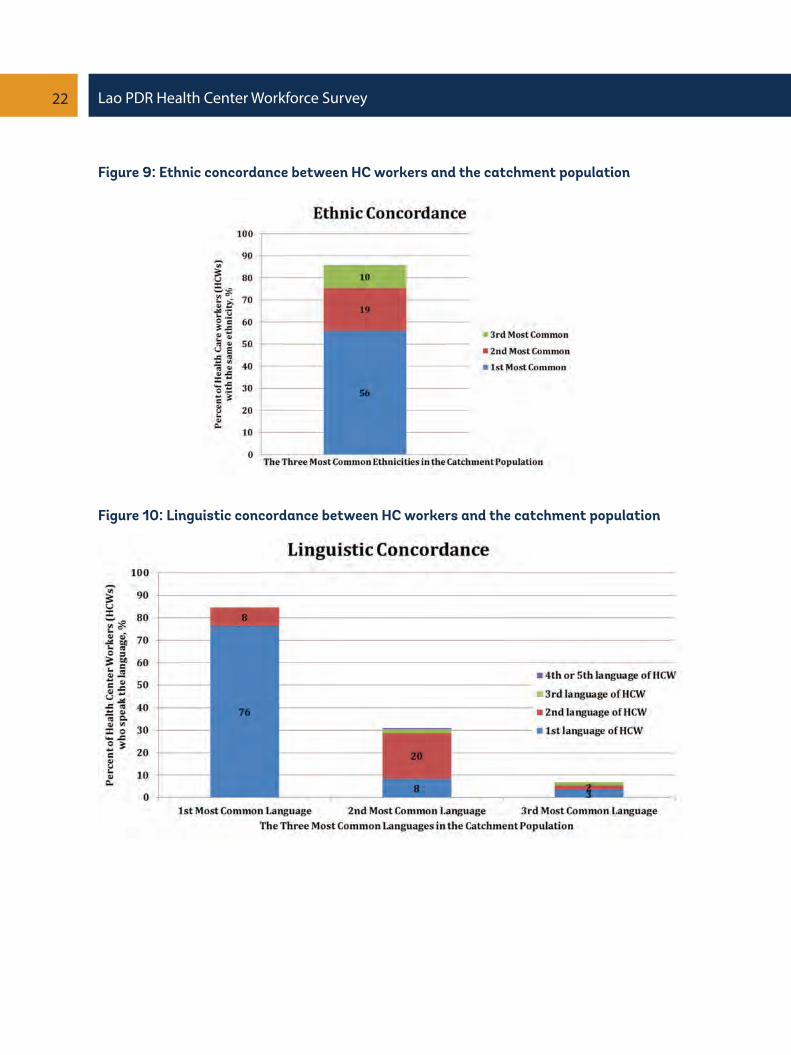
This survey finds that HC workers by and large mirrored the diverse ethnicity of the country - approximately 61 percent were Lao, 10 percent were Khmu, and 9 percent were Hmong; which was comparable to the national distribution of 55 percent, 11 percent, and 8 percent respective-ly. However, even though the ethnic composition of HC workers mirrored the national aggregate composition, there was assortment in the placements of HC workers such that only 56 percent of HC workers were of the same ethnicity as the most common ethnicity in the catchment popula-tion (Figure 9). A further 29 percent had the same ethnicity as either the second or third most common ethnicity in the catchment population.
Linguistic concordance may be more important as health workers and their patients need to be able to communicate. This survey finds that although 85 percent of HC workers were able to speak the most common language of the catchment population (Figure 10), typically the Lao national language, very much fewer were able to speak languages other than the most common language – only 31 percent of HC workers were able to speak the second most common language of the catchment population and only 7 percent of HC workers were able to speak the third most common language of the catchment population. A household survey would be required to ade-quately determine the percentage of households for whom there are no common languages with any of the HC workers, but the sharp drop in language skills for languages other than the most common language suggests that language may be a barrier in accessing health care services for non-Lao speakers. Furthermore, 15 percent of HC workers would not be able to use their first lan-guage to communicate with most of the people in their catchment population.
This is not due to a lack of linguistic ability on the part of health workers, as almost half of HC workers reported being able to speak two or more languages, with Lao being the most widely-spoken language (96 percent), followed by Khmu (20 percent), and Hmong (17 percent). However, the linguistic diversity of Lao PDR, especially in rural areas, presents an inherent challenge for frontline health care service delivery. Targeted recruitment of health workers from rural ethnolin-guistic groups, coupled with an intentional deployment back to their communities, may mitigate this challenge, and has been used successfully in Vietnam.30
30 Dolea, Carmen (2010). Increasing Access to Health Workers in Remote and Rural Areas through Improved Retention: Global Policy Recommendations.,World Health Organization, Geneva.
22 Lao PDR Health Center Workforce Survey
Figure 9: Ethnic concordance between HC workers and the catchment population
Figure 10: Linguistic concordance between HC workers and the catchment population
23Lao PDR Health Center Workforce Survey
Box 2: Gender Dimensions
Gender dimensions can be explored from two perspectives: Firstly, from the patient-client’s per-spective, in particular, whether pregnant women are able to receive maternity care from a female provider; and secondly, from the perspective of gender equity in employment.
With regard to patient-client perspectives, this survey finds that of all the HC workers who con-ducted a delivery (either at the HC or as outreach) within the last three months of the survey, 42 percent were male, typically medical assistants and male nurses. This is somewhat unusual given that most health workers were female, especially for health workers who are midwives and/or had MCH responsibilities (Table 3). The utilization of maternity services is already low in Lao PDR, with skilled birth attendant rates of only 31 percent in rural areas. Cultural barriers hence may be compounded by the lack of gender sensitivity in the provision of MCH services. Consider-ing that the HC workforce already includes many female health workers trained in NCH, it may be helpful to explicitly allow pregnant women the choice, where feasible, to be attended by a female birth attendant.
With regard to gender and employment, this survey finds that women make up the majority (57 percent) of HC workers, and that their aggregate compensation is equal to that of male counterparts, although they are on average three years junior to their male counterparts (Table 3). Certain positions and grades are dominated by women – midwives and MCH providers – but most HC heads are male (only 37 percent are female). In some grades and positions, women are compensated less than their male counterparts (for example, as medical assistants and mid-wives) although the reverse is true for some other grades and positions. There is some suggestion that there is an experienced cohort of women serving as deputy HC heads. Female HC workers are more highly educated – all have at least a basic degree, 77 percent had a mid-level degree compared with 64 percent for males, and 18 percent had a basic-level degree compared with 25 percent of males.
Many of these findings could be explained if HCs in the past had mainly been staffed by male health workers, but that recent times have seen the entry of a more highly educated and mainly female cohort of health workers. If true, such reforms would be welcome.

24 Lao PDR Health Center Workforce Survey
Table 3: Gender dimensions of HC workers
Type of health worker
Position within the HCHC HeadDeputy HC HeadMCHDrug Revolving FundGradeMedical AssistantsNursing ProfessionalsParamedicsMidwivesAll
Percent who are female (%)
37588754
5656517757
Median compensation31 of female workers (kip)
(% of median male worker’s compensation)
1,723,000 (102)1,446,000 (93)
1,167,00032
1,490,000 (210)
1,300,000 (84)1,250,000 (110)1,595,000 (115)1,500,000 (89)
1,363,000 (100)
Median experience of female workers (years)(male workers, years)
6.5 (9.8)15.2 (7.6)
3.34.3 (4.3)
3.3 (6.5)4.3 (5.4)4.3 (16.3)9.8 (9.8)4.3 (7.6)
31 Excluding supplementary income earned outside the health center.32 Only five male MCH staff, who are all volunteers.

25Lao PDR Health Center Workforce Survey
2.3 Health Center Workforce Distribution
9. There are large inequalities in the distribution of HC workers, as shown by Lorenz curves (Figure 11) of HC workers (all positions and grades), for urban HC catchment areas and, separately, for rural HC catchments areas. These inequalities do not merely reflect an urban-rural divide, as even within rural areas alone, the least served half of the rural popu-lation was served by only 26 percent of rural HC workers. In urban areas alone, the least served half of the urban population was served by only 28 percent of urban HC workers. In other words, there is significant maldistribution of the health workforce within rural areas and within urban areas, not just between urban and rural areas, which may have implica-tions on the allocative efficiency of service delivery.
Figure 11: Lorenz curve for the distribution of all HC workers across HC catchment ar-eas33
33 Lorenz curves and GINI coefficients can be used to measure imbalances in the geographic distribution of health workers. Munga, Michael A., and Ottar Mæstad (2009). “Measuring Inequalities in the Distribution of Health Workers: The Case of Tanzania.” Human Resources for Health, 7 (1): 4. doi:10.1186/1478-4491-7-4; and Soucat, Agnes, Richard Scheffler, and Tedros Adhanom Ghebreyesus, eds (2013). The Labor Market for Health Workers in Africa: A New Look at the Crisis. The World Bank. http://elibrary.worldbank.org/doi/book/10.1596/978-0-8213-9555-4.

26 Lao PDR Health Center Workforce Survey
34 Munga, et al. (2009).35 Tanzania has 169 districts and a national population of 49 million (≈290,000 per district); Lao PDR has 17
provinces including Vientiane municipality and a national population of 6.8 million (≈400,000 per province).36 Author’s calculations. Data source: Department of Organization and Personnel, Ministry of Health, Lao PDR
(2012).
Table 4: GINI coefficients for the distribution of health care workers, lao PDR and tanzania
GINI coefficients0 = perfect equality; 1= perfect inequalityBoth urban and rural health center catchments (HCCs)Rural HCCs onlyUrban HCCs onlyProvinces in Lao PDR (incl. Vientiane Capital), orUrban and rural districts in Tanzania35
Rural districts onlyUrban districts only
Lao PDR
0.3630.3920.306
0.15836
--
Tanzania34
---
0.2290.1100.225
10 Comparisons with Tanzania also highlight an interesting feature. Whereas in Tan-zania the distribution of health workers in rural districts is more equal compared with urban districts, in Lao PDR, this trend is reversed as rural HC catchment areas have greater mald-istribution of health workers than urban HC catchment areas. This characteristic – greater imbalances in the distribution of HRH within rural areas, where, for example, 27 percent of rural HC workers have been allocated to provide services for just 5 percent of the rural population - should be explored further. There is also some suggestion that health workers in Lao PDR are distributed inequitably (GINI of 0.16 at provincial-level) compared with Tan-zania (GINI of 0.229 at district-level, which are of comparable size to Lao provinces). See Table 4.
27Lao PDR Health Center Workforce Survey
37 WDI, 2014.38 LSIS, 2012.39 McCoy, David, Sara Bennett, Sophie Witter, Bob Pond, Brook Baker, Jeff Gow, Sudeep Chand, Tim Ensor, and
Barbara McPake (2008). “Salaries and Incomes of Health Workers in Sub-Saharan Africa.” The Lancet, 371 (9613): 675–81.
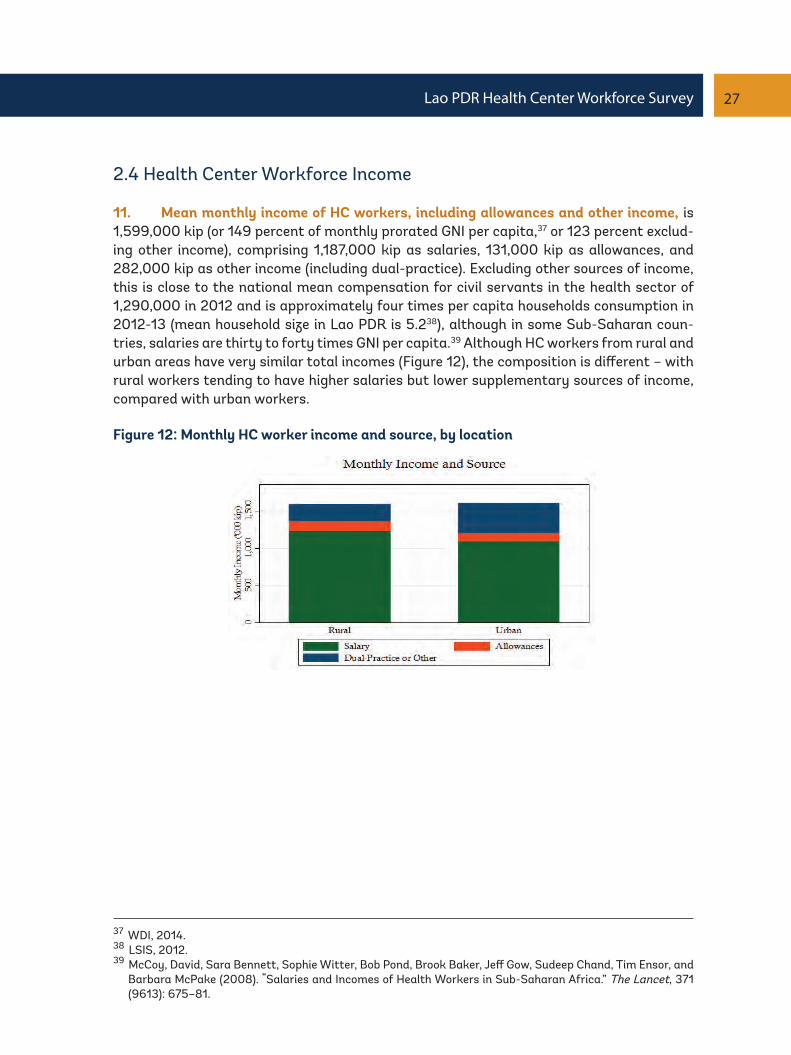
2.4 Health Center Workforce Income
11. Mean monthly income of HC workers, including allowances and other income, is 1,599,000 kip (or 149 percent of monthly prorated GNI per capita,37 or 123 percent exclud-ing other income), comprising 1,187,000 kip as salaries, 131,000 kip as allowances, and 282,000 kip as other income (including dual-practice). Excluding other sources of income, this is close to the national mean compensation for civil servants in the health sector of 1,290,000 in 2012 and is approximately four times per capita households consumption in 2012-13 (mean household size in Lao PDR is 5.238), although in some Sub-Saharan coun-tries, salaries are thirty to forty times GNI per capita.39 Although HC workers from rural and urban areas have very similar total incomes (Figure 12), the composition is different – with rural workers tending to have higher salaries but lower supplementary sources of income, compared with urban workers.
Figure 12: Monthly HC worker income and source, by location

28 Lao PDR Health Center Workforce Survey
12. Among the different grades of health workers, medical doctors have the highest salaries and nurses have the lowest salaries, although the overall picture is of a highly compressed salary scale which may indicate directions for reforms (Figure 13). Allowances and supplementary sources of income were significant contributors to total income.
Figure 13: Monthly HC worker income and source, by grade
13. The situation was less equitable when it comes to different employment statuses, as HC volunteers took home less than one-third of the total income of a HC civil servant (Figure 14). ‘Salaries’ for volunteers were comparable in quantum to their income from sup-plementary sources.
Figure 14: Monthly HC worker income and source, by employment status

29Lao PDR Health Center Workforce Survey
Box 3: Dual-practice and Supplementary Income
Almost half of HC workers (40 percent) had a supplementary source of individual income (not including income from other members of the household) outside the HC. Uniquely for Lao PDR, less than 2 percent were involved in health-related dual-practice even though there is no legal block on additional private work which takes place outside public sector working hours.40 This contrasts with other countries in the region where dual-practice is described as ‘ubiquitous’ in Cambodia where 90 percent of the income of dual practitioners is ‘from private work’. In Indonesia, ’70 per-cent of publicly employed puskesmas physicians’ are dual-practitioners, and in Vietnam, ’84 per-cent of public health staff’ are dual-practitioners.41 Although there is no empirical evidence avail-able to confirm this, the relatively low rates of health-related dual-practice in Lao PDR could be due to weak demand for private primary care services in the rural areas, and hence, almost all sources of supplementary income are from agricultural activities and/or small enterprises.
HC workers reported that the main reason for seeking additional income sources was due to inad-equate income (88 percent), although the baseline salary and allowances profile for HC workers with and without supplementary income is similar (Figure 15). Among those with supplementary income, the mean monthly supplement was 712,000 kip. The average time spent on work outside the HC was 12.9 hours per week.
Figure 15: Monthly HC worker income and source, for workers with and without a sup-plementary source of income
40 And meets the requirements of the Health Care Law (2005).41 World Health Organization et al. (2013). “Dual Practice by Health Workers in South and East Asia: Impact and
Policy Options.” http://iris.wpro.who.int/handle/10665.1/5284.

30 Lao PDR Health Center Workforce Survey
2.5 Health Center Workforce In-Service Training
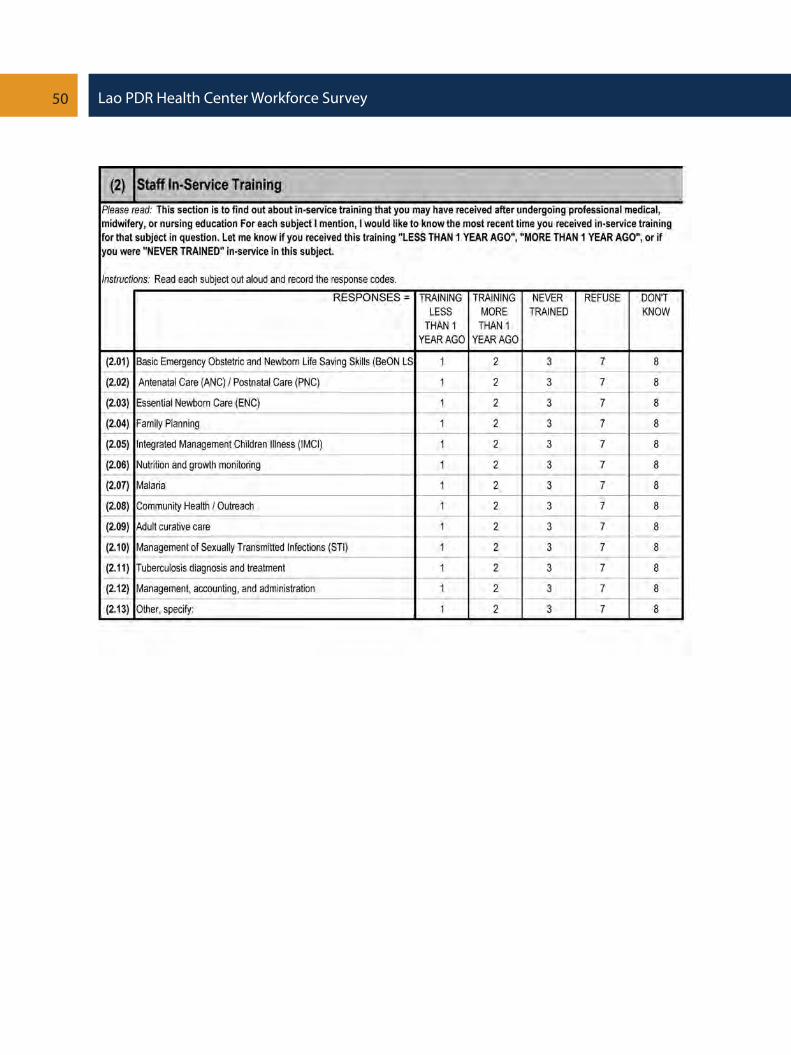
14. Almost half (44 percent) of HC staff had never undergone any in-service training (Figure 17), and only 40 percent underwent any training in the last one year. The three most common training topics provided were on (i) Nutrition and Growth Monitoring, (ii) Family Planning, and (iii) Antenatal and Postnatal Care (Table 16). Urban-rural differences were small – with urban HC workers reporting that 46 percent had never undergone any in-ser-vice training, compared with 42 percent for rural HC workers.
15. Training investments on critical topics even for staff directly involved in providing such critical services was inadequate – for example, 67 percent of HC staff who conducted a facility delivery in the last three months, had never received in-service training on Basic and Essential Obstetrics and Newborn Life Savings Skills (BEONLSS) (Figure 17). Similarly, 67 percent of staff who treated a patient for malaria in the last three months, had never received in-service training on malaria.
Figure 16: In-service training provided in the last year
Figure 17: In-service training never provided
31Lao PDR Health Center Workforce Survey
2.6 Health Center Workforce Satisfaction
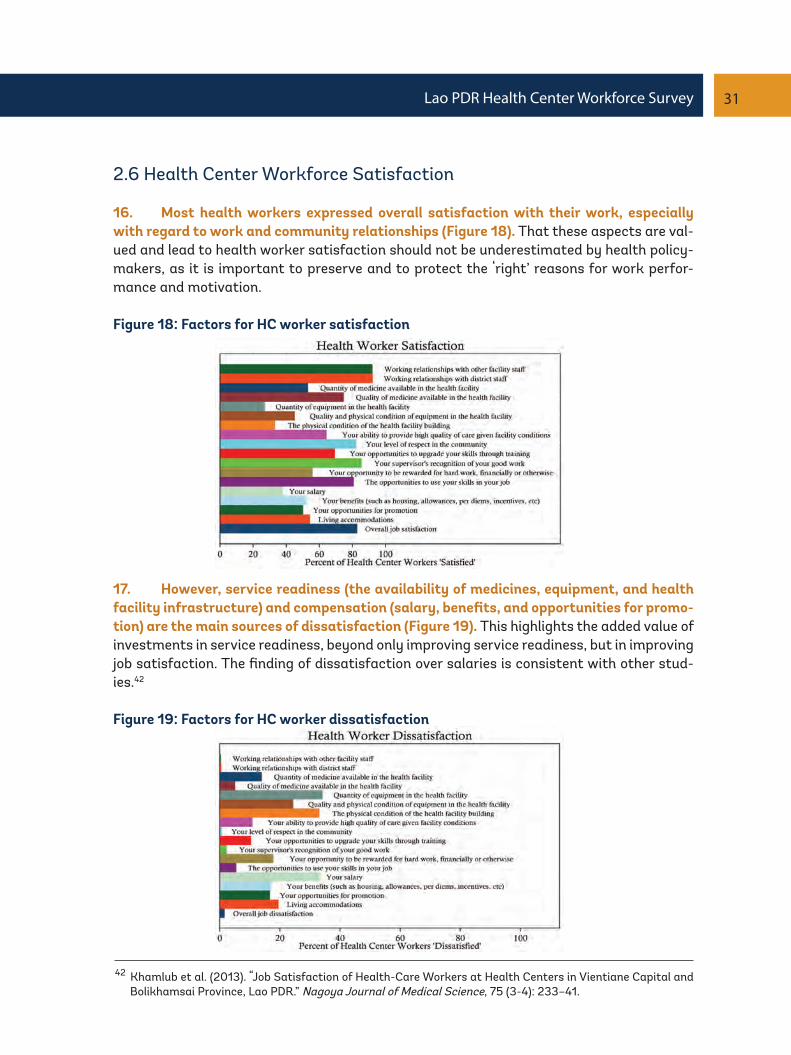
16. Most health workers expressed overall satisfaction with their work, especially with regard to work and community relationships (Figure 18). That these aspects are val-ued and lead to health worker satisfaction should not be underestimated by health policy-makers, as it is important to preserve and to protect the ‘right’ reasons for work perfor-mance and motivation.
Figure 18: Factors for HC worker satisfaction
17. However, service readiness (the availability of medicines, equipment, and health facility infrastructure) and compensation (salary, benefits, and opportunities for promo-tion) are the main sources of dissatisfaction (Figure 19). This highlights the added value of investments in service readiness, beyond only improving service readiness, but in improving job satisfaction. The finding of dissatisfaction over salaries is consistent with other stud-ies.42
Figure 19: Factors for HC worker dissatisfaction
42 Khamlub et al. (2013). “Job Satisfaction of Health-Care Workers at Health Centers in Vientiane Capital and Bolikhamsai Province, Lao PDR.” Nagoya Journal of Medical Science, 75 (3-4): 233–41.

32 Lao PDR Health Center Workforce Survey
43 Soucat, Agnes, Richard Scheffler, and Tedros Adhanom Ghebreyesus, eds (2013). The Labor Market for Health Workers in Africa: A New Look at the Crisis, The World Bank. http://elibrary.worldbank.org/doi/book/10.1596/978-0-8213-9555-4.
44 In this sample, health center workers from all grades and positions reported seeing patients, and hence are included in the analysis.
45 Health Management Information System 2011-2012, Lao PDR MoH.46 Kanchanachitra et al. (2011).
2.7 Health Center Workforce Productivity and Efficiency
18. HC workers in Lao PDR were underutilized, with a mean of only 5.6 consultations per HC worker per day (median 4), despite working a median of 40 hours a week, five days a week (mean is 54.6 hours and 5.4 days respectively) (Figure20). By contrast, in rural Tan-zania, the median number of consultations per day per health worker was 14.43 Hence, even though HC workers only received modest compensation, the implied unit cost of labor per consultation was relatively high at 13,500 kip.44
Figure 20: Consultations per HC worker per day
19. Part of the underutilization of HC workers may be attributed to the maldistribu-tion of health workers in rural and remote areas in Lao PDR, but given that outpatient utilization is low in Lao PDR nationally (0.44 outpatient consultations per capita per year in 2012),45 demand-side aspects such as health seeking behaviors, perceived quality con-cerns, financial, physical, cultural, and other barriers, will need also to be addressed. The irony of relative underemployment despite the scarcity of Lao health workers due to low utilization of health services attributed to demand-side factors has been noted before.46

33Lao PDR Health Center Workforce Survey
20. Furthermore, despite the relative scarcity of health workers, health workers spent 15 percent of their time completing forms, reports, and other monitoring activities, a mean of 8.7 hours per week (Figure 21). Although there is some degree of underutilization of health workers, this administrative burden may still affect frontline service delivery as health workers who spend the most time on clinical work, especially medical assistants and midwives (Figure 22), are also the health workers who spend the most time on these administrative tasks. Medical assistants spend 10 hours per week on administrative tasks in addition to 54 hours per week spent on, or being available for, clinical work. Considering HC worker salaries, the implied cost of these monitoring activities is 341,000 kip per month per HC worker. In the context of an overall undersupply of health workers, the use of roughly one-seventh of health worker time to complete forms, reports, and other monitoring activi-ties, may be unaffordable.
Figure 21: Usage of HC worker working time
Figure 22: Usage of HC worker working time, by grade

34 Lao PDR Health Center Workforce Survey
Box 4: How efficient are HCs in Lao PDR?
Data Envelopment Analysis (DEA)47 is a commonly used method for analyzing the efficiency of health facilities, based on measured inputs and outputs. Due to data limitations for this analysis, the input used is the total number of HC workers, and the outputs are deliveries (both in the HC and by outreach), immunizations, and outpatient consultations, and inpatient discharges.
DEA of HCs surveyed found that HCs overall were operating at only a 45 percent level of efficiency, with rural HCs slightly outperforming urban HCs. These findings contrast with findings from DEA done in other countries – for example, in Kenya, the mean efficiency of public HCs is 0.73 while the mean efficiency for public district hospitals in Zambia is 0.63 (0.73 in private district hospitals), thus highlighting the significant scope for improvement in the efficiency of HCs in Lao PDR (Table 5). Further analysis on determining the scale efficiencies and the causes of inefficiencies are pos-sible but beyond the scope of this report.
Table 5: Findings from DEA of lao HCs and comparators
Data Envelopment Analysis Statistics0 = inefficient; 1=efficientPercent of efficient health facilitiesMean efficiency scoreMedian efficiency scoreStandard DeviationLeast Efficiency ScoreMean efficiency score (rural HCs)Mean efficiency score (urban HCs)Mean efficiency score (public facilities)Mean efficiency score (private and mission facilities)
Lao PDRHCs
90.450.380.220.180.470.410.45
-
Zambia districthospitals
400.670.660.330.23
--
0.630.73
Kenyapublic HCs48
560.73
-----
0.73-
47 Masiye, Felix (2007). “Investigating Health System Performance: An Application of Data Envelopment Analy-sis to Zambian Hospitals.” BMC Health Services Research, 7 (1): 58. doi:10.1186/1472-6963-7-58.
48 Kirigia, Joses M., Ali Emrouznejad, Luis G. Sambo, Nzoya Munguti, and Wilson Liambila (2004). “Using Data Envelopment Analysis to Measure the Technical Efficiency of Public Health Centers in Kenya.” Journal of Med-ical Systems, 28 (2): 155–66.
Figure 23: Distribution of technical efficiency scores for HCs

35Lao PDR Health Center Workforce Survey
2.8 Health Center Workforce Ability
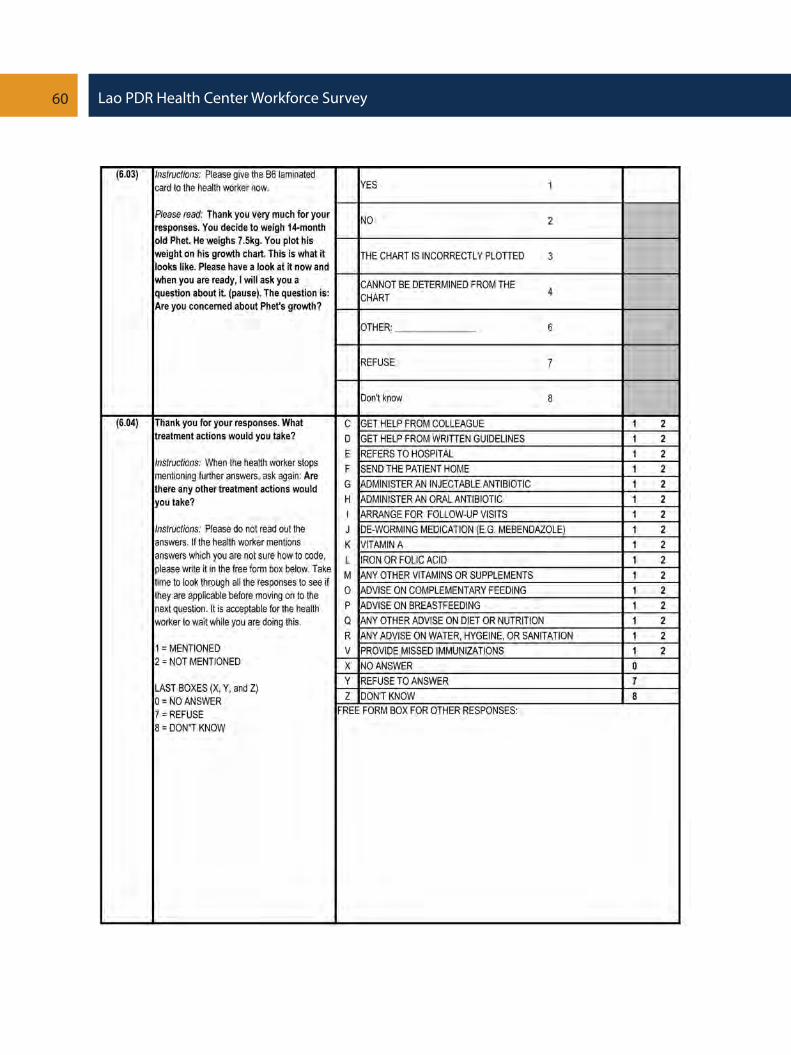
21. Based on an analysis of clinical vignettes applied to HC workers,49 this survey finds that only 56 percent of HC workers would ask about breastfeeding, only 72 percent would ask about complementary feeding practices, and only 21 percent would ask about hygiene and sanitation during a consultation for a child for growth monitoring (Table 6). These are critical aspects of infant and young child feeding (IYCF) as the prevalence of stunting (44 percent of under-fives) and underweight (27 percent of under-fives) is very high in Lao PDR.50 Although the causes for this are multisectoral, the health sector plays a role in providing nutrition advice and key commodities such as Vitamin A, deworming medicine, and iron supplements.
22. Most HC workers would weigh and measure the length/height of the child, and were able to correctly interpret the growth chart, but not many would then act on the im-plications of these findings - only about one-third of health workers would have then treat the child with Vitamin A or deworming medications, and 42 percent would have provided advice on hygiene and sanitation.
23. A further concern is that, in areas where health workers considered the preva-lence of stunting to be higher than usual, these health workers tended to undertreat chil-dren, perhaps indicating an incorrect consideration that where stunting is common, it can be considered to be ‘normal’.
24. Health workers who had experience providing child growth monitoring services in the last three months were associated with above average scores, and this association was confirmed in a basic regression model as detailed in Annex 1.
Table 6: Knowledge of nutrition as applied to a child growth monitoring visit
49 Methodology used is described in Box 5.50 LSIS, 2012.
36 Lao PDR Health Center Workforce Survey
51 WHO (2004). Immunizations in practice.52 WDI (2013).
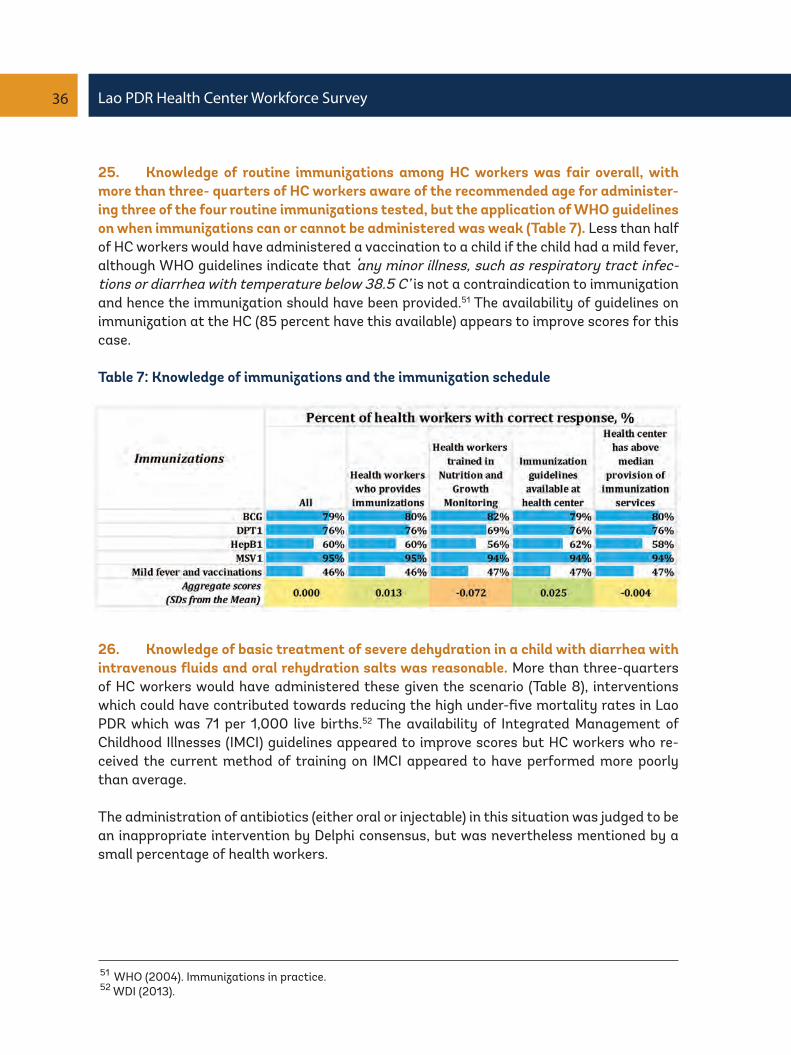
25. Knowledge of routine immunizations among HC workers was fair overall, with more than three- quarters of HC workers aware of the recommended age for administer-ing three of the four routine immunizations tested, but the application of WHO guidelines on when immunizations can or cannot be administered was weak (Table 7). Less than half of HC workers would have administered a vaccination to a child if the child had a mild fever, although WHO guidelines indicate that ‘any minor illness, such as respiratory tract infec-tions or diarrhea with temperature below 38.5 C’ is not a contraindication to immunization and hence the immunization should have been provided.51 The availability of guidelines on immunization at the HC (85 percent have this available) appears to improve scores for this case.
Table 7: Knowledge of immunizations and the immunization schedule
26. Knowledge of basic treatment of severe dehydration in a child with diarrhea with intravenous fluids and oral rehydration salts was reasonable. More than three-quarters of HC workers would have administered these given the scenario (Table 8), interventions which could have contributed towards reducing the high under-five mortality rates in Lao PDR which was 71 per 1,000 live births.52 The availability of Integrated Management of Childhood Illnesses (IMCI) guidelines appeared to improve scores but HC workers who re-ceived the current method of training on IMCI appeared to have performed more poorly than average.
The administration of antibiotics (either oral or injectable) in this situation was judged to be an inappropriate intervention by Delphi consensus, but was nevertheless mentioned by a small percentage of health workers.
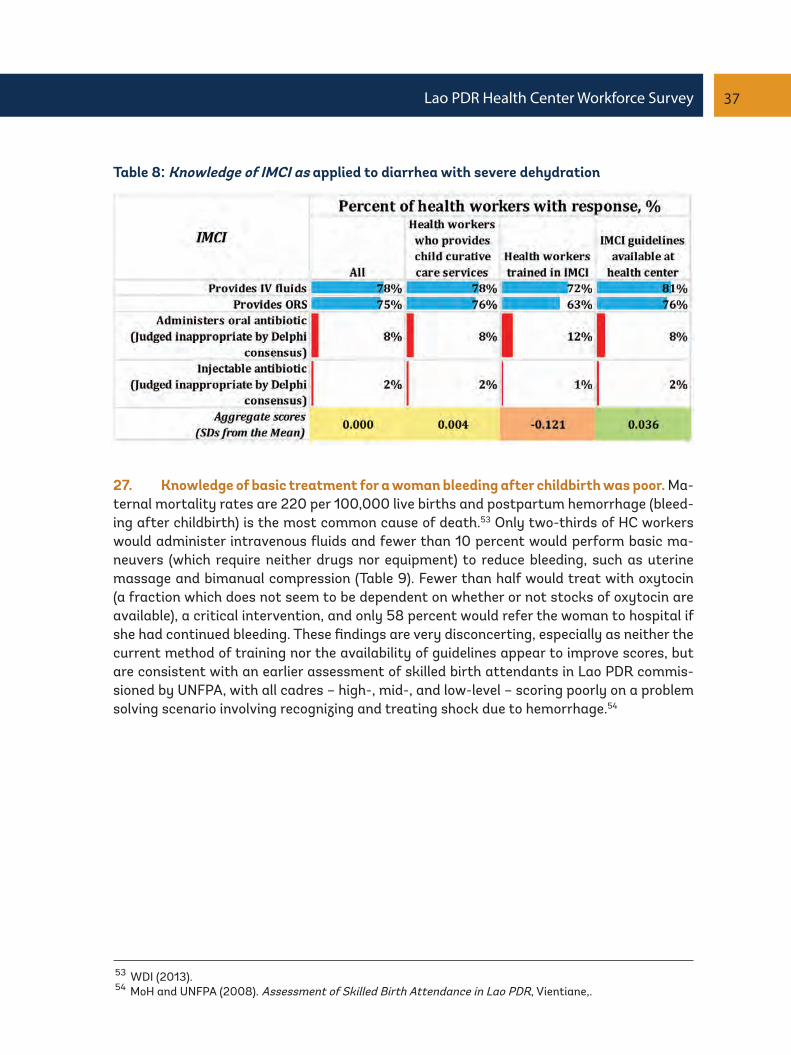
37Lao PDR Health Center Workforce Survey
Table 8: Knowledge of IMCI as applied to diarrhea with severe dehydration
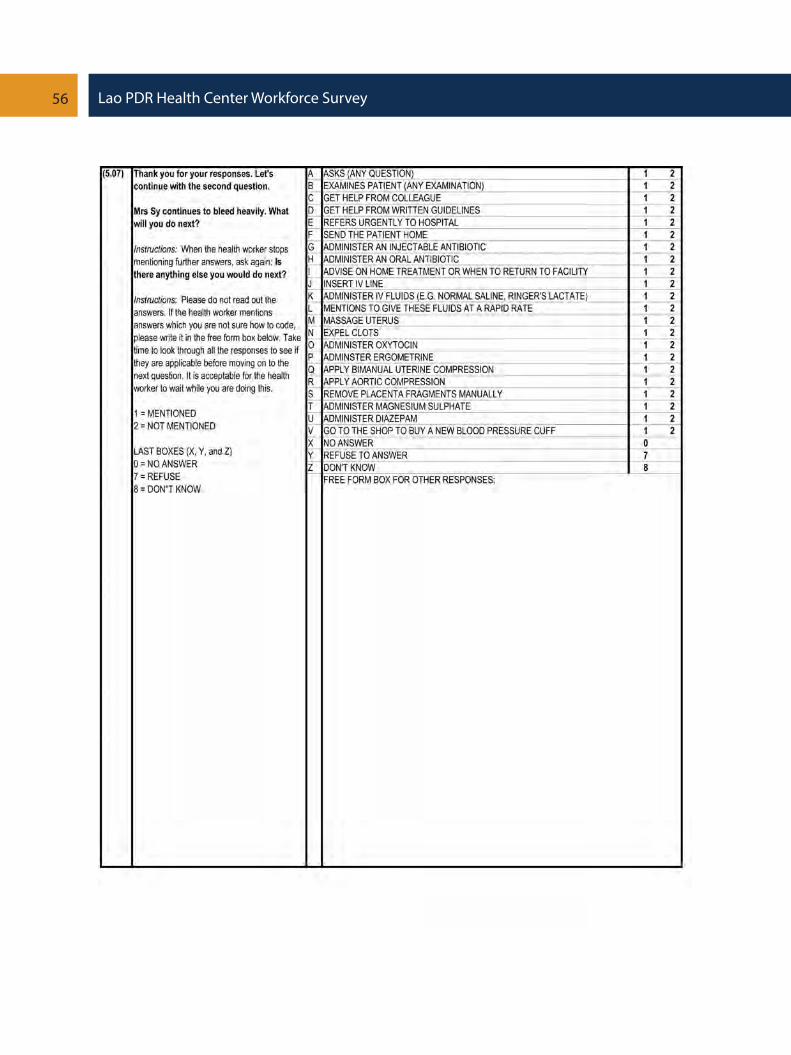
27. Knowledge of basic treatment for a woman bleeding after childbirth was poor. Ma-ternal mortality rates are 220 per 100,000 live births and postpartum hemorrhage (bleed-ing after childbirth) is the most common cause of death.53 Only two-thirds of HC workers would administer intravenous fluids and fewer than 10 percent would perform basic ma-neuvers (which require neither drugs nor equipment) to reduce bleeding, such as uterine massage and bimanual compression (Table 9). Fewer than half would treat with oxytocin (a fraction which does not seem to be dependent on whether or not stocks of oxytocin are available), a critical intervention, and only 58 percent would refer the woman to hospital if she had continued bleeding. These findings are very disconcerting, especially as neither the current method of training nor the availability of guidelines appear to improve scores, but are consistent with an earlier assessment of skilled birth attendants in Lao PDR commis-sioned by UNFPA, with all cadres – high-, mid-, and low-level – scoring poorly on a problem solving scenario involving recognizing and treating shock due to hemorrhage.54
53 WDI (2013).54 MoH and UNFPA (2008). Assessment of Skilled Birth Attendance in Lao PDR, Vientiane,.

38 Lao PDR Health Center Workforce Survey
28. Experience appears to be an important factor in improving scores. HC workers who have experienced a similar postpartum hemorrhage case before and those from HCs which are above the median in the number of deliveries conducted score better. However, in a basic regression model (as detailed in Annex 1), training appears to be negatively associ-ated with scores.
Table 9: Knowledge of integrated management of pregnancy and childbirth (IMPC) as ap-plied to postpartum hemorrhage
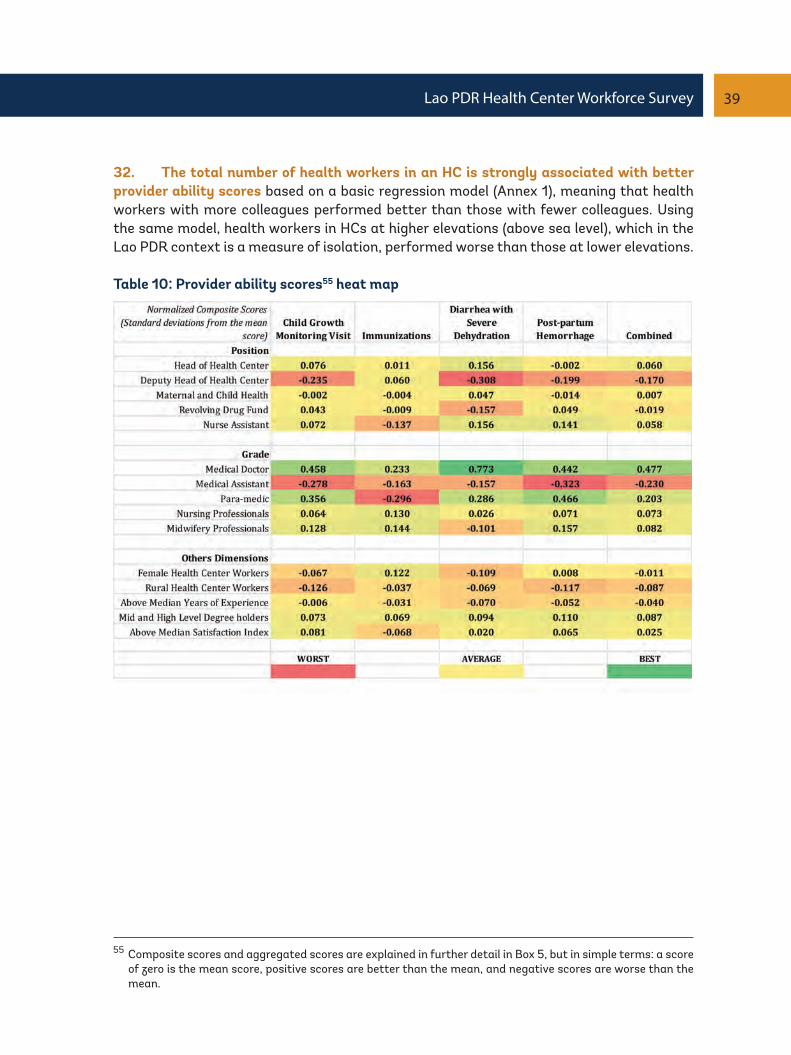
29. In terms of scores by position within the HC, HC heads performed the best overall and deputy HC heads performed the worst, especially in the case for child growth monitor-ing and the diarrhea with severe dehydration case (Table 10).
30. By grade, medical assistants, who are the largest single cadre by grade and com-prise 37 percent of all HC staff, performed the worst, especially for the postpartum hem-orrhage case and the child growth monitoring case. Midwifery professionals performed better on the postpartum hemorrhage case, but unsurprisingly did not perform well on cases they were not explicitly trained for such as diarrhea with severe dehydration. Medi-cal doctors appear to have performed the best compared to all other grades although the number of medical doctors in the sample was small.
31. There are no significant performance differences between male and female HC workers but rural HC workers appear to underperform relative to urban HC workers. HC workers with more years of experience since graduation, perhaps reflecting an earlier gen-eration of training, appear to perform less strongly, but HC worker satisfaction appears not to have much impact on scores.
39Lao PDR Health Center Workforce Survey
32. The total number of health workers in an HC is strongly associated with better provider ability scores based on a basic regression model (Annex 1), meaning that health workers with more colleagues performed better than those with fewer colleagues. Using the same model, health workers in HCs at higher elevations (above sea level), which in the Lao PDR context is a measure of isolation, performed worse than those at lower elevations.
Table 10: Provider ability scores55 heat map
55 Composite scores and aggregated scores are explained in further detail in Box 5, but in simple terms: a score of zero is the mean score, positive scores are better than the mean, and negative scores are worse than the mean.

40 Lao PDR Health Center Workforce Survey
56 The weights are as follows: +5 for mentioning a critically important intervention, -1 for omitting to mention a critically important intervention; +3 for mentioning a correct intervention; -1 for mentioning a harmful intervention; -2 for mentioning a life-threatening intervention.
Box 5: Method used for analyzing HC workforce ability
In order to measure provider ability in this survey, four cases were chosen reflecting the health pri-orities of Lao PDR, namely maternal health, child health, and nutrition. The four cases used were (i) a routine growth monitoring visit, (ii) routine childhood immunizations, (iii) a child with diarrhea and severe dehydration, and (iv) a delivery complicated by postpartum hemorrhage. National and international guidelines were consulted in order to construct the case and potential responses, in a contextualized manner. In order to determine whether responses were correct or incorrect, an expert panel comprising Lao PDR Ministry of Health central staff from the relevant department such as the Maternal and Child Health Center and the National Nutrition Center, and district-level staff was convened.
The Delphi consensus method was then used to query the panel to determine, given the local Lao context, whether potential responses to each question were (i) critically important life-saving in-terventions, (ii) correct interventions, (iii) neutral interventions with neither harmful nor beneficial effects, (iv) harmful interventions which may impact the patient negatively, (v) life-threatening interventions which may result in the death of the patient. Health worker responses were then scored against the expert panel consensus for each of the questions. In addition, composite scores were generated by weighting the individual responses56 and normalizing the total score for each of the four cases such that the scores are presented as standard deviations from the mean derived separately for each case.
A composite score of zero ‘0’ (yellow color) means that a health worker received the average (mean) score for all health workers for that particular case. A composite score of ‘-1’ (orange-red color) means that the health worker scored one standard deviation below (worse) the average (mean) score for all health workers for that particular case; while a composite score of ‘+1’ (green color) means that the health worker scored one standard deviation above (better) the average (mean) score for all health workers.
As there are four cases, a further measure – the ‘combined’ score – is an arithmetic unweighted mean composite score of all four cases.
In addition, basic econometric models were used to regress outcomes scores for vignettes with factors such as training received, availability of guidelines, experience, health worker demograph-ics, and HC characteristics. Findings from these are consistent with intuitions from the tabula-tions of scores provided earlier, and detailed findings are available in Annex 1.

41Lao PDR Health Center Workforce Survey
3. Key RecommendationsLao PDR is a sparsely populated, mountainous, and land-locked country, with a diversity of ethnicities and languages, and weak land transport infrastructure, thus posing an in-herent service delivery challenge, especially with regard to HRH. This study finds that the per capita density and distribution of critical HRH was low and inequitable, although this occurred in the context of extremely low utilization of health services, which means that the productivity of health workers was also low. Improving clinical ability, for which there is some evidence of a positive association with health worker experience and with HC staff working in large lowland health centers, is hence a major challenge.
In terms of informing broader HRH policy, the HC survey data used here is limited by the non-inclusion of (i) private providers, (ii) secondary and tertiary health facilities, (iii) other cadres, notable village-level agents, and managerial, administrative, and support staff. With these limitations in mind, we would like to make the recommendations below, based on the empirical findings from this public HC worker survey.
1. Conduct and act on an effective strategic review of the distribution of frontline HRH nationally. Considering the geographic, socioeconomic, and ethnolinguistic context of Lao PDR, HRH policies and implementation are noted to be particularly challenging in Lao PDR and this is acknowledged. Nevertheless, there are opportunities to address the sig-nificant inefficiencies in health service delivery related to the maldistribution (geographic, level, and type) and underutilization of frontline human resources, using fiscally neutral solutions. Although this review should be conducted at the national-level, the role and rel-evance of provincial-level stakeholders is critical to ensure buy-in and the inclusion of local considerations.
The terms of reference for this review should include (i) taking stock of the current supply and production of HRH, (ii) assessing, with adequate geographic granularity, population health needs (not just short term current demand) and utilization patterns at a subdistrict level, (iii) taking note of the infrastructure and networks for referrals (with particular focus on obstetric emergencies), (iv) taking into consideration ethnolinguistic and gender inclu-sivity and sensitivity, and (v) based on these, to make an objective determination of where the current and future supply (numerically, and by type and level) of HRH should be con-centrated, in view of its scarcity. This may include necessitating the consolidation of HCs in extreme cases where they are too thinly spread or fragmented to be effective – with the key concern being the demonstration in this study that low utilization and few opportuni-ties for experiential learning in isolated HCs health is associated with poor clinical ability in managing emergencies – in addition to efficiency considerations. Any such consolidation must be preceded by investments in strengthening community-level referral systems and an active program of outreach (beyond a uniform policy of quarterly visits only), which lev-erages and empowers village-level health agents (such as village health volunteers and/or village health workers.

42 Lao PDR Health Center Workforce Survey
This strategic review will need a sufficiently powerful political mandate such that poten-tially unpopular recommendations, which may include the closure and relocation of some HCs, and the relocation and retraining of health staff, can be followed through. Neverthe-less, some flexibility would be needed to allow transitions to occur over a fair amount of time, perhaps linked to overall investment plans for health facilities and linked to overall career development plans for health staff. In addition, an appropriate consultative process for local stakeholders will be needed to ensure that all relevant information and concerns are taken into consideration through the process.
This distributional review can be complemented by related HRH reviews such as the Repro-ductive, Maternal, and Neonatal Health Workforce Assessment used elsewhere,57 to pro-vide a model for projecting and costing various HRH development strategies.
2. Leverage the vast opportunities to improve training programs and supervision. This survey finds substantial gaps in the clinical abilities of frontline health workers in the management of MDG-related clinical situations, and highlights a significant gap in the quality of health education beginning at the pre-service stage (including entry regulations/requirements for health workers) and continuing throughout the professional life of the health worker.
Firstly, the delivery of in-service training needs to be improved as there is evidence that HC workers who received in-service training performed worse than those who didn’t, and that health workers scored best on questions which relate to a repetition of facts (for ex-ample, immunization schedules) rather than an application of principles (for example, ad-ministration of vaccines in a child with a mild fever). Furthermore, even though HC workers were able to correctly identify the problem of undernutrition in a child, they did not follow through with the appropriate treatment actions.
Secondly, the mode of learning should emphasize experiential and practical forms of peda-gogy, as there is evidence that prior and recurring experience is associated with better scores. Given the team nature of HCs (and indeed individuals in larger HC teams had better scores), health workers should be encouraged to consult with and learn from one another through mutual mentoring. The existing mechanism for supportive supervision can be lev-eraged further, to specifically enable (and make supervisors accountable for) mutual men-toring.
Thirdly, greater contextualization and orientation of training materials to the Lao PDR con-text is needed, in order to address the specific weaknesses and gaps in Lao PDR. For exam-ple, specific weaknesses and knowledge gaps have been identified in clinical cases involving nutrition and maternal health emergencies. Certain weaknesses in performance may even be due to a dilution of standards to the local norms – for example, there is some evidence that health workers would undertreat undernourished children, where they perceive that the children are from a community with above average stunting prevalence. Direct trans-lations of international guidelines to the Lao language would alone not be able to address such cognitive biases.
57 Chilvers R., P. Van Look, P. ten Hoope-Bender (2014). RMNH Workforce Assessment 2014. MOHFW Bangla-desh, UNFPA, ICS Integrare. Barcelona, Spain

43Lao PDR Health Center Workforce Survey
Fourthly, the selection and matching of staff for in-service training can be improved. HC workers who were providing critical services such as malaria treatment and delivery ser-vices, were more often than not HC staff who had never received in-service training on these topics. In larger HCs which serve larger catchment populations, specialization be-tween staff may be helpful in order to improve quality. Prioritization of rural HC staff for in-service training should also be considered, as these had below average scores in general on all four of the clinical cases used, once in-service training programs are improved. District and provincial stakeholders should be empowered to play a critical role in planning HRH training, and be held accountable for this.
3. Invest in reducing demand-side barriers such as physical access barriers, ethno-linguistic and gender barriers, and financial barriers, in order to increase the utilization of essential health services, as underutilization in rural areas is a substantial driver of health workforce inefficiencies in HCs. This will involve a combination of interventions (beyond the scope of this policy note) including community-based initiatives to address health seek-ing behaviors and cultural barriers, and health financing interventions to reduce financial barriers. HRH-related interventions in order to improve linguistic concordance and gender sensitivity will also be required, for example, by targeted recruitment of ethnic groups and deployment back to their communities, and allowing pregnant women more choice on the gender of those providing maternity services.
4. Invest in improving the service readiness of public health facilities. The share of public expenditure on HRH as a fraction of general government health expenditure in Lao PDR is already well within global and regional norms, although inadequate headcounts are noted. Hence, in the near term, further investments to ensure the availability of essential health commodities, equipment, and infrastructure in order to improve the service readi-ness of HCs should be prioritized, as the lack of these are noted to be just as much (if not more) a source of HC worker dissatisfaction as salary is. The supply-side readiness of HCs to provide maternal health services has been previously noted to be low.58 Hence, such in-vestments will have the synergistic effect of improving both health worker satisfaction as well as improving the technical readiness of health facilities to provide quality health ser-vices which improve health outcomes.
58 World Bank (October 2013). Maternal Health Out-of-Pocket Expenditure and Service Readiness in Lao PDR: Evidence for the National Free Maternal and Child Health Policy from a household and health center survey.


45Lao PDR Health Center Workforce Survey
AnnexesAnnex 1: Regressions
For each of the four cases – nutrition, immunizations, curative child health (IMCI), and ob-stetrics (IMPC) – a basic regression model was used, with the normalized case score as the dependent variable and independent variables as detailed in Table 11. In addition, Table 12 contains results from another basic regression model with the normalized combined case scores as the dependent variable. Notable findings are the strength of associations with markers of the degree of isolation and size of HCs. Health workers working in large HCs with many health workers in lowland environments scored significantly better than average
Table 11: Clinical vignette-specific scores
Dependent Variables
Recent (last 3 months) Relevant Experience
Relevant Guidelines Available
Relevant In-Service Training Received(at any time)
Oxytocin Available
Age (ln)
Education(Mid or High-level degree holders)
Urban
Constant
NutritionScore
0.583**0.19
-0.1160.15-0.1
0.14
0.2410.280.33
0.170.380**
0.13-1.604
1.07
ImmunizationScore
0.20.250.1920.18
-0.091
0.14
0.4360.29
0.446*
0.180.1150.14
-2.205*1.09
Obstetrics (IMPC)Score0.2180.16
-0.0270.17
-0.331*
0.160.0320.17
0.3480.29
0.508**
0.170.283*
0.14-0.1470.25
IMCIScore0.1180.29
-0.0370.16
-0.147
0.15
-0.0060.29
0.405*
0.180.1740.14
-0.3991.09
* p<0.05, ** p<0.01, *** p<0.001 ~ Standard Errors reported in italics

46 Lao PDR Health Center Workforce Survey
Dependent VariablesYears of Experience
Age (ln)
Education(Mid- or High-level degree holders)
Urban location
Satisfied(Satisfied with 12 or more of 18 indicators
of satisfaction)
Male Sex
Monthly Income from HC (ln)
Hours Worked per Week (ln)
Elevation above sea level (m)
Total HC Workersin the health center
Constant
Model 1-0.013
0.010.2680.350.315
0.160.244*
0.12-0.032
0.12-0.066
0.120.171*0.07
-0.0750.08
-0.798**0.27
Model 2-0.013
0.010.5010.34
0.324*
0.150.290*
0.12-0.02
0.110.0030.12
0.1040.07
-0.0930.08
0.001***0
-1.178***0.28
Model 3-0.009
0.010.3030.34
0.287
0.150.210.12
-0.028
0.110.035
0.110.0960.07
-0.0610.08
0.001***0
0.076**
0.02-3.080*
1.33
* p<0.05, ** p<0.01, *** p<0.001 ~ Standard Errors reported in italics
Table 12: Combined scores
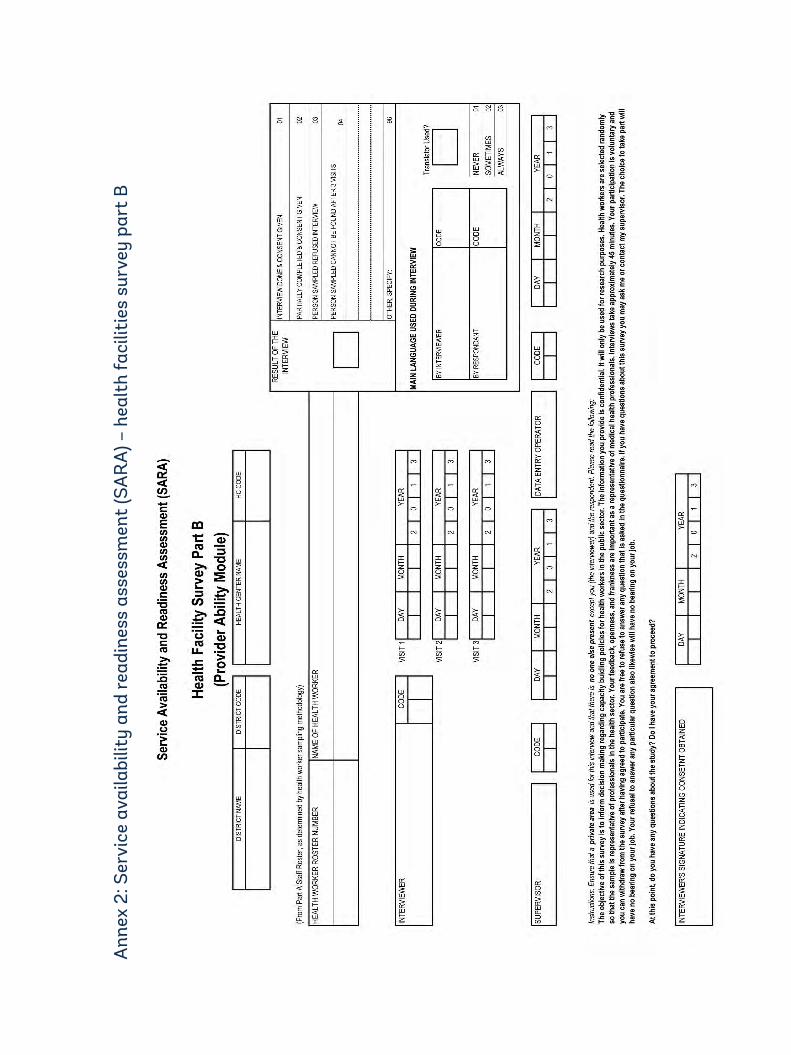
Ann
ex 2
: Ser
vice
ava
ilabi
lity
and
read
ines
s as
sess
men
t (S
AR
A) –
hea
lth
faci
litie
s su
rvey
par
t B

48 Lao PDR Health Center Workforce Survey

49Lao PDR Health Center Workforce Survey
50 Lao PDR Health Center Workforce Survey
51Lao PDR Health Center Workforce Survey

52 Lao PDR Health Center Workforce Survey

53Lao PDR Health Center Workforce Survey

54 Lao PDR Health Center Workforce Survey

55Lao PDR Health Center Workforce Survey
56 Lao PDR Health Center Workforce Survey

57Lao PDR Health Center Workforce Survey

58 Lao PDR Health Center Workforce Survey

59Lao PDR Health Center Workforce Survey
60 Lao PDR Health Center Workforce Survey

61Lao PDR Health Center Workforce Survey

63Lao PDR Health Center Workforce Survey
64 Lao PDR Health Center Workforce Survey

65Lao PDR Health Center Workforce Survey


The World Bank Lao PDRPatouxay Nehru RoadP.O Box: 345Vientiane, Lao PDRTel : (856-21) 266 200Fax : (856-21) 266 299Website: www.worldbank.org/lao
The World Bank1818 H Street, NWWashington, D.C. 20433, USATel: (202) 4731000Fax: (202) 4776391Website: www.worldbank.org