Language and Occupational Status: Linguistic Elitism in ...
26
The Economic and Social Review, Vol. 40, No. 4, Winter, 2009, pp. 435–460 Language and Occupational Status: Linguistic Elitism in the Irish Labour Market* VANI K. BOROOAH University of Ulster DONAL A. DINEEN University of Limerick NICOLA LYNCH University of Limerick Abstract: This paper, using data from the 2006 Irish Census, provides evidence of the structural advantage of Irish speaking, relative to non-speaking workers in Ireland’s labour market with advantage and disadvantage being defined in terms of occupational outcomes. To the best of our knowledge there has been no systematic investigation of any advantage enjoyed by Irish speakers in Ireland and allegations of the comfortable middle class ambience of the Gaelscoileanna have remained at the level of anecdote. Since linguistic elitism is a feature of many societies and since Irish enjoys the constitutional status of the national and first official language of Ireland, such an investigation was, arguably, overdue. This is then compared to the structural advantage of Irish speaking workers in Northern Ireland and of Welsh speaking workers in Wales. Our conclusion is that after controlling for as many relevant factors as the data permitted, a considerable part of the difference between Irish speakers and non-speakers in Ireland, in their proportionate presence in the upper reaches of occupational class, was due to structural advantage. The major contribution of this paper is to lift the debate about the economic position of Irish speakers in Ireland above the level of hearsay: dúirt bean liom go ndúirt bean léi. 435 * This paper has benefitted from the advice of Tony Fahey, John Fitz Gerald, Brian Ó Donnchadha, and Brian Nolan and from the views of seminar participants at the University of Limerick, the ESRI, and NUI Galway. Comments from an anonymous referee and from Alan Barrett were particularly valuable. Our thanks go to all of them. The results reported here are based on the Sample of Anonymised Records from Ireland’s Census of Population 2006 and from the UK’s Census of Population 2001. However, we are entirely responsible for the use and interpretation of these data, for the results reported, and, indeed, for any of this paper’s deficiencies. * Author for correspondence: [email protected] [email protected] [email protected] Nicola Lynch would like to gratefully acknowledge funding received from the Irish Research Council for the Humanities and Social Sciences (IRCHSS).
Transcript of Language and Occupational Status: Linguistic Elitism in ...

The Economic and Social Review, Vol. 40, No. 4, Winter, 2009, pp. 435–460
Language and Occupational Status: Linguistic
Elitism in the Irish Labour Market*
VANI K. BOROOAHUniversity of Ulster
DONAL A. DINEENUniversity of Limerick
NICOLA LYNCHUniversity of Limerick
Abstract: This paper, using data from the 2006 Irish Census, provides evidence of the structuraladvantage of Irish speaking, relative to non-speaking workers in Ireland’s labour market withadvantage and disadvantage being defined in terms of occupational outcomes. To the best of ourknowledge there has been no systematic investigation of any advantage enjoyed by Irish speakersin Ireland and allegations of the comfortable middle class ambience of the Gaelscoileanna haveremained at the level of anecdote. Since linguistic elitism is a feature of many societies and sinceIrish enjoys the constitutional status of the national and first official language of Ireland, such aninvestigation was, arguably, overdue. This is then compared to the structural advantage of Irishspeaking workers in Northern Ireland and of Welsh speaking workers in Wales. Our conclusion isthat after controlling for as many relevant factors as the data permitted, a considerable part ofthe difference between Irish speakers and non-speakers in Ireland, in their proportionatepresence in the upper reaches of occupational class, was due to structural advantage. The majorcontribution of this paper is to lift the debate about the economic position of Irish speakers inIreland above the level of hearsay: dúirt bean liom go ndúirt bean léi.
435
*This paper has benefitted from the advice of Tony Fahey, John Fitz Gerald, Brian Ó Donnchadha,and Brian Nolan and from the views of seminar participants at the University of Limerick, theESRI, and NUI Galway. Comments from an anonymous referee and from Alan Barrett wereparticularly valuable. Our thanks go to all of them. The results reported here are based on theSample of Anonymised Records from Ireland’s Census of Population 2006 and from the UK’sCensus of Population 2001. However, we are entirely responsible for the use and interpretation ofthese data, for the results reported, and, indeed, for any of this paper’s deficiencies.* Author for correspondence: [email protected]@[email protected] Nicola Lynch would like to gratefully acknowledge funding received from theIrish Research Council for the Humanities and Social Sciences (IRCHSS).
04 Borooah article_ESRI Vol 40 14/12/2009 17:39 Page 435

“Is there any point to which you would wish to draw my attention?”“To the curious incident of the dog in the night-time.”“The dog did nothing in the night-time.”“That was the curious incident,” remarked Sherlock Holmes.
Arthur Conan Doyle, Silver Blaze
I INTRODUCTION
The curious incident about Irish speakers in Ireland is that although manyof them never speak Irish – and, of those that do, only a few speak it with
any regularity – they have considerable advantage in the labour market. Thispaper is about the structural advantage – the advantage that remains afteraccounting for relevant employment related factors like educationalqualifications – that Irish speaking workers enjoy over workers who are notable to speak Irish. This advantage is then compared to that of Irish speakingworkers in Northern Ireland and of Welsh speaking workers in Wales.
There are two aspects to structural advantage in the labour market. Thefirst is whether differences in the remuneration to different persons fullyreflect disparities in their productivity or whether such differences are wholly,or in part, the result of “earnings discrimination”. Oaxaca (1973), in hispioneering study of male-female wage differentials, developed a methodologyfor answering this question.
The second aspect relates to the differential chances of persons fromdifferent groups attaining a particular occupational status. Here the concernis whether the different degrees of success, with which persons from differentgroups attain a particular status, are justified by inter-group differences inworker attributes or whether they are the result of “occupationaldiscrimination”. It is this aspect which is the focus of the paper.
The class of jobs we examine are those that are described as “professional,managerial, or technical” (PMT jobs) and having such a job, in contrast tohaving a job outside this occupational class (non-PMT jobs), is regarded in thispaper as “occupational success”. By structural advantage in terms ofoccupational outcomes we mean that, after controlling for a range of labourmarket attributes, workers from one group have a better chance of attainingPMT jobs (i.e. occupational success) than those from another group.
Although the existence, and degree of, occupational discrimination hasbeen investigated for inter alia the USA (Schmidt and Strauss, 1975), GreatBritain (Blackaby et al., 1997 and Borooah, 2001), and Australia (Borooah andMangan, 2007), to the best of our knowledge this has not been investigated forIreland. As Arrow (1998) has observed, although the issue of occupational
436 THE ECONOMIC AND SOCIAL REVIEW
04 Borooah article_ESRI Vol 40 14/12/2009 17:39 Page 436

discrimination is more important than that of earnings discrimination – in thesense of occurring more frequently in the real world – it is also the moreneglected. As Higgs (1977) and Whately and Wright (1994) have argued in thecontext of the US labour market, black and white wages for the same jobrarely differed by much; instead, discrimination took the form of restrictingthe range of jobs to which black persons were hired. Similarly, in NorthernIreland, discrimination against Catholics took the form of excluding them fromjobs (for example, in the shipyards) rather than paying Catholic workers lessthan Protestants (Borooah, 1999).
Examining the labour market advantage of Irish speakers in Ireland isslightly contentious. At a populist level, it has been claimed that “… studentsin Irish schools doing their exams through Irish enjoy positive discrimination,with an advantage in the Leaving Cert[ificate] of up to 10 per cent of theiroriginal result, and that puts children in English-speaking schools, fromEnglish-speaking and immigrant families, at a disadvantage”. Furthermore,smaller classes mean that “… every year, the Leaving Cert[ificate] studentswith the most As come largely from Irish-speaking schools” with theconsequence that “… students from Irish-speaking schools are more likely toget on the university course of their choice”.1 Needless to say, such claims arepromptly rubbished by others: rather than Irish-speaking schools(Gaelscoileanna) being bastions of middle class privilege, many of them are tobe found in working class areas; the extra points system is not as generous asit appears and, in any event, they are awarded to compensate for a paucity oflearning materials in Irish.2
II THE BACKGROUND
The data on which this study is based are from a 5 per cent sample fromthe 2006 Irish Census and a 3 per cent sample from the 2001 UK Census,referred to as the Sample of Anonymised Records and, hereafter, as SARS06and SARS01 respectively.3 The SARS06 asked all its respondents, aged 3 yearsor more: “Can you speak Irish?” If the answer was “yes”, the respondent wasthen asked if he/she spoke it: (i) daily, within the educational system; (ii) daily,outside the educational system; (iii) weekly; (iv) less often (than weekly); (v)never.
LINGUISTIC ELITISM IN THE IRISH LABOUR MARKET 437
1 Kate Holmquist, “Language of educational apartheid”, Irish Times, 9 December 2009.2 Muireann Ní Mhóráin, “’Apartheid’ slur on Gaelscoileanna not based on facts”, Irish Times, 18Dcember 2008.3 Census Enquiries Section, Central Statistics Office, Swords, Co. Dublin, Ireland (www.cso.ie)and Centre for Census and Survey Research, University of Manchester (www.ccsr.ac.uk).
04 Borooah article_ESRI Vol 40 14/12/2009 17:39 Page 437

According to the answers to this set of questions, of the 197,862 persons inthe Irish sample, 82,858 (42 per cent) said they could speak Irish and,hereafter, are referred to as “Irish speakers”. 4 Of these 82,858 Irish speakers,26,919 (32 per cent of speakers) said they spoke it daily and, of these dailyspeakers, 22,810 (85 per cent of daily speakers) only spoke it within theeducational system with 4,109 (15 per cent of daily speakers) speaking itoutside the educational system; of the 55,939 Irish speakers who did not speakIrish on a daily basis, 20,622 never spoke it and 29,218 spoke it less often thanonce weekly.
Consequently, if one regards a “living language” as one which is used daily,in a non-institutional setting, then Irish is a living language for less than onein twenty of Irish speakers in Ireland and a living language for one in forty ofIreland’s population.5 On the face of it, therefore, an inability to speak Irishshould not be a significant barrier to living and working in Ireland in the waythat, say, an inability to speak Urdu might be in Pakistan. Nevertheless, theevidence is that, on several counts, Irish speakers are considerably better offthan those who cannot speak the language.
For Northern Ireland, SARS01 showed that of the 52,416 respondents, 90per cent had no knowledge of Irish while 10 per cent (5,181 respondents) hadsome knowledge of Irish in that they could do one or more of the following:reading/writing/speaking/understanding Irish; 94 per cent of those who hadsome knowledge of Irish were Catholic.6 The SARS01 questions relating tolanguage were much more detailed for Scotland and Wales, with separatequestions for ability to read, write, speak, and understand Gaelic and Welsh.Of the 163,071 Scottish respondents, only 1.1 and 1.5 per cent could,respectively, speak and understand Gaelic; however, of the 89,817 Welshrespondents, 20 and 23 per cent could, respectively, speak and understandWelsh. Given the small numbers of Gaelic speakers in Scotland, the remainderof the paper focuses on Irish speakers in Ireland and in Northern Ireland andon Welsh speakers in Wales.
Needless to say, the first problem in analysing “linguistic elitism” inIreland is to obtain a meaningful definition of an “Irish speaker”. The IrishCensus simply asked its respondents whether they spoke Irish and, if they did,the frequency with which they did so. The practice of the UK Census wassimply to ask its Scottish and Welsh respondents whether they spoke Gaelic
438 THE ECONOMIC AND SOCIAL REVIEW
4 If one restricted attention to persons (who regarded themselves) of Irish ethnicity, then ofthe173,703 persons, 80,591 (46 per cent) were Irish speakers implying that nearly one in ten ofthe non-Irish part of the population was an Irish speaker in (2,267 out of 24,159 persons).5 In terms of SARS06, respectively, 4,109 out of 82,858 and 4,109 out of 197,862.6 The Northern Ireland question did not explicitly ask whether respondents could speak Irish.
04 Borooah article_ESRI Vol 40 14/12/2009 17:39 Page 438

or Welsh and its Northern Ireland respondents whether they had “some”knowledge of Irish. This study has identified as “speakers” all those whoanswered these questions in the affirmative.
It goes without saying that this masks a multitude of difficulties. First,since Irish is on the curriculum of most Irish schools, some people who claimto speak Irish may simply be recalling the Irish they learned and the moreable may be recalling this with greater clarity. Consequently, positiveresponses to this question may measure ability rather than facility. Second,the frequency of speaking differed between speakers and one might inferfluency from frequency.7 In this paper we test for this effect by subdividingIrish speakers according to how often they spoke the language. But,ultimately, one is forced to take the answers at face value – if a person claimsto speak Irish (the claim being made in English to a question posed inEnglish!) then, in the absence of any evidence to the contrary, he must bepresumed to be an Irish speaker.
Table 1 compares the socio-economic “achievements” of speakers and non-speakers of indigenous languages in Ireland, Northern Ireland, and Wales. Interms of social class, 42 per cent of Irish speakers in Ireland, but only 27 per
LINGUISTIC ELITISM IN THE IRISH LABOUR MARKET 439
Table1: Characteristics of Speakers and Non-Speakers of Irish and Welsh, byCountry
Percentage with Relevant CharacteristicCharacteristic ↓ Ireland Northern Ireland Wales
Speakers Non- Speakers Non- Speakers Non-(Irish) speakers (Irish) speakers (Welsh) speakers
PMT occupations 42 27 36 23 27 25
Unemployed 3 6 8 7 6 6Permanently
sick or disabled 3 5 11 12 10 13Degree or
higher 25 14 27 14 23 16Primary or no
qualifications 9 22 25 44 27 34Owner-
occupiers 82 70 74 74 73 74Detached house 52 41 43 42 37 27
2 or more cars households 45 34 40 38 37 36
7 Though, even here, caution is needed: the first author speaks Hindi fluently (or so he fondlybelieves!) but prolonged residence outside India means that he rarely gets to speak it.
04 Borooah article_ESRI Vol 40 14/12/2009 17:39 Page 439

cent of Irish non-speakers, were in professional, managerial, and technicaloccupations and 12 per cent of Irish speakers in Ireland, but 19 per cent ofIrish non-speakers, were in semi-skilled or unskilled occupations. In terms ofeconomic status, 3 per cent of Irish speakers in Ireland, compared to 6 per centof Irish non-speakers, were unemployed and 2 per cent of Irish speakers inIreland, compared to 5 per cent of Irish non-speakers were unable to work dueto permanent illness or disability. In terms of the highest level of education, 25per cent of Irish speakers in Ireland, compared to 14 per cent of Irish non-speakers, had degree (or higher) level qualifications and just 9 per cent of Irishspeakers in Ireland, in contrast to 22 per cent of Irish non-speakers, had justprimary level (or no) qualifications.8
The results for occupational class and educational levels were notdissimilar for Northern Ireland: 36 per cent of those with some knowledge ofIrish were in PMT occupations compared to 23 per cent of those with noknowledge of Irish; 27 per cent of those with some knowledge of Irish had adegree and 25 per cent had primary or no qualifications, compared to 23 and44 per cent, respectively, of those with no knowledge of Irish. The differencesfor Wales were much less marked for occupational status – 27 per cent ofWelsh speakers, compared to 25 per cent of non-speakers, were in PMToccupations – but were much more significant for educational achievements –23 per cent of Welsh speakers had degrees and only 16 per cent had justprimary (or no) qualifications, compared to 16 and 34 per cent, respectively, ofnon-speakers.
However, as this paper will show, even after controlling for relevant labourmarket attributes, Irish speakers in Ireland did better in the labour marketcompared to Irish non-speakers. In other words, ceteris paribus there is a bias in Ireland’s labour market which favours Irish speakers over non-speakers.
440 THE ECONOMIC AND SOCIAL REVIEW
8 These advantages spilled over from the labour market into other areas. In terms of housingtenure, 82 per cent of Irish speakers, compared to 70 per cent of Irish non-speakers, were owner-occupiers; in terms of housing type, 52 per cent of Irish speakers, compared to 41 per cent of Irishnon-speakers, lived in a detached house and 13 per cent of Irish speakers, compared to 18 per centof Irish non-speakers, lived in a terraced house; lastly, in terms of heating, 91 per cent of Irishspeakers, compared to 86 per cent of Irish non-speakers, lived in houses which had centralheating.
In terms of car ownership, 45 per cent of Irish speaking persons, compared to 34 per cent of Irishnon-speaking households, lived in two-car households and, in terms of computer ownership andweb access, 73 and 25 per cent of Irish speakers, owned a computer and had access to broadband,respectively, in contrast to, respectively, 58 and 21 per cent of Irish non-speakers.
04 Borooah article_ESRI Vol 40 14/12/2009 17:39 Page 440

III LOGIT AND ORDERED LOGIT MODELS OF LABOUR MARKETOUTCOMES IN IRELAND
The first logit model was estimated over the subset of persons fromSARS06 who were presently in work for payment or profit; in this model, thedependent variable Yi was such that Yi=1, if a person (i=1…N) worked in aprofessional, managerial or technical (PMT) capacity, Yi=0, if he/she wasemployed in another (non-PMT) capacity.9 The second logit model wasestimated over the subset of persons from SARS06 who were presently in thelabour force; in this model, the dependent variable Yi was such that Yi=1, if aperson (i=1…N) was working, Yi=0, if he/she was unemployed.
Both models were estimated on a vector of variables, Xij being the value ofthe jth variable for the ith person (j=1…J).10 A natural question to ask from thelogistic model is how the probability of a particular labour market outcomewould change in response to a change in the value of one of the variables.These probabilities are termed marginal probabilities.
For discrete variables, the marginal probabilities refer to changes in theoutcome probabilities consequent upon a move from the residual category forthat variable to the category in question, the values of the other variablesremaining unchanged. For continuous variables, the marginal probabilitiesrefer to changes in the outcome probabilities consequent upon a unit change inthe value of the variable, the values of the other variables remainingunchanged.
Table 2 shows the marginal probabilities for the “in work” equation andTable 2 shows the marginal probabilities for the “in labour force” equation. Theassociated z-values are shown alongside the marginal probabilities: a z valueexceeding 1.96 indicates that the coefficient was significantly different fromzero at a 5 per cent significance level. Table 2 shows that ceteris paribus thelikelihood of a female worker being in a PMT job was 10.1 percentage pointslower compared to the corresponding likelihood for a male worker while thelikelihood of an Irish speaking worker being in a PMT job was 6.7 points highercompared to the corresponding likelihood for a worker who did not speak Irish.
Relative to Dublin, the probability of working in a PMT job was lower inall the other regions of Ireland and was smallest in the Border and Westernregions (ceteris paribus 11.1 and 9.2 points, respectively, lower than Dublin).Compared to a non-Catholic worker, the likelihood of a Catholic worker beingin a PMT job was 8.1 points lower and, compared to persons whose ethnicity
LINGUISTIC ELITISM IN THE IRISH LABOUR MARKET 441
9 Non-manual, skilled manual, semi-skilled, unskilled, other.
10 The logit equation is for J coefficients, βj and for observationson J variables.
04 Borooah article_ESRI Vol 40 14/12/2009 17:39 Page 441

442 THE ECONOMIC AND SOCIAL REVIEW
Table 2: Marginal Probabilities from Logit Model for Persons Currently inWork Being Professional, Managerial or Technical Workers
Marginal SampleProbability z-value Average
SexFemale –0.101 –20.81 0.423Age Bands (Residual: 60+)Age: 20-29 –0.198 –20.06 0.258Age: 30-39 –0.094 –9.13 0.287Age: 40-49 –0.085 –8.35 0.239Age: 50-59 –0.056 –5.33 0.159Region (Residual: Dublin)Border –0.111 –14.86 0.108Mideast –0.041 –5.62 0.120Midland –0.062 –6.37 0.056Midwest –0.069 –8.25 0.083Southeast –0.077 –9.85 0.105Southwest –0.083 –12.20 0.143West –0.092 –11.76 0.097Religion (Residual: non-Catholic)Catholic –0.081 –10.50 0.881Area (Residual: Rural)Urban 0.008 1.45 0.608EthnicityIrish 0.073 3.79 0.885Industry of Work (Residual: Agriculture)Manufacturing –0.153 –17.07 0.164Construction and Transport –0.291 –41.41 0.192Commerce –0.050 –4.99 0.325Public Administration and Defence –0.192 –21.93 0.062Professional Services 0.080 6.93 0.203Highest Level of Education
(Residual: Primary or below)Third-level: degree and non-degree 0.596 76.33 0.425Secondary-level: lower and upper 0.183 17.73 0.499Never MarriedMarital Status (Residual: Widowed) 0.012 0.57 0.402Married 0.064 3.26 0.534Separated or Divorced –0.019 –0.90 0.051NationalityIrish 0.097 5.19 0.885Country of BirthIreland –0.042 –4.38 0.827Irish speaker 0.067 13.77 0.412
Dependent variable is 1 if the person was a professional, managerial, or technicalworker, 0 otherwise.Number of observations: 68,106; Pseudo R2 = 0.250.
04 Borooah article_ESRI Vol 40 14/12/2009 17:39 Page 442

was not Irish, the likelihood of workers of Irish ethnicity being in PMT jobswas 7.3 points higher. Workers who were Irish nationals were more likely (by9.7 points) to be in PMT jobs compared to non-nationals but workers born inIreland were less likely by 4.2 points, relative to foreign-born workers, to be inPMT jobs.
Relative to working in agriculture, the likelihood of working in PMT jobswas smaller in all the other industrial sectors (except professional services);this likelihood was smallest in construction and transport and in publicadministration and defence (ceteris paribus 29.1 and 19.2 points, respectively,lower than agriculture). As expected, the level of education had a large effecton the probability of working in a PMT job: compared to having a primaryeducation, the likelihoods of workers with third level education and of workerswith secondary education, being in PMT jobs were, respectively, 59.6 pointsand 18.3 points higher.
The marginal probabilities from the “labour force” equation (Table 3) echomany of the findings of the “in work” equation: the likelihood of Irish speakersbeing in work was 10 points higher than for non-speakers; relative to living inDublin, the likelihood of being in work was lower in many of the regions;Catholics in the labour force were more likely to be unemployed compared tonon-Catholics; relative to those in agriculture, people in manufacturing,construction and transport, commerce, and professional services were morelikely to be unemployed; persons with a degree or with secondary educationalqualifications were more likely to be in work compared to persons withprimary educational (or no) qualifications. Some differences between the “inwork” and “in labour force” equations were that the significant gender,nationality, and country of birth effects from the former set of estimates (Table2) were not reproduced in the latter set (Table 3).
In order to guard against the possibility that the claim to be an Irishspeaker covered a wide range of abilities, from the fluent to the barelyarticulate, we divided the category of Irish speakers into the following sub-categories: those who spoke Irish at least weekly and those who spoke it lessfrequently (including never!). When the equation shown in Table 2 was re-estimated with these two categories of Irish speakers, the marginalprobability of being in a PMT job was higher for frequent speakers of Irish thanfor non-frequent speakers (0.12 against 0.06); both marginal probabilitieswere significantly different from zero with z-values of 12.0. When, however,the labour force equation (Table 3) was similarly re-estimated, only themarginal probability associated with less frequent speakers of Irish wassignificantly different from zero (and positive). 11
LINGUISTIC ELITISM IN THE IRISH LABOUR MARKET 443
11 For reasons of economy, these results are not detailed in the paper; they may, however, beobtained on request from the corresponding author.
04 Borooah article_ESRI Vol 40 14/12/2009 17:39 Page 443
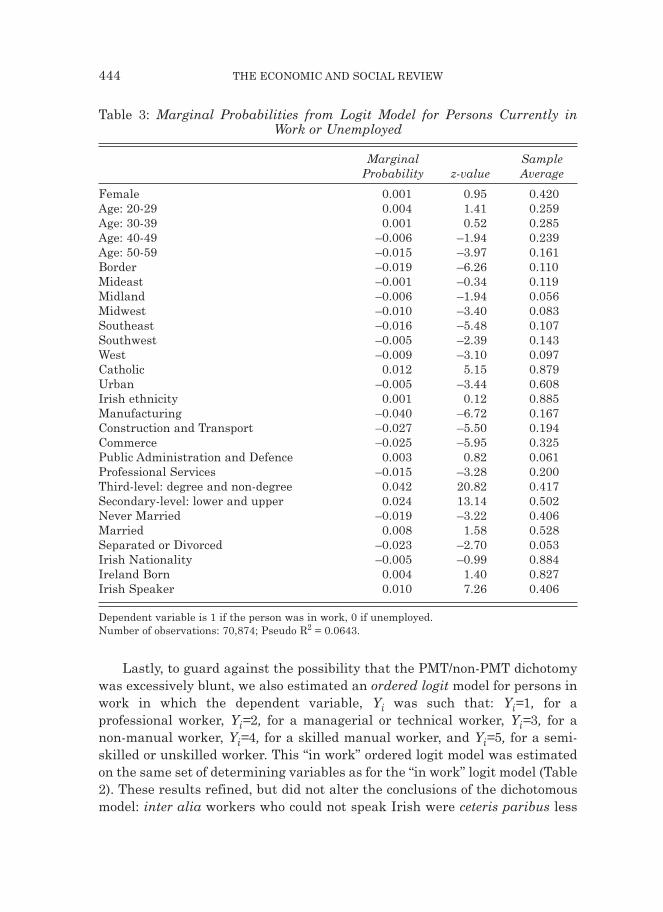
Lastly, to guard against the possibility that the PMT/non-PMT dichotomywas excessively blunt, we also estimated an ordered logit model for persons inwork in which the dependent variable, Yi was such that: Yi=1, for aprofessional worker, Yi=2, for a managerial or technical worker, Yi=3, for anon-manual worker, Yi=4, for a skilled manual worker, and Yi=5, for a semi-skilled or unskilled worker. This “in work” ordered logit model was estimatedon the same set of determining variables as for the “in work” logit model (Table2). These results refined, but did not alter the conclusions of the dichotomousmodel: inter alia workers who could not speak Irish were ceteris paribus less
444 THE ECONOMIC AND SOCIAL REVIEW
Table 3: Marginal Probabilities from Logit Model for Persons Currently inWork or Unemployed
Marginal SampleProbability z-value Average
Female 0.001 0.95 0.420Age: 20-29 0.004 1.41 0.259Age: 30-39 0.001 0.52 0.285Age: 40-49 –0.006 –1.94 0.239Age: 50-59 –0.015 –3.97 0.161Border –0.019 –6.26 0.110Mideast –0.001 –0.34 0.119Midland –0.006 –1.94 0.056Midwest –0.010 –3.40 0.083Southeast –0.016 –5.48 0.107Southwest –0.005 –2.39 0.143West –0.009 –3.10 0.097Catholic 0.012 5.15 0.879Urban –0.005 –3.44 0.608Irish ethnicity 0.001 0.12 0.885Manufacturing –0.040 –6.72 0.167Construction and Transport –0.027 –5.50 0.194Commerce –0.025 –5.95 0.325Public Administration and Defence 0.003 0.82 0.061Professional Services –0.015 –3.28 0.200Third-level: degree and non-degree 0.042 20.82 0.417Secondary-level: lower and upper 0.024 13.14 0.502Never Married –0.019 –3.22 0.406Married 0.008 1.58 0.528Separated or Divorced –0.023 –2.70 0.053Irish Nationality –0.005 –0.99 0.884Ireland Born 0.004 1.40 0.827Irish Speaker 0.010 7.26 0.406
Dependent variable is 1 if the person was in work, 0 if unemployed.Number of observations: 70,874; Pseudo R2 = 0.0643.
04 Borooah article_ESRI Vol 40 14/12/2009 17:39 Page 444

likely to be in professional jobs or in managerial/technical jobs and were morelikely to be at the non-manual and manual end of the class spectrum.12
IV THE ADVANTAGE OF BEING AN IRISH SPEAKER
The econometric results reported in the previous section clearly point tothe advantage that Irish speakers have over non-speakers in Ireland’s labourmarket: even after controlling for a number of attributes, the likelihood of anIrish speaking worker being in the upper echelons of social class weresignificantly higher, and the likelihood of an Irish speaker in the labour forcebeing unemployed were considerably lower, compared to the relevantprobabilities for non-speakers. The question is from where does this advantagederive?
One possibility is the quality of education. The Irish language movementhas attracted a small but strong wave of strong urban middle/professionalclass support in recent decades, especially since the 1970s. Up until then, thelanguage existed mainly within a small number of Irish language areas whichwere confined to poor, rural parts of the west coast, with a small core ofeducated urban activists, many of them connected in one way or another witheducation or the public sector. However, a major focus of the urban movementhas been a push for schools that operate through the Irish language.
That this push has been highly successful is evidenced by the fact that in1972, outside the Irish-speaking areas, there were 11 such schools at primarylevel and five at secondary level. Today there are 138 at primary level13 and 53at secondary level.14
These schools have developed good academic reputations. They attractgood teachers and a leadership core of committed parents and that attracts awider circle of families that are drawn by good examination performance. Theresult is a system of positive social selection into Irish language schools whichfeeds through into occupational attainment.15
LINGUISTIC ELITISM IN THE IRISH LABOUR MARKET 445
12 In an ordered logit model, a person’s classification in terms of his/her social class depends uponwhether the value of an unobservable latent variable crosses a threshold such that theprobabilities of a person being in a particular class are:
If it is assumed that the error term follows a logistic distribution then an ordered logit modelresults. Detailed results available on request from the authors.13 http://www.schooldays.ie/primary-schools-in-ireland/primary-gaelscoil14 http://www.schooldays.ie/secondary-schools-in-ireland/Gaelscoil15 The results can be seen among students at University College Dublin: the Cumann Gaelach(Irish language society) is one of the strongest student societies (over 1,000 members last year)and its board is dominated by students from the high-achieving areas of study (law, medicine,architecture, etc.).
04 Borooah article_ESRI Vol 40 14/12/2009 17:39 Page 445

Our analysis of “feeder” schools in Ireland (that is, schools supplyingstudents to third level educational institutions) shows that 53 schools, of atotal of 707 feeder schools sent all their students to third level institutions (7 per cent), compared to the 10 of the 46 Gaelscoils (22 per cent) who also didthe same.
An illustration of the quality of Irish-language schools is provided by anindependent report, commissioned by a Gaelscoil in Kerry, analysing itspupils’ scores in English reading ability in MICRA-T tests. This reportconcluded that the classes which had been previously assessed by schoolinspectors in 2006, and had been criticised for poor English language skills,had, in fact, above-average reading skills (60 per cent scored in the top levelfor reading compared to a 40 per cent national average) 18 months after theinspection. According to the school board’s chairman the original inspector’sreport failed to take account of how rapidly children improve their skills froma low base when knowledge of one language (Irish) reinforces learning anotherlanguage (English). (Irish Examiner, 7 May, 2008).16
Occupational attainment may also be influenced by the subjects studied bythose with third level education. Table 4 shows that of people currently inwork, 10 per cent of Irish speakers (regardless of sex) and 10 per cent ofwomen (regardless of whether they could speak Irish) obtained their third-level education in Education, in contrast to 3 per cent of non-speakers and 3 per cent of men. On the other hand, 17 per cent of non-speakers, and 26 percent of men, had third level education in Engineering, Manufacturing, andConstruction, in contrast to 12 per cent of Irish speakers and 3 per cent ofwomen. The popularity of Social Science/Business/Law was roughly equalacross the groups: in each group, about 22 per cent of workers with third leveleducation had this as their subject area.
Of Irish speaking workers 69 per cent, compared to 63 per cent of workerswere not Irish speakers, had third level education and had qualifications atdegree level or higher; compared to 67 per cent of male workers, 66 per cent offemale workers who had third level education had qualifications at degreelevel or higher.
Different subject groups had a different proportionate presence in the twosocial classes: PMT and non-PMT. Table 5 shows that 85 per cent of workerswith third level education in Education, and 92 per cent of workers with thirdlevel education in Health, had PMT jobs; in contrast, 56 per cent of workerswith third level education in Agriculture and Veterinary Science, and 48 percent of workers with third level education in Social Services, had PMT jobs.
446 THE ECONOMIC AND SOCIAL REVIEW
16 Ní Ríordáin and O’Donoghue (2008) suggest that a bilingual proficiency in English and Irishcan enhance mathematical performance.
04 Borooah article_ESRI Vol 40 14/12/2009 17:39 Page 446

LINGUISTIC ELITISM IN THE IRISH LABOUR MARKET 447
Table 4: Workers with Third Level Qualifications by Main Subject Area of Qualification
Irish Irish Men WomenNon-speakers Speakers
11,430 13,411 12,149 12,790
Education 3.0 10.4 3.3 10.4Humanities and Art 8.0 8.5 6.3 10.1Social Science/Business/Law 23.4 22.6 22.7 23.2Life Sciences/Physical Sciences/
Mathematics/Statistics 5.3 5.7 5.7 5.4Computing 8.1 5.8 8.7 5.1Engineering, Manufacturing,
Construction 16.9 11.7 25.9 2.7Agriculture and Veterinary 3.2 2.7 5.0 1.0Health 12.8 11.4 5.0 18.7Social Services 3.2 2.7 0.8 5Services 5.5 3.7 4.8 4.3Multiple Subjects 10.6 14.8 11.7 14.0Total 100 100 100 100Third level with degree 63 69 67 66
Table 5: Social Class of Workers with Third Level Qualifications, By Subject of Qualification
Professional, Non-Manual,Managerial, Skilled Manual, Semi-
Technical Skilled and Unskilled
Education 85.2 14.9Humanities and Art 63.6 36.4Social Science/Business/Law 67.4 32.6Life Sciences/Physical Sciences/
Mathematics/Statistics 77.9 22.1Computing 61.3 38.7Engineering, Manufacturing, Construction 64.1 35.9Agriculture and Veterinary 55.9 44.1Health 91.6 8.4Social Services 47.8 52.2Services 37.4 62.6Multiple Subjects 76.9 23.2Total 17,427 7,512Third Level with degree 77 23
04 Borooah article_ESRI Vol 40 14/12/2009 17:39 Page 447
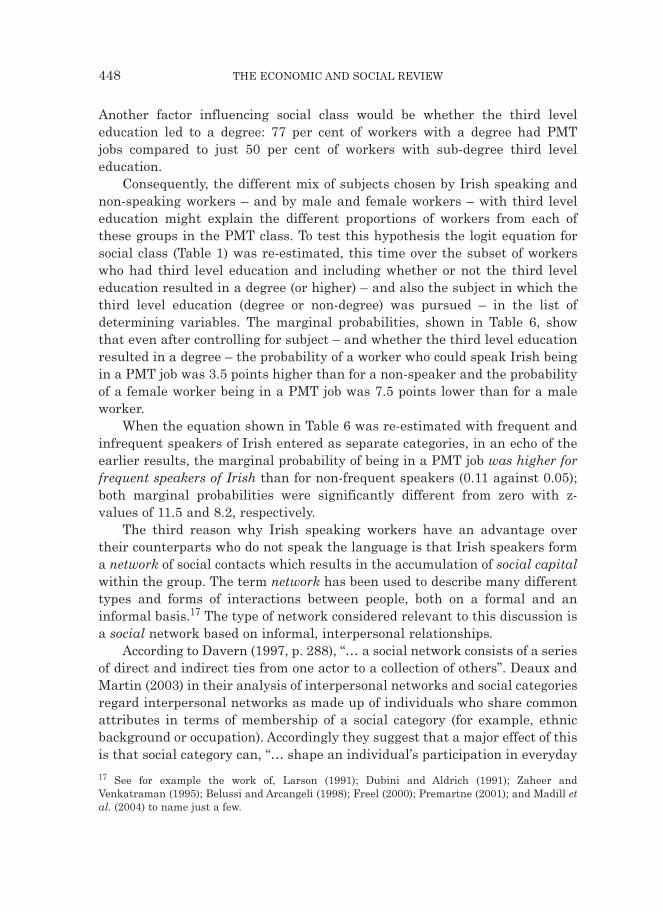
Another factor influencing social class would be whether the third leveleducation led to a degree: 77 per cent of workers with a degree had PMT jobs compared to just 50 per cent of workers with sub-degree third leveleducation.
Consequently, the different mix of subjects chosen by Irish speaking andnon-speaking workers – and by male and female workers – with third leveleducation might explain the different proportions of workers from each ofthese groups in the PMT class. To test this hypothesis the logit equation forsocial class (Table 1) was re-estimated, this time over the subset of workerswho had third level education and including whether or not the third leveleducation resulted in a degree (or higher) – and also the subject in which thethird level education (degree or non-degree) was pursued – in the list ofdetermining variables. The marginal probabilities, shown in Table 6, showthat even after controlling for subject – and whether the third level educationresulted in a degree – the probability of a worker who could speak Irish beingin a PMT job was 3.5 points higher than for a non-speaker and the probabilityof a female worker being in a PMT job was 7.5 points lower than for a maleworker.
When the equation shown in Table 6 was re-estimated with frequent andinfrequent speakers of Irish entered as separate categories, in an echo of theearlier results, the marginal probability of being in a PMT job was higher forfrequent speakers of Irish than for non-frequent speakers (0.11 against 0.05);both marginal probabilities were significantly different from zero with z-values of 11.5 and 8.2, respectively.
The third reason why Irish speaking workers have an advantage overtheir counterparts who do not speak the language is that Irish speakers forma network of social contacts which results in the accumulation of social capitalwithin the group. The term network has been used to describe many differenttypes and forms of interactions between people, both on a formal and aninformal basis.17 The type of network considered relevant to this discussion isa social network based on informal, interpersonal relationships.
According to Davern (1997, p. 288), “… a social network consists of a seriesof direct and indirect ties from one actor to a collection of others”. Deaux andMartin (2003) in their analysis of interpersonal networks and social categoriesregard interpersonal networks as made up of individuals who share commonattributes in terms of membership of a social category (for example, ethnicbackground or occupation). Accordingly they suggest that a major effect of thisis that social category can, “… shape an individual’s participation in everyday
448 THE ECONOMIC AND SOCIAL REVIEW
17 See for example the work of, Larson (1991); Dubini and Aldrich (1991); Zaheer andVenkatraman (1995); Belussi and Arcangeli (1998); Freel (2000); Premartne (2001); and Madill etal. (2004) to name just a few.
04 Borooah article_ESRI Vol 40 14/12/2009 17:39 Page 448

LINGUISTIC ELITISM IN THE IRISH LABOUR MARKET 449
Table 6: Marginal Probabilities from Logit Model for Persons with Third LevelQualifications, Currently in Work Being Professional, Managerial or
Technical Workers
Marginal SampleProbability z-value Average
Female –0.075 –11.94 0.521Age: 20-29 –0.221 –9.16 0.308Age:30-39 –0.092 –4.15 0.347Age: 40-49 –0.069 –3.01 0.202Age: 50-59 –0.034 –1.44 0.114Border –0.098 –7.42 0.089Mideast –0.038 –3.67 0.119Midland –0.069 –4.16 0.044Midwest –0.064 –4.85 0.076Southeast –0.065 –5.05 0.086Southwest –0.079 –7.61 0.142West –0.094 –7.26 0.089Catholic –0.045 –5.57 0.841Urban 0.000 –0.04 0.680Irish Ethnicity 0.102 3.73 0.867Manufacturing 0.073 4.18 0.140Construction and Transport –0.065 –2.82 0.094Commerce 0.113 6.25 0.360Public Administration and Defence –0.045 –1.92 0.067Professional Services 0.243 15.85 0.318Never Married 0.058 1.76 0.459Married 0.109 3.32 0.493Separated or Divorced 0.019 0.56 0.040Irish Nationality 0.138 4.89 0.870Ireland Born –0.029 –2.54 0.798Irish Speaker 0.035 5.39 0.537Third level with degree or higher 0.263 38.74 0.662Subject of Third level qualification(Residual: Multiple Subjects)Education 0.118 10.09 0.058Humanities –0.036 –2.98 0.069Social Science/Business/Law 0.047 6.27 0.191Life Sciences and Computing 0.094 11.47 0.098Engineering, Manufacturing, Construction 0.114 15.05 0.107Agriculture, Veterinary Science 0.040 2.27 0.022Health 0.228 34.67 0.097Social Services –0.100 –4.47 0.020
Workers with Third level educational qualifications only.Dependent variable is 1 if the person was a professional, managerial, or technical worker, 0otherwise.Number of observations: 28,913; Pseudo R2 = 0.188.
04 Borooah article_ESRI Vol 40 14/12/2009 17:39 Page 449

networks by creating opportunities to form relationships with similar others”(Deaux and Martin, 2003 p. 106). Deaux and Martin (2003) highlight theinterpersonal networks that Polish immigrants developed when they relocatedto the United States: they set up workmen’s groups, that were first located inboarding houses, with Polish immigrants being preferred to non-Polish immi -grants, relatives being preferred to non-family members, and people from thesame region in Poland being preferred over people from other Polish regions.
Lewer and Van den Berg (2007) show that the sharing of religious ideasand culture across countries (Buddhists, Confucians, Hindus, EasternOrthodox, Catholics, or Protestants) creates network effects that improveintra-group trade. Both of these examples indicate that common attributesbetween individuals can lead to the creation of a social network. From an Irishperspective, such attributes may include the Irish language (Gaeilge) and Irishculture (e.g. Irish sports such as hurling and Gaelic football). These linguistic,cultural, and sporting bonds are instrumental in creating social (interpersonalor informal) networks, whereby individuals who are bound by these tiesaccumulate trust and social capital.
Ties between individuals within a social network can accrue benefits tothose involved. One such example is in the job market. Davern (1997, 1999)highlights the advantages of social network involvement in the job market forboth individuals in search of work, and employers looking to fill a vacancy:social network ties can be used as a source of informal job search in terms of,for example, job referrals, getting “inside” information or possibly beingemployed directly by a friend.
Davern and Hachen (2006) emphasised the work of Granovetter (1973) forhis research on the role social networks play in the job mobility process.Granovetter (1973) proposed that the strength of interpersonal ties within anetwork influences the flow of information. He showed that the majority of hisrespondents found jobs through “informal” means, such as friends or family.He found that these ties served as bridges between networks, which allowedindividuals to link with others who were not already part of their network(Davern and Hachen, 2006). It was through these social networks thatindividuals, who were connected in some way (for example via ethnicbackground, gender, culture), interacted with each other.
VII THE DECOMPOSITION OF SOCIAL CLASS ADVANTAGE
In the logistic model reported in Table 2, the “Irish speaker” effectsoperated entirely through the intercept term with the slope coefficients beingunaffected by whether the person was an Irish speaker (the implication being
450 THE ECONOMIC AND SOCIAL REVIEW
04 Borooah article_ESRI Vol 40 14/12/2009 17:39 Page 450

that the marginal probabilities associated with the variables – say, third leveleducation – was the same for Irish speakers and non-speakers). Thisassumption can be relaxed by estimating the equation specified in Table 1separately for: workers who were Irish speakers and non-speakers. Themarginal probabilities from these models are shown in Table 7.
LINGUISTIC ELITISM IN THE IRISH LABOUR MARKET 451
Table 7: Marginal Probabilities from Logit Model for Irish Speakers and non-Speakers Currently in Work Being Professional, Managerial or Technical
Workers
Irish Speakers: 28,062 Irish Non-Speakers: 40,044Marg. z- Sample Marg. z- SampleProb. value Average Prob. value Average
Female –0.114 –14.20 0.502 –0.085 –15.22 0.368Age: 20-29 –0.219 –12.02 0.282 –0.170 –15.97 0.242Age:30-39 –0.113 –6.29 0.274 –0.074 –6.36 0.297Age: 40-49 –0.086 –4.81 0.224 –0.075 –6.61 0.250Age: 50-59 –0.051 –2.81 0.166 –0.053 –4.59 0.154Border –0.129 –9.28 0.099 –0.095 –11.86 0.115Mideast –0.056 –4.29 0.111 –0.033 –3.98 0.126Midland –0.082 –4.80 0.056 –0.049 –4.48 0.057Midwest –0.089 –6.34 0.096 –0.053 –5.41 0.073Southeast –0.081 –5.79 0.103 –0.071 –8.30 0.107Southwest –0.097 –8.31 0.162 –0.070 –9.04 0.130West –0.117 –8.71 0.111 –0.072 –7.93 0.087Catholic –0.015 –0.98 0.936 –0.096 –11.40 0.842
Urban 0.029 3.30 0.582 –0.006 –0.97 0.626
Irish Ethnicity 0.030 0.50 0.993 0.076 4.19 0.810Manufacturing –0.135 –7.41 0.140 –0.143 –15.68 0.180
Construction and Transport –0.294 –19.09 0.148 –0.264 –36.48 0.223
Commerce –0.034 –1.87 0.317 –0.049 –4.43 0.331Public Administration
and Defence –0.218 –12.22 0.082 –0.150 –15.68 0.049Professional Services 0.149 8.10 0.267 0.031 2.35 0.158
Third-level: degree and non-degree 0.601 39.08 0.553 0.582 59.84 0.334
Secondary-level: lower and upper 0.179 7.77 0.414 0.161 15.90 0.558
Never Married –0.001 –0.04 0.420 0.018 0.74 0.390Married 0.053 1.65 0.523 0.065 2.83 0.541Separated or Divorced –0.045 –1.24 0.043 –0.003 –0.13 0.057Irish Nationality 0.153 2.95 0.992 0.078 4.41 0.810Ireland Born –0.039 –2.20 0.949 –0.042 –4.10 0.742
An italicised, bold font indicates that the marginal probabilities were significantly differentbetween Irish speakers and non-speakers at 10 per cent or less.An italicised no-bold font indicates that the marginal probabilities were significantly differentbetween Irish speakers and non-speakers at 20 per cent or less.
04 Borooah article_ESRI Vol 40 14/12/2009 17:39 Page 451

According to Table 7, compared to an Irish speaking male (currently inwork), an Irish speaking female (currently in work) was 11.4 points less likelyto be in a PMT job while, compared to an Irish non-speaking male (currentlyin work), an Irish non-speaking female (currently in work) was 8.5 points lesslikely to be in a PMT job. So, while discrimination against women workers isa pervasive feature of the Irish jobs market, it would appear to be morepernicious among Irish speakers than among non-speakers.
An italicised, bold font in Table 7 indicates that the marginal probabilitieswere significantly different between the relevant groups at 10 per cent or less– while an italicised no-bold font indicates that the marginal probabilitieswere significantly different between the two groups at 20 per cent or less –level of significance. So, for example, in Table 7, an Irish speaking workerliving in the West of Ireland was 11.7 points less likely to be in a PMT job,compared to an Irish speaking worker in Dublin, while, compared to an Irishnon-speaking worker in Dublin, an Irish non-speaking worker living in theWest of Ireland was 7.2 points less likely to be in a PMT job; the italicised no-bold font indicates that these two marginal probabilities were significantlydifferent at a 20 per cent or less level of significance.
The Oaxaca (1973) method of decomposing differences between groups, intheir respective mean values, into “discrimination” and “characteristics”components is, arguably, the most widely used decomposition technique ineconomics. This method has been extended from its original setting withinregression analysis, to explaining group differences in probabilities derivedfrom models of discrete choice with a binary dependent variable and estimatedusing logit/probit methods (Nielsen, 1998).
The Oaxaca decomposition (and its extension) is formulated for situationsin which the sample is subdivided into two mutually exclusive and (collectivelyexhaustive) groups, such as, for example, men and women. Then, one maydecompose the difference in, for example, average wages between men andwomen – or the difference between male and female (or Irish speaking andnon-speaking) workers in their average probabilities of being in PMT jobs –into two parts: the first due to inter-group differences in the coefficient vectorsand the second due to inter-group differences in the attribute vectors.
The attribute contribution is computed by asking what the averagemale/female (Irish speaker/non-speaker) difference in probabilities wouldhave been if the difference in attributes between them had been evaluatedusing a common coefficient vector. Typically, two separate computations of theattribute contribution are provided using, in turn, the coefficient vectors of thetwo groups as the common vector. It is important to note that the two sets ofcomputations will, generally, yield different answers.
Column 1 of Table 8 shows the observed difference between Irish speakingand non-speaking workers in their proportions in PMT jobs: 0.502 – 0.333 =
452 THE ECONOMIC AND SOCIAL REVIEW
04 Borooah article_ESRI Vol 40 14/12/2009 17:39 Page 452

LINGUISTIC ELITISM IN THE IRISH LABOUR MARKET 453
Table 8: The Decomposition of the Proportion of Workers in Professional, Managerial, and Technical Occupations by Ability to Speak Irish
Sample Irish Non-Speaker Attributes Irish Speaker Attributes EvaluatedAverage Evaluated at Irish Speaker at Irish Non-Speaker Coefficients
Coefficients
FIS – FNS Attributes Residual Attributes ResidualDifference* Difference**
0.502 – 0.333 0.502-0.374 0.374- 0.333 0.448-0.333 0.502-0.448= 0.169 = 0.128 =0.041 = 0.115 = 0.054
FIS and FNS are the proportions of workers who are, respectively, Irish speakers and non-speakersin professional, managerial, or technical jobs.*Attributes difference: holding coefficients constant at Irish speaker values, this differencerepresents the inter-group difference in proportions due to differences between Irish speakers andnon-speakers in their attributes.** Attributes difference: holding coefficients constant at Irish non-speaker values, this differencerepresents the inter-group difference in proportions due to differences between Irish speakers andnon-speakers in their attributes.
Table 9: The Decomposition of the Proportion of Workers, with Third LevelQualifications, in Professional, Managerial, and Technical Occupations by
Ability to Speak Irish
Sample Irish Non-Speaker Attributes Irish Speaker Attributes EvaluatedAverage Evaluated at Irish Speaker at Irish Non-Speaker Coefficients
Coefficients
FIS – FNS Attributes Residual Attributes ResidualDifference* Difference**
0.720 – 0.633 0.720-0.668 0.668-0.633 0.681-0.633 0.720-0.681 = 0.087 = 0.052 =0.035 = 0.048 = 0.039
FIS and FNS are the proportions of workers with third level qualifications who are, respectively,Irish speakers and non-speakers in professional, managerial, or technical jobs.*Attributes difference: holding coefficients constant at Irish speaker values, this differencerepresents the inter-group difference in proportions due to differences between Irish speakers andnon-speakers in their attributes.** Attributes difference: holding coefficients constant at Irish non-speaker values, this differencerepresents the inter-group difference in proportions due to differences between Irish speakers andnon-speakers in their attributes.
0.169. Column 2 of Table 9 shows the amount of the overall gap that is due tothe attributes effect when speaker and non-speaker attributes are bothevaluated using speaker coefficients; similarly, column 4 of Table 8 shows theamount of the overall gap that is due to the attributes effect when speaker andnon-speaker attributes are both evaluated using non-speaker coefficients. Twopoints should be noted:
04 Borooah article_ESRI Vol 40 14/12/2009 17:39 Page 453

1. When non-speaker attributes are evaluated at speaker coefficients, theproportion of non-speaker workers in PMT jobs is predicted to rise fromthe observed value of 0.333 to 0.374: this is because non-speaker attributesare being evaluated using more favourable coefficients (i.e. those ofspeakers). Consequently, of the observed gap of 0.169 points, 0.128 (or 76per cent) can be explained by differences in attributes between workerswho are Irish speakers and non-speakers. The “unexplained” residual of 24per cent could be ascribed to some “structural advantage” that Irishspeakers possess over non-speakers.
2. When speaker attributes are evaluated at non-speaker coefficients, theproportion of Irish speaking workers in PMT jobs is predicted to fall fromthe observed value of 0.502 to 0.448: this is because speaker attributes arebeing evaluated using less favourable coefficients (i.e. those of non-speakers). Consequently, of the observed gap of 0.169 points, 0.115 (or 68per cent) can be explained by differences in attributes between workerswho are Irish speakers and non-speakers. The “unexplained” residual of 32per cent could be ascribed to some “structural advantage” that Irishspeakers possess over non-speakers.
Would the above conclusions have changed if the subject areas in whichthird-level education had been obtained were taken into account? In order toanswer this question the model shown in Table 6 – estimated over the subsetof workers with third level education – was now estimated separately for Irishspeakers and non-speakers.18 These results were then used to reprise thedecompositions, discussed above, and these are shown in Table 10 (Irishspeaking/non-speaking workers).
Under this revaluation, the observed difference between Irish speakingand non-speaking workers, with third level education, in PMT jobs is 0.087points, a reduction from the corresponding difference of 0.169 points of Table8 when all workers (regardless of educational attainment) were considered.However, when attention was restricted to workers with third level education,58 and 55 per cent of the observed gap was due to attribute differencesbetween the two groups of workers when, respectively, non-speaker attributeswere evaluated using speaker coefficients and speaker attributes wereevaluated using non-speaker coefficients. So, the structural advantage of Irishspeaking, over non-speaking, workers increased from 24-32 per cent, when allworkers were analysed, to 55-58 per cent when only workers with third leveleducation were considered.
454 THE ECONOMIC AND SOCIAL REVIEW
18 For reasons of economy these results are not shown and may be obtained on request from thecorresponding author.
04 Borooah article_ESRI Vol 40 14/12/2009 17:39 Page 454
The problem with the O-B method of decomposition is that thedecomposition is anchored either by treating non-speakers as speakers(column 2, Tables 8 and 9) or speakers as non-speakers (column 4, Tables 8and 9). More recently, Borooah and Iyer (2005) have proposed a method ofdecomposition which combines both “anchors” into a single decompositionformula. Denote, by P
–IS and P–NS, the average probabilities of being in PMT
jobs, computed over all the workers in the sample, when their individual
LINGUISTIC ELITISM IN THE IRISH LABOUR MARKET 455
Table 10: Marginal Probabilities from Logit Model of Persons Currently inWork Being Professional, Managerial, or Technical Workers: Northern Ireland
and Wales
Northern Ireland WalesMarginal z-value Marginal z-value
Probability Probability
SexFemale –0.111 –13.45 –0.154 –22.69Age Bands (Residual 55+)Age: 19-29 –0.166 –13.17 –0.114 –9.90Age: 30-44 –0.050 –4.07 –0.009 –0.89Age: 45-54 –0.002 –0.11 0.020 1.84Religion (NI only)Catholic –0.013 –1.53Highest Education level
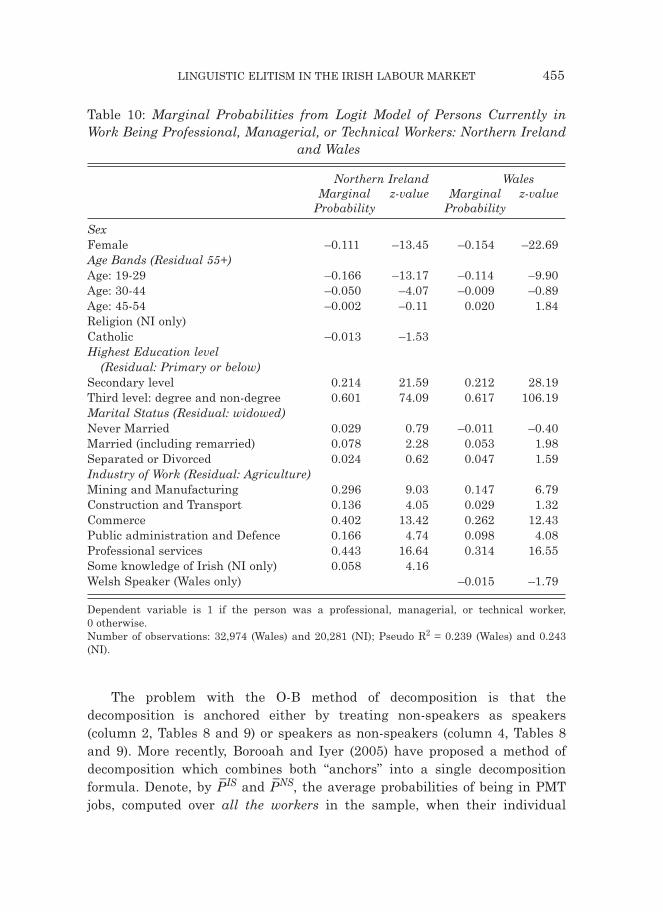
(Residual: Primary or below)Secondary level 0.214 21.59 0.212 28.19Third level: degree and non-degree 0.601 74.09 0.617 106.19Marital Status (Residual: widowed)Never Married 0.029 0.79 –0.011 –0.40Married (including remarried) 0.078 2.28 0.053 1.98Separated or Divorced 0.024 0.62 0.047 1.59Industry of Work (Residual: Agriculture)Mining and Manufacturing 0.296 9.03 0.147 6.79Construction and Transport 0.136 4.05 0.029 1.32Commerce 0.402 13.42 0.262 12.43Public administration and Defence 0.166 4.74 0.098 4.08Professional services 0.443 16.64 0.314 16.55Some knowledge of Irish (NI only) 0.058 4.16Welsh Speaker (Wales only) –0.015 –1.79
Dependent variable is 1 if the person was a professional, managerial, or technical worker, 0 otherwise.Number of observations: 32,974 (Wales) and 20,281 (NI); Pseudo R2 = 0.239 (Wales) and 0.243(NI).
04 Borooah article_ESRI Vol 40 14/12/2009 17:39 Page 455

attribute vectors (the Xik) are all evaluated using the coefficient vectors of,
respectively speakers (βIS) and men (βNS); in other words, P–IS and P
–NS are theaverage probabilities of being in PMT jobs, computed over the entire sample,when all the persons in the sample are treated as, respectively, Irish speakersand non-speakers. The difference between the probabilities, P
–IS – P–NS,
represents the “response effect” because it is entirely the consequence ofdifferences between speakers and non-speakers in their (coefficient) responsesto a given vector of attributes.
Borooah and Iyer (2005) have shown that these synthetic probabilities canbe used to resolve the ambiguity of the O-B formulation since: FIS – FNS =P–IS – P
–NS) + the weighted average of the two attribute effects, where the twoattribute effects are shown in columns 2 and 4 of Tables 8 and 9, the weightsbeing the proportions of speakers and non-speakers in the sample.
On our calculations, when all workers were considered, P–IS = 0.426 and
P–NS = 0.380 so that P
–IS – P–NS = 0.046. Since FIS and FNS = 0.169 (Table 8),
73 per cent of the observed difference between Irish speaking and non-speaking workers in their proportions in PMT jobs could be explained bydifferences between them in attributes. When only workers with third-levelqualifications were considered, P
–IS = 0.696 and P–NS = 0.659 so that
P–IS – P
–NS = 0.037. Since FIS – FNS = 0.087 (Table 9), 57 per cent of the observeddifference between Irish speaking and non-speaking workers (with third levelqualifications) in their proportions in PMT jobs could be explained bydifferences between them in attributes.
VI COMPARISON WITH OTHER COUNTRIES
In order to examine whether the results reported for Ireland were echoedin other countries, the equation specification reported in Table 2 wasestimated for Northern Ireland and for Wales on data for all those inemployment, with a dichotomy between those working in professional,managerial, or technical occupations (PMT) and those in non-PMToccupations. The data for this exercise were obtained from SARS01 and thederived econometric estimates are shown in Table 10. Putting aside the factthat there was a five year gap between the UK and Irish Censuses, thedefinitions of the variables were sufficiently similar to permit a comparisonbetween the Irish results and those for Northern Ireland and Wales.
The first point of interest regarding Northern Ireland was that althoughbeing Catholic carried some disadvantage (1.3 points) in terms of working in
456 THE ECONOMIC AND SOCIAL REVIEW
04 Borooah article_ESRI Vol 40 14/12/2009 17:39 Page 456
PMT occupations, this disadvantage was not statistically significant.19
However, there was significant advantage attached to having some knowledgeof Irish: ceteris paribus compared to workers with no knowledge of Irish, thelikelihood of workers with some knowledge of Irish being in PMT jobs washigher by 5.8 points, a margin not dissimilar to the 6.7 point advantageenjoyed by Irish speaking workers in Ireland.
The position in Wales was different: here Welsh speakers were at a smallbut significant disadvantage relative to non-speakers since ceteris paribuscompared to workers who could not speak Welsh, the likelihood of workers whowere Welsh speakers being in PMT jobs was lower by 1.5 points. This isperhaps explained by the fact that South Wales, with jobs and industry, isrelatively “Welsh-free” compared to more rural North Wales where Welsh ismore commonly spoken.
VII CONCLUSIONS
This paper, using data from the 2006 Irish Census, provided evidence ofthe structural disadvantage of women, relative to men, workers – and of thestructural advantage of Irish speaking, relative to non-speaking, workers – inIreland’s labour market where, it bears emphasising, disadvantage andadvantage were defined in terms of occupational outcomes. The former findingis, perhaps, less surprising, than the latter. To the best of our knowledge therehas been no systematic investigation of any advantage enjoyed by Irishspeakers in Ireland and allegations of the comfortable middle class ambienceof the Gaelscoileanna have remained at the level of anecdote and hearsay –dúirt bean liom go ndúirt bean léi.20
Since linguistic elitism is a feature of many societies – in Tsarist Russiaand in Vietnam the elite spoke French; in the Philippines, the elite spokeSpanish; in Plantagenet England, the elite spoke Anglo-Norman; in PtolemaicEgypt, the elite spoke Koine Greek21 – and since Irish enjoys the constitutionalstatus of the national and first official language of Ireland, such aninvestigation was, arguably, overdue.
Our conclusion was that after controlling for as many relevant factors asthe data permitted, there was a small, but undeniably significant, advantagethat accrued to Irish speakers in terms of obtaining jobs of the professional,
LINGUISTIC ELITISM IN THE IRISH LABOUR MARKET 457
19 The 2001 Census was conducted four years after the Good Friday Agreement which ushered ina period of rapprochement between Unionist and Nationalist politicians and 25 years after thefirst Fair Employment Act (NI) of 1976.20 A woman told me that another woman told her.21 Information from Wikipedia.
04 Borooah article_ESRI Vol 40 14/12/2009 17:39 Page 457

managerial, or technical variety. Equally, a considerable part of the differencebetween speakers and non-speakers in their proportionate presence in theupper reaches of occupational class was due to structural advantage.
We appreciate that the status of Irish as a language is an emotive subjectin Ireland and that some – indeed, many – might find our conclusions difficultto accept. But, as Sherlock Holmes, had he been an Irish speaker – which, alas,he was not – might have said: “Nuair a fhaigheann tú réidh lena bhfuildodhéanta, fiú agus gan í a bheith róchosúil, níl fágtha agat ach an fhírinne”.22
REFERENCES
ARROW, K. J., 1998. “What Has Economics to Say About Racial Discrimination”,Journal of Economic Perspectives 12, pp. 91-100.
BLACKABY, D., S. DRINKWATER, D. LESLIE and P. MURPHY, 1997. “A Picture ofMale and Female Unemployment Among Britain’s Ethnic Minorities”, ScottishJournal of Political Economy, Vol. 44, pp. 182-197.
BOROOAH, V. K., 1999. “Is There a Penalty to Being a Catholic in Northern Ireland?An Econometric Analysis of the Relationship Between Religious Belief andOccupational Success”, European Journal of Political Economy, Vol. 15, pp. 163-92.
BOROOAH, V. K., 2001. “How Do Employees of Ethnic Origin Fare on the OccupationalLadder in Britain?” The Scottish Journal of Political Economy, Vol. 48, pp. 1-26.
BOROOAH, V. K. and S. IYER, 2005. “The Decomposition of Inter-Group Differences ina Logit Model: Extending the Oaxaca-Blinder Approach with an Application toSchool Enrolment in India”, Journal of Economic and Social Measurement, Vol. 30,pp. 279-293.
BOROOAH, V. K. and J. E. MANGAN, 2007. “What Underpins Occupational Success?Race, Access and Reward in Professional and Managerial Jobs in Australia”,Labour, Vol. 21, pp. 837-869.
DAVERN, M., 1997. “Social Networks and Economic Sociology: A Proposed ResearchAgenda for a More Complete Social Science”, American Joumal of Economics andSociology, Vol. 56, No. 3, pp. 287-302.
DAVERN, M., 1999. “Social Networks and Prestige Attainment: New Empirical Find -ings”, American Journal of Economics and Sociology, Vol. 58, No. 4, pp. 843-864.
DAVERN, M. and D. S. HACHEN, 2006. “The Role of Information and Influence inSocial Networks, Examining the Association Between Social Network Structureand Job Mobility”, American Journal of Economics and Sociology, Vol. 65, No. 2,pp. 269-293.
DEAUX, K. and D. MARTIN, 2003. “Interpersonal Networks and Social Categories:Specifying Levels of Context in Identity Processes”, Social Psychology Quarterly,Vol. 66, No. 2, Special Issue: Social Identity: Sociological and Social PsychologicalPerspectives (June, 2003), pp. 101-117.
458 THE ECONOMIC AND SOCIAL REVIEW
22 “When you have eliminated the impossible, whatever remains, however improbable, must bethe truth”, Arthur Conan Doyle, The Sign of the Four.
04 Borooah article_ESRI Vol 40 14/12/2009 17:39 Page 458

DUBINI, P. and H. ALDRICH, 1991. “Personal and Extended Networks are Central tothe Entrepreneurial Process”, Journal of Business Venturing, Vol. 6, No. 5, pp. 305-313.
FREEL M. S., 2000. “External Linkages and Product Innovation in Small Manu -facturing Firms”, Entrepreneurship and Regional Development, Vol. 12, No. 3, pp. 245-266.
GRANOVETTER, M., 1973. “The Strength of Weak Ties”, American Journal ofSociology, Vol. 78, pp. 1360-1380.
HIGGS, R., 1977. Competition and Coercion: Blacks in the American Economy, 1865-1914, New York: Columbia University Press.
LARSON A., 1991. “Partner Networks: Leveraging Eternal Ties to Improve Entre -preneurial Performance”, Journal of Business Venturing, Vol. 6, No. 3, pp. 173-88.
LEWER, J. J. and H. VAN DEN BERG, 2007. “Religion and International Trade: Doesthe Sharing of a Religious Culture Facilitate the Formation of Trade Networks?”American Journal of Economics and Sociology, Vol. 66, No. 4, pp. 765-794.
MADILL, J. J., G. H. HAINES and A. L. RIDING, 2004. “Networks and LinkagesAmong Firms and Organisation in the Ottawa-Region”, Entrepreneurship andRegional Development, Vol. 16, pp. 351-368.
NIELSEN, H. S., 1998. “Discrimination and Detailed Decomposition in a Logit Model”,Economics Letters, Vol. 61, pp. 115-120.
NÍ RÍORDÁIN, M. and J. O’DONOGHUE, 2008. “The Relationship BetweenPerformance on Mathematical Word Problems and Language Proficiency forStudents Learning Through the Medium of Irish”, Educational Studies inMathematics: http://www.springerlink.com/content/158547k16j81r163/fulltext.pdf.
OAXACA, R., 1973. “Male-Female Wage Differentials in Urban Labor Markets”,International Economic Review, Vol. 14, pp. 693-709.
PREMARTNE, S. P., 2001. “Networks, Resources and Small Business Growth: TheExperience in Sri Lanka”, Journal of Small Business Management, Vol. 39, No. 4,pp. 363-371
SCHMIDT, P. and R. P. STRAUSS, 1975. “The Prediction of Occupation Using MultipleLogit Models”, International Economic Review, Vol. 16, pp. 471-486.
SEN, A.K., 1993. “Capability and Well-Being” in M. Nussbaum and A.K. Sen (ed.), TheQuality of Life, Oxford, Clarendon Press.
WHATELY, H. and G. WRIGHT, 1994. “Race, Human Capital and Labour Markets inAmerican History” in G. Grantham and M. MacKinnon (eds.), Labour MarketEvolution, New York: Routledge.
ZAHEER, A. and N. VENKATRAMAN, 1995. “Relational Governance as an Inter-Organisational Strategy: an Empirical Test of the Role of Trust in EconomicExchanges”, Strategic Management Journal, Vol. 16, pp. 373-392.
LINGUISTIC ELITISM IN THE IRISH LABOUR MARKET 459
04 Borooah article_ESRI Vol 40 14/12/2009 17:39 Page 459

04 Borooah article_ESRI Vol 40 14/12/2009 17:39 Page 460