Landslide hazard assessment in Georgia - CENNdrm.cenn.org/Local_Case_studies/Landslide hazard...
15
Report on the 1 st project of AES Geohazards Stream Landslide hazard assessment in Georgia George Gaprindashvili Faculty of Geo-Information Science and Earth Observation (ITC) of the University of Twente, 7500 AA Enschede, the Netherlands March 2011
-
Upload
nguyenlien -
Category
Documents
-
view
221 -
download
0
Transcript of Landslide hazard assessment in Georgia - CENNdrm.cenn.org/Local_Case_studies/Landslide hazard...

Report on the 1st project of AES Geohazards
Stream
Landslide hazard assessment in
Georgia
George Gaprindashvili
Faculty of Geo-Information Science and Earth Observation (ITC) of the University of Twente, 7500 AA Enschede, the
Netherlands
March 2011
2
Table of contents
1. INTRODUCTION. . . . . . . . . . . . . . . . . . . . . . . . . . . . . . . . . . . . . . . . . . . . . . . . . . 3
2. THE STUDY AREA . . . . . . . . . . . . . . . . . . . . . . . . . . . . . . . . . . . . . . . . . . . . . . . . . . . . . . . . . . 4
3. DATA DESCRIPTION.. . . . . . . . . . . . . . . . . . . . . . . . . . . . . . . . . . . . . . . . . . . . . . . . . . . . . . . . 6
4. METHODOLOGY. . . . . . . . . . . . . . . . . . . . . . . . . . . . . . . . . . . . . . . . . . . . .. . . . . . . . .6
4.1 STANDARTIZATION, WEIGHTING . . . . . . . . . . . . . . . . . . . . . . . . . . . . . . . . . . . . . . . . . . . . . . 7
5. RESULTS AND DISCUSSION . . . . . . . . . . . . . . . . . . . . . . . . . . . . . . . . . .. . . . . . . . . 8
5.1 SLOPE GRADIENT. . . . . . . . . . . . . . . . . . . . . . . . . . . . . . . . . . . . . . . . . . . . . . 9
5.2 GEOLOGY . . . . . . . . . . . . . . . . . . . . . . . . . . . . . . . . . . . . . . . . . . . . . . . . . . . .10
5.3 LANDCOVER. . . . . . . . . . . . . . . . . . . . . . . . . . . . . . . . . . . . . . . . . . . . . . . . . . . 11
5.5 DISTANCE TO THE ROAD NETWORK . . . . . . . . . . . . . . . . . . . . . . . . . . . . . . . 12
5.6 DISTANCE FROM FAULTS . . . . . . . . . . . . . . . . . . . . . . . . . . . . . . . . . . . . . . . 12
5.2 WEIGHT ASSIGNMENT. . . . . . . . . . . . . . . . . . . . . . . . . . . . . . . . . . . . . . . . . . 12
5.2 SUSCEPTIBILITY ASSESSMENT . . . . . . . . . . . . . . . . . . . . . . . . . . . . . . . . . . . 10
6. CONCLUSIONS AND RECOMMENDATIONS . . . . . . . . . . . . . . . . . . . . . . . . . . . . . 14
REFERENCES . . . . . . . . . . . . . . . . . . . . . . . . . . . . . . . . . . . . . . . . . . . . . . . . . . . . .15
3
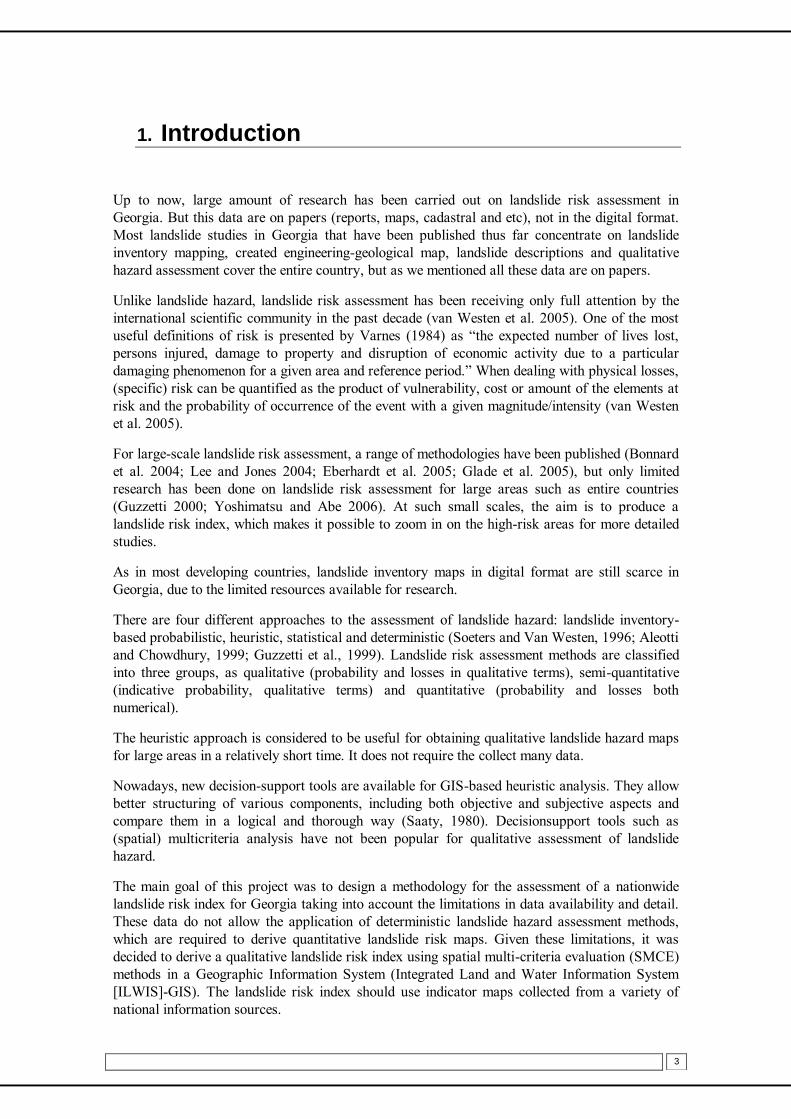
1. Introduction
Up to now, large amount of research has been carried out on landslide risk assessment in
Georgia. But this data are on papers (reports, maps, cadastral and etc), not in the digital format.
Most landslide studies in Georgia that have been published thus far concentrate on landslide
inventory mapping, created engineering-geological map, landslide descriptions and qualitative
hazard assessment cover the entire country, but as we mentioned all these data are on papers.
Unlike landslide hazard, landslide risk assessment has been receiving only full attention by the
international scientific community in the past decade (van Westen et al. 2005). One of the most
useful definitions of risk is presented by Varnes (1984) as “the expected number of lives lost,
persons injured, damage to property and disruption of economic activity due to a particular
damaging phenomenon for a given area and reference period.” When dealing with physical losses,
(specific) risk can be quantified as the product of vulnerability, cost or amount of the elements at
risk and the probability of occurrence of the event with a given magnitude/intensity (van Westen
et al. 2005).
For large-scale landslide risk assessment, a range of methodologies have been published (Bonnard
et al. 2004; Lee and Jones 2004; Eberhardt et al. 2005; Glade et al. 2005), but only limited
research has been done on landslide risk assessment for large areas such as entire countries
(Guzzetti 2000; Yoshimatsu and Abe 2006). At such small scales, the aim is to produce a
landslide risk index, which makes it possible to zoom in on the high-risk areas for more detailed
studies.
As in most developing countries, landslide inventory maps in digital format are still scarce in
Georgia, due to the limited resources available for research.
There are four different approaches to the assessment of landslide hazard: landslide inventory-
based probabilistic, heuristic, statistical and deterministic (Soeters and Van Westen, 1996; Aleotti
and Chowdhury, 1999; Guzzetti et al., 1999). Landslide risk assessment methods are classified
into three groups, as qualitative (probability and losses in qualitative terms), semi-quantitative
(indicative probability, qualitative terms) and quantitative (probability and losses both
numerical).
The heuristic approach is considered to be useful for obtaining qualitative landslide hazard maps
for large areas in a relatively short time. It does not require the collect many data.
Nowadays, new decision-support tools are available for GIS-based heuristic analysis. They allow
better structuring of various components, including both objective and subjective aspects and
compare them in a logical and thorough way (Saaty, 1980). Decisionsupport tools such as
(spatial) multicriteria analysis have not been popular for qualitative assessment of landslide
hazard.
The main goal of this project was to design a methodology for the assessment of a nationwide
landslide risk index for Georgia taking into account the limitations in data availability and detail.
These data do not allow the application of deterministic landslide hazard assessment methods,
which are required to derive quantitative landslide risk maps. Given these limitations, it was
decided to derive a qualitative landslide risk index using spatial multi-criteria evaluation (SMCE)
methods in a Geographic Information System (Integrated Land and Water Information System
[ILWIS]-GIS). The landslide risk index should use indicator maps collected from a variety of
national information sources.

4
2. The Study area
Georgia is a sovereign state in the Caucasus region of Eurasia (shown in Fig. 1). Situated at the
juncture of Eastern Europe and Western Asia it is bounded to the west by the Black Sea, to the
north by Russia, to the southwest by Turkey, to the south by Armenia, and to the southeast by
Azerbaijan. Georgia covers a territory of 69,700 km² and its population is almost 4.5 million.
The Greater Caucasus Mountain Range is much higher in elevation than the Lesser Caucasus
Mountains, with the highest peaks rising more than 5,000 meters above sea level.
Georgia is divided into two autonomous republics (Adjara and Apkhazeti) and nine regions
(shown in Fig. 2). The nine regions are Guria, Imereti, Kakheti, Kvemo Kartli, Mtskheta-Mtianeti,
Racha-Lechkhumi and Kvemo Svaneti, Samegrelo-Zemo Svaneti, Samtskhe-Javakheti, and Shida
Kartli.
Fig. 1: The Study area – Georgia (Source: Google Earth)
Fig. 2: Administrative map of Georgia
5
Despite its small area, Georgia has one of the most varied topographies of the Eastern
Europe. Georgia lies mostly in the Caucasus Mountains, and its northern boundary is
partly defined by the Greater Caucasus range. The Lesser Caucasus range, which runs
parallel to the Turkish and Armenian borders, and the Surami and Imereti ranges, which
connect the Greater Caucasus and the Lesser Caucasus, create natural barriers that are
partly responsible for cultural and linguistic differences among regions. Because of their
elevation and a poorly developed transportation infrastructure, many mountain villages
are virtually isolated from the outside world during the winter. Earthquakes and
landslides in mountainous areas present a significant threat to life and property.
Georgia has about 26,000 rivers. Drainage is into the Black Sea to the west and through
Azerbaijan to the Caspian Sea to the east. The largest river is the Mtkvari, which flows
1,364 km from northeast Turkey across the plains of eastern Georgia, through the capital,
Tbilisi, and into the Caspian Sea. The Rioni River, the largest river in western Georgia,
rises in the Greater Caucasus and empties into the Black Sea at the port of Poti.
The climate of Georgia is extremely diverse, considering the country's small size. There are two
main climatic zones, roughly separating Eastern and Western parts of the country. The Greater
Caucasus Mountain Range plays an important role in moderating Georgia's climate and protects
the country from the penetration of colder air masses from the north. The Lesser Caucasus
Mountains partially protect the region from the influence of dry and hot air masses from the south
as well.
Much of western Georgia lies within the northern periphery of the humid subtropical zone with
annual precipitation ranging from 1000–4000 mm. The climate of the region varies significantly
with elevation and while much of the lowland areas of western Georgia are relatively warm
throughout the year, the foothills and mountainous areas experience cool, wet summers and
snowy winters (snow cover often exceeds 2 meters in many regions).
Adjara is the wettest region of the Caucasus, where the Mt. Mtirala rainforest, east of Kobuleti
receives around 4500 mm of precipitation per year. Midwinter average temperature in West
Georgia is 5 C and the midsummer average is 22C.
Eastern Georgia has a transitional climate from humid subtropical to continental. The region's
weather patterns are influenced both by dry, Central Asian/Caspian air masses from the east and
humid, Black Sea air masses from the west. The penetration of humid air masses from the Black
Sea is often blocked by several mountain ranges (Likhi and Meskheti). Annual precipitation is
considerably less than that of western Georgia and ranges from 400–1600 mm.
The wettest periods generally occur during spring and autumn while winter and the Summer
months tend to be the driest. Much of eastern Georgia experiences hot summers (especially in the
low-lying areas) and relatively cold winters. As in the western parts of the country, elevation
plays an important role in eastern Georgia where climatic conditions above 1500 meters are
considerably colder than in the low-lying areas. The regions that lie above 2000 meters frequently
experience frost even during the summer months. The average temperature in summer here is 20-
24 degrees of Celsius, in winter 2-4 degrees of Celsius. Humidity is lower.
In Georgia a strong influence of natural hazards (earthquake, floods, flashflood landslide,
mudflow, rockfall, avalanche and etc) is experienced by thousands of populated areas, plots of
field, roads, oil and gas pipes, high-voltage electric power transmission towers, hydraulic
structures and reclamation constructions, mountain and tourist complexes, etc.
Many environmental factors, related to the fields of geology, geomorphology, topography and
land use, have the potential to affect land sliding (Clerici et al., 2002). Moreover, most of the
quantitative risk assessment methods that have been developed elsewhere are case-specific and
6
require many types of data, on landslide occurrence and impact, most of which, however, are not
yet available in Georgia.
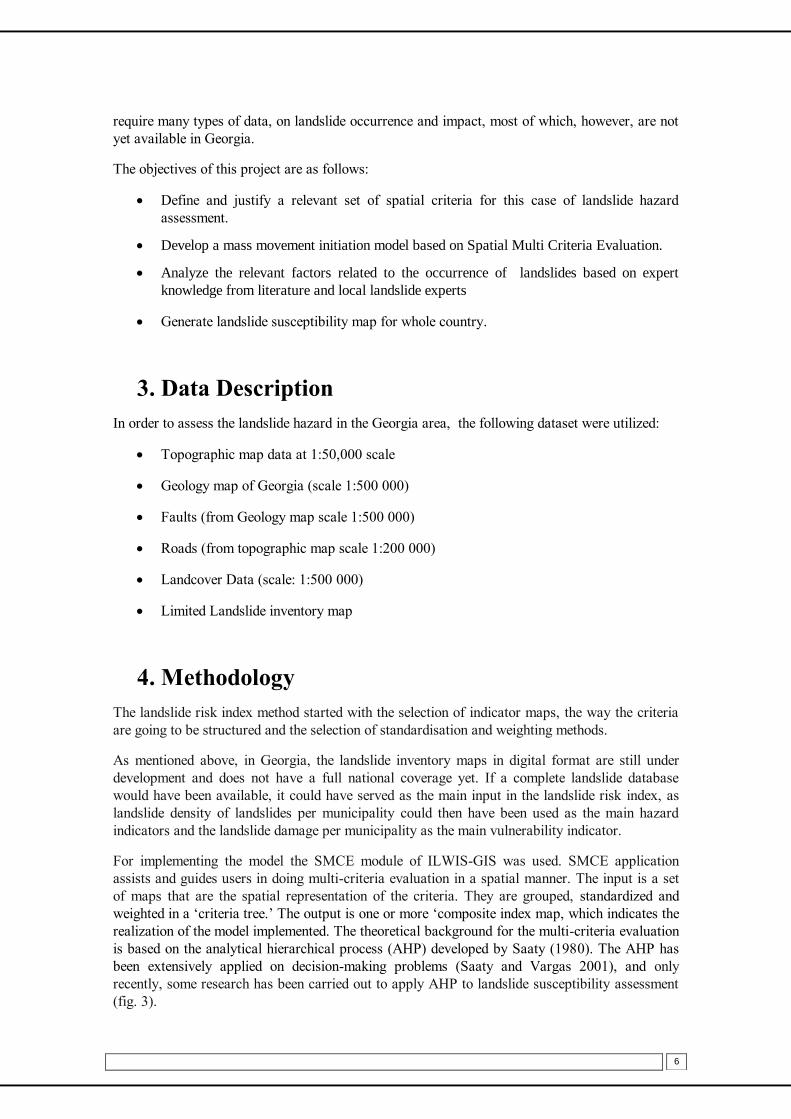
The objectives of this project are as follows:
Define and justify a relevant set of spatial criteria for this case of landslide hazard
assessment.
Develop a mass movement initiation model based on Spatial Multi Criteria Evaluation.
Analyze the relevant factors related to the occurrence of landslides based on expert
knowledge from literature and local landslide experts
Generate landslide susceptibility map for whole country.
3. Data Description
In order to assess the landslide hazard in the Georgia area, the following dataset were utilized:
Topographic map data at 1:50,000 scale
Geology map of Georgia (scale 1:500 000)
Faults (from Geology map scale 1:500 000)
Roads (from topographic map scale 1:200 000)
Landcover Data (scale: 1:500 000)
Limited Landslide inventory map
4. Methodology
The landslide risk index method started with the selection of indicator maps, the way the criteria
are going to be structured and the selection of standardisation and weighting methods.
As mentioned above, in Georgia, the landslide inventory maps in digital format are still under
development and does not have a full national coverage yet. If a complete landslide database
would have been available, it could have served as the main input in the landslide risk index, as
landslide density of landslides per municipality could then have been used as the main hazard
indicators and the landslide damage per municipality as the main vulnerability indicator.
For implementing the model the SMCE module of ILWIS-GIS was used. SMCE application
assists and guides users in doing multi-criteria evaluation in a spatial manner. The input is a set
of maps that are the spatial representation of the criteria. They are grouped, standardized and
weighted in a „criteria tree.‟ The output is one or more „composite index map, which indicates the
realization of the model implemented. The theoretical background for the multi-criteria evaluation
is based on the analytical hierarchical process (AHP) developed by Saaty (1980). The AHP has
been extensively applied on decision-making problems (Saaty and Vargas 2001), and only
recently, some research has been carried out to apply AHP to landslide susceptibility assessment
(fig. 3).

7
Fig. 3. Schematic procedure for spatial multi-criteria evaluation based on the analytical
Hierarchical process
4.1 Standardisation, weighting
To make spatial multi-criteria analysis possible, the input layers need to be standardized from
their original values to the value range of 0–1. There was provided different standardization in the
SMCE module of ILWIS (ITC 2001). For standardizing value maps, a set of equations can be
used to convert the actual map values to a range between 0 and 1. The class maps use an
associated table for standardisation where a column must be filled with values between 0 and 1.
In Section Indicator Analysis, a detailed description of the indicator maps and their
standardization is given. The next step is to decide for each indicator whether it is favourable or
unfavourable in relation to the intermediate or overall objective.
The most important constraint indicator used for the national landslide risk assessment is the
slope angle. In areas that have very gentle or flat slopes, landslides are not expected or occur only
under very specific conditions. After selecting the appropriate indicators, defining their
standardisation and the hierarchical structure weights were assigned to each criteria and
intermediate result. For weighting, 3 main methods can be used: direct method, pairwise
comparison and rank order methods. Finally landslide index map was created by direct method.
8
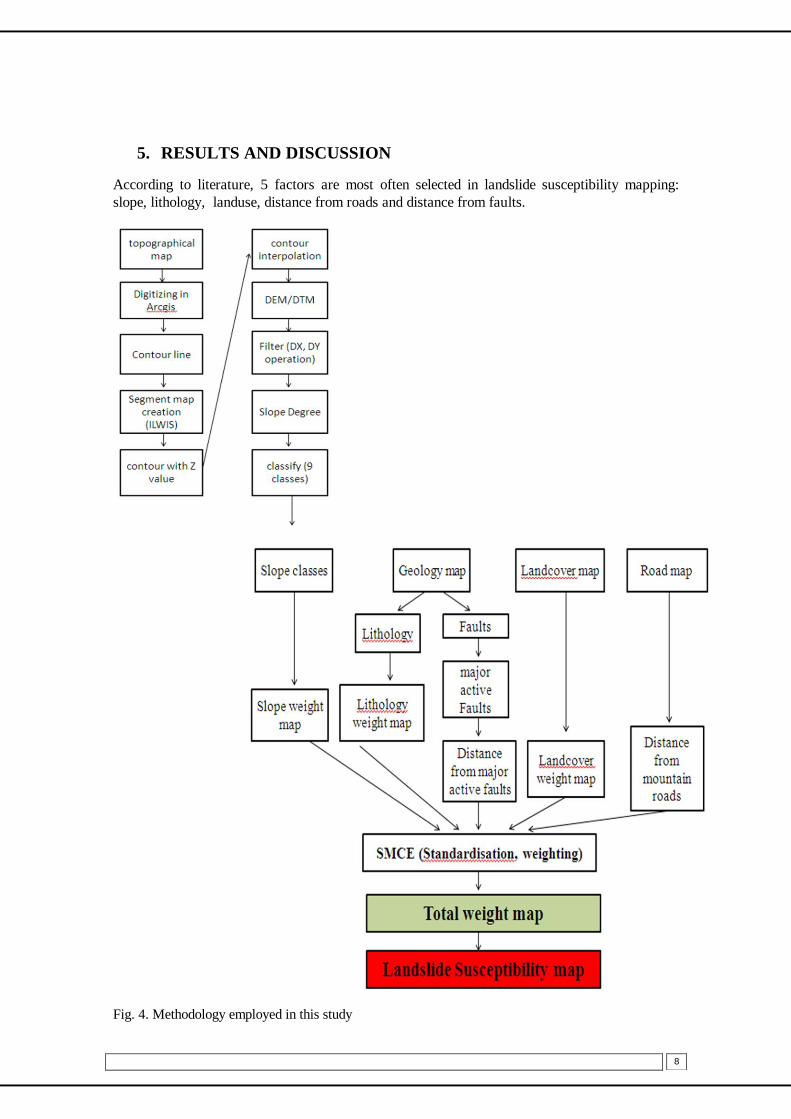
5. RESULTS AND DISCUSSION
According to literature, 5 factors are most often selected in landslide susceptibility mapping:
slope, lithology, landuse, distance from roads and distance from faults.
Fig. 4. Methodology employed in this study
9
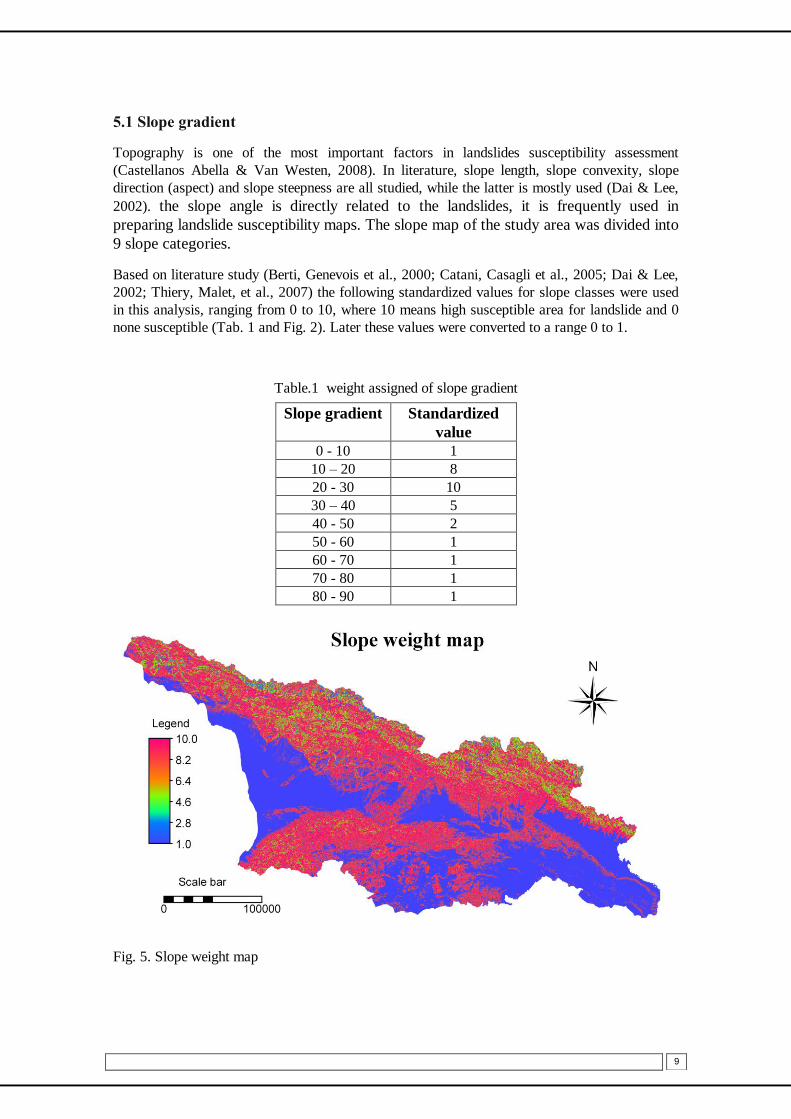
5.1 Slope gradient
Topography is one of the most important factors in landslides susceptibility assessment
(Castellanos Abella & Van Westen, 2008). In literature, slope length, slope convexity, slope
direction (aspect) and slope steepness are all studied, while the latter is mostly used (Dai & Lee,
2002). the slope angle is directly related to the landslides, it is frequently used in
preparing landslide susceptibility maps. The slope map of the study area was divided into
9 slope categories.
Based on literature study (Berti, Genevois et al., 2000; Catani, Casagli et al., 2005; Dai & Lee,
2002; Thiery, Malet, et al., 2007) the following standardized values for slope classes were used
in this analysis, ranging from 0 to 10, where 10 means high susceptible area for landslide and 0
none susceptible (Tab. 1 and Fig. 2). Later these values were converted to a range 0 to 1.
Table.1 weight assigned of slope gradient
Slope gradient Standardized
value
0 - 10 1
10 – 20 8
20 - 30 10
30 – 40 5
40 - 50 2
50 - 60 1
60 - 70 1
70 - 80 1
80 - 90 1
Fig. 5. Slope weight map
10
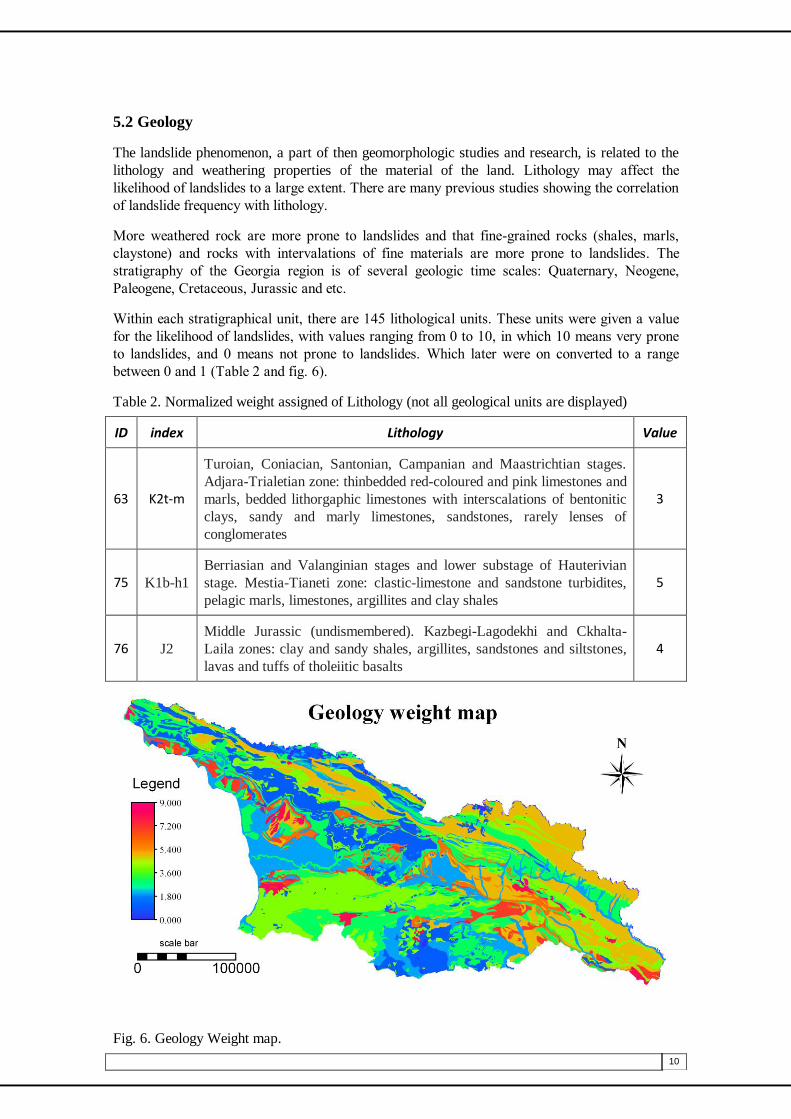
5.2 Geology
The landslide phenomenon, a part of then geomorphologic studies and research, is related to the
lithology and weathering properties of the material of the land. Lithology may affect the
likelihood of landslides to a large extent. There are many previous studies showing the correlation
of landslide frequency with lithology.
More weathered rock are more prone to landslides and that fine-grained rocks (shales, marls,
claystone) and rocks with intervalations of fine materials are more prone to landslides. The
stratigraphy of the Georgia region is of several geologic time scales: Quaternary, Neogene,
Paleogene, Cretaceous, Jurassic and etc.
Within each stratigraphical unit, there are 145 lithological units. These units were given a value
for the likelihood of landslides, with values ranging from 0 to 10, in which 10 means very prone
to landslides, and 0 means not prone to landslides. Which later were on converted to a range
between 0 and 1 (Table 2 and fig. 6).
Table 2. Normalized weight assigned of Lithology (not all geological units are displayed)
ID index Lithology Value
63 K2t-m
Turoian, Coniacian, Santonian, Campanian and Maastrichtian stages.
Adjara-Trialetian zone: thinbedded red-coloured and pink limestones and
marls, bedded lithorgaphic limestones with interscalations of bentonitic
clays, sandy and marly limestones, sandstones, rarely lenses of
conglomerates
3
75 K1b-h1 Berriasian and Valanginian stages and lower substage of Hauterivian
stage. Mestia-Tianeti zone: clastic-limestone and sandstone turbidites,
pelagic marls, limestones, argillites and clay shales 5
76 J2
Middle Jurassic (undismembered). Kazbegi-Lagodekhi and Ckhalta-
Laila zones: clay and sandy shales, argillites, sandstones and siltstones,
lavas and tuffs of tholeiitic basalts
4
Fig. 6. Geology Weight map.
11
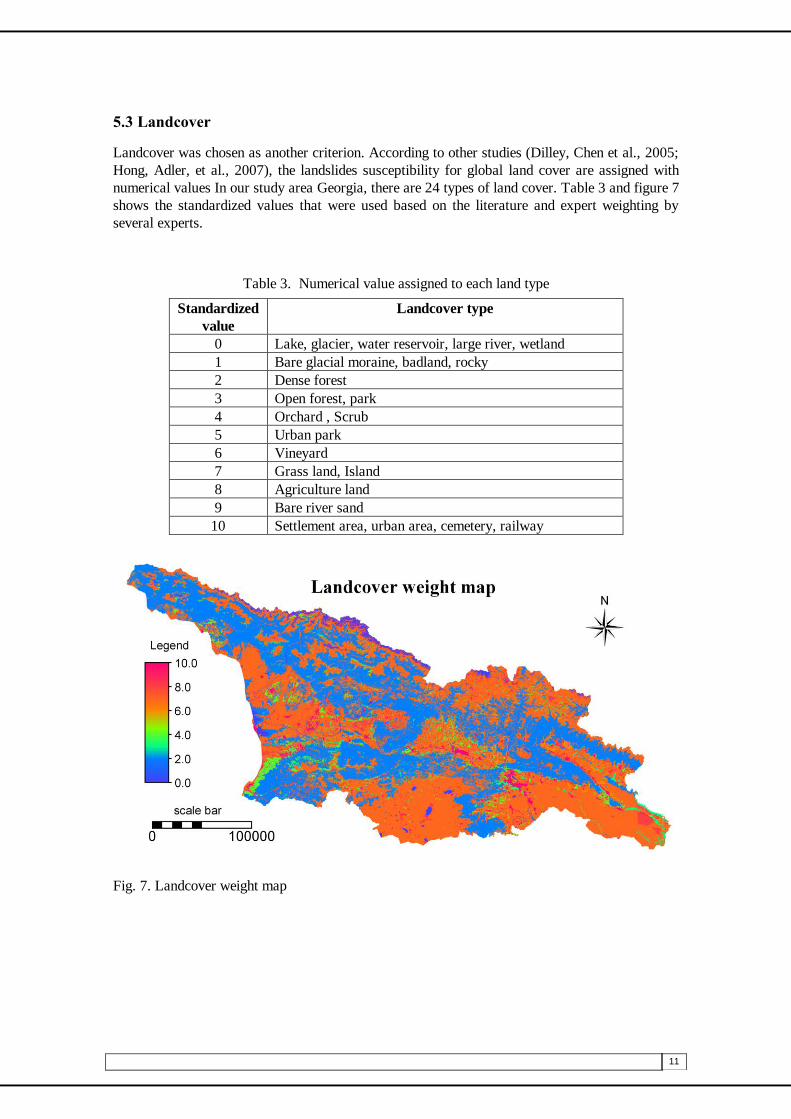
5.3 Landcover
Landcover was chosen as another criterion. According to other studies (Dilley, Chen et al., 2005;
Hong, Adler, et al., 2007), the landslides susceptibility for global land cover are assigned with
numerical values In our study area Georgia, there are 24 types of land cover. Table 3 and figure 7
shows the standardized values that were used based on the literature and expert weighting by
several experts.
Table 3. Numerical value assigned to each land type
Standardized
value
Landcover type
0 Lake, glacier, water reservoir, large river, wetland
1 Bare glacial moraine, badland, rocky
2 Dense forest
3 Open forest, park
4 Orchard , Scrub
5 Urban park
6 Vineyard
7 Grass land, Island
8 Agriculture land
9 Bare river sand
10 Settlement area, urban area, cemetery, railway
Fig. 7. Landcover weight map
12
5.4 Distance to the road network
Construction of roads also influences the density of landslides, especially in sloping areas where
road cuts are made. In this study, roads that are located on areas with slopes steeper than 20
degree and that are close to a road are taken into account with the value of 1, other areas are
assigned value of 0.
5.5 Distance from Faults
Distance from major Faults was chosen as another criterion. There are several major Faults in
our study area, but only major active Faults cause Landslides in Georgia. It was created buffer
zones. Threshold magnitudes, minimum shaking intensities, and relations between M and distance
from epicenter or fault rupture were used to define relative levels of shaking that trigger
landslides in susceptible materials.
5.6 Weight assignment
After the selection of the indicators, their standardisation and the definition of indicator weights,
the analysis was carried out using an ILWIS GIS script to obtain the composite index maps and
the final landslide risk index map.
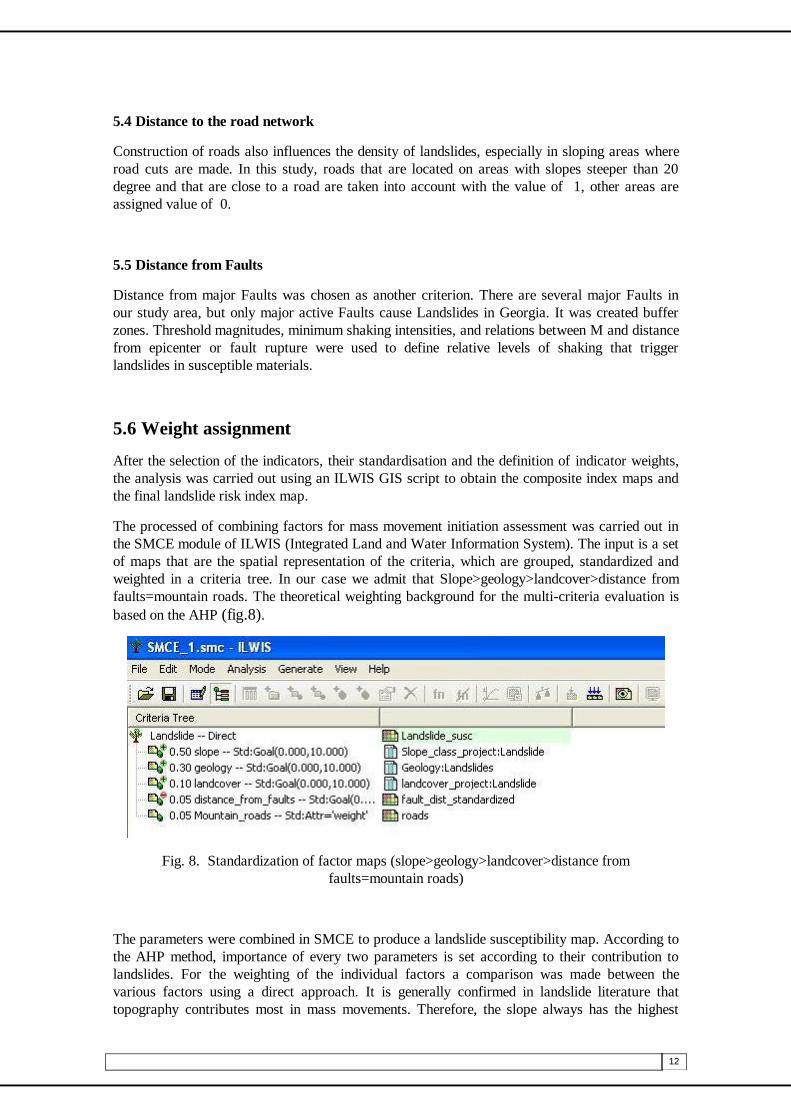
The processed of combining factors for mass movement initiation assessment was carried out in
the SMCE module of ILWIS (Integrated Land and Water Information System). The input is a set
of maps that are the spatial representation of the criteria, which are grouped, standardized and
weighted in a criteria tree. In our case we admit that Slope>geology>landcover>distance from
faults=mountain roads. The theoretical weighting background for the multi-criteria evaluation is
based on the AHP (fig.8).
Fig. 8. Standardization of factor maps (slope>geology>landcover>distance from
faults=mountain roads)
The parameters were combined in SMCE to produce a landslide susceptibility map. According to
the AHP method, importance of every two parameters is set according to their contribution to
landslides. For the weighting of the individual factors a comparison was made between the
various factors using a direct approach. It is generally confirmed in landslide literature that
topography contributes most in mass movements. Therefore, the slope always has the highest
13
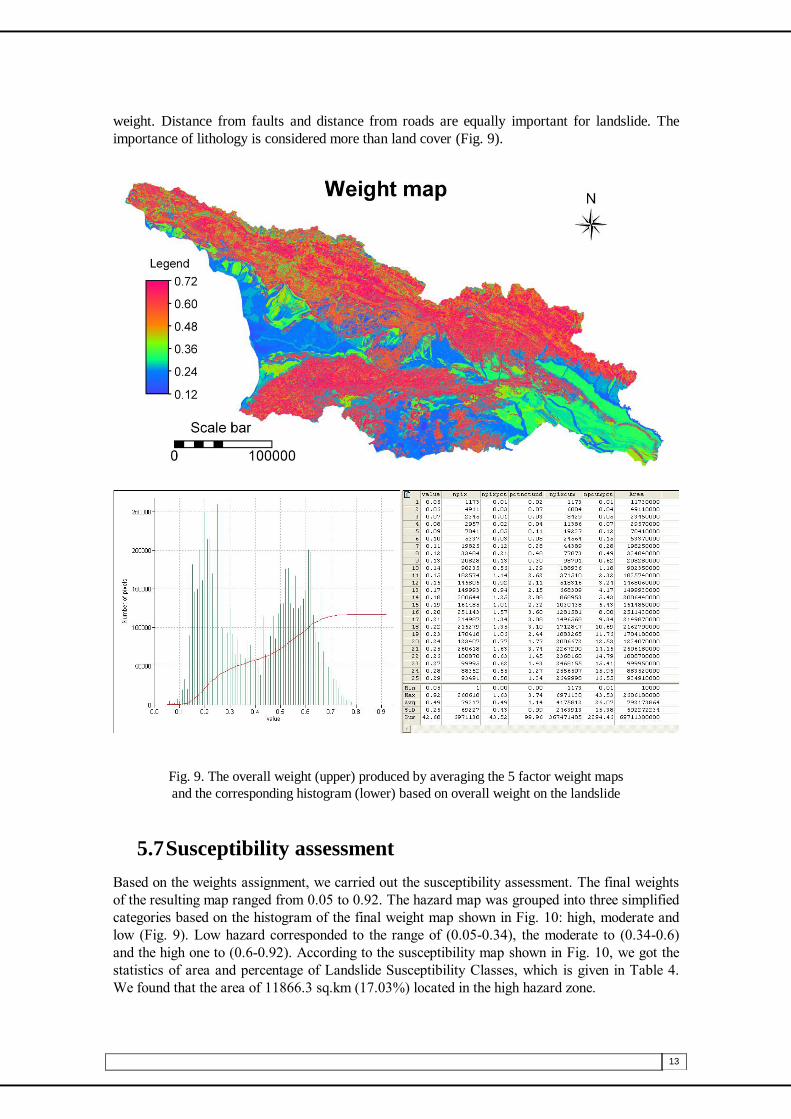
weight. Distance from faults and distance from roads are equally important for landslide. The
importance of lithology is considered more than land cover (Fig. 9).
Fig. 9. The overall weight (upper) produced by averaging the 5 factor weight maps
and the corresponding histogram (lower) based on overall weight on the landslide
5.7 Susceptibility assessment
Based on the weights assignment, we carried out the susceptibility assessment. The final weights
of the resulting map ranged from 0.05 to 0.92. The hazard map was grouped into three simplified
categories based on the histogram of the final weight map shown in Fig. 10: high, moderate and
low (Fig. 9). Low hazard corresponded to the range of (0.05-0.34), the moderate to (0.34-0.6)
and the high one to (0.6-0.92). According to the susceptibility map shown in Fig. 10, we got the
statistics of area and percentage of Landslide Susceptibility Classes, which is given in Table 4.
We found that the area of 11866.3 sq.km (17.03%) located in the high hazard zone.

14
Fig. 10. Landslide susceptibility map of Georgia
Table 4. Area and percentage of landslide susceptibility classes
HAZARD Area (sq. km) %
low hazard 30847.3 44.25
moderate hazard 26997.6 38.72
high hazard 11866.3 17.03
Total area 69711.3 100
6. CONCLUSIONS AND RECOMMENDATIONS
In Georgia, unfortunately landslide inventory covering the entire country is not available.
Therefore, it is not possible to re-classify the landslide inventory map according to regions, or
municipalities to obtain the landslide hazard map, which is one of the two required components of
the national landslide risk map.
In landslides, lithology is found to have more influence than land cover for the susceptibility map.
Slopes have more influence than land cover for the susceptibility map.
According to the susceptibility map we got the statistics of area and percentage of Landslide
Susceptibility Classes. We found that the area of 11866.3 sq.km (17.03%) located in the high
hazard zone. 38.72% in the moderate hazard zone and 44.25 in low hazard zone.

15
The resulting landslide susceptibility map is not a static one, as a number of indicators have a
temporal variability, and the landslide susceptibility map should therefore be updated regularly.
The use of landslide susceptibility map for provinces and municipalities is useful for ranking
them in order of importance for landslide risk reduction measures.
This study was one of the first steps in the national landslide risk assessment, and it is necessary
to follow it up with studies at a larger scale.
References
Castellanos Abella, E. A. and C. J. Van Western, 2007. Generation of a landslide risk index
map for Cuba using spatial multi-criteria evaluation, in: Landslides 4 (2007) 4.
Clerici, A., Perego, S., Tellini, C., and Vescovi, P. 2002. A procedure for landslide
susceptibility zonation by the conditional analysis method. [doi: DOI: 10.1016/S0169-
555X(02)00079-X]. Geomorphology, 48(4), 349-364.
Castellanos Abella, E.A. and van Westen, C.J., 2008. Qualitative landslide susceptibility
assessment by multicriteria analysis: a case study from San Antonio del Sur, Guantánamo,
Cuba. Geomorphology, 94 (2008)3-4, pp. 453-466
Dahl M.-P. J., Mortensen L. E., Veihe A., and JensenN. H. 2010. A simple qualitative approach for
mapping regional landslide susceptibility in the Faroe Islands. Nat. Hazards Earth Syst. Sci.,
10, 159–170, 2010
Farrokh Nadim, Oddvar Kjekstad, Pascal Peduzzi, Christian Herold, Christian Jaedicke 2006.
Global landslide and avalanche hotspots. DOI: 10.1007/s10346-006-0036-1, Landslides
(2006) 3: 159–173
Gupta R.P and Joshi B.C 1989. Landslide hazard zoning using the GIS approach--A case study
from the Ramganga catchment, Himalayas. Engineering Geology, 28 (1990) 119-131
Lee, E.M., and D. K. C., Jones, 2004. Landslide Risk Assessment. Thomas Telford, London. 454
pp.
Robin Fell, Jordi Corominas, Christophe Bonnard, Leonardo Cascini, Eric Leroi, William Z.
Savage on behalf of the JTC-1 Joint Technical Committee on Landslides and Engineered
Slopes 2008. Guidelines for landslide susceptibility, hazard and risk zoning for land use
planning. Engineering Geology, pp. 85-98