Landslide hazard evaluation and zonation in Dilbe Town and ...

Nat. Hazards Earth Syst. Sci., 13, 2833–2849, 2013www.nat-hazards-earth-syst-sci.net/13/2833/2013/doi:10.5194/nhess-13-2833-2013© Author(s) 2013. CC Attribution 3.0 License.
Natural Hazards and Earth System
SciencesO
pen Access
Landslide and debris flow susceptibility zonation using TRIGRS forthe 2011 Seoul landslide event
D. W. Park, N. V. Nikhil, and S. R. Lee
Korea Advanced Institute of Science and Technology, Daejeon, Republic of Korea
Correspondence to:S. R. Lee ([email protected])
Received: 23 April 2013 – Published in Nat. Hazards Earth Syst. Sci. Discuss.: 5 June 2013Revised: 10 October 2013 – Accepted: 15 October 2013 – Published: 14 November 2013
Abstract. This paper presents the results from the applica-tion of a regional, physically based stability model: TransientRainfall Infiltration and Grid-based Regional Slope-stabilityanalysis (TRIGRS) for a region on Woomyeon Mountain,Seoul, South Korea. This model couples an infinite-slope sta-bility analysis with a one-dimensional analytical solution topredict the transient pore pressure response to the infiltra-tion of rainfall. TRIGRS also adopts the geographic infor-mation system (GIS) framework for determining the wholebehaviour of a slope. In this paper, we suggest an index forevaluating the results produced by the model. Particular at-tention is devoted to the prediction of routes of debris flow,using a runoff module.
In this context, the paper compares observed landslideand debris flow events with those predicted by the TRIGRSmodel. The TRIGRS model, originally developed to predictshallow landslides, has been extended in this study for appli-cation to debris flows. The results predicted by the TRIGRSmodel are presented as safety factor (FS) maps correspond-ing to transient rainfall events, and in terms of debris flowpaths using methods proposed by several researchers in hy-drology.
In order to quantify the effectiveness of the model, we pro-posed an index called LRclass (landslide ratio for each pre-dicted FS class). The LRclass index is mainly applied in re-gions where the landslide scar area is not well defined (or isunknown), in order to avoid overestimation of the model re-sults. The use of the TRIGRS routing module was proposedto predict the paths of debris flow, especially in areas wherethe rheological properties and erosion rates of the materi-als are difficult to obtain. Although an improvement in ac-curacy is needed, this module is very useful for preliminaryspatio-temporal assessment over wide areas. In summary, the
TRIGRS model is a powerful tool of use to decision mak-ers for susceptibility mapping, particularly when linked withvarious advanced applications using GIS spatial functions.
1 Introduction
Shallow landslides involving colluvium are generally themost common in South Korea and often mobilize into de-structive debris flows. Shallow landslides are typically 1–3 mdeep and often occur at boundaries between the colluviumand the underlying more solid parent rock (Salciarini et al.,2008). In most parts of South Korea, including Seoul, thethickness of the colluvium is generally less than 2 m becauseof the relatively shallow depth of the bedrock, and henceshallow landslides are frequent. Furthermore, the climate ofSouth Korea is typical of the Indian Ocean monsoon, withpronounced seasonal precipitation (Kim et al., 2010). Thus,rainfall-triggered landslides are a recurring problem in SouthKorea. Due to the mountainous terrain with a shallow layerof colluvium, and associated weather conditions, landslideshave proven a hazard across most of the country. The socio-economic impact, moreover, has become much higher thanbefore because of the current population levels in the haz-ardous zones.
During 26–27 July 2011, in particular, heavy rainfall(470 mm in two days) occurred in Seoul, an amount ap-proximately equal to 20 % of the total annual rainfall forthat region. During this precipitation event, 147 catastrophiclandslides occurred on Mt. Woomyeon. Most of the land-slides were accompanied by debris flows, and these mix-tures of debris flowed down roads into the surroundingcommunities. Sixteen people were killed and ten buildings
Published by Copernicus Publications on behalf of the European Geosciences Union.
2834 D. W. Park et al.: Landslide and debris flow susceptibility zonation
damaged by these debris flows. During the storm, shallowlandslides on steep mountainous terrain were mostly trig-gered by heavy rainfall that increased the pore pressureof soil in the near-subsurface, with an attendant decreasein its shear strength. Under these conditions, precipitation-induced landslides caused translational mass movements thatoccurred suddenly.
In order to understand when and where rainfall-inducedlandslides have occurred in mountainous regions, and howtopographic, geotechnical and hydraulic parameters affectthe initiation of landslides and might be used to predictthem, models adopting both empirical and deterministic ap-proaches have been used.
SMORPH (Shaw and Johnson, 1995), which stands forSlope MORPHology, is an empirical model adapted to in-clude the contributing area with creeping process. One ad-vantage of this model is that it only uses parameters derivedfrom a digital elevation model (DEM) to calculate suscepti-bility, and does not require field mapping.
In contrast, physically based or deterministic models aremore frequently used for specific catchments, because thereare physical descriptions that can be used to inform math-ematical equations about slope failure processes. Five suchmodels are introduced below, and compared with TransientRainfall Infiltration and Grid-based Regional Slope-stabilityanalysis (TRIGRS), the model upon which this work is fo-cused.
LISA (Hammond et al., 1992) stands for Level I StabilityAnalysis. It identifies the effects of the tree root strength andtree surcharge on slope stability as an important parameter offorested, hill-slope areas. LISA enables the user to computethe probability of slope failure using up to 1000 iterations ofa Monte Carlo simulation, by varying input values involvedin the infinite slope equation. The Monte Carlo simulationestimates the probability of failure rather than a single factorof safety value.
SHALSTAB (Dietrich et al., 1993, 1995; Montgomery andDietrich, 1994; Montgomery et al., 1998) stands for ShallowSlope Stability Model. It is a coupled, steady-state runoff andinfinite-slope stability model which can be used to map therelative potential for shallow sliding. The model has been im-proved by various fellow scientists. As a result, this modelcorrectly predicts the observed tendency for soils to be thickin the un-channelled valleys and thin on ridges (Dietrich etal., 1995).
The dSLAM (Wu and Sidle 1995; Dhakal and Sidle,2003), distributed Shallow Landslide Analysis Model, is adistributed, physically based model that combines an infi-nite slope model, a kinematic wave groundwater model, anda model simulating continuous changes in vegetation rootstrength, to analyse shallow, rapid landslides. This also in-cludes results on the spatial distribution of safety factors insteep, forested terrain. This model is characterized by its fo-cus on the stochastic influence of rainfall on pore water pres-sure.
SHETRAN (Ewen et al., 2000; Birkinshaw et al., 2010),which stands for System Hydrology European TRANsport,provides a hydrological and sediment transport frameworkfor simulating landslides triggered by rain and snowmelt,along with sediment yield. In this model, the occurrence ofshallow landslides is predicted as a function of the time-and space-varying soil saturation conditions, using an infi-nite slope model for safety analysis.
SINMAP (Pack et al., 1998, 2001), for Stability INdexMAPping, was developed in British Columbia with the sup-port of the Canadian government. Compared to other models,the slope stability model SINMAP has merit in that it calcu-lates the potential slide risk for shallow translational slidesvia the specific-slope water balance (Chinnayakanahalli,2004).
TRIGRS (Baum et al., 2002, 2008) stands for Tran-sient Rainfall Infiltration and Grid-based Regional Slope-stability. It is written in FORTRAN code and based on Iver-son’s (2000) linearized solution of the Richards equation,and the extension of that solution. The TRIGRS model, usedfor either saturated or unsaturated soils, is able to improvethe effectiveness of susceptibility analysis by accounting forthe transient effects of varying rainfall on conditions affect-ing slope stability. It has been used successfully around theworld for quantitatively evaluating rainfall-triggered land-slides, and a number of those applications follow.
1. TRIGRS was used in a case study to account for thetransient effects of rainfall on shallow landslide initi-ation, and verified with pilot catchments. Some exam-ples include the Seattle area, Washington, USA (Godtet al., 2008); Mt. Tenliao, Taipei, Taiwan (Chen etal., 2005); and Mt. Gyemyeong, Yangju, South Korea(Kim et al., 2010).
2. TRIGRS was used to evaluate and compare otherphysically based models including SLIP (Montrasio,2011), SHALSTAB (Sorbino, 2010), SINMAP andLISA (Morrisey et al., 2001). The latter mentioned thatIverson’s model, which is the basis of TRIGRS, wouldbe preferred among the three models described above,because only Iverson’s transient response model canassess stability conditions as a function of time anddepth, on a regional scale, in areas prone to rainfall-induced landslide.
3. Some researchers have focused on parametric analysesto estimate material properties (Salciarini et al., 2006;Vieira, 2010). They proved that reasonable approxima-tions of soil parameters, based on a limited number ofmeasurements in the study area, were able to producesatisfactory results.
4. The TRIGRS model was augmented with a statisticaltechnique. In the probabilistic approach with TRIGRS,the simulated landslide potential map created was gen-erally comparable to field observations when using the
Nat. Hazards Earth Syst. Sci., 13, 2833–2849, 2013 www.nat-hazards-earth-syst-sci.net/13/2833/2013/

D. W. Park et al.: Landslide and debris flow susceptibility zonation 2835
Monte Carlo simulation (Liu and Wu, 2008) and thegeneral extreme value probability distribution (Salcia-rini et al., 2008).
5. TRIGRS code has been revised and converted forspecific purposes. There is a probabilistic version,TRIGRS-P (Raia et al., 2013), and a Matlab version,MaTRIGRS (Liao et al., 2011). TRIGRS-P adopts astochastic approach to compute and input parametersto be sampled randomly from a given probability dis-tribution. MaTRIGRS offers unique computational ef-ficiency in multi-dimensional matrix data and in real-time visualization of the simulation during modelling.
The shallow landslide often is mobilized into debris flow, andhence it is necessary to conduct a study into the mechanismand factors governing this process using a coupled method-ology. Many researchers have previously conducted studiesinto the debris flow mobilization from shallow landslide bycombining the pre-failure and post-failure process using asingle model or two different models.
Chiang et al. (2012) proposed a coupled model to sim-ulate landslide-induced debris flow at watershed level. Themodel combines a landslide susceptibility model to predictlandslide, an empirical model to select debris flow initia-tion points among predicted landslide area and a debris flowmodel to simulate the spread and inundated region of failedmaterials from the identified source areas.
Gomes et al. (2013) used the numerical models with anempirical procedure using back analysis data. They con-ducted landslide and debris flow analysis using the follow-ing steps: (a) detection of landslide-susceptible areas fromthe SHALSTAB model; (b) estimation of rheological pa-rameters of debris flow using back analysis technique; and(c) combination of SHALSTAB and FLO-2-D to model de-bris flow spreading area. The combination of two physicallybased models was able to simulate both landslides and debrisflow events.
Wang et al. (2013) integrated two major movement modesof slope failure: landslide and debris flow using dynamic pro-cess across 3-D terrains. First, the revised Hovland 3-D limitequilibrium model based on a geographic information sys-tem (GIS) was used to model the movement and stoppageof a landslide. In this step, they calculated the 3-D factor ofsafety step by step during the sliding. They defined stoppagefor the factor of safety much greater than one and the velocityequal to zero. Also, a GIS-based depth averaged 2-D numer-ical model was used to predict the inundated area as well asrun-out distance of debris flow.
The main objective of this study was to predict shallow,rainfall-triggered landslides using TRIGRS, in the region ofWoomyeon Mountain. The landslide ratio of each predictedclass of safety factors was employed in evaluating the per-formance of the landslide model. Finally, this paper dis-cusses the applicability of the flow routing model and then
Fig. 1.Location map of the Mt. Woomyeon region in South Korea.
concludes with a discussion of the effectiveness of this ap-proach and the potential for further research.
2 Study area
The study area was Woomyeon Mountain, which is locatedin the Seocho district of Seoul City, South Korea (Fig. 1). It islocated at 37◦27′00′′–37◦28′55′′ N latitude and 126◦59′02′′–127◦01′41′′ E longitude. The elevation of Woomyeon Moun-tain is 293 m above sea level. Completely encircled by build-ings and roads, this area measures 5 104 162 m−2 and is pre-dominantly covered by forest, mostly oak trees.
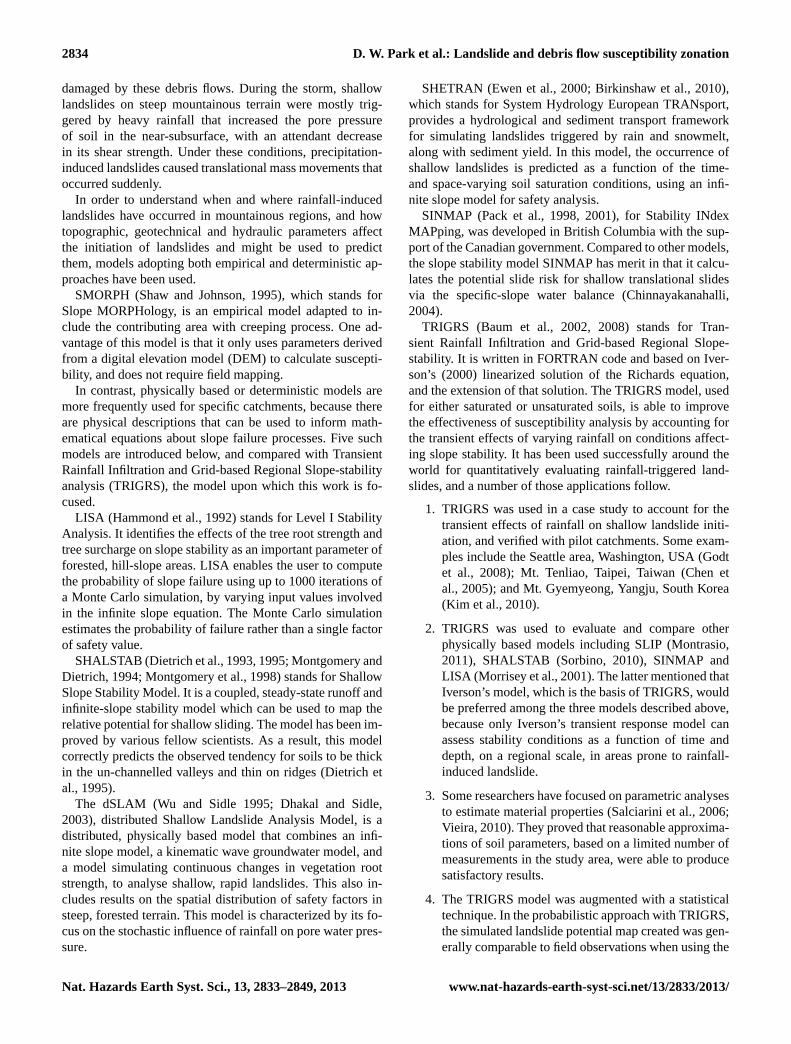
The Mt. Woomyeon range is basically composed of pre-Cambrian banded biotite gneiss and granitic gneiss as de-picted in Fig. 2. The banded biotite gneiss is moderatelyweathered and has stripes called gneissic banding, which de-velops under conditions of high temperature and pressure.
www.nat-hazards-earth-syst-sci.net/13/2833/2013/ Nat. Hazards Earth Syst. Sci., 13, 2833–2849, 2013
2836 D. W. Park et al.: Landslide and debris flow susceptibility zonation
Fig. 2.Geological map of the study area.
Because of the gneissic banding, it is clear that the study areahas been exposed to extreme shearing.
The soil profile can be divided into three main layers (Ko-rean Geotechnical Society, 2011):
1. A colluvium layer extends to a maximum depth of3.0 m from the ground level, and the upper part ofthis layer was formed from previously transported soil.This layer is generally loose material composed ofgravel and silty sand, according to the Unified SoilClassification System (USCS), a heterogeneous, inco-herent and permeable soil.
2. A transition zone is composed of mainly a clay layer(thickness is 0.2 m to 0.5 m below colluvium layer)characterized by the colours taupe and dark brown.It was anticipated that landslides would be generatedby conditions in this layer between the colluvium andbedrock.
3. A subsoil of stiff weathered bedrock is followed by aclay layer. This subsoil layer can be considered im-pervious according to the low hydraulic conductivityindicated by the modelling that follows.
3 Landslide event
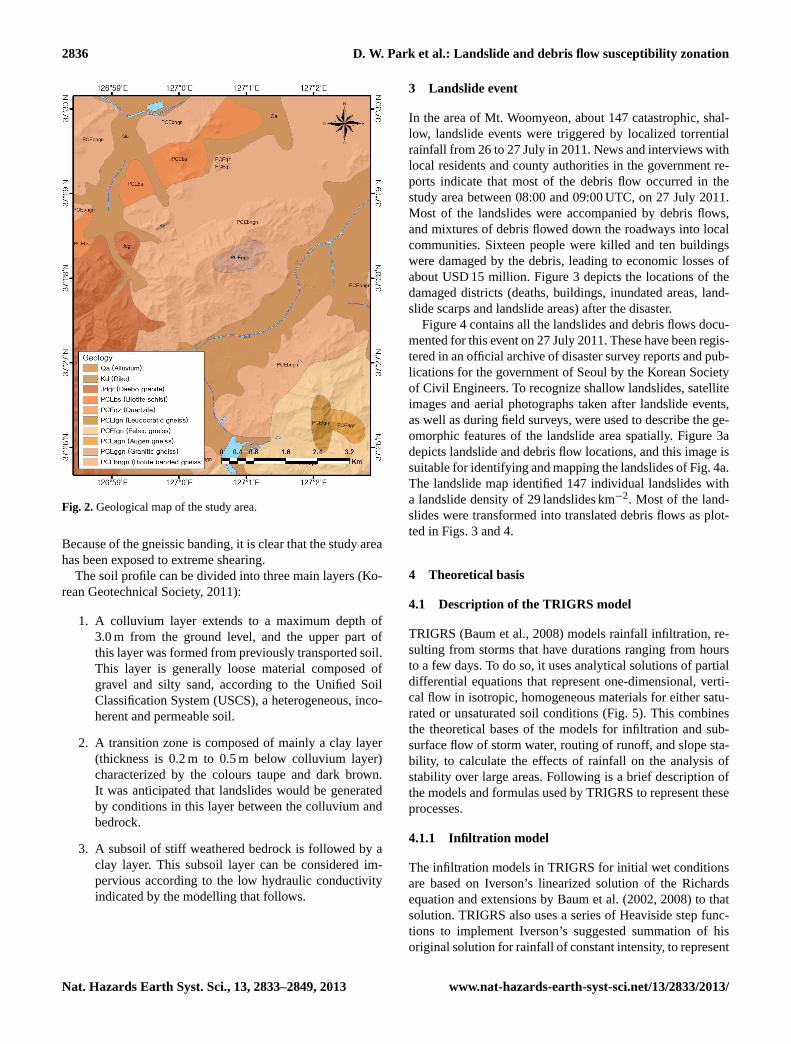
In the area of Mt. Woomyeon, about 147 catastrophic, shal-low, landslide events were triggered by localized torrentialrainfall from 26 to 27 July in 2011. News and interviews withlocal residents and county authorities in the government re-ports indicate that most of the debris flow occurred in thestudy area between 08:00 and 09:00 UTC, on 27 July 2011.Most of the landslides were accompanied by debris flows,and mixtures of debris flowed down the roadways into localcommunities. Sixteen people were killed and ten buildingswere damaged by the debris, leading to economic losses ofabout USD 15 million. Figure 3 depicts the locations of thedamaged districts (deaths, buildings, inundated areas, land-slide scarps and landslide areas) after the disaster.
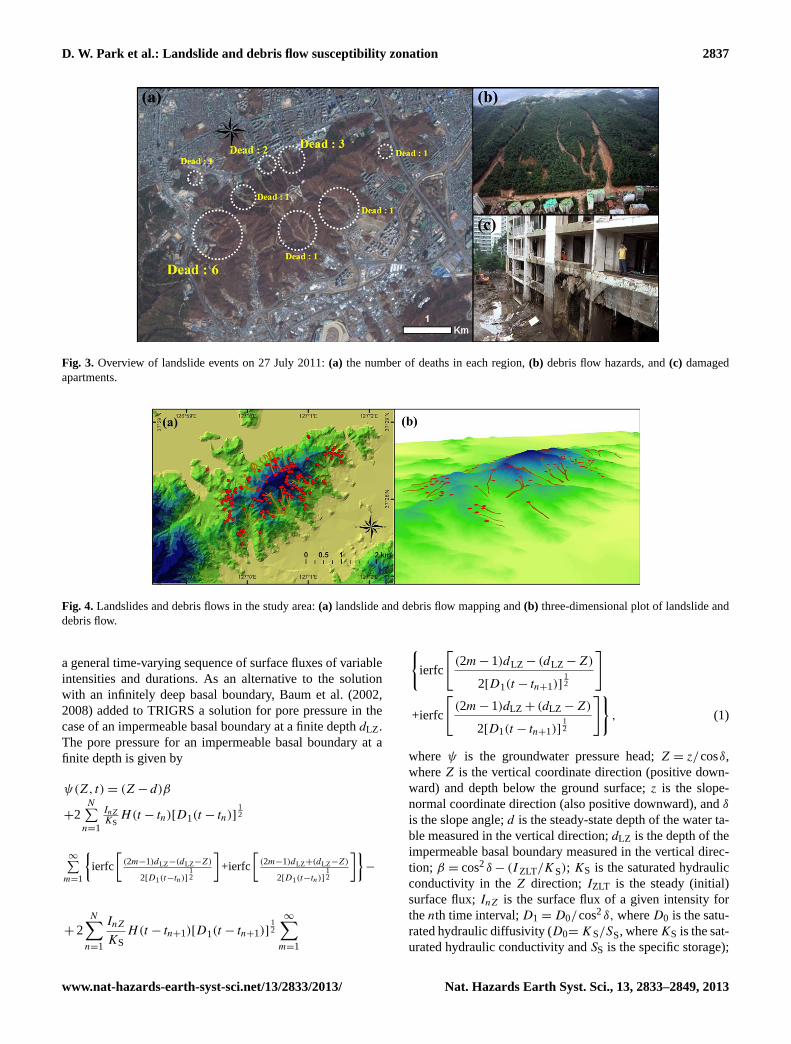
Figure 4 contains all the landslides and debris flows docu-mented for this event on 27 July 2011. These have been regis-tered in an official archive of disaster survey reports and pub-lications for the government of Seoul by the Korean Societyof Civil Engineers. To recognize shallow landslides, satelliteimages and aerial photographs taken after landslide events,as well as during field surveys, were used to describe the ge-omorphic features of the landslide area spatially. Figure 3adepicts landslide and debris flow locations, and this image issuitable for identifying and mapping the landslides of Fig. 4a.The landslide map identified 147 individual landslides witha landslide density of 29 landslides km−2. Most of the land-slides were transformed into translated debris flows as plot-ted in Figs. 3 and 4.
4 Theoretical basis
4.1 Description of the TRIGRS model
TRIGRS (Baum et al., 2008) models rainfall infiltration, re-sulting from storms that have durations ranging from hoursto a few days. To do so, it uses analytical solutions of partialdifferential equations that represent one-dimensional, verti-cal flow in isotropic, homogeneous materials for either satu-rated or unsaturated soil conditions (Fig. 5). This combinesthe theoretical bases of the models for infiltration and sub-surface flow of storm water, routing of runoff, and slope sta-bility, to calculate the effects of rainfall on the analysis ofstability over large areas. Following is a brief description ofthe models and formulas used by TRIGRS to represent theseprocesses.
4.1.1 Infiltration model
The infiltration models in TRIGRS for initial wet conditionsare based on Iverson’s linearized solution of the Richardsequation and extensions by Baum et al. (2002, 2008) to thatsolution. TRIGRS also uses a series of Heaviside step func-tions to implement Iverson’s suggested summation of hisoriginal solution for rainfall of constant intensity, to represent
Nat. Hazards Earth Syst. Sci., 13, 2833–2849, 2013 www.nat-hazards-earth-syst-sci.net/13/2833/2013/
D. W. Park et al.: Landslide and debris flow susceptibility zonation 2837
Fig. 3. Overview of landslide events on 27 July 2011:(a) the number of deaths in each region,(b) debris flow hazards, and(c) damagedapartments.
Fig. 4. Landslides and debris flows in the study area:(a) landslide and debris flow mapping and(b) three-dimensional plot of landslide anddebris flow.
a general time-varying sequence of surface fluxes of variableintensities and durations. As an alternative to the solutionwith an infinitely deep basal boundary, Baum et al. (2002,2008) added to TRIGRS a solution for pore pressure in thecase of an impermeable basal boundary at a finite depthdLZ .The pore pressure for an impermeable basal boundary at afinite depth is given by
ψ(Z,t)= (Z− d)β
+2N∑n=1
InZKSH(t − tn)[D1(t − tn)]
12
∞∑m=1
{ierfc
[(2m−1)dLZ−(dLZ−Z)
2[D1(t−tn)]12
]+ierfc
[(2m−1)dLZ+(dLZ−Z)
2[D1(t−tn)]12
]}−
+ 2N∑n=1
InZ
KSH(t − tn+1)[D1(t − tn+1)]
12
∞∑m=1
{ierfc
[(2m− 1)dLZ − (dLZ −Z)
2[D1(t − tn+1)]12
]
+ierfc
[(2m− 1)dLZ + (dLZ −Z)
2[D1(t − tn+1)]12
]}, (1)
whereψ is the groundwater pressure head;Z = z/cosδ,whereZ is the vertical coordinate direction (positive down-ward) and depth below the ground surface;z is the slope-normal coordinate direction (also positive downward), andδ
is the slope angle;d is the steady-state depth of the water ta-ble measured in the vertical direction;dLZ is the depth of theimpermeable basal boundary measured in the vertical direc-tion; β = cos2δ− (IZLT/KS); KS is the saturated hydraulicconductivity in theZ direction; IZLT is the steady (initial)surface flux;InZ is the surface flux of a given intensity forthenth time interval;D1 =D0/cos2δ, whereD0 is the satu-rated hydraulic diffusivity (D0=KS/SS, whereKS is the sat-urated hydraulic conductivity andSS is the specific storage);
www.nat-hazards-earth-syst-sci.net/13/2833/2013/ Nat. Hazards Earth Syst. Sci., 13, 2833–2849, 2013

2838 D. W. Park et al.: Landslide and debris flow susceptibility zonation
Fig. 5.Conceptual diagram of the TRIGRS model.
N is the total number of time intervals;H(t−tn) is the Heav-iside step function andtn is the time at thenth time interval inthe rainfall infiltration sequence; erfc(η) is the complemen-tary error function: ierfc(η)=
1√π
exp(−η2)− ηerfc(η) m isindex of infinite series displaying an odd term in comple-mentary error function.
4.1.2 Slope stability model
The model of slope stability, using an infinite-slope stabil-ity analysis, is characterized by the ratio of resisting frictionto gravitationally induced downslope driving stress. FS<1denotes unstable conditions, and the depthZ where FS firstdrops below “1” will be the depth of landslide initiation. Theequation to calculate the safety factor of the slope accord-ing to the infiltration of rainfall for an infinite slope model isgiven by
FS(Z, t)=tanφ′
tanδ+c′ −ψ(Z,t)γWtanφ′
γSZ sinδ cosδ, (2)
wherec′ is soil cohesion for effective stress;φ′ is the soil fric-tion angle for effective stress;γW is unit weight of ground-water;γS is unit weight of soil.
4.1.3 Runoff model
TRIGRS computes the infiltration of each cell. The amountof infiltration,I , is the sum of the precipitation,P , and runofffrom adjacent cells,Ru, if the infiltration cannot exceed thesaturated hydraulic conductivity,KS, as
I =P +RuKS
,
,
P +Ru ≤KSP +Ru >KS.
(3)
The runoff,Rd , is calculated by the following equation:
Rd =P +Ru−KS
0,
,
P +Ru−KS ≥ 0P +Ru−KS< 0.
(4)
Fig. 6.D8 ESRI direction code overview.
Further theoretical details of the model have been fullydescribed in TRIGRS open file reports (Baum et al., 2002,2008).
4.2 Description of the flow routing model
The model TRIGRS uses a method for routing runoff flowcell by cell in the mass balance calculations. Several meth-ods for the representation of flow directions, using rectangu-lar grid digital elevation models, are presented later, alongwith flow routing features. Figure 6 shows the designationof the eight flow directions used by following flow routingmodel, and the numbering scheme according to ESRI direc-tion codes in ArcGIS. This approach is commonly referredto as an eight-direction (D8) flow model because of the eightvalid output directions relating to the eight adjacent cells intowhich flow could travel. Based on the grid DEM, there aremany models for predicting the flow.
4.2.1 The D8 method
The earliest and simplest method for estimating flow direc-tions is to distribute flow from each cell to one of its eightneighbours, on the steepest downslope path. That is, flowis diverted only to the one neighbouring cell that is on thesteepest direction. This model, named the D8 method, wassuggested by O’Callaghan and Mark (1984), and has beenwidely used. In the D8 method approach, however, the re-sulting flow distribution is irregular and somewhat unreal-istic, because flow can occur in only the steepest direction,either adjacent or diagonally, of eight possible directions.
4.2.2 The multiple flow direction method
Multiple flow direction method (Quinn, 1991) offers ad-vancement over the D8 method (restricts flow to one amongeight possible directions). The fraction of the flow througheach grid cell to each downslope direction is proportional tothe gradient of each downhill flow path, so that steeper gra-dients will naturally attract more of the flow. All cells sur-rounding the central point can be flow directions if they have
Nat. Hazards Earth Syst. Sci., 13, 2833–2849, 2013 www.nat-hazards-earth-syst-sci.net/13/2833/2013/

D. W. Park et al.: Landslide and debris flow susceptibility zonation 2839
Fig. 7.Concept diagram of D-infinity method.
lower elevations than the initial one. The pattern, of course,becomes more strongly concentrated toward the steepestdownslope path. Equation (5) expresses the relative amountsfor the downhill directions.
1Ai = A(tanβiLi)/n∑j=1
(tanβjLj ), (5)
wheren is the total number of downhill directions;1Ai isthe amount passed onto theith downhill cell;A is the to-tal upslope area accumulated in the current cell; tanβi is thegradient (difference in elevation/distance between the eleva-tion values) in theith downhill directions;Li is the contourlength of theith direction either cardinal or diagonal.
4.2.3 The D-infinity method
Tarboton’s D-infinity method (Tarboton, 1997) assumes thatwater flows down one or two cells by partitioning the flowbetween the two cells nearest to the steepest slope direction.Figure 7 illustrates the calculation of flow directions. The sin-gle flow direction is determined by the steepest downwardsslope among the eight triangular facets. This direction is cal-culated by apportioning flow between two downslope pix-els according to how close the flow direction is to the directangle to the downslope pixel. In other words, the procedureis based on representing the flow direction as a single angletaken as the steepest downwards slope among the eight tri-angular facets. Like for the multiple flow direction method,some dispersion is generated by the proportioning of flowbetween downslope cells, but this is minimized since flow isnever diverted to more than two downslope cells. Comparedto other models, the D-infinity method was preferred becauseit is physically more realistic. The D-infinity method is alsoused in the program SINMAP.
Table 1 presents a summary of the flow routing methodsused in simulations. The TRIGRS runoff module is used tocompare the flow direction routing models above, with theobserved debris flow routes in the study area.
5 Application of the model
5.1 Rainfall characteristics
There are two meteorological monitoring stations (Namhyunand Seocho) near the Mt. Woomyeon region. All weather sta-tions are operated by the Korea Meteorological Administra-tion.
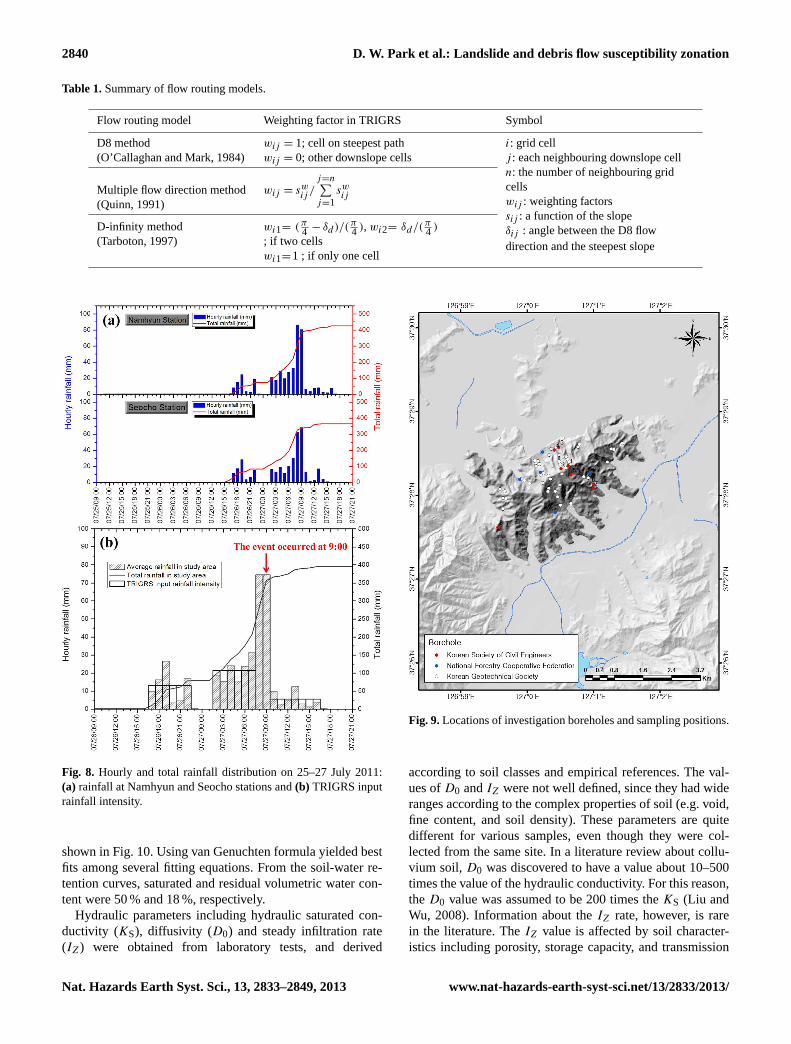
The rainfall distribution in the study area is mainlycharacterized by an average annual rainfall of 1400–1500 mm, which is highest in July and lowest in January.The precipitation conditions occurring in July 2011, how-ever, were significantly different from the average. Dur-ing July alone, Mt. Woomyeon received about 55 % ofits total annual precipitation of 2039 mm. Hourly maxi-mum rainfalls were 114 mm h−1 (07:44–08:44 on 27 July)and 87 mm h−1 (07:41–08:41 on 27 July). The first recordwas at Namhyun Station, the second one at Seocho Sta-tion. From the intensity–duration–frequency (IDF) curves forSeoul City, the rainfall recurrence intervals were 120 and20 yr, respectively.
Figure 8 shows the hourly rainfall history from 25 July to27 July in 2011. Shallow landslides were triggered by the lo-calized torrential rainfall during this period, characterized bya cumulative rainfall of about 350 mm, of which 42 % poureddown during the last 2 h (06:00–09:00) before the failures.The landslides started at 09:00 on 27 July.
5.2 Input parameters
Many important parameters are involved in the TRIGRSmodel, for example, topographic factors, soil thickness, aswell as strength properties and hydraulic parameters of thesoil. Accuracy and reliability of the results depend mainly ondetailed knowledge of the study site, and on the quality ofthe input parameters.
For Mt. Woomyeon, topographic analyses for elevation,slope angle and aspect were calculated from 1: 5000 mapsdeveloped by the National Geographic Information Institute.ArcGIS was used to create grids with 10 m cells and to quan-tify the aforementioned information above for each cell ofthe DEM.
All available data were obtained from the engineering ge-ological investigation for landslides hazard restoration workconducted by the National Forestry Cooperative Federation,Korean Society of Civil Engineers and Korean GeotechnicalSociety. After the landslides occurred on 27 July, a total of58 geotechnical investigation boreholes were drilled for col-lecting soil, hydrologic and geological information. Amongthese, available data from 13 boreholes and 19 soil sampleswere used in this analysis. Based on the wide database, theaverage values were used. The locations of the investiga-tion boreholes and profiles are depicted in Fig. 9. Determina-tion of the soil water characteristic curve was accomplishedby using pressure plate extractor and filter paper method as
www.nat-hazards-earth-syst-sci.net/13/2833/2013/ Nat. Hazards Earth Syst. Sci., 13, 2833–2849, 2013
2840 D. W. Park et al.: Landslide and debris flow susceptibility zonation
Table 1.Summary of flow routing models.
Flow routing model Weighting factor in TRIGRS Symbol
D8 method(O’Callaghan and Mark, 1984)
wij = 1; cell on steepest pathwij = 0; other downslope cells
i: grid cellj : each neighbouring downslope celln: the number of neighbouring gridcellswij : weighting factorssij : a function of the slopeδij : angle between the D8 flowdirection and the steepest slope
Multiple flow direction method(Quinn, 1991)
wij = swij/j=n∑j=1
swij
D-infinity method(Tarboton, 1997)
wi1= (π4 − δd )/(π4 ), wi2= δd/(
π4 )
; if two cellswi1=1 ; if only one cell
Fig. 8. Hourly and total rainfall distribution on 25–27 July 2011:(a) rainfall at Namhyun and Seocho stations and(b) TRIGRS inputrainfall intensity.
shown in Fig. 10. Using van Genuchten formula yielded bestfits among several fitting equations. From the soil-water re-tention curves, saturated and residual volumetric water con-tent were 50 % and 18 %, respectively.
Hydraulic parameters including hydraulic saturated con-ductivity (KS), diffusivity (D0) and steady infiltration rate(IZ) were obtained from laboratory tests, and derived
Fig. 9.Locations of investigation boreholes and sampling positions.
according to soil classes and empirical references. The val-ues ofD0 andIZ were not well defined, since they had wideranges according to the complex properties of soil (e.g. void,fine content, and soil density). These parameters are quitedifferent for various samples, even though they were col-lected from the same site. In a literature review about collu-vium soil,D0 was discovered to have a value about 10–500times the value of the hydraulic conductivity. For this reason,theD0 value was assumed to be 200 times theKS (Liu andWu, 2008). Information about theIZ rate, however, is rarein the literature. TheIZ value is affected by soil character-istics including porosity, storage capacity, and transmission
Nat. Hazards Earth Syst. Sci., 13, 2833–2849, 2013 www.nat-hazards-earth-syst-sci.net/13/2833/2013/

D. W. Park et al.: Landslide and debris flow susceptibility zonation 2841
Fig. 10.Soil water characteristic curve in study area.
rate through the soil. The soil texture and structure, vegeta-tion types and cover, water content of the soil and soil tem-perature also play a role in controlling the infiltration rate. Ifthe soil is saturated,IZ can be the same as hydraulic conduc-tivity, while it can be zero for dry soil. In this research, thereasonable value 0.01 of theKS (Salciarini et al., 2008; Liuand Wu, 2008; Kim et al., 2010) was selected forIZ becauseof the hot, dry conditions during the summer of this event.
In the simulations carried out in this study, a uniform soildepth of 2 m was considered based on site investigation re-ports (Korean Geotechnical Society, 2011), and it conformsto several studies which show that most of shallow landslidesin the mountainous regions of South Korea are observed be-tween 1 and 3 m. The initial groundwater table is set at thesame depth of soil thickness due to no heavy antecedent rain-fall before the event and hot dry conditions during the sum-mer of this event (Kim et al., 2010).
The input values, and units of the parameters for analysis,are listed in Table 2.
5.3 Debris flow routing module
The runoff routing module is an optional flow routing algo-rithm embedded in the TRIGRS model. The analysis timewith runoff calculation is almost the same as without runoffcalculation analysis case, since the module requires smallcomputational effort.
ArcGIS was used for the preparation of the input dataDEM and DIRECTION needed for runoff routing in TRI-GRS. This is because the input parameters need to be con-structed into a spatial database in a GIS platform. Thenext step involves the determination of the flow distribu-tion weighting factors. By changing the weighting factor, theuser can control the width of flow and direction algorithmsas mentioned previously (Table 1). Once a topographic dataset and routing method are selected for a study area, themaximum number of iterations is set up to apply the runoff
Table 2.Summary of values used in simulations.
Parameter (unit) Value
Friction angle,φ (◦) 29.63Cohesion,c (kPa) 10.17Total unit weight of soil,γs (KN/ m3 ) 18.38Hydraulic conductivity of saturated,KS (m s−1) 1.3× 10⁻⁵
Saturated volumetric water content,θs 0.5Residual volumetric water content,θr 0.18Hydraulic diffusivity,D0 (m2 s−1) 200KSSteady infiltration rate,IZ (m s−1) 0.01KS
module. The reason for setting the maximum number of iter-ations is to allow the module to stop after a reasonable timeperiod, because in the case of DEM it is not hydrologicallyconsistent and sometimes it cannot converge.
Further details of the module have been fully described inTRIGRS open file reports (Baum et al., 2002, 2008).
6 Results and discussion
6.1 Elevation, slope, aspect and curvature
The simulations described below were carried out at two lev-els: (i) considering landslides of the study area where 147shallow landslides occurred during an intense rainfall eventin July 2011, and (ii) taking into account the debris flowroutes, but not debris mass, velocity and deposits.
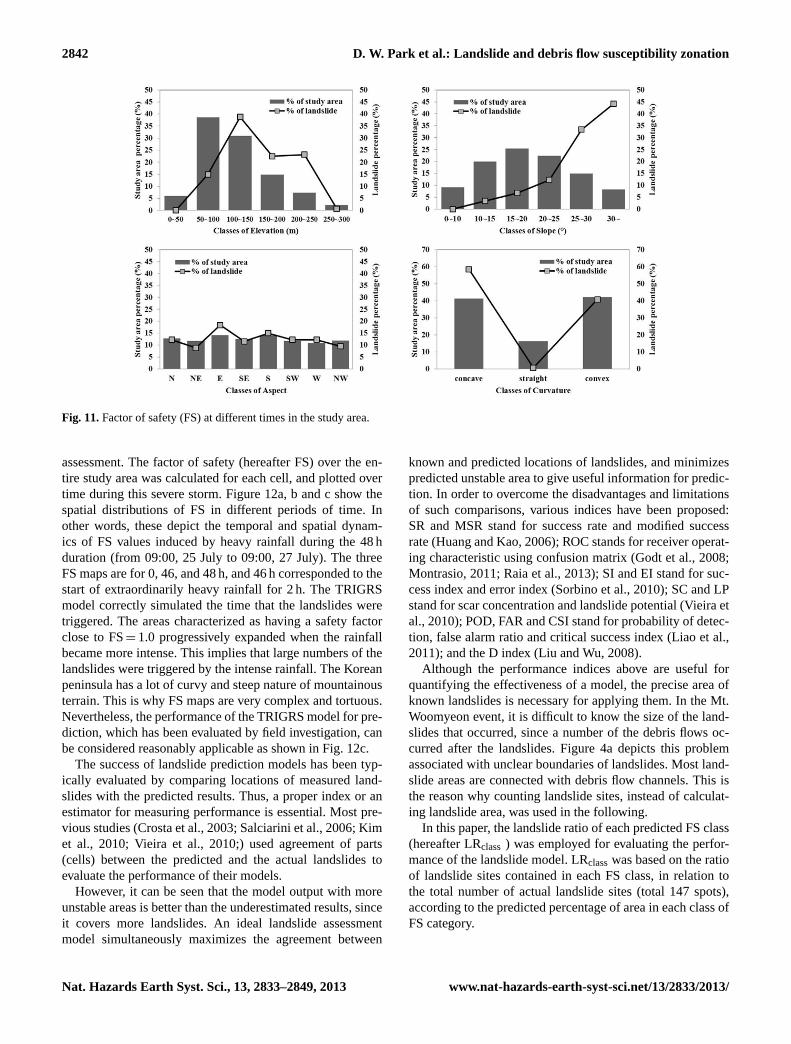
In the study area, elevation, slope, aspect and curvature, allof which are relevant to landslides, were calculated from to-pographic information. These results for both the study areaand the landslide occurrence points are shown in Fig. 11. Bargraphs represent the percentage of the area of each category,in relation to the total study area. Polygonal lines are the ra-tio of the number of landslides in each category, in relationto the total number of landslides.
Seventy percent of the study area was between 50 m and150 m elevation, and 67 % of the slope angles were between10 and 25 degrees. Most of the landslides were triggeredon terrain with mid- to high altitudes ranging from 100 to250 m (average 119 m), and on steeper slopes (>25◦, aver-age slope angle of the study area: 19◦). The aspect ratios ineach category were similar to each other while the largestlandslide orientation was east with 18 %. Curvature graphshowed nearly the same number of concave and convex pro-files in the study area, but concave was predominant in failurespots.
6.2 Prediction of landslides
One main objective of this research is to evaluate the spatio-temporal predictability of landslide events in Mt. Woomyeonusing the TRIGRS model for regional landslide hazard
www.nat-hazards-earth-syst-sci.net/13/2833/2013/ Nat. Hazards Earth Syst. Sci., 13, 2833–2849, 2013
2842 D. W. Park et al.: Landslide and debris flow susceptibility zonation
Fig. 11.Factor of safety (FS) at different times in the study area.
assessment. The factor of safety (hereafter FS) over the en-tire study area was calculated for each cell, and plotted overtime during this severe storm. Figure 12a, b and c show thespatial distributions of FS in different periods of time. Inother words, these depict the temporal and spatial dynam-ics of FS values induced by heavy rainfall during the 48 hduration (from 09:00, 25 July to 09:00, 27 July). The threeFS maps are for 0, 46, and 48 h, and 46 h corresponded to thestart of extraordinarily heavy rainfall for 2 h. The TRIGRSmodel correctly simulated the time that the landslides weretriggered. The areas characterized as having a safety factorclose to FS= 1.0 progressively expanded when the rainfallbecame more intense. This implies that large numbers of thelandslides were triggered by the intense rainfall. The Koreanpeninsula has a lot of curvy and steep nature of mountainousterrain. This is why FS maps are very complex and tortuous.Nevertheless, the performance of the TRIGRS model for pre-diction, which has been evaluated by field investigation, canbe considered reasonably applicable as shown in Fig. 12c.
The success of landslide prediction models has been typ-ically evaluated by comparing locations of measured land-slides with the predicted results. Thus, a proper index or anestimator for measuring performance is essential. Most pre-vious studies (Crosta et al., 2003; Salciarini et al., 2006; Kimet al., 2010; Vieira et al., 2010;) used agreement of parts(cells) between the predicted and the actual landslides toevaluate the performance of their models.
However, it can be seen that the model output with moreunstable areas is better than the underestimated results, sinceit covers more landslides. An ideal landslide assessmentmodel simultaneously maximizes the agreement between
known and predicted locations of landslides, and minimizespredicted unstable area to give useful information for predic-tion. In order to overcome the disadvantages and limitationsof such comparisons, various indices have been proposed:SR and MSR stand for success rate and modified successrate (Huang and Kao, 2006); ROC stands for receiver operat-ing characteristic using confusion matrix (Godt et al., 2008;Montrasio, 2011; Raia et al., 2013); SI and EI stand for suc-cess index and error index (Sorbino et al., 2010); SC and LPstand for scar concentration and landslide potential (Vieira etal., 2010); POD, FAR and CSI stand for probability of detec-tion, false alarm ratio and critical success index (Liao et al.,2011); and the D index (Liu and Wu, 2008).
Although the performance indices above are useful forquantifying the effectiveness of a model, the precise area ofknown landslides is necessary for applying them. In the Mt.Woomyeon event, it is difficult to know the size of the land-slides that occurred, since a number of the debris flows oc-curred after the landslides. Figure 4a depicts this problemassociated with unclear boundaries of landslides. Most land-slide areas are connected with debris flow channels. This isthe reason why counting landslide sites, instead of calculat-ing landslide area, was used in the following.
In this paper, the landslide ratio of each predicted FS class(hereafter LRclass) was employed for evaluating the perfor-mance of the landslide model. LRclasswas based on the ratioof landslide sites contained in each FS class, in relation tothe total number of actual landslide sites (total 147 spots),according to the predicted percentage of area in each class ofFS category.
Nat. Hazards Earth Syst. Sci., 13, 2833–2849, 2013 www.nat-hazards-earth-syst-sci.net/13/2833/2013/

D. W. Park et al.: Landslide and debris flow susceptibility zonation 2843
Fig. 12.Classes of topographic parameters (elevation, slope angle,aspect and curvature) for(a) 0 h (09:00, 25 July 2011),(b) 46 h(07:00, 27 July 2011), and(c) 48 h (09:00, 27 July 2011).
Fig. 13. Relationship between saturated water content and liquidlimit of soil samples. Numbers identify samples in Table 3:(a) per-centage of predicted FS and landslide and(b) percentage of LRclass.
LRclass=% of contained landslide sites in each class of FS
% of predicted landslide areas in each class of FS. (6)
Note that in the numerator, the number of landslide sites,instead of the number of landslide cells, is used because ofthe difficulty in defining boundaries between landslides anddebris flows. The performance value derived by LRclassen-ables consideration of predicted stable areas as well as pre-dicted unstable areas, and thus substantially reduces the over-prediction of landslide potential. Unlike the numerator, thenumber of predicted and total cells is used in the denomina-tor. The numerator, also, is the same as the SR (success ratio)index.
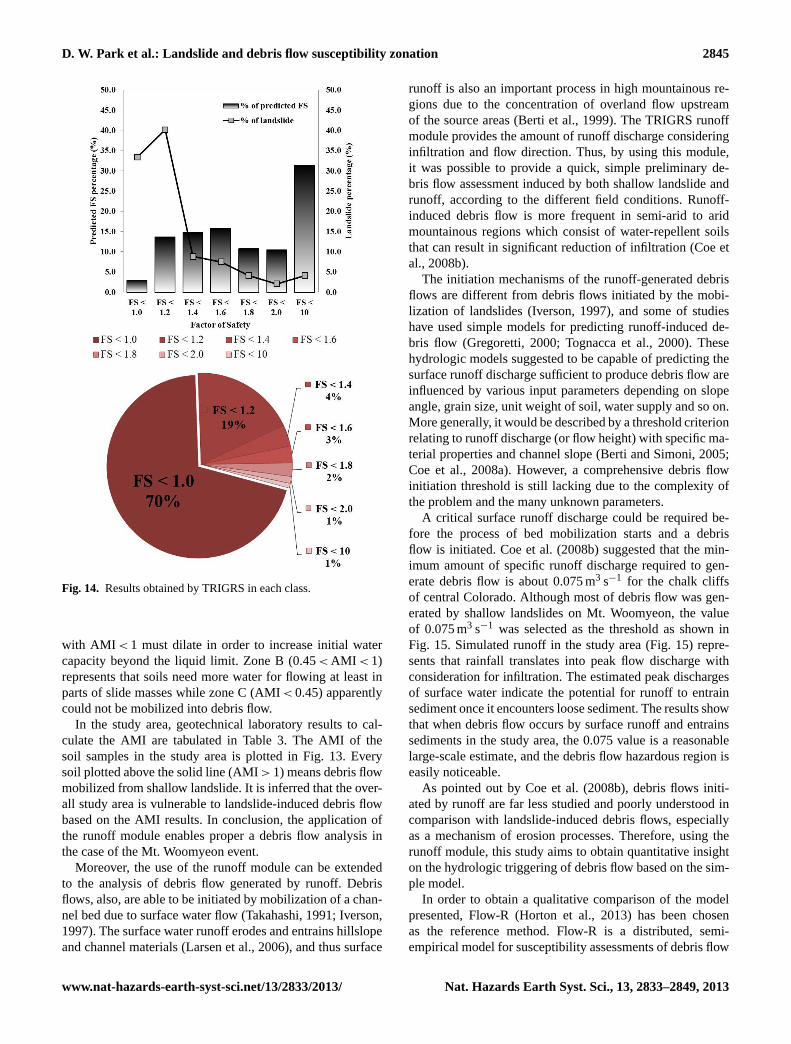
Table 4 and Fig. 14 show that 2.99 % of the area was clas-sified as unstable (FS≤ 1.0), and that 33.33 % of the actuallandslides were correctly localized within this predicted un-stable area. LRFS<1 was about 11 with 33.33 % over 2.99 %.By calculating the % of LRclass, we can get a quantitative re-sult. The percentage of LRFS<1 is 70.30 %; in other words, ifa landslide happens, then the predicted unstable area (FS<1)has 70.30 % chance of including the landslide. Also, lowersafety factor classes showed higher values of LRclass per-centages. The results show significant agreement between thesimulated and known landslide map from a quantitative pointof view, despite missing information on landslide area.
6.3 Prediction of debris flow routes
During severe storms, the failed soil mass rapidly propagatesdownslope and increases its initial volume through erosionof in-place soils producing a dangerous mobilized volume
www.nat-hazards-earth-syst-sci.net/13/2833/2013/ Nat. Hazards Earth Syst. Sci., 13, 2833–2849, 2013

2844 D. W. Park et al.: Landslide and debris flow susceptibility zonation
Table 3.Summary of geotechnical laboratory results. CL is Lean clay, SC is Clayey sand and SM is Silty sand.
No. in Water SpecificAtterberg Sieve analysis
USCS Saturated waterFigs. 9 and 13 content (%) gravity
limit (%)content (%)
LL PI #4 #10 #40 #200
1 18.2 2.73 36.6 15.4 100 99.3 85.5 51.9 CL 56.52 14.1 2.71 31.6 9.3 75.0 72.2 57.5 28.9 SC 55.43 32.1 2.64 40.6 16.9 98.3 96.2 81.9 55.7 CL 66.74 15.8 2.74 35.9 15.0 98.7 95.8 76.6 44.4 SC 60.15 21.2 2.64 41.6 18.6 87.6 85.9 74.2 55.1 CL 48.56 28.2 2.64 37.7 14.2 98.7 95.3 77.0 55.8 CL 50.97 28.1 2.65 30.2 6.4 84.4 81.3 62.1 28.8 SM 52.38 30.6 2.66 42.1 19.1 100 96.8 71.7 54.2 CL 58.0
Table 4.Summary of TRIGRS results in landslide simulations
Safety factor Landslide site % of landslide % of predicted LRclass % of LRclassclasses (a) site (c) = a/b area (d) (e) = c/d = e/f
FS≤ 1.0 49 33.33 2.99 11.14 70.301.0<FS≤ 1.2 59 40.14 13.68 2.93 18.511.2<FS≤ 1.4 13 8.84 14.76 0.60 3.781.4<FS≤ 1.6 11 7.48 15.87 0.47 2.971.6<FS≤ 1.8 6 4.08 10.77 0.38 2.391.8<FS≤ 2.0 3 2.04 10.53 0.19 1.222.0<FS 6 4.08 31.39 0.13 0.82
Sum 147 (b) 100.00 100.00 15.85 (f ) 100.00
called a debris flow. A large number of landslides evolvedinto debris flows during the torrential rainfall from 26 to27 July 2011, in Seoul, South Korea. The average length ofdebris flows in the study area was about 317.0 m, with anaverage volume of 269 m3. The biggest debris flow mappedhas a length of 632 m while the smallest is less than severaltens of metres (Korean Society of Civil Engineers and Ko-rean Geotechnical Society, 2012).
In this study, we suggested a debris flow routing methodfor the TRIGRS runoff module. This concept aims at giv-ing a prompt assessment of debris flow path analysis at aregional scale with minimum data requirement. Most debrisflow susceptibility models obviously depend on a lot of in-formation about the area of interest. Due to the complexityof debris flows relative to the modelling parameters, a sim-plified model was required for predicting flow paths on a re-gional scale.
The ability to predict debris flow using the runoff mod-ule of TRIGRS can be important for two purposes: to gainlandslide-induced debris flow susceptibility zonation andto apply the processes for debris flows that are generatedthrough runoff and erosion.
The TRIGRS runoff module is more suitable for caseswhich have high debris flow potential since the mod-ule detects every susceptibility region of debris flow. The
likelihood for a landslide to mobilize into a debris flow hasbeen assessed in various approaches. These methods usegeotechnical properties such as porosity, permeability andgrain size distribution (Iverson et al., 2000; Ellen and Flem-ing, 1987) and morphological features such as channel gra-dient, curvature and volume (Takahashi, 1981; Horton et al.,2011) controlling whether a landslide will mobilize into aflow or not.
Among them, Johnson and Rodine (1984) devised a mo-bility index (MI), which is the ratio of saturated water con-tent of the in-place soil to water content of the soil necessaryto flow in a specific channel. They found that debris flowwas more likely to occur in the case of MI>0.85, whileMI <0.85 did not produce any debris flows. Furthermore,Ellen and Fleming (1987) introduced the approximate mobil-ity index (here after AMI) by using the liquid limit. Qualita-tively, the liquid limit seems appropriate for representing theflow process since it is the water content that soil behaviouris resembling marginally fluid behaviour under shallow con-ditions. The AMI is defined as the ratio of in situ saturatedwater content to the water content at the liquid limit. In thecase of AMI>1 (case A) that plots above the solid line inFig. 13, the soils would flow easily when remolded. This isbecause these soils have initial capacity to hold more waterthan their liquid limits and also have low shear strength. Soils
Nat. Hazards Earth Syst. Sci., 13, 2833–2849, 2013 www.nat-hazards-earth-syst-sci.net/13/2833/2013/
D. W. Park et al.: Landslide and debris flow susceptibility zonation 2845
Fig. 14. Results obtained by TRIGRS in each class.
with AMI <1 must dilate in order to increase initial watercapacity beyond the liquid limit. Zone B (0.45<AMI <1)represents that soils need more water for flowing at least inparts of slide masses while zone C (AMI<0.45) apparentlycould not be mobilized into debris flow.
In the study area, geotechnical laboratory results to cal-culate the AMI are tabulated in Table 3. The AMI of thesoil samples in the study area is plotted in Fig. 13. Everysoil plotted above the solid line (AMI>1) means debris flowmobilized from shallow landslide. It is inferred that the over-all study area is vulnerable to landslide-induced debris flowbased on the AMI results. In conclusion, the application ofthe runoff module enables proper a debris flow analysis inthe case of the Mt. Woomyeon event.
Moreover, the use of the runoff module can be extendedto the analysis of debris flow generated by runoff. Debrisflows, also, are able to be initiated by mobilization of a chan-nel bed due to surface water flow (Takahashi, 1991; Iverson,1997). The surface water runoff erodes and entrains hillslopeand channel materials (Larsen et al., 2006), and thus surface
runoff is also an important process in high mountainous re-gions due to the concentration of overland flow upstreamof the source areas (Berti et al., 1999). The TRIGRS runoffmodule provides the amount of runoff discharge consideringinfiltration and flow direction. Thus, by using this module,it was possible to provide a quick, simple preliminary de-bris flow assessment induced by both shallow landslide andrunoff, according to the different field conditions. Runoff-induced debris flow is more frequent in semi-arid to aridmountainous regions which consist of water-repellent soilsthat can result in significant reduction of infiltration (Coe etal., 2008b).
The initiation mechanisms of the runoff-generated debrisflows are different from debris flows initiated by the mobi-lization of landslides (Iverson, 1997), and some of studieshave used simple models for predicting runoff-induced de-bris flow (Gregoretti, 2000; Tognacca et al., 2000). Thesehydrologic models suggested to be capable of predicting thesurface runoff discharge sufficient to produce debris flow areinfluenced by various input parameters depending on slopeangle, grain size, unit weight of soil, water supply and so on.More generally, it would be described by a threshold criterionrelating to runoff discharge (or flow height) with specific ma-terial properties and channel slope (Berti and Simoni, 2005;Coe et al., 2008a). However, a comprehensive debris flowinitiation threshold is still lacking due to the complexity ofthe problem and the many unknown parameters.
A critical surface runoff discharge could be required be-fore the process of bed mobilization starts and a debrisflow is initiated. Coe et al. (2008b) suggested that the min-imum amount of specific runoff discharge required to gen-erate debris flow is about 0.075 m3 s−1 for the chalk cliffsof central Colorado. Although most of debris flow was gen-erated by shallow landslides on Mt. Woomyeon, the valueof 0.075 m3 s−1 was selected as the threshold as shown inFig. 15. Simulated runoff in the study area (Fig. 15) repre-sents that rainfall translates into peak flow discharge withconsideration for infiltration. The estimated peak dischargesof surface water indicate the potential for runoff to entrainsediment once it encounters loose sediment. The results showthat when debris flow occurs by surface runoff and entrainssediments in the study area, the 0.075 value is a reasonablelarge-scale estimate, and the debris flow hazardous region iseasily noticeable.
As pointed out by Coe et al. (2008b), debris flows initi-ated by runoff are far less studied and poorly understood incomparison with landslide-induced debris flows, especiallyas a mechanism of erosion processes. Therefore, using therunoff module, this study aims to obtain quantitative insighton the hydrologic triggering of debris flow based on the sim-ple model.
In order to obtain a qualitative comparison of the modelpresented, Flow-R (Horton et al., 2013) has been chosenas the reference method. Flow-R is a distributed, semi-empirical model for susceptibility assessments of debris flow
www.nat-hazards-earth-syst-sci.net/13/2833/2013/ Nat. Hazards Earth Syst. Sci., 13, 2833–2849, 2013
2846 D. W. Park et al.: Landslide and debris flow susceptibility zonation
Fig. 15.Debris flow mapping and simulation results:(a) debris flow mapping in the study area,(b) Flow-R simulation result,(c) D-infinitymethod, and(d) multiple flow direction method.
developed at University of Lausanne. It assesses propaga-tions using three critical factors of sediment availability, wa-ter input and gradient (Takahashi, 1981). The following cal-ibrated parameters were used in the model: (1) flow accu-mulation and slope relationship – extreme event threshold,(2) Holmgren’s exponent – 4, (3) slope angle algorithm ofthe energy loss function – 11◦, and (4) velocity threshold –15 m s−1 (Horton et al., 2011).
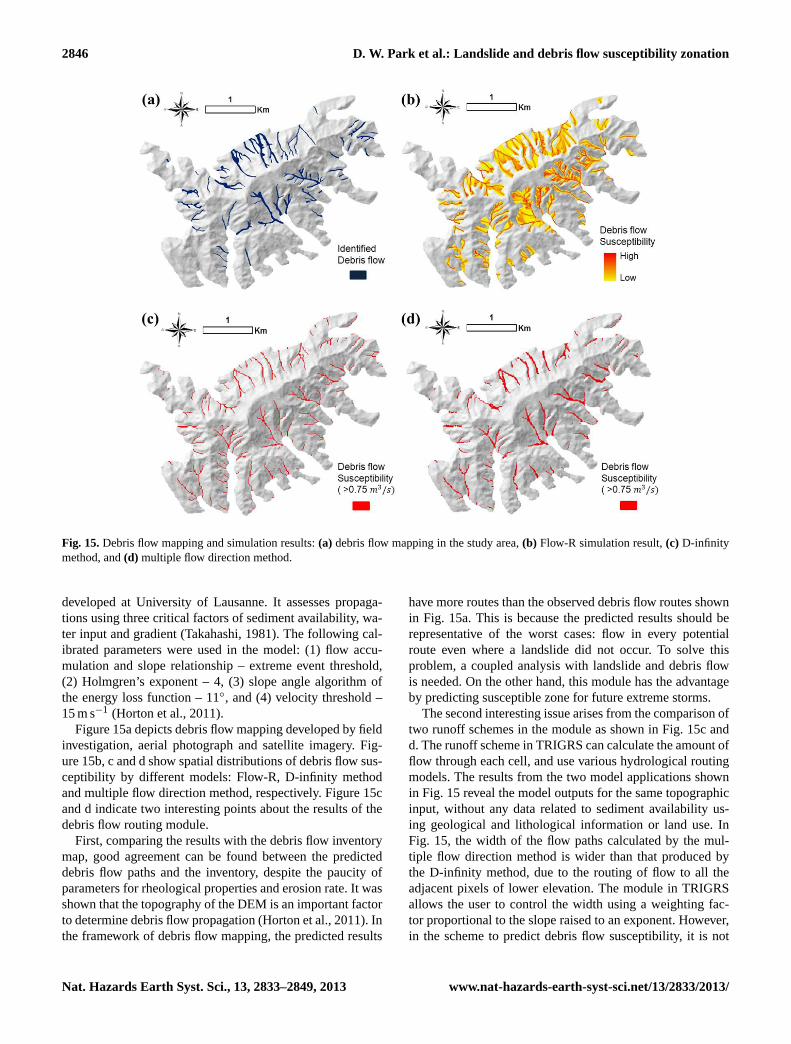
Figure 15a depicts debris flow mapping developed by fieldinvestigation, aerial photograph and satellite imagery. Fig-ure 15b, c and d show spatial distributions of debris flow sus-ceptibility by different models: Flow-R, D-infinity methodand multiple flow direction method, respectively. Figure 15cand d indicate two interesting points about the results of thedebris flow routing module.
First, comparing the results with the debris flow inventorymap, good agreement can be found between the predicteddebris flow paths and the inventory, despite the paucity ofparameters for rheological properties and erosion rate. It wasshown that the topography of the DEM is an important factorto determine debris flow propagation (Horton et al., 2011). Inthe framework of debris flow mapping, the predicted results
have more routes than the observed debris flow routes shownin Fig. 15a. This is because the predicted results should berepresentative of the worst cases: flow in every potentialroute even where a landslide did not occur. To solve thisproblem, a coupled analysis with landslide and debris flowis needed. On the other hand, this module has the advantageby predicting susceptible zone for future extreme storms.
The second interesting issue arises from the comparison oftwo runoff schemes in the module as shown in Fig. 15c andd. The runoff scheme in TRIGRS can calculate the amount offlow through each cell, and use various hydrological routingmodels. The results from the two model applications shownin Fig. 15 reveal the model outputs for the same topographicinput, without any data related to sediment availability us-ing geological and lithological information or land use. InFig. 15, the width of the flow paths calculated by the mul-tiple flow direction method is wider than that produced bythe D-infinity method, due to the routing of flow to all theadjacent pixels of lower elevation. The module in TRIGRSallows the user to control the width using a weighting fac-tor proportional to the slope raised to an exponent. However,in the scheme to predict debris flow susceptibility, it is not
Nat. Hazards Earth Syst. Sci., 13, 2833–2849, 2013 www.nat-hazards-earth-syst-sci.net/13/2833/2013/
D. W. Park et al.: Landslide and debris flow susceptibility zonation 2847
important to consider the flow width. Moreover, the moduleenables the improvement of the estimation by considering as-sessment of the propagation extent based on simple frictionallaws and spreading algorithms.
7 Conclusions
This paper presented an approach to assess rainfall-inducedshallow landslides and debris flows in a mountainous regionin Seoul, South Korea. Model simulations resulted in reason-able estimates of the mountain hazards based on a determin-istic approach.
One purpose of this paper was to suggest and verify an in-dex LRclass(landslide ratio of each predicted FS class) for apilot study. The biggest strength of this index is that it canestimate model performance quantitatively by minimizingthe overestimated area, even in landslide-debris flow regionswhere the area of landslide scars is unknown or ambiguous.According to the results, the percentage of LRclassof unstablearea is 70 %, and well reflects the effect of transient rainfall.
Another purpose was to introduce a GIS-based TRIGRSrunoff module for predicting debris flow routes. By applyinghydrological routing models, the results provide approximateinformation about debris flow routes. The operation of therunoff module was to delineate landslide-induced debris flowsusceptibility zonation and to understand the processes fordebris flows that are generated through runoff and erosion.This means that the model, originally developed for landslideassessment, has also been proved applicable for susceptibil-ity analysis of debris flow in catchments with limited dataavailability. It is noteworthy that the proposed approach isuseful when there are only a DEM and its derivative. Lastly,as demonstrated in this study, a combination of simulatedrunoff amount by heavy rain and surface water dischargethresholds can be useful in understanding and predicting de-bris flows generated by runoff and sediment entrainment.
In summary, though TRIGRS output is dependent on theresolution of DEM and precision of the geotechnical param-eters used, this paper provides a practical approach for map-ping the susceptibility to landslide and debris flow of eachpixel in an area. This kind of approach has advantages inthat (1) it considers “dynamic” (i.e. time-varying) analysisregarding the transient rainfall; (2) it provides workabilitywith very fast computation; and (3) it gives useful results forpreliminary assessments of hazards over large areas. Furtherresearch can be carried out to improve the TRIGRS modelby coupling the landslide and debris flow runoff parameters.
Acknowledgements.This study was supported by the NationalResearch Foundation of Korea under the Ministry of Education,Science, and Technology (under grant no. 2013M3A2A1054838)and Korean Ministry of Land, Transport and Maritime Affairs(MLTM) as part of the U-City Master and Doctor Course GrantProgram.
Edited by: K.-T. ChangReviewed by: two anonymous referees
References
Baum, R. L., Savage, W. Z., and Godt, J. W.: TRIGRS – a FOR-TRAN program for transient rainfall infiltration and grid-basedregional slope stability analysis, US Geological Survey Open-File Report 2002-424, 38 pp., 2002.
Baum, R. L., Savage, W. Z., and Godt, J. W.: TRIGRS – A FOR-TRAN program for transient rainfall infiltration and grid-basedregional slope stability analysis, version 2.0, US Geological Sur-vey Open-File Report 2008-1159, 75 pp., 2008.
Berti, M. and Simoni, A.: Experimental evidences and numericalmodelling of debris flow initiated by channel runoff, Landslides,2, 171–182, 2005.
Berti, M., Genevois, R., Simoni, A., and Tecca, P. R.: Field obser-vations of a debris flow event in the Dolomites, Geomorphology,29, 265–274, 1999.
Birkinshaw, S. J., James, P., and Ewen, J.: Graphical User Interfacefor Rapid Set-up of SHETRAN Physically-Based River Catch-ment Model, Environ. Model. Softw., 25, 609–610, 2010.
Chen, C. Y., Chen, T. C., Yu, F. C., and Lin, S. C.: Analysis oftime-varying rainfall infiltration induced landslide, Eng. Geol.,48, 466–479, 2005.
Chiang, S. H., Chang, K. T., Mondini, A. C., Tsai, B. W., and Chen,C. Y.: Simulation of event-based landslides and debris flows atwatershed level, Geomorphology, 138, 306–618, 2012.
Chinnayakanahalli, K.: An objective method for the intercompar-ison of terrain stability models and incorporation of parameteruncertainty, Ms.D. thesis, Civil and Environmental Engineering,Utah State University, available at:http://www.neng.usu.edu/cee/faculty/dtarb/Kiran_Thesis.pdf, 2004.
Coe, J. A., Cannon, S. H., and Santi, P. M.: Introduction to the spe-cial issue on debris flows initiated by runoff, erosion, and sed-iment entrainment in western North America, Geomorphology,96, 247–249, 2008a.
Coe, J. A., Kinner, D. A., and Godt, J. W.: Initiation conditionsfor debris flows generated by runoff at Chalk Cliffs, central Col-orado, Geomorphology, 96, 270–297, 2008b.
Crosta, G. B. and Frattini, P.: Distributed modelling of shallow land-slides triggered by intense rainfall, Nat. Hazards Earth Syst. Sci.,3, 81–93, doi:10.5194/nhess-3-81-2003, 2003.
Dhakal, A. S. and Sidle, R.: Long-term modeling of landslides fordifferent forest managent practices, Earth Surf. Proc. Land., 28,853–868, 2003.
Dietrich, W. E., Wilson, C. J., Montgomery, D. R., and McKean, J.:Analysis of erosion thresholds, channel networks and landscapemorphology using a digital terrain model, J. Geol., 101, 259–178,1993.
Dietrich, W. E., Reiss, R., Hsu, M. L., and Montgomery, D. R.: AProcess-based model for colluvium soil depth and shallow lands-
www.nat-hazards-earth-syst-sci.net/13/2833/2013/ Nat. Hazards Earth Syst. Sci., 13, 2833–2849, 2013

2848 D. W. Park et al.: Landslide and debris flow susceptibility zonation
liding using digital elevation data, Hydrol. Process., 9, 383–400,1995.
Ellen, S. D. and Fleming, R. W.: Mobilization of debris flows fromsoil slips, San Francisco Bay region, California, Geol. Soc. Am.Rev. Engng Geol., 7, 31–40, 1987.
Ewen, J., Parkin, G., and O’Connell, P. E.: SHETRAN: distributedriver basin flow and transport modeling system, J. Hydrol. Eng.,5, 250–258, 2000.
Godt, J. W., Baum, R. B., Savage, W. Z., Salciarini, D., Schulz,W. H., and Harp, E. L.: Transient deterministic shallow land-slide modeling: Requirements for susceptibility and hazard as-sessments in a GIS framework, Eng. Geol., 102, 214–226, 2008.
Gomes, R. A. T., Guimaraes, R. F., Carvalho Júnior, O. A., Fernan-des, N. F., and Amaral Jr., E. V.: Combining spatial models forshallow landslides and debris flows prediction, Remote Sens., 5,2219–2237, 2013.
Gregoretti, C.: The initiation of debris flow at high slopes: experi-mental results, J. Hydrol. Res., 38, 83–88, 2000.
Hammond, C. J., Prellwitz, R. W., and Miller, S. M.: Landslidehazard assessment using Monte Carlo Simulation. Proceedings6th International symposium on Landslides, Christchurch, NewZealand, Balkema publisher, 959–964, 1992.
Horton, P., Jaboyedoff, M., Zimmermann, M., Mazotti, B., andLongchamp, C.: Flow-R, a model for susceptibility mapping at aregional scale – some case studies, IJEGE.2011-03.B-095, 2011.
Horton, P., Jaboyedoff, M., Rudaz, B., and Zimmermann, M.: Flow-R, a model for susceptibility mapping of debris flows and othergravitational hazards at a regional scale, Nat. Hazards Earth Syst.Sci., 13, 869–885, doi:10.5194/nhess-13-869-2013, 2013.
Huang, J. C. and Kao, S. J.: Optimal estimator for assessing land-slide model performance, Hydrol. Earth Syst. Sci., 10, 957–965,doi:10.5194/hess-10-957-2006, 2006.
Iverson, R. M.: Landslide triggering by rain infiltration, Water Re-sour. Res., 36, 1897–1910, 2000.
Iverson, R. M., Reid, M. E., and LaHusen, R. G.: Debris-flow mo-bilization from landslides, Ann. Rev. Earth Planet. Sci., 25, 85–138, 1997.
Iverson, R. M., Reid, M. E., Iverson, N. R., LaHusen, R. G., Logan,M., Mann, J. E., Brien, D. L.: Acute sensitivity of landslide ratesto initial soil porosity, Science, 290, 513–516, 2000.
Jelínek, R. and Wagner, P.: Landslide hazard zonation by determin-istic analysis (Veká̌Causa landslide area, Slovakia), Landslides,4, 339–350, 2007.
Johnson, A. M. and Rodine, J. D.: Debris flow, in: slope Instability,John Wiley, New York, 257–361, 1984.
Kim, D., Im, S., Lee, S. H., Hong, Y., and Cha, K. S.: Predictingthe Rainfall-Triggered Landslides in a Forested Mountain RegionUsing TRIGRS Model, J. Mt. Sci., 7, 83–91, 2010.
Korean Geotechnical Society: Research contract report: additionand complement causes survey of Mt. Woomyeon landslide,2011.
Korean Society of Civil Engineers: Research contract report: causessurvey and restoration work of Mt. Woomyeon landslide, 2012.
Larsen, I. J., Pederson, J. L., and Schmidt, J. C.: Geologic versuswildfire controls on hillslope and debris flow initiation in theGreen River canyons of Dinosaur National Monument, Geomor-phology, 81, 114–127, 2006.
Liao, Z., Hong, Y., Kirschbaum, D., Adler, R. F., Gourley, J. J., andWooten, R.: Evaluation of TRIGRS (transient rainfall infiltration
and grid-based regional slope-stability analysis)’s predictive skillfor hurricane-triggered landslides: a case study in Macon County,North Carolina, Nat. Hazards, 58, 325–339, 2011.
Liu, C. N. and Wu, C. C.: Mapping susceptibility of rainfall-triggered shallow landslides using a probabilistic approach, Env-iron. Geol., 55, 907–915, 2008.
Montgomery, D. R. and Dietrich, W. E.: A physically based modelfor the topographic control on shallow landsliding, Water Resour.Res., 30, 1153–1171, 1994.
Montgomery, D. R., Sullivan, K., and Greenberg, H. M.: Regionaltest of a model for shallow landsliding, Hydrol. Process., 12,943–955, 1998.
Montrasio, L., Valentino, R., and Losi, G. L.: Towards a real-timesusceptibility assessment of rainfall-induced shallow landslideson a regional scale, Nat. Hazards Earth Syst. Sci., 11, 1927–1947,doi:10.5194/nhess-11-1927-2011, 2011.
Morrissey, M. M., Wieczorek, G. F., and Morgan, B. A.: A com-parative analysis of hazard models for predicting debris flows inMadison County, Virginia, USGS, 2001.
National Geographic Information Institute: Official archive forrestoration work of Mt. Woomyeon landslide, 2011.
O’Callaghan, J. F. and Mark, D. M.: The Extraction of DrainageNetworks From Digital Elevation Data, Computer Vision,Graphics Image Process., 28, 328–344, 1984.
Pack, R. T., Tarboton, D. G., and Goodwin, C. N.: Terrain stabilitymapping with SINMAP, Technical description and users guidefor version 1.00, Report and software available at:http://www.engineering.usu.edu/dtarb/(last access: 15 June 2007), 1998.
Pack, R. T., Tarboton, D. G., and Goodwin, C. N.: Assessing terrainstability in a GIS using SINMAP, in: 15th annual GIS confer-ence, GIS 2001, Vancouver, 56–68, 19–22 February 2001.
Quinn, P., Beven, K., Chevallier, P., and Planchon, O.: The Predic-tion of Hillslope Flow Paths for Distributed Hydrological Mod-eling Using Digital Terrain Models, Hydrol. Process., 5, 59–80,1991.
Raia, S., Alvioli, M., Rossi, M., Baum, R. L., Godt, J. W.,and Guzzetti, F.: Improving predictive power of physicallybased rainfall-induced shallow landslide models: a probabilis-tic approach, Geosci. Model Dev. Discuss., 6, 1367–1426,doi:10.5194/gmdd-6-1367-2013, 2013.
Salciarini, D., Godt, J. W., Savage, W. Z., Conversini, P., Baum, R.L., and Michael, J. A.: Modeling regional initiation of rainfall-induced shallow landslides in the eastern Umbria Region of cen-tral Italy, Landslides, 3, 181–194, 2006.
Salciarini, D., Godt, J. W., Savage, W. Z., Baum, R. L., and Con-versini, P.: Modeling landslide recurrence in Seattle, Washington,USA, Eng. Geol., 102, 227-237, 2008.
Shaw, S. and Johnson, D.: Slope Morphology Model Derived fromDigital Elevation Data, in: Proceedings, NW Arc/Info UsersConference. Coeur d’Alene, ID, 23–25 October 1995. 12 pp,The Klamath Resource Information System (KRIS), available at:http://www.krisweb.com/biblio/biblio.htm, 1995.
Sorbino, G., Sica, C., and Cascini, L.: Susceptibility analysis ofshallow landslides source areas using physically based models,Nat. Hazards, 53, 313–332, 2010.
Takahashi, T.: Debris Flow, IAHR Monograph Balkema, Rotter-dam, 1991.
Nat. Hazards Earth Syst. Sci., 13, 2833–2849, 2013 www.nat-hazards-earth-syst-sci.net/13/2833/2013/

D. W. Park et al.: Landslide and debris flow susceptibility zonation 2849
Takahashi, T.: Estimation of potential debris flows and their haz-ardous zones; soft countermeasures for a disaster, J. Natural Dis-aster Sci., 3, 57–89, 1981.
Tarboton, D. G.: A new method for the determination of flow di-rections and contributing areas in grid digital elevation models,Water Resources Research v.33, 2, 309–319, 1997.
Tognacca, C., Bezzola, G. R., and Minor, H. E.: Threshold criterionfor debris-flow initiation due to channel-bed failure, in: Debris-Flow Hazards Mitigation: Mechanics, Prediction, and Assess-ment, edited by: Wieczorek, G. F. and Naeser, N. D., Balkema,Rotterdam, The Netherlands, 89–97, 2000.
Vieira, B. C., Fernandes, N. F., and Filho, O. A.: Shallow land-slide prediction in the Serra do Mar, São Paulo, Brazil, Nat.Hazards Earth Syst. Sci., 10, 1829–1837, doi:10.5194/nhess-10-1829-2010, 2010.
Wang, C., Marui, H, Furuya, G., Watanabe, N.: Two integrated mod-els simulating dynamic process of landslide using GIS, LandslideSci. Practice, 3, 389–395, 2013.
Wu, W. and Sidle, R. C.: A distributed slope stability model forsteep forested basins, Water Resour. Res., 31, 2097–2110, 1995.
www.nat-hazards-earth-syst-sci.net/13/2833/2013/ Nat. Hazards Earth Syst. Sci., 13, 2833–2849, 2013