Landscape Sprinkler Irrigation Scheduling Calculator Users ... Sprinkler... · L. a. ndscape...
20
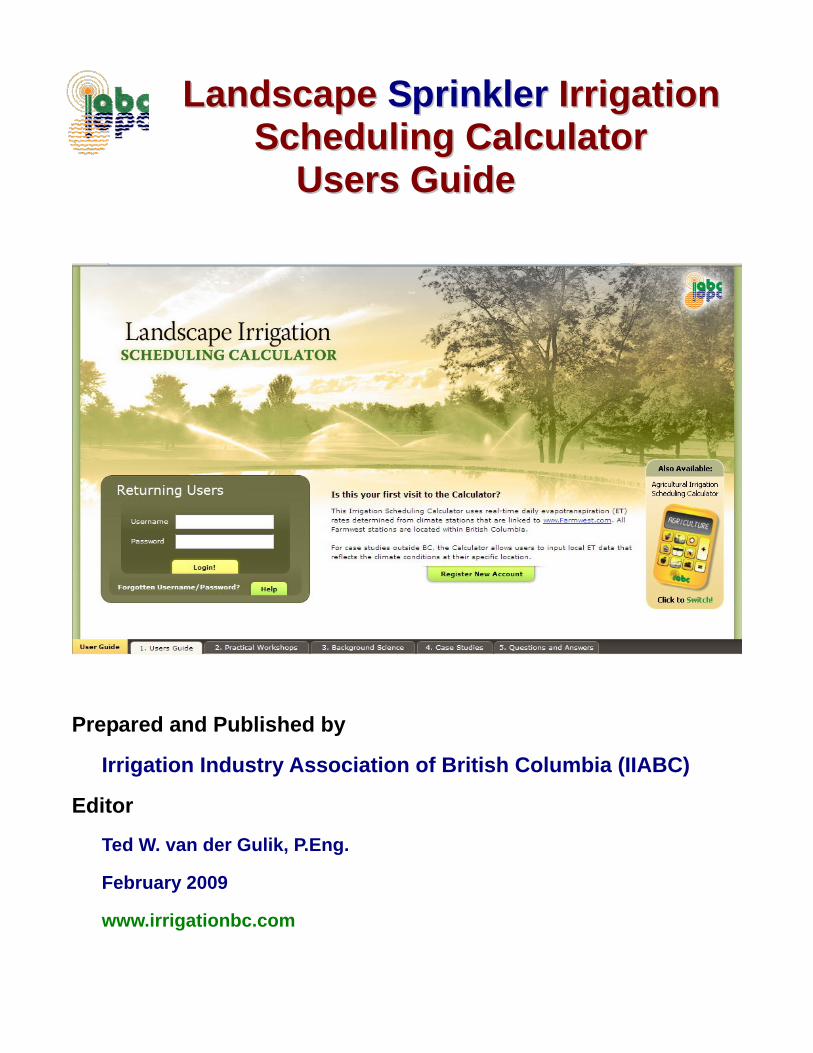
L L a a n n d d s s c c a a p p e e S S p p r r i i n n k k l l e e r r I I r r r r i i g g a a t t i i o o n n S S c c h h e e d d u u l l i i n n g g C C a a l l c c u u l l a a t t o o r r U U s s e e r r s s G G u u i i d d e e Prepared and Published by Irrigation Industry Association of British Columbia (IIABC) Editor Ted W. van der Gulik, P.Eng. February 2009 www.irrigationbc.com
Transcript of Landscape Sprinkler Irrigation Scheduling Calculator Users ... Sprinkler... · L. a. ndscape...
LLaannddssccaappee SSpprriinnkklleerr IIrrrriiggaattiioonn SScchheedduulliinngg CCaallccuullaattoorr
UUsseerrss GGuuiiddee
Prepared and Published by
Irrigation Industry Association of British Columbia (IIABC)
Editor
Ted W. van der Gulik, P.Eng.
February 2009
www.irrigationbc.com
Irrigation Industry Association of British Columbia Landscape Sprinkler Irrigation Scheduling Calculator
Page 2 of 20
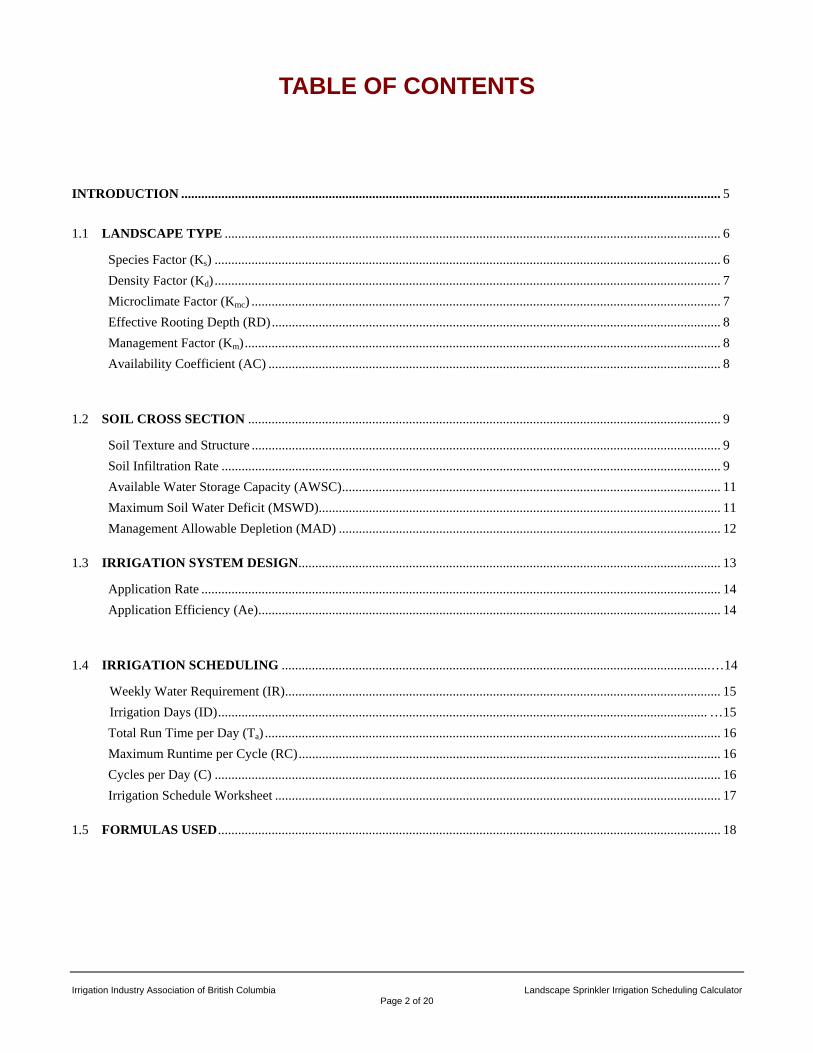
TABLE OF CONTENTS
INTRODUCTION ................................................................................................................................................................. 5
1.1 LANDSCAPE TYPE .................................................................................................................................................... 6
Species Factor (Ks) ....................................................................................................................................................... 6 Density Factor (Kd) ....................................................................................................................................................... 7 Microclimate Factor (Kmc) ............................................................................................................................................ 7 Effective Rooting Depth (RD) ...................................................................................................................................... 8 Management Factor (Km) .............................................................................................................................................. 8 Availability Coefficient (AC) ....................................................................................................................................... 8
1.2 SOIL CROSS SECTION ............................................................................................................................................. 9
Soil Texture and Structure ............................................................................................................................................ 9 Soil Infiltration Rate ..................................................................................................................................................... 9 Available Water Storage Capacity (AWSC) ................................................................................................................. 11 Maximum Soil Water Deficit (MSWD)........................................................................................................................ 11 Management Allowable Depletion (MAD) .................................................................................................................. 12
1.3 IRRIGATION SYSTEM DESIGN .............................................................................................................................. 13
Application Rate ........................................................................................................................................................... 14 Application Efficiency (Ae) .......................................................................................................................................... 14
1.4 IRRIGATION SCHEDULING ................................................................................................................................ …14
Weekly Water Requirement (IR) .................................................................................................................................. 15 Irrigation Days (ID) .................................................................................................................................................. …15 Total Run Time per Day (Ta) ........................................................................................................................................ 16 Maximum Runtime per Cycle (RC) .............................................................................................................................. 16 Cycles per Day (C) ....................................................................................................................................................... 16 Irrigation Schedule Worksheet ..................................................................................................................................... 17
1.5 FORMULAS USED ...................................................................................................................................................... 18
Irrigation Industry Association of British Columbia Landscape Sprinkler Irrigation Scheduling Calculator
Page 3 of 20
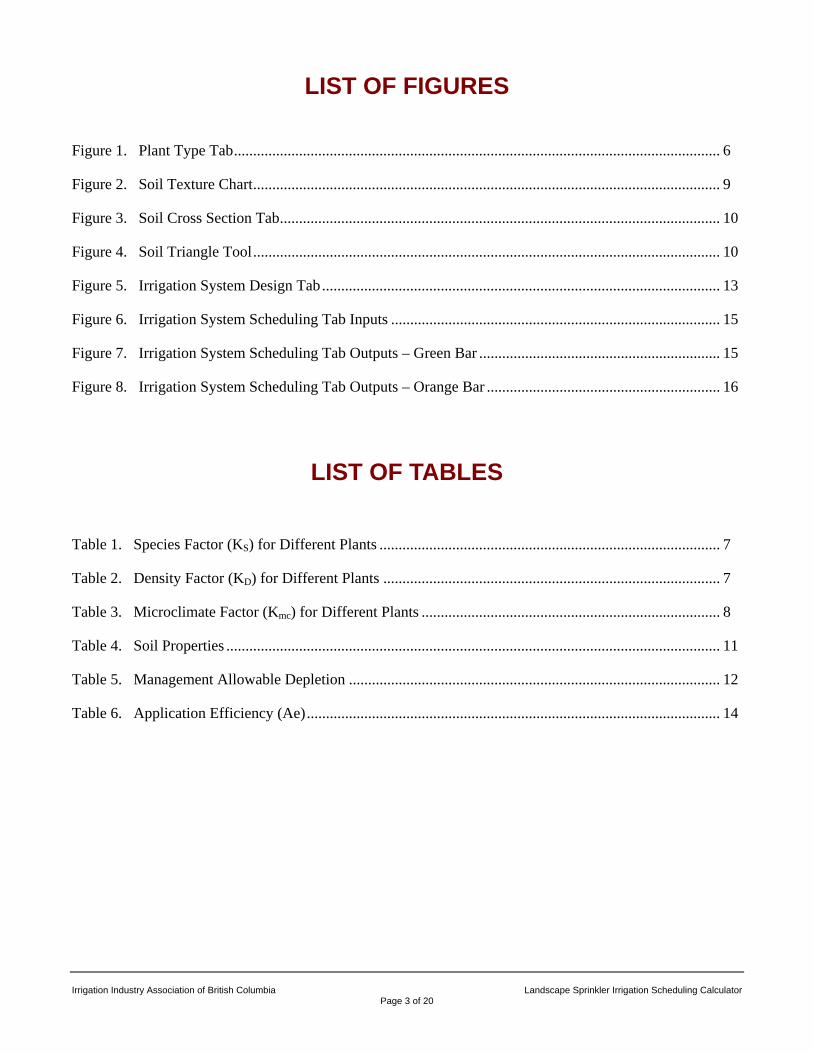
LIST OF FIGURES
Figure 1. Plant Type Tab ............................................................................................................................... 6
Figure 2. Soil Texture Chart .......................................................................................................................... 9
Figure 3. Soil Cross Section Tab ................................................................................................................... 10
Figure 4. Soil Triangle Tool .......................................................................................................................... 10
Figure 5. Irrigation System Design Tab ........................................................................................................ 13
Figure 6. Irrigation System Scheduling Tab Inputs ...................................................................................... 15
Figure 7. Irrigation System Scheduling Tab Outputs – Green Bar ............................................................... 15
Figure 8. Irrigation System Scheduling Tab Outputs – Orange Bar ............................................................. 16
LIST OF TABLES
Table 1. Species Factor (KS) for Different Plants ......................................................................................... 7
Table 2. Density Factor (KD) for Different Plants ........................................................................................ 7
Table 3. Microclimate Factor (Kmc) for Different Plants .............................................................................. 8
Table 4. Soil Properties ................................................................................................................................. 11
Table 5. Management Allowable Depletion ................................................................................................. 12
Table 6. Application Efficiency (Ae) ............................................................................................................ 14

Landscape Sprinkler Irrigation Scheduling Calculator User’s Guide
Information from the Certified Landscape Irrigation Auditor Training Manual produced by the Irrigation Association has been used as a guide in the preparation of this document. Information has been changed and additional parameters added to provide guidance to landscape irrigators in British Columbia. The Irrigation Scheduling Calculator was developed solely by the Ministry of Agriculture and Lands and the Irrigation Industry Association of British Columbia with funding from the Canada British Columbia Water Supply Expansion Program.
INTRODUCTION
The Irrigation Scheduling Calculator found at www.irrigationbc.com has been developed specifically for use in British Columbia although other regions can use the calculator by entering their own Reference Evapotranspiration (ETo) data. This guide provides background information on the parameters and calculations used in the Landscape Sprinkler Irrigation Scheduling Calculator. While there is on line help available on the calculator often not enough detail is provided to make a good determination on which value to use.
Irrigation systems should be designed and operated to supply the turf and landscape water requirement while minimizing runoff and leaching. To ensure peak irrigation system performance the system design should take into account evapotranspiration, landscape coefficients, soil type and irrigation system efficiencies. High frequency irrigation leads to increased surface evaporation and usually a higher rate of transpiration by the plants. The landscape irrigation scheduling calculator minimizes the frequency of irrigation but maximizes duration of application that is allowed by the soil and plants. It is better to have an irrigation schedule where irrigation occurs less frequently but fully utilizes water stored in the plants’ root zone.
The Landscape Irrigation Scheduling Calculator assumes that the irrigation system has been properly designed to match the location, soil type and plant water requirements and maintained in good operating condition. It is recommended that a Certified Irrigation Designer be used to design an irrigation system and a Certified Irrigation Technician be used to ensure that the irrigation system is installed as per plan.
The calculator takes the following information into account in the development of an irrigation schedule:
• How much water the landscape requires. • How much water can be stored in the soil that is readily available to the plant. • The amount of effective rainfall that is useable by the plant. • How much water the irrigation system needs to apply to make up the moisture deficit that has occurred. This User’s Guide provides direction on the calculations that are made by the calculator and how to select the information that populates the entry boxes in the calculator. There are four sections in the calculator that must be completed in order for a schedule to be developed. These are:
• Landscape Type • Soil Cross-section • Irrigation System Design • Irrigation Scheduling
Irrigation Industry Association of British Columbia Landscape Sprinkler Irrigation Scheduling Calculator
Page 4 of 20

1.1 LANDSCAPE TYPE
The landscape tab is where information on the species or plant material to be irrigated is entered. For the Vegetation Type selected the calculator will select a number of factors that are used to adjust the Reference Evapotranspiration Rate that is imported from the climate station later on in the calculator. Once the vegetation type is selected a decision must be made on the factors of vegetation water use, vegetation density and area microclimate. Tables 1, 2 and 3 provide the information that the calculator will enter for the choices made.
Figure 1 – Plant Type Tab
Depending on the choices made the value will be populated in the table under default values. By clicking on the default tab these values can be changed if desired.
Species Factor (Ks)
Different plant species can vary considerably in their rates of evapotranspiration. Some species transpire large amounts of water, while others use relatively little.
Because there is such a wide range of water needs among different landscape plants, the water use is divided into three use groups: high, medium, and low, as shown in Table 1.
Irrigation Industry Association of British Columbia Landscape Sprinkler Irrigation Scheduling Calculator
Page 5 of 20
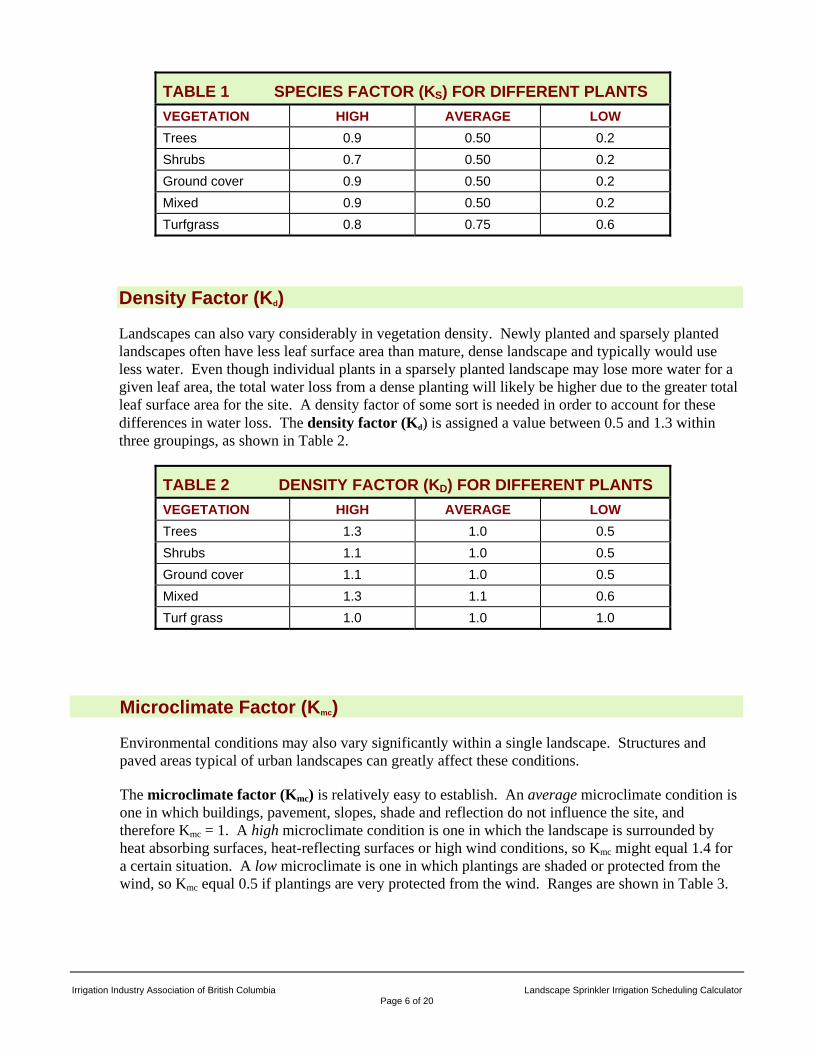
TABLE 1 SPECIES FACTOR (KS) FOR DIFFERENT PLANTS VEGETATION HIGH AVERAGE LOW Trees 0.9 0.50 0.2 Shrubs 0.7 0.50 0.2 Ground cover 0.9 0.50 0.2 Mixed 0.9 0.50 0.2 Turfgrass 0.8 0.75 0.6
Density Factor (Kd)
Landscapes can also vary considerably in vegetation density. Newly planted and sparsely planted landscapes often have less leaf surface area than mature, dense landscape and typically would use less water. Even though individual plants in a sparsely planted landscape may lose more water for a given leaf area, the total water loss from a dense planting will likely be higher due to the greater total leaf surface area for the site. A density factor of some sort is needed in order to account for these differences in water loss. The density factor (Kd) is assigned a value between 0.5 and 1.3 within three groupings, as shown in Table 2.
TABLE 2 DENSITY FACTOR (KD) FOR DIFFERENT PLANTS VEGETATION HIGH AVERAGE LOW Trees 1.3 1.0 0.5 Shrubs 1.1 1.0 0.5 Ground cover 1.1 1.0 0.5 Mixed 1.3 1.1 0.6 Turf grass 1.0 1.0 1.0
Microclimate Factor (Kmc)
Environmental conditions may also vary significantly within a single landscape. Structures and paved areas typical of urban landscapes can greatly affect these conditions.
The microclimate factor (Kmc) is relatively easy to establish. An average microclimate condition is one in which buildings, pavement, slopes, shade and reflection do not influence the site, and therefore Kmc = 1. A high microclimate condition is one in which the landscape is surrounded by heat absorbing surfaces, heat-reflecting surfaces or high wind conditions, so Kmc might equal 1.4 for a certain situation. A low microclimate is one in which plantings are shaded or protected from the wind, so Kmc equal 0.5 if plantings are very protected from the wind. Ranges are shown in Table 3.
Irrigation Industry Association of British Columbia Landscape Sprinkler Irrigation Scheduling Calculator
Page 6 of 20
Irrigation Industry Association of British Columbia Landscape Sprinkler Irrigation Scheduling Calculator
Page 7 of 20
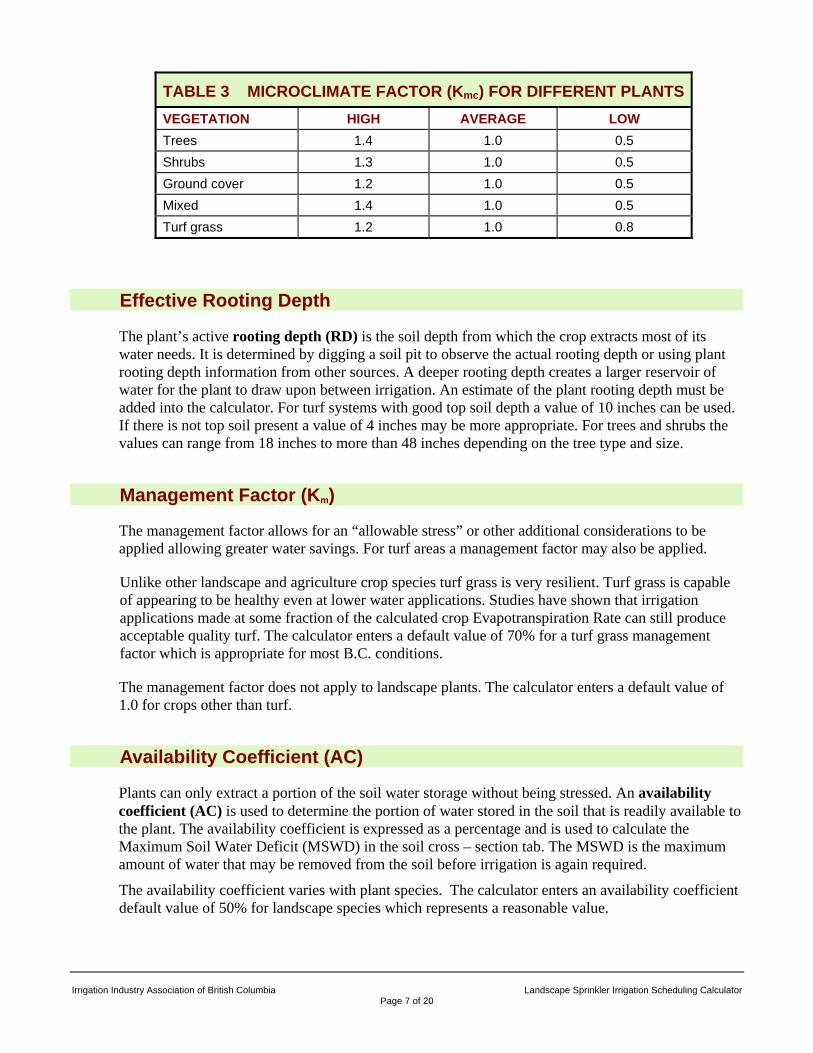
TABLE 3 MICROCLIMATE FACTOR (Kmc) FOR DIFFERENT PLANTSVEGETATION HIGH AVERAGE LOW Trees 1.4 1.0 0.5 Shrubs 1.3 1.0 0.5 Ground cover 1.2 1.0 0.5 Mixed 1.4 1.0 0.5 Turf grass 1.2 1.0 0.8
Effective Rooting Depth
The plant’s active rooting depth (RD) is the soil depth from which the crop extracts most of its water needs. It is determined by digging a soil pit to observe the actual rooting depth or using plant rooting depth information from other sources. A deeper rooting depth creates a larger reservoir of water for the plant to draw upon between irrigation. An estimate of the plant rooting depth must be added into the calculator. For turf systems with good top soil depth a value of 10 inches can be used. If there is not top soil present a value of 4 inches may be more appropriate. For trees and shrubs the values can range from 18 inches to more than 48 inches depending on the tree type and size.
Management Factor (Km)
The management factor allows for an “allowable stress” or other additional considerations to be applied allowing greater water savings. For turf areas a management factor may also be applied.
Unlike other landscape and agriculture crop species turf grass is very resilient. Turf grass is capable of appearing to be healthy even at lower water applications. Studies have shown that irrigation applications made at some fraction of the calculated crop Evapotranspiration Rate can still produce acceptable quality turf. The calculator enters a default value of 70% for a turf grass management factor which is appropriate for most B.C. conditions.
The management factor does not apply to landscape plants. The calculator enters a default value of 1.0 for crops other than turf.
Availability Coefficient (AC)
Plants can only extract a portion of the soil water storage without being stressed. An availability coefficient (AC) is used to determine the portion of water stored in the soil that is readily available to the plant. The availability coefficient is expressed as a percentage and is used to calculate the Maximum Soil Water Deficit (MSWD) in the soil cross – section tab. The MSWD is the maximum amount of water that may be removed from the soil before irrigation is again required.
The availability coefficient varies with plant species. The calculator enters an availability coefficient default value of 50% for landscape species which represents a reasonable value.
1.2 SOIL CROSS SECTION
Knowledge about the soil and landscape are important to ensure that water is applied when required by the plant at the rates and intervals that can be accepted by the soil and topography. The basic soil information required and calculated in the calculator is described below. The soil tab is where the soil type and depth is entered and the calculator selects the parameters described below.
Soil Texture and Structure
Irrigation Industry Association of British Columbia Landscape Sprinkler Irrigation Scheduling Calculator
Page 8 of 20
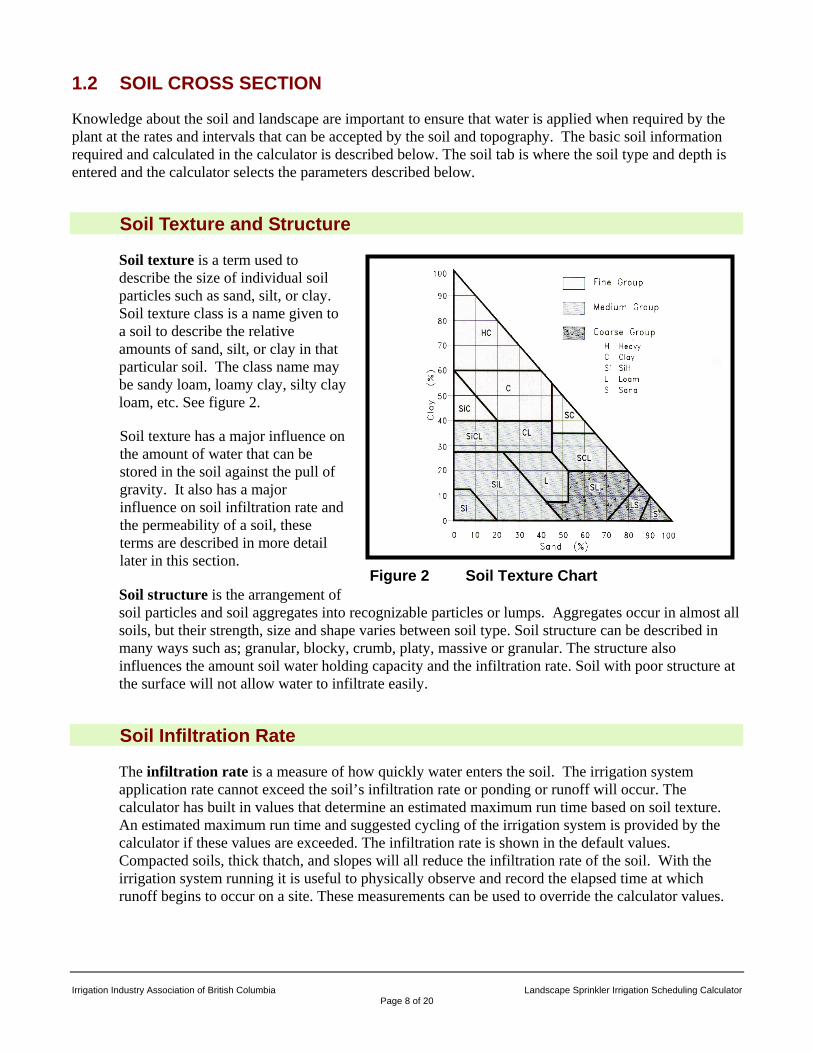
Figure 2 Soil Texture Chart
Soil texture is a term used to describe the size of individual soil particles such as sand, silt, or clay. Soil texture class is a name given to a soil to describe the relative amounts of sand, silt, or clay in that particular soil. The class name may be sandy loam, loamy clay, silty clay loam, etc. See figure 2.
Soil texture has a major influence on the amount of water that can be stored in the soil against the pull of gravity. It also has a major influence on soil infiltration rate and the permeability of a soil, these terms are described in more detail later in this section.
Soil structure is the arrangement of soil particles and soil aggregates into recognizable particles or lumps. Aggregates occur in almost all soils, but their strength, size and shape varies between soil type. Soil structure can be described in many ways such as; granular, blocky, crumb, platy, massive or granular. The structure also influences the amount soil water holding capacity and the infiltration rate. Soil with poor structure at the surface will not allow water to infiltrate easily.
Soil Infiltration Rate
The infiltration rate is a measure of how quickly water enters the soil. The irrigation system application rate cannot exceed the soil’s infiltration rate or ponding or runoff will occur. The calculator has built in values that determine an estimated maximum run time based on soil texture. An estimated maximum run time and suggested cycling of the irrigation system is provided by the calculator if these values are exceeded. The infiltration rate is shown in the default values. Compacted soils, thick thatch, and slopes will all reduce the infiltration rate of the soil. With the irrigation system running it is useful to physically observe and record the elapsed time at which runoff begins to occur on a site. These measurements can be used to override the calculator values.
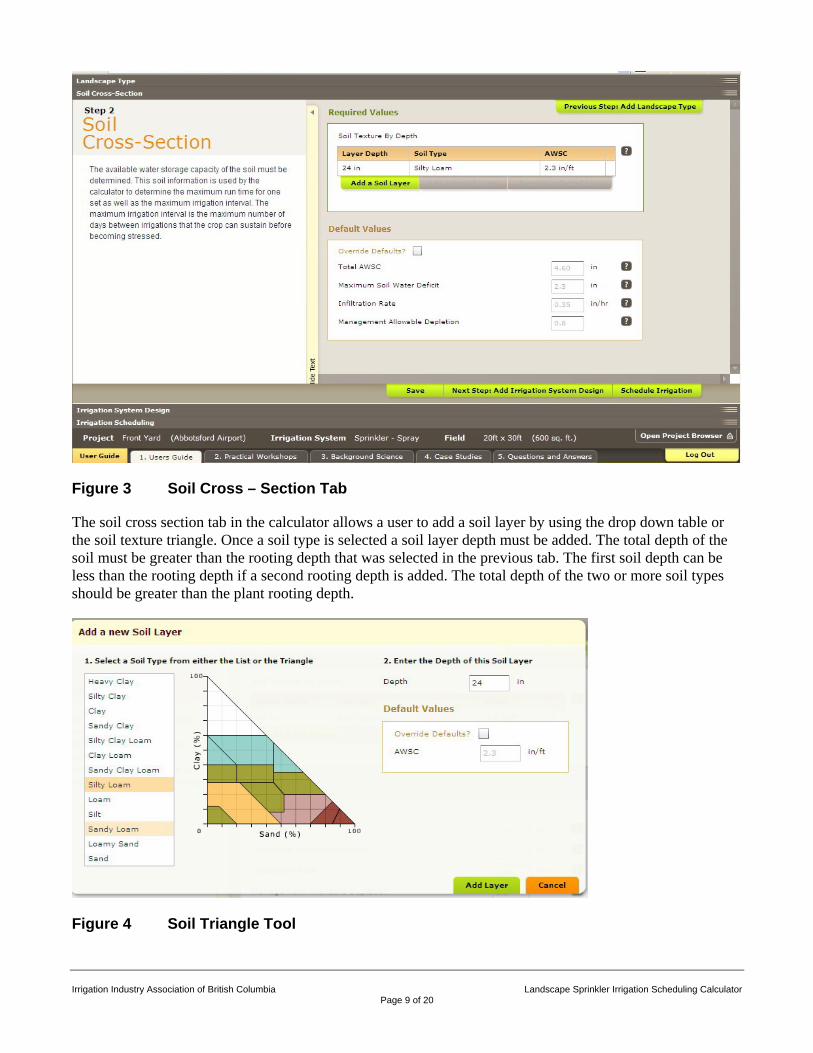
Figure 3 Soil Cross – Section Tab
The soil cross section tab in the calculator allows a user to add a soil layer by using the drop down table or the soil texture triangle. Once a soil type is selected a soil layer depth must be added. The total depth of the soil must be greater than the rooting depth that was selected in the previous tab. The first soil depth can be less than the rooting depth if a second rooting depth is added. The total depth of the two or more soil types should be greater than the plant rooting depth.
Figure 4 Soil Triangle Tool
Irrigation Industry Association of British Columbia Landscape Sprinkler Irrigation Scheduling Calculator
Page 9 of 20
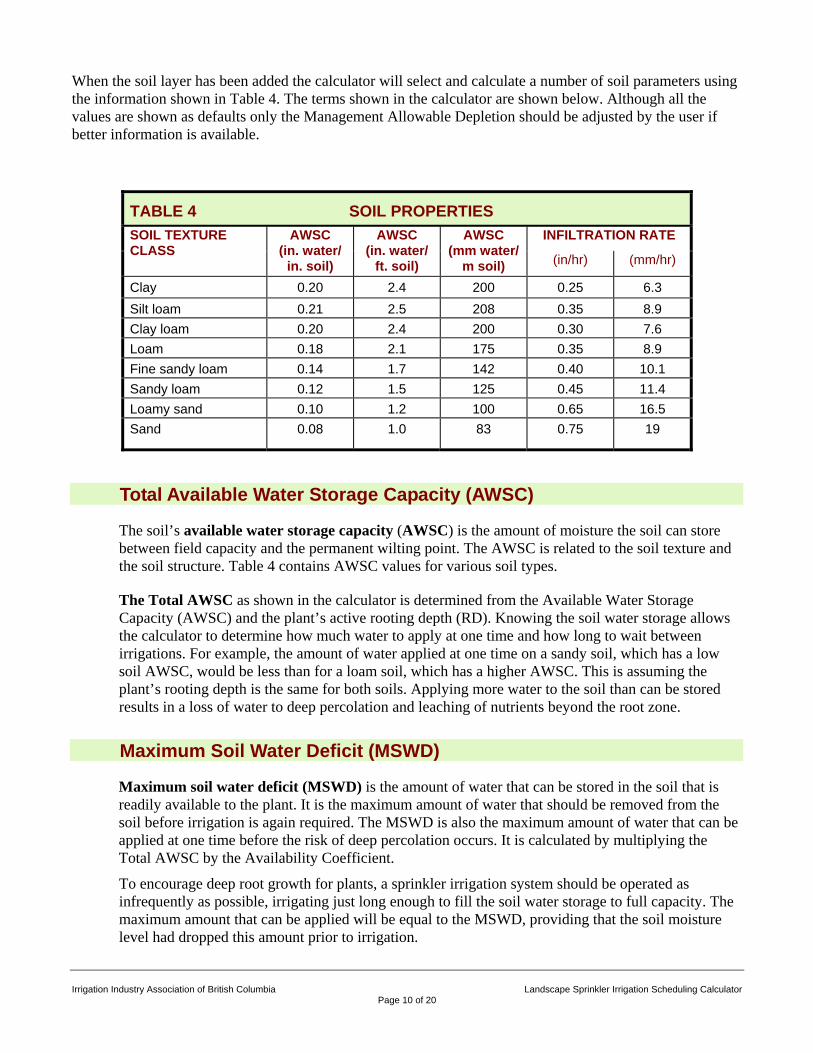
When the soil layer has been added the calculator will select and calculate a number of soil parameters using the information shown in Table 4. The terms shown in the calculator are shown below. Although all the values are shown as defaults only the Management Allowable Depletion should be adjusted by the user if better information is available.
TABLE 4 SOIL PROPERTIES SOIL TEXTURE CLASS
AWSC (in. water/
in. soil)
AWSC (in. water/
ft. soil)
AWSC (mm water/
m soil)
INFILTRATION RATE
(in/hr) (mm/hr)
Clay 0.20 2.4 200 0.25 6.3 Silt loam 0.21 2.5 208 0.35 8.9 Clay loam 0.20 2.4 200 0.30 7.6 Loam 0.18 2.1 175 0.35 8.9 Fine sandy loam 0.14 1.7 142 0.40 10.1 Sandy loam 0.12 1.5 125 0.45 11.4 Loamy sand 0.10 1.2 100 0.65 16.5 Sand 0.08 1.0 83 0.75 19
Total Available Water Storage Capacity (AWSC)
The soil’s available water storage capacity (AWSC) is the amount of moisture the soil can store between field capacity and the permanent wilting point. The AWSC is related to the soil texture and the soil structure. Table 4 contains AWSC values for various soil types.
The Total AWSC as shown in the calculator is determined from the Available Water Storage Capacity (AWSC) and the plant’s active rooting depth (RD). Knowing the soil water storage allows the calculator to determine how much water to apply at one time and how long to wait between irrigations. For example, the amount of water applied at one time on a sandy soil, which has a low soil AWSC, would be less than for a loam soil, which has a higher AWSC. This is assuming the plant’s rooting depth is the same for both soils. Applying more water to the soil than can be stored results in a loss of water to deep percolation and leaching of nutrients beyond the root zone.
Maximum Soil Water Deficit (MSWD)
Maximum soil water deficit (MSWD) is the amount of water that can be stored in the soil that is readily available to the plant. It is the maximum amount of water that should be removed from the soil before irrigation is again required. The MSWD is also the maximum amount of water that can be applied at one time before the risk of deep percolation occurs. It is calculated by multiplying the Total AWSC by the Availability Coefficient.
To encourage deep root growth for plants, a sprinkler irrigation system should be operated as infrequently as possible, irrigating just long enough to fill the soil water storage to full capacity. The maximum amount that can be applied will be equal to the MSWD, providing that the soil moisture level had dropped this amount prior to irrigation.
Irrigation Industry Association of British Columbia Landscape Sprinkler Irrigation Scheduling Calculator
Page 10 of 20
Irrigation Industry Association of British Columbia Landscape Sprinkler Irrigation Scheduling Calculator
Page 11 of 20
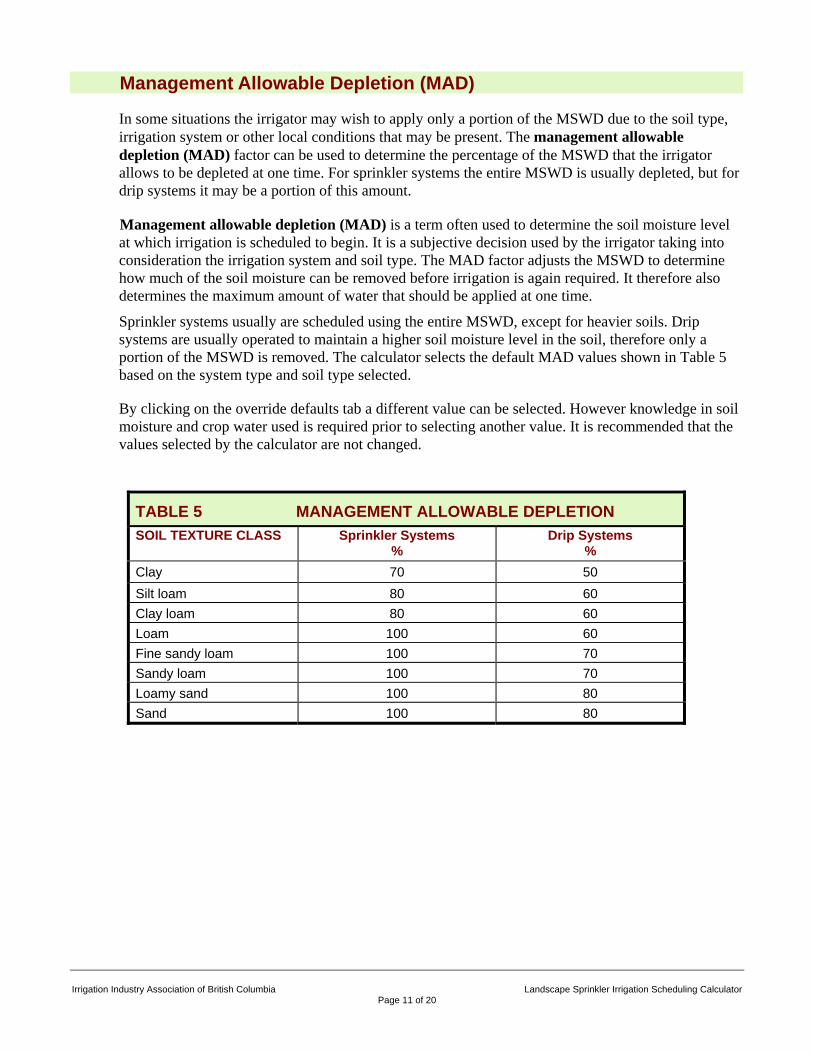
Management Allowable Depletion (MAD)
In some situations the irrigator may wish to apply only a portion of the MSWD due to the soil type, irrigation system or other local conditions that may be present. The management allowable depletion (MAD) factor can be used to determine the percentage of the MSWD that the irrigator allows to be depleted at one time. For sprinkler systems the entire MSWD is usually depleted, but for drip systems it may be a portion of this amount.
Management allowable depletion (MAD) is a term often used to determine the soil moisture level at which irrigation is scheduled to begin. It is a subjective decision used by the irrigator taking into consideration the irrigation system and soil type. The MAD factor adjusts the MSWD to determine how much of the soil moisture can be removed before irrigation is again required. It therefore also determines the maximum amount of water that should be applied at one time.
Sprinkler systems usually are scheduled using the entire MSWD, except for heavier soils. Drip systems are usually operated to maintain a higher soil moisture level in the soil, therefore only a portion of the MSWD is removed. The calculator selects the default MAD values shown in Table 5 based on the system type and soil type selected.
By clicking on the override defaults tab a different value can be selected. However knowledge in soil moisture and crop water used is required prior to selecting another value. It is recommended that the values selected by the calculator are not changed.
TABLE 5 MANAGEMENT ALLOWABLE DEPLETION SOIL TEXTURE CLASS Sprinkler Systems
% Drip Systems
% Clay 70 50 Silt loam 80 60 Clay loam 80 60 Loam 100 60 Fine sandy loam 100 70 Sandy loam 100 70 Loamy sand 100 80 Sand 100 80
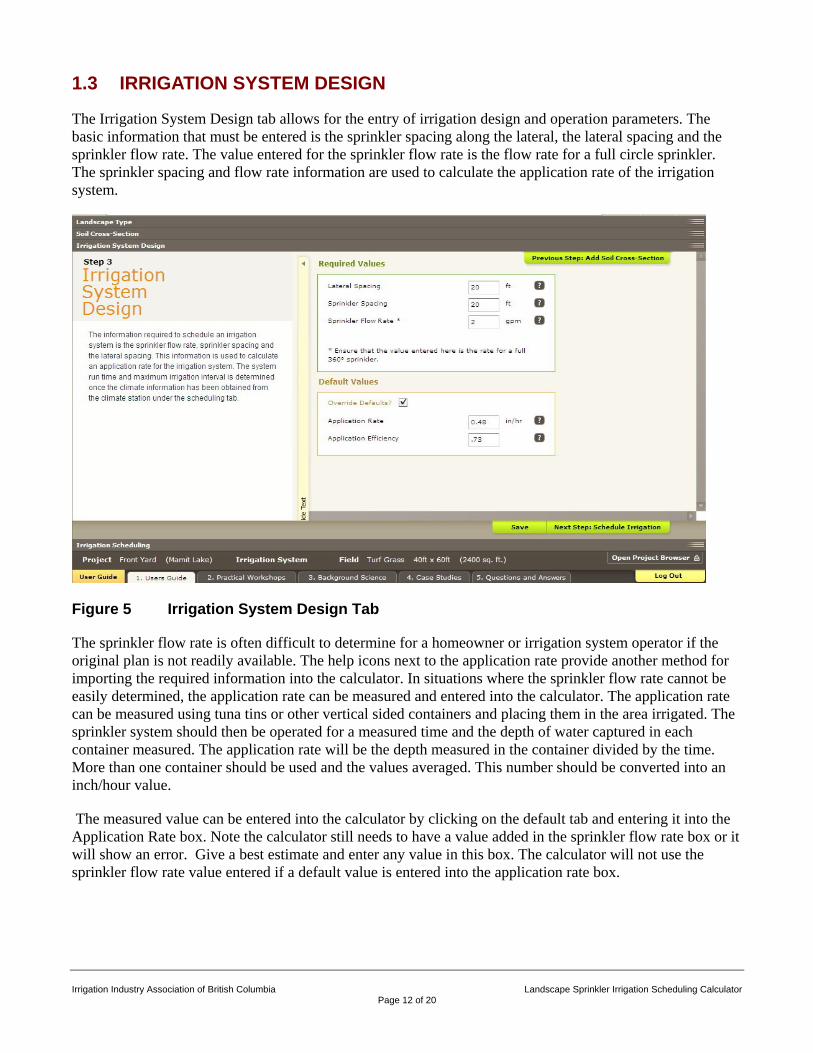
1.3 IRRIGATION SYSTEM DESIGN
The Irrigation System Design tab allows for the entry of irrigation design and operation parameters. The basic information that must be entered is the sprinkler spacing along the lateral, the lateral spacing and the sprinkler flow rate. The value entered for the sprinkler flow rate is the flow rate for a full circle sprinkler. The sprinkler spacing and flow rate information are used to calculate the application rate of the irrigation system.
Figure 5 Irrigation System Design Tab
The sprinkler flow rate is often difficult to determine for a homeowner or irrigation system operator if the original plan is not readily available. The help icons next to the application rate provide another method for importing the required information into the calculator. In situations where the sprinkler flow rate cannot be easily determined, the application rate can be measured and entered into the calculator. The application rate can be measured using tuna tins or other vertical sided containers and placing them in the area irrigated. The sprinkler system should then be operated for a measured time and the depth of water captured in each container measured. The application rate will be the depth measured in the container divided by the time. More than one container should be used and the values averaged. This number should be converted into an inch/hour value.
The measured value can be entered into the calculator by clicking on the default tab and entering it into the Application Rate box. Note the calculator still needs to have a value added in the sprinkler flow rate box or it will show an error. Give a best estimate and enter any value in this box. The calculator will not use the sprinkler flow rate value entered if a default value is entered into the application rate box.
Irrigation Industry Association of British Columbia Landscape Sprinkler Irrigation Scheduling Calculator
Page 12 of 20
Irrigation Industry Association of British Columbia Landscape Sprinkler Irrigation Scheduling Calculator
Page 13 of 20
Application Rate
Application rate (AR) also known as precipitation rate, is a measure of the rate at which water is applied to an area by the irrigation system per unit of time. It is a critical factor in design because a sprinkler system can easily apply water at rates greater than the soil’s ability to absorb water (infiltration rate), which leads to runoff. The application rate is used to determine how long the irrigation system should run to replace the moisture removed from the soil by the plant between irrigations.
The application rate for a sprinkler irrigation system can be calculated using equation 6.
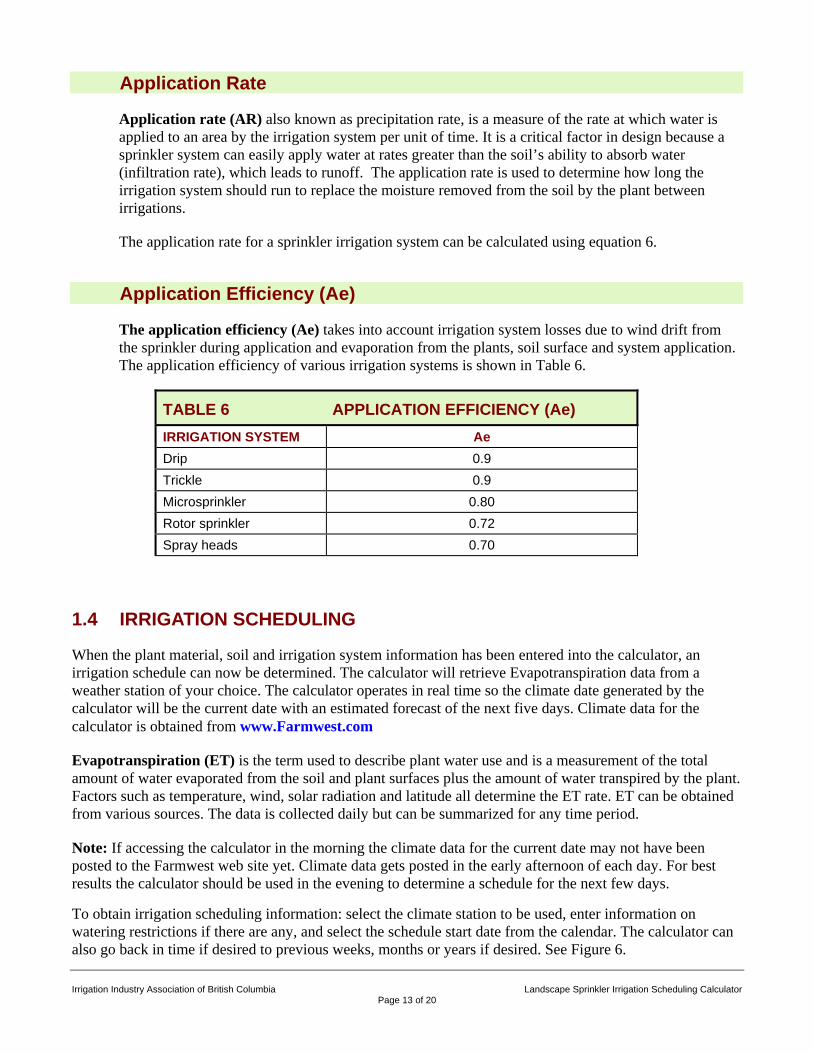
Application Efficiency (Ae)
The application efficiency (Ae) takes into account irrigation system losses due to wind drift from the sprinkler during application and evaporation from the plants, soil surface and system application. The application efficiency of various irrigation systems is shown in Table 6.
TABLE 6 APPLICATION EFFICIENCY (Ae) IRRIGATION SYSTEM Ae Drip 0.9 Trickle 0.9 Microsprinkler 0.80 Rotor sprinkler 0.72 Spray heads 0.70
1.4 IRRIGATION SCHEDULING
When the plant material, soil and irrigation system information has been entered into the calculator, an irrigation schedule can now be determined. The calculator will retrieve Evapotranspiration data from a weather station of your choice. The calculator operates in real time so the climate date generated by the calculator will be the current date with an estimated forecast of the next five days. Climate data for the calculator is obtained from www.Farmwest.com
Evapotranspiration (ET) is the term used to describe plant water use and is a measurement of the total amount of water evaporated from the soil and plant surfaces plus the amount of water transpired by the plant. Factors such as temperature, wind, solar radiation and latitude all determine the ET rate. ET can be obtained from various sources. The data is collected daily but can be summarized for any time period.
Note: If accessing the calculator in the morning the climate data for the current date may not have been posted to the Farmwest web site yet. Climate data gets posted in the early afternoon of each day. For best results the calculator should be used in the evening to determine a schedule for the next few days. To obtain irrigation scheduling information: select the climate station to be used, enter information on watering restrictions if there are any, and select the schedule start date from the calendar. The calculator can also go back in time if desired to previous weeks, months or years if desired. See Figure 6.
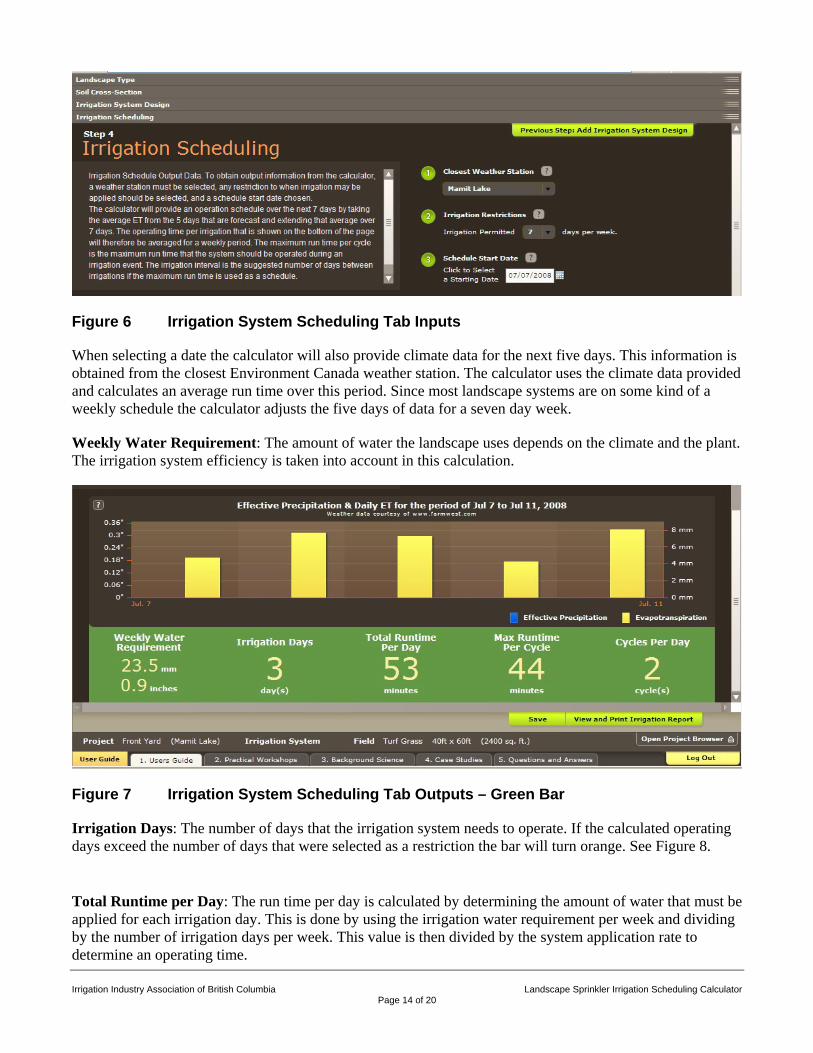
Figure 6 Irrigation System Scheduling Tab Inputs
When selecting a date the calculator will also provide climate data for the next five days. This information is obtained from the closest Environment Canada weather station. The calculator uses the climate data provided and calculates an average run time over this period. Since most landscape systems are on some kind of a weekly schedule the calculator adjusts the five days of data for a seven day week.
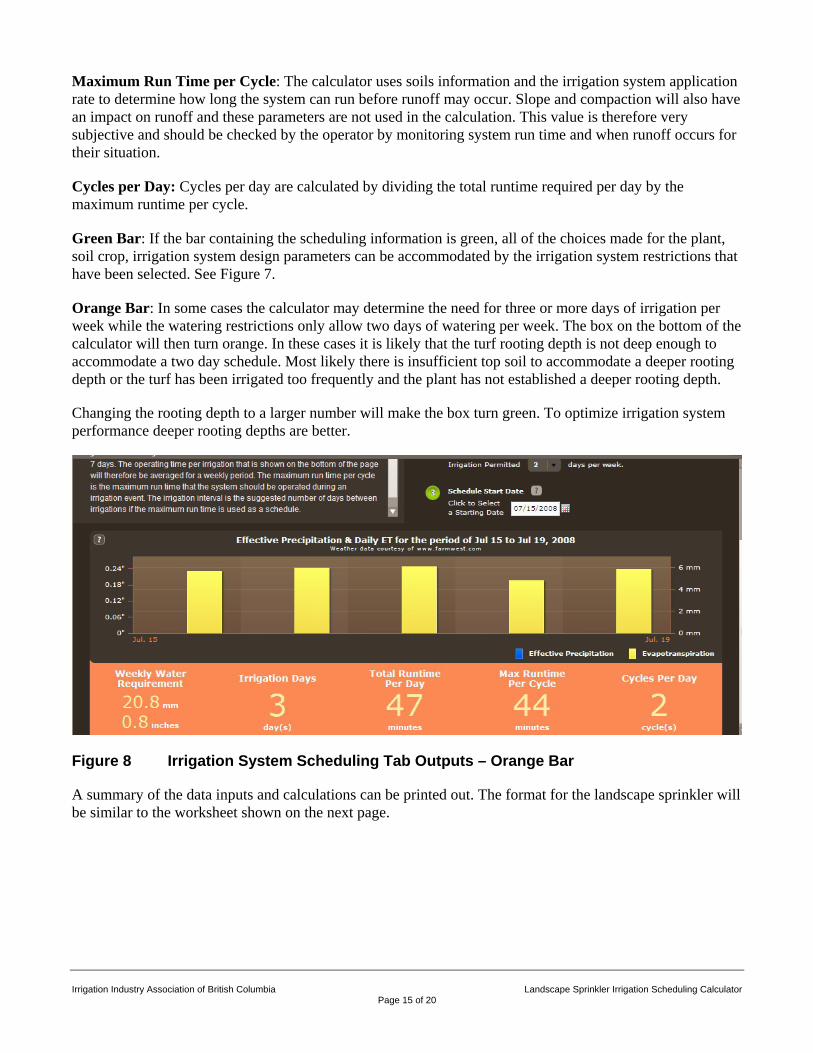
Weekly Water Requirement: The amount of water the landscape uses depends on the climate and the plant. The irrigation system efficiency is taken into account in this calculation.
Figure 7 Irrigation System Scheduling Tab Outputs – Green Bar
Irrigation Days: The number of days that the irrigation system needs to operate. If the calculated operating days exceed the number of days that were selected as a restriction the bar will turn orange. See Figure 8. Total Runtime per Day: The run time per day is calculated by determining the amount of water that must be applied for each irrigation day. This is done by using the irrigation water requirement per week and dividing by the number of irrigation days per week. This value is then divided by the system application rate to determine an operating time. Irrigation Industry Association of British Columbia Landscape Sprinkler Irrigation Scheduling Calculator
Page 14 of 20
Maximum Run Time per Cycle: The calculator uses soils information and the irrigation system application rate to determine how long the system can run before runoff may occur. Slope and compaction will also have an impact on runoff and these parameters are not used in the calculation. This value is therefore very subjective and should be checked by the operator by monitoring system run time and when runoff occurs for their situation.
Cycles per Day: Cycles per day are calculated by dividing the total runtime required per day by the maximum runtime per cycle.
Green Bar: If the bar containing the scheduling information is green, all of the choices made for the plant, soil crop, irrigation system design parameters can be accommodated by the irrigation system restrictions that have been selected. See Figure 7.
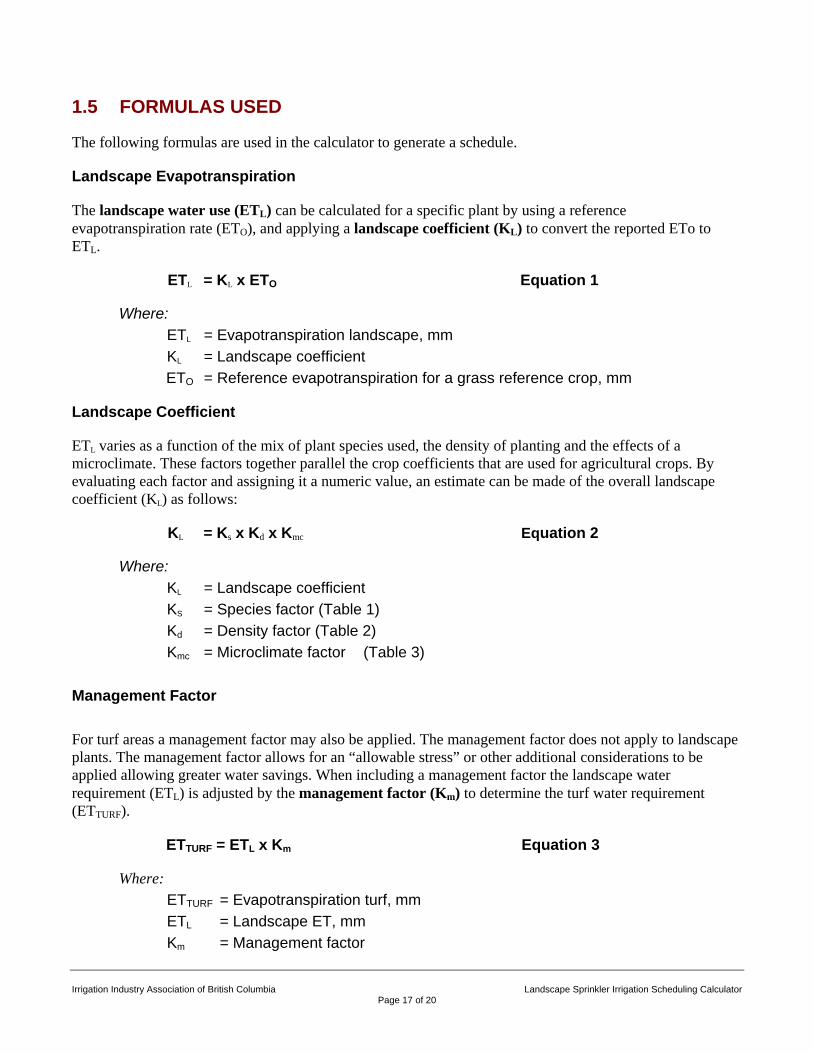
Orange Bar: In some cases the calculator may determine the need for three or more days of irrigation per week while the watering restrictions only allow two days of watering per week. The box on the bottom of the calculator will then turn orange. In these cases it is likely that the turf rooting depth is not deep enough to accommodate a two day schedule. Most likely there is insufficient top soil to accommodate a deeper rooting depth or the turf has been irrigated too frequently and the plant has not established a deeper rooting depth.
Changing the rooting depth to a larger number will make the box turn green. To optimize irrigation system performance deeper rooting depths are better.
Figure 8 Irrigation System Scheduling Tab Outputs – Orange Bar
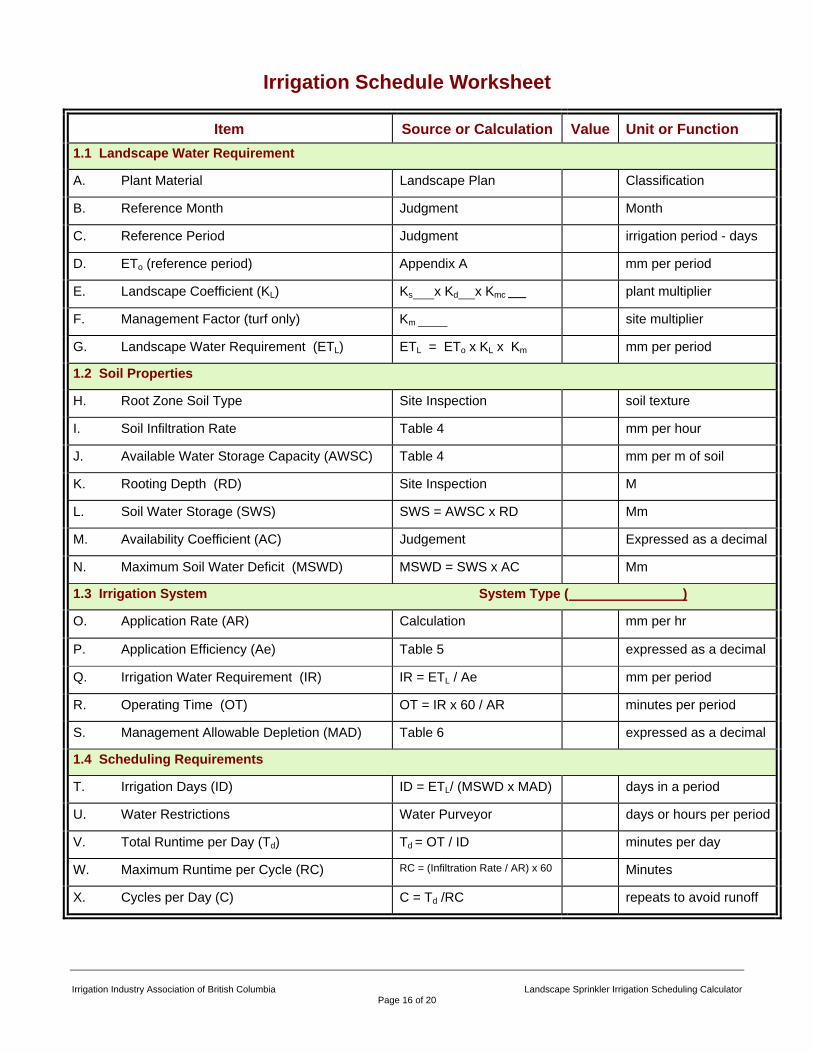
A summary of the data inputs and calculations can be printed out. The format for the landscape sprinkler will be similar to the worksheet shown on the next page.
Irrigation Industry Association of British Columbia Landscape Sprinkler Irrigation Scheduling Calculator
Page 15 of 20
Irrigation Industry Association of British Columbia Landscape Sprinkler Irrigation Scheduling Calculator
Page 16 of 20
Irrigation Schedule Worksheet
Item Source or Calculation Value Unit or Function 1.1 Landscape Water Requirement
A. Plant Material Landscape Plan Classification
B. Reference Month Judgment Month
C. Reference Period Judgment irrigation period - days
D. ETo (reference period) Appendix A mm per period
E. Landscape Coefficient (KL) Ks x Kd x Kmc . plant multiplier
F. Management Factor (turf only) Km site multiplier
G. Landscape Water Requirement (ETL) ETL = ETo x KL x Km mm per period
1.2 Soil Properties
H. Root Zone Soil Type Site Inspection soil texture
I. Soil Infiltration Rate Table 4 mm per hour
J. Available Water Storage Capacity (AWSC) Table 4 mm per m of soil
K. Rooting Depth (RD) Site Inspection M
L. Soil Water Storage (SWS) SWS = AWSC x RD Mm
M. Availability Coefficient (AC) Judgement Expressed as a decimal
N. Maximum Soil Water Deficit (MSWD) MSWD = SWS x AC Mm
1.3 Irrigation System System Type ( )
O. Application Rate (AR) Calculation mm per hr
P. Application Efficiency (Ae) Table 5 expressed as a decimal
Q. Irrigation Water Requirement (IR) IR = ETL / Ae mm per period
R. Operating Time (OT) OT = IR x 60 / AR minutes per period
S. Management Allowable Depletion (MAD) Table 6 expressed as a decimal
1.4 Scheduling Requirements
T. Irrigation Days (ID) ID = ETL/ (MSWD x MAD) days in a period
U. Water Restrictions Water Purveyor days or hours per period
V. Total Runtime per Day (Td) Td = OT / ID minutes per day
W. Maximum Runtime per Cycle (RC) RC = (Infiltration Rate / AR) x 60 Minutes
X. Cycles per Day (C) C = Td /RC repeats to avoid runoff
Irrigation Industry Association of British Columbia Landscape Sprinkler Irrigation Scheduling Calculator
Page 17 of 20
1.5 FORMULAS USED
The following formulas are used in the calculator to generate a schedule.
Landscape Evapotranspiration
The landscape water use (ETL) can be calculated for a specific plant by using a reference evapotranspiration rate (ETO), and applying a landscape coefficient (KL) to convert the reported ETo to ETL.
ETL = KL x ETO Equation 1
Where: ETL = Evapotranspiration landscape, mm KL = Landscape coefficient ETO = Reference evapotranspiration for a grass reference crop, mm
Landscape Coefficient
ETL varies as a function of the mix of plant species used, the density of planting and the effects of a microclimate. These factors together parallel the crop coefficients that are used for agricultural crops. By evaluating each factor and assigning it a numeric value, an estimate can be made of the overall landscape coefficient (KL) as follows:
KL = Ks x Kd x Kmc Equation 2
Where: KL = Landscape coefficient KS = Species factor (Table 1) Kd = Density factor (Table 2) Kmc = Microclimate factor (Table 3)
Management Factor
For turf areas a management factor may also be applied. The management factor does not apply to landscape plants. The management factor allows for an “allowable stress” or other additional considerations to be applied allowing greater water savings. When including a management factor the landscape water requirement (ETL) is adjusted by the management factor (Km) to determine the turf water requirement (ETTURF).
ETTURF = ETL x Km Equation 3
Where: ETTURF = Evapotranspiration turf, mm ETL = Landscape ET, mm Km = Management factor
Irrigation Industry Association of British Columbia Landscape Sprinkler Irrigation Scheduling Calculator
Page 18 of 20
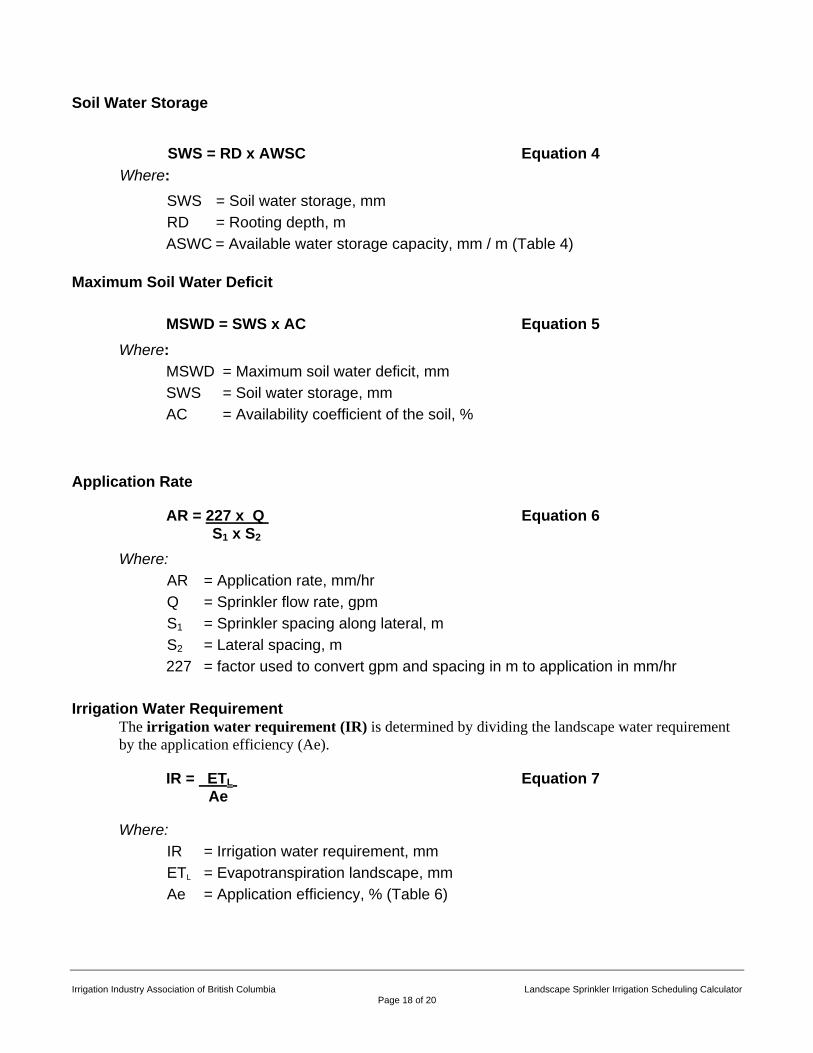
Soil Water Storage
SWS = RD x AWSC Equation 4
Where: SWS = Soil water storage, mm RD = Rooting depth, m
ASWC = Available water storage capacity, mm / m (Table 4)
Maximum Soil Water Deficit
MSWD = SWS x AC Equation 5 Where:
MSWD = Maximum soil water deficit, mm SWS = Soil water storage, mm
AC = Availability coefficient of the soil, %
Application Rate
AR = 227 x Q Equation 6 S1 x S2
Where: AR = Application rate, mm/hr Q = Sprinkler flow rate, gpm S1 = Sprinkler spacing along lateral, m S2 = Lateral spacing, m 227 = factor used to convert gpm and spacing in m to application in mm/hr
Irrigation Water Requirement
The irrigation water requirement (IR) is determined by dividing the landscape water requirement by the application efficiency (Ae).
IR = ETL Equation 7 Ae
Where: IR = Irrigation water requirement, mm ETL = Evapotranspiration landscape, mm Ae = Application efficiency, % (Table 6)
Irrigation Industry Association of British Columbia Landscape Sprinkler Irrigation Scheduling Calculator
Page 19 of 20
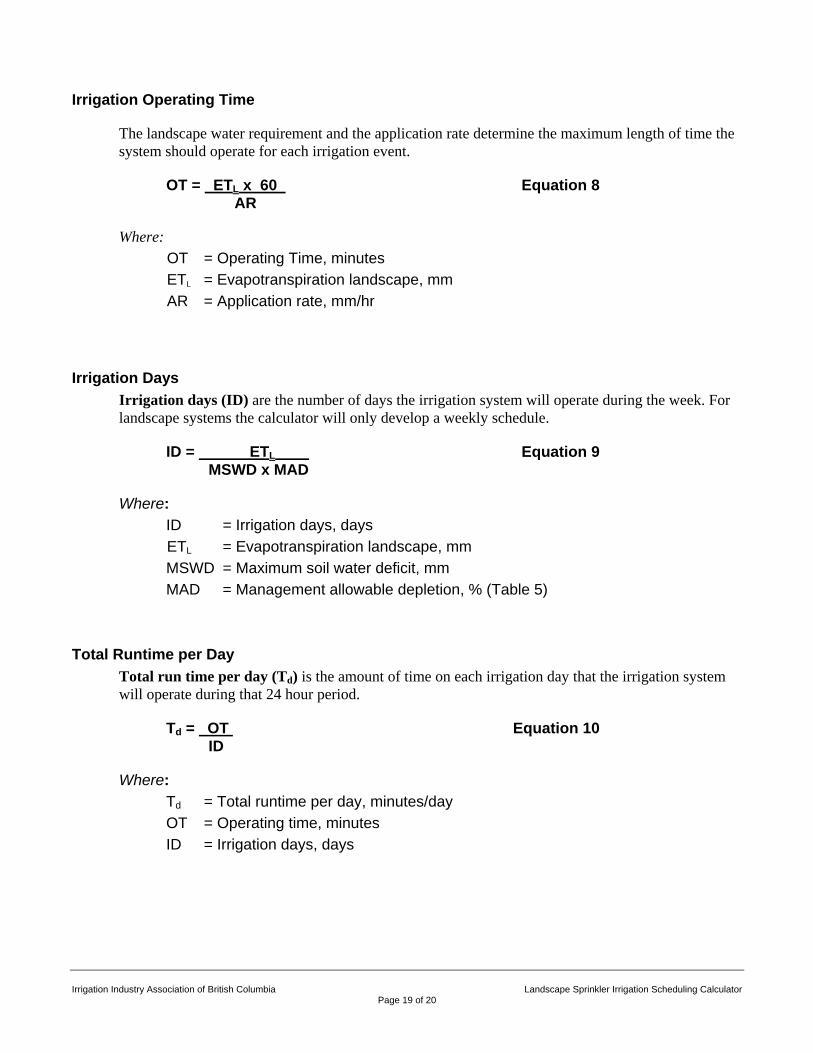
Irrigation Operating Time
The landscape water requirement and the application rate determine the maximum length of time the system should operate for each irrigation event.
OT = ETL x 60 Equation 8 AR
Where: OT = Operating Time, minutes ETL = Evapotranspiration landscape, mm AR = Application rate, mm/hr
Irrigation Days
Irrigation days (ID) are the number of days the irrigation system will operate during the week. For landscape systems the calculator will only develop a weekly schedule.
ID = ETL Equation 9 MSWD x MAD
Where: ID = Irrigation days, days ETL = Evapotranspiration landscape, mm MSWD = Maximum soil water deficit, mm MAD = Management allowable depletion, % (Table 5)
Total Runtime per Day
Total run time per day (Td) is the amount of time on each irrigation day that the irrigation system will operate during that 24 hour period.
Td = OT Equation 10 ID
Where: Td = Total runtime per day, minutes/day OT = Operating time, minutes ID = Irrigation days, days
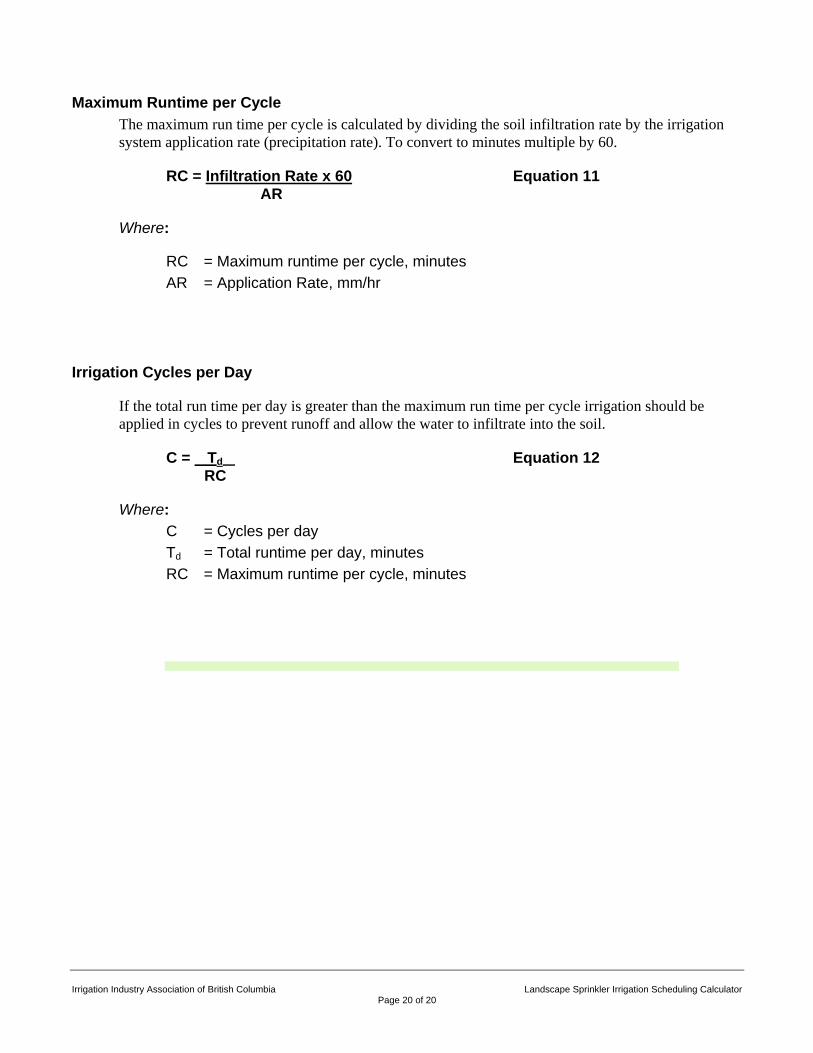
Maximum Runtime per Cycle
The maximum run time per cycle is calculated by dividing the soil infiltration rate by the irrigation system application rate (precipitation rate). To convert to minutes multiple by 60.
RC = Infiltration Rate x 60 Equation 11 AR
Where:
RC = Maximum runtime per cycle, minutes AR = Application Rate, mm/hr
Irrigation Cycles per Day
If the total run time per day is greater than the maximum run time per cycle irrigation should be applied in cycles to prevent runoff and allow the water to infiltrate into the soil.
C = Td Equation 12 RC
Where: C = Cycles per day Td = Total runtime per day, minutes RC = Maximum runtime per cycle, minutes
Irrigation Industry Association of British Columbia Landscape Sprinkler Irrigation Scheduling Calculator
Page 20 of 20