Landscape genetics and sociobiology of Gould‘s long€¦ · Landscape genetics and sociobiology...
129
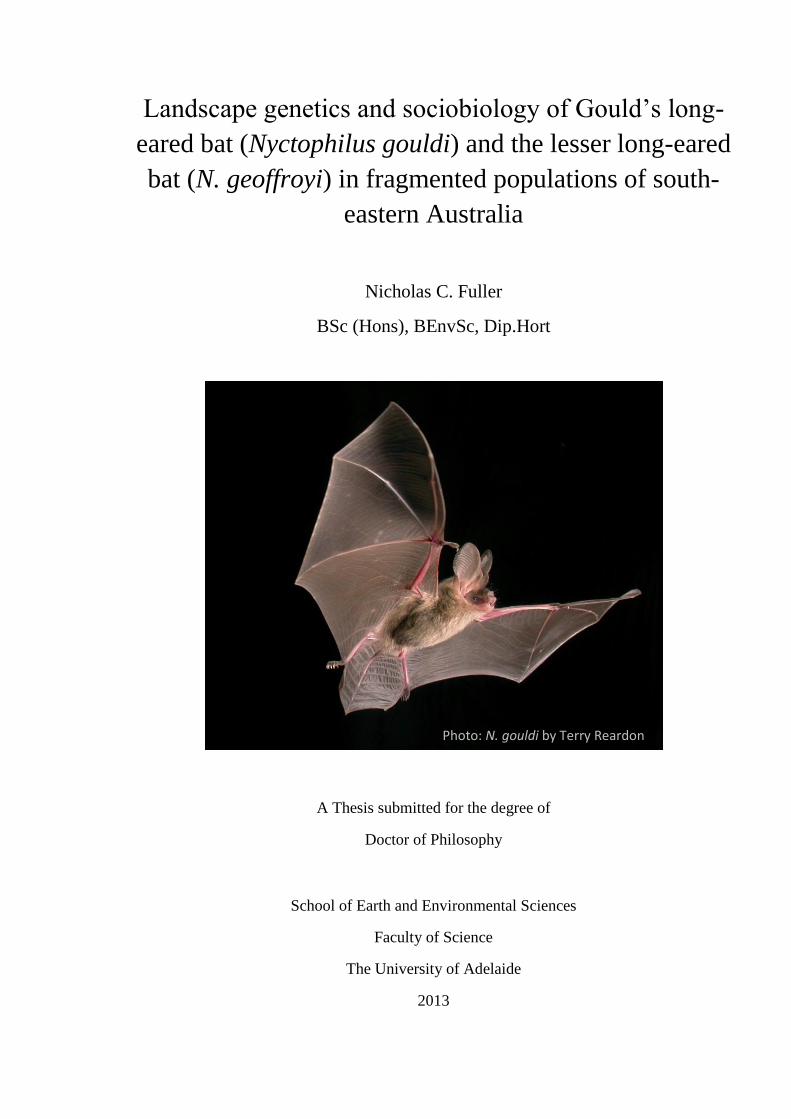
Landscape genetics and sociobiology of Gould‘s long- eared bat (Nyctophilus gouldi) and the lesser long-eared bat (N. geoffroyi) in fragmented populations of south- eastern Australia Nicholas C. Fuller BSc (Hons), BEnvSc, Dip.Hort A Thesis submitted for the degree of Doctor of Philosophy School of Earth and Environmental Sciences Faculty of Science The University of Adelaide 2013 Photo: N. gouldi by Terry Reardon
Transcript of Landscape genetics and sociobiology of Gould‘s long€¦ · Landscape genetics and sociobiology...
Landscape genetics and sociobiology of Gould‘s long-
eared bat (Nyctophilus gouldi) and the lesser long-eared
bat (N. geoffroyi) in fragmented populations of south-
eastern Australia
Nicholas C. Fuller
BSc (Hons), BEnvSc, Dip.Hort
A Thesis submitted for the degree of
Doctor of Philosophy
School of Earth and Environmental Sciences
Faculty of Science
The University of Adelaide
2013
Photo: N. gouldi by Terry Reardon
2
Table of Contents
List of Figures………………………………………………………………………………….3
List of Tables…………………………………………………………………………………..6
Acknowledgements………………………………………………………………………… …8
Thesis Abstract…………………………………………………………………………….....10
Statement of Authorship……………………………………………………………………...13
Chapter 1: …………………………………………………………………………………...15
Nicholas C. Fuller. General Introduction.
Chapter 2: …………………………………………………………………………………...25
Nicholas C. Fuller, Susan M. Carthew and Steven J. B. Cooper. Isolation and characterisation
of 16 microsatellite markers for the endangered Gould‘s long-eared bat (Nyctophilus gouldi)
and cross-amplification in the lesser long-eared bat (N. geoffroyi).
Chapter 3:…………………………………………………………………………………...30
Nicholas C. Fuller, Susan M. Carthew and Steven J. B. Cooper. The influence of habitat
fragmentation on population connectivity and genetic diversity in a microbat, Gould‘s long-
eared bat (Nyctophilus gouldi).
Chapter 4:…………………………………………………………………………………...60
Nicholas C. Fuller, Susan M. Carthew and Steven J. B. Cooper. The comparative influence of
habitat fragmentation on two congeneric vespertilionids with near-identical morphology and
contrasting degrees of specialisation.
Chapter 5:…………………………………………………………………………………...83
Nicholas C. Fuller, Susan M. Carthew and Steven J. B. Cooper. Dispersal strategies, mating
systems and social structure in two species of long-eared bats, Nyctophilus geoffroyi and N.
gouldi.
Chapter 6:…………………………………………………………………………………..104
Nicholas C. Fuller. General Discussion.
References………………………………………………………………………………….. .113
3
List of Figures
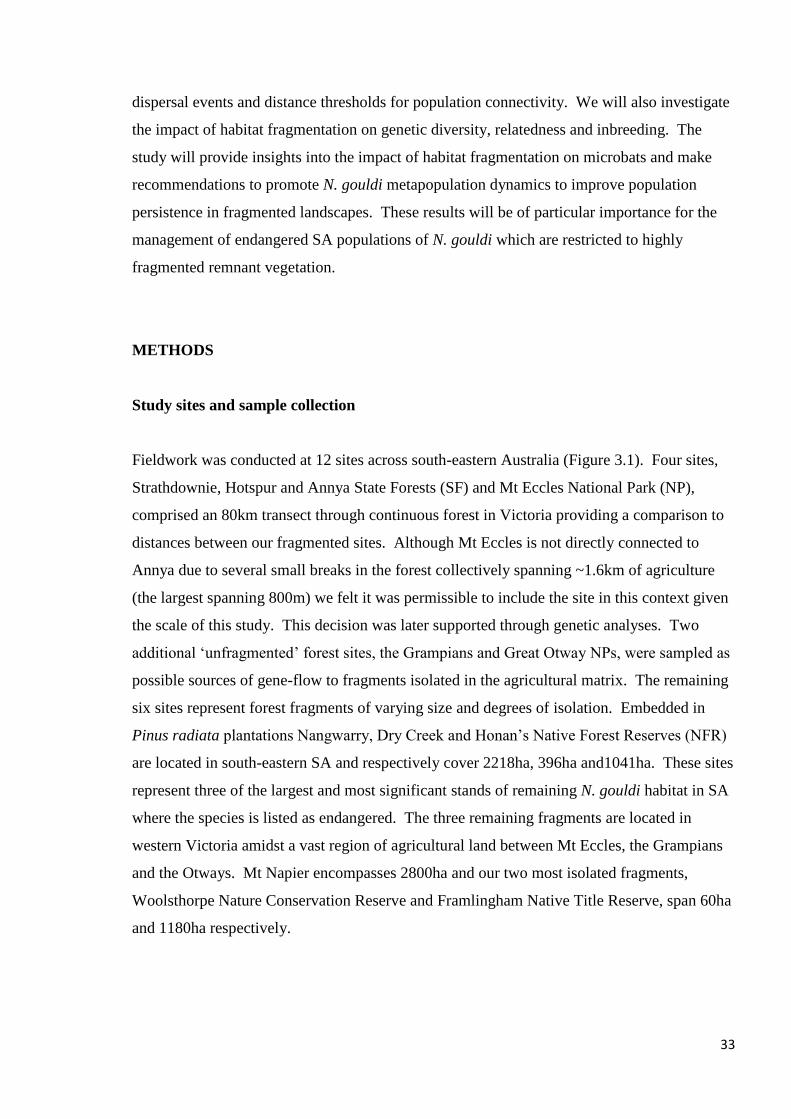
Figure 3.1
The distribution of 12 N. gouldi study sites across Victoria and South Australia. N. gouldi
were sampled in native vegetation (light grey) embedded within a matrix of hardwood (mid
grey) and softwood plantations (dark grey) and agricultural land (white).
Figure 3.2
Individual assignment plots from STRUCTURE (a), BAPS (b) and TESS (c). Two hundred
and twenty-nine N. gouldi individuals are represented along the x-axis by a vertical line
representing the posterior probability of membership (Q), indicated along the y-axis, to
genetic clusters (K) defined in the respective legend adjacent to each plot. Three white lines
in Figure 3.2c indicate additional clusters that have been ignored due to underrepresentation
(see text regarding BAPS results). Nine sampled populations are defined below the x-axis:
Nan = Nangwarry, Hon = Honans, Dry = Dry Creek, Ann = Annya, Otw = Otways, Gra =
Grampians, MtE = Mt Eccles, Hot = Hotpur, Str = Strathdownie.
Figure 3.3
Spatial plot displaying the membership of N. gouldi individuals to three genetic clusters
identified in TESS. Clusters are mapped via a Voronoi tessellation with black circles
representing sampling locations and clusters defined as: Cluster 1 (dark grey), Cluster 2 (light
grey) and Cluster 3 (mid grey). Nine sampled populations are represented: Nan = Nangwarry,
Hon = Honans, Dry = Dry Creek, Ann = Annya, Otw = Otways, Gra = Grampians, MtE = Mt
Eccles, Hot = Hotpur, Str = Strathdownie.
Figure 3.4
GENELAND results for N. gouldi illustrating the geographic distribution of four identified
genetic clusters based on the posterior probability of individuals belonging to Cluster 1 (a),
Cluster 2 (b), Cluster 3 (c) and Cluster 4 (d). White indicates a high probability of assignment
to a given cluster while dark orange indicates low probability of assignment. Nine sampled
populations are represented: Nan = Nangwarry, Hon = Honans, Dry = Dry Creek, Ann =
Annya, Otw = Otways, Gra = Grampians, MtE = Mt Eccles, Hot = Hotpur, Str =
Strathdownie.
4
Figure 3.5
Results of spatial autocorrelations preformed in GENALEX illustrating mean r (____
) with
95% upper and lower confidence levels (……
). Distance classes are displayed along the x-axis
in km. Figures represent: (a) Sites connected by continuous habitat, and (b) Sites fragmented
by agricultural land.
Figure 4.1
The distribution of 14 N. geoffroyi and N. gouldi study sites across Victoria and South
Australia. Nyctophilus were sampled in native vegetation (light grey) embedded within a
matrix of hardwood (mid grey) and softwood plantations (dark grey) and agricultural land
(white).
Figure 4.2
GENELAND results illustrating the geographic distribution of two identified genetic clusters
based on the posterior probability (Q) of 502 N. geoffroyi individuals belonging to Cluster 1
(a) and Cluster 2 (b). Colours represent a gradient of proportional assignment ranging from
high (white>0.9) to low (red<0.1). The sampling location of each individual is represented by
a black circle at one of fourteen study sites across south-eastern South Australia and western
Victoria.
Figure 4.3
Results of spatial autocorrelations preformed in GENALEX illustrating mean r (____
) along the
Y axis with 95% upper and lower confidence levels (……
). Distance classes are displayed
along the X axis in km. Figures represent: (a) all sites, (b) sites connected by continuous
habitat, and (c) sites fragmented by agricultural land.
Figure 5.1
The distribution of 14 N. geoffroyi and N. gouldi study sites across Victoria and South
Australia. Nyctophilus were sampled in native vegetation (light grey) embedded within a
matrix of hardwood (mid grey) and softwood plantations (dark grey) and agricultural land
(white). The location of three N. geoffroyi roosts in farm buildings is displayed in the lower
expansion showing their proximity to Warreanga NFR.
Figure 5.2
Results of spatial autocorrelations preformed in GENALEX illustrating mean r (____
) with
95% upper and lower confidence levels (……
). Distance classes are displayed along the x-axis
in km. Figures represent: (a) N. gouldi males, (b) N. gouldi females, (c) N. geoffroyi males,
and (d) N. geoffroyi females.
5
Figure 5.3
Social structure based on parent-offspring, full siblings, half siblings and cousins identified
using KINGROUP for populations of N. gouldi ( ) and N. geoffroyi ( ), and within three
artificial N. geoffroyi roosts ( ). Females ( ) and males ( ) are compared in terms of
the percentage of individuals with a relative in each category.
Figure 5.4
Comparison of social structure based on parent-offspring, full siblings, half siblings and
cousins identified using KINGROUP. Three groups are compared: populations of N. gouldi
( ) (n=256) and N. geoffroyi ( ) (n=502), and three N. geoffroyi roosts ( ) (n=157). Light
shades indicate female-female relatives ( ), dark shades male-male ( ), and striation
of light and dark shades indicates female-male relatives ( ). Figure (a) compares the total
number of female-female, male-male, and female-male related pairs. Figure (b) compares the
number of related pairs assigned to each class of sexual dyad and within each of the four
relative categories.
Figure 5.5
Mean (─) population and roost relatedness (r) for (a) N. gouldi, and (b) N. geoffroyi. Upper
and lower confidence limits (95%) (─) that there is no difference between the populations and
roosts based on 9999 permutations. Error bars based on bootstrap re-sampling (9999
bootstraps).
Figure 5.6
Distribution and frequency of pairwise relatedness (r) values comparing females ( ), males
( ) and both sexes ( ) for (a) N. gouldi populations (females 1288 comparisons, males 1368
comparisons, both sexes 4756 comparisons), (b) N. geoffroyi populations (females 2342
comparisons, males 3175 comparisons, both sexes 10396 comparisons), and (c) N. geoffroyi
roosts (females 2236 comparisons, males 420 comparisons, both sexes 4476 comparisons).
6
List of Tables
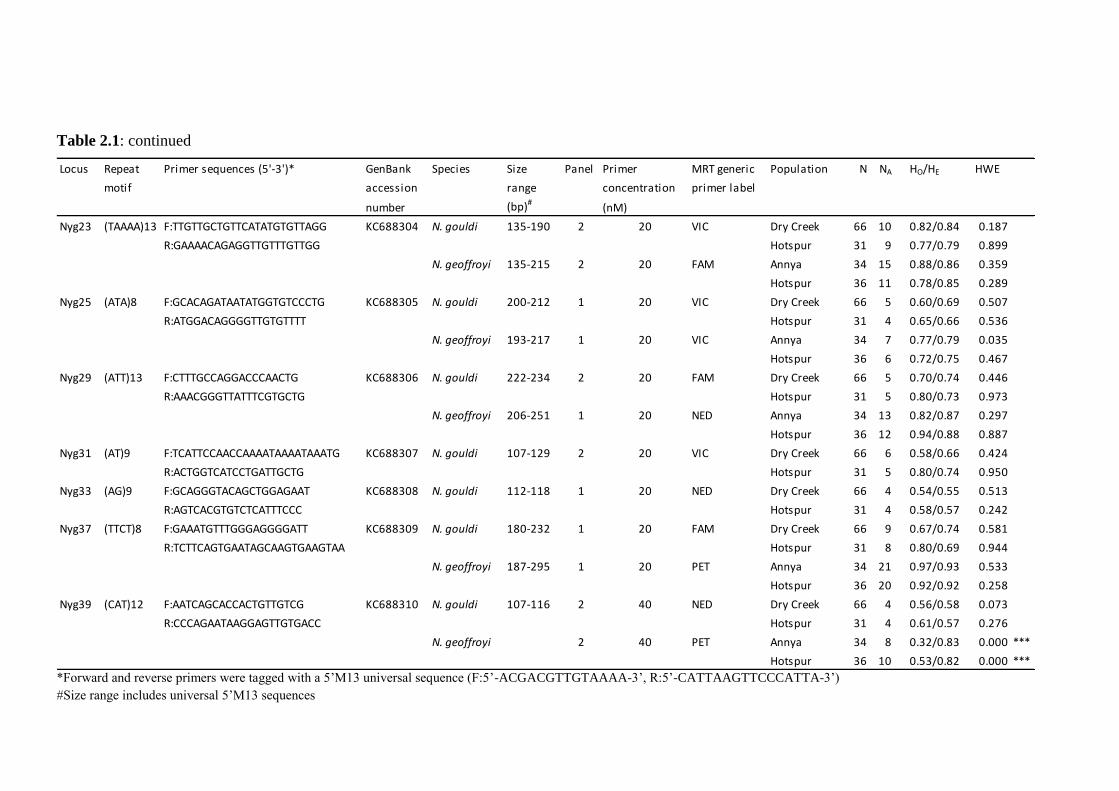
Table 2.1
Sixteen microsatellite primer sequences isolated from N. gouldi and their characteristics in
two species of Nyctophilus.
Table 3.1
Population differentiation calculated from 15 loci across nine populations of N. gouldi. FST
(Arlequin) below the diagonal and Dest (DEMEtics) above with p values provided before
(*,**,***) and after (*,**,***) sequential Bonferroni correction respectively indicating 0.05,
0.01 and 0.001 levels of significance. Nine populations are defined as: Nan = Nangwarry,
Hon = Honans, Dry = Dry Creek, Ann = Annya, Otw = Otways, Gra = Grampians, MtE = Mt
Eccles, Hot = Hotpur, Str = Strathdownie.
Table 3.2
Summary of dispersal events detected in GENECLASS displaying resident and source
populations. Distance (km) of dispersal events are given as the amount of agricultural land
crossed (agricultural distance) and total linear distance. Dispersal events were determined
with a significance threshold of p<0.05.
Table 3.3
Summary of population genetic measures and sample numbers across nine N. gouldi
populations. N = number of samples, AR = allelic richness, AP = private alleles, HO =
observed heterozygosity, HE = expected heterozygosity, SH = standardised heterozygosity, IR
= internal relatedness, FIS = the inbreeding coefficient, and the number of male and female
individuals. Fragmented sites are indicated in parentheses (f).
Table 3.4
Summary of relationship classes detected in KINGROUP and the number of dyads for each
class at nine N. gouldi populations. Fragmented sites are indicated in parentheses (f).
Relationships were established with a confidence level of p<0.05.
Table 4.1
Population differentiation measures estimated from 7 loci across 14 populations of N.
geoffroyi. FST (ARLEQUIN) below the diagonal and Dest (DEMEtics) above with p values
provided before (*,**,***) and after (*,**,***) sequential Bonferroni correction respectively
indicating 0.05, 0.01 and 0.001 levels of significance.
7
Table 4.2
Identification of dispersal events in GENECLASS determined with a significance level of
p<0.05. The inferred source population and the population in which an individual was
trapped are displayed. Fourteen sampled populations are defined: Nan = Nangwarry, War =
Warreanga, Dry = Dry Creek, Hon = Honans, Ann = Annya, Wee = Weecurra, Otw =
Otways, Gra = Grampians, MtN = Mt Napier, MtE = Mt Eccles, Hot = Hotpur, Str =
Strathdownie.
Table 4.3
Summary of population genetic measures and sample numbers across 14 N. geoffroyi
populations. N = number of samples, AR = allelic richness, AP = private alleles, HO =
observed heterozygosity, HE = expected heterozygosity, SH = standardised heterozygosity, IR
= internal relatedness, FIS = the inbreeding coefficient.
Table 4.4
Pairs of relatives identified using KINGROUP. Four types of relationships were examined:
parent-offspring, full siblings, half siblings and cousins. Results are presented for 14
populations across south-eastern South Australia and western Victoria. Relationships were
established with a confidence level of p<0.05.
8
Acknowledgements
I would like to thank my supervisors Steve Cooper and Sue Carthew for their support,
guidance and patience throughout my candidature. It was a gamble to move to Adelaide and
work with two academics who I had not met and I consider myself very fortunate to have had
two such likable, down to earth, insightful and resourceful supervisors. You have my
sincerest thanks.
I would like thank the South Australian Department of Environment, Water and Natural
Resources (South East) and Terry Reardon (South Australian Museum) for the loan of harp
traps to facilitate the study. I thank Sally for extensive field assistance, and Tony, Paul,
Roberta, Adam and Daniel for their assistance with fieldwork. Special thanks to Kathy Saint
for tireless assistance and advice with laboratory work; you are a precious resource and my
work would not have been possible without your considerable input. I would also like to
thank Alison Fitch for always being approachable and providing guidance with laboratory
matters.
I would like to give a special thanks to the community at Framlingham for providing
accommodation and site access to conduct trapping at the Framlingham Native Title Reserve.
I also thank Hancock Victorian Plantations for the provision of accommodation during
fieldwork and the following businesses for providing discounted accommodation rates during
fieldwork: Grampians Retreat and Field Study Centre; Narrawong Holiday Park; Otway
Tourist Park, and Southern Grampians Cottages. Finally I would like to thank Warrnambool
Field and Game for allowing us to trap on their club grounds at Woolsthorpe.
Thanks to Chris Medlin for the production of locality maps and GIS knowhow. Maps were
produced with spatial data generously provided by: Commonwealth of Australia (Geoscience
Australia), 2006. (Coastline, State border, Towns, Roads); State of Victoria (Dept Primary
Industries), 2009. (Victorian Land Use Information System, 2009). And; State of South
Australia (Dept Environment, Water & Natural Resources), 2008. (SE NRM Region Land
Use, 2008).
9
I would also like to acknowledge the comradery and support of my lab group and colleagues,
including but not limited to Jasmin, Sally, Bec, Ceci, Seba, Amanda, You-you, Leah,
Annabel, Andrew, Tim, Emmy and Casey. I would also like to single out Terry Reardon for
his generosity and field mentoring; you were instrumental in inspiring this work and I thank
you for driving me batty.
Last but not least I would like to thank my parents Paul and Roberta for their unwavering
support and belief in me throughout this journey. I could not have asked for better parents or
friends.
This research project was funded by the following sources:
Holsworth Wildlife Research Endowment
Lirabenda Endowment Fund, Field Naturalists Society of South Australia
Native Vegetation Research Fund, Native Vegetation council
Nature Foundation SA Inc
Sir Mark Mitchell Research Foundation
Wildlife Conservation Fund, Department of Environment, Water and Natural Resources, SA
We thank these granting bodies for making this research possible.
10
Thesis Abstract
Habitat fragmentation represents one of the greatest threats to biodiversity, yet for the second
largest mammalian order Chiroptera we have only just begun to assess the impacts of this
threatening process on population connectivity and genetic diversity. Many aspects of
chiropteran ecology remain unknown due to their cryptic lifestyle and difficulties in applying
traditional observational and field-based techniques. At the time of this PhD project‘s
conception there were no published studies utilising genetic techniques to address the
influence of habitat fragmentation on any chiropteran species. Since that time two studies
have been published, in 2009 and 2011. I add to this new body of literature by conducting
genetic analyses to assess population connectivity and genetic diversity in two congeneric
vespertilionids, Nyctophilus gouldi and N. geoffroyi. The study was conducted in western
Victoria and south-eastern South Australia across a landscape comprising continuous and
fragmented regions of native habitat. Populations within continuous forest provided a
benchmark for parameters including gene flow, genetic diversity and social structure, for
comparison with forest fragments. This thesis also capitalises on the underutilised potential
of molecular techniques for the study of chiropterans. I applied molecular approaches to
assess dispersal strategies and social structure in both species offering novel ecological
insights. Four data chapters covering these topics are outlined below.
Chapter 2 describes the isolation and characterisation of 16 microsatellite markers developed
to facilitate this research. I utilised next generation sequencing technology (454) to generate a
microsatellite DNA library and employed Multiplex Ready Technology (MRT) as a flexible
and cost effective method to test primers and design marker panels for screening. DNA was
isolated from N. gouldi resulting in 15 loci, while cross amplification in N. geoffroyi produced
7 reliable loci.
Chapter 3 addresses the impact of habitat fragmentation on the forest and woodland specialist
N. gouldi, which is listed as endangered in South Australia. Based on roosting requirements,
rarity in the agricultural landscape and limited dispersal ability I predicted that N. gouldi
populations would display reduced gene flow and signs of isolation as a result of habitat
fragmentation. This prediction was confirmed by my analyses which identified reduced
population connectivity, decreased genetic diversity, elevated measures of relatedness and

11
inbreeding, and altered demography within fragmented populations isolated by ≥27km of
agricultural land. Agricultural distances <2km did not influence population connectivity
providing a benchmark for habitat restoration to improve connectivity and mitigate population
isolation in this species. Management recommendations include the enhancement of
population connectivity between threatened SA populations, and recognition of a unique
Management Unit at the Grampians National Park.
The forth chapter investigates the influence of habitat fragmentation on N. geoffroyi for
comparison with N. gouldi. In contrast to N. gouldi, N. geoffroyi is a habitat generalist that
occupies a diverse range of ecosystems and which is commonly recorded within agricultural
landscapes. N. geoffroyi‘s presence in modified habitat coupled with plastic ecology and
roosting requirements led to the prediction that the species would display limited impacts
from habitat fragmentation. My analyses again confirmed this prediction with N. geoffroyi
displaying virtually no response to habitat fragmentation and a panmictic population structure
across the study region. The comparison between N. geoffroyi and N. gouldi provided an
opportunity to test the merit of several proposed predictors of bat vulnerability to habitat
fragmentation, in particular wing morphology, matrix tolerance, specialisation and geographic
range. The much touted predictor wing morphology failed to predict differing responses from
the two species while the following three predictors listed above received further support
from this study. I conclude that wing morphology may still be a useful predictor of bat
vulnerability to habitat fragmentation when coupled with other indicators such as matrix
tolerance and habitat specialisation.
The fifth and final data chapter utilises molecular analyses to assess several previously
unknown aspects of N. gouldi and N. geoffroyi ecology, dispersal strategies, mating systems
and social structure. N. gouldi displayed patterns consistent with female natal philopatry,
male biased dispersal and a polygynous mating system, while no such evidence was found for
N. geoffroyi. Results for N. geoffroyi may have been influenced by larger population sizes
which, coupled with higher dispersal rates, may have masked any evidence of sex-biased
dispersal. Both species displayed significant numbers of relatives at the population level,
with N. gouldi displaying particularly high levels of related females. N. geoffroyi displayed
higher numbers of relatives at the roost level indicating that kin selection may play an
important role in social structure and cooperative roosting. Despite significant numbers of
related N. geoffroyi at the roost level, the vast majority of pairwise comparisons indicated no

12
relationship between individuals suggesting that the dominant driver of sociality and
cooperative behaviour may not be solely based on relatedness. Nevertheless, high incidence
of related females at the population level for N. gouldi, and at the roost level for N. geoffroyi,
suggests that the bonds between related females are an important aspect of Nyctophilus
behavioural ecology and social structure.
13
Statement of Authorship
I certify that this work contains no material which has been accepted for the award of any
other degree or diploma in any university or other tertiary institution to Nicholas Fuller and,
to the best of my knowledge and belief, contains no material previously published or written
by another person, except where due reference has been made in the text. In addition, I certify
that no part of this work will, in the future, be used in a submission for any other degree or
diploma in any university or other tertiary institution without the prior approval of the
University of Adelaide and where applicable, any partner institution responsible for the joint-
award of this degree.
This thesis represents an original and independent piece of work. All significant aspects of
the work were conducted by myself including field work, laboratory work, data analysis and
interpretation, the production of manuscripts and the procurement of ethics approval, research
permits and all funding accrued to facilitate this project. My supervisors Steven J. B. Cooper
and Susan M. Carthew contributed to the production of manuscripts and provided supervisory
support and guidance. S. Cooper provided additional guidance with data analysis and
interpretation.
GIS maps displayed as Figures 3.1, 4.1 and 5.1 were produced by Christopher J. Medlin and
the cover image, a photograph of N. gouldi, was taken by Terry Reardon.
This thesis is presented as a series of manuscripts with Chapters 2-5 intended for publication
in peer-reviewed journals co-authored by myself, and my supervisors Steven J. B. Cooper and
Susan M. Carthew.
I give consent to this copy of my thesis, when deposited in the University Library, being made
available for loan and photocopying, subject to the provisions of the Copyright Act 1968.
I also give permission for the digital version of my thesis to be made available on the web, via
the University‘s digital research repository, the Library catalogue and also through web
search engines, unless permission has been granted by the University to restrict access for a
period of time.
14
This research was conducted under Animal Ethics Permits from the University of Adelaide
and wildlife permits from the Department of Sustainability and Environment (DSE), the
Department for Environment, Water and Natural Resources (DEWNR) and the South
Australian Forestry Corporation.
Nicholas C. Fuller
15
Chapter 1
General Introduction
Chiroptera is the second most speciose mammalian order following Rodentia and contains
approximately 20% of described mammals (Wilson & Reeder 2005). Representing a
significant contribution to biodiversity bats also provide important ecosystem services
including plant pollination, seed dispersal and the suppression of insect populations (Kunz et
al. 2011). Despite these roles we have limited knowledge regarding the ecology of this mega-
diverse order, particularly in regards to more cryptic aspects of ecology such as social
structure, dispersal strategies and mating systems (Burland & Worthington Wilmer 2001).
Similarly we know little about how species within the group respond to key threatening
processes such as habitat fragmentation, which has been recognised globally as one of the
major threats facing terrestrial species (Baillie et al. 2004; Bennett 2003). This lack of
information compromises our capacity to effectively manage and conserve chiropteran
species, particularly in regards to the threat posed by habitat fragmentation.
This thesis aims to address these issues by conducting landscape and population genetic
analyses on two species of Nyctophilus, one of the most speciose and abundant Australian
genera of bats, and members of the largest chiropteran family Vespertilionidae. The study
was carried out in western Victoria and south-eastern South Australia across a region
comprising both small and expansive patches of fragmented remnant native forest amidst a
matrix of agricultural land. This landscape facilitated an investigation into the impact of
habitat fragmentation on genetic diversity and population connectivity, and assessments of
dispersal patterns and social structure. We define connectivity throughout this thesis as
‗functional connectivity‘ reflecting an organism‘s capacity to traverse the matrix between
fragmented habitat patches (Kindlmann & Burel 2008). We also use the term ‗population‘
loosely to describe field sites that may be connected via continuous habitat or fragmented by
agriculture. Consequently they do not necessarily represent discrete biologically defined
populations.
Gould‘s long-eared bat (N. gouldi) and the lesser long-eared bat (N. geoffroyi) are small
insectivores that roost in tree hollows and under bark and display wing morphology
16
characteristic of slow manoeuvrable flight believed unsuited to long distance travel (Fullard et
al. 1991). However, N. gouldi is a habitat specialist with a distribution limited to forest and
woodland in eastern and south-western Australia and has been listed as endangered on
Schedule 7 of the South Australia National Parks and Wildlife Act 1972 (Churchill 2008). In
contrast, N. geoffroyi is a habitat generalist that displays a ubiquitous distribution across
Australia and is commonly recorded in agricultural landscapes (Churchill 2008). Comparison
of the two species will provide a novel opportunity to test the validity of several proposed
predictive traits for bat extinction and vulnerability to habitat fragmentation, including: wing
morphology, geographic range, habitat specialisation and tolerance to the intervening matrix
between habitat patches (Davies et al. 2000; Henle et al. 2004; Jones et al. 2003; Laurance
1991; Meyer et al. 2008; Safi & Kerth 2004; Viveiros de Castro & Fernandez 2004).
We are only aware of two other published studies worldwide specifically designed to
investigate the impact of modern anthropogenic habitat fragmentation on bat population
connectivity and genetic diversity (Meyer et al. 2009; Struebig et al. 2011). Consequently
this research will significantly contribute to international knowledge regarding the
conservation and management of bat populations at a landscape scale. The results from this
research will also shed new light on cryptic aspects of long-eared bat ecology including
dispersal strategies, social structure and mating systems. Finally, our research will assist land
managers to effectively manage remnant native vegetation in south-eastern South Australia
and western Victoria to maximise conservation outcomes for indigenous species.
Habitat fragmentation
Habitat fragmentation can impose barriers to dispersal between populations disrupting
metapopulation dynamics and rendering populations isolated, thereby reducing their effective
size (Hanski 1998; Lindenmayer & Peakall 2000; Saunders et al. 1991). Population size is
the most important factor in determining population, and thus species, persistence (O'Grady et
al. 2004; Reed et al. 2003; Shaffer 1981). Larger populations have been shown to contain
higher levels of genetic diversity (Frankham 1996) which provides numerous benefits
including greater resistance to parasites and disease (O'Brien & Evermann 1988; Spielman et
al. 2004), greater adaptive plasticity to changing environmental pressures (Frankham et al.
1999; Reed & Frankham 2003) and enhanced evolutionary potential (Crandall et al. 2000;
Franklin & Frankham 1998). Small populations are diminished in these respects and with
17
decreasing size they become increasingly vulnerable to stochastic environmental events like
fire and disease, as well as genetic and demographic processes including inbreeding and
genetic drift (Caughley 1994; Frankham 1995; Lacy 1997; Shaffer 1981).
Population size is primarily determined by the extent of available habitat and by connectivity
between areas of suitable habitat (Fahrig & Paloheimo 1988; Saunders et al. 1991). Adequate
connectivity between habitat facilitates dispersal between populations allowing them to
function as larger and more robust metapopulations (Burkey 1989; Hanski 1998; Reed 2004).
In addition to increasing effective population sizes, this connectivity provides a safeguard
against events like fire by allowing neighbouring populations to recolonise habitat after
localised extinctions occur (Hanski 1998; Wilcox & Murphy 1985). Habitat connectivity is
also an important consideration for climate change as species may need to migrate with
shifting environmental conditions in order to persist in suitable habitat (Hannah et al. 2002;
Opdam & Wascher 2004).
The impact of habitat fragmentation on vertebrate species is varied (e.g. amphibians, Gibbs
1998; bats, Gorresen & Willig 2004; marsupials, Laurance 1990; and reptiles, Mac Nally &
Brown 2001). As a consequence species-specific research is ideally required to identify the
influence of habitat fragmentation on dispersal and population connectivity (Cushman 2006;
Debinski & Holt 2000). Information on dispersal thresholds will allow us to manage
populations in fragmented landscapes through landscape management that promotes
connectivity for improved population viability. However, due to the inherent paucity of
species-specific data, species level investigations can also serve as useful indications of the
potential response within genera, family and higher taxonomic classifications.
The impact of habitat fragmentation on chiropterans
Despite the vagility of chiropterans, mounting research has documented the impacts of habitat
fragmentation on bats, including changes to community composition and the disappearance of
species from forest fragments (Cosson et al. 1999; Estrada & Coates-Estrada 2002; Estrada et
al. 1993; Medina et al. 2007; Schulze et al. 2000). In Australia, the Action Plan for Bats
(Duncan et al. 1999) lists habitat loss (incorporating land clearing, fragmentation and
modification) as the primary threatening process for Australian bats with nearly 60% of
threatened Australian chiropterans receiving their threatened status due to this cause. The
18
Action Plan also identifies ‗the impact of forest fragmentation on bats at a landscape scale‘ as
a priority for research. To effectively manage bat populations in fragmented landscapes data
must be collected on population connectivity to identify thresholds for dispersal, and to
provide recommendations for landscape management to avoid or reverse population isolation
(Galindo-Gonzalez & Sosa 2003). To date, most studies investigating the impacts of habitat
fragmentation on bats have used traditional field-based techniques to assess changes in
species abundance and distribution, or have employed telemetry to study animal movements.
However, these approaches have their limitations. Studies of abundance and distribution only
document the aftermath of habitat fragmentation and fail to address the mechanisms behind
the changes that occur. Telemetric approaches can provide useful insights into animal
movements but they typically cannot distinguish between successful and unsuccessful
migration events, while cost and labour usually result in limited datasets, analytical power and
spatial scale (Hebblewhite & Haydon 2010). Genetic techniques can overcome these
shortcomings and allow for the generation of broad-scale population censuses across entire
landscapes and the identification of thresholds for gene flow and population connectivity.
Genetic studies have provided powerful insights into the influence of landscape features on
bat population connectivity and dispersal. Many chiropteran species display largely
panmictic populations across their range (McCracken et al. 1994; Sinclair et al. 1996; Webb
& Tidemann 1996). However, this is not always the case as now demonstrated by numerous
examples (Burland & Worthington Wilmer 2001). In particular, non-migratory species with
restricted or specialised habitat requirements can display high levels of population structure
(Armstrong 2009; Worthington Wilmer et al. 1999; Worthington Wilmer et al. 1994). It has
also been demonstrated that landscape features, including water bodies (Castella et al. 2000;
Salgueiro et al. 2008) and mountain ranges (Ruedi & Castella 2003), can act as significant
barriers to dispersal and population connectivity.
Several authors have specifically proposed that poor habitat connectivity has resulted in
increased population structure and reduced dispersal in bats. Campbell et al. (2009)
suggested that significant FST values between neighbouring populations of Myotis macropus
may be the result of limited dispersal due to reduced riparian habitat in the agricultural
landscape. Kerth and Petit (2005) also proposed that a barrier due to habitat fragmentation
could explain patterns in the population structure of Myotis bechsteinii. However, few
19
population or landscape genetic studies have been specifically designed to investigate the
influence of habitat fragmentation on bat populations.
Meyer et al. (2009) examined ~340bp of the mtDNA control region (d-loop) to assess the
response of two species of phyllostomid bats to habitat fragmentation caused by the creation
of an artificial reservoir in Panama. The study was conducted at a microgeographic scale and
compared haplotype diversity and population differentiation (FST) between isolated and
continuous forest sites. The less mobile of the two study species, Carollia perspicillata,
showed signs of genetic erosion and significant population differentiation as a result of forest
fragmentation. Their findings suggest that the <2km of open water isolating fragments
represented a critical threshold in population connectivity for C. perspicillata.
Struebig et al. (2011) employed microsatellite markers to investigate the comparative impact
of habitat fragmentation on community level species richness and allelic richness in a subset
of three species with varying ecology. Population differentiation (Jost‘s D and FST) was also
assessed but only the minimum and maximum values were reported along with a series of
Mantel tests to identify correlations between differentiation and three factors: community
dissimilarity (Morisita-Horn index), Euclidian distance, and effective (least-cost) distance.
Characterised by low population densities and limited dispersal power Kerivoula papillosa
displayed a significant correlation between allelic richness and fragment size, where genetic
diversity decreased with habitat area. There were no significant cases of population
differentiation, nor was there a significant relationship between population differentiation and
community dissimilarity for either distance measure.
Meyer et al. (2009) and Struebig et al. (2011) represent the only examples we are aware of
that have specifically aimed to assess the impacts of habitat fragmentation on genetic
diversity and population connectivity within Chiroptera. Although both studies found that the
least mobile of their study species was negatively affected by habitat fragmentation both
studies also had their limitations. The use of mtDNA by Meyer at al. (2009) limited the
analyses that could be applied and the results only reflected female-mediated gene flow.
Struebig et al. (2011) on the other hand used microsatellite markers, however, they did not
endeavour to identify thresholds for dispersal. Instead their goal was more theoretical in
nature as they sought to assess the relationship between declines in species and allelic
richness due to habitat fragmentation.
20
In addition to these two studies we are aware of another multispecies investigation (Rossiter
et al. 2012) utilising microsatellite markers to assess the impacts of habitat fragmentation on
population genetic structure in seven codistributed microbats. Currently the results have been
published on the analysis of population structure and gene flow through continuous forest
while the results from the analysis of fragmented populations are yet to be published. Their
initial investigation on continuous habitat suggests that roosting ecology and social structure
may influence dispersal limits and that tree roosting species characterised by reduced vagility
may be at greater risk to habitat fragmentation (Rossiter et al. 2012).
Identifying predictive traits associated with chiropteran vulnerability to habitat
fragmentation
Conservation biologists are attracted to the prospect of identifying traits linked to
vulnerability to threatening process as it permits the a priori identification of species at risk
(Mac Nally & Bennett 1997). This issue has received much attention in terms of predictors of
extinction risk and vulnerability to threatening processes. Proposed species traits include
abundance, geographic range, fecundity, longevity, rarity, specialisation, body size and
trophic position (Cardillo et al. 2008; Davidson et al. 2009; Henle et al. 2004; Laurance 1991;
O'Grady et al. 2004; Safi & Kerth 2004). Many of these traits have been assessed in relation
to habitat fragmentation, in addition to several others such as presence in the matrix and
mobility, that are specific to this threatening process (Davies et al. 2000; Foufopoulos & Ives
1999; Gehring & Swihart 2003; Henle et al. 2004; Laurance 1991; Lehtinen &
Ramanamanjato 2006; Mac Nally & Bennett 1997; Tscharntke et al. 2002; Viveiros de Castro
& Fernandez 2004; Wang et al. 2009; Watling & Donnelly 2007).
For bats, wing morphology has been proposed as an additional predictive trait and has
received some support in relation to sensitivity to habitat fragmentation (Albrecht et al. 2007;
Meyer et al. 2008) and extinction risk (Jones et al. 2003; Safi & Kerth 2004). Two particular
characteristics of wing morphology, low aspect ratio and low wing loading, have been linked
with specialisation for closed habitat (Safi & Kerth 2004). These wing characteristics
represent adaptations for slow manoeuvrable flight that are inefficient for long distance flight
(Norberg & Rayner 1987), possibly reflecting a restricted capacity for movement between
habitat fragments. N. gouldi and N. geoffroyi possess these wing characteristics and display
near-identical wing morphology (Brigham et al. 1997; Churchill 2008; Fullard et al. 1991;
21
Norberg & Rayner 1987). Consequently this predictive trait would suggest that both species
possess the same physical capacity for dispersal between fragmented patches of habitat.
However, differing degrees of ecological plasticity indicated by contrasting geographic
distributions (Churchill 2008), roosting specificity (Churchill 2008; Lunney et al. 1988;
Reardon & Flavel 1987) and occurrence in agricultural landscapes (Lumsden & Bennett 2005;
Lumsden et al. 2002a; Lumsden et al. 2002b) suggest that N. geoffroyi will possess a greater
resilience to habitat fragmentation than N. gouldi. Consequently the comparison between the
two species will test the reliability and relative influence of several proposed predictive traits
for vulnerability to habitat fragmentation including wing morphology, habitat specialisation,
geographic range and tolerance to the matrix between patches of remnant vegetation.
Chiropteran behavioural ecology
Chiropteran lifestyles are cryptic due to their nocturnality, flight and the fact they often
shelter in difficult to access locations; consequently their behavioural ecology has proven
difficult to study with traditional techniques (Burland & Worthington Wilmer 2001; Kerth
2008). As a result there is a paucity of information on chiropteran behavioural ecology
compared to other social mammals (Kerth 2008). However, modern molecular techniques
provide the tools to investigate these previously elusive aspects of chiropteran ecology
(Burland & Worthington Wilmer 2001; Kerth et al. 2002b). Due to these developments the
number of studies into chiropteran sociobiology is increasing, but the sheer size of the order
means there is much work to be done. Nevertheless, many insights have been gained over the
last two decades into chiropteran dispersal strategies (Arnold 2007; Kerth et al. 2002a; Petit &
Mayer 1999; Weyandt et al. 2005; Worthington Wilmer et al. 1999), social structures
(Furmankiewicz & Altringham 2007; Heckel et al. 1999; Kerth et al. 2000; Metheny et al.
2008; Ortega et al. 2003; Petri et al. 1997; Rivers et al. 2005; Rossiter et al. 2002; Storz et al.
2001; Veith et al. 2004; Wilkinson 1992a) and mating systems (Burland et al. 2001; Chaverri
et al. 2008; Heckel et al. 1999; Ortega et al. 2003; Rossiter et al. 2000; Veith et al. 2004).
We add to this growing pool of research by investigating dispersal strategies, social structure
and mating systems in two temperate vespertilionids, N. gouldi and N. geoffroyi. This aspect
of our research will further complement our investigation into habitat fragmentation as
dispersal patterns, social organisation and mating systems may play important roles in
22
chiropteran responses, as indicated by Meyer et al. (2009), Struebig et al. (2011) and Rossiter
et al . (2012).
Aims
The principal aim of this thesis is to address the lack of knowledge regarding the impact of
habitat fragmentation on bat population connectivity by conducting an assessment of N.
gouldi and N. geoffroyi population structure and gene flow across a landscape comprising
continuous and fragmented forest. We will develop a suite of microsatellite markers to
facilitate the study which will be used to compare gene flow between populations connected
through continuous forest and populations fragmented by agricultural land. Analyses will be
used to assess population structure across the landscape and to identify dispersal events and
distance thresholds for population connectivity. We will also investigate the impact of habitat
fragmentation on genetic diversity, relatedness and inbreeding. These results may prove
particularly important for the management of endangered South Australian populations of N.
gouldi which are restricted to highly fragmented and limited remnant vegetation.
The comparison of the two target species will provide an opportunity to test the merit of wing
morphology as a predictor of bat vulnerability to habitat fragmentation. With near-identical
wing morphology the predictive trait suggests that both species will respond in the same
manner. However, contrasting degrees of specialisation, varying geographic distributions and
differing use of agricultural habitat indicate the species may respond quite differently to
habitat fragmentation. Consequently the comparison represents a novel case to assess the
relative influence of these predictive traits, and provide a more robust framework for
predictions regarding chiropteran responses to habitat fragmentation.
Finally, this thesis will contribute to the growing body of research into chiropteran
sociobiology by investigating dispersal patterns, mating systems, and social organisation.
Modern molecular techniques represent the ideal tools to tackle many difficult questions in
ecology, especially in regards to the cryptic chiropterans, yet they remain under-utilised by
ecologists. The following research represents our efforts to employ these tools in order to
address several important gaps in our scientific knowledge regarding chiropterans and
facilitate better conservation outcomes for this important and intrinsically valuable group of
mammals.
23
This thesis comprises four data chapters presented in a manuscript style format. We plan to
submit these chapters as articles in publications such as Molecular Ecology and Conservation
Genetics. However, for the purpose of this thesis we have taken the liberty of exceeding the
journal word limits in order to present and discuss a greater proportion of the analyses
undertaken. The specific aims of the data chapters are outlined below.
Chapter 2: Isolation and characterisation of 16 microsatellite markers for the endangered
Gould‘s long-eared bat (Nyctophilus gouldi) and cross-amplification in the lesser long-eared
bat (N. geoffroyi)
Aims:
1. Develop a suite of microsatellite markers for N. gouldi and N. geoffroyi using next
generation sequencing methods.
Chapter 3: The influence of habitat fragmentation on population connectivity and genetic
diversity in a microbat, Gould‘s long-eared bat (Nyctophilus gouldi)
Aims:
1. Assess the impact of habitat fragmentation on N. gouldi (endangered in South Australia)
population structure, population differentiation and dispersal.
2. Test the hypothesis that fragmented populations of the forest specialist N. gouldi will
display signs of reduced genetic diversity, elevated relatedness and inbreeding, and altered
demography.
3. If N. gouldi is influenced by habitat fragmentation, identify a threshold for dispersal and
population connectivity.
4. Determine whether the fragmented and endangered South Australian populations of N.
gouldi are at risk of genetic threats associated with isolation and small population sizes.
Chapter 4: The comparative influence of habitat fragmentation on two congeneric
vespertilionids with near-identical morphology and contrasting degrees of specialisation
Aims:
1. Assess the impact of habitat fragmentation on N. geoffroyi using comparative analyses to
facilitate a direct comparison with N. gouldi.
2. Test the hypothesis that N. gouldi populations will be more impacted by habitat
fragmentation than N. geoffroyi due to increased habitat specialisation and sensitivity to
24
the matrix, instead of displaying similar responses as similarities in wing morphology
predict.
Chapter 5: Dispersal strategies and social structure in two species of long-eared bats,
Nyctophilus geoffroyi and N. gouldi
Aims:
1. Investigate dispersal patterns in N. gouldi and N. geoffroyi to determine if either species
displays a sex-bias in dispersal.
2. Infer mating systems from dispersal patterns, and assess maternity and paternity for
evidence of polygyny, polyandry and multiple paternity.
3. Assess social structure in N. gouldi and N. geoffroyi by identifying relatives at the
population level, and at the roost level for three roosting congregations of N. geoffroyi.
4. Assess the composition of long-eared bat populations to determine whether communities
consist of a random assortment of individuals, or whether family groups or related pairs
comprise a significant proportion of the population.
5. Assess the social composition of N. geoffroyi roosts for evidence of kin selection or
reciprocal altruism in cooperative roosting behaviour.
25
Chapter 2
Isolation and characterisation of 16 microsatellite markers for the
endangered Gould‘s long-eared bat (Nyctophilus gouldi) and cross-
amplification in the lesser long-eared bat (N. geoffroyi)
Nicholas C. Fuller1, Susan M. Carthew
1,2 and Steven J.B. Cooper
1,3
1 School of Earth & Environmental Sciences, The University of Adelaide
2 Research Institute for Environment and Livelihoods, Charles Darwin University
3 Evolutionary Biology Unit, South Australian Museum
ABSTRACT
Sixteen microsatellite markers were developed for use on two species of long-eared bats
(Nyctophilus). 454 pyrosequencing of genomic DNA was conducted on N. gouldi which is
listed as endangered in South Australia. Fifteen loci successfully amplified on N. gouldi
while nine cross-amplified for use on N. geoffroyi. Two populations from south-eastern
Australia were genotyped for each species comprising 91 individuals for N. gouldi and 70
individuals for N. geoffroyi. There was no evidence of linkage disequilibrium and all loci
displayed Hardy-Weinberg equilibrium except Nyg19 and Nyg39 which displayed evidence
of null alleles in both N. geoffroyi populations. These markers will prove valuable in
assessing connectivity between endangered populations of N. gouldi, and facilitate a
comparative investigation into the impacts of habitat fragmentation on two vespertilionids.
Keywords: Nyctophilus, Chiroptera, microsatellites, 454 pyrosequencing
Gould‘s long-eared bat (Nyctophilus gouldi) is a forest and woodland specialist that is listed
as endangered in South Australia under Schedule 7 of the South Australian National Parks
and Wildlife Act. The South Australian distribution of the species is restricted to highly
fragmented remnant habitat embedded within a matrix of pastoral land and Pinus radiata
plantations. The nature of this landscape raises concerns about the viability of endangered N.
gouldi populations.
To address N. gouldi conservation concerns we aimed to develop a suite of microsatellite
markers to assess population connectivity and genetic diversity. In addition to this objective,
26
we have recognised an opportunity to cross-amplify these markers on the habitat generalist N.
geoffroyi in order to compare the influence of habitat fragmentation between two congeneric,
sympatric and morphologically near-identical chiropterans with contrasting degrees of
specialisation. We are only aware of two published studies employing genetic techniques to
investigate the impact of habitat fragmentation on chiropterans (Meyer et al. 2009; Struebig et
al. 2011). Consequently this application will constitute a significant contribution towards
understanding the impact of habitat fragmentation on bats.
Using methods outlined by Gardner et al. (2011) we employed a partial pyrosequencing run
(½ plate) on a GS-FLX Titanium platform (Roche, 454 Life Sciences) at the Australian
Genome Research Facility (AGRF, Brisbane, Australia). This approach produced a total of
21460 sequences and 752 microsatellite loci. Forty sets of primer pairs were selected for
initial PCR trials on a single Nyctophilus gouldi individual. Nuclear DNA was extracted from
wing biopsies using the Gentra Puregene extraction kit (Gentra Systems Inc.). PCR
amplification was performed using ―multiplex-ready technology‖ (MRT) developed by
Hayden et al. (2008) whereby generic M13 tags are attached to the 5‘ end of locus-specific
primer sequences providing a flexible system for the design of locus panels for product
screening.
PCR was conducted in a volume of 12µl containing ~10ng of DNA, 75nM of fluorescently
labelled generic MRT forward primer (HEX) and 75nM of unlabelled reverse primer, four
different concentrations of each locus-specific primer were tested (10, 20, 40 & 60nM), 0.15U
Immolase DNA polymerase (Bioline, Luckenwalde, Germany) and 2.4µl of 5 ImmoBuffer
(Bioline). MRT PCR-amplification is performed in two stages following a 10 minute
denaturation period at 95°C. The first stage employs 5 cycles of: 60s at 92°C, 90s at 50°C,
60s at 72°C; followed by 20 cycles of: 30s at 92°C, 90s at 63°C, 60s at 72°C. The second
phase comprises 40 cycles of: 15s at 92°C, 30s at 54°C, 30s at 72°C, with a final extension of
30 min at 65°C after the cycles are complete. To confirm amplification and identify
unambiguous loci and optimum primer concentrations PCR products were visualised on a 6%
polyacrylamide gel using a GelScan2000 instrument (Corbett Research, Sydney, Australia).
From the initial 40 loci tested 32 passed electrophoretic screening and progressed for
subsequent tests of polymorphism using three individuals for each species. Loci were
assigned one of four fluorescently labelled generic MRT primers (FAM, NED, PET and VIC)
27
for visualisation of PCR products on an ABI3730 DNA Analyser (Applied Biosystems). PCR
was performed separately for each locus and products were pooled post PCR into two panels
for each species using a pooling ratio of 2:3:3:6 (VIC:FAM:NED:PET). GENEMAPPER
v.3.5.1 (Applied Biosystems) was used to score alleles. Fifteen loci were polymorphic and
reliably scorable for N. gouldi and nine for N. geoffroyi, including one locus that only
amplified in N. geoffroyi (Table 2.1).
GENALEX v.6 (Peakall & Smouse 2006) was used to assess allelic diversity and calculate
observed and expected heterozygosity. We used GENEPOP v.3.4 (Raymond & Rousset
1995) to test populations and loci for deviations from Hardy-Weinberg equilibrium (HWE)
and linkage disequilibrium (LD), and MICROCHECKER v.2.2.3 (Van Oosterhout et al.
2004) to detect typing errors and null alleles. Sequential Bonferroni corrections were made
for all tests involving multiple comparisons (Rice 1989).
Individuals were genotyped from Hotspur and Annya State Forests in Victoria and Dry Creek
Native Forest Reserve in South Australia (Table 2.1). The number of alleles for N. gouldi loci
ranged from 3 to 10 (mean=6), and from 6 to 21 for N. geoffroyi loci (mean=11). Observed
and expected heterozygosity ranged in N. gouldi from 0.323-0.839 and 0.377-0.842
respectively, and from 0.324-0.971 and 0.671-0.932 for N. geoffroyi. There was no evidence
of deviation from HWE or LD with the exception of Nyg19 and Nyg39 which significantly
deviated from HWE for both N. geoffroyi populations. This deviation was most likely due to
the presence of null alleles (Hotspur, Nyg19 r=0.212, Nyg39 r=0.170; Annya, Nyg19 r=0.221,
Nyg39 r=0.294). Assessment of heterozygosity revealed no evidence of sex-linked loci.
The 16 microsatellite markers presented here will facilitate an assessment of genetic diversity
and population structure for endangered South Australian populations of N. gouldi. These
markers will also provide a valuable insight into the comparative influence of habitat
fragmentation on two congeneric vespertilionids.
28
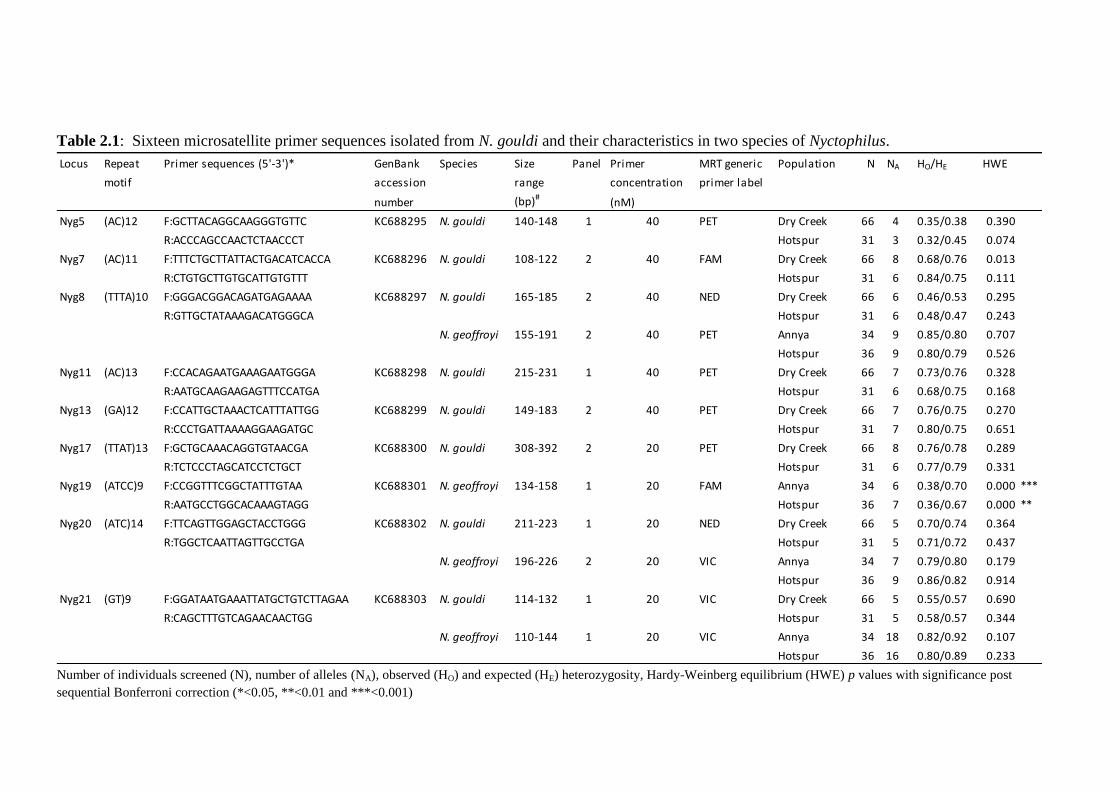
Table 2.1: Sixteen microsatellite primer sequences isolated from N. gouldi and their characteristics in two species of Nyctophilus.
Locus Repeat Primer sequences (5'-3')* GenBank Species Size Panel Primer MRT generic Population N NA HO/HE HWE
motif accession range concentration primer label
number (bp)#(nM)
Nyg5 (AC)12 F:GCTTACAGGCAAGGGTGTTC KC688295 N. gouldi 140-148 1 40 PET Dry Creek 66 4 0.35/0.38 0.390
R:ACCCAGCCAACTCTAACCCT Hotspur 31 3 0.32/0.45 0.074
Nyg7 (AC)11 F:TTTCTGCTTATTACTGACATCACCA KC688296 N. gouldi 108-122 2 40 FAM Dry Creek 66 8 0.68/0.76 0.013
R:CTGTGCTTGTGCATTGTGTTT Hotspur 31 6 0.84/0.75 0.111
Nyg8 (TTTA)10 F:GGGACGGACAGATGAGAAAA KC688297 N. gouldi 165-185 2 40 NED Dry Creek 66 6 0.46/0.53 0.295
R:GTTGCTATAAAGACATGGGCA Hotspur 31 6 0.48/0.47 0.243
N. geoffroyi 155-191 2 40 PET Annya 34 9 0.85/0.80 0.707
Hotspur 36 9 0.80/0.79 0.526
Nyg11 (AC)13 F:CCACAGAATGAAAGAATGGGA KC688298 N. gouldi 215-231 1 40 PET Dry Creek 66 7 0.73/0.76 0.328
R:AATGCAAGAAGAGTTTCCATGA Hotspur 31 6 0.68/0.75 0.168
Nyg13 (GA)12 F:CCATTGCTAAACTCATTTATTGG KC688299 N. gouldi 149-183 2 40 PET Dry Creek 66 7 0.76/0.75 0.270
R:CCCTGATTAAAAGGAAGATGC Hotspur 31 7 0.80/0.75 0.651
Nyg17 (TTAT)13 F:GCTGCAAACAGGTGTAACGA KC688300 N. gouldi 308-392 2 20 PET Dry Creek 66 8 0.76/0.78 0.289
R:TCTCCCTAGCATCCTCTGCT Hotspur 31 6 0.77/0.79 0.331
Nyg19 (ATCC)9 F:CCGGTTTCGGCTATTTGTAA KC688301 N. geoffroyi 134-158 1 20 FAM Annya 34 6 0.38/0.70 0.000 ***
R:AATGCCTGGCACAAAGTAGG Hotspur 36 7 0.36/0.67 0.000 **
Nyg20 (ATC)14 F:TTCAGTTGGAGCTACCTGGG KC688302 N. gouldi 211-223 1 20 NED Dry Creek 66 5 0.70/0.74 0.364
R:TGGCTCAATTAGTTGCCTGA Hotspur 31 5 0.71/0.72 0.437
N. geoffroyi 196-226 2 20 VIC Annya 34 7 0.79/0.80 0.179
Hotspur 36 9 0.86/0.82 0.914
Nyg21 (GT)9 F:GGATAATGAAATTATGCTGTCTTAGAA KC688303 N. gouldi 114-132 1 20 VIC Dry Creek 66 5 0.55/0.57 0.690
R:CAGCTTTGTCAGAACAACTGG Hotspur 31 5 0.58/0.57 0.344
N. geoffroyi 110-144 1 20 VIC Annya 34 18 0.82/0.92 0.107
Hotspur 36 16 0.80/0.89 0.233 Number of individuals screened (N), number of alleles (NA), observed (HO) and expected (HE) heterozygosity, Hardy-Weinberg equilibrium (HWE) p values with significance post
sequential Bonferroni correction (*<0.05, **<0.01 and ***<0.001)
29
Table 2.1: continued
Locus Repeat Primer sequences (5'-3')* GenBank Species Size Panel Primer MRT generic Population N NA HO/HE HWE
motif accession range concentration primer label
number (bp)#(nM)
Nyg23 (TAAAA)13 F:TTGTTGCTGTTCATATGTGTTAGG KC688304 N. gouldi 135-190 2 20 VIC Dry Creek 66 10 0.82/0.84 0.187
R:GAAAACAGAGGTTGTTTGTTGG Hotspur 31 9 0.77/0.79 0.899
N. geoffroyi 135-215 2 20 FAM Annya 34 15 0.88/0.86 0.359
Hotspur 36 11 0.78/0.85 0.289
Nyg25 (ATA)8 F:GCACAGATAATATGGTGTCCCTG KC688305 N. gouldi 200-212 1 20 VIC Dry Creek 66 5 0.60/0.69 0.507
R:ATGGACAGGGGTTGTGTTTT Hotspur 31 4 0.65/0.66 0.536
N. geoffroyi 193-217 1 20 VIC Annya 34 7 0.77/0.79 0.035
Hotspur 36 6 0.72/0.75 0.467
Nyg29 (ATT)13 F:CTTTGCCAGGACCCAACTG KC688306 N. gouldi 222-234 2 20 FAM Dry Creek 66 5 0.70/0.74 0.446
R:AAACGGGTTATTTCGTGCTG Hotspur 31 5 0.80/0.73 0.973
N. geoffroyi 206-251 1 20 NED Annya 34 13 0.82/0.87 0.297
Hotspur 36 12 0.94/0.88 0.887
Nyg31 (AT)9 F:TCATTCCAACCAAAATAAAATAAATG KC688307 N. gouldi 107-129 2 20 VIC Dry Creek 66 6 0.58/0.66 0.424
R:ACTGGTCATCCTGATTGCTG Hotspur 31 5 0.80/0.74 0.950
Nyg33 (AG)9 F:GCAGGGTACAGCTGGAGAAT KC688308 N. gouldi 112-118 1 20 NED Dry Creek 66 4 0.54/0.55 0.513
R:AGTCACGTGTCTCATTTCCC Hotspur 31 4 0.58/0.57 0.242
Nyg37 (TTCT)8 F:GAAATGTTTGGGAGGGGATT KC688309 N. gouldi 180-232 1 20 FAM Dry Creek 66 9 0.67/0.74 0.581
R:TCTTCAGTGAATAGCAAGTGAAGTAA Hotspur 31 8 0.80/0.69 0.944
N. geoffroyi 187-295 1 20 PET Annya 34 21 0.97/0.93 0.533
Hotspur 36 20 0.92/0.92 0.258
Nyg39 (CAT)12 F:AATCAGCACCACTGTTGTCG KC688310 N. gouldi 107-116 2 40 NED Dry Creek 66 4 0.56/0.58 0.073
R:CCCAGAATAAGGAGTTGTGACC Hotspur 31 4 0.61/0.57 0.276
N. geoffroyi 2 40 PET Annya 34 8 0.32/0.83 0.000 ***
Hotspur 36 10 0.53/0.82 0.000 ***
*Forward and reverse primers were tagged with a 5‘M13 universal sequence (F:5‘-ACGACGTTGTAAAA-3‘, R:5‘-CATTAAGTTCCCATTA-3‘)
#Size range includes universal 5‘M13 sequences
30
Chapter 3
The influence of habitat fragmentation on population connectivity and
genetic diversity in a microbat, Gould‘s long-eared bat (Nyctophilus
gouldi)
Nicholas C. Fuller1, Susan M. Carthew
1,2 and Steven J.B. Cooper
1,3
1 School of Earth & Environmental Sciences, The University of Adelaide
2 Research Institute for Environment and Livelihoods, Charles Darwin University
3 Evolutionary Biology Unit, South Australian Museum
ABSTRACT
Habitat fragmentation has been recognised globally as one of the major threats facing
biodiversity. Chiropterans represent approximately 20% of described mammal species yet we
know little about how habitat fragmentation influences population connectivity or genetic
diversity in this mammalian Order. We address this issue by examining the impact of habitat
fragmentation on a vespertilionid (Nyctophilus gouldi) in south-eastern Australia. Two
hundred and fifty-nine individuals were sampled across 12 populations. We employed 15
microsatellite markers designed for this study, to assess population structure and genetic
diversity in fragmented and continuous forest. We found that distances ≤27km across
agricultural land may represent a barrier to dispersal for this forest specialist. In contrast,
populations connected through continuous habitat revealed no structure over distances up to
80km and gene flow appears unimpeded by agricultural distances <2km. Fragmented
populations displayed signs of reduced genetic diversity, inbreeding, higher numbers of
relatives and skewed sex ratios. We make recommendations for the management of
endangered South Australian populations and raise concerns about a proposed Management
Unit at the Grampians. Despite the vagility of bat species we conclude that agricultural land
can impede gene-flow and impair population connectivity raising concerns about the long-
term viability and persistence of isolated populations.
31
INTRODUCTION
Land clearance and the subsequent fragmentation of native vegetation is recognised globally
as one of the major threats facing terrestrial species (Baillie et al. 2004; Bennett 2003).
Habitat fragmentation can impose a barrier to dispersal between populations disrupting
metapopulation dynamics and rendering populations isolated, causing a reduction in their
effective size and viability (Hanski 1998; Lindenmayer & Peakall 2000; Saunders et al.
1991). Consequently, the effective management of species in fragmented habitat requires
data on dispersal thresholds and gene-flow across the intervening matrix between remnant
habitat patches to ensure sufficient dispersal is maintained.
Bats are highly speciose and abundant representing approximately 20% of described global
mammal species (Wilson & Reeder 2005). These species play vital roles in ecosystem
function providing services such as plant pollination, seed dispersal, and the control or
suppression of insect numbers (Kunz et al. 2011). Despite their importance, the influence of
habitat fragmentation on bat population connectivity and dispersal thresholds has received
limited attention. Although bats are extremely vagile by nature they are not necessarily
immune to the impacts of habitat fragmentation and may be prone to population isolation like
other less mobile taxa. Indeed, numerous studies have documented changes in the presence
and abundance of bats in fragmented habitat and the disappearance of species from forest
remnants (Cosson et al. 1999; Estrada & Coates-Estrada 2002; Estrada et al. 1993; Medina et
al. 2007; Schulze et al. 2000).
Several bat studies have proposed that poor habitat connectivity has resulted in increased
population differentiation and reduced dispersal. Campbell et al. (2009) suggested that
significant FST values between nearby populations of Myotis macropus may be the result of
limited dispersal due to reduced riparian habitat in the agricultural landscape. Kerth and Petit
(2005) also proposed that a barrier due to habitat fragmentation could explain patterns in the
population structure of Myotis bechsteinii. However, we are only aware of two studies,
Meyer et al. (2009) and Struebig et al. (2011), specifically designed to investigate the impacts
of anthropogenic habitat fragmentation on genetic diversity and population differentiation in
bats. While both studies identified negative genetic impacts on the least mobile of their study
species, both studies also had their limitations. Meyer et al. (2009) acknowledge that marker
choice (mtDNA) limited the power and findings of their study reflecting only female-
32
mediated gene-flow. Struebig et al. (2011) on the other hand did not seek to identify
thresholds for population connectivity and dispersal; instead their purpose was to investigate
the relationship between declines in species richness and allelic richness due to habitat
fragmentation.
The study species: Gould’s long-eared bat (Nyctophilus gouldi)
Nyctophilus gouldi (Tomes, 1858) is a small (<16.5g) insectivorous (Grant 1991)
vespertilionid that roosts in hollows produced by mature eucalypts (Lunney et al. 1988). The
species distribution is limited to forest and woodland in eastern and south-western Australia
(Churchill 2008; Ellis et al. 1989; Hall & Richards 1979). Wing morphology suggests that N.
gouldi is suited to slow highly manoeuvrable flight in cluttered environments (Brigham et al.
1997; Fullard et al. 1991). Lunney et al. (1988) found that radio tracked individuals travelled
<2km from roosting sites supporting indications from wing morphology that the species may
be unsuited to sustained long-distance flight. Law et al. (1999) proposed that Nyctophilus
spp. have limited dispersal abilities and are sensitive to habitat fragmentation based on the
detection of a negative correlation between activity and habitat isolation, and a positive
association with large or continuous habitat. Lumsden and Bennett (2005) trapped N. gouldi
in a rural landscape across a gradient of tree densities from dense to sparse and found that the
species only persisted in densely treed conditions. Collectively this evidence supports the
hypothesis that N. gouldi is a forest habitat specialist that is sensitive to habitat fragmentation.
Coupled with a threatened status in South Australia (SA), where the remaining habitat is both
limited and highly fragmented, N. gouldi represents an ideal candidate to investigate the
influence of habitat fragmentation on bat population connectivity.
Aims
This study aims to address the lack of knowledge regarding the impact of habitat
fragmentation on bat population connectivity by conducting an assessment of N. gouldi
population structure and gene flow across a landscape comprising continuous and fragmented
forest. To facilitate this study we have developed a suite of microsatellite markers. These
markers will be used to test the hypothesis that gene flow will be higher between sites
connected by continuous native forest than between sites separated by agricultural land.
Analyses will be used to assess population structure across the landscape and to identify
33
dispersal events and distance thresholds for population connectivity. We will also investigate
the impact of habitat fragmentation on genetic diversity, relatedness and inbreeding. The
study will provide insights into the impact of habitat fragmentation on microbats and make
recommendations to promote N. gouldi metapopulation dynamics to improve population
persistence in fragmented landscapes. These results will be of particular importance for the
management of endangered SA populations of N. gouldi which are restricted to highly
fragmented remnant vegetation.
METHODS
Study sites and sample collection
Fieldwork was conducted at 12 sites across south-eastern Australia (Figure 3.1). Four sites,
Strathdownie, Hotspur and Annya State Forests (SF) and Mt Eccles National Park (NP),
comprised an 80km transect through continuous forest in Victoria providing a comparison to
distances between our fragmented sites. Although Mt Eccles is not directly connected to
Annya due to several small breaks in the forest collectively spanning ~1.6km of agriculture
(the largest spanning 800m) we felt it was permissible to include the site in this context given
the scale of this study. This decision was later supported through genetic analyses. Two
additional ‗unfragmented‘ forest sites, the Grampians and Great Otway NPs, were sampled as
possible sources of gene-flow to fragments isolated in the agricultural matrix. The remaining
six sites represent forest fragments of varying size and degrees of isolation. Embedded in
Pinus radiata plantations Nangwarry, Dry Creek and Honan‘s Native Forest Reserves (NFR)
are located in south-eastern SA and respectively cover 2218ha, 396ha and1041ha. These sites
represent three of the largest and most significant stands of remaining N. gouldi habitat in SA
where the species is listed as endangered. The three remaining fragments are located in
western Victoria amidst a vast region of agricultural land between Mt Eccles, the Grampians
and the Otways. Mt Napier encompasses 2800ha and our two most isolated fragments,
Woolsthorpe Nature Conservation Reserve and Framlingham Native Title Reserve, span 60ha
and 1180ha respectively.

34
Figure 3.1: The distribution of 12 N. gouldi study sites across Victoria and South Australia.
N. gouldi were sampled in native vegetation (light grey) embedded within a matrix of
hardwood (mid grey) and softwood plantations (dark grey) and agricultural land (white).
The study region has been extensively cleared for agriculture since European settlement of
Victoria in 1834 creating a landscape mosaic of habitat islands within an agricultural matrix.
The history of the Grampians differs in this respect as it was naturally isolated from the rest of
the study sites by native grassland at the time of European settlement and it is likely that this
isolation dates back to the late Pleistocene or early Holocene when these grasslands emerged
(DSE 2004a, b, 2011; Jones 1999). Throughout this manuscript we will refer to the study
sites as fragmented or unfragmented sites, further distinguishing the latter by referring to the
four sites connected through native forest as the continuous sites.
35
Bats were trapped between November and April over field seasons in 2008-2009 and 2009-
2010 using eight harp traps for a total of 1252 trap nights. Traps were placed at locations
where tree hollows were present and where the vegetation provided a funnel to increase trap
success. All trap locations were recorded with GPS for spatial genetic analyses. Trapping
was conducted in the central core of each site and to avoid the influence of the size of the
sampling area on genetic diversity we trapped over a similar area within each site (1-2km).
The exception to this approach was at the Grampians and the Otways where trapping was
conducted over a larger area due to difficulties locating the target species. Trapping was also
conducted in peripheral regions of these two parks so as to sample the most proximal location
to neighbouring study sites in otherwise vast stretches of continuous forest.
Traps were set at dusk and checked before midnight and again before sunrise when they were
closed and non-target species released under the cover of darkness. Target animals were held
for processing during the day in individual hold bags kept in a cool dark quiet location and
released at the point of capture the following evening. We recorded standard morphometric
measurements and animals were sexed, with female reproductive condition assessed by
examining teat and abdominal development. Bats were also aged and categorised as either
adults or sub-adults/juveniles based on the calcification of wing bones (Tidemann 1993).
Tissue samples for DNA analysis were collected via two 3.5mm wing membrane biopsies
taken from each bat (one from each wing) with a sterile biopsy punch and were stored in a 50-
50 ethanol-saline solution.
DNA extraction and microsatellite genotyping
Nuclear DNA was extracted from 128 biopsies using the Gentra Puregene extraction kit
(Gentra Systems Inc) and the remaining 151 samples were extracted by the AGRF (Australian
Genome Research Facility, Waite Campus, Adelaide). All DNA was subsequently quantified
using a Nanovue spectrophotometer (General Electric) and concentrations were standardised
to 10ng/µL. Individuals were screened at 15 microsatellite loci developed for this study
utilising 454 sequence data (Chapter 2) and Multiplex Ready Technology (MRT) (Hayden et
al. 2008). PCRs were performed according to methods outlined in Chapter 2 on a Corbett
Palm Cycler (model CG1-96) utilising BIOMEK 3000 robots (Beckman Coulter) to set up
PCRs and to pool products post PCR into two panels. These products were cleaned using a
Millipore vacuum plate (Multi Screen PCR µ96 Plate) and manifold (Multi ScreenHTS
36
Vacuum Manifold), and diluted before being sent to AGRF for electrophoresis and
visualisation on an ABI 3730 DNA Analyser.
Genotypes were scored using GENEMAPPER v.3.5.1 (Applied Biosystems) software and
tested with the program MICROCHECKER v.2.2.3 (Van Oosterhout et al. 2004) for typing
errors and the presence of null alleles before undertaking subsequent analyses. We used
GENEPOP v.3.4 (Raymond & Rousset 1995) to test populations and loci for deviations from
Hardy-Weinberg equilibrium (HWE), heterozygosity excess and deficiency, and linkage
disequilibrium (LD), with sequential Bonferroni corrections made for these and all subsequent
tests involving multiple comparisons (Rice 1989). Markov chain parameters in GENEPOP
were applied using the default settings.
Population differentiation: comparing continuous and fragmented sites
To assess population structure across the study region and compare structure between sites
connected by continuous habitat and sites fragmented by agricultural land we calculated
several measures of population differentiation. As a well-established measure of population
differentiation we calculated FST using ARLEQUIN v. 3.5 (Excoffier & Lischer 2010).
Additionally, and in response to recent articles discussing the use of FST and its relatives
(Gerlach et al. 2010; Heller & Siegismund 2009; Jost 2008, 2009; Meirmans & Hedrick 2011;
Ryman & Leimar 2009; Whitlock 2011), we calculated Jost‘s Dest (Jost 2008) using the
package DEMEtics (Gerlach et al. 2010) for the program R v. 2.1.3.1 (R Core Development
Team 2011). Due to low capture rates (≤2 individuals) at three fragmented sites (Mt Napier,
Framlingham and Woolsthorpe) these, and all subsequent, analyses were restricted to 256
individuals across nine populations.
Identifying genetic clusters across the landscape
To further investigate population structure we employed several Bayesian approaches to
identify genetic clusters across the landscape. Recent reviews and comparative tests on the
use of Bayesian clustering software have highlighted the advantages of concurrently
employing multiple programs to verify the number of clusters (K) within a dataset (Chen et al.
2007; Francois & Durand 2010; Guillot et al. 2009; Latch et al. 2006; Rowe & Beebee 2007).
Consequently we implemented four Bayesian clustering packages to estimate K across our
37
study region. Two of these analyses, STRUCTURE v. 2.2 (Pritchard et al. 2000) and BAPS
v. 5.2 (Corander et al. 2003), were utilised to infer clusters based on genotypic data alone,
whilst the remaining packages, GENELAND v. 3.3 (Guillot et al. 2005) and TESS v. 2.3
(Chen et al. 2007) incorporated both genotypic and spatial (geographic coordinates of
sampling locations) data to calculate K. For further information on the differences between
these packages model assumptions and algorithms refer to the recent review by Francois &
Durand (2010).
Latch et al. (2006) illustrated that STRUCTURE and BAPS may have difficulty identifying
the correct K and accurately assigning individuals to clusters when FST values are low
(<0.03). In this scenario Latch et al. (2006) recommend that the parallel use of BAPS and
STRUCTURE can increase the confidence of the results when K is inferred independently
and there is a consensus between the approaches. We ran STRUCTURE to test for K
between 1 to 9 with 10 iterations of each K with no priors, admixed ancestry and correlated
allele frequencies with burnin and run lengths of 100 000 and 1 million respectively.
STRUCTURE HARVESTER v. 0.6.8 (Earl & vonHoldt 2012) was used to employ the
Evanno method (Evanno et al. 2005) to select K from our STRUCTURE results. BAPS was
similarly run with 10 iterations of each K from 1 to 9 using the admixture model based on
mixture clustering of individuals with 100 000 iterations and, following the recommendation
of Corander and Marttinen (2006), we ignored clusters with fewer than five individuals.
Combining genotypic and spatial data, we conducted 15 independent runs of GENELAND
with K set from 1 to 9. Using the correlated allele and null allele models we set the
coordinate uncertainty to 500 and performed 1 million repetitions with thinning set to 100.
Once the value of K was determined we used this value to rerun the analysis 10 times with the
same parameters and K fixed to assess the stability of cluster locations and variation in the
assignment of individuals to particular clusters. TESS was performed with 10 000 sweeps
and a burnin of 5000 and we set multiple Ks from 2 to 9 with 10 iterations of each. We
selected the conditional autoregression (CAR) admixture model and did not elect to set the
initial CAR variance or to infer CAR variance from the data, nor did we continue with the
lowest deviance information criterion (DIC) from a previous run or start from a clustering
pattern obtained by a neighbour-Joining algorithm.
38
Prior to conducting Bayesian analyses all parent-offspring and full sibling relationships were
established in KINGROUP v. 2 (Konovalov et al. 2004) using the likelihood method of
Queller & Goodnight (1989). To avoid any bias from sampling family groups we removed
one individual from each identified pair of relatives from the dataset. This process reduced
the number of samples included in the Bayesian analyses to 229 across nine populations.
Isolation by distance: global test and comparison between continuous and fragmented
sites
To identify patterns of isolation by distance (IBD) across the study region we used
GENALEX v. 6 (Peakall & Smouse 2006) to perform three Mantel tests on our dataset using
individual pairwise geographic coordinates and genetic distance as defined by Smouse &
Peakall (1999). The first test analysed the study region as a whole, while consecutive tests
investigated the influence of matrix type (forest versus agricultural land) by independently
analysing sites connected through continuous forest (Strathdownie, Hotspur, Annya and Mt
Eccles) and sites separated by agriculture (Nangwarry, Dry Creek, Honans, Grampians and
the Otways). Mantel tests can be sensitive to missing data and with twelve individuals
missing data for at least one locus we utilised the ‗Interpolate Missing‘ data option to fill in
blanks with the average genetic distance for the respective locus and population.
The influence of geographic distance, agricultural distance and intervening matrix type
(forest Vs agriculture) on population differentiation
To further examine the underlying causes of genetic differentiation between sites we used
IBD v. 1.52 (Bohonak 2002) to carry out Mantel and partial Mantel tests at the site level
based on pairwise population FST and Dest values. This approach was employed using a third
indicator matrix in two varying ways. For our first test the indicator matrix represented the
intervening matrix type between sites represented by a ‗1‘ for agricultural land and a ‗0‘ for
continuous native forest. Secondly we used the indicator matrix to input a proposed least-
cost-path distance between each site measured as the route spanning the shortest accumulative
distance across agricultural land which we will refer to as agricultural distance. The partial
Mantel tests permitted analysis of the relationship between genetic and geographic distance
when controlling for the indicator factor and conversely the relationship between genetic
distance and the indicator factor when controlling for geographic distance.
39
Identification of dispersal events and thresholds for gene-flow
To investigate whether dispersal is occurring across agricultural land or if it is restricted to
continuous forest we attempted to identify dispersal events by conducting first-generation
migrant detection (F0) in GeneClass v. 2 (Piry et al. 2004). Tests were performed according
to the Bayesian method of Rannla & Mountain (1997) using the Monte Carlo resampling
approach of Paetkau et al. (2004) with 10 000 simulated individuals and a significance level
of 0.05. Due to the size of the study region several populations were not sampled and we
implemented the appropriate model (‗L=home‘) for migrant detection which assumes that not
all possible source populations have been sampled.
We performed spatial autocorrelations within GENALEX to test for patterns associated with
positive local neighbourhood structuring and negative relationships indicating distance
thresholds for dispersal. These tests were performed in the same manner as our GENALEX
Mantel tests utilising individual pairwise geographic coordinates and genetic distances. We
independently assessed sites separated by agriculture and continuous sites over a distance of
80km. We used variable distance classes which allowed us to obtain a resolution of 5km
distance classes where data permitted. Spatial autocorrelations utilised the entire dataset
including six additional individuals from Warreanga NFR and Weecurra SF (see Chapter 4
for locations). These additional individuals were not reported elsewhere in this chapter as the
sample sizes were too small to utilise for population level analyses and, unlike Mt Napier,
Framlingham and Woolsthorpe, insufficient trapping was conducted to draw any conclusions
about the presence or abundance of N. gouldi at these locations.
Genetic and demographic consequences of habitat fragmentation: comparing
fragmented and unfragmented sites
To investigate the genetic consequences of habitat fragmentation on small or isolated sites we
assessed a range of measures reflecting genetic diversity, relatedness and inbreeding, sex
ratios and bottlenecks. To assess genetic diversity across the study region we calculated
standard measures of genetic diversity (private alleles, HO & HE) using GENALEX, and
allelic richness (AR) as a standardised measure of allelic diversity based on sample size in
FSTAT v. 2.9.3 (Goudet 2001). As indicators of inbreeding we calculated the inbreeding
coefficient FIS in FSTAT and two additional measures reflecting inbreeding using the package
40
Rhh (Alho et al. 2010) in the program R; standardised heterozygosity (SH: Coltman et al.
1999) and internal relatedness (IR: Amos et al. 2001). IR is a multilocus estimator of parental
relatedness centred around zero with positive values suggesting inbreeding and negative
values suggesting outbreeding (Amos et al. 2001). Sex ratios were also assessed for
differences between populations and between fragmented and unfragmented sites. Bottleneck
v1.2.02 (Cornuet & Luikart 1996) was used to identify recent bottleneck events in fragmented
sites. Wilcoxon‘s test was used to determine the significance of heterozygosity excess
calculated with 10 000 permutations. The analysis was performed using the two-phase-
mutation model (TPM) (Di Rienzo et al. 1994) and following recommendations from Piry et
al. (1999) we weighted the TPM with 5% infinite-alleles model (IAM) and 95% stepwise-
mutation model (SMM). Allele frequencies within each fragmented population were also
assessed for signs of a mode shift from the normal L-shape distribution (Luikart et al. 1998).
Finally, KINGROUP was employed to identify related individuals and determine whether
fragmented sites contain a higher proportion of relatives than other sites. The analysis was
performed in accordance with the methods outlined above to identify four types of
relationships: parent-offspring, full siblings, half siblings and cousins.
RESULTS
Distribution of N. gouldi across the landscape and sample collection
We sampled a total of 259 N. gouldi across 11 of our 12 sites with variable trap success in
response to the time of year and minimum overnight temperatures. The conduciveness of the
vegetation structure for corralling bats towards traps also played a role in trap success,
particularly in taller forest such as the Otways where the canopy was well beyond the reach of
harp traps. Due to these factors we trapped for different durations at each site and produced
variable sample numbers. However, at several sites the species was in such low densities (or
absent) that we either caught no individuals or too few to utilise for population genetic
analyses despite thorough trapping effort. No individuals were caught at the small and highly
isolated Woolsthorpe, only one N. gouldi was caught at the equally isolated Framlingham and
just two individuals were caught at Mt Napier. Sufficient samples for analysis were obtained
from the remaining nine populations including the three fragmented sites in SA.
41
Tests for Hardy-Weinberg equilibrium, linkage disequilibrium and null alleles
All fifteen microsatellite loci were polymorphic displaying between five and fourteen alleles
with an average of nine per locus. The Grampians was the only population to deviate from
HWE at the population level (p<0.01) or for a particular locus (NyGo31, p<0.05).
Heterozygote excess was detected at the Grampians for locus NyGo31 (p<0.05) and there
were no cases of heterozygote deficiency. The Grampians was also the only site to display
linkage disequilibrium (LD) which occurred between locus NyGo17 and NyGo21 (p<0.001).
MICROCHECKER revealed no evidence of null alleles, large allele drop out or scoring errors
with one exception: the Grampians displayed signs of homozygote excess or possible null
alleles at four loci NyGo11, NyGo17, NyGo23 and NyGo33. With only single instances of
LD and deviation from HWE all 15 loci were retained for further analyses.
Population differentiation: comparing continuous and fragment sites
Both FST and Jost‘s Dest revealed numerous cases of significant differentiation between
populations (Table 3.1). FST values ranged from extremely low (FST = 0.000) to high (FST =
0.270). The four continuous sites displayed no differentiation (FST = 0.000) with one non-
significant exception between Annya and Hotspur (FST = 0.005, p = 0.303), indicating high
rates of gene flow through the continuous forest. The SA fragment Dry Creek displayed
similarly low rates of FST with these four sites suggesting gene-flow is freely occurring
between these locations. In stark contrast the levels of differentiation between the Grampians
and other locations were both extremely high and significant (FST = 0.229-0.270, p<0.001)
indicating population isolation with severely restricted or absent gene-flow to other sites.
Only one other significant FST value was recorded between the two most distal study sites,
Honans and the Otways (FST=0.053, p<0.001). The remaining measures of FST were low to
moderate (FST = 0.002-0.033) and not significant (p>0.05).
Dest values also ranged from low to extremely high (Dest = 0.000-0.386) but when compared to
FST many more significant cases of differentiation were revealed. Again the Grampians was
significantly differentiated from all other sites (Dest = 0.331-0.386, p<0.05). However, all the
other study sites isolated by agriculture also displayed consistent significant differentiation.
The Otways and Nangwarry were significantly differentiated from all but two other study
sites, the latter only showing non-significant relationships with two proximal neighbours
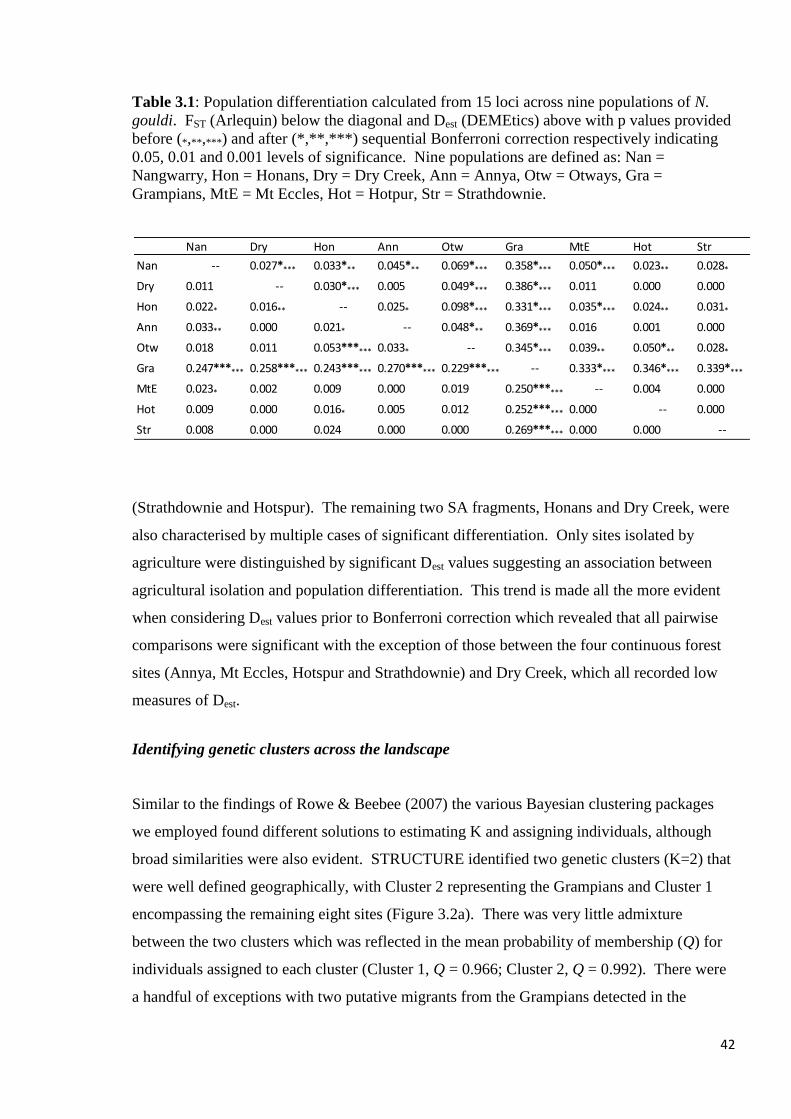
42
Table 3.1: Population differentiation calculated from 15 loci across nine populations of N.
gouldi. FST (Arlequin) below the diagonal and Dest (DEMEtics) above with p values provided
before (*,**,***) and after (*,**,***) sequential Bonferroni correction respectively indicating
0.05, 0.01 and 0.001 levels of significance. Nine populations are defined as: Nan =
Nangwarry, Hon = Honans, Dry = Dry Creek, Ann = Annya, Otw = Otways, Gra =
Grampians, MtE = Mt Eccles, Hot = Hotpur, Str = Strathdownie.
(Strathdownie and Hotspur). The remaining two SA fragments, Honans and Dry Creek, were
also characterised by multiple cases of significant differentiation. Only sites isolated by
agriculture were distinguished by significant Dest values suggesting an association between
agricultural isolation and population differentiation. This trend is made all the more evident
when considering Dest values prior to Bonferroni correction which revealed that all pairwise
comparisons were significant with the exception of those between the four continuous forest
sites (Annya, Mt Eccles, Hotspur and Strathdownie) and Dry Creek, which all recorded low
measures of Dest.
Identifying genetic clusters across the landscape
Similar to the findings of Rowe & Beebee (2007) the various Bayesian clustering packages
we employed found different solutions to estimating K and assigning individuals, although
broad similarities were also evident. STRUCTURE identified two genetic clusters (K=2) that
were well defined geographically, with Cluster 2 representing the Grampians and Cluster 1
encompassing the remaining eight sites (Figure 3.2a). There was very little admixture
between the two clusters which was reflected in the mean probability of membership (Q) for
individuals assigned to each cluster (Cluster 1, Q = 0.966; Cluster 2, Q = 0.992). There were
a handful of exceptions with two putative migrants from the Grampians detected in the
Nan Dry Hon Ann Otw Gra MtE Hot Str
Nan -- 0.027**** 0.033*** 0.045*** 0.069**** 0.358**** 0.050**** 0.023** 0.028*
Dry 0.011 -- 0.030**** 0.005 0.049**** 0.386**** 0.011 0.000 0.000
Hon 0.022* 0.016** -- 0.025* 0.098**** 0.331**** 0.035**** 0.024** 0.031*
Ann 0.033** 0.000 0.021* -- 0.048*** 0.369**** 0.016 0.001 0.000
Otw 0.018 0.011 0.053****** 0.033* -- 0.345**** 0.039** 0.050*** 0.028*
Gra 0.247****** 0.258****** 0.243****** 0.270****** 0.229****** -- 0.333**** 0.346**** 0.339****
MtE 0.023* 0.002 0.009 0.000 0.019 0.250****** -- 0.004 0.000
Hot 0.009 0.000 0.016* 0.005 0.012 0.252****** 0.000 -- 0.000
Str 0.008 0.000 0.024 0.000 0.000 0.269****** 0.000 0.000 --
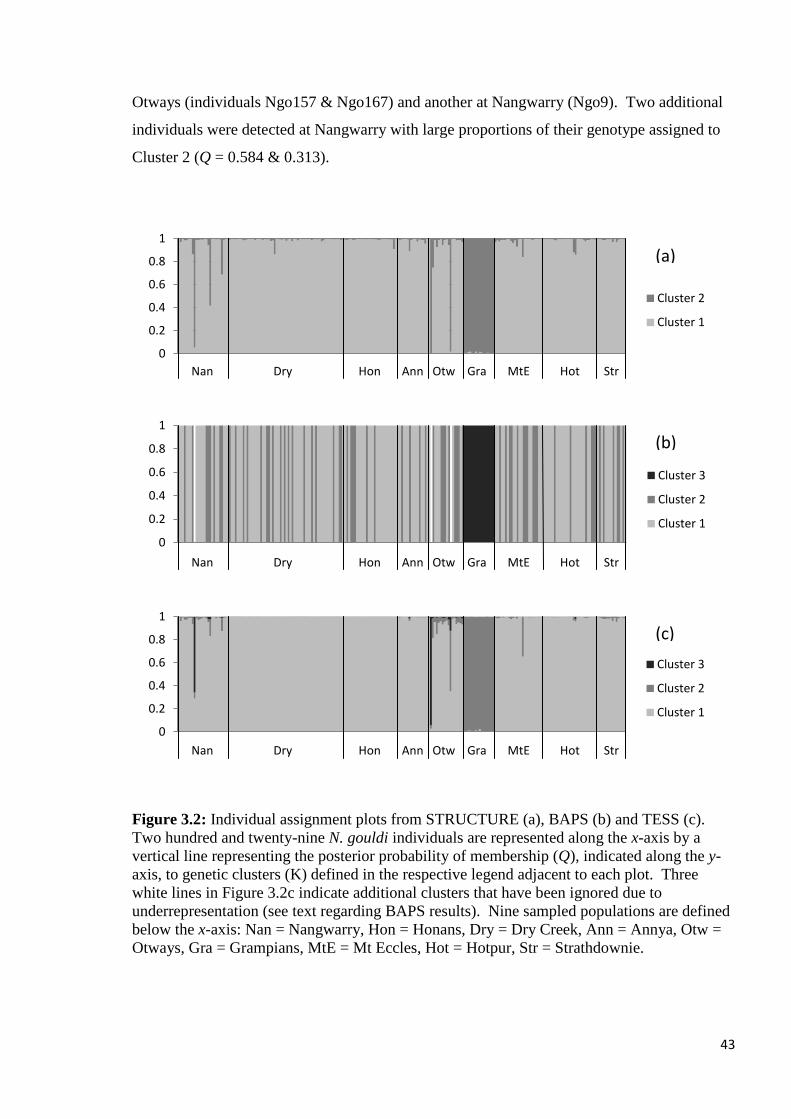
43
Otways (individuals Ngo157 & Ngo167) and another at Nangwarry (Ngo9). Two additional
individuals were detected at Nangwarry with large proportions of their genotype assigned to
Cluster 2 (Q = 0.584 & 0.313).
Figure 3.2: Individual assignment plots from STRUCTURE (a), BAPS (b) and TESS (c).
Two hundred and twenty-nine N. gouldi individuals are represented along the x-axis by a
vertical line representing the posterior probability of membership (Q), indicated along the y-
axis, to genetic clusters (K) defined in the respective legend adjacent to each plot. Three
white lines in Figure 3.2c indicate additional clusters that have been ignored due to
underrepresentation (see text regarding BAPS results). Nine sampled populations are defined
below the x-axis: Nan = Nangwarry, Hon = Honans, Dry = Dry Creek, Ann = Annya, Otw =
Otways, Gra = Grampians, MtE = Mt Eccles, Hot = Hotpur, Str = Strathdownie.
0
0.2
0.4
0.6
0.8
1
Cluster 2
Cluster 1
0
0.2
0.4
0.6
0.8
1
Cluster 3
Cluster 2
Cluster 1
0
0.2
0.4
0.6
0.8
1
Cluster 3
Cluster 2
Cluster 1
Nan Dry Hon Ann Otw Gra MtE Hot Str
Nan Dry Hon Ann Otw Gra MtE Hot Str
Nan Dry Hon Ann Otw Gra MtE Hot Str
(a)
(b)
(c)
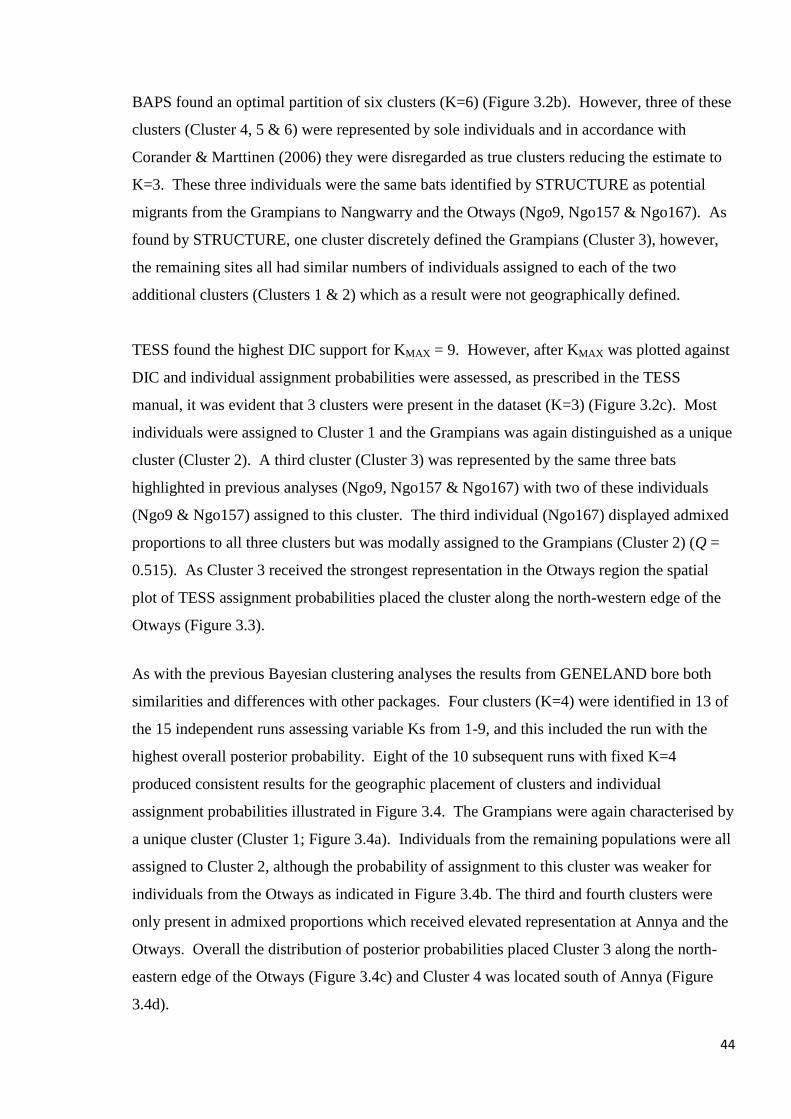
44
BAPS found an optimal partition of six clusters (K=6) (Figure 3.2b). However, three of these
clusters (Cluster 4, 5 & 6) were represented by sole individuals and in accordance with
Corander & Marttinen (2006) they were disregarded as true clusters reducing the estimate to
K=3. These three individuals were the same bats identified by STRUCTURE as potential
migrants from the Grampians to Nangwarry and the Otways (Ngo9, Ngo157 & Ngo167). As
found by STRUCTURE, one cluster discretely defined the Grampians (Cluster 3), however,
the remaining sites all had similar numbers of individuals assigned to each of the two
additional clusters (Clusters 1 & 2) which as a result were not geographically defined.
TESS found the highest DIC support for KMAX = 9. However, after KMAX was plotted against
DIC and individual assignment probabilities were assessed, as prescribed in the TESS
manual, it was evident that 3 clusters were present in the dataset (K=3) (Figure 3.2c). Most
individuals were assigned to Cluster 1 and the Grampians was again distinguished as a unique
cluster (Cluster 2). A third cluster (Cluster 3) was represented by the same three bats
highlighted in previous analyses (Ngo9, Ngo157 & Ngo167) with two of these individuals
(Ngo9 & Ngo157) assigned to this cluster. The third individual (Ngo167) displayed admixed
proportions to all three clusters but was modally assigned to the Grampians (Cluster 2) (Q =
0.515). As Cluster 3 received the strongest representation in the Otways region the spatial
plot of TESS assignment probabilities placed the cluster along the north-western edge of the
Otways (Figure 3.3).
As with the previous Bayesian clustering analyses the results from GENELAND bore both
similarities and differences with other packages. Four clusters (K=4) were identified in 13 of
the 15 independent runs assessing variable Ks from 1-9, and this included the run with the
highest overall posterior probability. Eight of the 10 subsequent runs with fixed K=4
produced consistent results for the geographic placement of clusters and individual
assignment probabilities illustrated in Figure 3.4. The Grampians were again characterised by
a unique cluster (Cluster 1; Figure 3.4a). Individuals from the remaining populations were all
assigned to Cluster 2, although the probability of assignment to this cluster was weaker for
individuals from the Otways as indicated in Figure 3.4b. The third and fourth clusters were
only present in admixed proportions which received elevated representation at Annya and the
Otways. Overall the distribution of posterior probabilities placed Cluster 3 along the north-
eastern edge of the Otways (Figure 3.4c) and Cluster 4 was located south of Annya (Figure
3.4d).
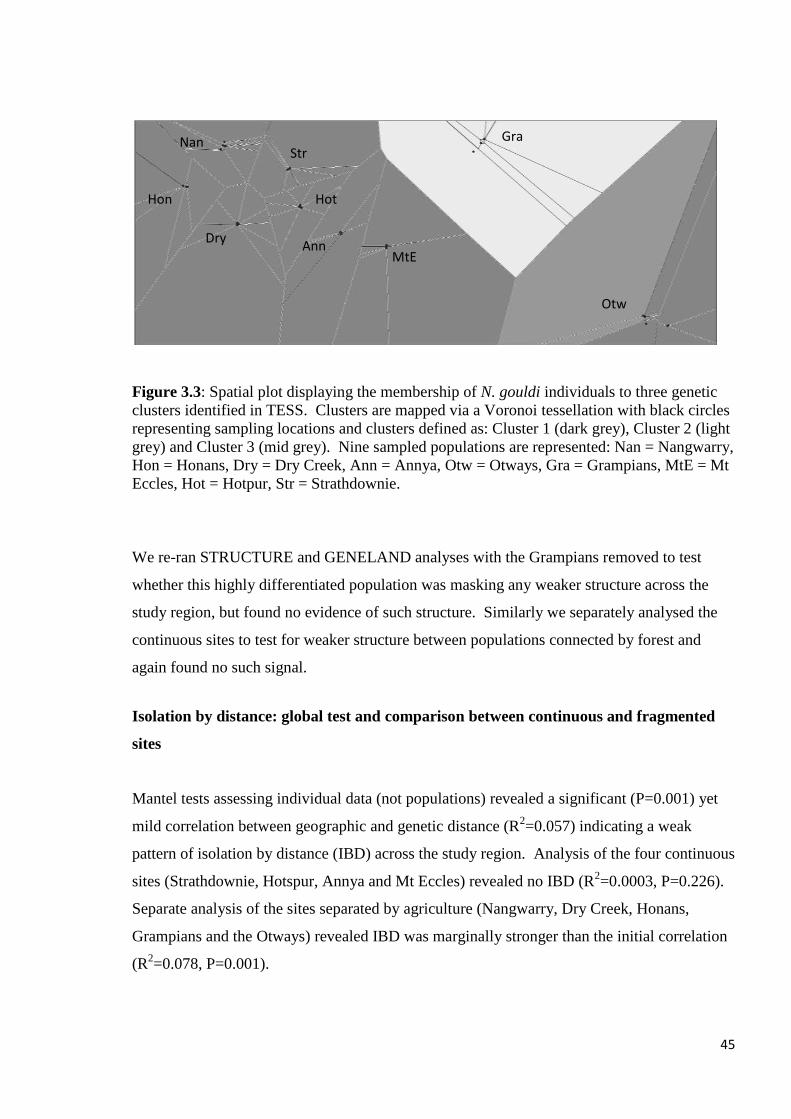
45
Figure 3.3: Spatial plot displaying the membership of N. gouldi individuals to three genetic
clusters identified in TESS. Clusters are mapped via a Voronoi tessellation with black circles
representing sampling locations and clusters defined as: Cluster 1 (dark grey), Cluster 2 (light
grey) and Cluster 3 (mid grey). Nine sampled populations are represented: Nan = Nangwarry,
Hon = Honans, Dry = Dry Creek, Ann = Annya, Otw = Otways, Gra = Grampians, MtE = Mt
Eccles, Hot = Hotpur, Str = Strathdownie.
We re-ran STRUCTURE and GENELAND analyses with the Grampians removed to test
whether this highly differentiated population was masking any weaker structure across the
study region, but found no evidence of such structure. Similarly we separately analysed the
continuous sites to test for weaker structure between populations connected by forest and
again found no such signal.
Isolation by distance: global test and comparison between continuous and fragmented
sites
Mantel tests assessing individual data (not populations) revealed a significant (P=0.001) yet
mild correlation between geographic and genetic distance (R2=0.057) indicating a weak
pattern of isolation by distance (IBD) across the study region. Analysis of the four continuous
sites (Strathdownie, Hotspur, Annya and Mt Eccles) revealed no IBD (R2=0.0003, P=0.226).
Separate analysis of the sites separated by agriculture (Nangwarry, Dry Creek, Honans,
Grampians and the Otways) revealed IBD was marginally stronger than the initial correlation
(R2=0.078, P=0.001).
Otw
Gra
MtE Ann
Hot
Str
Dry
Hon
Nan
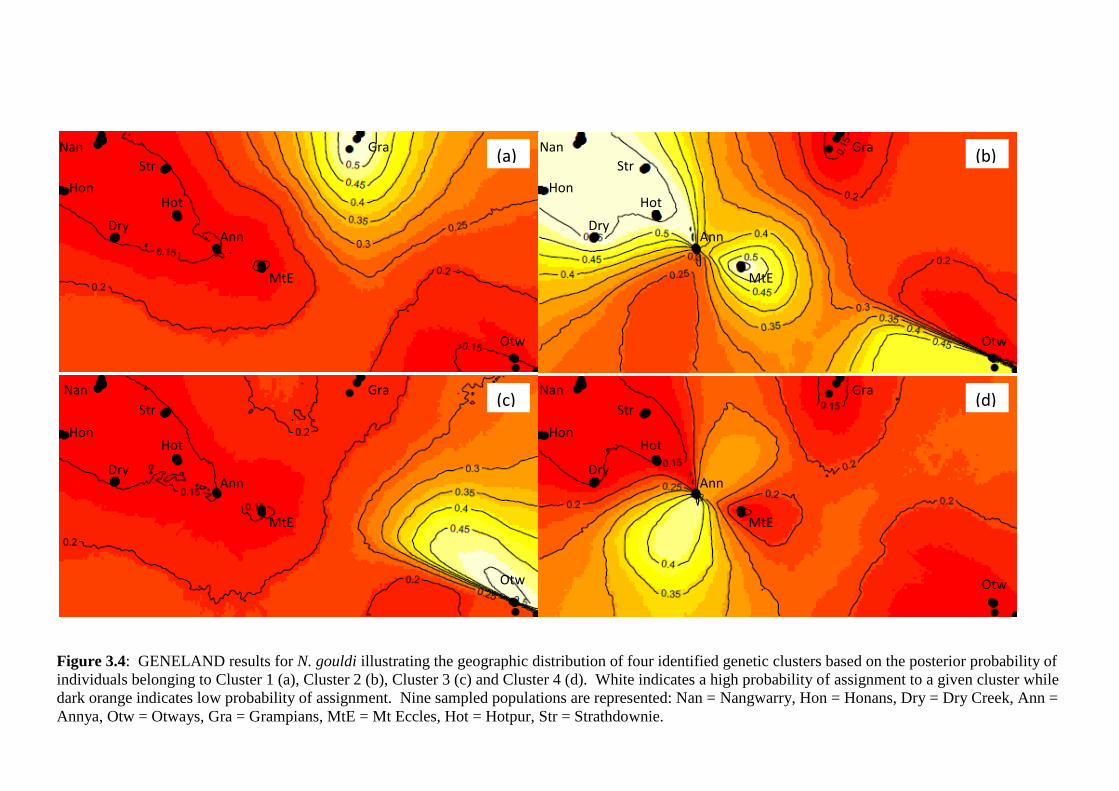
46
Figure 3.4: GENELAND results for N. gouldi illustrating the geographic distribution of four identified genetic clusters based on the posterior probability of
individuals belonging to Cluster 1 (a), Cluster 2 (b), Cluster 3 (c) and Cluster 4 (d). White indicates a high probability of assignment to a given cluster while
dark orange indicates low probability of assignment. Nine sampled populations are represented: Nan = Nangwarry, Hon = Honans, Dry = Dry Creek, Ann =
Annya, Otw = Otways, Gra = Grampians, MtE = Mt Eccles, Hot = Hotpur, Str = Strathdownie.
(a) (b)
(c) (d)
Nan
Nan
Nan
Nan
Hon
Hon
Hon
Hon
Dry Dry
Dry Dry
Str
Str
Str
Str
Hot
Hot
Hot
Hot
Ann
Ann
Ann
Ann
MtE
MtE
MtE
MtE
Gra
Gra
Gra
Gra
Otw
Otw Otw
Otw
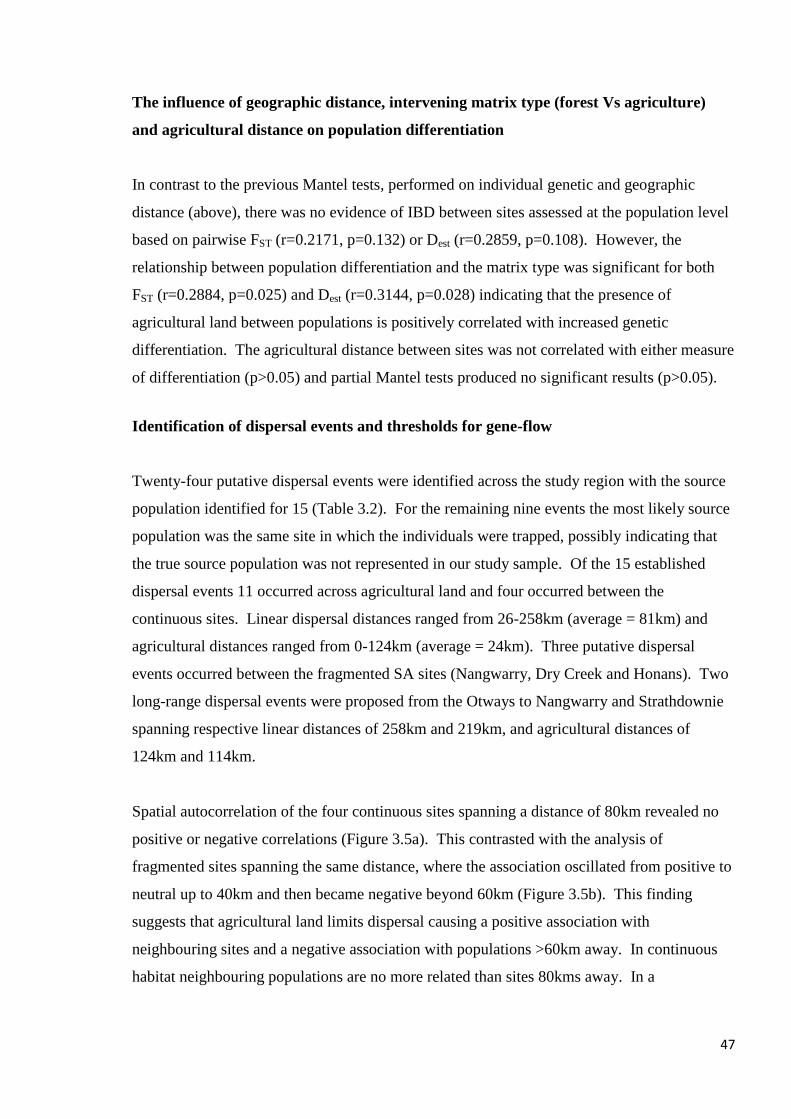
47
The influence of geographic distance, intervening matrix type (forest Vs agriculture)
and agricultural distance on population differentiation
In contrast to the previous Mantel tests, performed on individual genetic and geographic
distance (above), there was no evidence of IBD between sites assessed at the population level
based on pairwise FST (r=0.2171, p=0.132) or Dest (r=0.2859, p=0.108). However, the
relationship between population differentiation and the matrix type was significant for both
FST (r=0.2884, p=0.025) and Dest (r=0.3144, p=0.028) indicating that the presence of
agricultural land between populations is positively correlated with increased genetic
differentiation. The agricultural distance between sites was not correlated with either measure
of differentiation (p>0.05) and partial Mantel tests produced no significant results (p>0.05).
Identification of dispersal events and thresholds for gene-flow
Twenty-four putative dispersal events were identified across the study region with the source
population identified for 15 (Table 3.2). For the remaining nine events the most likely source
population was the same site in which the individuals were trapped, possibly indicating that
the true source population was not represented in our study sample. Of the 15 established
dispersal events 11 occurred across agricultural land and four occurred between the
continuous sites. Linear dispersal distances ranged from 26-258km (average = 81km) and
agricultural distances ranged from 0-124km (average = 24km). Three putative dispersal
events occurred between the fragmented SA sites (Nangwarry, Dry Creek and Honans). Two
long-range dispersal events were proposed from the Otways to Nangwarry and Strathdownie
spanning respective linear distances of 258km and 219km, and agricultural distances of
124km and 114km.
Spatial autocorrelation of the four continuous sites spanning a distance of 80km revealed no
positive or negative correlations (Figure 3.5a). This contrasted with the analysis of
fragmented sites spanning the same distance, where the association oscillated from positive to
neutral up to 40km and then became negative beyond 60km (Figure 3.5b). This finding
suggests that agricultural land limits dispersal causing a positive association with
neighbouring sites and a negative association with populations >60km away. In continuous
habitat neighbouring populations are no more related than sites 80kms away. In a
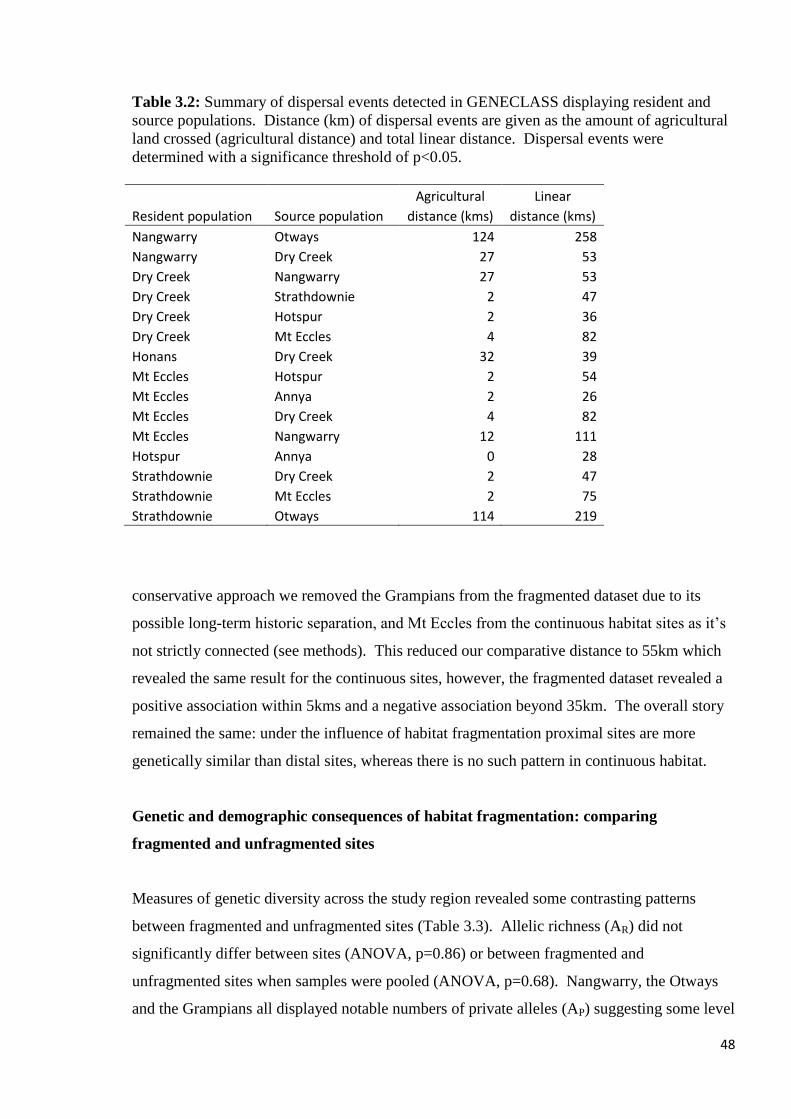
48
Table 3.2: Summary of dispersal events detected in GENECLASS displaying resident and
source populations. Distance (km) of dispersal events are given as the amount of agricultural
land crossed (agricultural distance) and total linear distance. Dispersal events were
determined with a significance threshold of p<0.05.
Agricultural Linear
Resident population Source population distance (kms) distance (kms)
Nangwarry Otways 124 258
Nangwarry Dry Creek 27 53
Dry Creek Nangwarry 27 53
Dry Creek Strathdownie 2 47
Dry Creek Hotspur 2 36
Dry Creek Mt Eccles 4 82
Honans Dry Creek 32 39
Mt Eccles Hotspur 2 54
Mt Eccles Annya 2 26
Mt Eccles Dry Creek 4 82
Mt Eccles Nangwarry 12 111
Hotspur Annya 0 28
Strathdownie Dry Creek 2 47
Strathdownie Mt Eccles 2 75
Strathdownie Otways 114 219
conservative approach we removed the Grampians from the fragmented dataset due to its
possible long-term historic separation, and Mt Eccles from the continuous habitat sites as it‘s
not strictly connected (see methods). This reduced our comparative distance to 55km which
revealed the same result for the continuous sites, however, the fragmented dataset revealed a
positive association within 5kms and a negative association beyond 35km. The overall story
remained the same: under the influence of habitat fragmentation proximal sites are more
genetically similar than distal sites, whereas there is no such pattern in continuous habitat.
Genetic and demographic consequences of habitat fragmentation: comparing
fragmented and unfragmented sites
Measures of genetic diversity across the study region revealed some contrasting patterns
between fragmented and unfragmented sites (Table 3.3). Allelic richness (AR) did not
significantly differ between sites (ANOVA, p=0.86) or between fragmented and
unfragmented sites when samples were pooled (ANOVA, p=0.68). Nangwarry, the Otways
and the Grampians all displayed notable numbers of private alleles (AP) suggesting some level
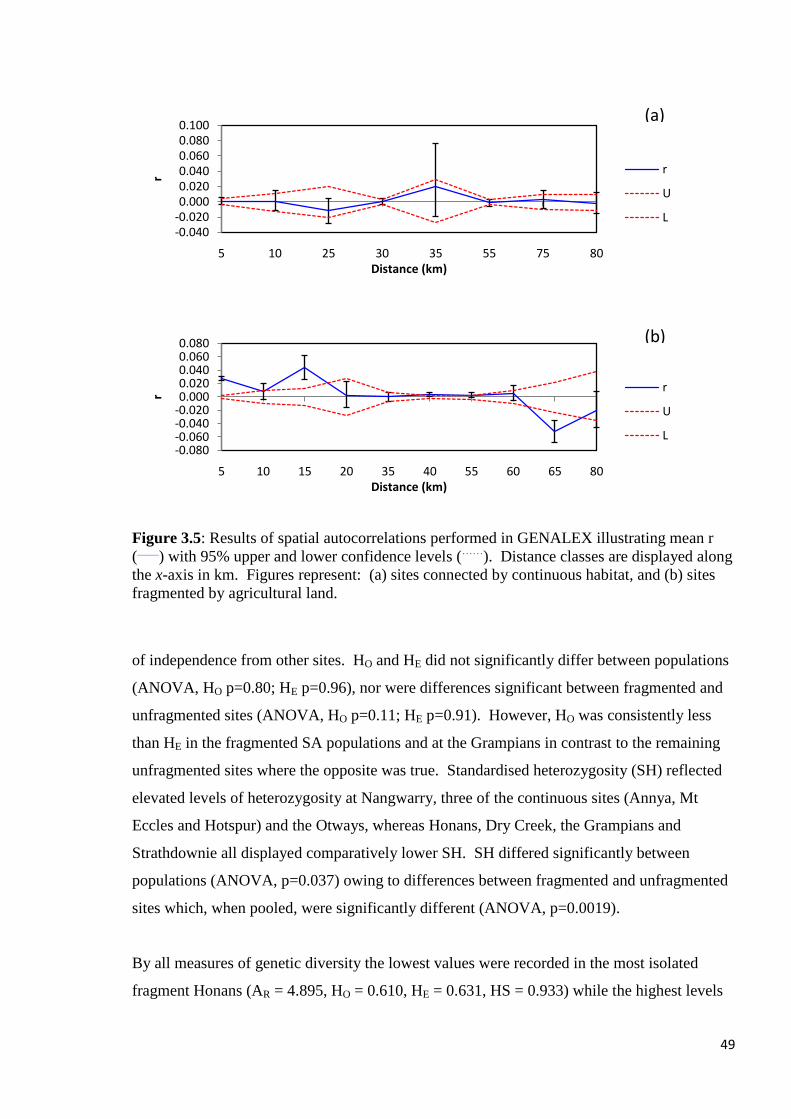
49
Figure 3.5: Results of spatial autocorrelations performed in GENALEX illustrating mean r
(____
) with 95% upper and lower confidence levels (……
). Distance classes are displayed along
the x-axis in km. Figures represent: (a) sites connected by continuous habitat, and (b) sites
fragmented by agricultural land.
of independence from other sites. HO and HE did not significantly differ between populations
(ANOVA, HO p=0.80; HE p=0.96), nor were differences significant between fragmented and
unfragmented sites (ANOVA, HO p=0.11; HE p=0.91). However, HO was consistently less
than HE in the fragmented SA populations and at the Grampians in contrast to the remaining
unfragmented sites where the opposite was true. Standardised heterozygosity (SH) reflected
elevated levels of heterozygosity at Nangwarry, three of the continuous sites (Annya, Mt
Eccles and Hotspur) and the Otways, whereas Honans, Dry Creek, the Grampians and
Strathdownie all displayed comparatively lower SH. SH differed significantly between
populations (ANOVA, p=0.037) owing to differences between fragmented and unfragmented
sites which, when pooled, were significantly different (ANOVA, p=0.0019).
By all measures of genetic diversity the lowest values were recorded in the most isolated
fragment Honans (AR = 4.895, HO = 0.610, HE = 0.631, HS = 0.933) while the highest levels
-0.040-0.0200.0000.0200.0400.0600.0800.100
5 10 25 30 35 55 75 80
r
Distance (km)
r
U
L
-0.080-0.060-0.040-0.0200.0000.0200.0400.0600.080
5 10 15 20 35 40 55 60 65 80
r
Distance (km)
r
U
L
(a)
(b)
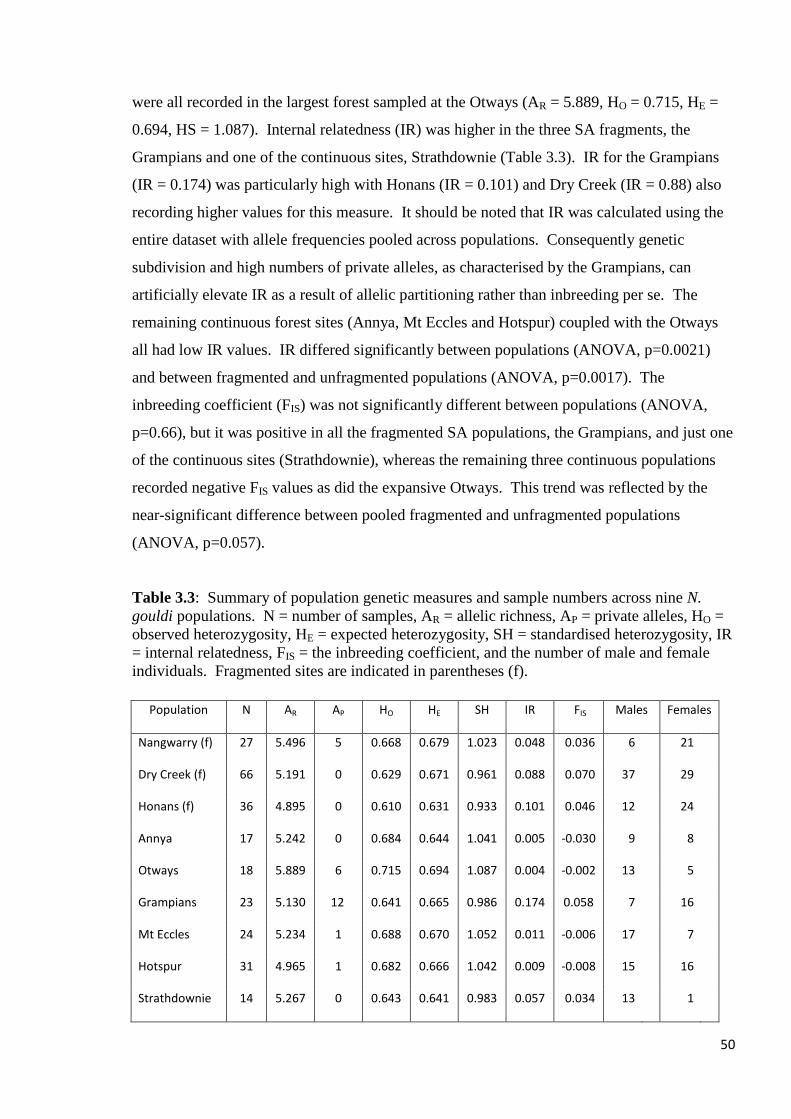
50
were all recorded in the largest forest sampled at the Otways (AR = 5.889, HO = 0.715, HE =
0.694, HS = 1.087). Internal relatedness (IR) was higher in the three SA fragments, the
Grampians and one of the continuous sites, Strathdownie (Table 3.3). IR for the Grampians
(IR = 0.174) was particularly high with Honans (IR = 0.101) and Dry Creek (IR = 0.88) also
recording higher values for this measure. It should be noted that IR was calculated using the
entire dataset with allele frequencies pooled across populations. Consequently genetic
subdivision and high numbers of private alleles, as characterised by the Grampians, can
artificially elevate IR as a result of allelic partitioning rather than inbreeding per se. The
remaining continuous forest sites (Annya, Mt Eccles and Hotspur) coupled with the Otways
all had low IR values. IR differed significantly between populations (ANOVA, p=0.0021)
and between fragmented and unfragmented populations (ANOVA, p=0.0017). The
inbreeding coefficient (FIS) was not significantly different between populations (ANOVA,
p=0.66), but it was positive in all the fragmented SA populations, the Grampians, and just one
of the continuous sites (Strathdownie), whereas the remaining three continuous populations
recorded negative FIS values as did the expansive Otways. This trend was reflected by the
near-significant difference between pooled fragmented and unfragmented populations
(ANOVA, p=0.057).
Table 3.3: Summary of population genetic measures and sample numbers across nine N.
gouldi populations. N = number of samples, AR = allelic richness, AP = private alleles, HO =
observed heterozygosity, HE = expected heterozygosity, SH = standardised heterozygosity, IR
= internal relatedness, FIS = the inbreeding coefficient, and the number of male and female
individuals. Fragmented sites are indicated in parentheses (f).
Population N AR AP HO HE SH IR FIS Males Females
Nangwarry (f) 27 5.496 5 0.668 0.679 1.023 0.048 0.036 6 21
Dry Creek (f) 66 5.191 0 0.629 0.671 0.961 0.088 0.070 37 29
Honans (f) 36 4.895 0 0.610 0.631 0.933 0.101 0.046 12 24
Annya 17 5.242 0 0.684 0.644 1.041 0.005 -0.030 9 8
Otways 18 5.889 6 0.715 0.694 1.087 0.004 -0.002 13 5
Grampians 23 5.130 12 0.641 0.665 0.986 0.174 0.058 7 16
Mt Eccles 24 5.234 1 0.688 0.670 1.052 0.011 -0.006 17 7
Hotspur 31 4.965 1 0.682 0.666 1.042 0.009 -0.008 15 16
Strathdownie 14 5.267 0 0.643 0.641 0.983 0.057 0.034 13 1
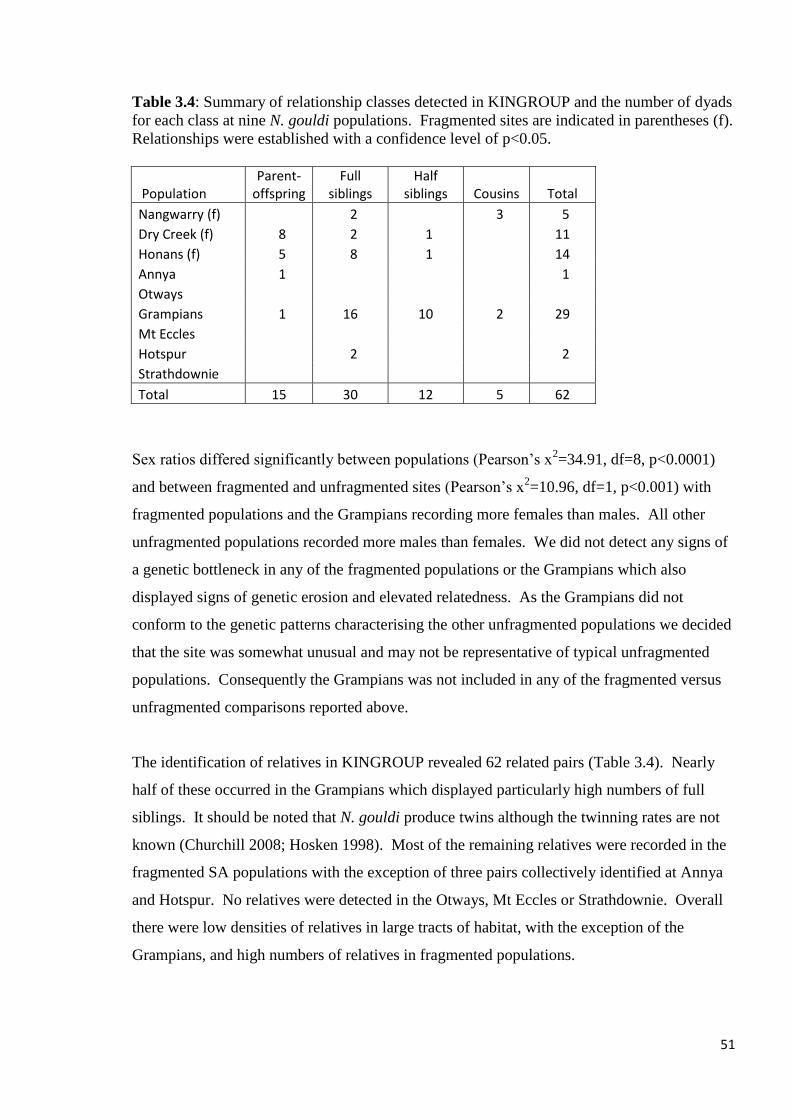
51
Table 3.4: Summary of relationship classes detected in KINGROUP and the number of dyads
for each class at nine N. gouldi populations. Fragmented sites are indicated in parentheses (f).
Relationships were established with a confidence level of p<0.05.
Sex ratios differed significantly between populations (Pearson‘s x2=34.91, df=8, p<0.0001)
and between fragmented and unfragmented sites (Pearson‘s x2=10.96, df=1, p<0.001) with
fragmented populations and the Grampians recording more females than males. All other
unfragmented populations recorded more males than females. We did not detect any signs of
a genetic bottleneck in any of the fragmented populations or the Grampians which also
displayed signs of genetic erosion and elevated relatedness. As the Grampians did not
conform to the genetic patterns characterising the other unfragmented populations we decided
that the site was somewhat unusual and may not be representative of typical unfragmented
populations. Consequently the Grampians was not included in any of the fragmented versus
unfragmented comparisons reported above.
The identification of relatives in KINGROUP revealed 62 related pairs (Table 3.4). Nearly
half of these occurred in the Grampians which displayed particularly high numbers of full
siblings. It should be noted that N. gouldi produce twins although the twinning rates are not
known (Churchill 2008; Hosken 1998). Most of the remaining relatives were recorded in the
fragmented SA populations with the exception of three pairs collectively identified at Annya
and Hotspur. No relatives were detected in the Otways, Mt Eccles or Strathdownie. Overall
there were low densities of relatives in large tracts of habitat, with the exception of the
Grampians, and high numbers of relatives in fragmented populations.
Population Parent-
offspring Full
siblings Half
siblings Cousins Total
Nangwarry (f)
2
3 5
Dry Creek (f) 8 2 1
11
Honans (f) 5 8 1
14
Annya 1
1
Otways Grampians 1 16 10 2 29
Mt Eccles Hotspur
2
2
Strathdownie Total 15 30 12 5 62
52
DISCUSSION
Reduced gene-flow across agricultural land
Trapping data revealed the relative absence of N. gouldi from three of our six fragmented sites
which included the two most isolated locations of Framlingham and Woolsthorpe. This in
itself was an important finding suggesting N. gouldi may be unable to maintain viable
populations under such degrees of isolation. Woolsthorpe is particularly small (60ha) and
may not be large enough to support a viable population size. Framlingham is larger than
several of our other fragmented sites supporting populations of N. gouldi (e.g. Honans and
Dry Creek) suggesting that isolation may be a key factor determining the species near-
absence. However, both Honans and Dry Creek have neighbouring networks of additional
habitat patches which may collectively facilitate population persistence. Furthermore, a
bushfire swept through Framlingham in 2007 affecting nearly the entire site (Geoff Clarke Jr.
―Possum‖, Forest Manager, Framlingham Aboriginal Trust, pers.comm.). Consequently the
absence of N. gouldi from the site could be due to a localised extinction or eviction caused by
this fire event. In this scenario the absence may reflect the species inability to recolonise the
site due to low numbers, or absence, in the surrounding agricultural matrix and lack of
metapopulation dynamics with neighbouring populations to facilitate such a recolonisation.
Our genetic analyses provided multiple lines of evidence to suggest high rates of gene flow
for N. gouldi between populations well connected by native forest, and through continuous
forest, whilst indicating restricted gene flow between locations separated by larger stretches
of agricultural land. This trend is supported by measures of population differentiation (FST
and Dest), Mantel tests assessing the influence of the matrix type (agriculture versus forest),
spatial autocorrelations comparing continuous and fragmented populations, and average
dispersal distances of migration events proposed by GENECLASS analysis. The exception to
the consensus in our results was the characterisation of population structure via Bayesian
clustering analyses. Although the Grampians was consistently recognised as a unique cluster,
lending support to isolation from agricultural land, this story was not reflected in other
isolated sites. We suspect this phenomenon is due to the difficulty these analyses can have in
identifying structure between populations when FST is <0.02-0.03 (Francois & Durand 2010;
Latch et al. 2006). Excluding the Grampians from the calculation the average FST values for
our populations were: Nangwarry 0.018, Dry Creek 0.006, Honans 0.023, Annya 0.013,

53
Otways 0.021, Mt Eccles 0.007, Hotspur 0.006 and Strathdownie 0.004. It is therefore not
surprising that these approaches were unable to detect population structure elsewhere across
the study region.
Despite the lack of support from these Bayesian clustering approaches for the population
differentiation indicated through alternative analyses, there were nevertheless several
interesting findings. Given the absence of samples in our study from populations along the
Great Dividing Range, eastern Australia, and the Cobboboonee/Glenelg region in western
Victoria it is possible that Clusters 3 (supported by GENELAND & TESS) and 4
(GENELAND) respectively represent the genetic influence of these potentially significant
gene-pools, an interpretation supported by the proposed location of these clusters (Figures 3.3
& 4). Also of note was the lower probability of assignment for individuals from the Otways
to Cluster 3.2 (GENELAND) compared to the westerly populations assigned to this cluster
(see Figure 3.4b) suggesting some level of differentiation between these regions as indicated
by Dest, and to a lesser extent FST.
As a more recently introduced measure of population differentiation, Jost‘s Dest was described
by Callens et al. (2011) as being ‗increasingly considered more reliable than traditional FST
and related measures in assessing allelic differences‘. In our study Dest proved highly
informative, particularly in our comparison between continuous and fragmented sites. Prior
to Bonferroni correction, Dest was significant between all locations with the exception of
pairwise comparisons between the four continuous sites and Dry Creek, indicating high rates
of gene flow between these five populations. Dry Creek is separated from the continuous
sites by more than 30km. However, only two small agricultural crossings (~1.25km and
0.5km) separate the two via Lower Glenelg NP and Cobboboonee SF which represents the
most likely path for gene flow. The agricultural distance isolating Dry Creek is similar to that
separating Mt Eccles from the other continuous sites (~1.6km) and these two cases suggest
that high rates of gene flow, indicated by low FST and Dest, can be maintained across
agricultural distances <2km. Conversely, all sites separated by >2km of agricultural land
displayed significant Dest prior to Bonferroni correction, with most cases retaining
significance post correction. In addition to low measures of population differentiation, our
decision to include Mt Eccles in the continuous forest transect is further supported by spatial
autocorrelation suggesting unimpeded gene flow between the continuous sites.
54
Overall Dest and FST results suggested a strong positive association between habitat
fragmentation and population differentiation. Mantel tests examining the correlation between
population differentiation (FST and Dest) and the intervening landscape type (agriculture or
forest habitat) confirmed a significant correlation between the presence of agricultural land
and increased genetic differentiation. Meyer et al. (2009) similarly found that populations of
Carollia perspicillata inhabiting fragmented habitat islands in an artificial lake were
significantly more differentiated than populations sampled in surrounding continuous forest.
Likewise, Kerth and Petit (2005) found that population differentiation in Myotis bechsteinii
was more influenced by co-occurrence within continuous forest than by geographic distance
alone. This mirrors our own findings in that populations separated by <2km of agricultural
land are less differentiated than more fragmented populations regardless of the geographic
distance between them. For example, Mt Eccles and Strathdownie (linear distance = 75km,
agricultural distance = 1.6km) are less differentiated than Nangwarry and Strathdownie (linear
distance = 38km, agricultural distance = 10km) despite being nearly twice as far away from
one another.
Dispersal events proposed by GENECLASS also suggested preferential dispersal through
suitable habitat. This was suggested by the respective average linear and agricultural
dispersal distances of 81km and 24km. In addition, nine of the fifteen proposed dispersal
events required crossing no more than 4km of agricultural land. As a further consideration,
dispersal estimates in GENECLASS are probability based, and with low FST values between
most sites these results should be treated with caution (Berry et al. 2004). In particular, the
two long-range dispersal events are outliers to the general trend and should not be interpreted
as confirmation of the species ability to traverse vast stretches of agricultural land. In fact, the
individual proposed as a migrant from the Otways to Nangwarry (Ngo9) was highlighted as a
migrant in STRUCTURE, BAPS and TESS, and each of these Bayesian approaches proposed
a different source population. This example highlights the inaccuracy of such Bayesian
techniques when population differentiation is too weak. The other proposed long-range
migrant (Ngo263) did not have multiple solutions proposed by the different approaches,
however, pairwise FST and Dest between the resident (Otways) and source (Strathdownie)
populations was even lower than in the case of Ngo9. GENECLASS is also restricted to
selecting the most likely candidate source population from the selection of sites provided. We
acknowledge that not all locations within the study region were sampled and that the true
source population may not be represented in the dataset. This seems likely given nine
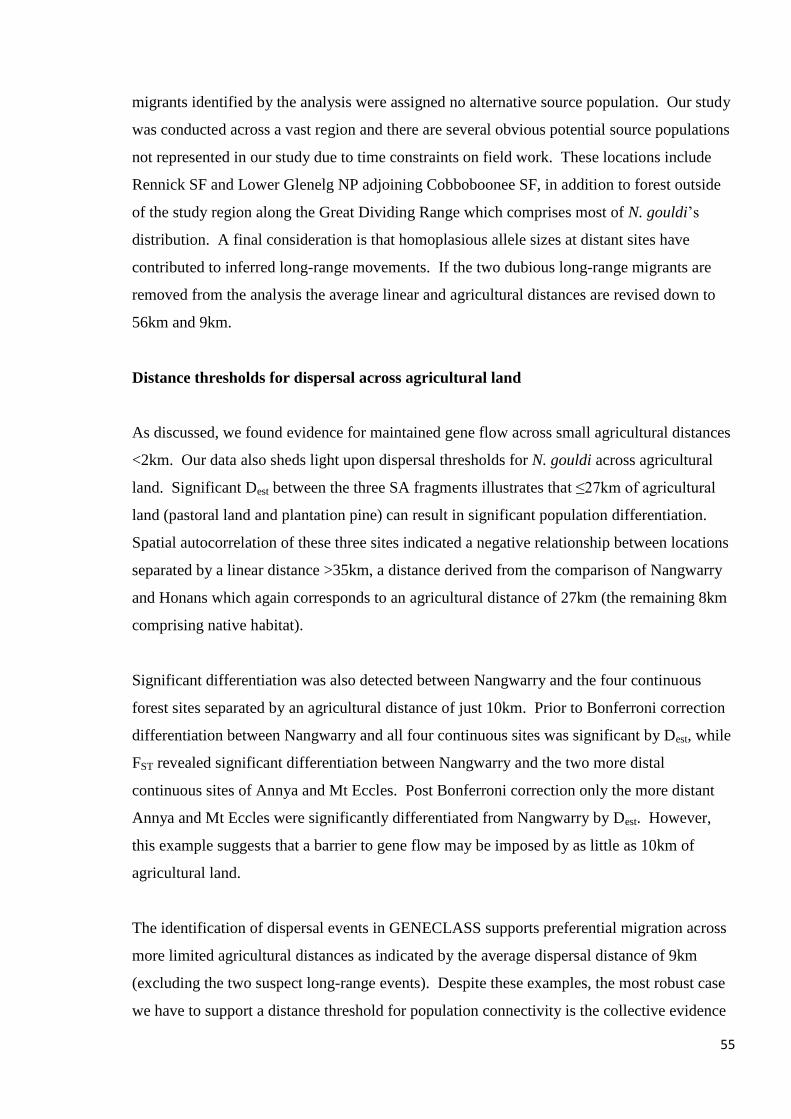
55
migrants identified by the analysis were assigned no alternative source population. Our study
was conducted across a vast region and there are several obvious potential source populations
not represented in our study due to time constraints on field work. These locations include
Rennick SF and Lower Glenelg NP adjoining Cobboboonee SF, in addition to forest outside
of the study region along the Great Dividing Range which comprises most of N. gouldi‘s
distribution. A final consideration is that homoplasious allele sizes at distant sites have
contributed to inferred long-range movements. If the two dubious long-range migrants are
removed from the analysis the average linear and agricultural distances are revised down to
56km and 9km.
Distance thresholds for dispersal across agricultural land
As discussed, we found evidence for maintained gene flow across small agricultural distances
<2km. Our data also sheds light upon dispersal thresholds for N. gouldi across agricultural
land. Significant Dest between the three SA fragments illustrates that ≤27km of agricultural
land (pastoral land and plantation pine) can result in significant population differentiation.
Spatial autocorrelation of these three sites indicated a negative relationship between locations
separated by a linear distance >35km, a distance derived from the comparison of Nangwarry
and Honans which again corresponds to an agricultural distance of 27km (the remaining 8km
comprising native habitat).
Significant differentiation was also detected between Nangwarry and the four continuous
forest sites separated by an agricultural distance of just 10km. Prior to Bonferroni correction
differentiation between Nangwarry and all four continuous sites was significant by Dest, while
FST revealed significant differentiation between Nangwarry and the two more distal
continuous sites of Annya and Mt Eccles. Post Bonferroni correction only the more distant
Annya and Mt Eccles were significantly differentiated from Nangwarry by Dest. However,
this example suggests that a barrier to gene flow may be imposed by as little as 10km of
agricultural land.
The identification of dispersal events in GENECLASS supports preferential migration across
more limited agricultural distances as indicated by the average dispersal distance of 9km
(excluding the two suspect long-range events). Despite these examples, the most robust case
we have to support a distance threshold for population connectivity is the collective evidence
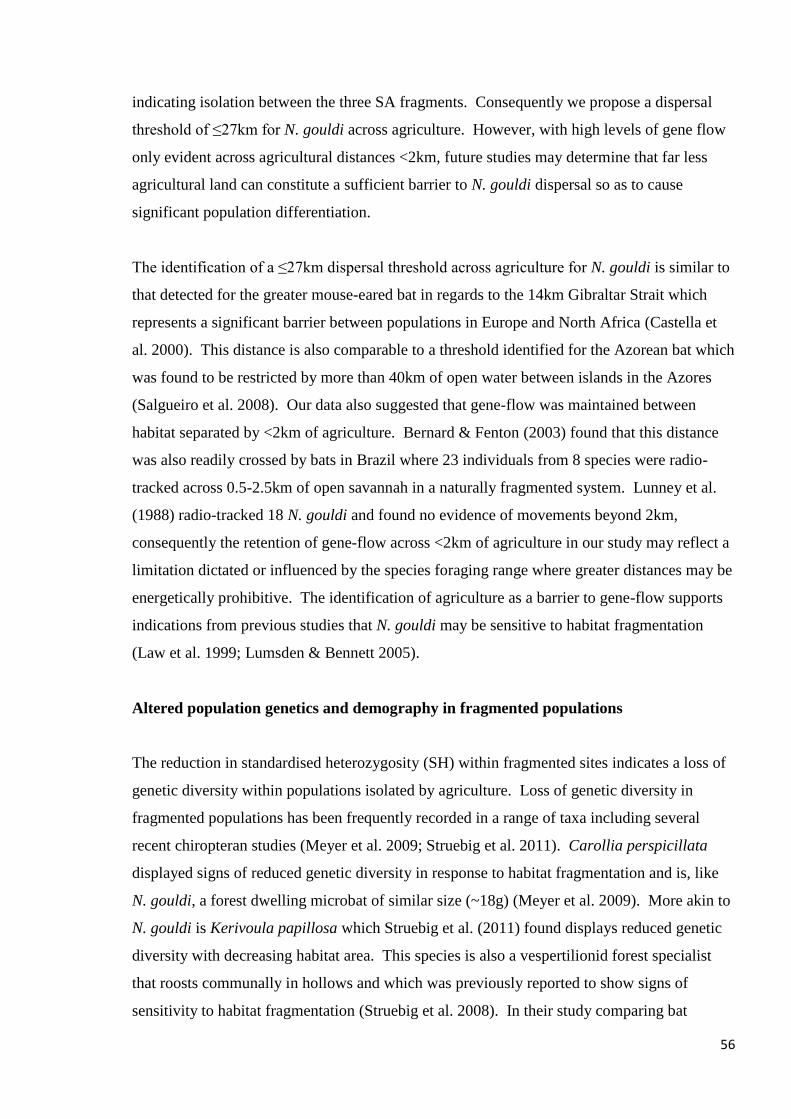
56
indicating isolation between the three SA fragments. Consequently we propose a dispersal
threshold of ≤27km for N. gouldi across agriculture. However, with high levels of gene flow
only evident across agricultural distances <2km, future studies may determine that far less
agricultural land can constitute a sufficient barrier to N. gouldi dispersal so as to cause
significant population differentiation.
The identification of a ≤27km dispersal threshold across agriculture for N. gouldi is similar to
that detected for the greater mouse-eared bat in regards to the 14km Gibraltar Strait which
represents a significant barrier between populations in Europe and North Africa (Castella et
al. 2000). This distance is also comparable to a threshold identified for the Azorean bat which
was found to be restricted by more than 40km of open water between islands in the Azores
(Salgueiro et al. 2008). Our data also suggested that gene-flow was maintained between
habitat separated by <2km of agriculture. Bernard & Fenton (2003) found that this distance
was also readily crossed by bats in Brazil where 23 individuals from 8 species were radio-
tracked across 0.5-2.5km of open savannah in a naturally fragmented system. Lunney et al.
(1988) radio-tracked 18 N. gouldi and found no evidence of movements beyond 2km,
consequently the retention of gene-flow across <2km of agriculture in our study may reflect a
limitation dictated or influenced by the species foraging range where greater distances may be
energetically prohibitive. The identification of agriculture as a barrier to gene-flow supports
indications from previous studies that N. gouldi may be sensitive to habitat fragmentation
(Law et al. 1999; Lumsden & Bennett 2005).
Altered population genetics and demography in fragmented populations
The reduction in standardised heterozygosity (SH) within fragmented sites indicates a loss of
genetic diversity within populations isolated by agriculture. Loss of genetic diversity in
fragmented populations has been frequently recorded in a range of taxa including several
recent chiropteran studies (Meyer et al. 2009; Struebig et al. 2011). Carollia perspicillata
displayed signs of reduced genetic diversity in response to habitat fragmentation and is, like
N. gouldi, a forest dwelling microbat of similar size (~18g) (Meyer et al. 2009). More akin to
N. gouldi is Kerivoula papillosa which Struebig et al. (2011) found displays reduced genetic
diversity with decreasing habitat area. This species is also a vespertilionid forest specialist
that roosts communally in hollows and which was previously reported to show signs of
sensitivity to habitat fragmentation (Struebig et al. 2008). In their study comparing bat
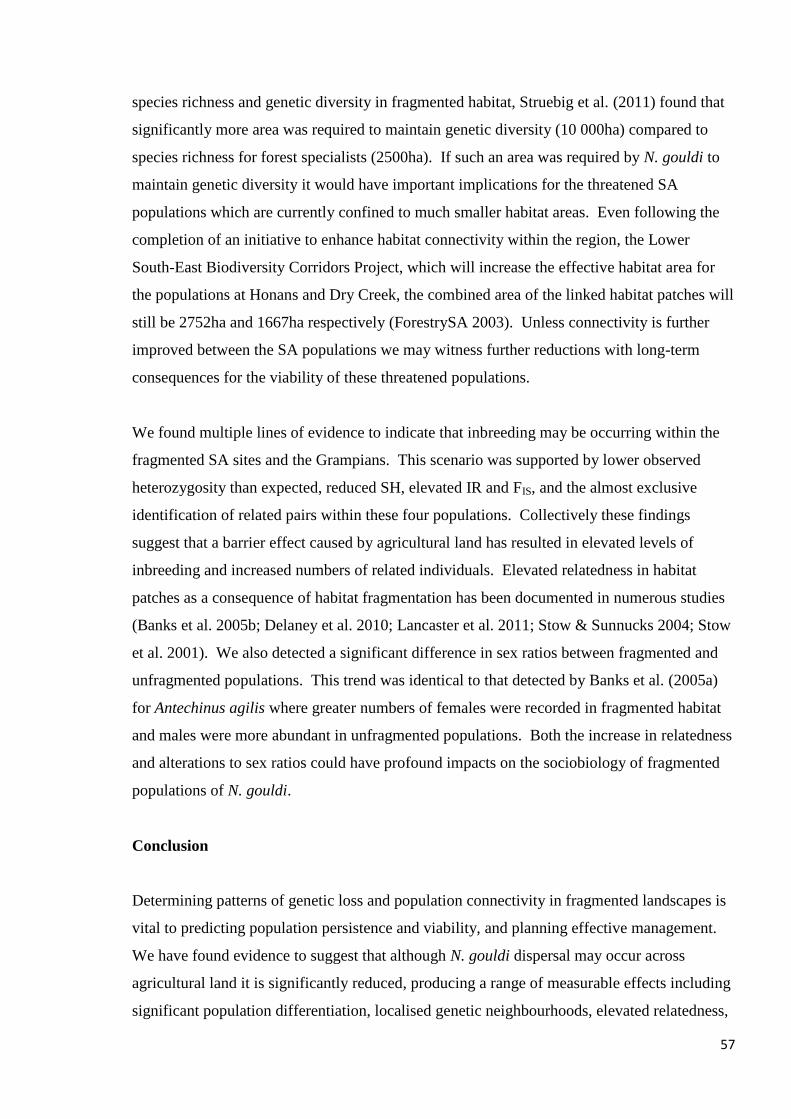
57
species richness and genetic diversity in fragmented habitat, Struebig et al. (2011) found that
significantly more area was required to maintain genetic diversity (10 000ha) compared to
species richness for forest specialists (2500ha). If such an area was required by N. gouldi to
maintain genetic diversity it would have important implications for the threatened SA
populations which are currently confined to much smaller habitat areas. Even following the
completion of an initiative to enhance habitat connectivity within the region, the Lower
South-East Biodiversity Corridors Project, which will increase the effective habitat area for
the populations at Honans and Dry Creek, the combined area of the linked habitat patches will
still be 2752ha and 1667ha respectively (ForestrySA 2003). Unless connectivity is further
improved between the SA populations we may witness further reductions with long-term
consequences for the viability of these threatened populations.
We found multiple lines of evidence to indicate that inbreeding may be occurring within the
fragmented SA sites and the Grampians. This scenario was supported by lower observed
heterozygosity than expected, reduced SH, elevated IR and FIS, and the almost exclusive
identification of related pairs within these four populations. Collectively these findings
suggest that a barrier effect caused by agricultural land has resulted in elevated levels of
inbreeding and increased numbers of related individuals. Elevated relatedness in habitat
patches as a consequence of habitat fragmentation has been documented in numerous studies
(Banks et al. 2005b; Delaney et al. 2010; Lancaster et al. 2011; Stow & Sunnucks 2004; Stow
et al. 2001). We also detected a significant difference in sex ratios between fragmented and
unfragmented populations. This trend was identical to that detected by Banks et al. (2005a)
for Antechinus agilis where greater numbers of females were recorded in fragmented habitat
and males were more abundant in unfragmented populations. Both the increase in relatedness
and alterations to sex ratios could have profound impacts on the sociobiology of fragmented
populations of N. gouldi.
Conclusion
Determining patterns of genetic loss and population connectivity in fragmented landscapes is
vital to predicting population persistence and viability, and planning effective management.
We have found evidence to suggest that although N. gouldi dispersal may occur across
agricultural land it is significantly reduced, producing a range of measurable effects including
significant population differentiation, localised genetic neighbourhoods, elevated relatedness,
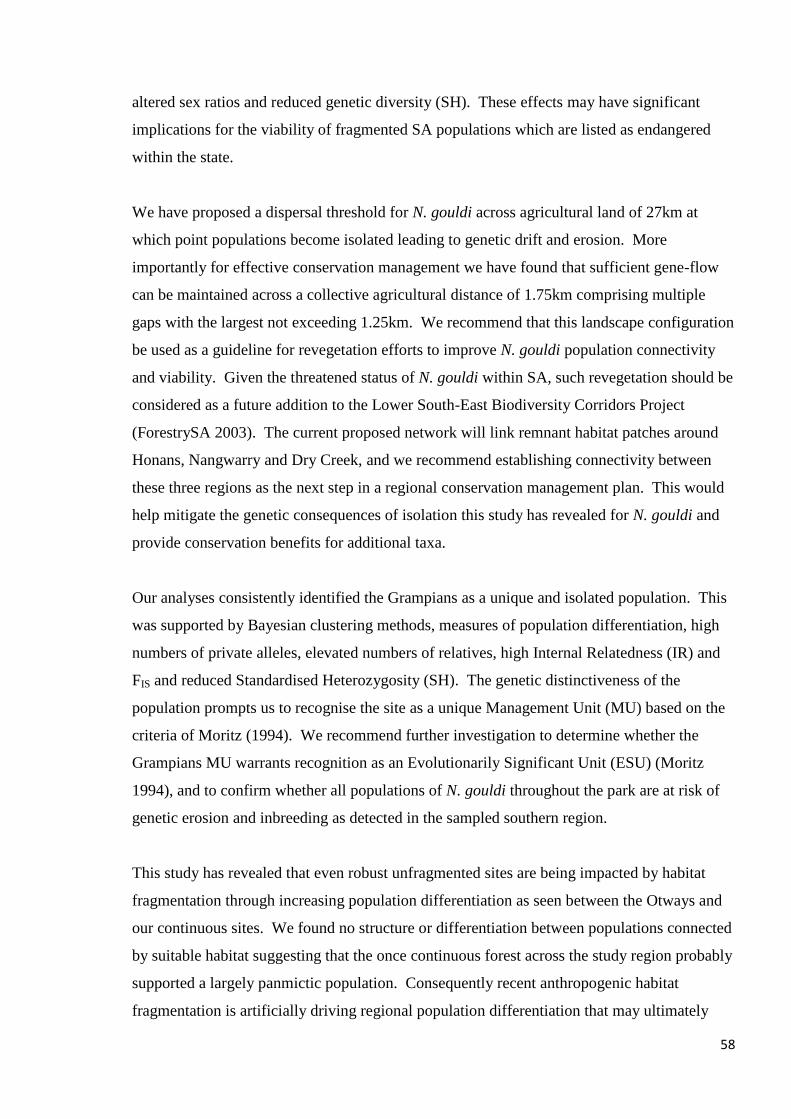
58
altered sex ratios and reduced genetic diversity (SH). These effects may have significant
implications for the viability of fragmented SA populations which are listed as endangered
within the state.
We have proposed a dispersal threshold for N. gouldi across agricultural land of 27km at
which point populations become isolated leading to genetic drift and erosion. More
importantly for effective conservation management we have found that sufficient gene-flow
can be maintained across a collective agricultural distance of 1.75km comprising multiple
gaps with the largest not exceeding 1.25km. We recommend that this landscape configuration
be used as a guideline for revegetation efforts to improve N. gouldi population connectivity
and viability. Given the threatened status of N. gouldi within SA, such revegetation should be
considered as a future addition to the Lower South-East Biodiversity Corridors Project
(ForestrySA 2003). The current proposed network will link remnant habitat patches around
Honans, Nangwarry and Dry Creek, and we recommend establishing connectivity between
these three regions as the next step in a regional conservation management plan. This would
help mitigate the genetic consequences of isolation this study has revealed for N. gouldi and
provide conservation benefits for additional taxa.
Our analyses consistently identified the Grampians as a unique and isolated population. This
was supported by Bayesian clustering methods, measures of population differentiation, high
numbers of private alleles, elevated numbers of relatives, high Internal Relatedness (IR) and
FIS and reduced Standardised Heterozygosity (SH). The genetic distinctiveness of the
population prompts us to recognise the site as a unique Management Unit (MU) based on the
criteria of Moritz (1994). We recommend further investigation to determine whether the
Grampians MU warrants recognition as an Evolutionarily Significant Unit (ESU) (Moritz
1994), and to confirm whether all populations of N. gouldi throughout the park are at risk of
genetic erosion and inbreeding as detected in the sampled southern region.
This study has revealed that even robust unfragmented sites are being impacted by habitat
fragmentation through increasing population differentiation as seen between the Otways and
our continuous sites. We found no structure or differentiation between populations connected
by suitable habitat suggesting that the once continuous forest across the study region probably
supported a largely panmictic population. Consequently recent anthropogenic habitat
fragmentation is artificially driving regional population differentiation that may ultimately

59
result in divergent populations, thus altering the evolutionary trajectory of the species. With
the looming prospect of drifting species ranges due to climate change, land managers will
increasingly need to consider improving regional habitat connectivity to facilitate distribution
shifts in response to altering climatic conditions. Our study illustrates that even flying
mammals may be limited in their capacity to adapt through migration due to barriers imposed
by habitat fragmentation, thus highlighting the magnitude of risk for less vagile terrestrial and
arboreal species.
60
Chapter 4
The comparative influence of habitat fragmentation on two congeneric
vespertilionids with near-identical morphology and contrasting
degrees of specialisation
Nicholas C. Fuller1, Susan M. Carthew
1,2 and Steven J.B. Cooper
1,3
1 School of Earth & Environmental Sciences, The University of Adelaide
2 Research Institute for Environment and Livelihoods, Charles Darwin University
3 Evolutionary Biology Unit, South Australian Museum
ABSTRACT
Few studies have investigated the influence of habitat fragmentation on population
connectivity and genetic diversity in bats. We address this paucity of research by conducting
a landscape scale investigation of population connectivity through continuous and fragmented
habitats. Comparison of a habitat specialist and a habitat generalist with near-identical
morphology provides a unique opportunity to test the reliability of several proposed predictors
of bat sensitivity to habitat fragmentation. We developed 16 microsatellite markers to
facilitate the study and sampled 502 Nyctophilus geoffroyi and 259 N. gouldi at 14 sites across
south-eastern Australia. Fragmented populations of N. gouldi displayed reduced population
connectivity, reduced genetic diversity, elevated relatedness and inbreeding (FIS), and altered
sex ratios. In contrast, N. geoffroyi displayed virtually no response to habitat fragmentation
with fragmented populations showing the same levels of genetic diversity and population
connectivity as populations within continuous forest. Our data suggest that N. geoffroyi is
resilient to landscape change and is readily able to disperse across large tracts of agricultural
land. Contrasting responses between these two species with near-identical morphology
questions the reliability of wing morphology as a proposed predictor of bat sensitivity to
habitat fragmentation. At the same time our results lend further support to other predictive
traits of bat sensitivity to habitat fragmentation, most notably habitat specialisation and
tolerance to the intervening matrix between fragmented habitats. We conclude that species
with plastic ecology and behaviour are more likely to cope with fragmented habitat as are
species commonly detected within the matrix.
61
INTRODUCTION
Habitat fragmentation is a principal cause of population declines and localised extinctions
(Baillie et al. 2004; Burkey 1989; Reed 2004). Baillie et al. (2004) stated that habitat
destruction, degradation and fragmentation represent the greatest threat to terrestrial species
impacting 86% of threatened birds, 86% of threatened mammals and 88% of threatened
amphibians worldwide. By restricting wildlife to small or isolated habitat islands habitat
fragmentation can reduce effective population sizes exposing resident populations to a range
of genetic, demographic and environmental threats (Caughley 1994; Frankham 1995; Lacy
1997; Shaffer 1981).
The ability of a species to utilise or traverse the intervening matrix between fragmented
habitat patches determines population connectivity and thus whether a population is isolated,
restricted in size and accessible for recolonisation following a localised extinction event
(Brown & Kodric-Brown 1977; Burkey 1989; Fahrig & Merriam 1985; Fahrig & Paloheimo
1988; Hanski 1991, 1998). If a species is able to exploit the matrix as habitat then the matrix
may simply represent a continuation of habitat and should not pose a barrier to population
connectivity (Laurance 1991; Laurance et al. 2011). Similarly, if the matrix can facilitate
dispersal then populations will not become isolated and may instead maintain connectivity as
more robust metapopulations (Hanski 1991, 1998). Sufficient transfer of individuals between
fragmented populations can buffer them against such threats as genetic drift, inbreeding and
demographic stochasticity through the introduction of new individuals and genetic diversity
(Brown & Kodric-Brown 1977; Burkey 1989). Immigration also facilitates the re-
establishment of populations following reductions or localised extinctions due to stochastic
environmental events such as fire or disease (Fahrig & Merriam 1985; Hanski 1991, 1998).
Consequently, determining the influence of habitat fragmentation on population connectivity
and dispersal is vital to identifying which species are vulnerable to this threatening process
and how landscapes can be managed to encourage dispersal and mitigate negative effects,
thereby improving conservation outcomes.
Studies of animal movements are a valuable approach for assessing dispersal in fragmented
landscapes although telemetric methods and mark-recapture generally result in limited
datasets due to cost, labour intensity and restrictive spatial scale (Hebblewhite & Haydon
2010; Nathan et al. 2003). Furthermore, these approaches fail to determine whether a
62
dispersal event has led to successful establishment and reproduction (Broquet & Petit 2009).
An alternate approach that avoids these shortcomings is landscape genetics which provides
the ideal means by which to investigate population connectivity and gene flow in relation to
landscape configuration (Schlosser et al. 2009; Sork & Waits 2010).
Genetic studies investigating the influence of habitat fragmentation on gene flow and
population connectivity are increasing (Storfer et al. 2010), but data are still lacking for the
vast majority of taxa. This is particularly true for bats (Burland & Worthington Wilmer
2001). Although several studies have examined bat gene flow amongst sites naturally
fragmented by water bodies (Castella et al. 2000; Pumo et al. 1988; Salgueiro et al. 2008), we
are only aware of two studies (Meyer et al. 2009; Struebig et al. 2011) specifically designed to
investigate bat gene flow in habitat fragmented by human activity, the scenario of concern
and relevance to conservation biologists.
Meyer et al. (2009) compared two microbats with contrasting ecology, one more mobile than
the other, utilising mtDNA to assess haplotype diversity and population differentiation (FST)
amongst fragmented sites and sites within continuous forest. They found that the less mobile
Carollia perspicillata had significantly lower haplotype diversity in fragmented sites
compared with continuous forest sites and that FST was higher between fragmented sites than
between sites connected through continuous forest. This contrasted with the more mobile
Uroderma bilobatum which displayed no such effects, supporting the notion that mobility is a
key factor determining bat responses to fragmentation. The study by Struebig et al. (2011)
was more theoretical in nature investigating the correlation between changes to allelic
diversity and species richness, and between genetic differentiation and species assemblage
dissimilarity, under the influence of habitat fragmentation.
The lack of research in this area is surprising given that Chiroptera is the second most
speciose order of mammals containing more than 20% of mammal species, and with nearly
24% of bat species listed as threatened (Critically Endangered, Endangered, Vulnerable) by
the IUCN (Mickleburgh et al. 2002). To inform management decisions and improve
conservation outcomes we require more empirical studies that target the direct impacts of
habitat fragmentation on population processes such as dispersal, mating systems and
demography, so that negative impacts can be identified and mitigated.
63
In this chapter we endeavour to further our understanding of how human induced habitat
fragmentation influences the key process of dispersal and population connectivity in bats. We
will build upon our companion study (Chapter 3) which explored the consequences of habitat
fragmentation on the habitat specialist Nyctophilus gouldi by assessing a congeneric habitat
generalist, N. geoffroyi, across the same landscape. We have selected our target species based
on several considerations; Vespertilionidae is the largest of all bat families (Mickleburgh et al.
2002) and in Australia Nyctophilus represents one of the most species rich chiropteran genera
(Churchill 2008). The genus also contains two species that provide an ideal model to
compare bat responses to habitat fragmentation.
N. gouldi is listed as threatened in South Australia, and has a distribution restricted to native
forest and woodland in eastern and south-western Australia (Churchill 2008; Lunney et al.
1988). This distribution suggests the species is somewhat of a habitat specialist and records
within disturbed agricultural settings are rare (Lumsden & Bennett 2005) indicating that it
may be vulnerable to habitat fragmentation. Indeed our investigation of N. gouldi found that
habitat fragmentation had led to reduced population connectivity, significantly lower genetic
diversity, significantly elevated levels of inbreeding and relatedness, and significantly altered
sex ratios (Chapter 3). Contrasting with N. gouldi, N. geoffroyi displays a near-ubiquitous
distribution across the Australian continent and is readily recorded in disturbed agricultural
landscapes, suggesting the species is a habitat generalist with more plastic ecology (Churchill
2008; Lumsden & Bennett 2005; Lumsden et al. 2002a). However, the two species have
much in common as both are tree roosting (hollows, cavities and under bark) (Churchill 2008;
Lumsden et al. 2002b; Lunney et al. 1988) insectivores with similar diets (Fullard et al. 1991;
Lumsden & Bennett 2005; Vestjens & Hall 1977), foraging behaviour (Brigham et al. 1997;
Grant 1991; O'neill & Taylor 1986) and near-identical morphology (Brigham et al. 1997;
Churchill 2008; Fullard et al. 1991; Norberg & Rayner 1987; Rhodes 2002), although N.
gouldi is typically larger than N. geoffroyi with average weights of 12.3g and 8.2g
respectively (Churchill 2008). Furthermore, analysis of wing morphology indicates very little
difference between the two species which both display low aspect ratio and wing loading
characteristic of flycatchers adapted for slow manoeuvrable flight (Brigham et al. 1997;
Fullard et al. 1991; Norberg & Rayner 1987; Rhodes 2002).
In addition to furthering our knowledge of bat responses to habitat fragmentation, the
comparison between N. gouldi and N. geoffroyi will provide a unique opportunity to assess
64
the merit of a proposed predictor of bat vulnerability to threatening processes: wing
morphology (Jones et al. 2003; Meyer et al. 2008; Safi & Kerth 2004). The prospect of
identifying traits linked to vulnerability is attractive to conservation biologists as it allows for
the a priori identification of which species are of concern and warrant attention or
intervention (Mac Nally & Bennett 1997). Predictors of extinction risk and sensitivity to
threatening processes have received much attention with proposed animal traits including
specialisation, body size, fecundity, longevity, rarity, abundance, geographic range and
trophic position, amongst others (Cardillo et al. 2008; Davidson et al. 2009; Henle et al. 2004;
Laurance 1991; O'Grady et al. 2004; Safi & Kerth 2004). Many of these traits have been
examined and proposed as predictors of sensitivity to habitat fragmentation along with several
additional traits specific to this particular threatening process such as mobility and tolerance
to the matrix (Davies et al. 2000; Foufopoulos & Ives 1999; Gehring & Swihart 2003; Henle
et al. 2004; Laurance 1991; Lehtinen & Ramanamanjato 2006; Mac Nally & Bennett 1997;
Tscharntke et al. 2002; Viveiros de Castro & Fernandez 2004; Wang et al. 2009; Watling &
Donnelly 2007). Wing morphology has been proposed as an additional predictive chiropteran
trait, receiving some support in relation to vulnerability to habitat fragmentation (Albrecht et
al. 2007; Meyer et al. 2008) and extinction in general (Jones et al. 2003; Safi & Kerth 2004).
Low aspect ratio and wing loading have been associated with habitat specialisation (Safi &
Kerth 2004) and indicate adaptation for slow manoeuvrable flight believed energetically
unsuited to long distance flight (Norberg & Rayner 1987) thus reflecting mobility and the
capacity to move between habitat fragments.
Aims
Genetic analyses will be conducted to assess the impact of habitat fragmentation on N.
geoffroyi population connectivity and genetic diversity. These analyses will mirror our work
on N. gouldi in Chapter 3 facilitating a comparison between the two species. Due to the near-
identical wing morphology of N. gouldi and N. geoffroyi this predictive trait would suggest
that both species possess the same physiological capacity for dispersal across agricultural land
and will share a similar response to habitat fragmentation. However, several other factors
suggest that the two species will respond in contrasting ways. Firstly, the geographic
distribution of the two species suggests that N. geoffroyi is a habitat generalist displaying
ecological plasticity whereas N. gouldi is strictly a forest and woodland specialist. Secondly,
N. geoffroyi is able to exploit and traverse the agricultural matrix which has not been
65
documented in N. gouldi. Collectively, habitat specialisation and tolerance to the matrix
suggest that N. gouldi will be more greatly affected by habitat fragmentation than in its
congeneric N. geoffroyi. Overriding predictions based on wing morphology, we predict that
the habitat specialist N. gouldi will be more influenced by habitat fragmentation than the
habitat generalist N. geoffroyi.
METHODS
As a companion paper to our study of N. gouldi (Chapter 3), the methodology in this chapter
mirrors that of the first. Consequently we will concisely reiterate methods but for more
detailed information regarding study sites, fieldwork, laboratory work and analyses refer to
Chapter 3. The only exceptions to the replication of Chapter 3 methodology is the inclusion
of two additional sites (Weecurra SF and Warreanga NFR) and reduced Bayesian analyses
(no TESS or BAPS).
Study sites and sample collection
Fourteen sites were sampled for N. geoffroyi across south-eastern South Australia and western
Victoria in a region composed of native forest remnants, agriculture and plantation forestry
(Figure 4.1). Five sites comprised an 80km transect through continuous forest, namely
Strathdownie, Weecurra, Hotspur and Annya State Forests (SF) and Mt Eccles National Park
(NP). Two additional expansive forest sites, the Grampians and Great Otway NPs, were
sampled as potential sources of gene-flow to isolated fragments on the Victorian volcanic
plains. Seven discrete habitat fragments were sampled in total comprising three Victorian
sites surrounded by agriculture and four South Australian sites isolated by agriculture and
embedded within plantation pine (Pinus radiata). Victorian fragments include Mt Napier
State Park (SP) (2800ha), Framlingham Native Title Reserve (1180ha) and Woolsthorpe
Nature Conservation Reserve (NCR) (60ha). South Australian sites represent four of the
largest remnant patches of native vegetation in the south-east and include Nangwarry
(2218ha), Dry Creek (396ha), Honan‘s (1041ha) and Warreanga (429ha including the
adjoining Penambol Conservation Park) Native Forest Reserves (NFR). Over the last 150
years of European settlement the study region has been extensively cleared for agriculture
creating a landscape mosaic of remnant native vegetation and plantation forestry within an
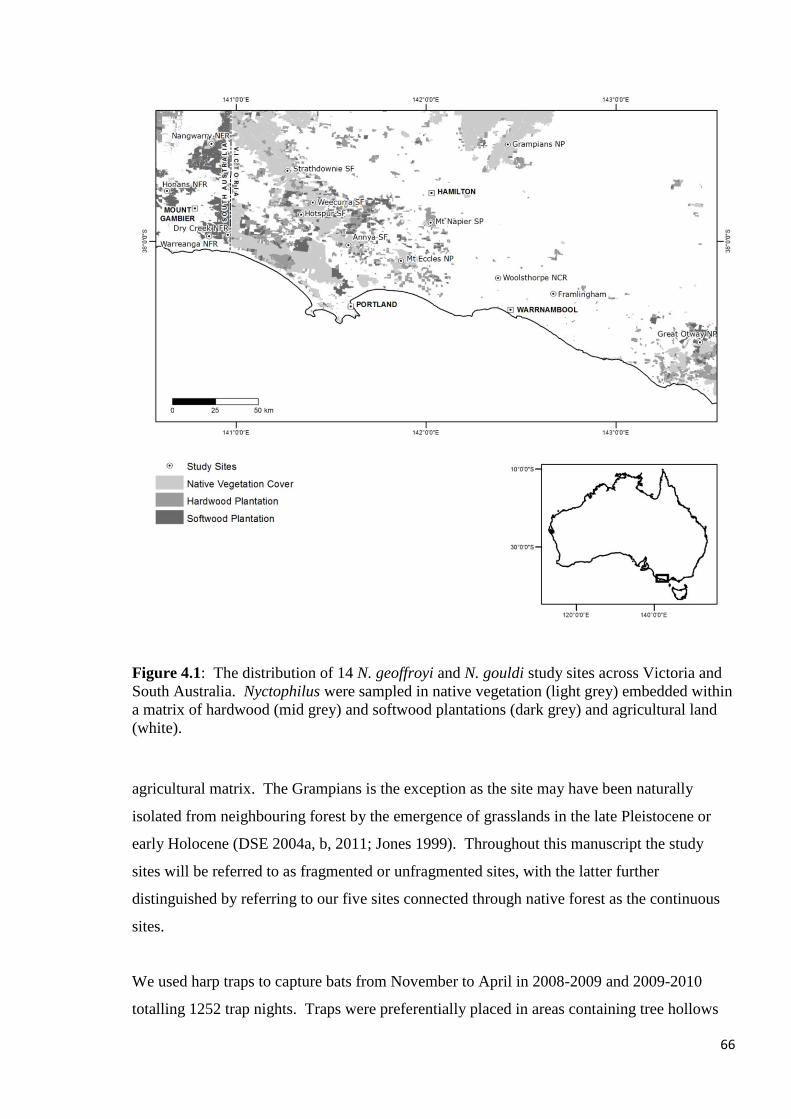
66
Figure 4.1: The distribution of 14 N. geoffroyi and N. gouldi study sites across Victoria and
South Australia. Nyctophilus were sampled in native vegetation (light grey) embedded within
a matrix of hardwood (mid grey) and softwood plantations (dark grey) and agricultural land
(white).
agricultural matrix. The Grampians is the exception as the site may have been naturally
isolated from neighbouring forest by the emergence of grasslands in the late Pleistocene or
early Holocene (DSE 2004a, b, 2011; Jones 1999). Throughout this manuscript the study
sites will be referred to as fragmented or unfragmented sites, with the latter further
distinguished by referring to our five sites connected through native forest as the continuous
sites.
We used harp traps to capture bats from November to April in 2008-2009 and 2009-2010
totalling 1252 trap nights. Traps were preferentially placed in areas containing tree hollows
67
and where vegetation formed a corral to funnel bats into traps, usually along tracks. All trap
locations were marked using GPS for spatial genetic analyses. To maintain sampling
consistency between sites we trapped in the central core of each site with all trapping
conducted within 1-2km to avoid the influence of capture area on genetic diversity. Only the
Otways and Grampians differed in this respect as poor trap success forced us to trap over a
wide area to obtain sufficient samples. Traps were set at dusk and checked twice, once before
midnight and again before dawn so that non-target animals could be released in darkness.
Target animals were held for daytime processing and stored in individual cotton hold bags in
a cool dark quiet location before release the following evening at the point of capture. DNA
was collected by taking two 3.5mm wing membrane biopsies, one from each wing, with a
sterile biopsy punch and the tissue was stored in an ethanol-saline solution for preservation.
Each individual was measured and sexed, with females assessed for reproductive condition
via teat and abdominal development. All bats were aged by assessing the calcification of
wing joints and categorised as either adults or juveniles (Tidemann 1993).
DNA extraction and microsatellite genotyping
Nuclear DNA was extracted from 180 biopsies using the Gentra Puregene extraction kit
(Gentra Systems Inc) with an additional 322 biopsies submitted for extraction by AGRF
(Australian Genome Research Facility, Waite Campus, Adelaide). DNA was quantified using
a Nanovue spectrophotometer (General Electric) and all concentrations were standardised to
10ng/µL. 502 N. geoffroyi individuals were screened at 9 microsatellite loci developed for
this study utilising next generation sequencing (Roche 454 sequencing) and Multiplex Ready
Technology (MRT) (Hayden et al. 2008)(see Chapter 2). PCRs were performed according to
Chapter 2 on a Corbett Palm Cycler (model CG1-96) utilising BIOMEK 3000 robots
(Beckman Coulter) to set up PCRs and to pool products post PCR into two panels. PCR
products were cleaned using a Millipore vacuum plate (Multi Screen PCR µ96 Plate) and
manifold (Multi ScreenHTS Vacuum Manifold), and diluted before being sent to AGRF for
electrophoresis and visualisation on an ABI 3730 DNA Analyser. Genotypes were scored
using GENEMAPPER v.3.5.1 (Applied Biosystems) software and tested with the program
MICROCHECKER v.2.2.3 (Van Oosterhout et al. 2004) for typing errors and the presence of
null alleles before undertaking subsequent analyses. We used GENEPOP v.3.4 (Raymond &
Rousset 1995) to test populations and loci for deviations from Hardy-Weinberg equilibrium
(HWE), heterozygosity excess and deficiency, and linkage disequilibrium (LD) with
68
sequential Bonferroni corrections made for these and all subsequent tests involving multiple
comparisons (Rice 1989). Markov chain parameters in GENEPOP were applied using the
default settings.
Genetic analyses
We employed a range of genetic analyses to examine population structure across the study
region and to compare population connectivity within continuous forest and between
fragmented populations. We calculated two measures of population differentiation, FST using
ARLEQUIN v. 3.5 (Excoffier et al. 2005) and Dest (equation 12: (Jost 2008) using the
package DEMEtics (Gerlach et al. 2010) for the program R v. 2.1.3.1 (R Development Core
Team 2011). Bayesian approaches were also utilised to identify genetic clusters across the
landscape. We implemented STRUCTURE v. 2.2 (Pritchard et al. 2000) to infer clusters
based on genotypic data alone, and GENELAND v. 3.3 (Guillot et al. 2005) to incorporate
both genotypic and spatial data (geographic coordinates of sampling locations) to calculate
the number of clusters (K). GENALEX v. 6 (Peakall & Smouse 2006) was used to perform
Mantel tests and spatial autocorrelations across the entire dataset and to compare fragmented
and continuous sites using individual pairwise geographic coordinates and genetic distance.
To further examine the underlying causes of genetic differentiation between sites we used
IBD v. 1.52 (Bohonak 2002) to carryout Mantel and partial Mantel tests at the site level based
on pairwise population FST and Dest values. This approach was employed using a third
indicator matrix in two varying ways. For our first test the indicator matrix represented the
intervening matrix type between sites represented by a ‗1‘ for agricultural land and a ‗0‘ for
continuous native forest. Secondly we used the indicator matrix to input a proposed least-
cost-path distance between each site measured as the route spanning the shortest accumulative
distance across agricultural land which we will refer to as agricultural distance. To
investigate whether dispersal is occurring across agricultural land or if it is restricted to
continuous forest we attempted to identify dispersal events by conducting first-generation
migrant detection (F0) in GENECLASS v. 2 (Piry et al. 2004).
We investigated the genetic consequences of habitat fragmentation on populations by
assessing a range of measures reflecting genetic diversity, relatedness and inbreeding, sex
ratios and bottlenecks. We calculated standard measures of genetic diversity (private alleles,
69
HO & HE) using GENALEX, and allelic richness (AR) as a standardised measure of allelic
diversity based on sample size in FSTAT v. 2.9.3 (Goudet 2001). As indicators of inbreeding
we calculated the inbreeding coefficient FIS in FSTAT and two additional measures reflecting
inbreeding using the R package Rhh (Alho et al. 2010); standardised heterozygosity (SH:
Coltman et al. 1999) and internal relatedness (IR: Amos et al. 2001). Sex ratios were also
assessed for differences between populations and between island and mainland sites.
BOTTLENECK v1.2.02 (Piry et al. 1999) was used to identify recent bottleneck events in
island sites under a two-phase-mutation model (TPM) (Di Rienzo et al. 1994). Finally,
KINGROUP v. 2 (Konovalov et al. 2004) was employed to identify parent-offspring, full
siblings, half siblings and cousins using the likelihood method of Queller & Goodnight
(1989). This allowed us to compare the frequency of relatives in fragmented and continuous
habitat.
RESULTS
Nyctophilus geoffroyi were readily caught across the study region and we generally obtained
our target number of 30+ individuals from each site within 16-24 trap nights. This contrasts
with N. gouldi which often took 80+ trap nights to reach target sample sizes. Only three sites
produced fewer than the target number; Dry Creek (n=15), Weecurra (n=23) and the Otways
(n=20). In total, trapping produced samples from 502 N. geoffroyi individuals across fourteen
sites. Numbers of N. geoffroyi at Dry Creek were atypically lower than N. gouldi, perhaps
reflecting differences in habitat suitability. Obtaining sufficient captures at the Otways
proved difficult for N. geoffroyi and N. gouldi. We speculate that a taller canopy than other
sites may have reduced the effectiveness of harp traps despite efforts to raise them into the
canopy.
MICROCHECKER identified evidence of null alleles at several populations and loci
including locus NyGo21 at the Grampians, NyGo20 and NyGo37 at Mt Napier, and NyGo25
and NyGo29 at Honans, Nangwarry and Woolsthorpe. In addition to these cases two loci
displayed consistent signs of null alleles, NyGo19 at all 14 populations and NyGo39 at 13
populations, and were subsequently removed from further analyses, reducing the number of
usable loci to seven. Following Bonferroni correction GENEPOP identified three populations
that deviated from HWE, Nangwarry (p<0.05), Honans (p<0.001) and Woolsthorpe
70
(p<0.005). At the locus level there was only a single incidence of deviation from HWE which
occurred at Honans (NyGo29, p<0.001). GENEPOP also identified loci displaying
heterozygote deficiency at Annya (NyGo21, p<0.001) and Woolsthorpe (NyGo20, p<0.05 &
NyGo29, p<0.001). The deviation of Nangwarry, Honans and Woolsthorpe from HWE
coincides with evidence from MICROCHECKER of homozygote excess and possible null
alleles at NyGo25 and NyGo29. This could be due to the cross-amplification and use of
microsatellite markers originally developed for a different species (N. gouldi). Other possible
explanations include outbreeding which could be expected in fragmented populations,
however, the presence of heterozygote deficiency suggests that null alleles, inbreeding or a
Wahlund effect are more likely explanations.
FST values were low and ranged from 0.000-0.013 while Dest values were higher ranging from
0.000-0.101 (Table 4.1). The highest FST occurred between Honans and Mt Eccles (FST =
0.0131) and the lowest between Annya and Strathdownie (FST = 0.0000). The highest Dest
occurred between Dry Creek and Framlingham (Dest = 0.101) and the lowest Dest (0.0000)
occurred between Annya and Strathdownie. Prior to Bonferroni correction there were
numerous significant cases of population differentiation. With one exception, all such cases
involved sites separated by agriculture: Mt Eccles displayed significant differentiation from
Hotspur and Strathdownie via FST and Dest. It should be noted that several small gaps of
agriculture separate Mt Eccles from the other continuous sites; these gaps collectively span
1.6km with the largest single gap spanning ~800m (see Chapter 3). Post Bonferroni
correction there were only two cases of significant differentiation; both were via FST and
indicated differentiation between Honans and two other sites, the Grampians and Mt Eccles.
To allow direct comparison with the N. gouldi dataset, these analyses were re-run using nine
common populations. This revealed that prior to Bonferroni correction N. gouldi displayed
16 cases of significant FST and nine post correction, while N. geoffroyi displayed 12 cases
prior and just two cases post. This comparison was further pronounced for Dest where N.
gouldi numbered 26 significant cases prior to Bonferroni correction and 19 post, while N.
geoffroyi tallied 10 significant cases prior and no cases post.
Bayesian clustering analyses similarly revealed less structure for N. geoffroyi than was
detected for N. gouldi. STRUCTURE identified a single cluster (K=1) across the landscape
suggesting that the population is panmictic. GENELAND identified 2 clusters (K=2), east
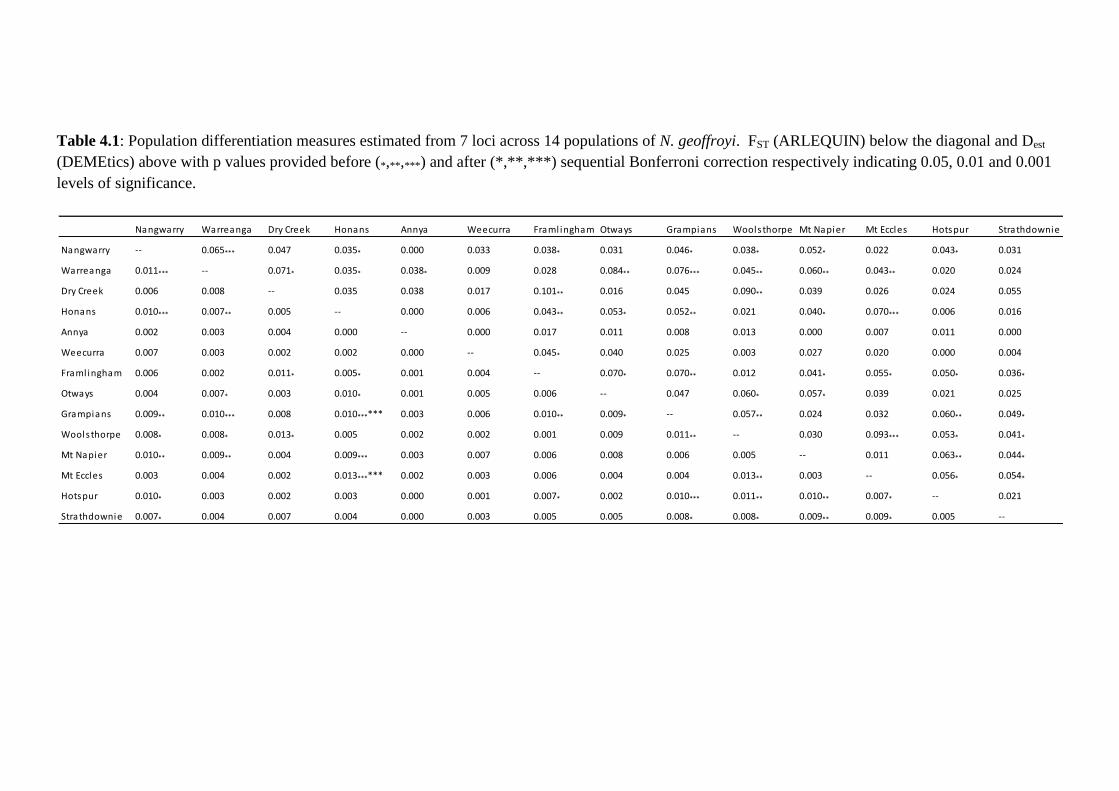
71
Table 4.1: Population differentiation measures estimated from 7 loci across 14 populations of N. geoffroyi. FST (ARLEQUIN) below the diagonal and Dest
(DEMEtics) above with p values provided before (*,**,***) and after (*,**,***) sequential Bonferroni correction respectively indicating 0.05, 0.01 and 0.001
levels of significance.
Nangwarry Warreanga Dry Creek Honans Annya Weecurra Framl ingham Otways Grampians Woolsthorpe Mt Napier Mt Eccles Hotspur Strathdownie
Nangwarry -- 0.065*** 0.047 0.035* 0.000 0.033 0.038* 0.031 0.046* 0.038* 0.052* 0.022 0.043* 0.031
Warreanga 0.011*** -- 0.071* 0.035* 0.038* 0.009 0.028 0.084** 0.076*** 0.045** 0.060** 0.043** 0.020 0.024
Dry Creek 0.006 0.008 -- 0.035 0.038 0.017 0.101** 0.016 0.045 0.090** 0.039 0.026 0.024 0.055
Honans 0.010*** 0.007** 0.005 -- 0.000 0.006 0.043** 0.053* 0.052** 0.021 0.040* 0.070*** 0.006 0.016
Annya 0.002 0.003 0.004 0.000 -- 0.000 0.017 0.011 0.008 0.013 0.000 0.007 0.011 0.000
Weecurra 0.007 0.003 0.002 0.002 0.000 -- 0.045* 0.040 0.025 0.003 0.027 0.020 0.000 0.004
Framl ingham 0.006 0.002 0.011* 0.005* 0.001 0.004 -- 0.070* 0.070** 0.012 0.041* 0.055* 0.050* 0.036*
Otways 0.004 0.007* 0.003 0.010* 0.001 0.005 0.006 -- 0.047 0.060* 0.057* 0.039 0.021 0.025
Grampians 0.009** 0.010*** 0.008 0.010****** 0.003 0.006 0.010** 0.009* -- 0.057** 0.024 0.032 0.060** 0.049*
Woolsthorpe 0.008* 0.008* 0.013* 0.005 0.002 0.002 0.001 0.009 0.011** -- 0.030 0.093*** 0.053* 0.041*
Mt Napier 0.010** 0.009** 0.004 0.009*** 0.003 0.007 0.006 0.008 0.006 0.005 -- 0.011 0.063** 0.044*
Mt Eccles 0.003 0.004 0.002 0.013****** 0.002 0.003 0.006 0.004 0.004 0.013** 0.003 -- 0.056* 0.054*
Hotspur 0.010* 0.003 0.002 0.003 0.000 0.001 0.007* 0.002 0.010*** 0.011** 0.010** 0.007* -- 0.021
Strathdownie 0.007* 0.004 0.007 0.004 0.000 0.003 0.005 0.005 0.008* 0.008* 0.009** 0.009* 0.005 --
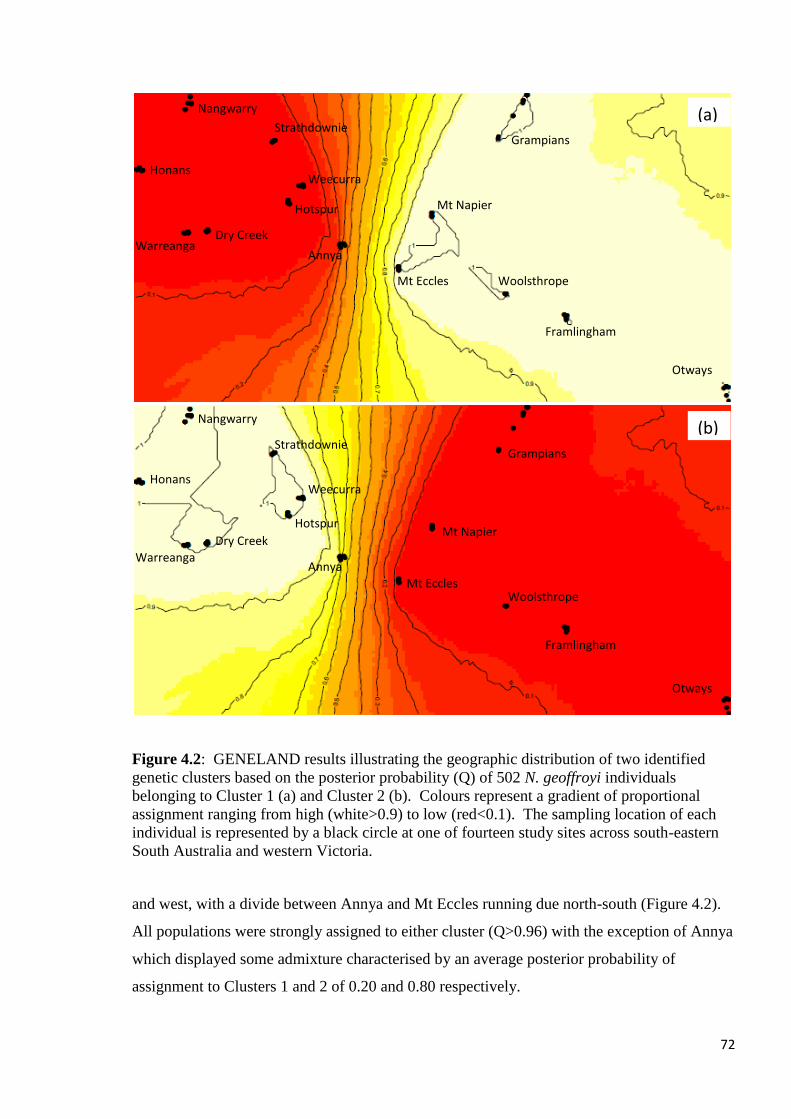
72
Figure 4.2: GENELAND results illustrating the geographic distribution of two identified
genetic clusters based on the posterior probability (Q) of 502 N. geoffroyi individuals
belonging to Cluster 1 (a) and Cluster 2 (b). Colours represent a gradient of proportional
assignment ranging from high (white>0.9) to low (red<0.1). The sampling location of each
individual is represented by a black circle at one of fourteen study sites across south-eastern
South Australia and western Victoria.
and west, with a divide between Annya and Mt Eccles running due north-south (Figure 4.2).
All populations were strongly assigned to either cluster (Q>0.96) with the exception of Annya
which displayed some admixture characterised by an average posterior probability of
assignment to Clusters 1 and 2 of 0.20 and 0.80 respectively.
Nangwarry
Honans
Dry Creek
Warreanga
Strathdownie
Weecurra
Hotspur
Annya
Mt Eccles
Mt Napier
Grampians
Woolsthrope
Framlingham
Otways
Nangwarry
Honans
Strathdownie
Weecurra
Hotspur
Dry Creek Warreanga
Annya
Grampians
Mt Napier
Mt Eccles Woolsthrope
Framlingham
Otways
(a)
(b)
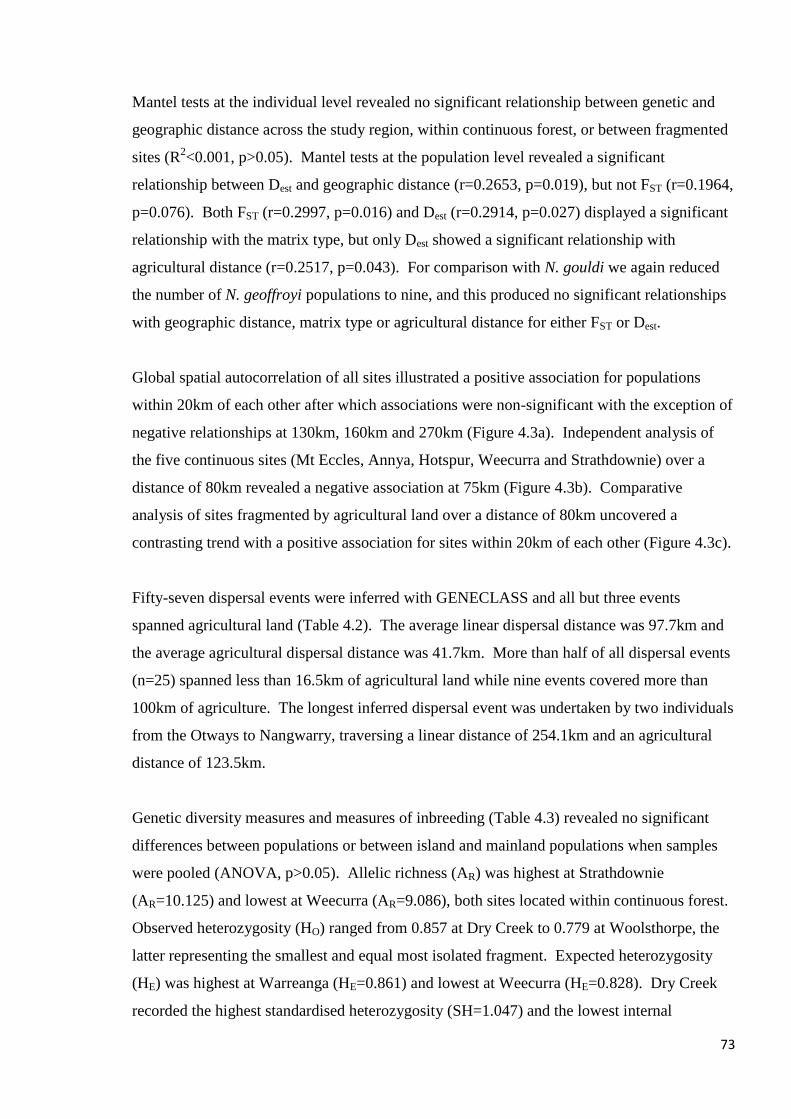
73
Mantel tests at the individual level revealed no significant relationship between genetic and
geographic distance across the study region, within continuous forest, or between fragmented
sites (R2<0.001, p>0.05). Mantel tests at the population level revealed a significant
relationship between Dest and geographic distance (r=0.2653, p=0.019), but not FST (r=0.1964,
p=0.076). Both FST (r=0.2997, p=0.016) and Dest (r=0.2914, p=0.027) displayed a significant
relationship with the matrix type, but only Dest showed a significant relationship with
agricultural distance (r=0.2517, p=0.043). For comparison with N. gouldi we again reduced
the number of N. geoffroyi populations to nine, and this produced no significant relationships
with geographic distance, matrix type or agricultural distance for either FST or Dest.
Global spatial autocorrelation of all sites illustrated a positive association for populations
within 20km of each other after which associations were non-significant with the exception of
negative relationships at 130km, 160km and 270km (Figure 4.3a). Independent analysis of
the five continuous sites (Mt Eccles, Annya, Hotspur, Weecurra and Strathdownie) over a
distance of 80km revealed a negative association at 75km (Figure 4.3b). Comparative
analysis of sites fragmented by agricultural land over a distance of 80km uncovered a
contrasting trend with a positive association for sites within 20km of each other (Figure 4.3c).
Fifty-seven dispersal events were inferred with GENECLASS and all but three events
spanned agricultural land (Table 4.2). The average linear dispersal distance was 97.7km and
the average agricultural dispersal distance was 41.7km. More than half of all dispersal events
(n=25) spanned less than 16.5km of agricultural land while nine events covered more than
100km of agriculture. The longest inferred dispersal event was undertaken by two individuals
from the Otways to Nangwarry, traversing a linear distance of 254.1km and an agricultural
distance of 123.5km.
Genetic diversity measures and measures of inbreeding (Table 4.3) revealed no significant
differences between populations or between island and mainland populations when samples
were pooled (ANOVA, p>0.05). Allelic richness (AR) was highest at Strathdownie
(AR=10.125) and lowest at Weecurra (AR=9.086), both sites located within continuous forest.
Observed heterozygosity (HO) ranged from 0.857 at Dry Creek to 0.779 at Woolsthorpe, the
latter representing the smallest and equal most isolated fragment. Expected heterozygosity
(HE) was highest at Warreanga (HE=0.861) and lowest at Weecurra (HE=0.828). Dry Creek
recorded the highest standardised heterozygosity (SH=1.047) and the lowest internal
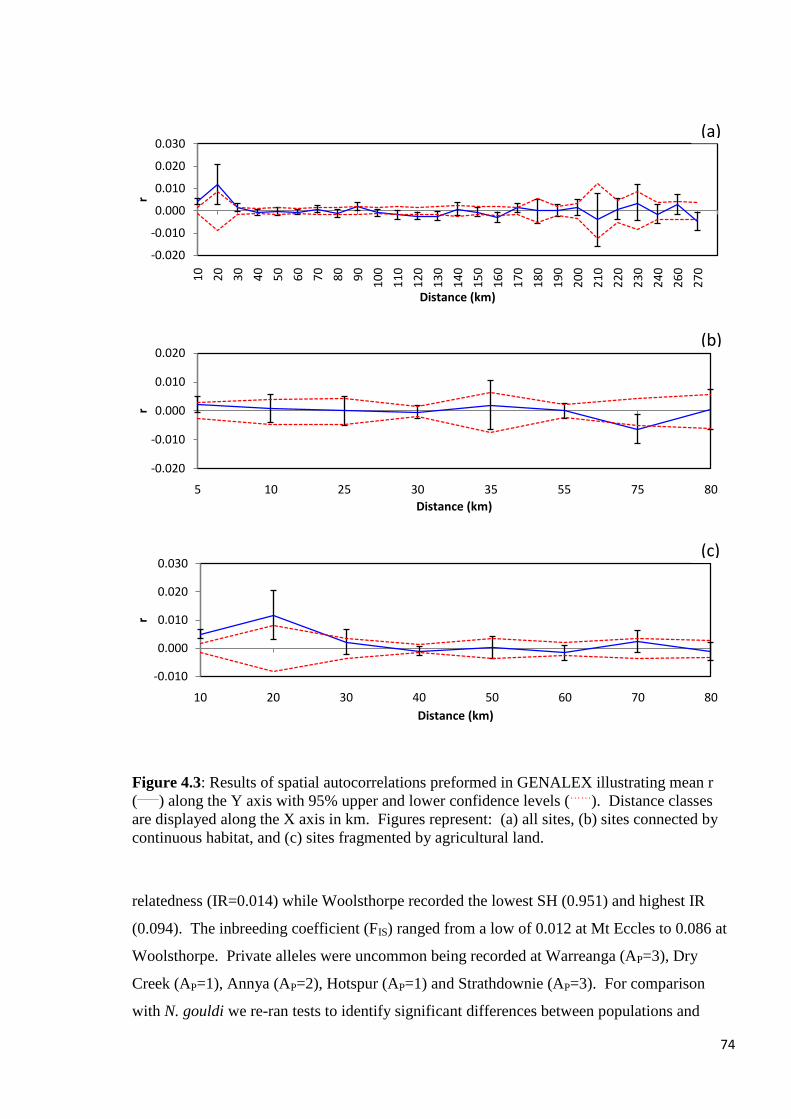
74
Figure 4.3: Results of spatial autocorrelations preformed in GENALEX illustrating mean r
(____
) along the Y axis with 95% upper and lower confidence levels (……
). Distance classes
are displayed along the X axis in km. Figures represent: (a) all sites, (b) sites connected by
continuous habitat, and (c) sites fragmented by agricultural land.
relatedness (IR=0.014) while Woolsthorpe recorded the lowest SH (0.951) and highest IR
(0.094). The inbreeding coefficient (FIS) ranged from a low of 0.012 at Mt Eccles to 0.086 at
Woolsthorpe. Private alleles were uncommon being recorded at Warreanga (AP=3), Dry
Creek (AP=1), Annya (AP=2), Hotspur (AP=1) and Strathdownie (AP=3). For comparison
with N. gouldi we re-ran tests to identify significant differences between populations and
-0.020
-0.010
0.000
0.010
0.020
0.030
10
20
30
40
50
60
70
80
90
10
0
11
0
12
0
13
0
14
0
15
0
16
0
17
0
18
0
19
0
20
0
21
0
22
0
23
0
24
0
26
0
27
0
r
Distance (km)
-0.020
-0.010
0.000
0.010
0.020
5 10 25 30 35 55 75 80
r
Distance (km)
-0.010
0.000
0.010
0.020
0.030
10 20 30 40 50 60 70 80
r
Distance (km)
(a)
(b)
(c)
75
Table 4.2: Identification of dispersal events in GENECLASS determined with a significance
level of p<0.05. The inferred source population and the population in which an individual
was trapped are displayed. Fourteen sampled populations are defined: Nan = Nangwarry,
War = Warreanga, Dry = Dry Creek, Hon = Honans, Ann = Annya, Wee = Weecurra, Otw =
Otways, Gra = Grampians, MtN = Mt Napier, MtE = Mt Eccles, Hot = Hotpur, Str =
Strathdownie.
Population Source population
Trapped Nan War Dry Hon Ann Wee Fra Otw Gra Woo MtN MtE Hot Str Total
Nan
1 1 1
2
1 1
7
War
2
1
2
1 6
Dry
1
2
3
Hon 1
2
1
4
Ann
1
2 1
4
Wee
1
1
2
Fra 1
2 1
1
1
1
7
Otw
1
1
2
Gra 1
1
1
1
1
5
Woo
1
1
1 3
MtN
1
1
1 3
MtE
1
1
1 1 4
Hot
1
1
1
3
Str
1
1
1
1
4
total 3 7 2 9 7 1 1 8 1 3 2 6 3 4 57
Table 4.3: Summary of population genetic measures and sample numbers across 14 N.
geoffroyi populations. N = number of samples, AR = allelic richness, AP = private alleles, HO
= observed heterozygosity, HE = expected heterozygosity, SH = standardised heterozygosity,
IR = internal relatedness, FIS = the inbreeding coefficient.
Population N AR AP HO HE SH IR FIS
Nangwarry 40 9.577 0 0.786 0.842 0.959 0.087 0.079
Warreanga 53 9.922 3 0.836 0.861 1.020 0.037 0.039
Dry Creek 15 9.714 1 0.857 0.842 1.047 0.014 0.016
Honans 69 9.541 0 0.810 0.839 0.988 0.056 0.042
Annya 34 10.111 2 0.845 0.853 1.031 0.021 0.025
Weecurra 23 9.086 0 0.783 0.828 0.956 0.084 0.077
Framlingham 34 9.522 0 0.836 0.845 1.021 0.031 0.026
Otways 20 10.094 0 0.829 0.857 1.012 0.050 0.059
Grampians 39 9.420 0 0.799 0.832 0.975 0.069 0.053
Woolsthorpe 33 9.114 0 0.779 0.839 0.951 0.094 0.086
Mt Napier 36 9.750 0 0.810 0.843 0.988 0.060 0.054
Mt Eccles 34 9.361 0 0.845 0.842 1.031 0.019 0.012
Hotspur 36 9.369 1 0.833 0.843 1.018 0.032 0.025
Strathdownie 36 10.125 3 0.841 0.860 1.027 0.032 0.035
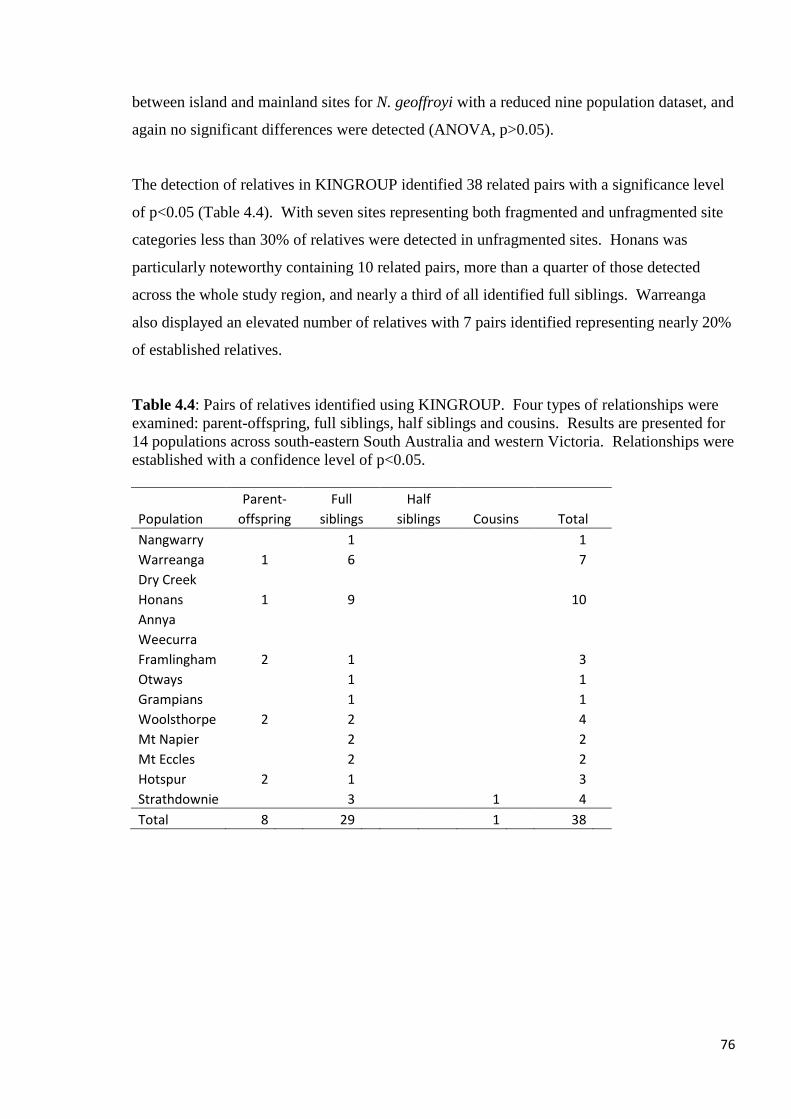
76
between island and mainland sites for N. geoffroyi with a reduced nine population dataset, and
again no significant differences were detected (ANOVA, p>0.05).
The detection of relatives in KINGROUP identified 38 related pairs with a significance level
of p<0.05 (Table 4.4). With seven sites representing both fragmented and unfragmented site
categories less than 30% of relatives were detected in unfragmented sites. Honans was
particularly noteworthy containing 10 related pairs, more than a quarter of those detected
across the whole study region, and nearly a third of all identified full siblings. Warreanga
also displayed an elevated number of relatives with 7 pairs identified representing nearly 20%
of established relatives.
Table 4.4: Pairs of relatives identified using KINGROUP. Four types of relationships were
examined: parent-offspring, full siblings, half siblings and cousins. Results are presented for
14 populations across south-eastern South Australia and western Victoria. Relationships were
established with a confidence level of p<0.05.
Parent- Full Half Population offspring siblings siblings Cousins Total
Nangwarry
1
1
Warreanga 1
6
7 Dry Creek
Honans 1
9
10 Annya
Weecurra
Framlingham 2
1
3
Otways
1
1 Grampians
1
1
Woolsthorpe 2
2
4 Mt Napier
2
2
Mt Eccles
2
2
Hotspur 2
1
3 Strathdownie
3
1
4
Total 8 29 1 38
77
DISCUSSION
The impact of habitat fragmentation on N. geoffroyi
As predicted N. geoffroyi displayed little response to habitat fragmentation. However there
were several analyses that produced results indicating some degree of population structuring
across the study. For example, GENELAND identified an east and west cluster which may
indicate a geographic cline in allele frequencies across the study region. This result differed
from STRUCTURE which identified a single cluster suggesting that the population is
panmictic. Importantly, the clusters in GENELAND did not reflect the configuration of forest
due to habitat fragmentation suggesting that the presence of agricultural land is unlikely to be
the factor driving population differentiation. Spatial autocorrelation of fragmented sites did
reveal a positive neighbourhood effect within a radius of 20km, a trend not detected within
the continuous forest. This finding suggests a barrier effect where individuals may be
influenced to display more philopatric behaviour than those within continuous forest simply
due to the imposition of a barrier formed by agricultural land. However, this positive
neighbourhood effect was not coupled with a negative association with distal sites indicating
that N. geoffroyi is able to successfully disperse to distant populations. The identification of
dispersal events supports this ability as the average agricultural distance traversed by
dispersing individuals was over 40km and nine events spanned more than 100km of
agriculture. Despite this support, putative dispersal events should be treated with caution as
population differentiation between sites was low (Berry et al. 2004).
N. geoffroyi displayed few significant cases of pairwise population differentiation with only
two FST values retaining significance following Bonferroni correction. Although these two
cases occurred between sites separated by agriculture they did not represent the most isolated
or distal populations and there was no consistent pattern of population differentiation between
fragmented sites. We did however detect significant correlations between N. geoffroyi
population differentiation (FST and Dest) and the presence of agricultural land, and between
Dest and the agricultural distance between sites. These findings were determined with the
complete N. geoffroyi 14 population dataset while the reduced nine population dataset, used
for direct comparison with the N. gouldi dataset, revealed no such correlations.
78
Comparing the influence of habitat fragmentation on N. geoffroyi and N. gouldi
As we hypothesised N. geoffroyi did indeed contrast N. gouldi in its response to habitat
fragmentation displaying little impact from the fragmentation of habitat across our study
region. The difference between the two species is perhaps best illustrated by the example
given above regarding the correlation between population differentiation and the presence of
agricultural land. While this assessment did reveal a significant correlation for both N.
geoffroyi and N. gouldi, significance for N. geoffroyi was only produced with the larger 14
population dataset. This dataset included the addition of three highly isolated sites (Mt
Napier, Framlingham and Woolsthorpe), which were not represented in N. gouldi. The
reduced nine population N. geoffroyi dataset, used for comparison with N. gouldi, revealed no
significant correlation. This difference suggests that while habitat fragmentation may
increase population differentiation between N. geoffroyi populations, the effect is not of the
same magnitude as that detected for N. gouldi.
In our companion paper (Chapter 3) we documented multiple lines of evidence to consistently
indicate that agricultural land acts as a barrier to N. gouldi gene flow. This evidence included
significant population differentiation between all sites separated by agriculture (prior to
Bonferroni correction), contrasting spatial autocorrelations between continuous and
fragmented sites, and the identification of reduced genetic diversity, skewed sex ratios,
increased relatedness and evidence of inbreeding within fragmented populations. In stark
contrast N. geoffroyi appears more resilient to habitat fragmentation with only two cases of
significant population differentiation and no evidence of reduced genetic diversity, elevated
relatedness or altered demography as a consequence of isolation. N. gouldi dispersal events
proposed by GENECLASS also contrasted with N. geoffroyi. The average agricultural
dispersal distance for N. gouldi was 24km, almost half that proposed for N. geoffroyi.
Furthermore this result was heavily influenced by two suspected outliers (see Chapter 3)
which, when removed, reduced the average N. gouldi agricultural dispersal distance to just
9km.
While we proposed a dispersal threshold of ≤27km across agriculture for N. gouldi and found
evidence of maintained gene flow across agricultural distances <2km (Chapter 3), we did not
find any evidence of a threshold for N. geoffroyi population connectivity. This case is well
illustrated by our identification of a unique N. gouldi management unit (Moritz 1994) for the
79
Grampians (see Chapter 3), despite the fact that the Grampians are less than 35km away from
neighbouring forest. We explored this issue in Chapter 3 where we considered the possibility
that N. gouldi in the Grampians had been naturally isolated from the rest of the study region
by the emergence of grassland during the late Pleistocene or early Holocene. However,
contrasting N. gouldi, N. geoffroyi displayed no genetic differentiation between the
Grampians and populations to the south indicating that this population has remained
connected to the rest of the study region. Similarly, N. geoffroyi populations have persisted at
the three most isolated habitat patches in Victoria (Mt Napier, Framlingham and
Woolsthorpe) where N. gouldi was in low densities or missing altogether. Nyctophilus
geoffroyi‘s presence at these three sites suggests either: a direct capacity to cope with high
degrees of isolation; the ability to readily supplement sink populations or recolonise sites after
localised extinctions, or; that agricultural land represents a continuation of the species habitat
as opposed to an intervening matrix. It should also be noted that larger N. geoffroyi
population sizes, indicated by trapping, would result in slower rates of genetic drift and thus
lower levels of population differentiation than N. gouldi. Consequently we cannot exclude
the possibility that N. geoffroyi populations may still be affected by habitat fragmentation, but
that the impacts may take longer to manifest than for N. gouldi.
Why do the two species respond differently to habitat fragmentation?
Coupled with information on N. geoffroyi and N. gouldi distributions and occurrence in
agricultural land, our results suggest that differences in habitat specialisation and tolerance to
the matrix may explain the different responses to habitat fragmentation between the two
species. For example, N. geoffroyi displays an extensive geographic range spanning diverse
ecosystems from desert to tropical rainforest, while N. gouldi is restricted to native forest and
woodland (Churchill 2008; Ellis et al. 1989; Hall & Richards 1979). The ecological
flexibility of N. geoffroyi potentially bestows a greater capacity to exploit modified or
disturbed landscapes. Differences in the use of agricultural land between the two species
have also been reported. Lumsden & Bennett (2005) found that N. geoffroyi persisted in
agricultural land almost devoid of trees (<1 tree per ha), while N. gouldi was only recorded
twice in the agricultural study area, and both cases were confined to densely treed paddocks
(10-34 trees per ha). In addition, N. geoffroyi has been reported commuting, foraging and
roosting within agricultural land, proving the species capacity to occupy and utilise the
agricultural matrix (Churchill 2008; Lumsden et al. 2002a). Collectively these examples
80
support the notion that N. geoffroyi is a habitat generalist contrasting with N. gouldi which is a
forest and woodland specialist.
Differences in mobility between N. geoffroyi and N. gouldi could also explain their
differential responses to habitat fragmentation. Although the two species possess near-
identical wing morphology, this trait may not necessarily be able to discern between certain
flight capabilities (Jones et al. 2003; Meyer et al. 2008; Safi & Kerth 2004), and there is
limited evidence to suggest there are differences in vagility between N. geoffroyi and N.
gouldi. For example, Lunney (1988) employed radio tracking and found that N. gouldi
confined all of their activity within 2km of their roosts, whereas Lumsden et al. (2002a)
reported that radio tracked N. geoffroyi regularly traversed up to 12km of agricultural land on
daily foraging expeditions. Lumsden et al. (2002a) also observed N. geoffroyi employing two
modes of flight, one slow manoeuvrable mode when foraging and another faster more direct
mode of flight when commuting, which has not been reported for N. gouldi. This capacity
alone, if not shared by N. gouldi, could potentially explain the differences in population
connectivity we have recorded.
Roosting behaviour is a key aspect of chiropteran ecology and requires consideration as a
possible factor behind the two species differing responses to habitat fragmentation.
Differences in the characteristics of roost trees between the two species have been
documented. Lunney (1988) found that N. gouldi forest roosts were restricted to riparian
zones and occurred within large (DBH >80cm) mature hollow bearing trees. N. geoffroyi
displays a preference for dead hollow bearing trees, both small and large, and is known to
roost within agricultural land (Churchill 2008; Lumsden et al. 2002a). Differences in the
availability of the two species preferred roost trees within the matrix, and abiotic conditions at
potential roost trees (eg. exposure, temperature and humidity), could influence their capacity
to utilise modified agricultural landscapes. Both species have also been recorded roosting in
manmade structures such as buildings, fence posts and other opportunistic locations
(Churchill 2008; Ellis et al. 1989; Hall & Richards 1979). However, despite both species
capacity to exploit opportunistic roosting locations, it is possible that they differ in their
willingness to do so. For example, we sampled three roosts in farm buildings in south-eastern
South Australia (Chapter 5) and captured a total of 157 N. geoffroyi compared to just one N.
gouldi.
81
Finally, the different responses to habitat fragmentation between N. geoffroyi and N. gouldi
may come down to more cryptic differences in behaviour that are more difficult to assess. N.
gouldi may simply display an avoidance of open spaces for evolutionary reasons such as
predator avoidance. Laurance et al. (2002) suggested that understorey species may lack
historic evolutionary exposure to open spaces resulting in innate behaviour to avoid exposed
areas. Similarly, Greenberg (1989) proposed that selection for reduced exploratory behaviour
away from preferred habitat could explain species avoidance of open or novel areas.
However, for these behavioural explanations we can only speculate.
Insights into chiropteran responses to habitat fragmentation
Although wing morphology has received support as an indicator of chiropteran sensitivity to
habitat fragmentation (Albrecht et al. 2007; Meyer et al. 2008), it did not predict the
contrasting responses of N. geoffroyi and N. gouldi which possess near-identical wing
morphology. Wing morphology may still have merit as a predictor of chiropteran responses
to habitat fragmentation, but its influence may not be as great as other factors such as habitat
specialisation and tolerance to the matrix which may supersede its effects. Safi & Kerth
(2004) acknowledged that although wing morphology does, on average, correlate with higher
extinction risk ‗exceptions exist on the level of single species‘. Safi & Kerth (2004) also
acknowledged that wing morphology alone cannot explain differences between species
foraging behaviour or habitat adaptations, both representing factors that could influence
chiropteran responses to habitat fragmentation. Our study provides direct evidence that wing
morphology alone cannot predict the response of chiropterans to habitat fragmentation. The
assessment of wing morphology may still be useful as a first step in identifying chiropterans
sensitive to habitat fragmentation. However, this should be followed by consideration of
habitat specialisation (geographic range and critical resources), and tolerance to the matrix
(presence in the matrix), in order to make more robust predictions about chiropteran species at
risk to habitat fragmentation.
As a final note we wish to raise an important issue of scale regarding the study of bats and
habitat fragmentation which we do not believe has been addressed within the literature.
Virtually all of the studies we have examined regarding chiropteran responses to habitat
fragmentation have assessed landscapes where fragments are separated by <2km of modified
or cleared habitat (Bernard & Fenton 2003, 2007; Cosson et al. 1999; Estrada & Coates-
82
Estrada 2002; Estrada et al. 1993; Faria 2006; Galindo-Gonzalez & Sosa 2003; Gorresen &
Willig 2004; Johansson & Jong 1996; Klingbeil & Willig 2009; Law et al. 1999; Meyer et al.
2008; Meyer et al. 2009; Schulze et al. 2000; Struebig et al. 2008). The few exceptions
include Struebig et al. (2011) who included several sites isolated by 3-5km, and Montiel et al.
(2006) who included two sites categorised as ‗far‘ which were located 10.2km and 11.5km
from the nearest forest. In our companion paper focussing on the response of N. gouldi to
habitat fragmentation (Chapter 3) we proposed a dispersal threshold across agriculture of
≤27km, a result that would not have been detected at the scale adopted by any of the above
studies.
Other landscape genetic studies assessing barriers to bat dispersal have identified distance
thresholds of a similar magnitude to that proposed for N. gouldi. Castella et al. (2000) found
that the 14km wide Gibraltar Strait represents a significant barrier to Myotis myotis between
populations in Europe and North Africa. Similarly, Salgueiro et al. (2008) found that
Nyctalus azoreum was restricted by more than 40km of open water between islands in the
Azores. Furthermore, we found evidence to suggest that N. gouldi gene flow was maintained
between habitat separated by <2km of agriculture. Collectively these findings indicate that
the identification of barriers to bat population connectivity and distance thresholds for
dispersal will require a scale that considers 10s of kilometres rather than several kilometres.
Microgeographic studies provide valuable insights into the effects of habitat fragmentation at
a fine scale, but ultimately they may prove misleading in definitively determining species
vulnerability to habitat fragmentation. We propose that studies investigating the impacts of
habitat fragmentation on chiropteran population connectivity, or changes to community
composition, will benefit from adopting a larger scale more appropriate for this highly vagile
group of mammals. If we are to effectively manage species at a landscape or regional level
we believe it is more constructive to assess scales that inform our capacity to do so, and that
means considering larger distances that often characterise distances between significant
conservation areas. In addition to habitat fragmentation per se this information may prove
increasingly valuable as pressure from climate change increases our need to manage regional
connectivity to facilitate range shifts in response to drifting environmental conditions
(Hannah et al. 2002; Opdam & Wascher 2004).
83
Chapter 5
Dispersal strategies, mating systems and social structure in two
species of long-eared bats, Nyctophilus geoffroyi and N. gouldi
Nicholas C. Fuller1, Susan M. Carthew
1,2 and Steven J.B. Cooper
1,3
1 School of Earth & Environmental Sciences, The University of Adelaide
2 Research Institute for Environment and Livelihoods, Charles Darwin University
3 Evolutionary Biology Unit, South Australian Museum
ABSTRACT
Chiroptera is a mega-diverse order with species providing a range of essential ecosystem
services such as plant pollination and the regulation of insect populations. However, despite
their importance we know little about the life history of many bat species particularly in
regards to social structure, mating systems and dispersal. To address this knowledge gap we
utilised 16 microsatellite markers to investigate dispersal strategies and social structure in two
species of long-eared bats, Nyctophilus geoffroyi and N. gouldi. We sampled 502 N. geoffroyi
and 265 N. gouldi across 14 sites in south-eastern Australia, and 157 N. geoffroyi in three
roosts in farm buildings. We provide evidence of male biased dispersal, female philopatry
and polygynous mating in N. gouldi, but detected no such patterns for N. geoffroyi. Analysis
of social structure at the population level revealed that nearly twice as many N. gouldi
(26.5%) possessed a relative as N. geoffroyi (13.9%), although this figure was higher for N.
geoffroyi roosts (43.9%). Populations of both species, and N. geoffroyi roosts, contained
significantly more female relatives than males or mixed-sex relatives. We hypothesise that
matrilineal social groups may play a significant role in the social structure and behaviour of
both species. Despite the high proportion of individuals with relatives within N. geoffroyi
roosts, the vast majority of pairwise comparisons indicated no relationship between roosting
individuals. This finding suggests that reciprocal altruism, not kin selection, is the principal
mechanism behind cooperative roosting behaviour for N. geoffroyi.
84
INTRODUCTION
Chiroptera is a mega-diverse order that represents approximately 20% of mammalian
diversity and plays key roles in ecosystem function including the regulation of insect
populations and the propagation of plant communities via pollination and seed dispersal
(Kunz et al. 2011). Despite these facts we have limited knowledge regarding the ecology of
many chiropterans, particularly cryptic aspects of ecology such as dispersal strategies, social
structure and mating systems (Burland & Worthington Wilmer 2001; Kerth 2008). Bats show
a propensity to form social groups and, like the majority of mammals, they are typically
polygynous (Clutton-Brock 1989; McCracken & Wilkinson 2000). Chiroptera also contains a
great diversity of social structures, dispersal patterns and mating systems providing a novel
window into how these mechanisms evolve in mammals (Kunz et al. 2011). It is perhaps
surprising then that, in comparison to other social mammals like primates, ungulates and
rodents, chiropterans are highly underrepresented in terms of study into behavioural ecology
(Kerth 2008).
In the past this lack of chiropteran research has been largely due to the cryptic nature of bats
which make them difficult to study with traditional field based techniques (Burland &
Worthington Wilmer 2001; Kerth et al. 2002b). However, modern molecular techniques have
made these previously elusive aspects of bat ecology accessible for study and as a result the
number of such studies is increasing (Burland & Worthington Wilmer 2001; Kerth et al.
2002b). Despite this progress we have only begun to understand chiropteran sociobiology, a
point illustrated by our knowledge of mating systems which had only been determined for
6.9% of >1000 species by the year 2000 (McCracken & Wilkinson 2000). Nevertheless,
genetic research over the last two decades has begun to reveal a diverse range of dispersal
strategies and social structures within Chiroptera. These include the typical mammalian male
biased dispersal and female philopatry (Arnold 2007; Kerth et al. 2002a; Petit & Mayer 1999;
Weyandt et al. 2005; Worthington Wilmer et al. 1999), natal philopatry in both sexes
(Burland et al. 1999), dispersal in both sexes (Dechmann et al. 2007), and colonies with
varying degrees of relatedness (Furmankiewicz & Altringham 2007; Heckel et al. 1999; Kerth
et al. 2000; Metheny et al. 2008; Ortega et al. 2003; Petri et al. 1997; Rivers et al. 2005;
Rossiter et al. 2002; Storz et al. 2001; Veith et al. 2004; Wilkinson 1992a) and differing
compositions of relatives (Bryja et al. 2009; Burland et al. 2001; Kerth et al. 2002b). Genetic
investigations have also provided probing insights into a range of chiropteran mating systems
85
from swarming sites to harem structures and mating success (Burland et al. 2001; Chaverri et
al. 2008; Heckel et al. 1999; Ortega et al. 2003; Rossiter et al. 2000; Veith et al. 2004).
In this paper we employ a combination of molecular techniques to investigate philopatry,
dispersal patterns and mating systems in two endemic Australian species of Nyctophilus
(Vespertilionidae), N. gouldi and N. geoffroyi. We also assess social structure at the
population level in both species, and at the roost level for N. geoffroyi, by calculating
measures of relatedness and identifying putative relatives. The two species appear to differ in
ecological plasticity as N. gouldi displays a distribution limited to forest and woodland in
eastern and south-western Australia, apparently specialising in such habitat, while N.
geoffroyi is a habitat generalist with a continent-wide distribution spanning a diverse range of
ecosystems (Churchill 2008). Both species are small insectivores that roost in tree cavities,
however, they are also known to form colonies in manmade structures (Reardon & Flavel
1987). N. geoffroyi sexes are reported to roost separately throughout most of the year either
alone or in small groups, however, maternity colonies of up to 30 females are known to occur
often accompanied by a single male (Churchill 2008; Lumsden et al. 2002a; Lumsden et al.
2002b; Reardon & Flavel 1987). Mixed-sex colonies of up to 200 individuals have been
reported in buildings elsewhere (Reardon & Flavel 1987) and it is possible that these artificial
spaces facilitate year-round co-roosting behaviour between the sexes. N. gouldi females are
reported to form colonies of 20 or more individuals while males generally roost alone or in
small groups comprising fewer than six individuals (Churchill 2008).
Little is known about the mating systems of N. gouldi or N. geoffroyi. More than 90% of
mammals display some form of polygynous mating system, and the majority of assessed bat
species conform to this trend (McCracken & Wilkinson 2000). Both species mate in autumn
and females store sperm until spring when ovulation and fertilisation take place (Churchill
2008; Hosken 1997). Male N. gouldi have also been reported to mate sporadically throughout
winter with torpid females (Churchill 2008). This behaviour has been recorded in another
Australian vespertilionid, Vespadelus vulturnus (Tidemann 1993), and is likely to occur in N.
geoffroyi. Hosken (1998) conducted consecutive isolation experiments with opposite sex
pairs of N. geoffroyi and found that both sexes mated with multiple individuals. Females
stored viable sperm for up to 93 days which, coupled with the formation of copulatory plugs
by males, provided strong evidence of sperm competition (Hosken 1998). Hosken (1998)
86
also assessed paternity using electrophoresis of blood enzymes, and although all females
mated with two males, all offspring were sired by the same male.
Evidence of multiple matings in captivity, and reproductive biology conducive to sperm
competition, is strong evidence of polygynous and polyandrous behaviour in wild populations
of N. geoffroyi. However it is unclear whether the species forms single-male multiple-female
groups for breeding or multiple-male multiple-female groups (McCracken & Wilkinson
2000). As discussed above, Churchill (2008) states that N. geoffroyi maternity colonies are
often accompanied by a single male suggesting single-male multiple-female group
formations. However, Reardon and Flavel (1987) reported a large mixed-sex colony of N.
geoffroyi supporting the occurrence of multiple-male multiple-female congregations. It is
possible that the composition of colonies in manmade structures is not representative of
typical behaviour. Consequently, in the case of polyandry, it is not clear whether males
‗invade‘ single-male multiple-female colonies to mate with females, or whether polyandry
occurs freely within mixed sexed colonies. Both species also give birth to twins, although the
twinning rate is believed to be higher for N. geoffroyi (Churchill 2008). This raises the
possibility of multiple paternity. Only one N. geoffroyi female gave birth to twins in the
captive study by Hosken (1998), and as stated above, all offspring were fathered by the same
individual. Consequently, the question of multiple paternity remains unanswered.
We aim to test the hypothesis that N. gouldi and N. geoffroyi display female natal philopatry
and male biased dispersal. Male biased dispersal is highly correlated with a polygynous
mating system and would provide further support for polygyny in wild populations (Dobson
1982). Evidence of polygyny, and polyandry, may be provided by the identification of half
siblings indicating males and/or females had mated with different individuals over multiple
seasons. Similarly, the identification of juvenile half siblings born in the same season would
provide evidence of multiple paternity, provided the half siblings share the same mother.
Given the relatedness of the two species we expect them to display similar dispersal patterns
and social structure. Female philopatry should result in higher numbers of female relatives
within populations than males. Consequently we expect to find more female relatives at the
population level than male relatives, or female-male relatives, and we expect this trend will be
more pronounced at the roost level for N. geoffroyi. The hypothesis further predicts that
female relatives will comprise a significant component of social structure at the population
level for both species, and at the roost level for N. geoffroyi. High numbers of relatives at the
87
roost level for N. geoffroyi will provide an insight into the role of kin selection and reciprocal
altruism in cooperative roosting. In particular, high numbers of female relatives at the roost
level may suggest that female relatives play an important role in group formation and social
behaviour.
METHODS
Fieldwork was conducted at 14 sites across western Victoria and south-eastern South
Australia comprising a mixture of expansive forest regions and smaller fragmented patches of
remnant vegetation (Figure 5.1). Further details regarding these sites are provided in Chapter
3. No N. gouldi were caught at the small (60ha) and highly isolated Woolsthorpe fragment,
with low numbers obtained at four other locations; Warreanga (n=3), Weecurra (n=3), Mt
Napier (n=2) and Framlingham (n=1). N. gouldi was captured in higher numbers (n=14-66)
at the remaining nine sites and N. geoffroyi was readily caught at all 14 locations (n=15-69).
In addition to these sites, three roosting groups of N. geoffroyi were sampled in farm buildings
south of Mt Gambier in South Australia. Two of the roosts were located within wall and roof
cavities of two separate houses (Telford House and Feast House), while the third was located
within a shearing shed adjacent to one of the houses (Telford Shed) (Figure 5.1).
Eight harp traps were used to capture the target species over two field seasons from
November to April 2008-2009 and 2009-2010, totalling 1252 trap nights. The three roost
sites were sampled over two days in March 2009. We set up netting around emergence points
to funnel bats into harp traps and as a consequence we likely sampled most individuals within
each roost. Genetic samples were obtained by taking a 3.5mm biopsy from the wing
membrane. Further details regarding field methods are provided in Chapter 3. Sixteen
microsatellite markers developed for the study (see Chapter 2) were used to genotype 265 N.
gouldi at 15 loci and 659 N. geoffroyi at 9 loci, the latter including 157 individuals from the
three sampled roosts. PCR products were sent to AGRF for electrophoresis and visualisation
on an ABI 3730 DNA Analyser (Applied biosystems) with further laboratory methods
provided in Chapters 2 and 3. Genotypes were scored using GENEMAPPER v.3.5.1
(Applied Biosystems) and MICROCHECKER v.2.2.3 (Van Oosterhout et al. 2004) was used
to check data for scoring errors and the presence of null alleles. We used GENEPOP v.3.4
(Raymond & Rousset 1995)
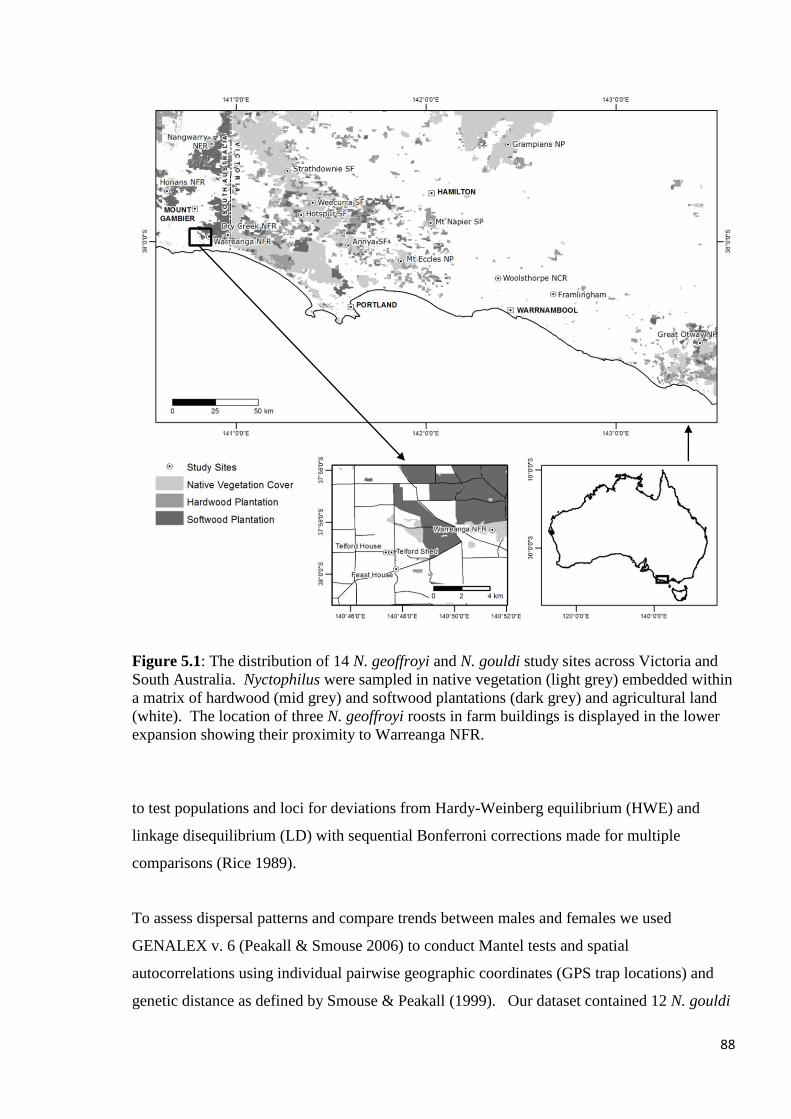
88
Figure 5.1: The distribution of 14 N. geoffroyi and N. gouldi study sites across Victoria and
South Australia. Nyctophilus were sampled in native vegetation (light grey) embedded within
a matrix of hardwood (mid grey) and softwood plantations (dark grey) and agricultural land
(white). The location of three N. geoffroyi roosts in farm buildings is displayed in the lower
expansion showing their proximity to Warreanga NFR.
to test populations and loci for deviations from Hardy-Weinberg equilibrium (HWE) and
linkage disequilibrium (LD) with sequential Bonferroni corrections made for multiple
comparisons (Rice 1989).
To assess dispersal patterns and compare trends between males and females we used
GENALEX v. 6 (Peakall & Smouse 2006) to conduct Mantel tests and spatial
autocorrelations using individual pairwise geographic coordinates (GPS trap locations) and
genetic distance as defined by Smouse & Peakall (1999). Our dataset contained 12 N. gouldi
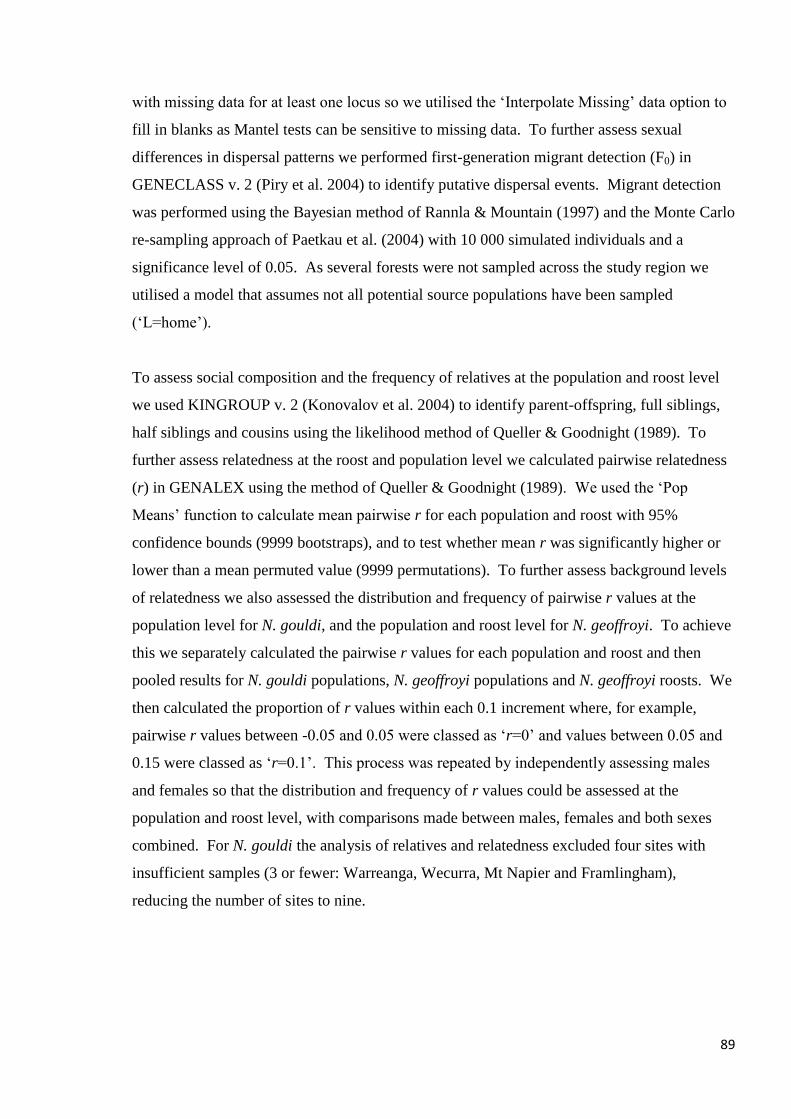
89
with missing data for at least one locus so we utilised the ‗Interpolate Missing‘ data option to
fill in blanks as Mantel tests can be sensitive to missing data. To further assess sexual
differences in dispersal patterns we performed first-generation migrant detection (F0) in
GENECLASS v. 2 (Piry et al. 2004) to identify putative dispersal events. Migrant detection
was performed using the Bayesian method of Rannla & Mountain (1997) and the Monte Carlo
re-sampling approach of Paetkau et al. (2004) with 10 000 simulated individuals and a
significance level of 0.05. As several forests were not sampled across the study region we
utilised a model that assumes not all potential source populations have been sampled
(‗L=home‘).
To assess social composition and the frequency of relatives at the population and roost level
we used KINGROUP v. 2 (Konovalov et al. 2004) to identify parent-offspring, full siblings,
half siblings and cousins using the likelihood method of Queller & Goodnight (1989). To
further assess relatedness at the roost and population level we calculated pairwise relatedness
(r) in GENALEX using the method of Queller & Goodnight (1989). We used the ‗Pop
Means‘ function to calculate mean pairwise r for each population and roost with 95%
confidence bounds (9999 bootstraps), and to test whether mean r was significantly higher or
lower than a mean permuted value (9999 permutations). To further assess background levels
of relatedness we also assessed the distribution and frequency of pairwise r values at the
population level for N. gouldi, and the population and roost level for N. geoffroyi. To achieve
this we separately calculated the pairwise r values for each population and roost and then
pooled results for N. gouldi populations, N. geoffroyi populations and N. geoffroyi roosts. We
then calculated the proportion of r values within each 0.1 increment where, for example,
pairwise r values between -0.05 and 0.05 were classed as ‗r=0‘ and values between 0.05 and
0.15 were classed as ‗r=0.1‘. This process was repeated by independently assessing males
and females so that the distribution and frequency of r values could be assessed at the
population and roost level, with comparisons made between males, females and both sexes
combined. For N. gouldi the analysis of relatives and relatedness excluded four sites with
insufficient samples (3 or fewer: Warreanga, Wecurra, Mt Napier and Framlingham),
reducing the number of sites to nine.
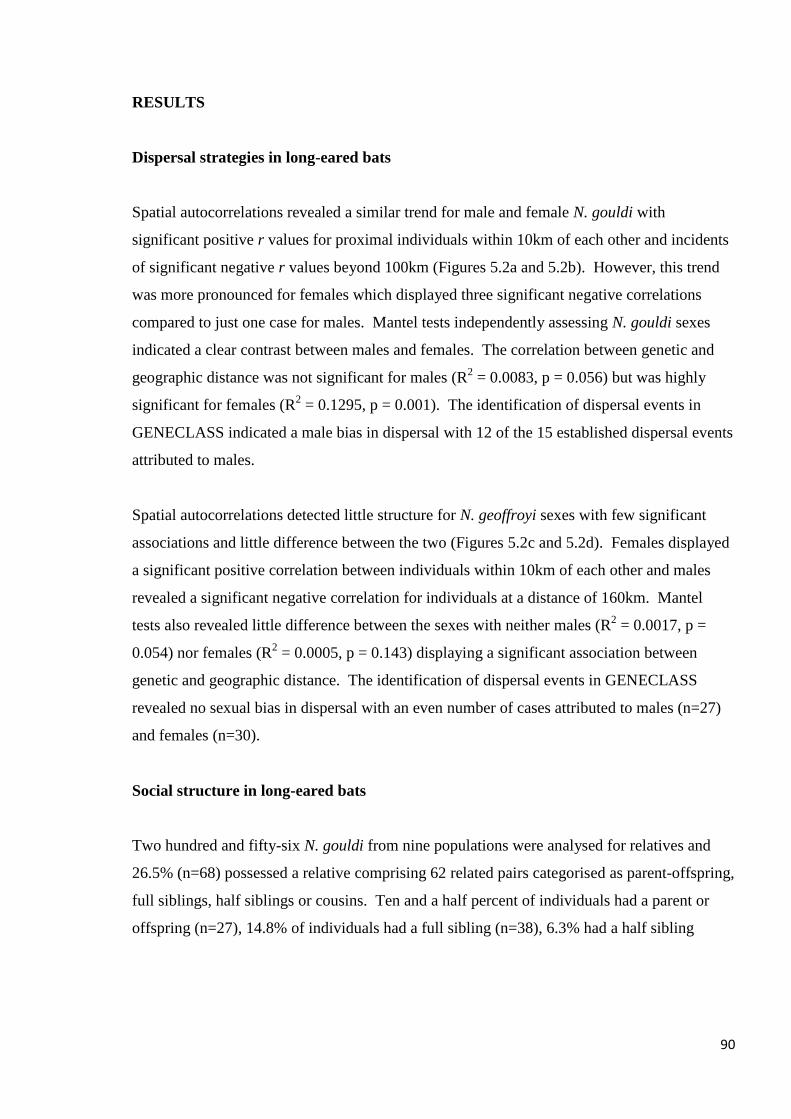
90
RESULTS
Dispersal strategies in long-eared bats
Spatial autocorrelations revealed a similar trend for male and female N. gouldi with
significant positive r values for proximal individuals within 10km of each other and incidents
of significant negative r values beyond 100km (Figures 5.2a and 5.2b). However, this trend
was more pronounced for females which displayed three significant negative correlations
compared to just one case for males. Mantel tests independently assessing N. gouldi sexes
indicated a clear contrast between males and females. The correlation between genetic and
geographic distance was not significant for males (R2 = 0.0083, p = 0.056) but was highly
significant for females (R2 = 0.1295, p = 0.001). The identification of dispersal events in
GENECLASS indicated a male bias in dispersal with 12 of the 15 established dispersal events
attributed to males.
Spatial autocorrelations detected little structure for N. geoffroyi sexes with few significant
associations and little difference between the two (Figures 5.2c and 5.2d). Females displayed
a significant positive correlation between individuals within 10km of each other and males
revealed a significant negative correlation for individuals at a distance of 160km. Mantel
tests also revealed little difference between the sexes with neither males (R2 = 0.0017, p =
0.054) nor females (R2 = 0.0005, p = 0.143) displaying a significant association between
genetic and geographic distance. The identification of dispersal events in GENECLASS
revealed no sexual bias in dispersal with an even number of cases attributed to males (n=27)
and females (n=30).
Social structure in long-eared bats
Two hundred and fifty-six N. gouldi from nine populations were analysed for relatives and
26.5% (n=68) possessed a relative comprising 62 related pairs categorised as parent-offspring,
full siblings, half siblings or cousins. Ten and a half percent of individuals had a parent or
offspring (n=27), 14.8% of individuals had a full sibling (n=38), 6.3% had a half sibling
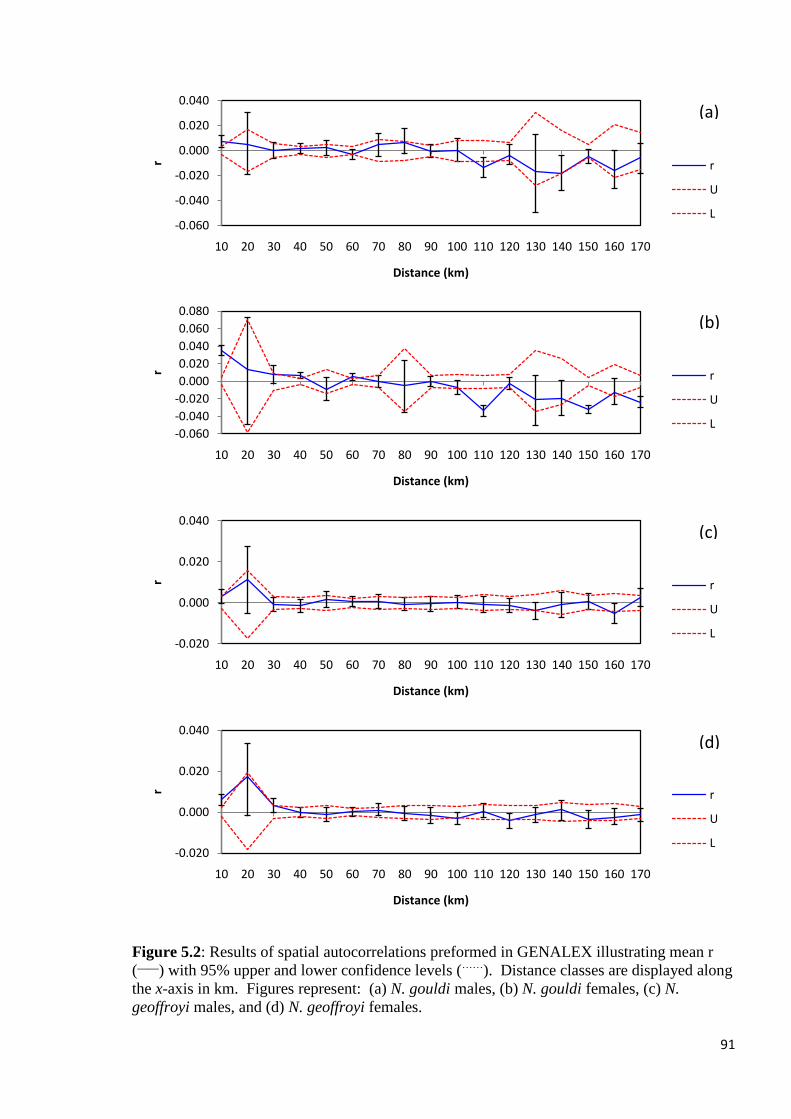
91
Figure 5.2: Results of spatial autocorrelations preformed in GENALEX illustrating mean r
(____
) with 95% upper and lower confidence levels (……
). Distance classes are displayed along
the x-axis in km. Figures represent: (a) N. gouldi males, (b) N. gouldi females, (c) N.
geoffroyi males, and (d) N. geoffroyi females.
-0.060
-0.040
-0.020
0.000
0.020
0.040
10 20 30 40 50 60 70 80 90 100 110 120 130 140 150 160 170
r
Distance (km)
r
U
L
-0.060
-0.040
-0.020
0.000
0.020
0.040
0.060
0.080
10 20 30 40 50 60 70 80 90 100 110 120 130 140 150 160 170
r
Distance (km)
r
U
L
-0.020
0.000
0.020
0.040
10 20 30 40 50 60 70 80 90 100 110 120 130 140 150 160 170
r
Distance (km)
r
U
L
-0.020
0.000
0.020
0.040
10 20 30 40 50 60 70 80 90 100 110 120 130 140 150 160 170
r
Distance (km)
r
U
L
(a)
(b)
(c)
(d)
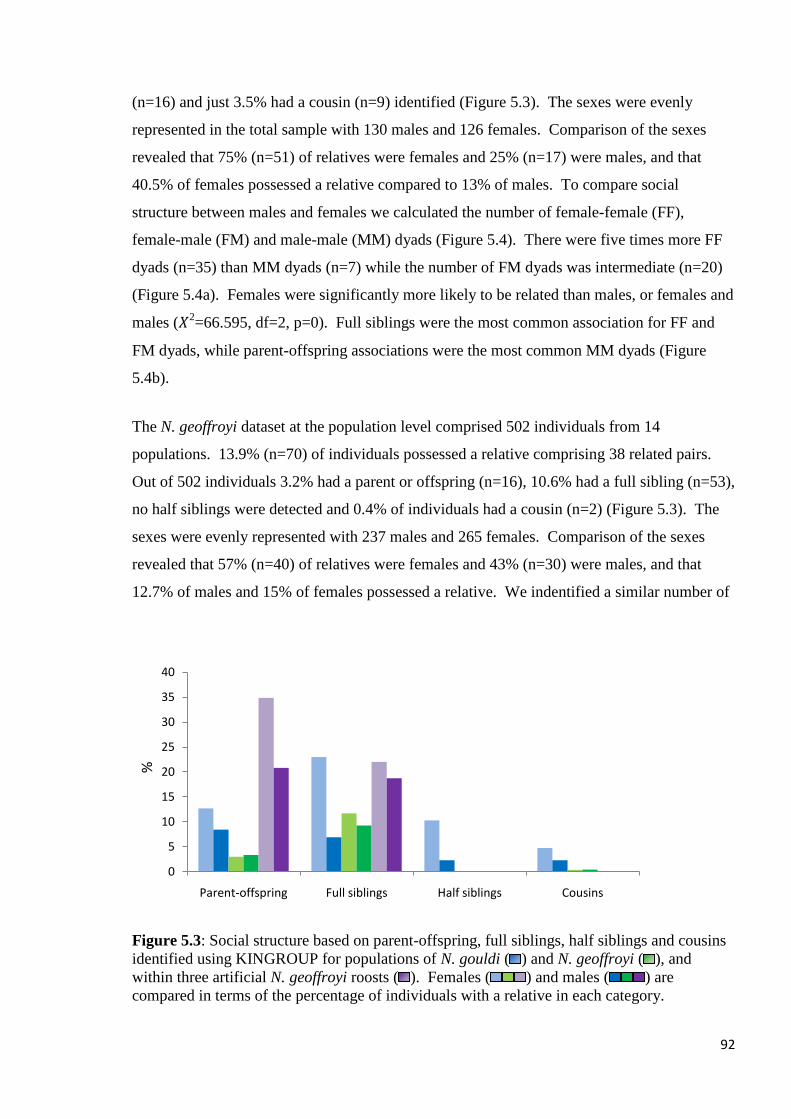
92
(n=16) and just 3.5% had a cousin (n=9) identified (Figure 5.3). The sexes were evenly
represented in the total sample with 130 males and 126 females. Comparison of the sexes
revealed that 75% (n=51) of relatives were females and 25% (n=17) were males, and that
40.5% of females possessed a relative compared to 13% of males. To compare social
structure between males and females we calculated the number of female-female (FF),
female-male (FM) and male-male (MM) dyads (Figure 5.4). There were five times more FF
dyads (n=35) than MM dyads (n=7) while the number of FM dyads was intermediate (n=20)
(Figure 5.4a). Females were significantly more likely to be related than males, or females and
males ( 2=66.595, df=2, p=0). Full siblings were the most common association for FF and
FM dyads, while parent-offspring associations were the most common MM dyads (Figure
5.4b).
The N. geoffroyi dataset at the population level comprised 502 individuals from 14
populations. 13.9% (n=70) of individuals possessed a relative comprising 38 related pairs.
Out of 502 individuals 3.2% had a parent or offspring (n=16), 10.6% had a full sibling (n=53),
no half siblings were detected and 0.4% of individuals had a cousin (n=2) (Figure 5.3). The
sexes were evenly represented with 237 males and 265 females. Comparison of the sexes
revealed that 57% (n=40) of relatives were females and 43% (n=30) were males, and that
12.7% of males and 15% of females possessed a relative. We indentified a similar number of
Figure 5.3: Social structure based on parent-offspring, full siblings, half siblings and cousins
identified using KINGROUP for populations of N. gouldi ( ) and N. geoffroyi ( ), and
within three artificial N. geoffroyi roosts ( ). Females ( ) and males ( ) are
compared in terms of the percentage of individuals with a relative in each category.
0
5
10
15
20
25
30
35
40
Parent-offspring Full siblings Half siblings Cousins
%
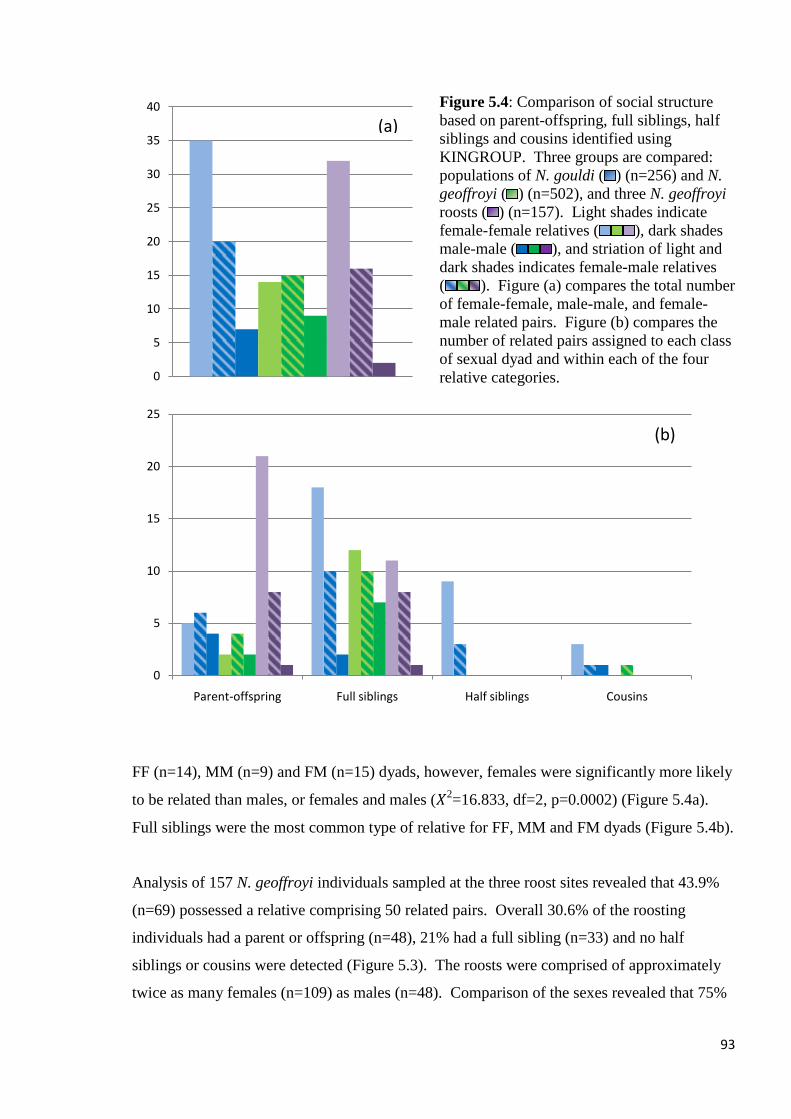
93
Figure 5.4: Comparison of social structure
based on parent-offspring, full siblings, half
siblings and cousins identified using
KINGROUP. Three groups are compared:
populations of N. gouldi ( ) (n=256) and N.
geoffroyi ( ) (n=502), and three N. geoffroyi
roosts ( ) (n=157). Light shades indicate
female-female relatives ( ), dark shades
male-male ( ), and striation of light and
dark shades indicates female-male relatives
( ). Figure (a) compares the total number
of female-female, male-male, and female-
male related pairs. Figure (b) compares the
number of related pairs assigned to each class
of sexual dyad and within each of the four
relative categories.
FF (n=14), MM (n=9) and FM (n=15) dyads, however, females were significantly more likely
to be related than males, or females and males ( 2=16.833, df=2, p=0.0002) (Figure 5.4a).
Full siblings were the most common type of relative for FF, MM and FM dyads (Figure 5.4b).
Analysis of 157 N. geoffroyi individuals sampled at the three roost sites revealed that 43.9%
(n=69) possessed a relative comprising 50 related pairs. Overall 30.6% of the roosting
individuals had a parent or offspring (n=48), 21% had a full sibling (n=33) and no half
siblings or cousins were detected (Figure 5.3). The roosts were comprised of approximately
twice as many females (n=109) as males (n=48). Comparison of the sexes revealed that 75%
0
5
10
15
20
25
Parent-offspring Full siblings Half siblings Cousins
0
5
10
15
20
25
30
35
40
(a)
(b)
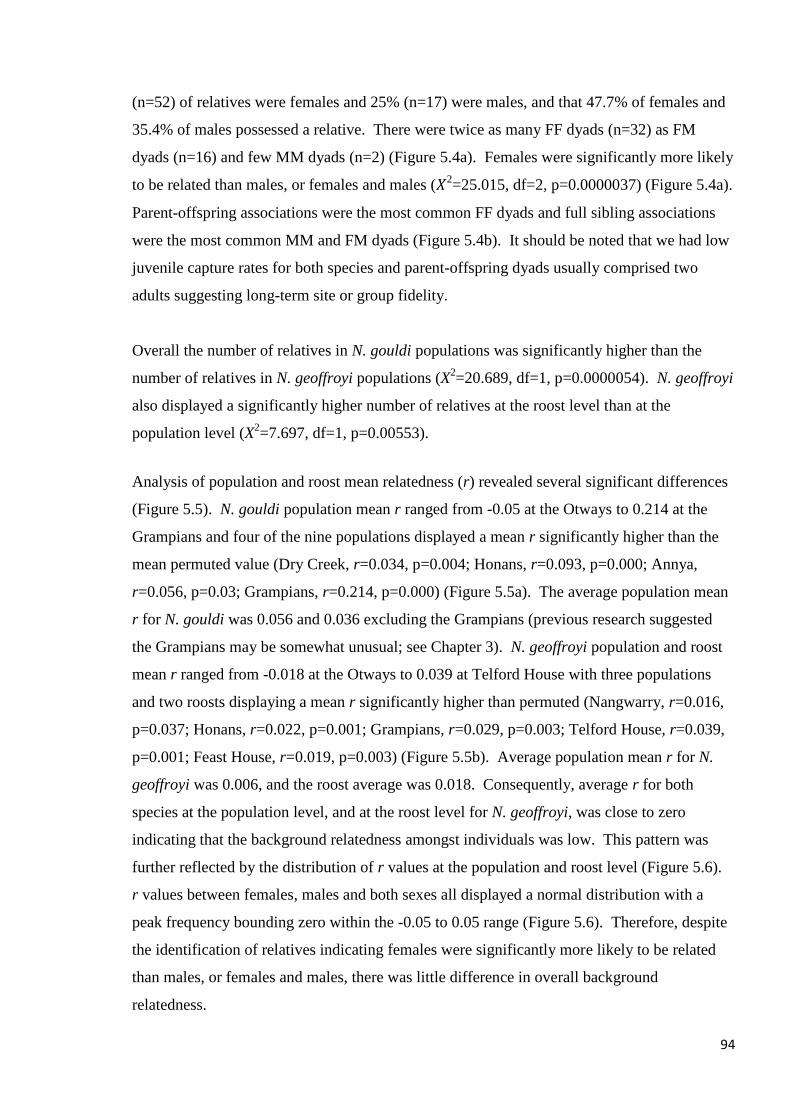
94
(n=52) of relatives were females and 25% (n=17) were males, and that 47.7% of females and
35.4% of males possessed a relative. There were twice as many FF dyads (n=32) as FM
dyads (n=16) and few MM dyads (n=2) (Figure 5.4a). Females were significantly more likely
to be related than males, or females and males ( 2=25.015, df=2, p=0.0000037) (Figure 5.4a).
Parent-offspring associations were the most common FF dyads and full sibling associations
were the most common MM and FM dyads (Figure 5.4b). It should be noted that we had low
juvenile capture rates for both species and parent-offspring dyads usually comprised two
adults suggesting long-term site or group fidelity.
Overall the number of relatives in N. gouldi populations was significantly higher than the
number of relatives in N. geoffroyi populations (X2=20.689, df=1, p=0.0000054). N. geoffroyi
also displayed a significantly higher number of relatives at the roost level than at the
population level (X2=7.697, df=1, p=0.00553).
Analysis of population and roost mean relatedness (r) revealed several significant differences
(Figure 5.5). N. gouldi population mean r ranged from -0.05 at the Otways to 0.214 at the
Grampians and four of the nine populations displayed a mean r significantly higher than the
mean permuted value (Dry Creek, r=0.034, p=0.004; Honans, r=0.093, p=0.000; Annya,
r=0.056, p=0.03; Grampians, r=0.214, p=0.000) (Figure 5.5a). The average population mean
r for N. gouldi was 0.056 and 0.036 excluding the Grampians (previous research suggested
the Grampians may be somewhat unusual; see Chapter 3). N. geoffroyi population and roost
mean r ranged from -0.018 at the Otways to 0.039 at Telford House with three populations
and two roosts displaying a mean r significantly higher than permuted (Nangwarry, r=0.016,
p=0.037; Honans, r=0.022, p=0.001; Grampians, r=0.029, p=0.003; Telford House, r=0.039,
p=0.001; Feast House, r=0.019, p=0.003) (Figure 5.5b). Average population mean r for N.
geoffroyi was 0.006, and the roost average was 0.018. Consequently, average r for both
species at the population level, and at the roost level for N. geoffroyi, was close to zero
indicating that the background relatedness amongst individuals was low. This pattern was
further reflected by the distribution of r values at the population and roost level (Figure 5.6).
r values between females, males and both sexes all displayed a normal distribution with a
peak frequency bounding zero within the -0.05 to 0.05 range (Figure 5.6). Therefore, despite
the identification of relatives indicating females were significantly more likely to be related
than males, or females and males, there was little difference in overall background
relatedness.
95
Figure 5.5: Mean (─) population and roost relatedness (r) for (a) N. gouldi, and (b) N.
geoffroyi. Upper and lower confidence limits (95%) (─) that there is no difference between
the populations and roosts based on 9999 permutations. Error bars based on bootstrap re-
sampling (9999 bootstraps).
DISCUSSION
Dispersal patterns
As predicted, our genetic analyses of N. gouldi provide evidence of a male bias in dispersal
and female philopatry within this species. Consistent with this strategy Mantel tests revealed
a significant pattern of isolation by distance (IBD) for females indicating that proximal
females were more closely related than distal females. Female philopatry was also support by
the identification of relatives which indicated that females were significantly more likely to be
related than males, or males and females. No IBD was detected for males which accounted
for 80% of the dispersal events proposed by GENECLASS. Common amongst mammals,
-0.100
-0.050
0.000
0.050
0.100
0.150
0.200
0.250
r
-0.040-0.030-0.020-0.0100.0000.0100.0200.0300.0400.0500.060
r
(b)
(a)
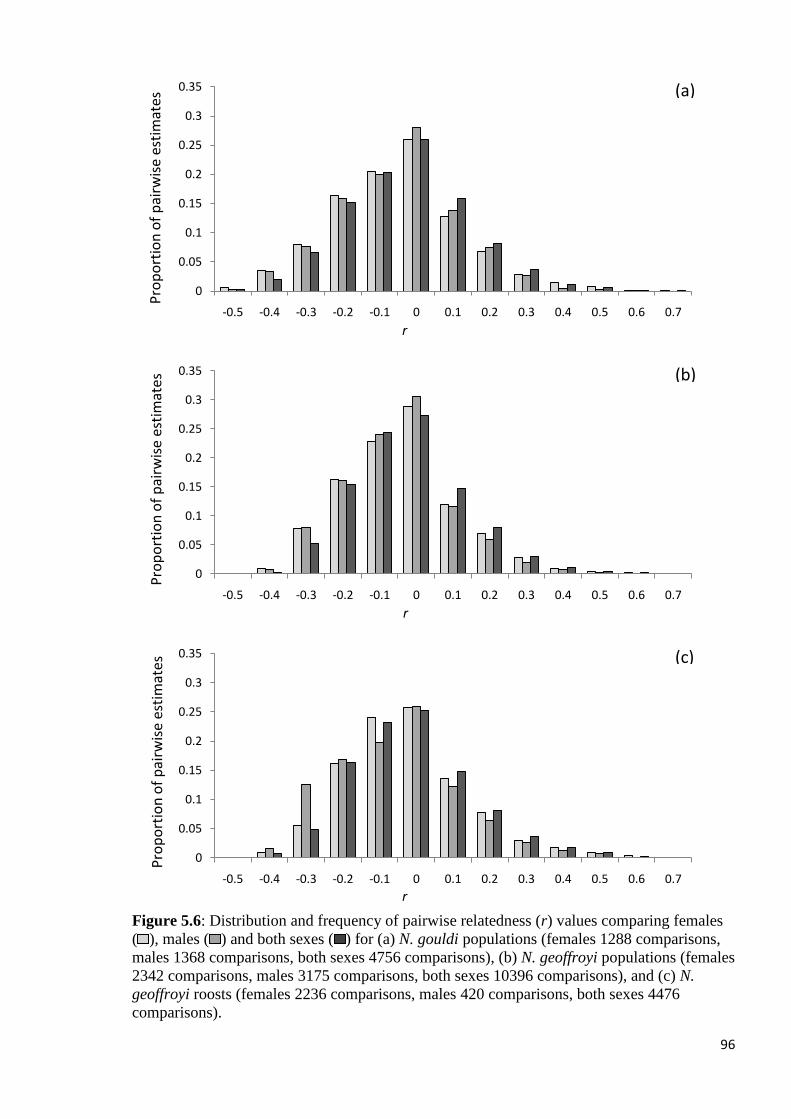
96
Figure 5.6: Distribution and frequency of pairwise relatedness (r) values comparing females
( ), males ( ) and both sexes ( ) for (a) N. gouldi populations (females 1288 comparisons,
males 1368 comparisons, both sexes 4756 comparisons), (b) N. geoffroyi populations (females
2342 comparisons, males 3175 comparisons, both sexes 10396 comparisons), and (c) N.
geoffroyi roosts (females 2236 comparisons, males 420 comparisons, both sexes 4476
comparisons).
0
0.05
0.1
0.15
0.2
0.25
0.3
0.35
-0.5 -0.4 -0.3 -0.2 -0.1 0 0.1 0.2 0.3 0.4 0.5 0.6 0.7
Pro
po
rtio
no
f p
airw
ise
esti
mat
es
r
0
0.05
0.1
0.15
0.2
0.25
0.3
0.35
-0.5 -0.4 -0.3 -0.2 -0.1 0 0.1 0.2 0.3 0.4 0.5 0.6 0.7
Pro
po
rtio
no
f p
airw
ise
esti
mat
es
r
0
0.05
0.1
0.15
0.2
0.25
0.3
0.35
-0.5 -0.4 -0.3 -0.2 -0.1 0 0.1 0.2 0.3 0.4 0.5 0.6 0.7
Pro
po
rtio
no
f p
airw
ise
esti
mat
es
r
(a)
(b)
(c)
97
male biased dispersal has been identified in numerous chiropterans including Rhinolophus
monoceros (Chen et al. 2008), M. bechsteinii (Kerth et al. 2002a), Nyctalus noctula (Petit et
al. 2001), Myotis myotis (Petri et al. 1997), Macroderma gigas (Worthington Wilmer et al.
1999), Myotis septentrionalis (Arnold 2007) and Corynorhinus townsendii ingens (Weyandt
et al. 2005). Although this appears to be the most common dispersal strategy within
Chiroptera, other strategies are also employed. For example, both sexes are recruited into
Plecotus auritus colonies (Burland et al. 1999), while in Lophostoma silvicolum both
offspring disperse (Dechmann et al. 2007).
In contrast to N. gouldi, we found no evidence to suggest a sexual bias in dispersal for N.
geoffroyi. This finding conflicted with our hypothesis that the two closely related species
would display similar dispersal strategies. We did detect a significant female bias in the
number of related N. geoffroyi consistent with female philopatry and male biased dispersal.
However, male and female N. geoffroyi are known to roost separately (Churchill 2008;
Lumsden et al. 2002a; Lumsden et al. 2002b; Reardon & Flavel 1987) and a localised bias in
female relatives could reflect a pattern of social structure that occurs independently of
dispersal strategies. We propose that large population sizes and prolific male dispersal may
have masked evidence of male biased dispersal that could be detected with nuclear markers.
Consequently, we recommend the use of a sex-linked marker, such as mtDNA, coupled with
more intensive sampling at fewer sites to resolve N. geoffroyi dispersal strategies.
Social structure
Our hypothesis that N. gouldi and N. geoffroyi would display similar social structure was only
partially supported. In both species females were significantly more likely to be related than
males, or males and females. However, this relationship was of greater significance for N.
gouldi, and over 40% of N. gouldi females possessed a relative with females comprising 75%
of relatives. This contrasted with N. geoffroyi where only 15% of females possessed a
relative and females accounted for 57% of relatives. N. gouldi also displayed significantly
more relatives than N. geoffroyi at the population level with approximately twice as many N.
gouldi (26.5%) possessing a relative than N. geoffroyi (13.9%). This suggests that social
bonds between relatives may play a more significant role in the social structure of N. gouldi
populations. However, as acknowledged regarding dispersal patterns, we cannot rule out that
these differences are purely due to larger N. geoffroyi population sizes. Had we sampled a
98
larger proportion of N. geoffroyi populations we may have identified a similar ratio of
relatives in both species. Nevertheless, N. gouldi populations contained a substantial number
of related individuals suggesting that relatives comprise a significant component of social
structure. This trend was most pronounced for female relatives, especially sisters, suggesting
that the bonds between female full siblings may be of particular social significance. Although
fewer relatives were detected within N. geoffroyi populations the same pattern was observed:
female full siblings were the most common type of relatives detected.
The social structure of N. geoffroyi roosts differed significantly from that detected at the
population level for the species. N. geoffroyi roosts displayed more similarity to N. gouldi
populations with 47.7% of females possessing a relative and females comprising 75.4% of
relatives. However, the similarities ended there as 43.9% of roosting individuals possessed a
relative, the roosts contained fewer males (30.6%) than females (69.4%), and males
frequently possessed relatives (35.4%). While full siblings were the most common relatives
for both species at the population level, parent-offspring dyads were the most common
associations within the roosts. The high number of parent-offspring was driven by female-
female (FF) associations and may be due to female philopatry and recruitment into the
colonies. Nevertheless, male-male (MM) and female-male (FM) dyads within roosts
displayed similar numbers of parent-offspring and full siblings contrasting N. geoffroyi
populations which contained more full siblings. The skew towards parent-offspring dyads
may be a consequence of recent breeding activity at the sites, discussed below.
N. geoffroyi parturition occurs in October and November and lactation generally ceases by
February when juveniles can no longer be distinguished from adults and when dispersal
occurs (Churchill 2008; Hosken 1997). Mating typically commences in Autumn between
March and May (Churchill 2008; Hosken 1997). Due to the time of roost sampling (March),
and the mixed sex composition of the colonies, it is unclear whether the composition of the
roosts represents relictual maternity colonies or congregations forming in anticipation of
mating. The landowner who alerted us to the colonies confirmed that the roosts were
permanent year-round colonies and that juveniles were readily observed at the Telford Shed
site several months earlier (A.Telford. pers.comm.). This confirmed the use of the Telford
Shed site as a maternity roost, and given the permanent status of all three colonies, it is highly
likely that all three sites contained maternity colonies several months prior to sampling.
99
As discussed, female and male N. geoffroyi typically roost apart, alone or in small groups,
with maternity colonies of up to 30 females forming often accompanied by a male (Churchill
2008; Lumsden et al. 2002a; Lumsden et al. 2002b; Reardon & Flavel 1987). Other large
mixed-sex colonies, such as ours, have been reported in buildings elsewhere (Churchill 2008;
Lumsden et al. 2002a; Lumsden et al. 2002b; Reardon & Flavel 1987), and it is possible that
these artificial spaces facilitate year-round co-roosting behaviour between the sexes. Such
atypical mixing of the sexes could potentially be sustained through the provision of varied
thermal conditions to suit both sexes (Lumsden et al. 2002b; Turbill 2006; Turbill & Geiser
2006), or through internal compartmentalisation of the space to maintain strict social
structures.
If the hypothesis is true that the composition of the roosts represents a relictual maternity
colony, it is not clear whether this scenario is typical of N. geoffroyi roosts at this time of
year, or whether it is a consequence of artificial roosting sites. Lumsden et al. (2002a) found
that N. geoffroyi, including breeding females, would travel up to 12km to forage within
agricultural land suggesting that agricultural land may represent an optimal foraging habitat
for the species. Combined with thermally diverse and abundant roost sites within manmade
structures, it is possible that farms may facilitate increased philopatry or prolonged parental
care.
In contrast to the identification of relatives, the calculation of pairwise relatedness (r) revealed
little difference in the distribution and frequency of r values between the two species, or
between N. geoffroyi at the roost and population level. This seems counter intuitive given the
differences identified through the assessment of related dyads. However given the pairwise
comparisons for N. gouldi and N. geoffroyi populations and N. geoffroyi roosts tally 4756,
10396 and 4476 respectively, the respective identification of 62, 70 and 50 related pairs gives
context to the small proportion of pairwise comparisons constituting relatives. Despite this
apparent contradiction there was some agreement between the two approaches. Female N.
geoffroyi within roosts appear to display a greater proportion of positive r values compared to
males which concurs with the higher incidence of female relatives compared to males.
However, N. gouldi displayed a higher proportion of positive r values for males compared to
females, conflicting with the analysis of relatives which showed a clear female bias in the
frequency of relatives.

100
There were also some seemingly conflicting results between the identification of relatives and
the calculation of mean population and roost relatedness (r). An increase in the number of
related dyads did not always coincide with an increase in population or roost mean r. For
example, the two roosts with a mean r significantly higher than permuted, Telford House
(mean r= 0.039) and Feast House (mean r=0.019) contained lower percentages of relatives
(34% and 38% respectively) compared to Telford Shed (58%) which had the lowest mean r
amongst the roosts (mean r= -0.05). This again highlights the fact that related pairs actually
comprised a small proportion of pairwise comparisons. In reality the populations and roosts
were predominantly comprised of unrelated individuals, thus the background mean r was low.
Kerth et al. (2002b) obtained a similar result for Myotis bechsteinii colonies where despite
75% of individuals possessing a relative mean r was close to zero (r = 0.02). They concluded
that average r is a poor predictor of kin selection as it fails to recognise family groups amidst
the background noise of unrelated individuals. Rossiter et al. (2002) made a similar discovery
regarding Rhinolophus ferrumequinum which displayed low background mean r (0.03)
amongst colony females despite the presence of matriline groups within the colony with
average relatedness levels of 0.17-0.64.
Our results suggest that while bonds between related females may represent an important
aspect of social structure in N. gouldi and N. geoffroyi, they are not necessarily the principal
factor driving sociality. Both Rossiter et al. (2002) and Kerth et al. (2002b) discuss similar
scenarios for R. ferrumequinum and M. bechsteinii and propose that reciprocal altruism , not
kin selection, is the dominant mechanism behind sociality and colonialism. For example,
basic cooperative behaviour such as clustering may be shared between conspecifics while
higher order cooperation such as cooperative breeding or information transfer may be
restricted to kin. Rossiter et al. (2002) found that cooperative foraging behaviour in R.
ferrumequinum was indeed biased towards kin indicating that individuals did discriminate
between relatives and non-relatives to engage in cooperative behaviour. Similar
discrimination in cooperative behaviour has been proposed in Desmodus rotundus where food
sharing and grooming is positively correlated with relatedness (Wilkinson 1984, 1986). We
concur with conclusions made by Kerth et al. (2002b) regarding M. bechsteinii, that low
background r suggests that kin selection does not constitute the principal factor driving social
systems for N. gouldi and N. geoffroyi. Instead, reciprocal altruism may be the dominant
mechanism driving sociality within these two species, but without behavioural observations
we can only speculate. Nevertheless, kin selection does represent a significant component of
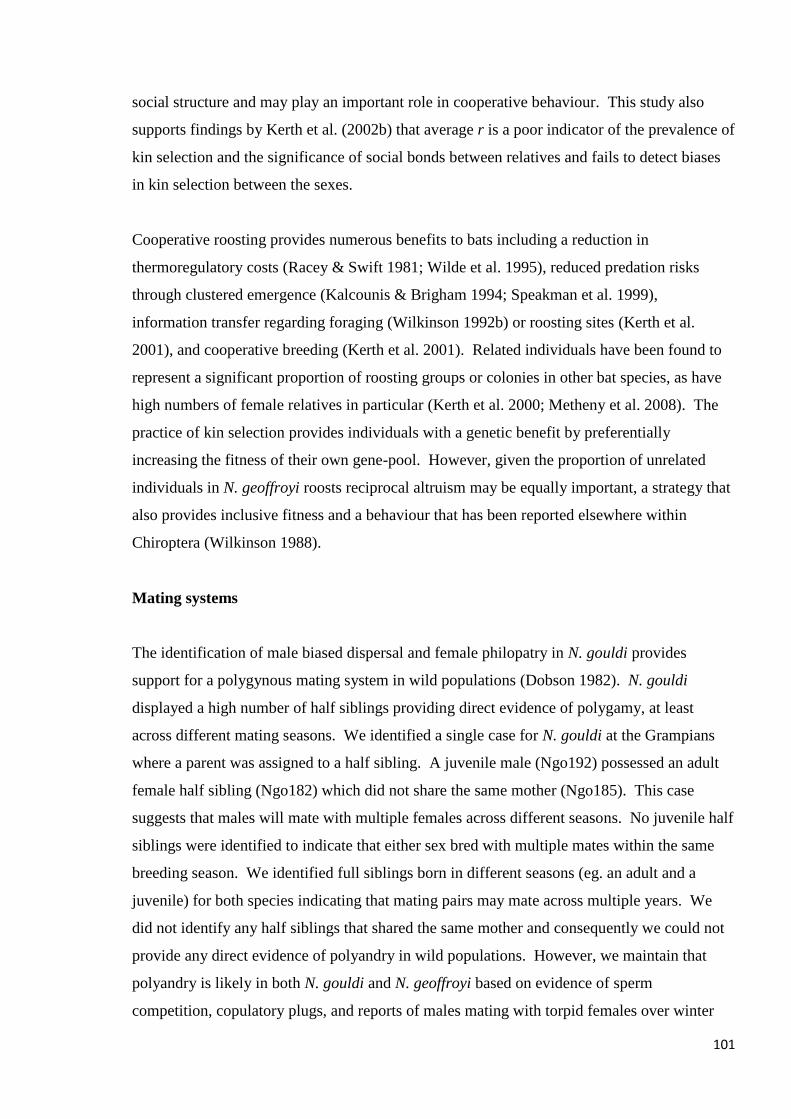
101
social structure and may play an important role in cooperative behaviour. This study also
supports findings by Kerth et al. (2002b) that average r is a poor indicator of the prevalence of
kin selection and the significance of social bonds between relatives and fails to detect biases
in kin selection between the sexes.
Cooperative roosting provides numerous benefits to bats including a reduction in
thermoregulatory costs (Racey & Swift 1981; Wilde et al. 1995), reduced predation risks
through clustered emergence (Kalcounis & Brigham 1994; Speakman et al. 1999),
information transfer regarding foraging (Wilkinson 1992b) or roosting sites (Kerth et al.
2001), and cooperative breeding (Kerth et al. 2001). Related individuals have been found to
represent a significant proportion of roosting groups or colonies in other bat species, as have
high numbers of female relatives in particular (Kerth et al. 2000; Metheny et al. 2008). The
practice of kin selection provides individuals with a genetic benefit by preferentially
increasing the fitness of their own gene-pool. However, given the proportion of unrelated
individuals in N. geoffroyi roosts reciprocal altruism may be equally important, a strategy that
also provides inclusive fitness and a behaviour that has been reported elsewhere within
Chiroptera (Wilkinson 1988).
Mating systems
The identification of male biased dispersal and female philopatry in N. gouldi provides
support for a polygynous mating system in wild populations (Dobson 1982). N. gouldi
displayed a high number of half siblings providing direct evidence of polygamy, at least
across different mating seasons. We identified a single case for N. gouldi at the Grampians
where a parent was assigned to a half sibling. A juvenile male (Ngo192) possessed an adult
female half sibling (Ngo182) which did not share the same mother (Ngo185). This case
suggests that males will mate with multiple females across different seasons. No juvenile half
siblings were identified to indicate that either sex bred with multiple mates within the same
breeding season. We identified full siblings born in different seasons (eg. an adult and a
juvenile) for both species indicating that mating pairs may mate across multiple years. We
did not identify any half siblings that shared the same mother and consequently we could not
provide any direct evidence of polyandry in wild populations. However, we maintain that
polyandry is likely in both N. gouldi and N. geoffroyi based on evidence of sperm
competition, copulatory plugs, and reports of males mating with torpid females over winter
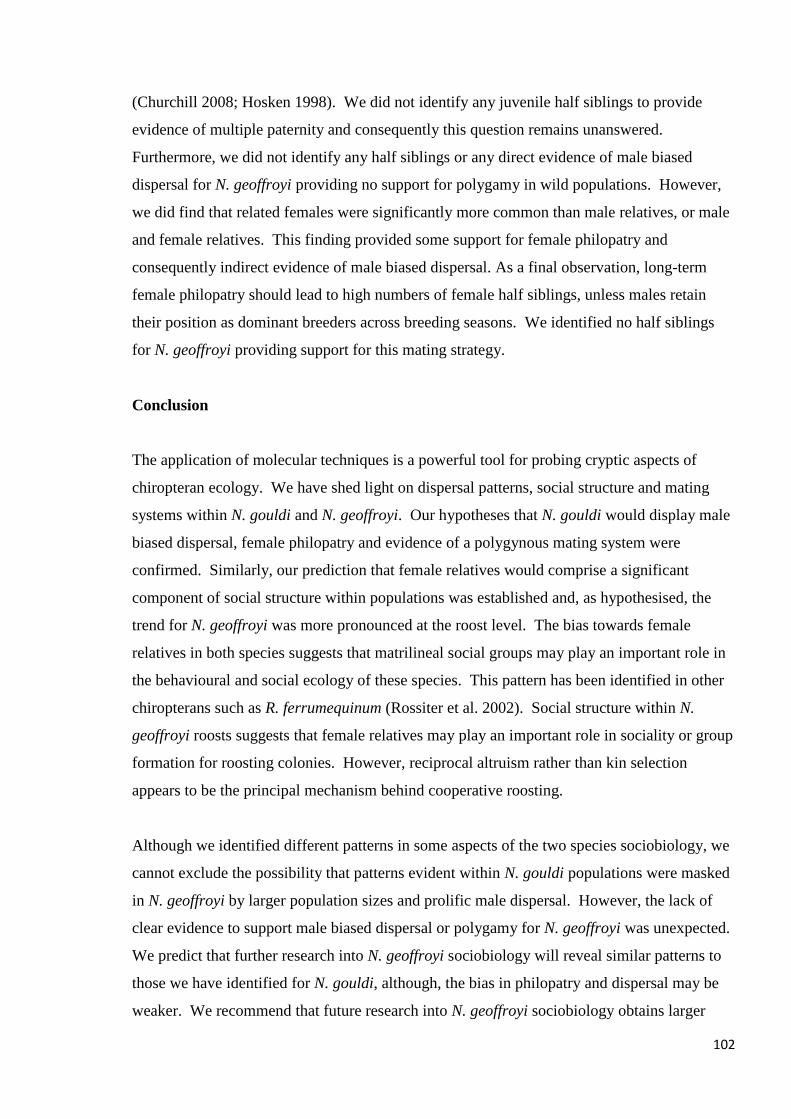
102
(Churchill 2008; Hosken 1998). We did not identify any juvenile half siblings to provide
evidence of multiple paternity and consequently this question remains unanswered.
Furthermore, we did not identify any half siblings or any direct evidence of male biased
dispersal for N. geoffroyi providing no support for polygamy in wild populations. However,
we did find that related females were significantly more common than male relatives, or male
and female relatives. This finding provided some support for female philopatry and
consequently indirect evidence of male biased dispersal. As a final observation, long-term
female philopatry should lead to high numbers of female half siblings, unless males retain
their position as dominant breeders across breeding seasons. We identified no half siblings
for N. geoffroyi providing support for this mating strategy.
Conclusion
The application of molecular techniques is a powerful tool for probing cryptic aspects of
chiropteran ecology. We have shed light on dispersal patterns, social structure and mating
systems within N. gouldi and N. geoffroyi. Our hypotheses that N. gouldi would display male
biased dispersal, female philopatry and evidence of a polygynous mating system were
confirmed. Similarly, our prediction that female relatives would comprise a significant
component of social structure within populations was established and, as hypothesised, the
trend for N. geoffroyi was more pronounced at the roost level. The bias towards female
relatives in both species suggests that matrilineal social groups may play an important role in
the behavioural and social ecology of these species. This pattern has been identified in other
chiropterans such as R. ferrumequinum (Rossiter et al. 2002). Social structure within N.
geoffroyi roosts suggests that female relatives may play an important role in sociality or group
formation for roosting colonies. However, reciprocal altruism rather than kin selection
appears to be the principal mechanism behind cooperative roosting.
Although we identified different patterns in some aspects of the two species sociobiology, we
cannot exclude the possibility that patterns evident within N. gouldi populations were masked
in N. geoffroyi by larger population sizes and prolific male dispersal. However, the lack of
clear evidence to support male biased dispersal or polygamy for N. geoffroyi was unexpected.
We predict that further research into N. geoffroyi sociobiology will reveal similar patterns to
those we have identified for N. gouldi, although, the bias in philopatry and dispersal may be
weaker. We recommend that future research into N. geoffroyi sociobiology obtains larger

103
sample sizes and utilises sex-linked markers, such as mtDNA and Y-chromosome markers,
for greater resolving power to determine dispersal patterns.
104
Chapter 6
General Discussion
The following general discussion focuses on further management implications derived from
this thesis and considers future prospects for research. This thesis has made a significant
contribution in its objectives to bridge the knowledge gap in several aspects of chiropteran
conservation and ecology. Prior to the commencement of this thesis there were no published
studies investigating the influence of habitat fragmentation on gene flow or genetic diversity
for any chiropteran species. This was cause for concern given two important facts: habitat
fragmentation represents one of the key threats facing global biodiversity and chiropterans
comprise more than 20% of described mammal species (Baillie et al. 2004; Bennett 2003;
(Wilson & Reeder 2005). Nearly a quarter of all chiropterans are listed on the IUCN Red List
as threatened (Critically Endangered, Endangered or Vulnerable) and habitat destruction,
degradation and fragmentation are identified as impacting 86% of threatened mammal species
(Baillie et al. 2004; Mickleburgh et al. 2002). At a national level, the primary cause for
listing 60% of threatened Australian chiropterans is habitat loss, incorporating land clearing,
fragmentation and modification (Duncan et al. 1999). Furthermore, the Australian Action
Plan for Bats identifies ‗the impact of forest fragmentation on bats at a landscape scale‘ as a
priority for research efforts (Duncan et al. 1999). Presence and abundance studies have
documented changes to the composition of chiropteran communities due to habitat
fragmentation, including the loss of some species from isolated fragments (Cosson et al.
1999; Estrada & Coates-Estrada 2002; Estrada et al. 1993; Medina et al. 2007; Schulze et al.
2000). Therefore despite their vagility, it appears that not all chiropterans are immune to
impacts on dispersal and population connectivity due to habitat fragmentation. Clearly the
impact of habitat fragmentation on bat population connectivity warrants urgent critical
assessment.
Insights into chiropteran responses to habitat fragmentation
Adding to published studies by Struebig et al. (2011) and Meyer et al. (2009), this study used
genetic data to provide a significant insight into chiropteran responses to habitat
fragmentation. The study has documented changes to population structure and connectivity,
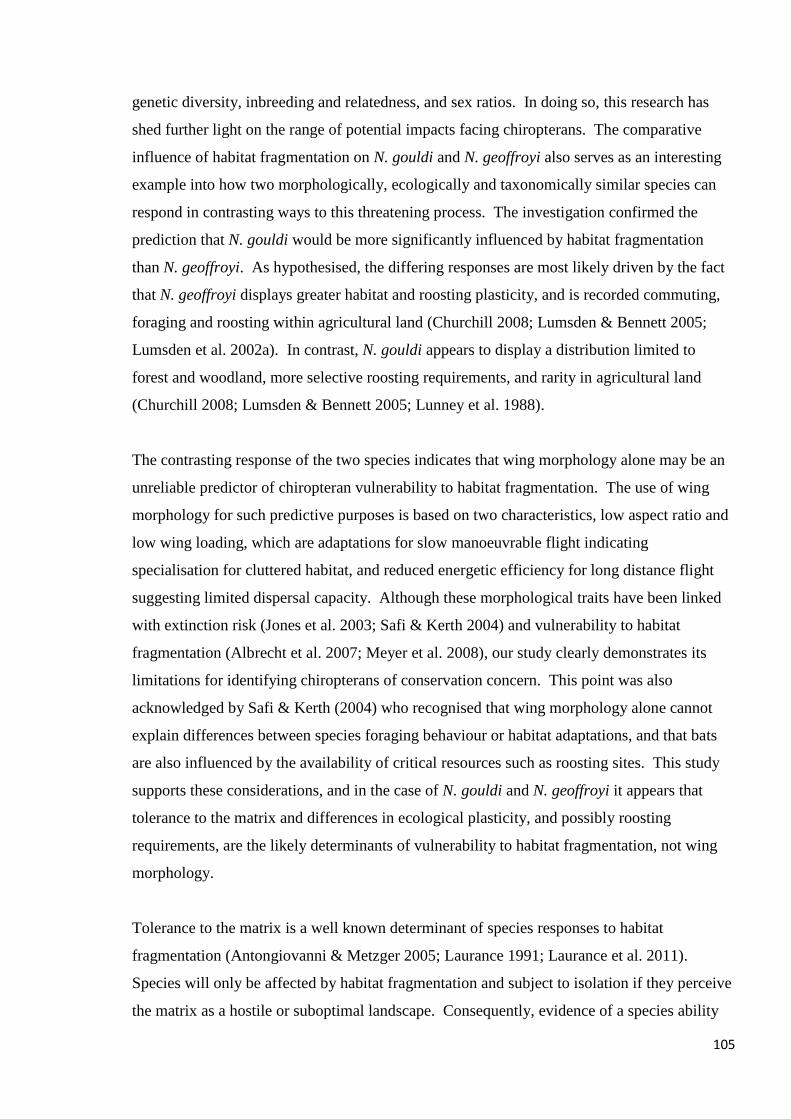
105
genetic diversity, inbreeding and relatedness, and sex ratios. In doing so, this research has
shed further light on the range of potential impacts facing chiropterans. The comparative
influence of habitat fragmentation on N. gouldi and N. geoffroyi also serves as an interesting
example into how two morphologically, ecologically and taxonomically similar species can
respond in contrasting ways to this threatening process. The investigation confirmed the
prediction that N. gouldi would be more significantly influenced by habitat fragmentation
than N. geoffroyi. As hypothesised, the differing responses are most likely driven by the fact
that N. geoffroyi displays greater habitat and roosting plasticity, and is recorded commuting,
foraging and roosting within agricultural land (Churchill 2008; Lumsden & Bennett 2005;
Lumsden et al. 2002a). In contrast, N. gouldi appears to display a distribution limited to
forest and woodland, more selective roosting requirements, and rarity in agricultural land
(Churchill 2008; Lumsden & Bennett 2005; Lunney et al. 1988).
The contrasting response of the two species indicates that wing morphology alone may be an
unreliable predictor of chiropteran vulnerability to habitat fragmentation. The use of wing
morphology for such predictive purposes is based on two characteristics, low aspect ratio and
low wing loading, which are adaptations for slow manoeuvrable flight indicating
specialisation for cluttered habitat, and reduced energetic efficiency for long distance flight
suggesting limited dispersal capacity. Although these morphological traits have been linked
with extinction risk (Jones et al. 2003; Safi & Kerth 2004) and vulnerability to habitat
fragmentation (Albrecht et al. 2007; Meyer et al. 2008), our study clearly demonstrates its
limitations for identifying chiropterans of conservation concern. This point was also
acknowledged by Safi & Kerth (2004) who recognised that wing morphology alone cannot
explain differences between species foraging behaviour or habitat adaptations, and that bats
are also influenced by the availability of critical resources such as roosting sites. This study
supports these considerations, and in the case of N. gouldi and N. geoffroyi it appears that
tolerance to the matrix and differences in ecological plasticity, and possibly roosting
requirements, are the likely determinants of vulnerability to habitat fragmentation, not wing
morphology.
Tolerance to the matrix is a well known determinant of species responses to habitat
fragmentation (Antongiovanni & Metzger 2005; Laurance 1991; Laurance et al. 2011).
Species will only be affected by habitat fragmentation and subject to isolation if they perceive
the matrix as a hostile or suboptimal landscape. Consequently, evidence of a species ability
106
to readily traverse the matrix, utilise resources within the matrix, or permanently reside within
the matrix are the strongest indicators that a species will be resilient to habitat fragmentation.
The opposite is also true; species that do not display these characteristics may be vulnerable
and prone to population isolation following habitat fragmentation. An additional indirect
measure of tolerance to the matrix is a species‘ degree of specialisation. Species with
specialist habitat or resource needs are less likely to find these resources within modified
landscapes than generalist species able to exploit a variety of habitats and resources.
Consequently, indicators of specialisation can be useful predictors of vulnerability to habitat
fragmentation, as illustrated by support for chiropteran wing morphology as a predictive trait
(Albrecht et al. 2007; Meyer et al. 2008). Limited geographic range suggesting narrow
ecological tolerances, and evidence of specialised dietary or habitat requirements may also
serve as informative predictors of species responses to habitat fragmentation.
Evidence of tolerance to the matrix and habitat specialisation proved valuable predictors of
vulnerability to habitat fragmentation in this study, overriding predictions derived from wing
morphology alone. With several studies supporting the use of wing morphology as a
predictor of chiropteran vulnerability to habitat fragmentation (Albrecht et al. 2007; Meyer et
al. 2008) I recommend that researchers use caution when using this approach. Instead, I
propose that the predictive framework for chiropteran responses to habitat fragmentation be
refined to include consideration of habitat and roosting specialisation, and tolerance to the
matrix, in conjunction with this meritorious morphological trait. This refinement will
improve the accuracy and reliability of efforts to predict chiropterans at risk to habitat
fragmentation.
Candidates for future chiropteran studies assessing the impact of habitat fragmentation
Until the impact of habitat fragmentation on population connectivity is assessed in additional
bat species we will not have a clear idea how prevalent vulnerability to habitat fragmentation
is within Chiroptera. The results of this research suggest that future studies should start by
assessing species with traits similar to N. gouldi. Key traits to consider include wing
morphology (low aspect ratio and low wing loading), habitat specialisation, a distribution
limited to regions of forest or woodland, and direct evidence of matrix avoidance or a positive
association with tree density. Based on these considerations several Australian bat species
107
may serve as good candidates for future studies assessing the impact of habitat fragmentation
on chiropteran population connectivity.
Law et al. (1999) used ultrasonic detectors to assess bat activity across a range of habitat
categories including continuous forest, fragmented forest and open areas. The activity of
three vespertilionids, Chalinolobus morio, Vespadelus regulus and Falsistrellus tasmaniensis,
was positively associated with habitat area and habitat diversity and negatively associated
with habitat isolation, suggesting sensitivity to habitat fragmentation (Law et al. 1999). C.
morio activity was significantly greater in continuous forest than small forests and the species
displayed a low detection rate within open spaces. V. regulus activity was lowest within
small remnants, corridors and open spaces. F. tasmaniensis also displayed the greatest
activity within continuous forest and was absent from small forest fragments and corridors,
however, it was recorded moving through cleared landscapes. Lumsden and Bennett (2005)
provided further evidence of possible sensitivity to habitat fragmentation in C. morio and V.
regulus in their study assessing bat activity across a gradient of tree cover using sonic
detectors and harp trapping. Via both sampling techniques C. morio activity displayed a
significant positive correlation with tree cover. V. regulus activity was not significantly
correlated with tree cover, but both sampling methods revealed the highest activity within
densely treed paddocks and the lowest activity within open paddock.
Chalinolobus morio and V. regulus display geographic distributions concentrated in forest,
woodland and mallee across southern and south-eastern Australia, however, both species
distributions also include some regions of shrubland (Churchill 2008). F. tasmaniensis
appears to display a higher degree of habitat specialisation with a distribution strictly limited
to forest, woodland and mallee in south-eastern Australia (Churchill 2008). C. morio and V.
regulus both display wing morphology similar to N. geoffroyi and N. gouldi characterised by
low aspect ratio and wing loading, indicating adaptation for slow manoeuvrable flight suited
to cluttered environments (Fullard et al. 1991; Norberg & Rayner 1987; O'neill & Taylor
1986; Rhodes 2002). In contrast, F. tasmaniensis displays wing morphology adapted for fast
flight with limited manoeuvrability characterised by a higher aspect ratio (Norberg & Rayner
1987; O'neill & Taylor 1986) and wing loading (Norberg & Rayner 1987). Despite its
differing wing morphology, F. tasmaniensis displays an affinity for tall (≥20m) forest where it
forages in and around the canopy (Churchill 2008). Based on the collective evidence given
108
above I propose that C. morio, V. regulus and F. tasmaniensis all represent suitable candidates
for future studies investigating the impact of habitat fragmentation on Australian chiropterans.
Management implications for N. gouldi
Endangered South Australian populations
Having proposed a threshold for N. gouldi population connectivity of 27km across
agricultural land comprosed of pasture and plantation pine in Chapter 3, and identifying
unimpeded gene flow across small agricultural distances <2km, I suggest that the true
dispersal threshold lies somewhere between the two. Lack of captures at three Victorian
fragmented sites (Framlingham, Woolsthrope and Mt Napier) impeded my capacity to further
refine this threshold for N. gouldi population connectivity. Future studies could build upon
this work by assessing gene flow between sites within this distance range to further refine a
threshold estimate. In the meantime I recommend applying the precautionary principal by
utilising the <2km threshold, 1.75km to be precise (see below), as a known agricultural
distance across which N. gouldi dispersal is maintained, to guide conservation and
revegetation efforts. However, as a species-specific guideline, this information should be
considered in conjunction with data on additional taxa for a holistic approach to regional
conservation and landscape management.
The results of this research suggest that N. gouldi dispersal events may occur across
agricultural land but that dispersal rates are significantly reduced, leading to a range of
measureable impacts within fragmented populations. These impacts include significant
population differentiation, elevated measures of inbreeding and relatedness, reduced genetic
diversity (standardised heterozygosity) and altered sex ratios. These findings have direct
implications for long-term persistence of the endangered SA populations of N. gouldi which
are restricted to limited and highly fragmented patches of remnant habitat. However, my data
indicate that sufficient gene flow to limit population differentiation can be maintained across
agricultural crossings spanning a collective distance of <1.75km, with the largest single gap
not exceeding 1.25km. Therefore to improve connectivity between the SA populations
revegetation could be conducted to establish stepping-stones or corridors according to these
guidelines to bridge the agricultural gaps between sites. This approach could mitigate the
negative impacts I have identified and secure the SA populations as a more robust
109
metapopulation with enhanced long-term prospects for persistence. However, other
considerations may also need to be addressed to achieve this management outcome. Despite
the proximity of Dry Creek to the extensive Lower Glenelg and Cobboboonee NPs the site
still suffers from the same symptoms characterising the other isolated SA populations. As the
smallest site included in our analyses (396ha) it may be that the limited size of this remnant is
also influencing the genetic and demographic composition of the population. These issues
may be resolved upon completion of the South East Biodiversity Corridors Network which
will connect Dry Creek with neighbouring forest remnants within the local plantation pine
matrix and significantly increase the effective habitat area for the population (ForestrySA
2003). The south East Biodiversity Corridors Network provides several opportunities for
future research to improve conservation outcomes for the endangered SA populations of N.
gouldi. I recommend further sampling be conducted within sites designated for inclusion
within the corridor network to establish N. gouldi population structure prior to corridor
establishment, particularly within the Mt Burr South and Caroline groups (see (ForestrySA
2003). Subsequent post corridor sampling would then be able to measure the effectiveness of
corridors for facilitating N. gouldi dispersal, improving genetic diversity and normalising sex
ratios.
The Grampians
The Grampians was a distinctive N. gouldi population within this study. It was clearly
identified as the most unique population by Bayesian clustering tests, genetic differentiation
(FST & Dest) and the identification of 12 private alleles. Initially I considered the population
would comprise an unfragmented ‗mainland‘ site to compare with fragmented ‗island‘
populations. However, the site revealed some surprising characteristics including almost half
of the identified related pairs within the study, the highest Internal Relatedness (IR), the
second highest FIS, lower observed than expected heterozygosity and Standardised
Heterozygosity (SH) below parity. These findings were in stark contrast to the other
unfragmented sites and were akin to results for the small isolated fragments in SA. This was
surprising given the Grampians spans 167 000ha and the SA fragments of Nangwarry, Dry
Creek and Honans cover 2218ha, 396ha and 1041ha respectively.
Pre-European estimates of vegetation cover indicate that the Grampians was naturally
separated from neighbouring forests by a belt comprised primarily of two ecological
110
vegetation classes (EVCs), Plains Grassland which is devoid of tree cover, and Plains Grassy
Woodland characterised by a tree canopy cover of 20% (DSE 2004a, b, 2011). EVCs
represent an approach by the State Government of Victoria for describing broad vegetation
categories (Woodgate et al. 1994). EVCs are modelled using GIS based on field data
(floristics and vegetation structure) and environmental spatial data (soils, rainfall and
topography). Pre-European estimates of EVC distributions are modelled in consultation with
historical records such as Parish plans. The canopy cover present in Plains Grassy Woodland
corresponds most closely with the ‗moderately scattered‘ tree density class used by Lumsden
& Bennett (2005) in which no N. gouldi were caught. It is reasonable to assume that the belt
of grassland complexes surrounding the Grampians prior to European settlement may have
posed a barrier or filter to N. gouldi dispersal effectively isolating the resident population.
Pollen analysis of sediment cores from lake beds throughout the region indicate that
vegetation types were fairly stable during the Holocene and that these grasslands could even
date back to the late Pleistocene (Jones 1999).
The possible isolation of the Grampians since the early Holocene or late Pleistocene would
explain the high FST and Dest values, the significant structure detected in our Bayesian tests,
and the high number of private alleles. However, in such a large forest, isolation alone is
unlikely to have produced the signs of inbreeding and elevated relatedness. These
characteristics suggest that the population is small, either permanently due to limited or
marginal habitat or temporarily as a consequence of a population bottleneck. In 2006 the
region did experience a significant bushfire that ravaged much of the National Park. Such an
event could have caused a population bottleneck, but our analyses revealed no signs that a
bottleneck took place. Consequently it appears that despite the size of the Grampians suitable
N. gouldi habitat may be limited, supporting only small numbers of the species. This
hypothesis sits well with my trapping effort as I extensively trapped over a considerable area
of the southern Grampians and located all but one individual along several kilometres of the
Wannon River. This region was characterised by moister conditions and a greater abundance
of older hollow bearing trees, a phenomenon I recognised at many of the sites where high
capture rates were recorded. However, I believe this trend was most pronounced at the
Grampians where these presumably optimal areas were less common and captures elsewhere
were scarce. On the south coast of NSW Lunney et al. (1988) found that conditions suitable
for N. gouldi were only provided in gullies along water lines. I propose the same pattern is
likely in the Grampians.
111
With a potentially restricted population size concentrated in limited regions of suitable
habitat, the population of N. gouldi at the Grampians could be at risk of threats associated
with small populations including stochastic events and genetic and demographic processes
(Caughley 1994). This is of particular concern as I propose that the Grampians population
warrants recognition as a unique Management Unit (MU) based on the criteria of Moritz
(1994). Further analysis of this population may elevate this status to an Evolutionarily
Significant Unit (ESU) (Moritz 1994). I recommend that additional research is conducted on
the Grampians population with sampling undertaken in the north and west of the National
Park. This additional sampling could determine whether the limited distribution and genetic
impoverishment detected in the south is indicative of the entire site, and confirm whether my
concerns regarding the genetic health and size of the population are warranted.
Molecular insights into chiropteran ecology
As reviewed by Burland and Worthington Wilmer (2001), molecular techniques are ideally
suited to the study of chiropterans, a group whose characteristics make them difficult to study
with traditional field-based techniques. As a consequence of these difficulties there are many
baseline ecological factors that remain unknown for chiropterans, particularly tree dwelling
microbats. This fact prompted my investigation of dispersal strategies and social structure in
N. gouldi and N. geoffroyi. Male biased dispersal and female philopatry was evident within
populations of N. gouldi, a trend not revealed for N. geoffroyi. I acknowledge that higher
abundance resulting in potentially less representative sampling, and high rates of dispersal,
may have masked the identification of male biased dispersal for N. geoffroyi. This strategy
may still be revealed for N. geoffroyi if future studies conduct more intensive sampling at
fewer locations and assess male- and female-mediated gene flow through the assessment of
mtDNA or y-chromosome markers respectively.
The assessment of social structure in both species indicated that female relatives may form
bonds that play a significant role in the species behavioural ecology. The assessment of social
structure within N. geoffroyi roosts also raised the possible role of kin selection and reciprocal
altruism in cooperative roosting behaviour. Several studies have documented kin selection in
chiropteran cooperative behaviour; for example, Desmodus rotundus displays a correlation
between relatedness and both grooming and food sharing (blood regurgitation) (Wilkinson
1984, 1986). Similarly, Rhinolophus ferrumequinum has been shown to display kin selection
112
in cooperative foraging behaviour (Rossiter et al. 2002). Tree dwelling species pose many
challenges for conducting joint observational, telemetric and social studies, particularly when
they reside within dead or aging trees that can be inaccessible or dangerous for researchers to
access. N. geoffroyi represents a prime opportunity in this respect as they frequently roost
within accessible manmade structures such as barns and houses, as demonstrated in this study.
Although one of the roosts sampled in this study was subsequently dislocated due to building
renovations the other two roosts remain, providing the ideal opportunity to conduct further
sociobiology studies such as the examples given above. Due to their propensity to form social
groups and the diversity of social behaviour chiropterans represent ideal model organisms for
sociobiology studies exploring the evolution of social and cooperative behaviours. Future
studies capitalising on the suitability of N. geoffroyi may yield valuable insights into the
evolution of kin selection, reciprocal altruism and sociality amongst mammals.
Conclusion
This study has contributed to the growing wealth of chiropteran ecological knowledge gained
through the application of molecular techniques and further promotes continued efforts to
capitalise upon these tools for the study of cryptic chiropterans. Chiroptera is a vast order
displaying diverse ecologies, the continued application of molecular studies will, no doubt,
reveal a rich tapestry of ecological strategies and behaviour, shedding much light on the
evolution of mammalian behaviour. More importantly, this study has contributed valuable
information for the conservation of Chiroptera, the second largest mammalian order, by
identifying a range of potential impacts that can result from habitat fragmentation. As far as I
am aware it is the first chiropteran study to utilise microsatellite markers to address the
influence of habitat fragmentation on a host of factors including population connectivity,
genetic diversity, inbreeding and relatedness, and changes to demography. In doing so my
research has drawn attention to the potential threat posed by habitat fragmentation to
chiropterans, which in extreme cases may jeopardise population and species persistence.
These issues are of vital importance if we are to conserve global chiropteran fauna, maintain
healthy ecosystems and manage chiropteran range shifts due to climate change. This field of
study is still in its infancy but I hope that this example serves to raise a flag prompting further
research into the magnitude and prevalence of chiropteran vulnerability to the process of
habitat fragmentation.
113
References
Albrecht, L., C. Meyer, and E. Kalko. 2007. Differential mobility in two small phyllostomid
bats, Artibeus watsoni and Micronycteris microtis, in a fragmented neotropical
landscape. Acta Theriologica 52:141-149.
Alho, J. S., K. Välimäki, and J. Merilä. 2010. Rhh: an R extension for estimating multilocus
heterozygosity and heterozygosity–heterozygosity correlation. Molecular Ecology
Resources 10:720-722.
Amos, W., J. Worthington Wilmer, K. Fullard, T. M. Burg, J. P. Croxall, D. Bloch, and T.
Coulson. 2001. The influence of parental relatedness on reproductive success.
Proceedings of the Royal Society of London. Series B: Biological Sciences 268:2021-
2027.
Antongiovanni, M., and J. P. Metzger. 2005. Influence of matrix habitats on the occurrence of
insectivorous bird species in Amazonian forest fragments. Biological Conservation
122:441-451.
Armstrong, K. N. 2009. Phylogeographic structure in Rhinonicteris aurantia (Chiroptera:
Hipposideridae): implications for conservation. Acta Chiropterologica 8:63-81.
Arnold, B. D. 2007. Population structure and sex-biased dispersal in the forest dwelling
vespertilionid bat, Myotis septentrionalis. The American Midland Naturalist 157:374-
384.
Baillie, J. E. M., C. Hilton-Taylor, and S. N. Stuart, editors. 2004. 2004 IUCN Red List of
Threatened Species. A global species assessment. IUCN, Gland, Switzerland and
Cambridge, UK.
Banks, S. C., G. R. Finlayson, S. J. Lawson, D. B. Lindenmayer, D. Paetkau, S. J. Ward, and
A. C. Taylor. 2005a. The effects of habitat fragmentation due to forestry plantation
establishment on the demography and genetic variation of a marsupial carnivore,
Antechinus agilis. Biological Conservation 122:581-597.
Banks, S. C., S. J. Ward, D. B. Lindenmayer, G. R. Finlayson, S. J. Lawson, and A. C.
Taylor. 2005b. The effects of habitat fragmentation on the social kin structure and
mating system of the agile antechinus, Antechinus agilis. Molecular Ecology 14:1789-
1801.
114
Bennett, A. F. 2003. Linkages in the Landscape: The Role of Corridors and Connectivity in
Wildlife Conservation. Page xiv + 254. IUCN, Gland, Switzerland and Cambridge,
UK.
Bernard, E., and M. B. Fenton. 2003. Bat mobility and roosts in a fragmented landscape in
central Amazonia, Brazil. Biotropica 35:262-277.
Bernard, E., and M. B. Fenton. 2007. Bats in a fragmented landscape: species composition,
diversity and habitat interactions in savannas of Santarém, central Amazonia, Brazil.
Biological Conservation 134:332-343.
Berry, O., M. D. Tocher, and S. D. Sarre. 2004. Can assignment tests measure dispersal?
Molecular Ecology 13:551-561.
Bohonak, A. J. 2002. IBD (Isolation by Distance): a program for analyses of isolation by
distance. Journal of Heredity 93:153-154.
Brigham, R. M., R. L. Francis, and S. Hamdorf. 1997. Microhabitat use by two species of
Nyctophilus bats: a test of ecomorphology theory. Australian Journal of Zoology
45:553-560.
Broquet, T., and E. J. Petit. 2009. Molecular estimation of dispersal for ecology and
population genetics. Annual Review of Ecology, Evolution, and Systematics 40:193-
216.
Brown, J. H., and A. Kodric-Brown. 1977. Turnover rates in insular biogeography: effect of
immigration on extinction. Ecology 58:445-449.
Bryja, J., P. Kanuch, A. Fornuskova, T. Bartonicka, and Z. Rehak. 2009. Low population
genetic structuring of two cryptic bat species suggests their migratory behaviour in
continental Europe. Biological Journal of the Linnean Society 96:103-114.
Burkey, T. V. 1989. Extinction in Nature Reserves: The effect of fragmentation and the
importance of migration between reserve fragments. Oikos 55:75-81.
Burland, T. M., E. M. Barratt, M. A. Beaumont, and P. A. Racey. 1999. Population genetic
structure and gene flow in a gleaning bat, Plecotus auritus. Proceedings of the Royal
Society B: Biological Sciences 266:975-980.
Burland, T. M., E. M. Barratt, R. A. Nichols, and P. A. Racey. 2001. Mating patterns,
relatedness and the basis of natal philopatry in the brown long-eared bat, Plecotus
auritus. Molecular Ecology 10:1309-1321.
Burland, T. M., and J. Worthington Wilmer. 2001. Seeing in the dark: molecular approaches
to the study of bat populations. Biological Reviews 76:389-409.
115
Callens, T. O. M., P. Galbusera, E. Matthysen, E. Y. Durand, M. Githiru, J. R. Huyghe, and
L. U. C. Lens. 2011. Genetic signature of population fragmentation varies with
mobility in seven bird species of a fragmented Kenyan cloud forest. Molecular
Ecology 20:1829-1844.
Campbell, S., P.-J. Guay, P. J. Mitrovski, and R. Mulder. 2009. Genetic differentiation among
populations of a specialist fishing bat suggests lack of suitable habitat connectivity.
Biological Conservation 142:2657-2664.
Cardillo, M., G. M. Mace, J. L. Gittleman, K. E. Jones, J. Bielby, and A. Purvis. 2008. The
predictability of extinction: biological and external correlates of decline in mammals.
Proceedings of the Royal Society B: Biological Sciences 275:1441-1448.
Castella, V., M. Ruedi, L. Excoffier, C. Ibáñez, R. Arlettaz, and J. Hausser. 2000. Is the
Gibraltar Strait a barrier to gene flow for the bat Myotis myotis (Chiroptera:
Vespertilionidae)? Molecular Ecology 9:1761-1772.
Caughley, G. 1994. Directions in conservation biology. Journal of Animal Ecology 63:215-
244.
Chaverri, G., C. J. Schneider, and T. H. Kunz. 2008. Mating system of the tent-making bat
Artibeus watsoni (Chiroptera: Phyllostomidae). Journal of Mammalogy 89:1361-1371.
Chen, C., E. Durand, F. Forbes, and O. Francois. 2007. Bayesian clustering algorithms
ascertaining spatial population structure: a new computer program and a comparison
study. Molecular Ecology Notes 7:747-756.
Chen, S. F., G. Jones, and S. J. Rossiter. 2008. Sex-biased gene flow and colonization in the
Formosan lesser horseshoe bat: inference from nuclear and mitochondrial markers.
Journal of Zoology 274:207-215.
Churchill, S. 2008. Australian Bats. Jacanda Books, an imprint of Allen & Unwin, Crows
Nest, NSW.
Clutton-Brock, T. H. 1989. Review lecture: mammalian mating systems. Proceedings of the
Royal Society of London. B. Biological Sciences 236:339-372.
Coltman, D. W., J. G. Pilkington, J. A. Smith, and J. M. Pemberton. 1999. Parasite-mediated
selection against inbred soay sheep in a free-living, island population. Evolution
53:1259-1267.
Corander, J., and P. Marttinen. 2006. Bayesian identification of admixture events using
multilocus molecular markers. Molecular Ecology 15:2833-2843.
Corander, J., P. Waldmann, and M. J. Sillanpaa. 2003. Bayesian analysis of genetic
differentiation between populations. Genetics 163:367-374.
116
Cornuet, J. M., and G. Luikart. 1996. Description and power analysis of two tests for
Detecting recent population bottlenecks from allele frequency data. Genetics
144:2001-2014.
Cosson, J.-F., J.-M. Pons, and D. Masson. 1999. Effects of forest fragmentation on
frugivorous and nectarivorous bats in French Guiana. Journal of Tropical Ecology
15:515-534.
Crandall, K. A., O. R. P. Bininda-Emonds, G. M. Mace, and R. K. Wayne. 2000. Considering
evolutionary processes in conservation biology. Trends in Ecology & Evolution
15:290-295.
Cushman, S. A. 2006. Effects of habitat loss and fragmentation on amphibians: A review and
prospectus. Biological Conservation 128:231-240.
Davidson, A. D., M. J. Hamilton, A. G. Boyer, J. H. Brown, and G. Ceballos. 2009. Multiple
ecological pathways to extinction in mammals. Proceedings of the National Academy
of Sciences 106:10702-10705.
Davies, K. F., C. R. Margules, and J. F. Lawrence. 2000. Which traits of species predict
population declines in experimental forest fragments? Ecology 81:1450-1461.
Debinski, D. M., and R. D. Holt. 2000. A survey and overview of habitat fragmentation
experiments. Conservation Biology 14:342-355.
Dechmann, D., E. Kalko, and G. Kerth. 2007. All-offspring dispersal in a tropical mammal
with resource defense polygyny. Behavioral Ecology and Sociobiology 61:1219-1228.
Delaney, K. S., S. P. D. Riley, and R. N. Fisher. 2010. A rapid, strong, and convergent genetic
response to urban habitat fragmentation in four divergent and widespread vertebrates.
PLoS ONE 5:e12767.
Di Rienzo, A., A. C. Peterson, J. C. Garza, A. M. Valdes, M. Slatkin, and N. B. Freimer.
1994. Mutational processes of simple-sequence repeat loci in human populations.
Proceedings of the National Academy of Sciences 91:3166-3170.
Dobson, S. F. 1982. Competition for mates and predominant juvenile male dispersal in
mammals. Animal Behaviour 30:1183-1192.
DSE. 2004a. EVC/Bioregion benchmark for vegetation quality assessment, Victorian
Volcanic Plain bioregion, EVC 55_61: Plains Grassy Woodland. Department of
Sustainability and Environment, Victoria.
DSE. 2004b. EVC/Bioregion benchmark for vegetation quality assessment, Victorian
Volcanic Plain bioregion, EVC 132_61/62/63: Plains Grassland. Department of
Sustainability and Environment, Victoria.
117
DSE. 2011. Biodiversity Interactive Map - 3.1. Department of Sustainability and
Environment, Victoria.
Duncan, A., G. B. Baker, and N. Montgomery, editors. 1999. The action plan for Australian
Bats. Environment Australia, Canberra.
Earl, D., and B. vonHoldt. 2012. STRUCTURE HARVESTER: a website and program for
visualizing STRUCTURE output and implementing the Evanno method. Conservation
Genetics Resources 4:359-361.
Ellis, M. V., C. R. Williams, and P. Wilson. 1989. Extension to the known range of Gould's
long-eared bat Nyctophilus gouldi Tomes, 1858 (Chiroptera: Vespertilionidae) in New
South Wales. Australian Zoologist 25:79-82.
Estrada, A., and R. Coates-Estrada. 2002. Bats in continuous forest, forest fragments and in
an agricultural mosaic habitat-island at Los Tuxtlas, Mexico. Biological Conservation
103:237-245.
Estrada, A., R. Coates-Estrada, and J. Meritt, Dennis. 1993. Bat species richness and
abundance in tropical rain forest fragments and in agricultural habitats at Los Tuxtlas,
Mexico. Ecography 16:309-318.
Evanno, G., S. Regnaut, and J. Goudet. 2005. Detecting the number of clusters of individuals
using the software structure: a simulation study. Molecular Ecology 14:2611-2620.
Excoffier, L., G. Laval, and S. Schneider. 2005. ARLEQUIN (version 3.0): An integrated
software package for population genetics data analysis. Evolutionary Bioinformatics
Online 1:47-50.
Excoffier, L., and H. E. L. Lischer. 2010. ARLEQUIN suite ver 3.5: a new series of programs
to perform population genetics analyses under Linux and Windows. Molecular
Ecology Resources 10:564-567.
Fahrig, L., and G. Merriam. 1985. Habitat patch connectivity and population survival.
Ecology 66:1762-1768.
Fahrig, L., and J. Paloheimo. 1988. Determinants of local population size in patchy habitats.
Theoretical Population Biology 34:194-213.
Faria, D. 2006. Phyllostomid bats of a fragmented landscape in the north-eastern Atlantic
forest, Brazil. Journal of Tropical Ecology 22:531-542.
ForestrySA. 2003. South east biodiversity corridors strategy. Government of South
Australian, Available from:
http://www.forestry.sa.gov.au/Conservation/BiodiversityCorridors.aspx.
118
Foufopoulos, J., and A. R. Ives. 1999. Reptile extinctions on land-bridge islands: life-history
attributes and vulnerability to extinction. The American Naturalist 153:1-25.
Francois, O., and E. Durand. 2010. Spatially explicit Bayesian clustering models in
population genetics. Molecular Ecology Resources 10:773-784.
Frankham, R. 1995. Conservation genetics. Annual Review of Genetics 29:305-327.
Frankham, R. 1996. Relationship of genetic variation to population size in wildlife.
Conservation Biology 10:1500-1508.
Frankham, R., K. Lees, M. E. Montgomery, P. R. England, E. H. Lowe, and D. A. Briscoe.
1999. Do population size bottlenecks reduce evolutionary potential? Animal
Conservation 2:255-260.
Franklin, I. R., and R. Frankham. 1998. How large must populations be to retain evolutionary
potential? Animal Conservation 1:69-70.
Fullard, J. H., C. Koehler, A. Surlykke, and N. L. McKenzie. 1991. Echolocation ecology and
flight morphology of insectivorous bats (Chiroptera) in South-Western Australia.
Australian Journal of Zoology 39:427-438.
Furmankiewicz, J., and J. Altringham. 2007. Genetic structure in a swarming brown long-
eared bat (Plecotus auritus) population: evidence for mating at swarming sites.
Conservation Genetics 8:913-923.
Galindo-Gonzalez, J., and V. J. Sosa. 2003. Frugivorous bats in isolated trees and riparian
vegetation associated with human-made pastures in a fragmented tropical landscape.
The Southwestern Naturalist 48:579-589.
Gardner, M. G., A. J. Fitch, T. Bertozzi, and A. J. Lowe. 2011. Rise of the machines –
recommendations for ecologists when using next generation sequencing for
microsatellite development. Molecular Ecology Resources 11:1093-1101.
Gehring, T. M., and R. K. Swihart. 2003. Body size, niche breadth, and ecologically scaled
responses to habitat fragmentation: mammalian predators in an agricultural landscape.
Biological Conservation 109:283-295.
Gerlach, G., A. Jueterbock, P. Kraemer, J. Deppermann, and P. Harmand. 2010. Calculations
of population differentiation based on GST and D: forget GST but not all of statistics!
Molecular Ecology 19:3845-3852.
Gibbs, J. P. 1998. Distribution of woodland amphibians along a forest fragmentation gradient.
Landscape Ecology 13:263-268.
Gorresen, P. M., and M. R. Willig. 2004. Landscape responses of bats to habitat
fragmentation in Atlantic Forest of Paraguay. Journal of Mammalogy 85:688-697.
119
Goudet, J. 2001. FSTAT, a program to estimate and test gene diversities and fixation indices
(version 2.9.3), Available from: http://www2.unil.ch/popgen/softwares/fstat.htm.
Grant, J. D. A. 1991. Prey location by two Australian long-eared bats, Nyctophilus gouldi and
N.geoffroyi. Australian Journal of Zoology 39:45-56.
Greenberg, R. 1989. Neophobia, aversion to open space, and ecological plasticity in song and
swamp sparrows. Canadian Journal of Zoology 67:1194-1199.
Guillot, G., R. Leblois, A. Coulon, and A. C. Frantz. 2009. Statistical methods in spatial
genetics. Molecular Ecology 18:4734-4756.
Guillot, G., F. Mortier, and A. Estoup. 2005. GENELAND: a computer package for landscape
genetics. Molecular Ecology Notes 5:712-715.
Hall, L. S., and G. C. Richards. 1979. Bats of eastern Australia. Queensland Museum Booklet
No. 12, Brisbane.
Hannah, L., G. F. Midgley, T. Lovejoy, W. J. Bond, M. Bush, J. C. Lovett, D. Scott, and F. I.
Woodward. 2002. Conservation of biodiversity in a changing climate. Conservation
Biology 16:264-268.
Hanski, I. 1991. Single-species metapopulation dynamics: concepts, models and observations.
Biological Journal of the Linnean Society 42:17-38.
Hanski, I. 1998. Metapopulation dynamics. Nature 396:41-49.
Hayden, M., T. Nguyen, A. Waterman, G. McMichael, and K. Chalmers. 2008. Application
of multiplex-ready PCR for fluorescence-based SSR genotyping in barley and wheat.
Molecular Breeding 21:271-281.
Hebblewhite, M., and D. T. Haydon. 2010. Distinguishing technology from biology: a critical
review of the use of GPS telemetry data in ecology. Philosophical Transactions of the
Royal Society B: Biological Sciences 365:2303-2312.
Heckel, G., C. C. Voigt, F. Mayer, and H. Otto Von. 1999. Extra-harem paternity in the
white-lined bat Saccopteryx bilineata (Emballonuridae). Behaviour 136:1173-1185.
Heller, R., and H. R. Siegismund. 2009. Relationship between three measures of genetic
differentiation GST, DEST and G‘ST: how wrong have we been? Molecular Ecology
18:2080-2083.
Henle, K., K. F. Davies, M. Kleyer, C. Margules, and J. Settele. 2004. Predictors of species
sensitivity to fragmentation. Biodiversity and Conservation 13:207-251.
Hosken, D. J. 1997. Reproduction and the female reproductive cycle of Nyctophilus geoffroyi
and N. major (Chiroptera: Vespertilionidae) from south-western Australia. Australian
Journal of Zoology 45:489-504.
120
Hosken, D. J. 1998. Sperm fertility and skewed paternity during sperm competition in the
Australian long-eared bat Nyctophilus geoffroyi (Chiroptera: Vespertilionidae).
Journal of Zoology 245:93-100.
Johansson, M., and J. Jong. 1996. Bat species diversity in a lake archipelago in central
Sweden. Biodiversity and Conservation 5:1221-1229.
Jones, K. E., A. Purvis, and J. L. Gittleman. 2003. Biological correlates of extinction risk in
bats. The American Naturalist 161:601-614.
Jones, R. N. 1999. Natural and human influences on the distribution and extent of Victorian
lowland grasslands. Pages 19-39 in R. N. Jones, editor. The great plains crash:
proceedings of a conference on Victorian lowland grasslands and grassy woodlands.
Indigenous Flora and Fauna Association, Victorian Nation Parks Association.
Jost, L. O. U. 2008. GST and its relatives do not measure differentiation. Molecular Ecology
17:4015-4026.
Jost, L. O. U. 2009. D vs. GST: Response to Heller and Siegismund (2009) and Ryman and
Leimar (2009). Molecular Ecology 18:2088-2091.
Kalcounis, M. C., and R. M. Brigham. 1994. Impact of predation risk on emergence by little
brown bats, Myotis lucifugus (Chiroptera: Vespertilionidae), from a maternity colony.
Ethology 98:201-209.
Kerth, G. 2008. Causes and consequences of sociality in bats. BioScience 58:737-746.
Kerth, G., F. Mayer, and B. König. 2000. Mitochondrial DNA (mtDNA) reveals that female
Bechstein‘s bats live in closed societies. Molecular Ecology 9:793-800.
Kerth, G., F. Mayer, and E. Petit. 2002a. Extreme sex-biased dispersal in the communally
breeding, nonmigratory Bechstein's bat (Myotis bechsteinii). Molecular Ecology
11:1491-1498.
Kerth, G., and E. Petit. 2005. Colonization and dispersal in a social species, the Bechstein's
bat (Myotis bechsteinii). Molecular Ecology 14:3943-3950.
Kerth, G., K. Safi, and B. Konig. 2002b. Mean colony relatedness is a poor predictor of
colony structure and female philopatry in the communally breeding Bechstein's bat
(Myotis bechsteinii). Behavioral Ecology and Sociobiology 52:203-210.
Kerth, G., M. Wagner, and B. Konig. 2001. Roosting together, foraging apart: information
transfer about food is unlikely to explain sociality in female Bechstein's bats (Myotis
bechsteinii). Behavioral Ecology and Sociobiology 50:283-291.
Kindlmann, P. and F. Burel. 2008. Connectivity measures: a review. Landscape Ecology
23:879-890.
121
Klingbeil, B. T., and M. R. Willig. 2009. Guild-specific responses of bats to landscape
composition and configuration in fragmented Amazonian rainforest. Journal of
Applied Ecology 46:203-213.
Konovalov, D. A., C. Manning, and M. T. Henshaw. 2004. KINGROUP: a program for
pedigree relationship reconstruction and kin group assignments using genetic markers.
Molecular Ecology Notes 4:779-782.
Kunz, T. H., E. Braun de Torrez, D. Bauer, T. Lobova, and T. H. Fleming. 2011. Ecosystem
services provided by bats. Annals of the New York Academy of Sciences 1223:1-38.
Lacy, R. 1997. Importance of genetic variation to the viability of mammalian populations.
Journal of Mammalogy 78:320-335.
Lancaster, M. L., A. C. Taylor, S. J. B. Cooper, and S. M. Carthew. 2011. Limited ecological
connectivity of an arboreal marsupial across a forest/plantation landscape despite
apparent resilience to fragmentation. Molecular Ecology 20:2258-2271.
Latch, E., G. Dharmarajan, J. Glaubitz, and O. Rhodes. 2006. Relative performance of
Bayesian clustering software for inferring population substructure and individual
assignment at low levels of population differentiation. Conservation Genetics 7:295-
302.
Laurance, W. F. 1990. Comparative responses of five arboreal marsupials to tropical forest
fragmentation. Journal of Mammalogy 71:641-653.
Laurance, W. F. 1991. Ecological correlates of extinction proneness in Australian tropical rain
forest mammals. Conservation Biology 5:79-89.
Laurance, W. F., J. L. C. Camargo, R. C. C. Luizao, S. G. Laurance, S. L. Pimm, E. M.
Bruna, P. C. Stouffer, G. Bruce Williamson, J. Benitez-Malvido, H. L. Vasconcelos,
K. S. Van Houtan, C. E. Zartman, S. A. Boyle, R. K. Didham, A. Andrade, and T. E.
Lovejoy. 2011. The fate of Amazonian forest fragments: a 32-year investigation.
Biological Conservation 144:56-67.
Laurance, W. F., T. E. Lovejoy, H. L. Vasconcelos, E. M. Bruna, R. K. Didham, P. C.
Stouffer, C. Gascon, R. O. Bierregaard, S. G. Laurance, and E. Sampaio. 2002.
Ecosystem decay of Amazonian forest fragments: a 22-year investigation.
Conservation Biology 16:605-618.
Law, B. S., J. Anderson, and M. Chidel. 1999. Bat communities in a fragmented forest
landscape on the south-west slopes of New South Wales, Australia. Biological
Conservation 88:333-345.
122
Lehtinen, R., and J. Ramanamanjato. 2006. Effects of rainforest fragmentation and correlates
of local extinction in a herpetofauna from Madagascar. Applied Herpetology 3:95-
110.
Lindenmayer, D. B., and R. Peakall. 2000. The Tumut experiment - integrating demographic
and genetic studies to unravel fragmentation effects: a case study of the native bush rat
in A. G. Young, and G. M. Clarke, editors. Genetics, demography and viability of
fragmented populations. Cambridge University Press, Cambridge.
Luikart, G., F. W. Allendorf, J. M. Cornuet, and W. B. Sherwin. 1998. Distortion of allele
frequency distributions provides a test for recent population bottlenecks. Journal of
Heredity 89:238-247.
Lumsden, L. F., and A. F. Bennett. 2005. Scattered trees in rural landscapes: foraging habitat
for insectivorous bats in south-eastern Australia. Biological Conservation 122:205-
222.
Lumsden, L. F., A. F. Bennett, and J. E. Silins. 2002a. Location of roosts of the lesser long-
eared bat Nyctophilus geoffroyi and Gould's wattled bat Chalinolobus gouldii in a
fragmented landscape in south-eastern Australia. Biological Conservation 106:237-
249.
Lumsden, L. F., A. F. Bennett, and J. E. Silins. 2002b. Selection of roost sites by the lesser
long-eared bat (Nyctophilus geoffroyi) and Gould's wattled bat (Chalinolobus gouldii)
in south-eastern Australia. Journal of Zoology 257:207-218.
Lunney, D., J. Barker, D. Priddel, and M. Oconnell. 1988. Roost selection by Gould's long-
eared bat, Nyctophilus gouldi Tomes (Chiroptera, Vespertilionidae), in logged forest
on the south coast of New South-Wales. Wildlife Research 15:375-384.
Mac Nally, R., and A. F. Bennett. 1997. Species-specific predictions of the impact of habitat
fragmentation: Local extinction of birds in the box-ironbark forests of central Victoria,
Australia. Biological Conservation 82:147-155.
Mac Nally, R., and G. W. Brown. 2001. Reptiles and habitat fragmentation in the box-
ironbark forests of central Victoria, Australia: predictions, compositional change and
faunal nestedness. Oecologia 128:116-125.
McCracken, G. F., M. K. McCracken, and A. T. Vawter. 1994. Genetic structure in migratory
populations of the bat Tadarida brasiliensis mexicana. Journal of Mammalogy
75:500-514.
123
McCracken, G. F., and G. S. Wilkinson. 2000. Bat mating systems. Pages 321-362 in P. H.
Krutzsch, and E. G. Creighton, editors. Reproductive biology of bats. Academic Press,
New York.
Medina, A., C. A. Harvey, D. S. Merlo, S. Vílchez, and B. Hernández. 2007. Bat diversity and
movement in an agricultural landscape in Matiguás, Nicaragua. Biotropica 39:120-
128.
Meirmans, P. G., and P. W. Hedrick. 2011. Assessing population structure: FST and related
measures. Molecular Ecology Resources 11:5-18.
Metheny, J. D., M. C. Kalcounis-Rueppell, K. J. Bondo, and R. M. Brigham. 2008. A genetic
analysis of group movement in an isolated population of tree-roosting bats.
Proceedings of the Royal Society B: Biological Sciences 275:2265-2272.
Meyer, C. F. J., J. Fründ, W. P. Lizano, and E. K. Kalko. 2008. Ecological correlates of
vulnerability to fragmentation in Neotropical bats. Journal of Applied Ecology
45:381-391.
Meyer, C. F. J., E. K. V. Kalko, and G. Kerth. 2009. Small-scale fragmentation effects on
local genetic diversity in two phyllostomid bats with different dispersal abilities in
Panama. Biotropica 41:95-102.
Mickleburgh, S. P., A. M. Hutson, and P. A. Racey. 2002. A review of the global
conservation status of bats. Oryx 36:18-34.
Montiel, S., A. Estrada, Le, oacute, and P. n. 2006. Bat assemblages in a naturally fragmented
ecosystem in the Yucatan Peninsula, Mexico: species richness, diversity and spatio-
temporal dynamics. Journal of Tropical Ecology 22:267-276.
Moritz, C. 1994. Defining 'Evolutionary Significant Units' for conservation. Trends in
Ecology & Evolution 9:373-375.
Nathan, R., G. Perry, J. T. Cronin, A. E. Strand, and M. L. Cain. 2003. Methods for
estimating long-distance dispersal. Oikos 103:261-273.
National Parks and Wildlife Act 1972. Department of Environment and Natural Resources,
South Australia.
Norberg, U. M., and J. M. V. Rayner. 1987. Ecological morphology and flight in bats
(Mammalia; Chiroptera): wing adaptations, flight performance, foraging strategy and
echolocation. Philosophical Transactions of the Royal Society of London. Series B,
Biological Sciences 316:335-427.
O'Brien, S. J., and J. F. Evermann. 1988. Interactive influence of infectious disease and
genetic diversity in natural populations. Trends in Ecology & Evolution 3:254-259.
124
O'Grady, J. J., D. H. Reed, B. W. Brook, and R. Frankham. 2004. What are the best correlates
of predicted extinction risk? Biological Conservation 118:513-520.
O'neill, M., and R. Taylor. 1986. Observations on the flight patterns and foraging behavior of
Tasmanian bats. Australian Wildlife Research 13:427-432.
Opdam, P., and D. Wascher. 2004. Climate change meets habitat fragmentation: linking
landscape and biogeographical scale levels in research and conservation. Biological
Conservation 117:285-297.
Ortega, J., J. E. Maldonado, G. S. Wilkinson, H. T. Arita, and R. C. Fleischer. 2003. Male
dominance, paternity, and relatedness in the Jamaican fruit-eating bat (Artibeus
jamaicensis). Molecular Ecology 12:2409-2415.
Paetkau, D., R. Slade, M. Burden, and A. Estoup. 2004. Genetic assignment methods for the
direct, real-time estimation of migration rate: a simulation-based exploration of
accuracy and power. Molecular Ecology 13:55-65.
Peakall, R. O. D., and P. E. Smouse. 2006. GENALEX 6: genetic analysis in Excel.
Population genetic software for teaching and research. Molecular Ecology Notes
6:288-295.
Petit, E., F. Balloux, and J. Goudet. 2001. Sex-biased dispersal in a migratory bat: a
characterization using sex-specific demographic parameters. Evolution 55:635-640.
Petit, E., and F. Mayer. 1999. Male dispersal in the noctule bat (Nyctalus noctula): where are
the limits? Proceedings of the Royal Society of London. Series B: Biological Sciences
266:1717-1722.
Petri, B., S. Pääbo, A. Von Haeseler, and D. Tautz. 1997. Paternity assessment and population
subdivision in a natural population of the larger mouse-eared bat Myotis myotis.
Molecular Ecology 6:235-242.
Piry, S., A. Alapetite, J. M. Cornuet, D. Paetkau, L. Baudouin, and A. Estoup. 2004.
GENECLASS2: A software for genetic assignment and first-generation migrant
detection. Journal of Heredity 95:536-539.
Piry, S., G. Luikart, and J. M. Cornuet. 1999. BOTTLENECK: a computer program for
detecting recent reductions in the effective size using allele frequency data. Journal of
Heredity 90:502-503.
Pritchard, J. K., M. Stephens, and P. Donnelly. 2000. Inference of population structure using
multilocus genotype data. Genetics 155:945-959.
125
Pumo, D. E., E. Z. Goldin, B. Elliot, C. J. Phillips, and H. H. Genoways. 1988. Mitochondrial
DNA polymorphism in three Antillean island populations of the fruit bat, Artibeus
jamaicensis. Mol Biol Evol 5:79-89.
Queller, D. C., and K. F. Goodnight. 1989. Estimating relatedness using genetic markers.
Evolution 43:258-275.
R Core Development Team. 2011. R: A language and environment for statistical computing,
R Foundation for Statistical Computing, Vienna, Austria.
Racey, P. A., and S. M. Swift. 1981. Variations in gestation length in a colony of pipistrelle
bats (Pipistrellus pipistrellus) from year to year. Journal of Reproduction and Fertility
61:123-129.
Rannala, B., and J. L. Mountain. 1997. Detecting immigration by using multilocus genotypes.
Proceedings of the National Academy of Sciences 94:9197-9201.
Raymond, M., and F. Rousset. 1995. GENEPOP (version 1.2): population genetics software
for exact tests and ecumenicism. Journal of Heredity 86:248-249.
Reardon, T. B., and S. C. Flavel 1987. A guide to the bats of South Australia. South
Australian Museum, Adelaide.
Reed, D. H. 2004. Extinction risk in fragmented habitats. Animal Conservation 7:181-191.
Reed, D. H., and R. Frankham. 2003. Correlation between fitness and genetic diversity.
Conservation Biology 17:230-237.
Reed, D. H., J. J. O'Grady, B. W. Brook, J. D. Ballou, and R. Frankham. 2003. Estimates of
minimum viable population sizes for vertebrates and factors influencing those
estimates. Biological Conservation 113:23-34.
Rhodes, M. P. 2002. Assessment of sources of variance and patterns of overlap in
microchiropteran wing morphology in southeast Queensland, Australia. Canadian
Journal of Zoology 80:450.
Rice, W. R. 1989. Analyzing tables of statistical tests. Evolution 43:223-225.
Rivers, N. M., R. K. Butlin, and J. D. Altringham. 2005. Genetic population structure of
Natterer's bats explained by mating at swarming sites and philopatry. Molecular
Ecology 14:4299-4312.
Rossiter, S. J., G. Jones, R. D. Ransome, and E. M. Barratt. 2000. Parentage, reproductive
success and breeding behaviour in the greater horseshoe bat (Rhinolophus
ferrumequinum). Proceedings of the Royal Society of London. Series B: Biological
Sciences 267:545-551.
126
Rossiter, S. J., G. Jones, R. D. Ransome, and E. M. Barratt. 2002. Relatedness structure and
kin-biased foraging in the greater horseshoe bat (Rhinolophus ferrumequinum).
Behavioral Ecology and Sociobiology 51:510-518.
Rossiter, S. J., A. Zubaid, A. Mohd-Adnan, M. J. Struebig, T. H. Kunz, S. Gopal, E. J. Petit,
and T. Kingston. 2012. Social organization and genetic structure: insights from
codistributed bat populations. Molecular Ecology 21:647-661.
Rowe, G., and T. J. C. Beebee. 2007. Defining population boundaries: use of three Bayesian
approaches with microsatellite data from British natterjack toads (Bufo calamita).
Molecular Ecology 16:785-796.
Ruedi, M., and V. Castella. 2003. Genetic consequences of the ice ages on nurseries of the bat
Myotis myotis: a mitochondrial and nuclear survey. Molecular Ecology 12:1527-1540.
Ryman, N., and O. Leimar. 2009. GST is still a useful measure of genetic differentiation — a
comment on Jost's D. Molecular Ecology 18:2084-2087.
Safi, K., and G. Kerth. 2004. A comparative analysis of specialization and extinction risk in
temperate-zone bats. Conservation Biology 18:1293-1303.
Salgueiro, P., J. Palmeirim, M. Ruedi, and M. Coelho. 2008. Gene flow and population
structure of the endemic Azorean bat (Nyctalus azoreum) based on microsatellites:
implications for conservation. Conservation Genetics 9:1163-1171.
Saunders, D. A., R. J. Hobbs, and C. R. Margules. 1991. Biological consequences of
ecosystem fragmentation: a review. Conservation Biology 5:18-32.
Schlosser, J., J. Dubach, T. Garner, B. Araya, M. Bernal, A. Simeone, K. Smith, and R.
Wallace. 2009. Evidence for gene flow differs from observed dispersal patterns in the
Humboldt penguin, Spheniscus humboldti. Conservation Genetics 10:839-849.
Schulze, M. D., N. E. Seavy, and D. F. Whitacre. 2000. A comparison of the phyllostomid bat
assemblages in undisturbed Neotropical forest and in forest fragments of a slash-and-
burn farming mosaic in Peten, Guatemala. Biotropica 32:174-184.
Shaffer, M. L. 1981. Minimum population sizes for species conservation. BioScience 31:131-
134.
Sinclair, E. A., N. J. Webb, A. D. Marchant, and C. R. Tidemann. 1996. Genetic variation in
the little red flying-fox Pteropus scapulatus (Chiroptera: Pteropodidae): implications
for management. Biological Conservation 76:45-50.
Smouse, P. E., and R. Peakall. 1999. Spatial autocorrelation analysis of individual multiallele
and multilocus genetic structure. Heredity 82:561-573.
127
Sork, V. L., and L. Waits. 2010. Contributions of landscape genetics – approaches, insights,
and future potential. Molecular Ecology 19:3489-3495.
Speakman, J. R., N. Irwin, N. Tallach, and R. Stone. 1999. Effect of roost size on the
emergence behaviour of pipistrelle bats. Animal Behaviour 58:787-795.
Spielman, D., B. W. Brook, D. A. Briscoe, and R. Frankham. 2004. Does inbreeding and loss
of genetic diversity decrease disease resistance? Conservation Genetics 5:439-448.
Storfer, A., M. A. Murphy, S. F. Spear, R. Holderegger, and L. P. Waits. 2010. Landscape
genetics: where are we now? Molecular Ecology 19:3496-3514.
Storz, J. F., H. R. Bhat, and T. H. Kunz. 2001. Genetic consequences of polygyny and social
structure in an Indian fruit bat, Cynopterus sphinx. I. Inbreeding, outbreeding, and
population subdivision. Evolution 55:1215-1223.
Stow, A. J., and P. Sunnucks. 2004. Inbreeding avoidance in Cunningham's skinks (Egernia
cunninghami) in natural and fragmented habitat. Molecular Ecology 13:443-447.
Stow, A. J., P. Sunnucks, D. A. Briscoe, and M. G. Gardner. 2001. The impact of habitat
fragmentation on dispersal of Cunningham‘s skink (Egernia cunninghami): evidence
from allelic and genotypic analyses of microsatellites. Molecular Ecology 10:867-878.
Struebig, M. J., T. Kingston, E. J. Petit, S. C. Le Comber, A. Zubaid, A. Mohd-Adnan, and S.
J. Rossiter. 2011. Parallel declines in species and genetic diversity in tropical forest
fragments. Ecology Letters 14:582-590.
Struebig, M. J., T. Kingston, A. Zubaid, A. Mohd-Adnan, and S. J. Rossiter. 2008.
Conservation value of forest fragments to Palaeotropical bats. Biological Conservation
141:2112-2126.
Tidemann, C. R. 1993. Reproduction in the bats Vespadelus vulturnus, V. regulus and V.
darlingtoni (Microchiroptera, Vespertilionidae) in coastal south-eastern Australia.
Australian Journal of Zoology 41:21-35.
Tscharntke, T., I. Steffan-Dewenter, A. Kruess, and C. Thies. 2002. Characteristics of insect
populations on habitat fragments: A mini review. Ecological Research 17:229-239.
Turbill, C. 2006. Roosting and thermoregulatory behaviour of male Gould's long-eared bats,
Nyctophilus gouldi: energetic benefits of thermally unstable tree roosts. Australian
Journal of Zoology 54:57-60.
Turbill, C., and F. Geiser. 2006. Thermal physiology of pregnant and lactating female and
male long-eared bats, Nyctophilus geoffroyi and N. gouldi. Journal of Comparative
Physiology B: Biochemical, Systemic, and Environmental Physiology 176:165-172.
128
Van Oosterhout, C., W. F. Hutchinson, D. P. M. Wills, and P. Shipley. 2004. MICRO-
CHECKER: software for identifying and correcting genotyping errors in microsatellite
data. Molecular Ecology Notes 4:535-538.
Veith, M., N. Beer, A. Kiefer, J. Johannesen, and A. Seitz. 2004. The role of swarming sites
for maintaining gene flow in the brown long-eared bat (Plecotus auritus). Heredity
93:342-349.
Vestjens, W., and L. Hall. 1977. Stomach contents of forty-two species of bats from the
Australasian region. Australian Wildlife Research 4:25-35.
Viveiros de Castro, E. B., and F. A. S. Fernandez. 2004. Determinants of differential
extinction vulnerabilities of small mammals in Atlantic forest fragments in Brazil.
Biological Conservation 119:73-80.
Wang, Y., J. Zhang, K. J. Feeley, P. Jiang, and P. Ding. 2009. Life-history traits associated
with fragmentation vulnerability of lizards in the Thousand Island Lake, China.
Animal Conservation 12:329-337.
Watling, J. I., and M. A. Donnelly. 2007. Multivariate correlates of extinction proneness in a
naturally fragmented landscape. Diversity and Distributions 13:372-378.
Webb, N. J., and C. R. Tidemann. 1996. Mobility of Australian flying-foxes, Pteropus spp.
(Megachiroptera): evidence from genetic variation. Proceedings: Biological Sciences
263:497-502.
Weyandt, S. E., R. A. Van Den Bussche, M. J. Hamilton, and D. M. Leslie. 2005. Unraveling
the effects of sex and dispersal: Ozark big-eared bat (Corynorhinus townsendii ingens)
conservation genetics. Journal of Mammalogy 86:1136-1143.
Whitlock, M. C. 2011. G'st and D do not replace Fst. Molecular Ecology 20:1083-1091.
Wilcox, B. A., and D. D. Murphy. 1985. Conservation strategy: the effects of fragmentation
on extinction. The American Naturalist 125:879-887.
Wilde, C. J., M. A. Kerr, C. H. Knight, and P. A. Racey. 1995. Lactation in vespertilionid
bats. Symposium of the Zoological Society of London 67:139-149.
Wilkinson, G. S. 1984. Reciprocal food sharing in the vampire bat. Nature 308:181-184.
Wilkinson, G. S. 1986. Social grooming in the common vampire bat, Desmodus rotundus.
Animal Behaviour 34:1880-1889.
Wilkinson, G. S. 1988. Reciprocal altruism in bats and other mammals. Ethology and
Sociobiology 9:85-100.
Wilkinson, G. S. 1992a. Communal nursing in the evening bat, Nycticeius humeralis.
Behavioral Ecology and Sociobiology 31:225-235.
129
Wilkinson, G. S. 1992b. Information transfer at evening bat colonies. Animal Behaviour
44:501-518.
Wilson, D. E., and D. M. Reeder. 2005. Mammal species of the world: a taxonomic and
geographic reference. John Hopkins University Press, Baltimore, Maryland.
Worthington Wilmer, J., L. Hall, E. Barratt, and C. Moritz. 1999. Genetic structure and male-
mediated gene flow in the ghost bat (Macroderma gigas). Evolution 53:1582-1591.
Worthington Wilmer, J., C. Moritz, L. Hall, and J. Toop. 1994. Extreme population
structuring in the threatened ghost bat, Macroderma gigas: evidence from
mitochondrial DNA. Proceedings: Biological Sciences 257:193-198.