Landsat-scale observation and monitoring of global land ... 2/PGon… · Landsat-scale observation...
42
Landsat-scale observation and monitoring of global land cover: progress and experiences from China Peng Gong Center for Earth System Science, Tsinghua University And Department of Environmental Science, Policy and Management, University of California, Berkeley April 15, 2013 3 rd GOFC-GOLD Land Monitoring Symposium, Wageningen, The Netherlands
Transcript of Landsat-scale observation and monitoring of global land ... 2/PGon… · Landsat-scale observation...

Landsat-scale observation and
monitoring of global land cover: progress and experiences from China
Peng Gong Center for Earth System Science, Tsinghua University
And Department of Environmental Science, Policy and Management, University of California, Berkeley
April 15, 2013 3rd GOFC-GOLD Land Monitoring Symposium,
Wageningen, The Netherlands

Acknowledgements
• Le Yu, Yuanyuan Zhao, Luanyun Hu, Qinchuan Xin, Nicholas Clinton, Tsinghua University
• Lu Liang, Yanlei Chen, Liheng Zhong, UC Berkeley
• Zhenguo Niu, Jie Wang, Lei Wang, Peng Zhu, Wei Fu, Huabing Huang, Institute of Remote Sensing and Digital Earth, CAS
• Congcong Li, Yue Xu, Xueyan Li, Jin Chen, Beijing Normal University, China
• Fangdi Sun, Nanjing University • Jun Chen, National Geomatics Center,
China • Zhiliang Zhu, US Geological Survey
Cropland
Validation
Algorithm
Wetland Change
Forest
Settlement

Products Completed and in progress
Cropland
Validation
Algorithm
Wetland Change
Forest
Settlement
Land cover
Completion Time
Plan for Completion
China Global
2011 Global
2013
China Global
2011 2012
Further Improvement
GA GM
2010 On going
2015
2011 2012 2012
2000 GLC In 2013
FROM-GC
2013
China Global
China Global
2013 Global
2000 FC 2013 On going
China Global
2013 On going
2014
FROM-GLC FROM-SEG FROM-AGG
Scope of Work
People in Charge
Niu ZG Zhu P
Liang L Zhao YY
Wang Jie Clinton N
Gong P Yu L
Yu L Zhong LH
Xin QC Li CC
Gong P Wang L
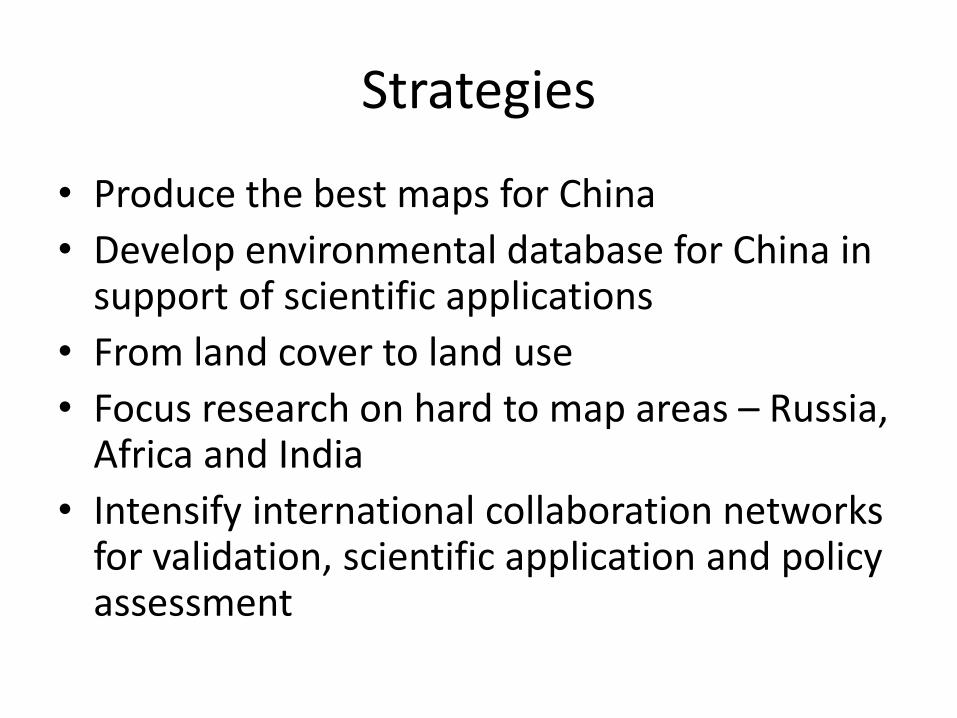
Strategies
• Produce the best maps for China
• Develop environmental database for China in support of scientific applications
• From land cover to land use
• Focus research on hard to map areas – Russia, Africa and India
• Intensify international collaboration networks for validation, scientific application and policy assessment

From avian influenza research to China’s wetland maps
2000 – Landsat TM 1990 – Landsat TM 1978 – Landsat MSS 2008 – CBERS 2010 – In progress (to be completed this month)
For references: Niu, Gong, Cheng et al., 2009 Gong, Niu, Cheng et al., 2010 Niu, et al., 2012


From 1 km global potential wetland mapping to 30 m wetland mapping
Natural Suitability Predicted by BRT
Modified by Human Converted areas

From 1 km global potential wetland mapping to 30 m wetland mapping
Modelled Local Water Balance methods
Interpolated Modelled Groundwater Table Method Fan et al, 2013
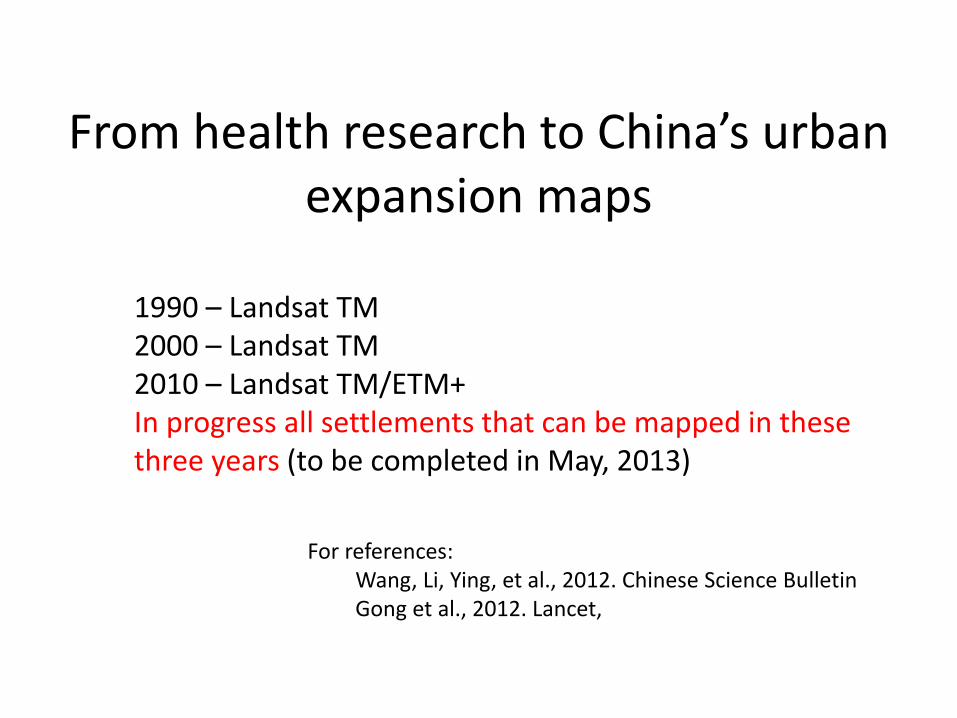
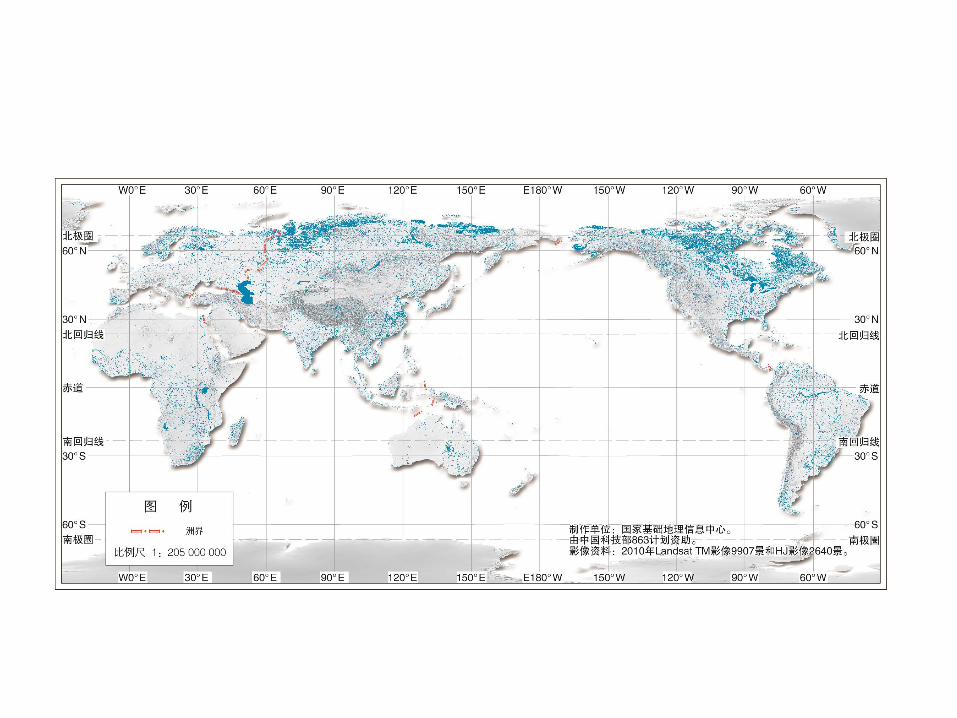
From health research to China’s urban expansion maps
1990 – Landsat TM 2000 – Landsat TM 2010 – Landsat TM/ETM+ In progress all settlements that can be mapped in these three years (to be completed in May, 2013)
For references: Wang, Li, Ying, et al., 2012. Chinese Science Bulletin Gong et al., 2012. Lancet,


82% cities are developing downhill?

Three existing 30m land cover map products
FROM-GLC – only used Landsat TM or ETM+ data FROM-GLC-SEG used Landsat, 250m MODIS 16 day time series and other bioclimatic data products FROM-GLC-AGG aggregates previous two products, NOAA night light impervious surface area and Boston/Wisconsin urban land products FROM-GLC-MetaPrediciton in progress (scheduled to complete in June 2013)
All three products downloadable from data.ess.tsinghua.edu.cn

http://data.ess.tsinghua.edu.cn/
Gong et al., 2013. Finer resolution observation and
monitoring of global land cover: first mapping results
with Landsat TM and ETM+ data. IJRS, 34(7): 2607-
2654.
20 March, 2013 - 15 April, 2013

Training samples
Test samples Hexagon partition based systematic unaligned sampling Gong et al., 2013. IJRS

30 m resolution global land cover mapping

FROM-GLC (Accuracy: 63.72%)
Gong et al., 2013. IJRS

FROM-GLC-SEG, a segmentation-based multi-resolution integration
• Spatial down-scaling – TM/ETM 30m -> MODIS EVI 250m, Bio/DEM/Soil-Water1km
– Homogeneous polygon (watershed segmentation)
• Extracting MODIS EVI (and other features) values by the center of segment polygon
MODIS pixel grid (250m)
Yu et al., in press, IJRS

FROM-GLC-SEG (Accuracy: 64.63%) Yu et al., in press, IJRS

FROM-GLC-AGG (Accuracy: 66.00%) Yu et al., submitted

• P188r032(2001-10-05)


• FROM-GLC
– Landsat TM/ETM+
• FROM-GLC-seg
– Landsat TM/ETM+, Landsat TM/ETM+,
MODIS EVI, Bioclimatic variables, DEM…
– Segmentation based
• FROM-GLC-agg
– Aggregation of FROM-GLC, FROM-GLC-
seg, and two 1km global impervious products
(Elvidge et al., 2007), Schneider et al., 2009,
2010)
Three global land cover products

250 m global land cover change maps
250 m global land cover using Random Forest classifier - overall accuracy = 75%

Improvements – by spatial temporal contextual classification – toward change
ADAR Image
Converge?
SVM
Conditional
Probability
Classification
(intermediate)
MAP-MRF
Conditional
Probability
Classification
(intermediate)
Converge?
2000 2001
Yes
No No
Initialization
MAP-MRF
ADAR Image
Classification
(Final)
Classification
(Final)
SVM
Initialization
Yes
ADAR Image
Converge?
SVM
Conditional
Probability
Classification
(intermediate)
MAP-MRF
Conditional
Probability
Classification
(intermediate)
Converge?
2000 2001
Yes
No No
Initialization
MAP-MRF
ADAR Image
Classification
(Final)
Classification
(Final)
SVM
Initialization
Yes
Liu, Kelly, Gong, 2006, RSE; Liu, Song, Townshend, Gong, 2008, RSE

30 m global water masks, 2000, 2010

Extraction of Open Water
Extraction
• decision tree
• SVM
• maximum likelihood comprehensive method
TM after atmospheric correction
(TM2+TM3)-(TM4+TM5)
Threshold T1
Mask 1
TCW in humidity component
Threshold T2
Mask 2
Intersection
operation
Optimal mask water+some
other landmark
Maximum likelihood classification
Human-computer interaction modification
Water classification results
Training samples
maximumlikelihood comprehensive method flow


Continents
name
2000 water
area(104km2)
2010 water
srea(104km2
)
Europe 31.56 31.59
Oceania 4.61 4.82
Africa 27.23 27.19
South America 26.57 26.78
North America 153.05 153.02
Asia 124.55 124.28
Globe 367.56 367.67
Global Land Surface Water (2000-2010)
• 2000 367.56 104km2,
• 2010 367.67 104km2
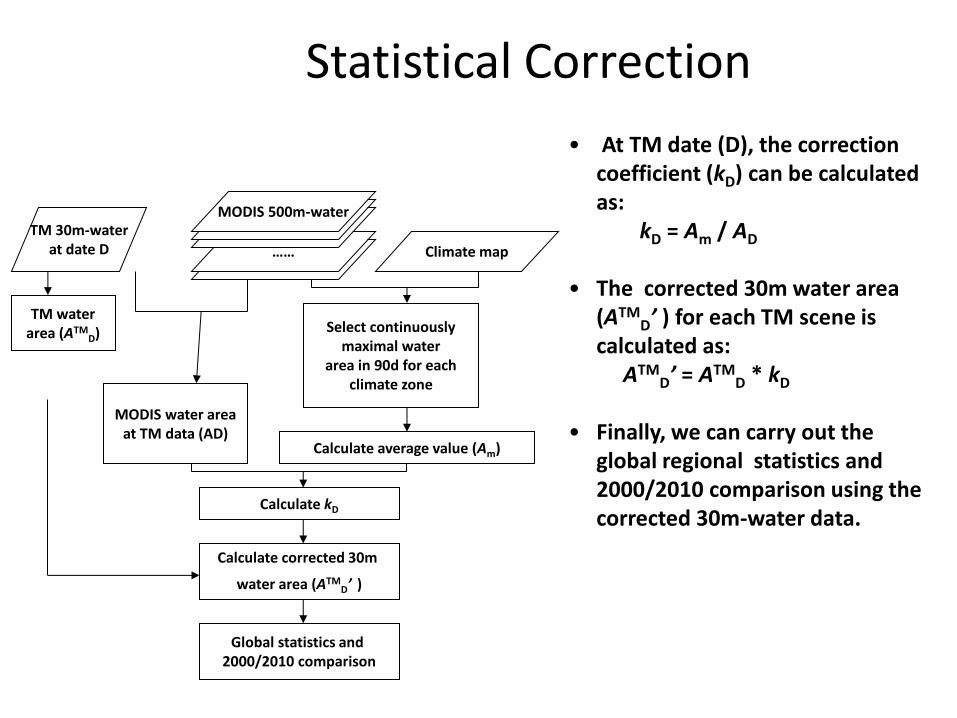
Statistical Correction
Select continuously maximal water
area in 90d for each climate zone
TM 30m-water at date D ……
MODIS 500m-water
Climate map
Calculate average value (Am)
MODIS water area at TM data (AD)
Calculate kD
TM water area (ATM
D)
Calculate corrected 30m
water area (ATMD’ )
Global statistics and 2000/2010 comparison
• At TM date (D), the correction coefficient (kD) can be calculated as:
kD = Am / AD
• The corrected 30m water area (ATM
D’ ) for each TM scene is calculated as:
ATMD’ = ATM
D * kD
• Finally, we can carry out the global regional statistics and 2000/2010 comparison using the corrected 30m-water data.

30 m global cropland mask – FROM-GC

Global Cropland Distribution, UA/PA approx. 60%
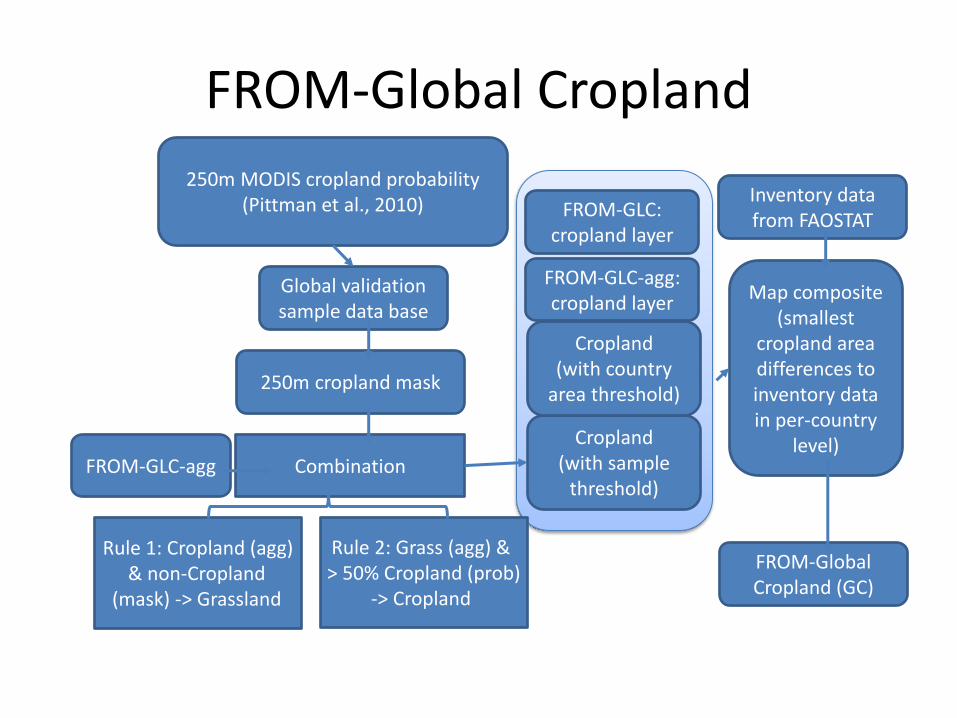
FROM-Global Cropland
FROM-GLC-agg
250m MODIS cropland probability (Pittman et al., 2010)
Global validation sample data base
250m cropland mask
Combination
Rule 1: Cropland (agg) & non-Cropland
(mask) -> Grassland
Rule 2: Grass (agg) & > 50% Cropland (prob)
-> Cropland
FROM-GLC: cropland layer
FROM-GLC-agg: cropland layer
Cropland (with sample
threshold)
Cropland (with country
area threshold)
Inventory data from FAOSTAT
Map composite (smallest
cropland area differences to inventory data in per-country
level)
FROM-Global Cropland (GC)

1533.83 million ha (Mha) land is cropland at year 2010, which is 6.95 Mha (0.45%) less than the area reported by FAO for the same year.


Finally

Web-based Validation
30m Land Cover Data(left) and Landsat Images(Right) 30m Land Cover Data(left) and GlobCover 2005(Right) 30m Land Cover Data(left) and Google Images(Right)
Input window
Images and
mapping
results
Convenient
tools for on-
line evaluat.
Post-
analysis and
modification

Call for Participation to Validation
More information
www.globallandcover.com.cn
Contact: [email protected]
Future Mtg: April 29-30, 2013, Beijing
Presentation of the results of GLC mapping
Evaluation of the data products
Future Mtg: June 25-27, 2013, Nairobi
Presentation of the results of GLC mapping
Contact: [email protected]

Thank you for your attention!