Landsat-5 TM Reflective-Band Absolute ... - · PDF fileHE LANDSAT program began in 1972 and...
14
IEEE TRANSACTIONS ON GEOSCIENCE AND REMOTE SENSING, VOL. 42, NO. 12, DECEMBER 2004 2747 Landsat-5 TM Reflective-Band Absolute Radiometric Calibration Gyanesh Chander, Dennis L. Helder, Member, IEEE, Brian L. Markham, Member, IEEE, James D. Dewald, Member, IEEE, Ed Kaita, Kurtis J. Thome, Esad Micijevic, and Timothy A. Ruggles, Member, IEEE Abstract—The Landsat-5 Thematic Mapper (TM) sensor pro- vides the longest running continuous dataset of moderate spatial resolution remote sensing imagery, dating back to its launch in March 1984. Historically, the radiometric calibration procedure for this imagery used the instrument’s response to the Internal Cal- ibrator (IC) on a scene-by-scene basis to determine the gain and offset of each detector. Due to observed degradations in the IC, a new procedure was implemented for U.S.-processed data in May 2003. This new calibration procedure is based on a lifetime radio- metric calibration model for the instrument’s reflective bands (1–5 and 7) and is derived, in part, from the IC response without the related degradation effects and is tied to the cross calibration with the Landsat-7 Enhanced Thematic Mapper Plus. Reflective-band absolute radiometric accuracy of the instrument tends to be on the order of 7% to 10%, based on a variety of calibration methods. Index Terms—Absolute calibration, characterization, Internal Calibrator (IC), Landsat, Landsat-5 (L5) Thematic Mapper (TM), Landsat-7 (L7) Enhanced Thematic Mapper Plus (ETM+), lookup table (LUT), radiance, radiometry, reflectance, relative spectral re- sponse, vicarious. I. INTRODUCTION T HE LANDSAT program began in 1972 and has since provided continuous, consistent measurements of earth surface features over seven mission generations. Landsat sen- sors have been developed specifically to detect and quantify changes in the earth’s environment and its global energy bal- ance. Two such satellites in near-polar orbit, Landsat-4 and Landsat-5, carry the Thematic Mapper (TM) sensor. When launched, these satellites marked a significant advance in remote sensing through the addition of an enhanced sensor Manuscript received November 30, 2003; revised May 29, 2004. This work was supported in part by the National Aeronautics and Space Administration Landsat Project Science Office under Dr. D. Williams, Project Scientist, and in part by the U.S. Geological Survey Earth Resources Observation System Data Center Land Remote Sensing Program under Wayne Miller and Tracy Zeiler, Project Chiefs. G. Chander and E. Micijevic are with the Science Application International Corporation, Earth Resources Observation System Data Center, U.S. Geological Survey, Sioux Falls, SD 57198 USA (e-mail: [email protected]). D. L. Helder, J. D. Dewald, and T. A. Ruggles are with the Electrical Engi- neering and Computer Science Department, South Dakota State University, SD 57007 USA (e-mail: [email protected]). B. L. Markham is with the Landsat Project Science Office, NASA Goddard Space Flight Center, Greenbelt, MD 20771 USA (e-mail: [email protected]). E. Kaita is with the Science Systems and Applications, Incorporated, NASA Goddard Space Flight Center, Greenbelt, MD 20771 USA (e-mail: [email protected]). K. J. Thome is with the Remote Sensing Group, Optical Sciences Center, Uni- versity of Arizona, Tucson, AZ 85721 USA (e-mail: [email protected] zona.edu). Digital Object Identifier 10.1109/TGRS.2004.836388 system, an increased data acquisition and transmission capa- bility, and more rapid data processing at highly automated facilities. Although L5 was launched in March 1984, it con- tinues operating to this day, far beyond its expected five-year lifetime. Nevertheless, the instrument has aged, and its charac- teristics have changed since its launch. These changes must be adequately characterized and corrected, if possible, to preserve the usefulness of the acquired data. L5 was developed and launched in 1984 by the National Aeronautics and Space Administration (NASA). Following on-orbit testing, L5 was turned over to the National Oceanic and Atmospheric Administration (NOAA). In September 1985, NOAA transferred operational control of L5 to a commercial vendor, the Earth Observation Satellite (EOSAT) Company (currently known as Space Imaging, Inc). In July 2001, opera- tional control of L5, and its entire data archive, was returned to the U.S. Government, to be administered by the U.S. Geolog- ical Survey (USGS). Three data product generation systems have been used to process L5 image data in the U.S. The first processing system, used by NOAA and adopted later by EOSAT, was the TM Image Processing System (TIPS). EOSAT updated TIPS to the En- hanced Image Processing System (EIPS) in October 1991. At the same time, the USGS began work on its own TM archive, processing TM data with the National Landsat Archive Produc- tion System (NLAPS), created by MacDonald Dettwiler Asso- ciates (MDA). A. Instrument Overview The orbit of Landsat-5 is repetitive, circular, sun-syn- chronous, and near polar at a nominal altitude of 705 km (438 miles) at the equator. The spacecraft crosses the equator from north to south on a descending orbital node from between 10:00 A.M. and 10:15 A.M. on each pass. Circling the earth at 7.5 km/s, each orbit takes nearly 99 min. The spacecraft completes just over 14 orbits per day, covering the entire earth between 81 north and south latitude every 16 days. The TM instrument provides image data with eight-bit radiometric resolution in seven bands covering the visible, near infrared, shortwave infrared and thermal regions of the electromagnetic spectrum. Bands 1–4 use 16-element Si-based detector arrays with center wavelengths of 0.49, 0.56, 0.66, and 0.83 m. Bands 5 and 7 use 16-element, cooled InSb-based detector arrays with center wavelengths of 1.67 and 2.24 m. Band 6, the thermal emissive band, uses a cooled four-element HgCdTe-based array with a center wavelength of around 11.5 m. The six reflective 0196-2892/04$20.00 © 2004 IEEE
Transcript of Landsat-5 TM Reflective-Band Absolute ... - · PDF fileHE LANDSAT program began in 1972 and...
IEEE TRANSACTIONS ON GEOSCIENCE AND REMOTE SENSING, VOL. 42, NO. 12, DECEMBER 2004 2747
Landsat-5 TM Reflective-Band AbsoluteRadiometric Calibration
Gyanesh Chander, Dennis L. Helder, Member, IEEE, Brian L. Markham, Member, IEEE,James D. Dewald, Member, IEEE, Ed Kaita, Kurtis J. Thome, Esad Micijevic, and Timothy A. Ruggles, Member, IEEE
Abstract—The Landsat-5 Thematic Mapper (TM) sensor pro-vides the longest running continuous dataset of moderate spatialresolution remote sensing imagery, dating back to its launch inMarch 1984. Historically, the radiometric calibration procedurefor this imagery used the instrument’s response to the Internal Cal-ibrator (IC) on a scene-by-scene basis to determine the gain andoffset of each detector. Due to observed degradations in the IC, anew procedure was implemented for U.S.-processed data in May2003. This new calibration procedure is based on a lifetime radio-metric calibration model for the instrument’s reflective bands (1–5and 7) and is derived, in part, from the IC response without therelated degradation effects and is tied to the cross calibration withthe Landsat-7 Enhanced Thematic Mapper Plus. Reflective-bandabsolute radiometric accuracy of the instrument tends to be on theorder of 7% to 10%, based on a variety of calibration methods.
Index Terms—Absolute calibration, characterization, InternalCalibrator (IC), Landsat, Landsat-5 (L5) Thematic Mapper (TM),Landsat-7 (L7) Enhanced Thematic Mapper Plus (ETM+), lookuptable (LUT), radiance, radiometry, reflectance, relative spectral re-sponse, vicarious.
I. INTRODUCTION
THE LANDSAT program began in 1972 and has sinceprovided continuous, consistent measurements of earth
surface features over seven mission generations. Landsat sen-sors have been developed specifically to detect and quantifychanges in the earth’s environment and its global energy bal-ance. Two such satellites in near-polar orbit, Landsat-4 andLandsat-5, carry the Thematic Mapper (TM) sensor. Whenlaunched, these satellites marked a significant advance inremote sensing through the addition of an enhanced sensor
Manuscript received November 30, 2003; revised May 29, 2004. This workwas supported in part by the National Aeronautics and Space AdministrationLandsat Project Science Office under Dr. D. Williams, Project Scientist, and inpart by the U.S. Geological Survey Earth Resources Observation System DataCenter Land Remote Sensing Program under Wayne Miller and Tracy Zeiler,Project Chiefs.
G. Chander and E. Micijevic are with the Science Application InternationalCorporation, Earth Resources Observation System Data Center, U.S. GeologicalSurvey, Sioux Falls, SD 57198 USA (e-mail: [email protected]).
D. L. Helder, J. D. Dewald, and T. A. Ruggles are with the Electrical Engi-neering and Computer Science Department, South Dakota State University, SD57007 USA (e-mail: [email protected]).
B. L. Markham is with the Landsat Project Science Office, NASAGoddard Space Flight Center, Greenbelt, MD 20771 USA (e-mail:[email protected]).
E. Kaita is with the Science Systems and Applications, Incorporated,NASA Goddard Space Flight Center, Greenbelt, MD 20771 USA (e-mail:[email protected]).
K. J. Thome is with the Remote Sensing Group, Optical Sciences Center, Uni-versity of Arizona, Tucson, AZ 85721 USA (e-mail: [email protected]).
Digital Object Identifier 10.1109/TGRS.2004.836388
system, an increased data acquisition and transmission capa-bility, and more rapid data processing at highly automatedfacilities. Although L5 was launched in March 1984, it con-tinues operating to this day, far beyond its expected five-yearlifetime. Nevertheless, the instrument has aged, and its charac-teristics have changed since its launch. These changes must beadequately characterized and corrected, if possible, to preservethe usefulness of the acquired data.
L5 was developed and launched in 1984 by the NationalAeronautics and Space Administration (NASA). Followingon-orbit testing, L5 was turned over to the National Oceanicand Atmospheric Administration (NOAA). In September 1985,NOAA transferred operational control of L5 to a commercialvendor, the Earth Observation Satellite (EOSAT) Company(currently known as Space Imaging, Inc). In July 2001, opera-tional control of L5, and its entire data archive, was returned tothe U.S. Government, to be administered by the U.S. Geolog-ical Survey (USGS).
Three data product generation systems have been used toprocess L5 image data in the U.S. The first processing system,used by NOAA and adopted later by EOSAT, was the TM ImageProcessing System (TIPS). EOSAT updated TIPS to the En-hanced Image Processing System (EIPS) in October 1991. Atthe same time, the USGS began work on its own TM archive,processing TM data with the National Landsat Archive Produc-tion System (NLAPS), created by MacDonald Dettwiler Asso-ciates (MDA).
A. Instrument Overview
The orbit of Landsat-5 is repetitive, circular, sun-syn-chronous, and near polar at a nominal altitude of 705 km (438miles) at the equator. The spacecraft crosses the equator fromnorth to south on a descending orbital node from between10:00 A.M. and 10:15 A.M. on each pass. Circling the earthat 7.5 km/s, each orbit takes nearly 99 min. The spacecraftcompletes just over 14 orbits per day, covering the entire earthbetween 81 north and south latitude every 16 days. The TMinstrument provides image data with eight-bit radiometricresolution in seven bands covering the visible, near infrared,shortwave infrared and thermal regions of the electromagneticspectrum. Bands 1–4 use 16-element Si-based detector arrayswith center wavelengths of 0.49, 0.56, 0.66, and 0.83 m. Bands5 and 7 use 16-element, cooled InSb-based detector arrays withcenter wavelengths of 1.67 and 2.24 m. Band 6, the thermalemissive band, uses a cooled four-element HgCdTe-based arraywith a center wavelength of around 11.5 m. The six reflective
0196-2892/04$20.00 © 2004 IEEE

2748 IEEE TRANSACTIONS ON GEOSCIENCE AND REMOTE SENSING, VOL. 42, NO. 12, DECEMBER 2004
TABLE IL5 TM SPECTRAL COVERAGE AND GROUND SAMPLE DISTANCE [1]
bands have a spatial resolution of 30 m, and the thermal bandhas a spatial resolution of 120 m. Table I provides a summary ofsome of the key characteristics of these instruments, includingthe spectral range of the channels [1].
The TM sensor incorporates an onboard radiometric calibra-tion system called the Internal Calibrator (IC), which is locatedin front of the primary focal plane. The IC has a shutter flagthat includes optical components that direct light from threelamps, located near the base of the shutter flag, to the detectors.The output from each lamp is modified by a different attenua-tion filter, producing three different intensities that can be com-bined into eight distinct brightness levels. The lamps are con-tinuously cycled through an eight state sequence during a 24-sscene acquisition, and their outputs are monitored by unfilteredsilicon photodiodes located behind a hole in the condenser mir-rors within the lamp assemblies; the lamp currents are controlledby feedback networks such that the photodiode outputs remainconstant. The shutter flag oscillates in synchronization with thescan mirror such that, at the end of each image scan, the shutterflag obscures the primary focal plane (and by extension the coldfocal plane, through an optical relay system), blocking receptionof reflected scene energy. The shutter flag is painted black andprovides both focal planes with a zero-radiance reference [2].
B. Purpose of This Paper
Teams from the Image Assessment System (IAS), LandsatProject Science Office (LPSO), Canada Centre for RemoteSensing (CCRS), South Dakota State University (SDSU),University of Arizona (UOA), Jet Propulsion Laboratory (JPL),Rochester Institute of Technology (RIT), MacDonald DettwilerAssociates (MDA), and others involved in Landsat calibrationmeet on a semiannual basis to compare results from indepen-dent calibration efforts. For the L5 TM, the current emphasisis on determining the calibration history for the entire archiveand making recommendations for necessary corrections. Theultimate goal of these calibration teams has been to characterizethe instrument and provide accurate radiometric calibration forany point in its lifetime. This paper focuses on the calibrationof the reflective bands of the L5 TM instrument.
A revised radiometric calibration of the L5 TM sensor forits entire mission has been developed and anchored to that ofthe L7 ETM+. This paper documents the results of the collab-orative effort on an improved calibration procedure and pro-vides specifications for the related calibration algorithms. Thispaper includes: 1) development of lifetime calibration equa-tions; 2) refinements to calibration models accounting for out-
gassing effects; 3) revised postcalibration dynamic range; 4)lookup table (LUT) implementation of absolute gains gener-ated from time-dependent models; 5) operational implementa-tion of revised calibration procedures; and 6) improvement incalibration consistency of L5 with L7. A more detailed treat-ment of the development of the lifetime gain equations is pro-vided in Teillet et al. [3]. A succinct treatment of the informa-tion users need with equations and parameters for converting thedigital numbers (DNs) from the image data to useful quantitiessuch as spectral radiance and top-of-atmosphere (TOA)reflectance or temperature ( ) estimates is provided in [4]and [5].
Historically, L5 TM calibration information has been pre-sented in spectral radiance units of milliwatts per square cen-timeter per steradian per micron. To maintain consistency withL7 ETM+, this paper uses spectral radiance units of watts persquare meter per steradian per micron; note that the conversionfactor is 1 : 10 when going from one radiance unit to the other.
II. L5 TM ARTIFACT CORRECTIONS
This paper deals primarily with the development of a calibra-tion procedure for determining a single gain value per band fora scene of data. A number of other issues need to be dealt withto maintain the internal consistency of the calibration within ascene. These include artifact correction and detector-to-detectornormalization. This section reviews these effects.
A. Artifacts
Radiometric performance studies of the L4/L5 TM sensorshave led to a detailed understanding of several image artifactsdue to particular sensor characteristics. These artifacts were ob-served in image data shortly after launch of the L4 TM. Beforeradiometric calibration of the Landsat TM data can be done ac-curately, it is necessary to minimize the effects of these artifactsin the data, originating in the instrument’s signal processingpath. Data analysis has identified three primary radiometric ar-tifacts: scan-correlated shift (SCS), coherent noise (CN), andmemory effect (ME). All three are normally difficult to observeexcept in fairly homogeneous regions such as water or desert.To varying degrees, they have also been observed in calibrationdata. Other secondary artifacts have been observed; however,their effects on image data are significantly smaller.
SCS is a sudden, simultaneous shift in the bias level of alldetectors occurring at the end of a scan line; all detectors shiftat the same time between two bias levels. It is easily correctedin image data simply by subtracting bias from each scan line.Coherent noise is a periodic noise pattern that is present in allimagery. The noise level is very low, typically less than oneDN. ME is a significant problem that can cause, in the worstcase, an 8-DN error in pixel intensity. This problem is due to theresponse of a first-order resistance–capacitance network withinthe analog preamplifiers used by bands 1–4.
Additional information on TM artifacts and the correctionprocedures can be found in the TM on-orbit radiometric per-formance [6].

CHANDER et al.: LANDSAT-5 TM REFLECTIVE-BAND ABSOLUTE RADIOMETRIC CALIBRATION 2749
TABLE IIL5 TM PRELAUNCH GAIN/BIAS COEFFICIENTS [8]
TABLE IIILIFETIME VICARIOUS CALIBRATIONS AND GAIN COEFFICIENTS IN DIGITAL
NUMBERS PER UNIT RADIANCES WATTS PER SQUARE METER PER
STERADIAN PER MICRON FOR THE DATES SHOWN FOR THE SIX
SOLAR REFLECTIVE BANDS OF L5 TM BASED ON LEVEL 0R DATA
B. Detector Equalization
Individual detectors within an array typically do not possesssimilar gain and bias characteristics. This mismatch of detectorresponse results in the appearance of striping in acquired im-ages. Striping has been the most significant radiometric artifactobserved in all of the Landsat imaging sensors, beginning withthe Multispectral Scanner (MSS) on Landsat-1 in 1972. It isalso clearly evident in TM imagery. The objective of detectorequalization, or “relative” radiometric calibration, is to reducestriping effects by establishing a reference, based on a single de-tector or a band average of all detectors, and then shifting andscaling the detector responses to match the reference gain andbias level [7]. One method of achieving this equalization is his-togram equalization, which is discussed below.
1) Histogram Equalization: A destriping algorithm was de-veloped at CCRS for the MSS on Landsat-1 and was improvedand adapted to the TM sensor by Murphy (1984). This algo-rithm has been incorporated into the Landsat Level 1 Product
(a)
(b)
Fig. 1. (a) Normalized net pulse value and (b) the detector response (gain) inunits of DN/radiance.
Generation System (LPGS), Product Generation System (PGS),Thematic Mapper Bulk Processing System (TMBPS), and Geo-metric Image Correction System (GICS). On a scene-specificbasis, it determines the bias and gain of each detector relative toa reference detector and then equalizes the detectors to the biasand gain of the reference. In most U.S. implementations, the ref-erence detector is typically a “pseudo”-detector whose gain andbias are the arithmetic mean of the gains and biases of all de-tectors. Canadian implementations, on the other hand, choose asingle detector as the reference.
C. Icing Corrections for Bands 5 and 7
The detectors of bands 5, 6, and 7 are located on the cold focalplane (CFP) at a temperature maintained between 95–105 K, tominimize thermal noise and allow adequate detection of sceneenergy. Gain oscillations observed in bands 5 and 7 are believedto be caused by ice that builds up on the window of a dewar that

2750 IEEE TRANSACTIONS ON GEOSCIENCE AND REMOTE SENSING, VOL. 42, NO. 12, DECEMBER 2004
Fig. 2. L5 TM IC lamp sequencing for band 1 detector 15.
houses the CFP detectors. This process of icing, an effect of out-gassing, is detected and characterized through observations ofIC data, revealing an indication of 3% to 5% uncertainty in ab-solute gain estimates. Correction of the gain oscillations makesuse of a thin-film interference model developed at SDSU. Themodel is based on an analysis of closely sampled sets of detectorresponses from the TM’s lifetime and relates detector behaviorto both the accumulated ice thickness, since the previous out-gassing event and the current growth rate of the ice film. Thismodel provides correction coefficients on a daily basis for anypoint in time since the launch of the satellite [6].
III. L5 TM ABSOLUTE RADIOMETRIC CALIBRATION
The Landsat series of satellites has provided the longest run-ning continuous dataset of moderate spatial-resolution imagery,dating back to the launch of Landsat-1 in 1972. Part of the suc-cess of the Landsat program has been the ability to understandthe radiometric properties of its various sensors. This under-standing is attributed to a combination of prelaunch and post-launch data from laboratory, onboard, and vicarious calibrationmethods. Radiometric calibration of these sensors helps charac-terize the operation of the instrument, but more importantly, thecalibration allows the full Landsat data archive to be used in aquantitative sense.
A. Prelaunch Instrument Gain
Prelaunch calibration of the sensors is the work done in thelaboratory before the instrument’s launch. It allows the systemto be tested to ensure it operates properly before being inte-grated into the launch vehicle. Laboratory calibrations are easierto control and perform than methods used after launch. Duringthe preflight phase, TM detectors were calibrated using a sec-ondary standard integrating sphere (IS122 of the U.S. NationalBureau of Standards). Several calibration tests have been carriedout under ambient and vacuum conditions. Tables containingfixed estimates of detector gain and bias for each TM detectorare provided in the Landsat to Ground Station Interface Descrip-tion document [8]. This document also provides radiance levelsfor each calibration lamp configuration as sensed by each singledetector given in digital counts, which are related to effective ra-diance by the gain and bias values.
TABLE IVCOMPARISON OF TANDEM-ORBIT-BASED (RVPN XCAL) AND VICARIOUS
(RVPN UOA) CALIBRATION RESULTS FOR LANDSAT 5 TM GAIN
COEFFICIENTS FOR THE RVPN TEST SITE IN JUNE 1999. ACOMPARISON BETWEEN RVPN XCAL AND PRELAUNCH
GAIN COEFFICIENTS IS ALSO INCLUDED. GAINS ARE IN
UNITS OF WATTS PER SQUARE METER PER
STERADIAN PER MICRON [16]
TABLE VCOEFFICIENTS FOR TIME-DEPENDENT CHARACTERIZATION OF L5 TMLIFETIME GAIN BASED ON IC TREND ANALYSIS, ANCHORED TO L7ETM+ VIA CROSS CALIBRATION USING THE TANDEM-ORBIT IMAGE
PAIR FOR RVPN IN 1999. COEFFICIENTS a AND a ARE IN UNITS
OF WATTS PER SQUARE METER PER STERADIAN PER MICRON
AND THE a COEFFICIENTS ARE DIMENSIONLESS
Before its launch, L5 was well-calibrated radiometrically.However, following launch, the IC response of the instrumentdecreased in an exponential manner due to spectral filteroutgassing. Table II summarizes the prelaunch gain and biascoefficients. The prelaunch gain coefficients are not consis-tent with the vicarious and onboard calibrations performedthroughout the instrument’s lifetime. A large variation, on theorder of 20%, has been observed between the prelaunch valuesand postlaunch cross-calibration and vicarious calibrationvalues. As such, the prelaunch gain coefficients are not usefulfor performing radiometric calibration, and it has been recom-mended that the International Ground Stations (IGSs) updatetheir processing systems from the default database values to therevised definitive gain coefficients.
B. Lifetime Vicarious Calibration Gains
As previously mentioned, the internal calibrator is incorpo-rated as an onboard radiometric calibration system. Vicariouscalibration is an approach that attempts to estimate the radianceseen at the sensor (basically at the top of the earth’s atmos-phere) over a selected test site on the earth’s surface, using insitu measurement results and radiative transfer code computa-tions. The onboard lamp systems provide a high-precision viewof the sensor’s behavior as a function of time, over time inter-vals ranging from a single orbital period to several months. Forlonger time intervals, it becomes necessary to verify the status
CHANDER et al.: LANDSAT-5 TM REFLECTIVE-BAND ABSOLUTE RADIOMETRIC CALIBRATION 2751
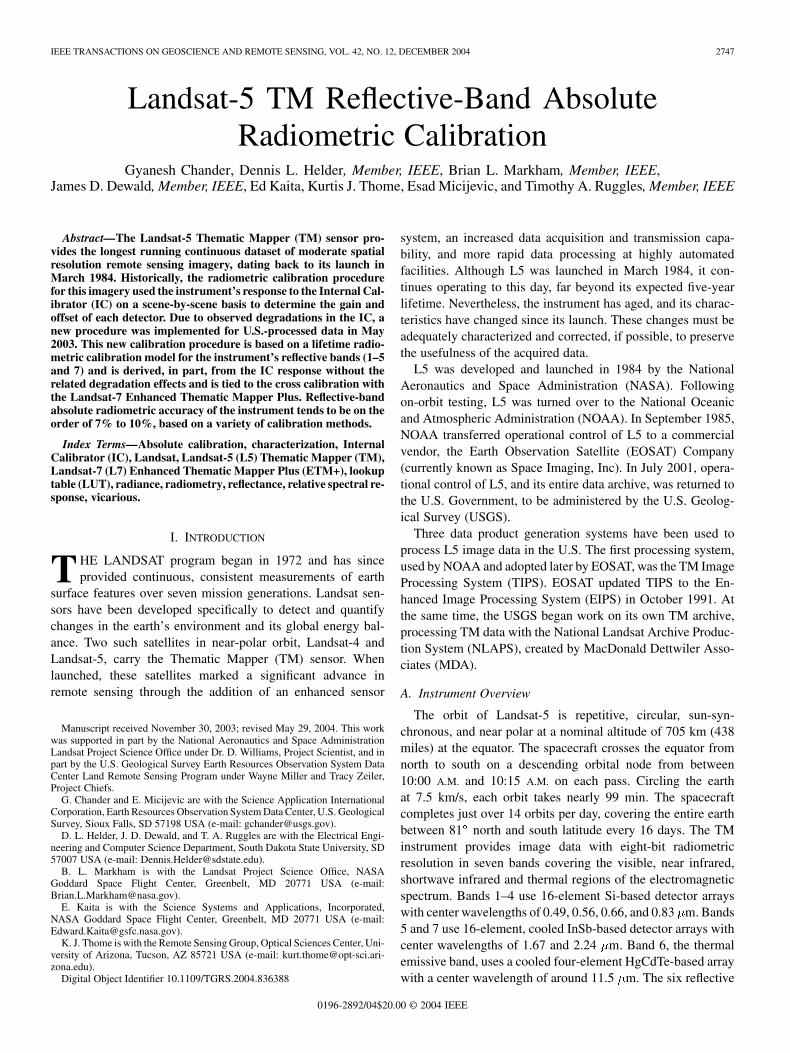
Fig. 3. Lifetime gain plot for the solar reflective bands of L5 TM, tied to L7 ETM+ cross-calibration measurements. DN is digital counts. Radiance is in wattsper square meter per sterdian per micron. UAZ is University of Arizona, and SDSU is South Dakota State University.
of the onboard references (lamps, diffusers) through indepen-dent means. Vicarious methods provide these independent dataand provide insights to drift in the instrument response or thecalibration system (IC).
The major advantage of vicarious methods is that the cali-bration is performed with the system operating in the mode in
which it normally collects data. Vicarious approaches take intoconsideration the full aperture and full optical path calibrations,providing relatively high accuracy in calibration. However, vi-carious calibration is labor-intensive, which limits the numberof calibrations that can be performed. In addition, calibrationcan only be performed when the system collects data over the

2752 IEEE TRANSACTIONS ON GEOSCIENCE AND REMOTE SENSING, VOL. 42, NO. 12, DECEMBER 2004
Fig. 4. Lifetime gain plot for the solar reflective bands of L5 TM in radiance units watts per square meter per steradian per micron showing the comparison ofthe gain generated from IC versus the LUT.
test site. For L5, the maximum number of calibrations possibleduring a given year, for a given test site, is 22. The actual numberwill be further reduced due to adverse local weather conditions(i.e., cloud cover obscuring the test site).
Teams from SDSU and the UOA collect vicarious measure-ments for L5 TM data and use other techniques to calibrate his-torical data available from the archive. Table III summarizes thegain coefficients obtained from measurements from both teams.The background information and processing methodology havebeen generated and reported elsewhere. References at the endof this paper provide additional information [2], [9].
C. IC-Based Calibration Gain
NASA/Santa Barbara Research Center (SBRC) developedprocessing algorithms that estimated detector gain based onthe prelaunch calibrated IC lamp responses. The procedure
Fig. 5. Lifetime gain plot for band 7 showing the icing corrections. The verticalbar shows an outgassing cycle of 2000.
CHANDER et al.: LANDSAT-5 TM REFLECTIVE-BAND ABSOLUTE RADIOMETRIC CALIBRATION 2753
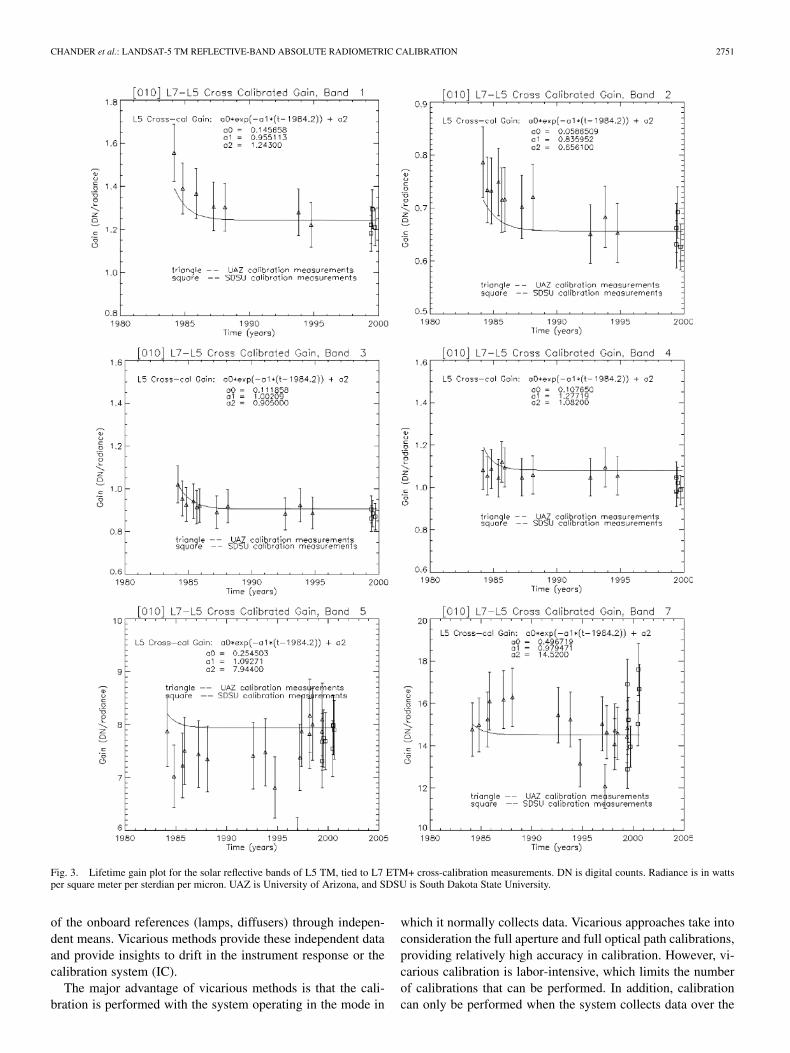
TABLE VIL5 TM POSTCALIBRATION DYNAMIC RANGES FOR U.S. PROCESSED NLAPS DATA [4]
involved regression of lamp responses against the measuredradiances for all eight lamp states. The slopes of the regressionsrepresent the gain; the intercepts represent the bias. Constantvalues of gain and bias are used for each detector for a scene.
Many techniques have been developed to analyze data fromthe IC over the instrument’s lifetime [10]–[14]. Results from ICanalysis through 1999 for the solar reflective bands suggest thatthe L5 TM lifetime radiometric response follows an exponen-tial plus linear model, as shown in Fig. 1. The exponential partseemed to reach an asymptotic limit in 1987 and is considered tobe a “true change” in instrument response, likely due (as men-tioned earlier) to outgassing from the spectral filters occurringduring the first few years after launch.
The subsequent linear increase is considered to be a change inthe IC system (i.e., a change in lamp characteristics rather thana true change in instrument response). The L5 TM IC controlphotodiode is unfiltered. It therefore monitors only total powerwithin its region of spectral sensitivity. The photodiode has toadjust the current going to the lamp to keep this power constant.If the spectral nature of the light output should change (e.g., byyellowing/browning of the lamp envelope), each band will notreceive a constant power over time. This could be a contributingfactor to some of the changes observed. Hypothetically, the IClamps may be contaminated in the region viewed by the photo-diode in the lamp radiance control system. Such contaminationmay cause a reduction in measured radiance at the photodiodeand drive an increase in overall lamp brightness. Fig. 2 shows thelamp responses for all lamp states from two scenes acquired in1986 and 2001. It can be seen that the pulses from 2001 are muchbrighter than the corresponding pulses from the 1986 scene.
Vicarious calibration results suggest a relatively constant re-sponse since 1988. The linear increase as seen in the lamp re-sponse was not observed in the vicarious calibration results, asshown in Fig. 1(b). Once the linear term was removed from theIC model, agreement between the IC model and the vicariousresults improved.
Based on these results, it is currently believed that only the ex-ponential decrease observed in the IC system response and gainmodel represents a real change in the TM’s gain response. Theobserved linear increase in the IC system response is believed tobe a “false” effect, consistent with the understanding that gainresponse does not increase over time. Thus, in formulating thefinal temporal characterization, the linear trend is removed fromthe entire lifetime IC record based on the post-1988 fit. How-
ever, the gain calculated using the full IC model introduces errorinto the radiometric calibration accuracy. Thus, the historicalprocedure of using the IC to calculate the gain no longer pro-duces the desired calibration; the result is a short-term variationin the apparent gain of the instrument [15].
D. Cross Calibration With L7 ETM+
Early in its mission, the L7 spacecraft was temporarily placedin a “tandem” orbit very close to that of the L5 spacecraft inorder to facilitate the establishment of sensor calibration con-tinuity between the ETM+ and TM sensors. During June 1–4,1999, hundreds of nearly coincident matching scenes wererecorded by both the ETM+ and, in cooperation with SpaceImaging/EOSAT and IGS’s, the TM as well. A cross-cali-bration method [16] was formulated and implemented to useimage pairs from the tandem-orbit configuration period toradiometrically calibrate the solar reflective bands of the TMwith respect to the excellent radiometric performance of theETM+ (to 3%).
Among the matching scenes, only two are known to have co-incident ground measurements associated with them. One of thescenes covers the Railroad Valley Playa, NV (RVPN), which isused on a regular basis for sensor radiometric calibration due toits well-characterized relatively stable surface and atmosphericcharacteristics. Therefore, the RVPN results are considered tobe the definitive set of L5 TM gain coefficients for June 1999(Table IV). Tandem-orbit-based results from other image pairs(not shown) indicate a repeatability of the approach on the orderof 2%. For spectral bands 1–4, the estimated uncertainty ofthis TOA radiance calibration is 3.6% (one sigma), based onthe root sum square of 3% for ETM+ calibration and 2%for the tandem-orbit-based cross calibration. Uncertainty esti-mates have yet to be determined for spectral bands 5 and 7,but experience suggests that they will be approximately 50%greater than the uncertainties in the first four spectral bands.Comparisons with results from independent vicarious calibra-tion methods (Table IV) indicate that the tandem-orbit-basedcross calibration is in reasonable agreement with the indepen-dent results (to within 2.5% on average and no worse than within4.4%). A comparison between the 1999 and prelaunch TM gaincoefficients is also included in Table IV. The large changes ingain in spectral bands 1–3 underscore the importance of post-launch calibration updates during the lifetime of the mission[16].

2754 IEEE TRANSACTIONS ON GEOSCIENCE AND REMOTE SENSING, VOL. 42, NO. 12, DECEMBER 2004
E. Development of Lifetime Calibration Equations
A new formulation for the instrument gain was developed.This formulation models the gain of each band as a time-de-pendent equation. The model initially consisted of the sum oftwo terms representing the initial exponential decrease in re-sponse (believed to be due to outgassing from the spectral filters)and the linear increase in response and were based on normal-ized instrument response to reverse scan calibration data fromthe one lamp (state [010]), with continuous output. The lin-early increasing component was not included in the final model.The final model curve was then scaled to the cross-calibrationgain estimates for the L7 ETM+ obtained in June 1999, as de-termined by the tandem-based cross calibration for the RVPNtest site [16]. The time-dependent equations for L5 TM gain
applicable to raw data take the form
(1)
where the time is in decimal years, a0 is a scaling factor for theexponential decrease, a1 is a time constant of the exponential de-crease, a2 is a required offset, and 1984.2 refers to “time zero,”the date when the earliest lifetime net pulse value was collected.The coefficients a0, a1, and a2 are given in Table V. The gain co-efficients in the solar reflective bands are constant and within theaccuracy of the vicarious calibration results since approximately1987. The resulting curves (Fig. 3) are generally consistent withindependent lifetime vicarious calibration results obtained byUOA and 1999 estimates obtained by SDSU. For spectral bands1–4, the lifetime gain curves only fall outside the uncertainty ofthe vicarious calibration results at the very beginning of the L5mission in 1984. For spectral bands 5 and 7, the lifetime gaincurves do not correspond as well to the independent vicariouscalibration measurements.
1) LUT Description: Due to the periodic build up of iceduring outgassing cycles as explained in the earlier section,there is an additional 3% to 5% uncertainty in bands 5 and7 in any given TM product. The developed thin-film modelcorrects for most of this effect. The oscillatory nature of thismodel is such that the for bands 5 and 7 will be betterspecified in terms of day-specific LUTs. Hence, for consistency,LUTs was used for for all six solar reflective bands.
Fig. 3 shows the final lifetime gain model for L5 TM thathas been scaled to the cross-calibration estimates with the L7ETM+. These gains are generated over the lifetime of the mis-sion and stored in day-specific LUTs. These are referred to asLUT gains in this paper. In the same sense, the gains calculatedusing IC responses are referred to as IC gains. A comparison ofIC versus the LUT gains over the lifetime of the instrument isshown in Fig. 4. The LUT gain plot for the band 7 with incor-porated icing corrections are shown in Fig. 5. The Gain Modelcurve in that figure shows the band 7 gain in absence of the icingproblem, and the Icing Correction Gain follows the interferencenature of the ice film growth on the CFP window. The verticallines show the beginnings of the two consecutive outgassing cy-cles, indicating discontinuities in the interference pattern due to
the outgassing process and successful recovery of detector re-sponsivities to the no-ice values.
2) Revised Postcalibration Dynamic Ranges: The L5 TMdata products are eight-bit; therefore, the calibrated pixels needto be scaled. The postcalibration dynamic range defines the DNto radiance scaling limits in the Level 1 products. Originally,an identical postcalibration dynamic range was defined for theL4 and L5 TM sensors. The postcalibration dynamic ranges arespecified by a maximum radiance LMAX and a minimum ra-diance LMIN .
Table VI provides band-specific LMAX and LMIN param-eters and the corresponding and values used atdifferent times for the L5 processing system. The units of spec-tral radiance are watts per square meter per steradiam per micron
LMIN
Postcal gain
whereminimum quantized calibrated pixel value DN
corresponding to LMIN ;maximum quantized calibrated pixel value DN
corresponding to LMAX ;LMIN spectral radiance that is scaled to in watts
per square meter per steradian per micron;LMAX spectral radiance that is scaled to in watts
per square meters per sterdian per micron.(units of watts per square meter per steradian per mi-
cron per digital number) and (units of watts per squaremeter per steradian per micron) are band-specific rescaling fac-tors typically given in the NLAPS product header file (.h1) andthe product generation work order report (.wo) and used forconverting the calibrated DNs in L1 products back to at-sensorspectral radiance. Note that gain has been variously defined asradiance per unit DN (typically for the data products) and DNper unit radiance (typically for the instrument), lending confu-sion to the discussion. When referring to data products, we willcall what have typically been called data product gains, e.g.,
, scaling factors, and reserve “gain” for the inverse ofthe scaling factor.
Figs. 6–9 compare the postcalibration gains in relation to theinstrument gains being generated by IC and LUT processing forall of the bands. A higher gain implies lower saturation radi-ance. Generally, the strategy is to set the gain as low as the mostsensitive (highest gain) detector in the band will support. Noteparticularly for bands 1 and 2 that the LUT gains are signifi-cantly lower than the IC gains. This means that if the postcali-bration range is not changed, then the LUT L1R processing willbe forcing more pixels into saturation than the IC processing.This will cause negative impacts in analysis of the bright targets.To avoid this problem, the postcalibration gains were reduced(this means increasing the LMAXs) to remap the calibrated DNsto their new radiance levels. For the other bands, the LUT gainswere similar to the IC gains, though some revisions were made.

CHANDER et al.: LANDSAT-5 TM REFLECTIVE-BAND ABSOLUTE RADIOMETRIC CALIBRATION 2755
Fig. 6. L5 TM lifetime gain for band 1 with revised postcalibration dynamicranges.
Fig. 7. L5 TM lifetime gain for band 2 with revised postcalibration dynamicranges.
Beginning May 5, 2003, the new postcalibration dynamicranges are used for all of the data processed and distributed bythe Earth Resources Observation System (EROS) Data Center(EDC) [4]. LMAX was set to be slightly lower than the satura-tion radiance of the most sensitive detector in the given band.This forces all detectors to “saturate” at the same radiance inthe calibrated data product and prevents striping in high-radi-ance areas. This method allows a fixed postcalibration dynamicrange for the life of the mission at the expense of throwing awayincreasing amounts of data as the gain decreases with time. Atall times, however, the data product has the same range. Therelative calibration results over the lifetime of the instrumentindicate that the maximum variation within a band is 2.5%from the average. Based on these results, the revised LMAX waschosen 5% above the gain numbers derived from the cross-cal-ibration experiment.
For “early mission” L5 TM data (acquired after launch in1984 through mid-1985), the change in postcalibration dynamicranges will introduce high-radiance striping and saturation of
Fig. 8. L5 TM lifetime gain for band 3 with revised postcalibration dynamicranges.
Fig. 9. L5 TM lifetime gain for band 4 with revised postcalibration dynamicranges.
Fig. 10. High-radiance striping for early mission L5 TM data.
calibrated digital counts values below 255, as shown in theFig. 10. This striping results from each detector saturating ata different DN in the calibrated data products. As shown in

2756 IEEE TRANSACTIONS ON GEOSCIENCE AND REMOTE SENSING, VOL. 42, NO. 12, DECEMBER 2004
Figs. 6–9, during this time period the postcalibration gain islower than the instrument LUT gains. Users should considerall the detectors saturated in areas where they observe thishigh-radiance striping.
The revised postcalibration dynamic ranges are only appli-cable to the data processed using the LUT gains, and the newLMAXs should not be applied to the data processed using ICgains. The new postcalibration dynamic ranges are consideredto be valid only for the L5 TM calibrated products. L4 TMsensor calibration will continue to use the postcallibration dy-namic ranges as previously defined.
IV. IMPROVEMENT IN ABSOLUTE CALIBRATION
ACCURACY OF L5 WITH L7
Historically, the L5 TM calibration procedure in NLAPS(adopted from TIPS) used the instrument’s response to the IC ona scene-by-scene basis to determine gains and offsets. EffectiveMay 5, 2003, revised L5 TM radiometric calibration proceduresand postcalibration dynamic ranges were implemented into theNLAPS system for all of the data processed and distributed bythe EDC [4]. The modified approach discontinued use of the ICfor the reflective bands (with the exception of the thermal band)and implemented instead a time-dependent calibration LUT.Note that products generated before May 5, 2003 (calibratedwith the IC-based gain and converted to radiance using theolder LMINs and LMAX values) will not provide the sameradiances as those processed since May 5, 2003 (calibrated withthe LUT gain and converted to radiance with the new LMINsand LMAXs).
Data continuity within the Landsat program requires con-sistency in interpretation of image data acquired by differentimaging instruments. This section provides another comparisonof the reflectance measurements obtained from the “tandem”L5 TM and L7 ETM+ scenes. The goal of this analysis is toshow the improvement in consistency of the L5 with L7 im-agery achieved by implementation of the LUT approach in L5data product generation.
Three image pairs acquired in June 1999 were used inthis analysis: RVPN having WRS path/row 40/33, Niobrara,NE, having WRS path/row 31/30, and Washington, DC (DC)having WRS path/row 15/33. All scenes were processed toLevel 1R (applied radiometric, but no geometric correction).L5 TM scenes were processed using two different calibrationprocedures through the National Landsat Archive ProductionSystem (NLAPS). The first calibration procedure used the IC(based on linear regression through the detector responses toall lamp states collected during a scene acquisition time), andthe second approach used the revised and improved calibra-tion procedures. (LUT gains based on a lifetime radiometriccalibration gain model) The L7 ETM+ scenes were processedthrough the Image Assessment System (IAS) using the mostcurrent available calibration parameter file (CPF-19).
The L7 and L5 sensors differ in their along-track and across-track pixel sampling. Due to wearing of the bumpers used bythe L5 TM scanning mirror, along-track gaps between scans are
Fig. 11. Areas in common between the ETM+ and TM image pairs.
longer than they are for L7 ETM+. For the same reason and be-cause the ETM+ scan time is slightly longer than the specifica-
CHANDER et al.: LANDSAT-5 TM REFLECTIVE-BAND ABSOLUTE RADIOMETRIC CALIBRATION 2757
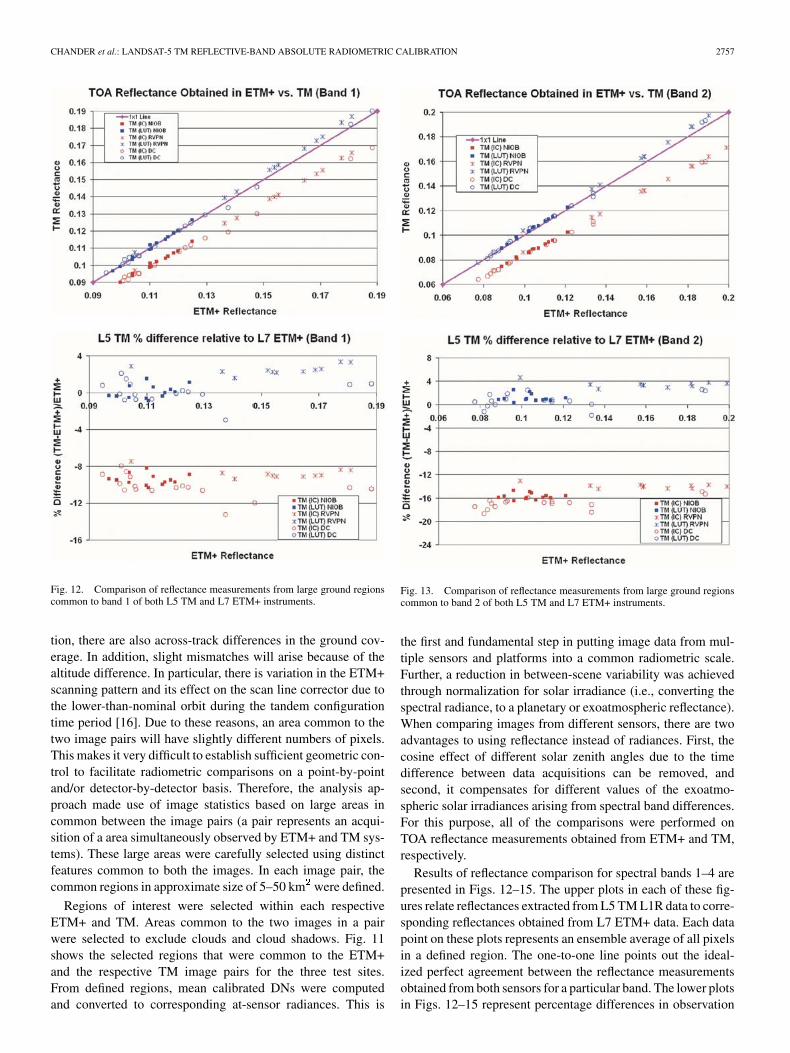
Fig. 12. Comparison of reflectance measurements from large ground regionscommon to band 1 of both L5 TM and L7 ETM+ instruments.
tion, there are also across-track differences in the ground cov-erage. In addition, slight mismatches will arise because of thealtitude difference. In particular, there is variation in the ETM+scanning pattern and its effect on the scan line corrector due tothe lower-than-nominal orbit during the tandem configurationtime period [16]. Due to these reasons, an area common to thetwo image pairs will have slightly different numbers of pixels.This makes it very difficult to establish sufficient geometric con-trol to facilitate radiometric comparisons on a point-by-pointand/or detector-by-detector basis. Therefore, the analysis ap-proach made use of image statistics based on large areas incommon between the image pairs (a pair represents an acqui-sition of a area simultaneously observed by ETM+ and TM sys-tems). These large areas were carefully selected using distinctfeatures common to both the images. In each image pair, thecommon regions in approximate size of 5–50 km were defined.
Regions of interest were selected within each respectiveETM+ and TM. Areas common to the two images in a pairwere selected to exclude clouds and cloud shadows. Fig. 11shows the selected regions that were common to the ETM+and the respective TM image pairs for the three test sites.From defined regions, mean calibrated DNs were computedand converted to corresponding at-sensor radiances. This is
Fig. 13. Comparison of reflectance measurements from large ground regionscommon to band 2 of both L5 TM and L7 ETM+ instruments.
the first and fundamental step in putting image data from mul-tiple sensors and platforms into a common radiometric scale.Further, a reduction in between-scene variability was achievedthrough normalization for solar irradiance (i.e., converting thespectral radiance, to a planetary or exoatmospheric reflectance).When comparing images from different sensors, there are twoadvantages to using reflectance instead of radiances. First, thecosine effect of different solar zenith angles due to the timedifference between data acquisitions can be removed, andsecond, it compensates for different values of the exoatmo-spheric solar irradiances arising from spectral band differences.For this purpose, all of the comparisons were performed onTOA reflectance measurements obtained from ETM+ and TM,respectively.
Results of reflectance comparison for spectral bands 1–4 arepresented in Figs. 12–15. The upper plots in each of these fig-ures relate reflectances extracted from L5 TM L1R data to corre-sponding reflectances obtained from L7 ETM+ data. Each datapoint on these plots represents an ensemble average of all pixelsin a defined region. The one-to-one line points out the ideal-ized perfect agreement between the reflectance measurementsobtained from both sensors for a particular band. The lower plotsin Figs. 12–15 represent percentage differences in observation

2758 IEEE TRANSACTIONS ON GEOSCIENCE AND REMOTE SENSING, VOL. 42, NO. 12, DECEMBER 2004
Fig. 14. Comparison of reflectance measurements from large ground regionscommon to band 3 of both L5 TM and L7 ETM+ instruments.
using the IC and LUT approach in L5 processing relative to L7data.
The plots clearly indicate a significant improvement towardconsistency of L5 data with L7 data achieved using the LUT ap-proach as opposed to the historical calibration procedure. Thepercentage mean difference in reflectance measurements ob-tained from the L5 TM relative to ETM+ in band 1 is reducedfrom about 9.5% to 1.3%, in band 2 from 15.6% to 1.8%, inband 3 from 10.8% to 2.6%, and in band 4 from 7.4% to 1.3%using the LUT calibration approach. Because the imaging ofscene pairs was performed only 10–30 min apart, the poten-tial changes in ground and atmospheric conditions should notsignificantly affect the comparison. The larger differences ob-served in low-reflectance range in band 3 are probably causedby low SNR in that portion of the instruments’ responsivities.In general, no spectral band adjustments were performed, somost of the remaining differences in all bands are accounted tothe different relative spectral response profiles of the L7 ETM+and corresponding L5 TM spectral bands. The consistency be-tween results from the three tandem image pairs is less than 3%for all of the bands, which is well beyond the specified 6%overall uncertainty for the targets with unknown spectral signa-tures [16].
Fig. 15. Comparison of reflectance measurements from large ground regionscommon to band 4 of both L5 TM and L7 ETM+ instruments.
V. CONCLUSION
The Landsat-5 TM sensor has continued to perform well overa period of time far exceeding its expected design life. The19-year image archive should remain very useful if the revisedcalibration procedures are used. The revised calibration proce-dure implemented in May 2003, along with the revised post-calibration dynamic ranges, will provide a data product seriesthat is more self-consistent and more consistent with Landsat-7ETM+ data. This improvement in the knowledge of the radio-metric accuracy of Landsat-5 over its lifetime is indicative of theadvancement in the state of the art of on-orbit satellite calibra-tion methods. It is also suggestive of the need for persistent cal-ibrations of an instrument over its lifetime, as well as the needfor a variety of calibration methods in order to assess the trueradiometric response of an instrument as accurately as possible.Based on the work done with Landsat-5 over the past 20 years,the radiometric fidelity of the instrument has exceeded all ex-pectations and may continue to do so for several more years.
ACKNOWLEDGMENT
The work presented in this paper is the culmination of amultiyear effort of a number of individuals. P. Teillet (Canada

CHANDER et al.: LANDSAT-5 TM REFLECTIVE-BAND ABSOLUTE RADIOMETRIC CALIBRATION 2759
Centre for Remote Sensing) initiated the Landsat TM Calibra-tion Working Group (LTMCALWG) during his sabbatical atthe Landsat Project Science Office at Goddard Space FlightCenter. The intention of the LTMCALWG charter is to improvethe historical radiometric calibration of the pre-L7 instruments.
REFERENCES
[1] B. L. Markham and J. L. Barker, “Spectral characterization of theLandsat Thematic Mapper sensors,” Int. J. Remote Sens., vol. 6, pp.697–716, 1985.
[2] K. J. Thome, B. L. Markham, J. L. Barker, P. L. Slater, and S. F. Biggar,“Radiometric calibration of Landsat,” Photogramm. Eng. Remote Sens.,vol. 63, pp. 853–858, 1997.
[3] P. M. Teillet, P. M. Helder, T. Ruggles, R. Landry, F. J. Ahern, N. J.Higgs, J. Barsi, G. Chander, B. L. Markham, J. L. Barker, K. J. Thome, J.R. Schott, and F. D. Palluconi, “Toward a definitive calibration record forthe Landsat-5 Thematic Mapper anchored to the Landsat-7 radiometricscale,” Can. J. Remote Sens., vol. 30, no. 4, pp. 631–643, Aug. 2004.
[4] G. Chander and B. L. Markham, “Revised Landsat-5 TM radiometriccalibration procedures, and postcalibration dynamic ranges,” IEEETrans. Geosci. Remote Sensing, vol. 41, pp. 2674–2677, Nov. 2003.
[5] B. L. Markham and J. L. Barker, “Landsat MSS and TM post-calibra-tion dynamic ranges, exoatmospheric reflectances and at-satellite tem-peratures,”, vol. 1, EOSAT Landsat Tech. Notes, Aug. 1986.
[6] D. L. Helder and T. A. Ruggles, “Landsat Thematic Mapper reflective-band radiometric artifacts,” IEEE Trans. Geosci. Remote Sensing, vol.42, pp. 2704–2716, Dec. 2004.
[7] G. Chander, D. L. Helder, and W. C. Boncyk, “Landsat-4/5 band-6 rel-ative radiometry,” IEEE Trans. Geosci. Remote Sensing, vol. 40, pp.206–210, Jan. 2002.
[8] NASA GSFC, “Landsat to ground station interface description,” God-dard Space Flight Center, Greenbelt, MD, Rev. 9, Jan. 1986.
[9] K. J. Thome, B. G. Crowther, and S. F. Biggar, “Reflectance and irradi-ance based calibration of Landsat-5 Thematic Mapper,” Can. J. RemoteSens., vol. 23, pp. 309–317, 1997.
[10] D. L. Helder, “A radiometric calibration archive for Landsat TM,” Proc.SPIE, vol. 2758, pp. 273–284, June 1996.
[11] D. L. Helder, J. L. Barker, W. C. Boncyk, and B. L. Markham, “Shortterm calibration of Landsat TM: Recent findings and suggested tech-niques,” in Proc. IGARSS, Lincoln, NE, 1996, pp. 1286–1289.
[12] D. L. Helder, W. C. Boncyk, and R. Morfitt, “Absolute calibration ofthe Landsat Thematic Mapper using the internal calibrator,” in Proc.IGARSS, Seattle, WA, 1998, pp. 2716–2718.
[13] B. L. Markham, J. C. Seiferth, J. Smid, and J. L. Barker, “Lifetime re-sponsivity behavior of the Landsat-5 Thematic Mapper,” Proc. SPIE,vol. 3427, pp. 420–431, 1998.
[14] P. M. Teillet, D. L. Helder, B. L. Markham, J. L. Barker, K. J. Thome,R. Morfitt, J. R. Schott, and F. D. Palluconi, “A lifetime radiometric cal-ibration record for the Landsat Thematic Mapper,” in Proc. Can. Symp.Remote Sensing, Aug. 2001, pp. 17–25.
[15] South Dakota State Univ. (SDSU). Radiometric characterization andcalibration of Landsat-4/5 Thematic Mappers. Image ProcessingLab, South Dakota State Univ., Brookings. [Online]. Available:http://iplab2out.sdstate.edu/projects/landsat45/tmcal/index.html.
[16] P. M. Teillet, J. L. Barker, B. L. Markham, R. R. Irish, G. Fedosejevs,and J. C. Storey, “Radiometric cross-calibration of the Landsat-7 ETM+and Landsat-5 TM sensors based on tandem data sets,” Remote Sens.Environ., vol. 78, no. 1–2, pp. 39–54, 2001.
Gyanesh Chander received the M.S. degree in elec-trical engineering from South Dakota State Univer-sity, Brookings, in 2001.
He is currently a Scientist with Science Applica-tions International Corporation (SAIC) at the EarthResources Observation System Data Center, U.S. Ge-ological Survey, Sioux Falls, SD. He works on radio-metric characterization and calibration of satellitesand airborne instruments.
Dennis L. Helder (S’88–M’90) received the B.S.degrees in animal science and electrical engineering,the M.S. degree in electrical engineering from SouthDakota State University, Brookings, and the Ph.D.degree in electrical engineering from North DakotaState University, Fargo, in 1979, 1980, 1985, and1991, respectively.
For the past ten years, he has worked extensivelywith the Earth Resources Observation System DataCenter, the National Aeronautics and Space Admin-istration’s Goddard Space Flight Center (GSFC), and
Stennis Space Center in the area of radiometric, geometric, and spatial calibra-tion of satellite imagery. Other activities include consulting, membership on theinternational Committee of Earth Observation Satellites Infrared, Visible, andOptical Sensor’s subcommittee, a Visiting Scientist appointment at GSFC, de-velopment of the Landsat-7 image assessment system with GSFC, and designof aircraft imaging systems.
Brian L. Markham (M’04) received the B.S. de-gree with a specialization in natural resources and theM.S. degree in remote sensing from Cornell Univer-sity, Ithaca, NY, in 1976 and 1978, respectively, andthe M.S. degree in applied physics from The JohnsHopkins University, Baltimore, MD, in 1996.
He has been a Physical Scientist at the NationalAeronautics and Space Administration GoddardSpace Flight Center, Greenbelt, MD, since 1978.His research has focused on characterizing the ra-diometric properties of ground, aircraft, and satellite
sensor systems, as well as characterizing atmospheric aerosol optical propertiesfor correction of optical remote sensing data. He has been the Landsat Cali-bration Scientist since 1993, where he has been involved in the prelaunch andon-orbit radiometric characterization and calibration of the Landsat-7 ETM+sensor.
James D. Dewald (S’92–M’92) received the B.S. de-gree in electrical engineering and the M.S. degreein engineering from South Dakota State University(SDSU), Brookings, in 1992 and 1994, respectively.
He is currently with the Department of ElectricalEngineering and Computer Science, SDSU, in bothan instructional and research capacity. His current re-search activities include radiometric sensor calibra-tion and application of remotely sensed data for agri-culture purposes.
Ed Kaita received the B.S. degree in physics andastronomy from the State University of New York,Stony Brook, and the M.S. degree in physics fromthe University of Kentucky, Lexington.
He has worked within the National Aeronauticsand Space Administration Goddard Space FlightCenter contractor community for the past twodecades supporting instrument and data calibrationactivities for the Hubble Space Telescope, the Cos-mological Background Explorer Satellite, and mostrecently the Landsat-7 project.

2760 IEEE TRANSACTIONS ON GEOSCIENCE AND REMOTE SENSING, VOL. 42, NO. 12, DECEMBER 2004
Kurtis J. Thome received the B.S. degree in meteo-rology from Texas A&M University, College Station,and the M.S. and Ph.D. degrees in atmospheric sci-ences from the University of Arizona, Tucson.
He is currently an Associate Professor of opticalsciences at the University of Arizona, where he is thehead of the Remote Sensing Group. He has servedas a member of the Landsat-7, ASTER, and MODISscience teams. His current research is focused on thevicarious calibration of earth-imaging sensors and re-lated studies in atmospheric remote sensing, radiative
transfer, and satellite atmospheric correction
Esad Micijevic received the B.S. degree in electricalengineering from the University of Zagreb, Zagreb,Croatia, and the M.S. degree in engineering fromSouth Dakota State University, Brookings.
He has been working on Landsat radiometric andgeometric characterization and calibration since2001 and has been with Science Applications In-ternational, Corporation, EROS Data Center, SiouxFalls, SD, since 2003.
Timothy A. Ruggles (S’91–M’92) received the B.S.degree in engineering physics/electrical engineeringand the M.S. degree in electrical engineering fromSouth Dakota State University (SDSU), Brookings,in 1992 and 1996, respectively.
He is currently an Imaging Engineer with theImage Processing Laboratory, SDSU, working onissues related to radiometric characterization andcalibration of earth imaging sensors such as theLandsat-5 Thematic Mapper and the EO-1 AdvancedLand Imager.