Land, water and energy use efficiencies of potato ...
42
Land, water and energy use efficiencies of potato production in South Africa JM Steyn 1 , JE van der Waals 1 , AC Franke 2 , AJ Haverkort 1,2 1 University of Pretoria 2 Wageningen University
Transcript of Land, water and energy use efficiencies of potato ...

Land, water and energy use efficiencies of potato production in South Africa
JM Steyn1, JE van der Waals1,
AC Franke2, AJ Haverkort1,2
1University of Pretoria 2Wageningen University

Layout of presentation
Introduction:
The SA potato industry
Resource use efficiencies
Methodology
Results Land
Water
Energy (CO2)
What can we do about it?

Introduction
± 50 000 ha potatoes produced
16 geographical regions of SA
Potato regions differ in
soils, climate, production practices

Production practices also differ for table, processing, seed
These affect
amount of input resources used to produce potatoes
resource use efficiencies (footprints)
Introduction

Introduction Potato – requires high input levels
Seed, fertilizers, pest control chemicals, energy
Cost of energy has risen sharply
High input cost >>R100 000/ha
Product prices – almost constant
Significant negative impact on financial sustainability

Introduction
High resource input levels also affect environmental sustainability
Expressed as efficiencies or Environmental Footprints

Land use efficiency
LUE = yield per unit area of land (t/ha)

Energy use efficiency
Energy inputs per ton of potato
or “Carbon footprint”
Total amount of “greenhouse gases” produced by any activity
Expressed in tons of CO2 produced
Includes energy used for 1o and 2o production

Water use efficiency Yield per unit of water used
(kg/ha/mm water)
or “Water footprint” Total volume of water used to produce
a unit of product (L/kg)
Includes both direct and indirect water use
Examples of some food products:
80 L/ orange (150 gram)
1020 L/ L orange juice

“Water footprints”
4620 L / 300g steak
43 L / 150 g potato
Resource use efficiencies = indicators of sustainability of production
not determined for SA potato production before

Objectives
To assess and benchmark potato production areas regarding their
use of land,
water,
energy (carbon)

Objectives
Identify resource intensive practices
Recommend interventions how to address these
Improve environmental and economic sustainability

Methodology
Surveys in all 16 potato production regions
Interviewed >3 farmers per production system (seed, table, processing)
±100 farmers interviewed = 15%
±100 questions – inputs, practices Processed per farm, region and
country

Land use efficiency
5 year average yields (t/ha)
Yield gap analysis = actual yield vs. calculated potential yields
Using LINTUL-potato growth model
temp, radiation, water inputs
Root zone
Drainage
Rain &
Irrigation
Evapo-
transpiration

Water use efficiency
Irrigation need = ET - rainfall
WU = rainfall + total amount of irrigation applied in season
WUE = kg/ha potato mm-1
Only water used for 1o production – not washing plant
Actual water use vs. LINTUL model simulated need

Energy use efficiency
Used “Cool Farm Tool-Potato” (CFT-Potato) (Haverkort & Hiller, 2011)
Decision support tool for growers / companies to calculate their CO2 footprints
Total kg CO2 equivalent greenhouse gases produced / ton potatoes

RESULTS

Land use efficiency
0
10
20
30
40
50
60
70
HV NW SWFS WFS Ceres Lim SV GT SC NC MH KZN NEC EC SWC EFS
Fre
sh t
ub
er
yie
ld (
t/h
a)
Region
LUE

Land use efficiency
0
20
40
60
80
100
120
HV NW SWFS WFS Ceres Lim SV GT SC NC MH KZN NEC EC SWC EFS
Fre
sh
tu
ber
yie
ld (
t/h
a)
Region
Average actual yield
Calculated potential yield

Land use efficiency
0
0.1
0.2
0.3
0.4
0.5
0.6
0.7
0.8
0.9
SC Ceres GT HV WFS NW MH KZN SWFS Lim NC EC NEC SV SWC EFS
Ra
tio
Act
ua
l y
ield
/ P
ote
nti
al y
ield
Region

Land use efficiency
0
10
20
30
40
50
60
70
1 2 3 4 5 6 7 8 9
Fre
sh t
ub
er
yie
ld (
t/h
a)
Grower

Actual Irrigation
0
100
200
300
400
500
600
700
800
900
SWC Ceres SV SWFS GT MH Lim NW WFS NC EC HV KZN SC NEC EFS
Act
ua
l irr
iga
tio
n a
mo
un
t (m
m)
Region

Actual Irrigation vs Irrigation need
0
100
200
300
400
500
600
700
800
900
Cer SV SWFS GT MH WFS Lim NW NC EC HV KZN SC NEC EFS
Irri
gati
on
ne
ed
(m
m)
Region
Average Actual irrigation
Calculated Irrigation need

Actual Irrigation vs Irrigation need
y = 0.1828x + 104.49
R² = 0.115
0
50
100
150
200
250
300
350
400
450
0 100 200 300 400 500 600 700 800 900
Ca
lcu
late
d I
rrig
ati
on
ne
ed
(m
m)
Actual Irrigation (mm)

Actual Irrigation vs Irrigation need
y = 0.7685x - 122.81
R² = 0.6526
0
50
100
150
200
250
300
350
400
450
0 100 200 300 400 500 600 700
Ca
lcu
late
d I
rrig
ati
on
ne
ed
(m
m)
Actual Irrigation (mm)

Water use efficiency (Irrigation + rainfall)
0
20
40
60
80
100
120
140
HV Lim NW SC MH WFS SWFS KZN GT NC NEC SV EC EFS Cer SWC
Wa
ter
Use
Eff
icie
ncy
(k
g/h
a/m
m)
Region
18 L / medium tuber

Water use efficiency (Irrigation + rainfall)
0
500
1000
1500
2000
1 2 3 4 5 6 7 8 9
WU
E (
L/1
0k
g b
ag
)
Grower

Energy use efficiency 2
17 4
8
9
5 3 9 8 5 7 3 11
3 7
5
0
50
100
150
200
250
300
350
400
450
500
SWC SV GT Ceres Lim NW EC WFS NC MH NEC SC KZN SWFS EFS HV
kg
CO
2 e
q.
/ t
fre
sh p
ota
to
Region
Total

Energy use efficiency
0
50
100
150
200
250
300
350
SV GT Ceres Lim NW EC WFS NC MH NEC SC KZN SWFS EFS HV
kg
CO
2 e
q.
/ t
fre
sh p
ota
to
Regions
Other
Farm gate transport
Grading, cooling, storage
Irrigation
Fertiliser-related

Carbon footprint
NW SW-FS
Fertiliser-related
Irrigation
Grading, cooling,
storageFarm gate transport
Other

Nutrient rate/ha
0
100
200
300
400
500
600
700
800
900
1000
SC EFS EC MH NC SWFS Lim KZN HV NEC WFS SWC NW GT Cer SV
kg
/ha
N,
P, K
Region
N
P
K

Potassium use efficiency
0
50
100
150
200
250
300
350
400
450
500
SWFS EC SC WFS EFS Lim NC HV MH NEC KZN NW GT Cer SV SWC
K u
se e
ffii
cie
ncy
(k
g p
ota
to/k
g K
)
Region
KUE

Energy use efficiency
0
50
100
150
200
250
300
350
SV GT Ceres Lim NW EC WFS NC MH NEC SC KZN SWFS EFS HV
kg
CO
2 e
q.
/ t
fre
sh p
ota
to
Regions
Other
Farm gate transport
Grading, cooling, storage
Irrigation
Fertiliser-related
Netherlands
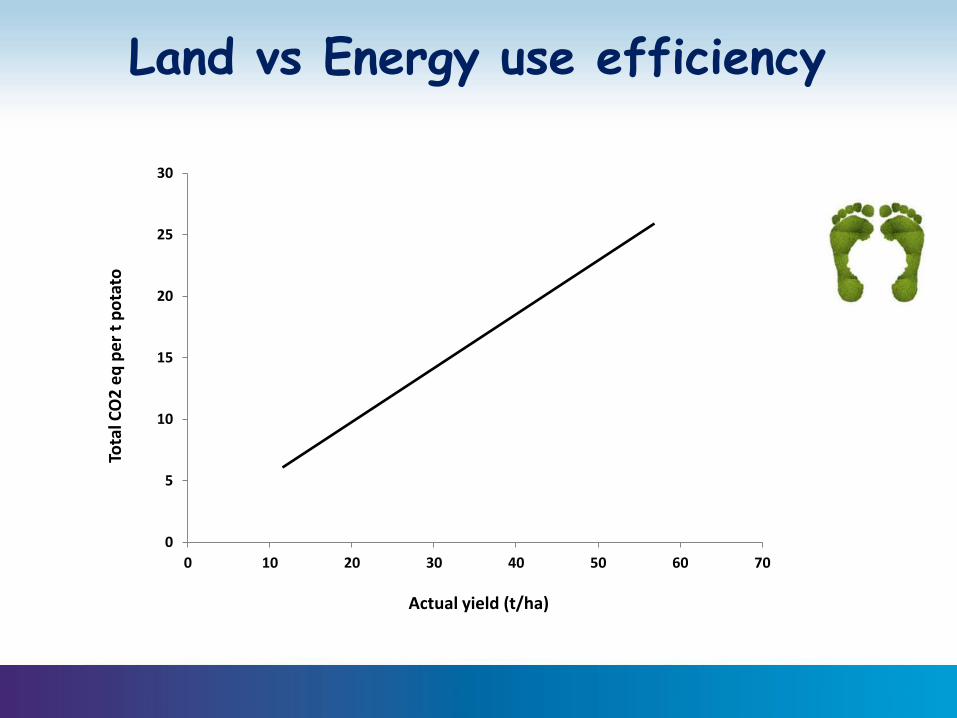
Land vs Energy use efficiency
0
5
10
15
20
25
30
0 10 20 30 40 50 60 70
Tota
l CO
2 e
q p
er
t p
ota
to
Actual yield (t/ha)

Land vs Energy use efficiency All regions
y = -0.3135x + 29.569
R² = 0.2442
0
5
10
15
20
25
30
0 10 20 30 40 50 60 70
Tota
l CO
2 e
q p
er
t p
ota
to
Actual yield (t/ha)

Energy use efficiency
0
50
100
150
200
250
300
1 2 3 4 5 6 7 8 9
kg
CO
2 e
q.
/ t
fre
sh p
ota
to
Grower
Fertiliser-related
Pesticides
Transport (farm-gate)
Other (ex pesticides)
Grading, cooling, storage
Irrigation

Energy use efficiency
0
50
100
150
200
250
300
350
SV GT Ceres Lim NW EC WFS NC MH NEC SC KZN SWFS EFS HV
kg
CO
2 e
q.
/ t
fre
sh p
ota
to
Regions
Transport to market
Other
Farm gate transport
Grading, cooling, storage
Irrigation
Fertiliser-related

Discussion and Conclusions
Significant range in energy use efficiency (C-footprints) between regions
Soils, climate, practices differ
Also between growers within a region
Major contributors to energy use:
Fertilizers - 35%
Irrigation - 30%
Transport - 6.5% (20% incl. to market)
Nutrient levels vary substantially
Low efficiencies for some growers & regions
LUE – country average 43 t/ha = 63% of potential
WUE – average of 80 kg/ha/mm
Vast differences between & within regions
Opportunity for improvement
Discussion and Conclusions

Where to from here?
What can be done about it?
Set norms and move the curve
50 100 150 200 250 300
kg CO2 /t potato
% o
f p
rod
uce
rs
Discussion and Conclusions

Identify most inefficient practices – per region / individual growers
Interact with growers - feedback sessions
Explore options to improve efficiencies by altering practices / field operations
e.g. lower application levels of chemicals or fertilizers
use decision support systems, e.g. irrigation scheduling tools / fertilizer recommendations
Improve environmental & financial sustainability
Discussion and Conclusions

Acknowledgements
Potato growers in different regions
Potatoes South Africa
University of Pretoria
Netherlands Embassy
THRIP