Land use planning and the siting of nuclear installations ... · A Note on Land Use Planning and...
12
Health and Safety Executive Health and Safety Executive Nuclear Directorate LAND USE PLANNING AND THE SITING OF NUCLEAR INSTALLATIONS IN THE UNITED KINGDOM A note by the Health & Safety Executive’s (HSE) Nuclear Installations Inspectorate (NII) , describing the basis for its advice on demographics in relation to developments around existing nuclear licensed sites, and on the siting of proposed nuclear installations
-
Upload
phungkhanh -
Category
Documents
-
view
216 -
download
0
Transcript of Land use planning and the siting of nuclear installations ... · A Note on Land Use Planning and...
Health and Safety Executive
Health and Safety Executive
Nuclear Directorate
LAND USE PLANNING AND
THE SITING OF NUCLEAR INSTALLATIONS
IN THE UNITED KINGDOM
A note by the Health & Safety Executive’s (HSE) Nuclear Installations Inspectorate (NII) , describing the basis for its advice on demographics in relation to developments around existing nuclear licensed sites, and on the siting of proposed nuclear installations
Summary
Since the start of the civil nuclear power programme in the 1960s, the government has applied a policy of siting new nuclear power plants in areas where the population density does not exceed certain thresholds, and where the growth of that population can be monitored and controlled. This is done by means of land use planning policies which require local planning authorities to carefully consider the impact of new developments within ‘consultation zones’ around each nuclear site. The aim was to avoid the population around the station steadily rising to an undesirable level. The policy and its application is now extended to all nuclear installations. The UK Government’s policy on the siting of nuclear power stations was, in the 1960’s, based on the advice and recommendations of its Nuclear Safety Advisory Committee. Responsibility for the implementation of this policy was vested in the Nuclear Installations Inspectorate (NII), who developed methods and criteria on which advice could be provided in relation to the siting of new nuclear plants, and subsequently on the control of population around such site after they had begun operation. This note describes HSE’s current approach to providing advice in relation to the population distribution (or ‘demographics’) near to proposed or existing nuclear sites. This is particularly pertinent at the moment with the growth of interest in the siting of new nuclear power stations and the note explains how HSE’s advice has informed the Government’s Strategic Siting Assessment process. The main part of this note is descriptive and is intended to be of interest to non-technical readers. Two annexes provide more technical detail and a worked example which will be of interest to those with a more technical background.
A Note on Land Use Planning and the Siting of Nuclear Installations in the United Kingdom Background HSE’s regulation of UK health and safety laws require that the Nuclear Site Licensees operate their nuclear installations in such a way that risks to employees and to the general public are as low as reasonably practicable (ALARP). HSE applies a range of regulatory procedures, including inspection and assessment to make judgements about the licensee’s compliance with the law, through their safety cases and licensing conditions which are benchmarked against international requirements and standards. Although Licensees put in place arrangements to demonstrate compliance with legal controls to ensure that the chances of an accident leading to the release of radioactivity into the environment are very low, the risk of such an accident cannot be eliminated. Measures, to reduce the chance of a release, and control any that occur are based on the reliability and control systems for complex plant and equipment, which is supported by operator procedures. Additionally, emergency preparedness and response arrangements are put in place to minimise and mitigate the health consequences of any significant radiological release that might occur. Emergency arrangements cover the actions to be taken by the local emergency authorities and services, to assist and protect people living in the vicinity of the nuclear installation. The key objective is to ensure that all these planned actions would operate effectively during the course of a potential accident and the subsequent recovery phase. Emergency planning arrangements are regularly practised and tested, with the efficiency and effectiveness of response being related to the assumptions made about population density and controls. For that reason, since the start of the civil nuclear power programme in the 1960s, the government has applied a policy of siting new nuclear power plants in areas where the population density does not exceed certain thresholds, and where the growth of that population can be monitored and controlled. This is done by means of land use planning policies which require local councils to carefully consider the impact of new developments within ‘consultation zones’ around each nuclear site. The aim was to avoid the population around the station steadily rising to an undesirable level. This policy has been reinforced at public inquires in the 1980s for the development of the Sizewell B and proposed Hinkley Point C power stations. Consultation criteria are in place around all licensed nuclear sites with arrangements for planning authorities to consult NII about planning applications (details can be found at: http://www.hse.gov.uk/landuseplanning/nuclear.htm ) NII’s Approach to Demographic Assessment In 2008, the Nuclear Installations Inspectorate (NII) produced a paper to the then Health & Safety Commission’s Nuclear Safety Advisory Committee (NuSAC) (9&10) . The aim was to refresh and update the published demographic criteria for the siting of nuclear installations in the UK, not least to inform UK Government policy on the suitability of sites for proposed new power stations, in terms of their compatibility with surrounding distribution of populations (known as demographics). NII’s suggested method for assessing demographics in

relation to siting new installations is based on international best practice and guidelines, including those produced by the International Atomic Energy Agency (IAEA) and the NII’s Safety Assessment Principles (SAPs)8 for Nuclear Facilities. These approaches seek to limit the scale of harmful effects of radiation in the remote chance of an accident at a nuclear facility by limiting the number of people living and working in the vicinity. The approach also acknowledges that new nuclear ‘power stations’ will be designed and constructed to engineering standards that have been developed from international operating experience over the last 50 years and are therefore expected to be safer than those existing power stations which are nearing the end of operation. Demographics and Advice to Local Planning Authorities about new development in the vicinity of nuclear installations The NuSAC paper also reinforced the basis of the method for assessing the significance of population growth arising from new developments in the vicinity of existing nuclear installations. As stated above controls over development have been in place for many years and seek to preserve the desirable population characteristics from the time a nuclear installation is first licensed, and throughout its operating life. NII is consulted by Local Planning Authorities (LPAs) and provides advice about certain types of development before the LPA decides on planning permission. NII’s advice takes into account the significance of any increase in population and impact on the capability of local emergency arrangements. Strategic Siting Assessment (SSA) for new Nuclear Power Stations The Government’s proposed approach to the assessment and decision making process on the potential suitability of sites for new nuclear power stations will take into account a number of social, environmental and operational factors. Further details about the Government’s SSA process can be found at the web site of the Department of Energy and Climate Change (DECC) http://www.nuclearpowersiting.decc.gov.uk/nominations/ SSA Criteria & those for Demographic Assessment One of the SSA criteria places a restriction on the local population density and distribution which if exceeded will categorically exclude a site from further consideration. For the purpose of the Strategic Siting Assessment SSA, the Government has decided to adopt an established “semi urban” siting criteria as an ‘exclusionary’ limit. Because of NII’s expertise and experience in demographic analysis, DECC asked NII to undertake an assessment of the sites nominated as part of the SSA process against the “semi-urban” criteria. In this assessment, should areas of a nominated site exceed the semi-urban criteria the Government would consider further advice from the regulators to see whether the site remains viable. Such flexibility is possible, because at the stage of nuclear licensing it would be stipulated that the nuclear island, ie those elements which have a direct potential to cause radiological hazard would be in the area of the site which does not exceed the semi-urban criteria. Furthermore this assessment process is independent of any knowledge about the design of the nuclear reactor; the only purpose is to determine whether a

proposed site should be excluded, because the near site population density is too high. The semi-urban ‘limiting criterion’ derives from cumulative weighted populations present in a given area (ie population density – or number of people per square kilometre). A weighting factor is attached to take account of the reduction in radiation dose, with distance from a possible accident situation. The population is measured out to various radial distances all around the nominated site, and in any 30 degree sector, then compared to constraint limits. Technical details of the basis for the demographics assessment are given in Annex 1. A worked example is given in Annex 2. New Nuclear Power Stations - Site Specific Assessment If a nominated site meets the Strategic Siting Assessment criteria then it may be included in the Government’s Nuclear National Policy Statement. Developers wishing to construct a power station on one of those sites must obtain a site licence from NII. As part of its licensing assessment, NII will undertake a more detailed consideration of viability of the site on the basis of the risk to persons off the site presented by the proposed reactor design. That risk will be compared with risk targets contained within NII’s Safety Assessment Principles (SAPs)8 . Control of Future Population at Developments around Nuclear Sites The recently published Nuclear National Policy Statement from the Department of Energy and Climate Change (DECC) restates the Government’s longstanding policy regarding local demographics which would limit the radiological consequences to the public in the unlikely event of an accident involving the spread of radioactive materials beyond the site boundary. This policy is a measure of prudence over and above the stringent regulatory requirements imposed on nuclear operators to prevent such accidents. The Health and safety Executive, through the Nuclear Installations Inspectorate administers the Government’s policy on the control of population around existing licensed nuclear sites. Planning Authorities take this advice into account in considering whether or not to approve planning applications. Furthermore once a new power station receives planning consent, and a nuclear site license, arrangements will be put in place with Local Planning Authorities and Nuclear Site Licensees, which place constraints on development around nuclear sites. These constraints are designed to control residential, industrial and commercial developments. The aim is to preserve the general characteristics of the area around the nuclear site throughout its lifecycle, and to ensure that the basis on which the site is licensed is not undermined.
ANNEX 1: Technical Basis for HSE’s Demographics Assessments Historical Approach to Demographic Assessment The early approach for considering demographic siting criteria in the UK was developed from the work of Charlesworth and Gronow (7) , and was based on a consideration of the dispersion characteristics of the generalized Gaussian Plume Model for estimating the dispersion of a prolonged, accidental release of radioactive material. This approach was developed in a series of papers by the Health & Safety Commission’s Advisory Committee on the Safety of Nuclear Installations (ACSNI) from 1978 to 1988, leading to the definition of a “semi-urban” siting criterion which was described in a ministerial statement to Parliament in March 1988. Further details are provided in NuSAC P12 (2008)9 and its Addendum (2008)10 which includes the historical development of demographic siting criteria. Approach for Generic Screening Demographic Assessment The current approach considers the population in the vicinity of an installation which is compared with standard reference population distributions. A Generic Site Population Factor (SPF)11 is calculated based on the maximum of the actual weighted population density around the site divided by the reference weighted population density. The absolute value of the Generic SPF provides a simple indication of the relative risks associated with different sites, based on an assessment of 30 degree sectors, and also the total population all around the site. In both cases, the cumulative weighted populations are considered for each radial distance band out to 30 km. Sector rotations of 5 degree intervals ie 72 distinct sectors, is used to identify the most densely populated 30 degree sector. On the basis of HSE’s advice the Government has decided that if a SPF for any location proposed new site exceeds the semi-urban demographic siting criteria previously used for Advanced Gas-Cooled Reactors ( AGRs), then the local population density is too high to permit the siting of a nuclear power station at that location. This led to the adoption of an Exclusionary Criterion, in the Government’s Strategic Siting Assessment process, based on the ‘semi-urban’ criterion. It is emphasised that the generic SPF does not take into account any features of the design of any particular type of station, but simply gives a measure of the population density in the vicinity. Whilst this provides a useful measure for comparing sites, and for providing an initial assessment, the actual risks associated with any particular station will be site specific, and will depend on the extent to which the installation meets the relevant targets in the Safety Assessment Principles, which would be considered by NII during the process of nuclear site licensing.
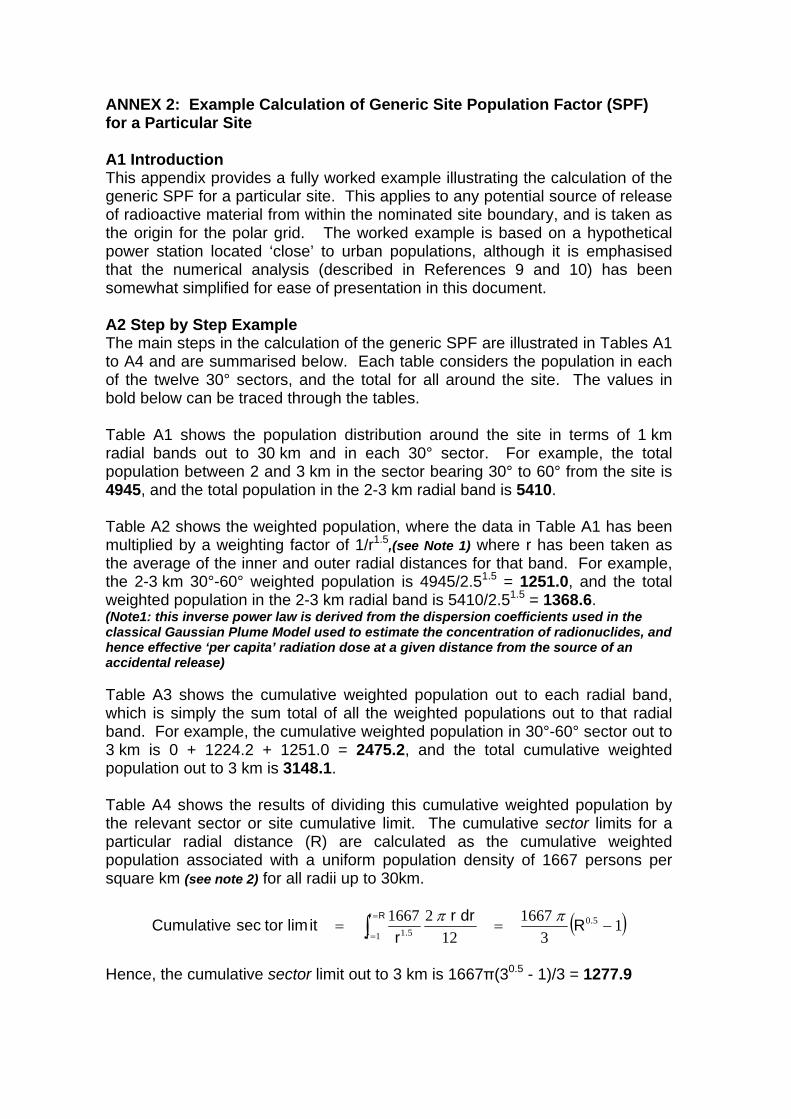
ANNEX 2: Example Calculation of Generic Site Population Factor (SPF) for a Particular Site A1 Introduction This appendix provides a fully worked example illustrating the calculation of the generic SPF for a particular site. This applies to any potential source of release of radioactive material from within the nominated site boundary, and is taken as the origin for the polar grid. The worked example is based on a hypothetical power station located ‘close’ to urban populations, although it is emphasised that the numerical analysis (described in References 9 and 10) has been somewhat simplified for ease of presentation in this document. A2 Step by Step Example The main steps in the calculation of the generic SPF are illustrated in Tables A1 to A4 and are summarised below. Each table considers the population in each of the twelve 30° sectors, and the total for all around the site. The values in bold below can be traced through the tables. Table A1 shows the population distribution around the site in terms of 1 km radial bands out to 30 km and in each 30° sector. For example, the total population between 2 and 3 km in the sector bearing 30° to 60° from the site is 4945, and the total population in the 2-3 km radial band is 5410. Table A2 shows the weighted population, where the data in Table A1 has been multiplied by a weighting factor of 1/r1.5,(see Note 1) where r has been taken as the average of the inner and outer radial distances for that band. For example, the 2-3 km 30°-60° weighted population is 4945/2.51.5 = 1251.0, and the total weighted population in the 2-3 km radial band is 5410/2.51.5 = 1368.6. (Note1: this inverse power law is derived from the dispersion coefficients used in the classical Gaussian Plume Model used to estimate the concentration of radionuclides, and hence effective ‘per capita’ radiation dose at a given distance from the source of an accidental release) Table A3 shows the cumulative weighted population out to each radial band, which is simply the sum total of all the weighted populations out to that radial band. For example, the cumulative weighted population in 30°-60° sector out to 3 km is 0 + 1224.2 + 1251.0 = 2475.2, and the total cumulative weighted population out to 3 km is 3148.1. Table A4 shows the results of dividing this cumulative weighted population by the relevant sector or site cumulative limit. The cumulative sector limits for a particular radial distance (R) are calculated as the cumulative weighted population associated with a uniform population density of 1667 persons per square km (see note 2) for all radii up to 30km.
( )13
166712
21667 50
1 51 −== ∫=
=
.Rr
r . Rdrrr
itlimtorsecCumulative ππ
Hence, the cumulative sector limit out to 3 km is 1667π(30.5 - 1)/3 = 1277.9
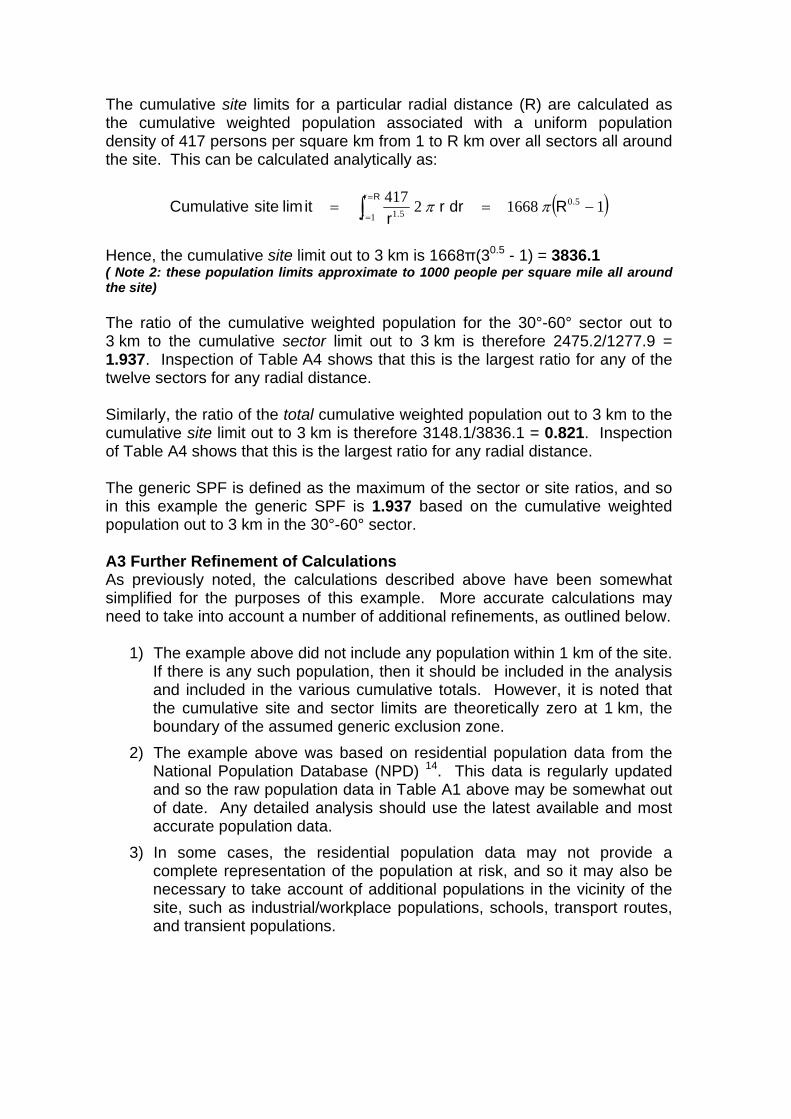
The cumulative site limits for a particular radial distance (R) are calculated as the cumulative weighted population associated with a uniform population density of 417 persons per square km from 1 to R km over all sectors all around the site. This can be calculated analytically as:
( )116682417 50
1 51 −== ∫=
=
.Rr
r . Rdrrr
itlimsiteCumulative ππ
Hence, the cumulative site limit out to 3 km is 1668π(30.5 - 1) = 3836.1 ( Note 2: these population limits approximate to 1000 people per square mile all around the site) The ratio of the cumulative weighted population for the 30°-60° sector out to 3 km to the cumulative sector limit out to 3 km is therefore 2475.2/1277.9 = 1.937. Inspection of Table A4 shows that this is the largest ratio for any of the twelve sectors for any radial distance. Similarly, the ratio of the total cumulative weighted population out to 3 km to the cumulative site limit out to 3 km is therefore 3148.1/3836.1 = 0.821. Inspection of Table A4 shows that this is the largest ratio for any radial distance. The generic SPF is defined as the maximum of the sector or site ratios, and so in this example the generic SPF is 1.937 based on the cumulative weighted population out to 3 km in the 30°-60° sector. A3 Further Refinement of Calculations As previously noted, the calculations described above have been somewhat simplified for the purposes of this example. More accurate calculations may need to take into account a number of additional refinements, as outlined below.
1) The example above did not include any population within 1 km of the site. If there is any such population, then it should be included in the analysis and included in the various cumulative totals. However, it is noted that the cumulative site and sector limits are theoretically zero at 1 km, the boundary of the assumed generic exclusion zone.
2) The example above was based on residential population data from the National Population Database (NPD) 14. This data is regularly updated and so the raw population data in Table A1 above may be somewhat out of date. Any detailed analysis should use the latest available and most accurate population data.
3) In some cases, the residential population data may not provide a complete representation of the population at risk, and so it may also be necessary to take account of additional populations in the vicinity of the site, such as industrial/workplace populations, schools, transport routes, and transient populations.
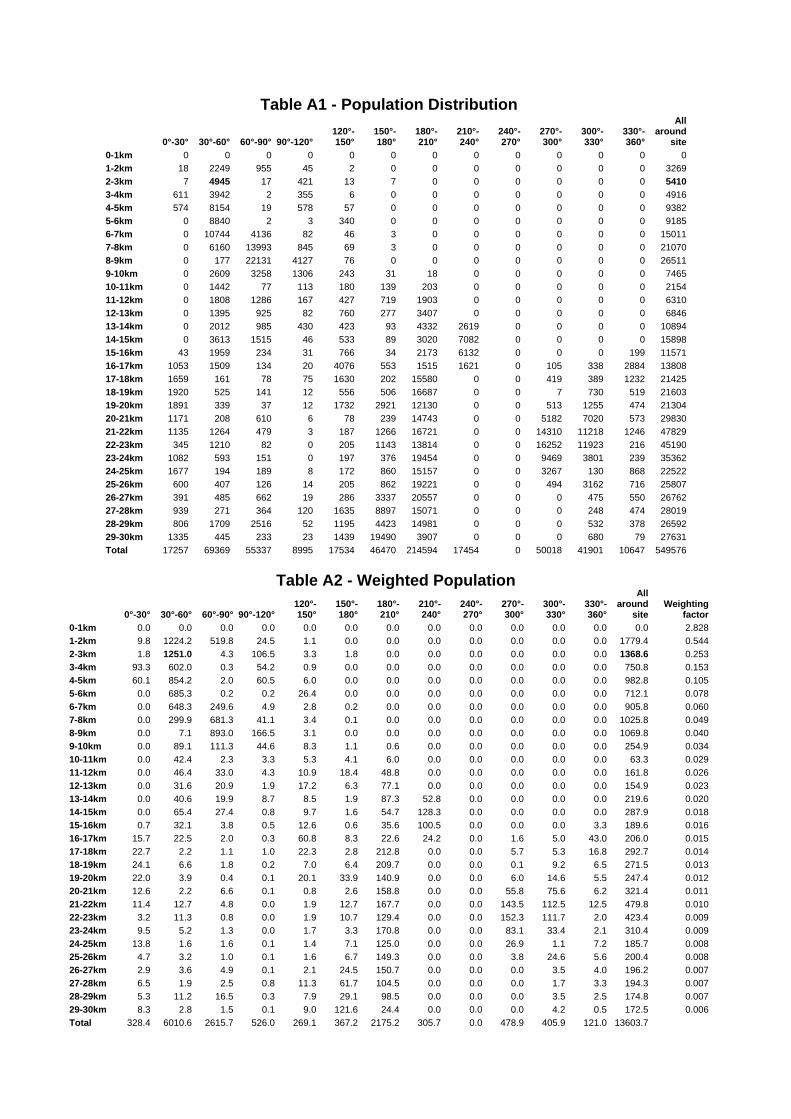
Table A1 - Population Distribution
0°-30° 30°-60° 60°-90° 90°-120°120°-150°
150°-180°
180°-210°
210°-240°
240°-270°
270°-300°
300°-330°
330°-360°
All around
site0-1km 0 0 0 0 0 0 0 0 0 0 0 0 01-2km 18 2249 955 45 2 0 0 0 0 0 0 0 32692-3km 7 4945 17 421 13 7 0 0 0 0 0 0 54103-4km 611 3942 2 355 6 0 0 0 0 0 0 0 49164-5km 574 8154 19 578 57 0 0 0 0 0 0 0 93825-6km 0 8840 2 3 340 0 0 0 0 0 0 0 91856-7km 0 10744 4136 82 46 3 0 0 0 0 0 0 150117-8km 0 6160 13993 845 69 3 0 0 0 0 0 0 210708-9km 0 177 22131 4127 76 0 0 0 0 0 0 0 265119-10km 0 2609 3258 1306 243 31 18 0 0 0 0 0 746510-11km 0 1442 77 113 180 139 203 0 0 0 0 0 215411-12km 0 1808 1286 167 427 719 1903 0 0 0 0 0 631012-13km 0 1395 925 82 760 277 3407 0 0 0 0 0 684613-14km 0 2012 985 430 423 93 4332 2619 0 0 0 0 1089414-15km 0 3613 1515 46 533 89 3020 7082 0 0 0 0 1589815-16km 43 1959 234 31 766 34 2173 6132 0 0 0 199 1157116-17km 1053 1509 134 20 4076 553 1515 1621 0 105 338 2884 1380817-18km 1659 161 78 75 1630 202 15580 0 0 419 389 1232 2142518-19km 1920 525 141 12 556 506 16687 0 0 7 730 519 2160319-20km 1891 339 37 12 1732 2921 12130 0 0 513 1255 474 2130420-21km 1171 208 610 6 78 239 14743 0 0 5182 7020 573 2983021-22km 1135 1264 479 3 187 1266 16721 0 0 14310 11218 1246 4782922-23km 345 1210 82 0 205 1143 13814 0 0 16252 11923 216 4519023-24km 1082 593 151 0 197 376 19454 0 0 9469 3801 239 3536224-25km 1677 194 189 8 172 860 15157 0 0 3267 130 868 2252225-26km 600 407 126 14 205 862 19221 0 0 494 3162 716 2580726-27km 391 485 662 19 286 3337 20557 0 0 0 475 550 2676227-28km 939 271 364 120 1635 8897 15071 0 0 0 248 474 2801928-29km 806 1709 2516 52 1195 4423 14981 0 0 0 532 378 2659229-30km 1335 445 233 23 1439 19490 3907 0 0 0 680 79 27631Total 17257 69369 55337 8995 17534 46470 214594 17454 0 50018 41901 10647 549576
0°-30° 30°-60° 60°-90° 90°-120° 120°-150°
150°-180°
180°-210°
210°-240°
240°-270°
270°-300°
300°-330°
330°-360°
All around
site Weighting
factor0-1km 0.0 0.0 0.0 0.0 0.0 0.0 0.0 0.0 0.0 0.0 0.0 0.0 0.0 2.8281-2km 9.8 1224.2 519.8 24.5 1.1 0.0 0.0 0.0 0.0 0.0 0.0 0.0 1779.4 0.5442-3km 1.8 1251.0 4.3 106.5 3.3 1.8 0.0 0.0 0.0 0.0 0.0 0.0 1368.6 0.2533-4km 93.3 602.0 0.3 54.2 0.9 0.0 0.0 0.0 0.0 0.0 0.0 0.0 750.8 0.1534-5km 60.1 854.2 2.0 60.5 6.0 0.0 0.0 0.0 0.0 0.0 0.0 0.0 982.8 0.1055-6km 0.0 685.3 0.2 0.2 26.4 0.0 0.0 0.0 0.0 0.0 0.0 0.0 712.1 0.0786-7km 0.0 648.3 249.6 4.9 2.8 0.2 0.0 0.0 0.0 0.0 0.0 0.0 905.8 0.0607-8km 0.0 299.9 681.3 41.1 3.4 0.1 0.0 0.0 0.0 0.0 0.0 0.0 1025.8 0.0498-9km 0.0 7.1 893.0 166.5 3.1 0.0 0.0 0.0 0.0 0.0 0.0 0.0 1069.8 0.0409-10km 0.0 89.1 111.3 44.6 8.3 1.1 0.6 0.0 0.0 0.0 0.0 0.0 254.9 0.03410-11km 0.0 42.4 2.3 3.3 5.3 4.1 6.0 0.0 0.0 0.0 0.0 0.0 63.3 0.02911-12km 0.0 46.4 33.0 4.3 10.9 18.4 48.8 0.0 0.0 0.0 0.0 0.0 161.8 0.02612-13km 0.0 31.6 20.9 1.9 17.2 6.3 77.1 0.0 0.0 0.0 0.0 0.0 154.9 0.02313-14km 0.0 40.6 19.9 8.7 8.5 1.9 87.3 52.8 0.0 0.0 0.0 0.0 219.6 0.02014-15km 0.0 65.4 27.4 0.8 9.7 1.6 54.7 128.3 0.0 0.0 0.0 0.0 287.9 0.01815-16km 0.7 32.1 3.8 0.5 12.6 0.6 35.6 100.5 0.0 0.0 0.0 3.3 189.6 0.01616-17km 15.7 22.5 2.0 0.3 60.8 8.3 22.6 24.2 0.0 1.6 5.0 43.0 206.0 0.01517-18km 22.7 2.2 1.1 1.0 22.3 2.8 212.8 0.0 0.0 5.7 5.3 16.8 292.7 0.01418-19km 24.1 6.6 1.8 0.2 7.0 6.4 209.7 0.0 0.0 0.1 9.2 6.5 271.5 0.01319-20km 22.0 3.9 0.4 0.1 20.1 33.9 140.9 0.0 0.0 6.0 14.6 5.5 247.4 0.01220-21km 12.6 2.2 6.6 0.1 0.8 2.6 158.8 0.0 0.0 55.8 75.6 6.2 321.4 0.01121-22km 11.4 12.7 4.8 0.0 1.9 12.7 167.7 0.0 0.0 143.5 112.5 12.5 479.8 0.01022-23km 3.2 11.3 0.8 0.0 1.9 10.7 129.4 0.0 0.0 152.3 111.7 2.0 423.4 0.00923-24km 9.5 5.2 1.3 0.0 1.7 3.3 170.8 0.0 0.0 83.1 33.4 2.1 310.4 0.00924-25km 13.8 1.6 1.6 0.1 1.4 7.1 125.0 0.0 0.0 26.9 1.1 7.2 185.7 0.00825-26km 4.7 3.2 1.0 0.1 1.6 6.7 149.3 0.0 0.0 3.8 24.6 5.6 200.4 0.00826-27km 2.9 3.6 4.9 0.1 2.1 24.5 150.7 0.0 0.0 0.0 3.5 4.0 196.2 0.00727-28km 6.5 1.9 2.5 0.8 11.3 61.7 104.5 0.0 0.0 0.0 1.7 3.3 194.3 0.00728-29km 5.3 11.2 16.5 0.3 7.9 29.1 98.5 0.0 0.0 0.0 3.5 2.5 174.8 0.00729-30km 8.3 2.8 1.5 0.1 9.0 121.6 24.4 0.0 0.0 0.0 4.2 0.5 172.5 0.006Total 328.4 6010.6 2615.7 526.0 269.1 367.2 2175.2 305.7 0.0 478.9 405.9 121.0 13603.7
Table A2 - Weighted Population
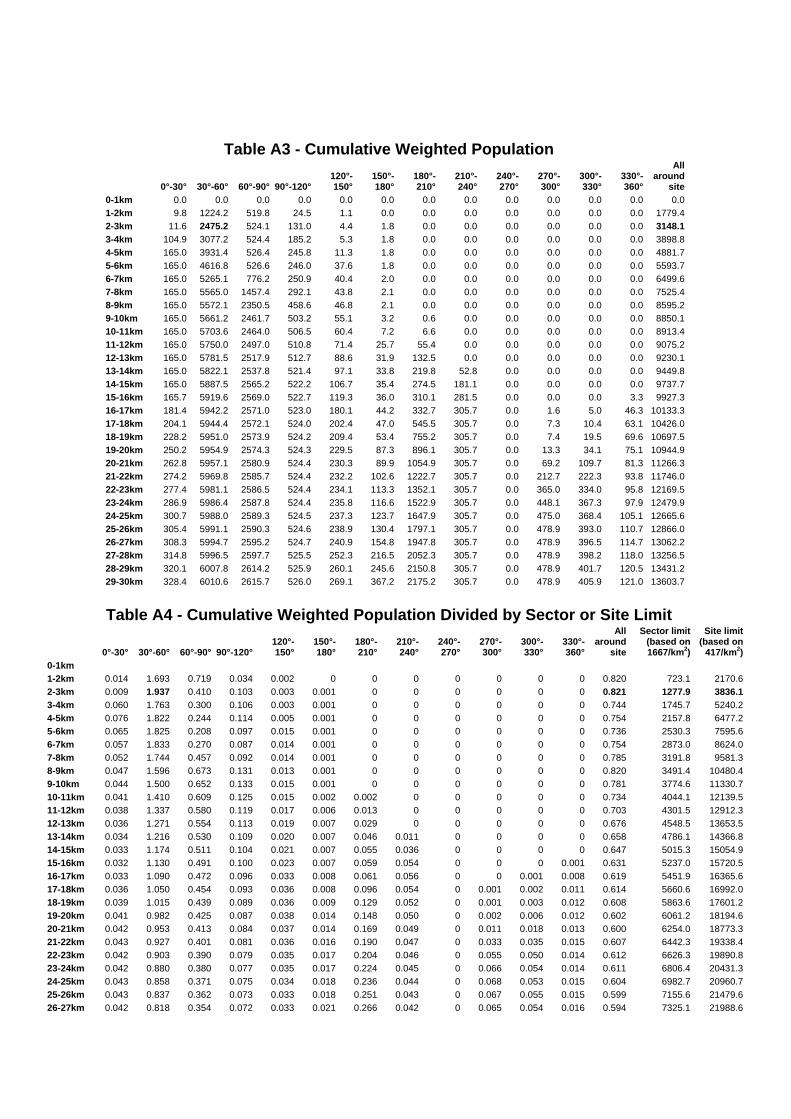
Table A3 - Cumulative Weighted Population
0°-30° 30°-60° 60°-90° 90°-120° 120°-150°
150°-180°
180°-210°
210°-240°
240°-270°
270°-300°
300°-330°
330°-360°
All around
site0-1km 0.0 0.0 0.0 0.0 0.0 0.0 0.0 0.0 0.0 0.0 0.0 0.0 0.01-2km 9.8 1224.2 519.8 24.5 1.1 0.0 0.0 0.0 0.0 0.0 0.0 0.0 1779.42-3km 11.6 2475.2 524.1 131.0 4.4 1.8 0.0 0.0 0.0 0.0 0.0 0.0 3148.13-4km 104.9 3077.2 524.4 185.2 5.3 1.8 0.0 0.0 0.0 0.0 0.0 0.0 3898.84-5km 165.0 3931.4 526.4 245.8 11.3 1.8 0.0 0.0 0.0 0.0 0.0 0.0 4881.75-6km 165.0 4616.8 526.6 246.0 37.6 1.8 0.0 0.0 0.0 0.0 0.0 0.0 5593.76-7km 165.0 5265.1 776.2 250.9 40.4 2.0 0.0 0.0 0.0 0.0 0.0 0.0 6499.67-8km 165.0 5565.0 1457.4 292.1 43.8 2.1 0.0 0.0 0.0 0.0 0.0 0.0 7525.48-9km 165.0 5572.1 2350.5 458.6 46.8 2.1 0.0 0.0 0.0 0.0 0.0 0.0 8595.29-10km 165.0 5661.2 2461.7 503.2 55.1 3.2 0.6 0.0 0.0 0.0 0.0 0.0 8850.110-11km 165.0 5703.6 2464.0 506.5 60.4 7.2 6.6 0.0 0.0 0.0 0.0 0.0 8913.411-12km 165.0 5750.0 2497.0 510.8 71.4 25.7 55.4 0.0 0.0 0.0 0.0 0.0 9075.212-13km 165.0 5781.5 2517.9 512.7 88.6 31.9 132.5 0.0 0.0 0.0 0.0 0.0 9230.113-14km 165.0 5822.1 2537.8 521.4 97.1 33.8 219.8 52.8 0.0 0.0 0.0 0.0 9449.814-15km 165.0 5887.5 2565.2 522.2 106.7 35.4 274.5 181.1 0.0 0.0 0.0 0.0 9737.715-16km 165.7 5919.6 2569.0 522.7 119.3 36.0 310.1 281.5 0.0 0.0 0.0 3.3 9927.316-17km 181.4 5942.2 2571.0 523.0 180.1 44.2 332.7 305.7 0.0 1.6 5.0 46.3 10133.317-18km 204.1 5944.4 2572.1 524.0 202.4 47.0 545.5 305.7 0.0 7.3 10.4 63.1 10426.018-19km 228.2 5951.0 2573.9 524.2 209.4 53.4 755.2 305.7 0.0 7.4 19.5 69.6 10697.519-20km 250.2 5954.9 2574.3 524.3 229.5 87.3 896.1 305.7 0.0 13.3 34.1 75.1 10944.920-21km 262.8 5957.1 2580.9 524.4 230.3 89.9 1054.9 305.7 0.0 69.2 109.7 81.3 11266.321-22km 274.2 5969.8 2585.7 524.4 232.2 102.6 1222.7 305.7 0.0 212.7 222.3 93.8 11746.022-23km 277.4 5981.1 2586.5 524.4 234.1 113.3 1352.1 305.7 0.0 365.0 334.0 95.8 12169.523-24km 286.9 5986.4 2587.8 524.4 235.8 116.6 1522.9 305.7 0.0 448.1 367.3 97.9 12479.924-25km 300.7 5988.0 2589.3 524.5 237.3 123.7 1647.9 305.7 0.0 475.0 368.4 105.1 12665.625-26km 305.4 5991.1 2590.3 524.6 238.9 130.4 1797.1 305.7 0.0 478.9 393.0 110.7 12866.026-27km 308.3 5994.7 2595.2 524.7 240.9 154.8 1947.8 305.7 0.0 478.9 396.5 114.7 13062.227-28km 314.8 5996.5 2597.7 525.5 252.3 216.5 2052.3 305.7 0.0 478.9 398.2 118.0 13256.528-29km 320.1 6007.8 2614.2 525.9 260.1 245.6 2150.8 305.7 0.0 478.9 401.7 120.5 13431.229-30km 328.4 6010.6 2615.7 526.0 269.1 367.2 2175.2 305.7 0.0 478.9 405.9 121.0 13603.7
Table A4 - Cumulative Weighted Population Divided by Sector or Site Limit
0°-30° 30°-60° 60°-90° 90°-120° 120°-150°
150°-180°
180°-210°
210°-240°
240°-270°
270°-300°
300°-330°
330°-360°
All around
site
Sector limit(based on 1667/km2)
Site limit(based on
417/km2)0-1km 1-2km 0.014 1.693 0.719 0.034 0.002 0 0 0 0 0 0 0 0.820 723.1 2170.62-3km 0.009 1.937 0.410 0.103 0.003 0.001 0 0 0 0 0 0 0.821 1277.9 3836.13-4km 0.060 1.763 0.300 0.106 0.003 0.001 0 0 0 0 0 0 0.744 1745.7 5240.24-5km 0.076 1.822 0.244 0.114 0.005 0.001 0 0 0 0 0 0 0.754 2157.8 6477.25-6km 0.065 1.825 0.208 0.097 0.015 0.001 0 0 0 0 0 0 0.736 2530.3 7595.66-7km 0.057 1.833 0.270 0.087 0.014 0.001 0 0 0 0 0 0 0.754 2873.0 8624.07-8km 0.052 1.744 0.457 0.092 0.014 0.001 0 0 0 0 0 0 0.785 3191.8 9581.38-9km 0.047 1.596 0.673 0.131 0.013 0.001 0 0 0 0 0 0 0.820 3491.4 10480.49-10km 0.044 1.500 0.652 0.133 0.015 0.001 0 0 0 0 0 0 0.781 3774.6 11330.710-11km 0.041 1.410 0.609 0.125 0.015 0.002 0.002 0 0 0 0 0 0.734 4044.1 12139.511-12km 0.038 1.337 0.580 0.119 0.017 0.006 0.013 0 0 0 0 0 0.703 4301.5 12912.312-13km 0.036 1.271 0.554 0.113 0.019 0.007 0.029 0 0 0 0 0 0.676 4548.5 13653.513-14km 0.034 1.216 0.530 0.109 0.020 0.007 0.046 0.011 0 0 0 0 0.658 4786.1 14366.814-15km 0.033 1.174 0.511 0.104 0.021 0.007 0.055 0.036 0 0 0 0 0.647 5015.3 15054.915-16km 0.032 1.130 0.491 0.100 0.023 0.007 0.059 0.054 0 0 0 0.001 0.631 5237.0 15720.516-17km 0.033 1.090 0.472 0.096 0.033 0.008 0.061 0.056 0 0 0.001 0.008 0.619 5451.9 16365.617-18km 0.036 1.050 0.454 0.093 0.036 0.008 0.096 0.054 0 0.001 0.002 0.011 0.614 5660.6 16992.018-19km 0.039 1.015 0.439 0.089 0.036 0.009 0.129 0.052 0 0.001 0.003 0.012 0.608 5863.6 17601.219-20km 0.041 0.982 0.425 0.087 0.038 0.014 0.148 0.050 0 0.002 0.006 0.012 0.602 6061.2 18194.620-21km 0.042 0.953 0.413 0.084 0.037 0.014 0.169 0.049 0 0.011 0.018 0.013 0.600 6254.0 18773.321-22km 0.043 0.927 0.401 0.081 0.036 0.016 0.190 0.047 0 0.033 0.035 0.015 0.607 6442.3 19338.422-23km 0.042 0.903 0.390 0.079 0.035 0.017 0.204 0.046 0 0.055 0.050 0.014 0.612 6626.3 19890.823-24km 0.042 0.880 0.380 0.077 0.035 0.017 0.224 0.045 0 0.066 0.054 0.014 0.611 6806.4 20431.324-25km 0.043 0.858 0.371 0.075 0.034 0.018 0.236 0.044 0 0.068 0.053 0.015 0.604 6982.7 20960.725-26km 0.043 0.837 0.362 0.073 0.033 0.018 0.251 0.043 0 0.067 0.055 0.015 0.599 7155.6 21479.626-27km 0.042 0.818 0.354 0.072 0.033 0.021 0.266 0.042 0 0.065 0.054 0.016 0.594 7325.1 21988.6

27-28km 0.042 0.800 0.347 0.070 0.034 0.029 0.274 0.041 0 0.064 0.053 0.016 0.589 7491.6 22488.228-29km 0.042 0.785 0.342 0.069 0.034 0.032 0.281 0.040 0 0.063 0.052 0.016 0.584 7655.1 22979.029-30km 0.042 0.769 0.335 0.067 0.034 0.047 0.278 0.039 0 0.061 0.052 0.015 0.580 7815.8 23461.5
References
1. ACSNI(78)P4: W.S. Gronow, The Development of Siting Policy for Nuclear Power Stations in the United Kingdom, October 1978.
2. ACSNI(81)P3: R.D. Anthony, Siting Policy for Nuclear Power Plants in the
UK, September 1981.
3. ACSNI(85)P8: F.C.J. Tildsley, Siting Policy and Emergency Arrangements for UK Nuclear Power Stations, June 1985.
4. ACSNI(87)P9: Anon., Siting and Safety Requirements for PWR’s after
Sizewell ‘B’, May 1987. 5. ACSNI(88)P1: F.E. Taylor, The Siting of Nuclear Installations in the UK,
February 1988. 6. ACSNI(88)P5: P.B. Woods, The Siting of Nuclear Installations in the UK:
Development of the Proposals, June 1988. 7. Charlesworth F.R. and Gronow W.S., A Summary of Experience in the
Practical Application of Siting Policy in the United Kingdom, in Containment and Siting of Nuclear Power Plants, pp.143-170, IAEA, Vienna, 1967.
8. NII, ‘Safety Assessment Principles for Nuclear Facilities’, 2006 Edition,
Revision 1. http://www.hse.gov.uk/nuclear/saps/saps2006.pdf 9. Nuclear Safety Advisory Committee (NuSAC), ‘The Siting of Nuclear
Installations in the United Kingdom’, John Highton and David Senior, NuSAC(2008)P12, 3 July 2008. http://www.hse.gov.uk/aboutus/meetings/iacs/nusac/index.htm
10. NuSAC, ‘The Siting of Nuclear Installations in the United Kingdom’, John
Highton, NuSAC(2008)P12 Addendum, 8 July 2008.
11. Openshaw, S, ‘Nuclear Power: Siting and Safety’, Routledge and K. Paul, 1986.
12. U.S. Nuclear Regulatory Commission, ‘General Site Suitability Criteria for
Nuclear Power Stations’, Regulatory Guide 4.7, Revision 1, September 1975.
13. U.S. Nuclear Regulatory Commission, ‘General Site Suitability Criteria for
Nuclear Power Stations’, Regulatory Guide 4.7, Revision 2, April 1998.http://www.nrc.gov/reading-rm/doc-collections/reg-guides/environmental-siting/active/04-007/
14. HSE National Population Database – further details at
http://www.hse.gov.uk/research/rrhtm/RR678.htm