Land Tenure, Price Shocks and Insurgency: Evidence from Peru
49
* *
Transcript of Land Tenure, Price Shocks and Insurgency: Evidence from Peru

Land Tenure, Price Shocks and Insurgency: Evidence
from Peru∗
Jenny Guardado R.
Link to Latest Version Here
Abstract
How do di�erent property arrangements a�ect armed con�ict? I revisit this long-standing question by exploiting exogenous variation in the agricultural incomes ofPeruvian co�ee producers to examine how they a�ect violent outcomes conditionalon the type of land tenure arrangement prevailing. Using detailed data on districtlevel land arrangements and violent events in Peru from 1990 to 2000, I �nd thatnegative co�ee price shocks leads to a di�erential increase in violence in co�ee pro-ducing districts compared to non-co�ee districts. Yet, such spikes in violence aresigni�cantly smaller in districts with a greater number of shared property arrange-ments such as communal lands and sharecropping areas as opposed to districts withgreater individual land ownership. To examine the mechanisms at work I exploitmonthly variation in the demand for agricultural labor due to harvesting to showhow negative price shocks reduce agricultural employment particularly in districtswith a greater prevalence of individual ownership. Evidence from individual surveysfurther corroborates this result. The paper provides the �rst micro-estimations ofthe role of di�erent property arrangements on violence intensity in Peru. The paperprovides the �rst micro-estimations of the role of di�erent property arrangementson violence intensity in Peru.
∗I am grateful to Oeindrila Dube, Adam Przeworski, and participants of the 2014 ISNIE Conference atDuke University and the 2011 Chicago Ronald Coase workshop on Institutional Analysis. All remainingerrors are my own.
1

1 Introduction
Do certain property arrangements fuel armed con�ict? During the last century, the typeof access to land has been frequently referred to as a major factor driving peasant re-bellion and insurrection. From Che Guevara to Mao itself, the mobilization of scores ofpeasants living under exploitative property arrangements was considered key for revo-lutionary success. Thus motivating a large body of studies emphasizing the role of landtenure and access to land to explain the rise of guerrilla movements and demand foragrarian reforms, particularly in Latin America1.
Despite the perceived importance of land tenure arrangements for insurgency, littlemicro-level evidence exists about its e�ect on armed con�ict and the mechanisms whichmay explain such e�ect. The reasons for such gap are twofolded: First, there is aninherent di�culty in disentangling the e�ects of land arrangements from overall economicconditions associated with violence (e.g. poverty). Second, a slow-changing factor suchas land tenure is considered unsuitable to explain the dynamics behind con�ict onsetand intensity. In this paper I address these concerns by examining how land tenurea�ects the onset and intensity of armed con�ict in the presence of exogenous changes inthe opportunity cost of joining armed organizations.
Speci�cally, the paper uses two sources of variation to identify the role of di�erentland tenure arrangements on violence. First, I exploit plausibly exogenous variationin the international prices of co�ee to approximate changes in the opportunity cost ofviolence among co�ee producers. Due to the labor-intensive nature of co�ee productionand the fact that it is harvested annually, price shocks are more likely to a�ect householdincome (Dal Bo and Dal Bo 2011). Moreover, given Peruvian producers are essentiallyprice-takers in the international market for co�ee � the main agricultural export ofPeru at the time � changes in the international price would best capture exogenousvariation in the returns to co�ee cultivation. Second, I use cross-sectional variation inthe distribution of land tenure arrangements2 recorded prior to the beginning of thecon�ict period. In other words, I compare the e�ect of co�ee price shocks among thethree main land arrangements of co�ee production in Peru: individual landholders,collective owners (e.g. communities) and wage laborers. Using both sources of variationI examine whether shocks to the returns of co�ee production a�ect con�ict di�erentiallyaccording to the prevaling land tenure arrangements.
Using this approach, the paper has three main results. First, consistent with anopportunity cost argument (Collier and Hoe�er 1998 and 2004; Fearon and Laitin, 2003;Miguel et. al. 2004; Dube and Vargas 2012), a drop in the price of co�ee di�erentiallyincreases violence intensity in Peru in co�ee producing districts compared to non-co�ee
1Among prominent studies: Scott (1977), Paige (1978), Popkin (1979), Wolf (1969), Wickham-Crowley (1992) among others.
2By �land tenure arrangements� I am not referring to the presence or not of secure property rightsin the form of titling, but rather, in the form of production of this land such as tenancy arrangements,single land holders, or communal land arrangements.
2
ones. Estimates show that a decrease of 10% in the value of co�ee production � roughlythe yearly variation observed throughout the period � leads to 0.15 more violent events.Given the average number of attacks is 0.57 in co�ee areas during these years, suchincrease is around 26 percent. In the case of guerrilla attacks, the results show thata 10% decrease in the value of co�ee production leads to an increase of 33 percentagemore attacks evaluated at the mean. Similar results are obtained for the case of armyattacks, attacks against peasants and political leaders � the signature attacks of the leftistguerrillas� as well as overall killings. These results imply that although commodity priceshocks may not explain violence intensity everywhere (Blattman and Bazzi 2014) it wasan important factor driving violence intensity during the Peruvian civil war.
Second, the increase in violence due to negative price shocks is smaller in districtswith a greater prevalence of shared property arrangements in which peasants cultivatethe land but do not own it individually (e.g. communal land and wage laborers). Specif-ically, while a 10% decrease in the value of co�ee production increases attacks by 0.16,this number is only 0.14 or 0.13 for each additional hundred communal or sharecroppingfarms in the district. In contrast, there is little to no di�erence depending on the numberof farms owned by individuals in the district. These results suggest that districts witha greater prevalence of shared arrangements see a smaller increase in violence driven bydrops in the value of co�ee production. Hence, studies linking agricultural commodityprice shocks to armed con�ict must account for di�erences in the mode of productionthat might attenuate the impact of such shocks.
Third, after establishing the role of each property arrangement on violence inten-sity I examine the role of land tenure on agricultural employment as a potential causalmechanism. To do so, I exploit the length and start date of the co�ee harvesting seasonto examine how price shocks a�ect violence at times of greater demand for labor versustimes in which the demand is lower. While a decrease in the value of co�ee produc-tion leads to a di�erential increase in violence during the co�ee harvesting months �potentially driven by unemployment � such e�ect is smaller in districts with a greaternumber of wage-laborer farms (and less so communal lands). These �ndings suggest thatwage-laborers � as opposed to individual owners � may better secure employment andpay for co�ee production thus reducing the amount of violence when commodity pricesfall. These results are consistent with individual-level �ndings showing that employmentopportunities could reduce participation in illicit activities (Blattman and Annan 2014)while contrasting with studies �nding no role for wage employment in fueling violence(Berman et. al. 2011). To further corroborate this mechanism I collected individuallevel data from national household surveys between 1986 and 2000 to analyze the pat-terns of occupation in the agricultural sector. Results using these surveys show howunemployment in the agricultural sector is di�erentially higher during negative co�eeshocks, particularly for districts with a greater number of individual owners. Therefore,the fall in the value of co�ee production between 1986 and 1995 is associated with a dif-ferentially higher level of unemployment in the agricultural sector in districts with moreindividually owned farms thus consistent with the higher increases of violence observed.
3

The paper contributes to the current literature in the following ways: First, theseresults provide evidence that shared property rights (e.g. communal lands and share-croppers) might reduce violence intensity by mitigating the e�ect of income shocks drivenby international market conditions. In contrast, individuals left to face the volatility ofthe international markets have greater incentives to engage in violence when there is adrop in the value of co�ee production. Although in theory individual landowners would�nd it easier to switch to alternative crops or use land in some other ways to o�set re-duced pro�ts (e.g. as a collateral, Feder et. al. 1988), in practice this does not seem tocase given the higher prevalence of unemployment in districts with individual ownershipwhen co�ee prices plummet. These results are consistent with previous �ndings docu-menting how small landholders appear more vulnerable to commodity price shocks, atleast in the case of coca producers (Angrist and Kugler 2008) as well as co�ee producersin Colombia (Dube and Vargas 2013). In sum, while strong and well de�ned propertyrights may be crucial for economic development (North and Thomas, 1973; De Longand Shleifer, 1993; Johnson et. al. 2002) and investment (Demsetz 1967; Alchian andDemsetz, 1973), it is unclear whether property rights in the form of individual ownershipis better than shared ownership to insure against income shocks that lead to violence,at least in the Peruvian case.
Similarly, while it is a well-established fact that negative economic shocks a�ect con-�ict (Collier and Hoe�er 1998; Fearon and Laitin 2003; Miguel et. al. 2004; Fearon2005), this paper contributes to a better understanding of the intermediate mechanismsbetween price shocks of labor intensive crops and con�ict by looking at the land ar-rangements under which these crops are produced and the patterns of seasonal labor.Results shown here calls for a re-examination of the role of di�erent types of propertyarrangements on how they reduce the appeal of joining armed organizations at times ofpoor economic performance.
Second, the paper contributes to understanding the role of international commoditymarkets on the Peruvian Civil War. On the one hand, some accounts of the Peruviancase argue for a limited in�uence of the export crop industry on the rise and successof the guerrilla movement (McClintock 1984). On the other, sociological accounts positthat instances of peasant unrest cannot be detached from the agrarian export industry,at least after the �rst half of the 20th century. For instance, Scott (1977) argues that theintroduction of market relations in the countryside, particularly international markets,exposed peasants to greater risk thus providing incentives for revolutionary action. Morespeci�cally, Paige (1978) and Wickham-Crowley (1992) argue that it is agriculturalworkers, sharecroppers and migrant state laborers working for wages in the export cropindustry who are more vulnerable to market shocks and likely to rebel or radicalizedemands. Some evidence of this relationship is provided by Hofheinz (1977) who �ndstenancy and sharecropper support for the Chinese communist guerrillas. My �ndingsfor the case of Peru suggest that the export crop sector did play an important role inthe intensity of violence more generally. However, contrary to the sociological literature,price shocks led to a smaller increase in violence among districts dominated by peasants
4

living in communal lands and wage laborers.
Finally, according to some accounts Shining Path did not bene�t from the revenuesobtained through coca trade. Rather, these �coca taxes� remained in the region wherethey were mostly generated (Huallaga) and did not help �nance Shining Path's violentactions elsewhere (McClinctock 1998). Yet, other studies seem unable to rule out orcon�rm the �nancing means of the guerrilla through coca trade (Weinstein 2007: 93).Using agricultural data on district coca cultivation I explore the alternative explanationthat increases of violence in co�ee areas was due to the expansion of illicit crops (Angristand Kugler 2008). I �nd that after excluding the main production regions from thesample, and interacting the levels of coca production with export crop prices, priceshocks still have a negative e�ect on violence. Moreover, the e�ect of higher co�ee pricesincreased violence in coca producing areas, which seem counter intuitive considering cocaproduction should be more attractive at times of lower co�ee production not when pricesare relatively higher. Future research will investigate the precise mechanisms throughwhich this occurs.
The paper is organized as follows: Section 2 describes the main features of thePeruvian Civil War as well as Peru's recent developments in the export sector and landreforms. Section 3 describes the data and the construction of the variables includedin the paper. Section 4 describes the identi�cation strategy and estimation procedure.Section 5 presents and discusses the results. Section 6 concludes and considers extensionsand venues for future research.
2 Shining Path and MRTA - Peruvian Civil War
From 1980 until 2000, two guerrilla movements caused the most intense period of vio-lence in recent Peruvian history. The rebel group Partido Comunista del Perú - Sendero
Luminoso (PCP-SL or Shining Path) and the Movimiento Revolucionario Tupac Amaru
(MRTA) were in constant �ghts with both the army and paramilitary groups and some-times even among themselves. According to the Peruvian Truth and ReconciliationCommission (CVR, for its acronym in Spanish), this con�ict caused the death of about69,290 people (CVR, 2004) thus making the Peruvian civil war one of the bloodiestpolitical con�icts in Latin America.
The PCP-SL, also known as Shining Path, declared a �war� on the Peruvian State inMay 1980 which would continue until its full dismantling in 2000. Alone, Shining Pathis responsible for the death of 31,331 people or 54% of total casualties (CVR 2004). Therebel group, initially founded with 17 members in 1970 reached its peak in 1990 with2,700 core militants without counting other sympathizers or occasional collaborators(CVR 2004). Shining Path's �rst violent action was to symbolically boycott nationalelections by burning ballot boxes and the voter registry on the eve of the elections inthe district of Chuschi, in Ayacucho state (Weinstein 2007:81). At the onset, the stateof Ayacucho was the center of Shining Path's political activity, however, inspired by the
5

Chinese revolution it attempted to advance from the rural areas to the cities. As putelsewhere, Shining Path's leader �envisioned a rural movement led by the peasantry thatwould `encircle the cities from the countryside'� (Weinstein 2007: 84).
Shining Path was not a centralized organization. Rather, it was formed by a largenumber of groups each of which contained a small number of trained cadres whichwould agitate, mobilize, and start the process of �population education� of peasantsand exert �popular� justice. The main targets of Shining Path were visible �guresof �the system�: government representatives, police force, peasant leaders, and localo�cials as well as public infrastructure. In �nancial terms, Shining Path was also adecentralized organization whereby each regional committee was �nanced with resourceslocally extracted from peasants as in the case of coca producers from the Upper HuallagaValley.
2.1 Peruvian Economy and Export Sector: 1980-2000.
Parallel to the con�ict, worsening economic conditions between 1970 and 1992 wereparticularly felt by peasants in the rural highlands (Weinstein 2007). For instance,McClintock (1984:64) argues that by 1980 the terms of trade between the coast and thehighlands have turned against the latter. The crisis started during the mid 80's whenPeru was �nally transitioning to democracy after years of military dictatorship. Soonafter the transition, during the �rst presidential period (1986-1990) of Alan Garcia,the country underwent one of its worst macroeconomic economic crises with a sharpdecrease in its gross domestic product and hyperin�ation episodes. Macroeconomicindicators, such as consumer price indexes and exchange rates skyrocketed. Moreover,starting 1980, a trade policy oriented towards liberalization and tari� reduction onfood imports made Peruvian peasants face external competition, lower food prices andgreater price volatility. The only peasant villages that remained una�ected by the marketeconomy were the most backwards, isolated and reliant on subsistence agriculture. Sucheconomic instability may have contributed to the onset and appeal of Shining Path inthe countryside.
Despite the crises of the 1980's, and after years of structural adjustment and marketoriented reforms, the agricultural export sector experienced a notable expansion duringthe 1990's (MINAG 2011). According to the Peruvian Ministry of Agriculture, theexpansion of the agricultural export sector occurred both in traditional agriculturalPeruvian exports (co�ee, cotton and sugar) as well as in an incipient �non-traditional�agricultural exports (asparagus, cacao, grapes, bananas, and beans). These changes weredriven largely by previous structural adjustment policies, that is, drastic liberalizationby reduction of tari� levels in agricultural sectors (Boloña and Illescas 1997; Fairlie andTorres Zorrilla 2002). As shown in Figure 1 below, co�ee exports largely bene�ted fromliberalization, as the value of total exports increased sharply after 1993. Moreover, co�eeis also one of the main Peruvian exports only exceeded by the proceeds obtained fromoil and natural gas and even more important than that of minerals and �shing products.
6

The value of the exports of other agricultural goods was quite small, include those ofsugar, corn, beans and cotton.
Figure 1: Value of Peruvian Exports: 1983-2000
[Source: ECLAC. Export value of other agricultural goods was too small to be included].
2.2 Peruvian Land Reforms
The variable of interest in this paper is land tenure, which before 1970 was characterizedby the prevalence of large landholders (approximately 90% of Peruvian land was heldby 5% of total owners) often established since colonial times. Even by Latin Americanstandards, land distribution in Peru was one of the most unequal in the world (McClin-tock 1984: 4). Therefore, in 1969, the governing military junta launched a land reformof populist cut ordering the redistribution of large landholders, generally haciendas, intocollective or individual ownership which in turn could not be sold in the private markets.The military junta also explicitly promoted associative or collective forms of productionsuch that vast territories would be given in property to associations, towns or pueblos,mostly indigenous. In numbers, the reform meant that between 1969 and 1979 9,066thousands of hectares were expropriated and distributed among 368,817 peasants. Theland distributed were those of former haciendas or single-owned large extensions of land,which would be collectivized and to be run under cooperatives (�cooperativas�). In prac-tical terms the reform ordered the transfer of ownership of haciendas to the peasantsalready working there with the limitation of not being able to sell it. A similar arrange-ment was that of �communal� land tenure which was land distributed to members of an
7

indigenous peasant community3 with the same restriction of not being able to be sold,privatized or divided. This e�ort was partially dismantled with the Constitution of 1979which allowed for collective forms of land to be divided and small property or �minifun-dos� to exist. Later, in 1991, the decree of 1969 was completely abolished thus allowingland to be sold and to register individually the land distributed during the 1970s.
2.3 Land Tenure and Crop Cultivation
The main agricultural export of Peru, co�ee, is mostly grown in the highland areas ofPeru and part of the tropical jungle. In particular, co�ee grows in middle altitudes withplenty of precipitation. Co�ee also has the advantage of being able to grow jointly withother food crops to guarantee a minimum provision of subsistence even in cases of badharvesting (Paige 1978).The organization of co�ee production in di�erent land tenurearrangements responds to historical events as well as to the agricultural characteristicsof the crop.
In Table 1 I created a dichotomous variable indicating co�ee presence to assess thedistribution of di�erent land tenure arrangements. As shown, among co�ee areas, at least99% have some sort of individual ownership farm, who often sell their co�ee produceto major distributors. Such percentage is very close to the average observed outsideco�ee areas. Compared to owners, shared land arrangements see a greater presence inco�ee regions compared to non-co�ee regions. That is, co�ee areas also exhibit a higherproportion of communal farms especially in the Andean highlands as well as commercialmanors such as those of tenants or sharecroppers who grow co�ee in exchange for awage. Speci�cally, around 57% of co�ee areas have at least one communal farm in it,compared to only 50% of non-co�ee areas. In terms of sharecropping arrangements,there is at least one sharecropping farm in 89% of co�ee districts while only in 80% ofdistricts without co�ee production. Although the presence of tenant and communal landtenure are a small fraction of all land tenure arrangements, they have a greater presenceamong co�ee producing districts. The fact that there is a greater presence of sharedarrangements in co�ee producing areas alleviates the concern that results are driven bya smaller presence of these arrangements in co�ee producing regions. It should be notedthat the dichotomous measure of co�ee captures the presence of cultivation but it doesnot reveal the speci�c intensity with which it is cultivated, which will be closely analyzedin section IV.
In sum, we observe di�erent ownership arrangements being present in both co�eeand non-co�ee areas which will be useful to contrast the e�ect of di�erent tenure systemson con�ict intensity. Such heterogeneity in land tenure arrangements will allow me todocument whether there is an e�ect of income shocks on con�ict. While this claim wasinitially put forward by Scott's (1977) landmark book and widely tested in the litera-ture on economic shocks and violence, I use such �nding to establish: First, whether
3By peasant communities it is generally referred as those of strong indigenous and traditional rootslocated in the Andean highlands.
8

individual versus communal arrangements better insures against income shocks to re-duce violence intensity. Second, whether wage-laborers seem particularly susceptible toradical appeals given their limited access to land and their larger vulnerability to priceshocks which would leave them without means of subsistence (Wickham-Crowley 1992)than non-wage laborers.
3 Data
The dataset on violence was collected by the Peruvian Truth and Reconciliation Com-mission (CVR), which recorded individual level data on the number and type of humanrights violations (illegal detentions, kidnapping, murder, extra judicial executions, tor-ture, or rapes) as well as the perpetrator (government forces, guerrilla or paramilitarygroups) over the twenty years of the Peruvian civil war. The Peruvian Truth and Rec-onciliation Commission collected around 19,000 testimonies from victims of the con�ictor their relatives. To do so, the CVR held public hearings around the country to gathertestimonies from victims, relatives, witnesses and survivors to report any violent actbetween 1980 and 2000. Testimonies were coded by the type of violent action, location,responsible group, time of occurrence and the victim's individual characteristics. Testi-monies were also crosschecked with other NGO's to verify their accuracy. The locationand timing of the crimes allows me to identify where and when the victim was attackedby either the army, guerrilla or paramilitary groups.
To measure land tenure, I collected district level measures of property arrangementsfrom the agricultural census of 1972. I sought information preceding the con�ict episodeto minimize possible confounders. The agricultural census data identi�es the type ofland tenure, size of the land plot in hectares and type of crops cultivated. I measurecrop intensity as the number of hectares per district to obtain the relative co�ee in-tensity at the district level. This measure is commonly used by the Statistics Institutein Peru in their elaboration of their indicators as well as in other related papers usingcrop cultivation intensity (Dube and Vargas 2012). I measure land tenure according tothe proportion of the district which is under one land tenure arrangement or another.The data distinguishes three main types of land tenure: full property, tenants (individ-uals who use others land in exchange for a fee) and communal land tenure. Althoughother types exist, their proportion from the total is negligible4. While full (individ-ual) property is the most prevalent form, communal land tenure is common in placeswith historical strong indigenous community organization (departments of Apurimac,Cusco and Amazonas). Finally, tenant forms are present in areas in which peasantswork in exchange for a wage for a landowner who does not personally cultivate the land,particularly in the departments of Lima (8%), Ancash (8%), and Cajamarca (9%).
4According to the Ministry of Agriculture, the other associative forms created of land tenure createdin 1969 are the �Cooperativas Agrarias de Production� (CAP), the �Sociedades Agricolas de InteresSocial� (SAIS) and the �Empresas de Propiedad Social� (EPS). These forms only represent 0.28% ofproduction units in 1994. Source: http://iinei.inei.gob.pe/iinei/cenagro1994/
9

As shown in Figure 2, none of these types of tenure are clustered regionally. Sincethe census data identi�es the type of land tenure per district I therefore matched thesemeasures with the con�ict data, to obtain the levels of violence per year and districtas well as the types of land tenure, crop production and district size. This allows meto exploit variation over time within a district (there are about 1800 districts in Peru),controlling for time-invariant districts characteristics that are potentially correlated withcon�ict. The �nal dataset is at the district level, including both district and departmentlevel controls when necessary.
Time series of export crop prices comes from the International Monetary Fund whichcollects monthly data on crop prices from which I created a simple annual average ofthe price and used it directly in the estimation as the number of US cents per kilo ofco�ee5. These prices are further adjusted by U.S. in�ation between 1990 and 2000. Sinceit is an international price, it represents a benchmark price representative of the globalmarket and determined by the largest exporter of a given commodity. For none of thecommodities included is Peru the largest exporter for the years under study.
Data on Peruvian exports was obtained from ECLAC (Economic Commission forLatin America and the Caribbean) which provides the value in dollars per year of Pe-ruvian exports.6 This data is limited to the period 1983 to 2000. Yet, because of thelimitations imposed by other district controls, most of my estimates come from the pe-riod 1990 to 2000 such that the information provided appropriately describes the dataused. In addition, information on the market share for co�ee was provided by the Inter-national Co�ee Organization (ICO) from 1990 to 1999.
Information on crop cultivation was obtained from the 1972 Agricultural Census,which provides a time-invariant measure of the number of hectares cultivated per dis-tricts of a speci�c crop. This variable measures crop cultivation intensity for each districtthus avoiding potential endogeneity concerns when using time-varying measures of pro-duction, since these might respond to prevailing violence. The 1972 census includes thenumber of hectares, number of farms and tons produced per district cultivating co�ee.A concern with this data is that it is not possible to identify both the type of land tenureand their crop cultivation at the level of the agricultural unit, therefore I use districttotals. Among the other crops included in the analysis is that of coca cultivation. Due tothe increasing salience of Peruvian coca production, and mainly for political and securityreasons, the hectares of coca cultivation for the period 1980 - 2000 were not publishedby the Ministry of Agriculture. Yet, information on coca cultivation was coded from theagricultural census of 1972 at a time in which coca cultivation from peasants was notbanned. Although more reliable accounts of coca production would be desirable (e.g.satellite images) it has the advantage of preceding the period of observed violence, andprovides and approximation for historical zones of coca production and a lower bound
5Data for monthly prices: http://www.imf.org/external/np/res/commod/External_Data.xls6The speci�c data source is the Statistical Data Base of Foreign Trade (BADECEL, Base de Datos
Estadisticos de Comercio Exterior). I used the classi�cation of exports given by CUCI Rev 2 to thegroup and partida level. http://websie.eclac.cl/badecel/basededatos.asp
10

of actual production. Finally, additional district controls such as district populationfrom 1990 to 2000 was included in all speci�cations and obtained from INEI (InstitutoNacional de Estadistica e Informatica).
3.1 Descriptive Statistics
Table 2 summarizes the descriptive statistics of the main dependent and independentvariables in districts with a large presence of co�ee or sugar cultivation. As shown,farms or �rural economic units� compose around 38% of all farms while communal,sharecropping and those distributed during the agrarian reform compose around 4% ofthe total. The rest falls under the category of �other�which mostly comprises farms undermixed arrangements (sharecropping and owner) - which makes it di�cult to disentangletheir overall e�ect on violence.
In terms of co�ee production, the average price throughout the period is of 275 centsper kg or 2.75 dollars. The average level of co�ee production is of 0.034 tons or 34kilos, yet, it should be noted that those not producing co�ee are coded as zero. Whenlooking at violence, the average number of attacks per district per year was 0.35 followedby army and guerrilla attacks respectively. When examine whether violence occurreddisproportionately in co�ee areas, Figure 4 appears to suggest it does. Not only wasviolence greater in co�ee regions, but it also appear to be so at times when the price ofco�ee was particularly low.
To better depict the It is noteworthy that on the aggregate, overall violence, guerrillaand army attacks are not di�erent depending on whether they cultivate co�ee or not.That is, violence does not occur exclusively in co�ee producing areas. However, as shownin Figure 3 (below), violence does seem to respond to changes in the international priceof co�ee: high prices are associated with lower violence while a steep decrease in pricesalso sees a surge in overall violence.
Finally, from Table 2 we should also notice the higher proportion of coca farmsand coca cultivation in co�ee areas. Since coca and co�ee often bene�t from sameclimatological conditions, we must account for the substitution between coca and co�eein the case of a drop in the international price of the latter. Considering these di�erencesI will account for coca production including the number of hectares interacted with co�eeprices to control for changes in violence in these coca production zones.
4 Empirical Strategy
The paper uses a di�erence in di�erence (DID) approach to estimate whether the e�ectof price shocks a�ected violence disproportionately in places under speci�c land tenurearrangements or not. The heterogeneity and widespread distribution observed in thePeruvian land tenure system ensures no single type of tenure is clustered regionally asshown in Figure 2. Although individual property arrangements are the most prevalentform, communal and tenant regimes are also present in every Peruvian department.
11

Figure 2: Peruvian Land Tenure Arrangements Distribution in 1994
[Note: Darker areas re�ect higher intensity of a speci�c land tenure arrangement].
To account for the change of income of Peruvian peasants I use international cropprices which are clearly exogenous to Peruvian production. Local prices would raiseserious endogeneity concerns if prices respond to violence levels (e.g. reduced produc-tion increasing prices) thus a�ecting my estimates. Since violence does tend to disruptproductive activities, especially when the victims are peasants or landowners as manyof the victims were, I use the price of Peruvian export crops. Co�ee, the main exportcrop of Peru, only holds a small fraction of the Latin American market, let alone of theinternational market thus Peru can be considered a price-taker for practical purposes.As seen in Figure 3, the share of the market for Peruvian co�ee is only 1/5 of Brazil's(the major exporter) and behind producers such as Vietnam, Mexico, Indonesia andColombia as well as producers from Africa and the Middle East (not shown). Therefore,I am rest assured that changes in the conditions prevailing in Peru will not a�ect co�eeprices as events in Vietnam, Brazil and Colombia would.
12

Figure 3: Market Share of Co�ee: 1990-1999
Moreover, Figure 6 of Appendix A show that the Peruvian value obtained fromco�ee exports are small in comparison to Brazil, the United States, and in some casesfrom the Argentinean value obtained from export agricultural production. Some of thesegoods have been generally expanding from 1980 onwards, consistent with the liberalizingpolitics of the period and the growth of export agricultural production. This shift hasturned Peru into a new player in the world commodity markets. Figure 7 of AppendixA shows the time series of international commodity prices (in real US dollars). Usingchanges in the international commodity prices allows me to assess whether price shocksa�ect con�ict di�erentially in zones under particular land tenure arrangements. Asshown in Figure 4 (below), the price of co�ee exhibits a large increase between 1994until 1997 when co�ee prices sharply decline until the end of my sample. Moreover,this pattern of price decline mirrors the increase in violence observed from Shining Pathbetween 1985 to 1992 in co�ee versus non-co�ee areas.
13

Figure 4: Distribution of Violence in Co�ee vs Non-Co�ee Districts
Figure 5: Timing of Attacks in Co�ee Regions
Other endogeneity concerns arise if speci�c land tenure arrangements are associatedwith features potentially fostering violence (e.g. mountains as hideouts, or roads sus-ceptible to be attacked). In such case, con�ict would be correlated with land tenurevia a third unknown factor (omitted variable bias). Similarly, it is possible that violentcon�ict promotes a switch towards speci�c land tenure arrangements (reverse causal-ity). For example, if con�ict reduces land productivity and therefore pushes peasants
14

to leave their land and become wage laborers elsewhere. To address both concerns I�rst use exogenous price shocks to make sure changes in income and prevailing landtenure are not due to local con�ict. Second, I use a measure of district land tenureconditions, the agricultural census of 1972, which measures district level land tenurearrangements before the con�ict period started and are therefore unlikely to be relatedto it. However, potential concerns arise from land reforms themselves. For instance, theland reform launched in 1969 appeared to be one of the most comprehensive reforms inLatin America which drastically changed Peruvian rural landscape in the 1970s (Guillet1979). These changes in land tenure would be of concern if one particular type of landtenure were to be grown exponentially and devoted to particular land crops. In suchcase, the census of 1972 would no longer truly re�ect the conditions prevailing in 1990.However, as shown by MINAG7, the variation in land tenure between 1972 to 1994 wasminimal for individual proprietors. Thus, there was no large increase in individual prop-erty due to communal lands being divided and sold as the 1990 land reform allowed. Ifanything, there was a notable increase in communal lands between 1972 and 1994 by thereform. However, this expansion of communal land was accompanied by a decrease inthe number of cooperatives or �cooperativas� (a pre-1969 land tenure form). Accordingto qualitative accounts, the functioning of �cooperativas� and �communal land� becamevery similar due to a decree in 1970 issued as an adjunct to the Agrarian Reform Lawof 1969. As Guillet (1979: 98-99) explains:
�Prior to the Peasant Communities Law, indigenous communities had a pe-culiar organization [...] dating from the provisions of the Constitution of1920. Under the provisions of the new law, peasant communities now havean organization almost identical to that speci�ed in the General Law of Co-operatives (No. 15260). There is an administrative council, charged with theadministration of community a�airs; a vigilance council, which overlooks theactivities of the administration council; and a general assembly of comuneros,the maximum decision-making body of the community, which sets long-termpolicy and review the actions of the administrative councils� (p.98-99)
Thus, although there is an increase in the number of communal lands, part of thisgrowth can be counteracted by the decrease in the number of �cooperativas� arrangement.However, additional increases in communal land arrangements would then a�ect myestimates on communal land, although not those concerning ownership and tenants.
Another concern arises if those bene�ting from land redistribution were for somereasons more belligerent and politically active thus exhibiting a higher level of violence.Although this possibility is real, those bene�ting from the 1969 land reform were col-lective forms of land tenure such as communities and cooperatives. Therefore, if thesedistricts were simply more belligerent, we should expect them to exhibit larger violencewhen a negative shock ensues. The fact that those most bene�ted from the reform wereindigenous communities, and that these do not exhibit a higher propensity to violence
7Available at: http://iinei.inei.gob.pe/iinei/cenagro1994/ under �Formas Juridicas de Tenencia�
15

during crises make this option less plausible. In fact, those not bene�ted from the reformresponded more promptly to price shocks and higher violence overall. How the 1969 re-form might have triggered such forms of violence in the presence of income shocks is aninteresting avenue for future research.
Finally, an alternative approach to the DID is to instrument local prices with in-ternational prices. However, it was not possible to instrument the internal price perdepartment with the international price provided by the IMF given the two hyperin�a-tion periods experienced in Peru. International prices, once converted to Peruvian Solesto make them comparable with local real prices, re�ects the spikes of the exchange rateand the internal consumer price index. Thus, changes in international prices would nolonger be driven by exogenous market jumps but rather by these in�ationary periodsclearly due to internal Peruvian politics of which civil war most likely played a role.Figure 8 of Appendix A shows the international price converted to Peruvian soles aswell as the internal prices (wholesale average prices across Peruvian departments) of thesame commodities. As seen, the spikes in prices re�ect internal Peruvian conditions andnot exogenous price shocks. For this reason, I use directly the international price in USdollars.
4.1 Estimation
My empirical strategy relies on the heterogeneity of Peruvian land tenure arrangementswhich creates spatial variation across districts. I use measures preceding the con�ictperiod (census of 1972), thus I can be sure that the land tenure distribution is not aresponse to violent con�ict dynamics.
As mentioned above, local prices could be endogenous to violent dynamics: If violencea�ects crop production, this could confound any estimates on the e�ect of price shocks oncon�ict. Speci�cally, if violence reduces agricultural productivity thus increasing prices,this would generate a downward bias considering the opportunity cost for a peasantof �ghting is now higher. Conversely, if for some reason violence increases agriculturaloutput thus reducing prices, this creates an upward bias in my estimates. To address thepotential endogeneity of local prices, I directly use changes in international commodityprices as a proxy for changes of internal prices in Peru. To look at the di�erential e�ectof price shocks on con�ict I estimate:
Attacksijt = αi + γt + β1 · PriceShockit−1+Xijt + ηjt + εijt (1)
Where j is the department, i is the district and t is the year (1980-2000). Attacksijtcan either refer to aggregate number of violent episodes, or to speci�c acts committed bythe government or guerrilla groups in department j, district i and year t. PriceShockit−1
is the log of the interacted international price of the crop in the year t−1 with the numberof kilos of co�ee produced per districts in 1972. This variable by itself re�ects the valueof co�ee production in year t − 1 according to the production levels of 1972. If β1 < 0, then a decrease in the value of co�ee production increases violence. Xijt are control
16

covariates including district levels controls such as population; ηjt are state-level lineartime trends; αi is the district �xed e�ect, and γt are the year e�ects. Equation 1 isestimated using OLS.
Since the variable of interest is the e�ect of land tenure, I look at whether thereare di�erential e�ects in districts with speci�c land tenures using a triple interactionspeci�cation. I estimate:
Attacksijt = αi + δt + β1PriceShockit−1 (2)
+β2(PriceShockit−1 ×Owneri,1972) + β3(PriceShockit−1 × Commi,1972)
β4(PriceShockit−1 × Sharecropi,1972)+Xijt + ρit + ηjt + εijt
Where PriceShockit−1 is the value of co�ee production in year t − 1 as describedin Equation 1. Owneri1972, Commi,1972 and Sharecropi,1972 are continuous measures(unless otherwise speci�ed) of the prevalence of individual ownership, communal landand sharecropping arrangements, respectively. These measures include the number offarms per hundreds or �economic units� under each arrangement, or the share of these inthe district. The coe�cients of interest are β2, β3 and β4, which captures the di�erentiale�ect of price shocks on violence in districts which a speci�c land arrangement relativeto regions not exhibiting such land arrangements. For instance, if β2 > 0 it suggeststhat that particular land arrangement attenuates the e�ect of price shocks on violence,however, to corroborate this is the case I present a test for the sum of the coe�cients toassess whether the di�erence is statistically di�erent from zero or not. Other variablesare the same as included in Equation 1, with the exception of ρit which is an indicatoraccounting for coca producing districts interacted with the international price of co�eeto account for substitution e�ects. Other sub-interactions are absorbed either by thedistrict or by the year �xed e�ects.
5 Results � Export crops, Land Tenure and Con�ict.
In this section I present the results for the period 1990-2000 for which I have the pop-ulation data. As argued earlier, the international price of export crops is consideredexogenous to Peru's production during the period, and is used to approximate changesin local prices.
17

5.1 Is there a Price Shock e�ect on Con�ict?
Table 3 shows the results of estimating the price shock e�ect on con�ict (two way in-teraction) of Equation 1. All regressions presented include a large set of district �xede�ects controlling for any district speci�c characteristic. Similarly, the year �xed e�ectscontrols for any shock common to all districts in the same year. In addition, all regres-sions have clustered standard errors at the district level, to control for potential serialcorrelation in districts over time and across districts within a department.
Table 3 shows the results of changes in international prices which are therefore,exogenous to the Peruvian civil war. Coe�cients of the interaction term indicate thatthe crop prices of co�ee have a negative relationship to overall violence (perpetrated byeither group): when the price of co�ee increase, violence is lower in districts of exportcrops (co�ee) relative to districts not oriented towards agricultural exports, for example,subsistence agriculture districts. These estimates imply that the average co�ee prices,from 1990 to 2000 which is around 2.4 dollars per kilo, was accompanied by an increase
in overall levels of violence in co�ee intensive districts relative to non-co�ee districts.8
Speci�cally, estimates show that a decrease of 10% in the value of co�ee production� roughly the yearly variation throughout the period � leads to 0.15 more attacks ingeneral. Given the average number of attacks is 0.57 in co�ee areas during the period,these results imply an increase of 26 percent. Such results are consistent with a largenumber of studies �nding an increase in violence at times of economic downturns.
The estimates shown in Table 3 Column (1) re�ect the e�ect of price shocks on overalllevels of violence, regardless of who the perpetrator was. Therefore, in Columns (2) and(3) of Table 3-Panel A I estimate Equation 1, that is, the e�ect of price shocks on con�ictbut now distinguishing a speci�c type of violence: the violence perpetrated by the guer-rilla movement and by the army. Given the type of strategy followed by the rebel group,in which they settled in a village monitoring and punishing non-compliance, we wouldexpect that deteriorating economic conditions increases the recruitment opportunitiesand violent episodes of rebel groups (Nillesen and Verwimp 2009). In the case of govern-ment violence, I grouped together violence perpetrated by army forces (military, police,or secret security forces) but excluded crimes committed by the paramilitaries and the�rondas� during the period 1990-2000 given the small number of the latter. However, theinclusion of paramilitary violence does not alter the results obtained for army attacks.During these years, paramilitaries were only responsible for 1 case while self-defense or�rondas� were behind 5 cases throughout the 10 year period under analysis. It is be-fore 1990 when �rondas� and paramilitaries were most violent in their attacks againstalleged guerrilla members of sympathizers. In addition, the grouping is only naturalgiven well-known links between the military and the self-defense organizations, in whichcivilian defense was often promoted and even armed by the military (McClintock 1984).Therefore, I included the paramilitary attacks under the �army� label, which does not
8Note: From 1998 to 2000 there is a second drop in co�ee prices, which meant a decrease in 39% ofthe price. The price kept falling until 2003, yet the analysis ends in 2000.
18

change the results obtained in Table 3 - Column (3) .
The most salient result is the negative relationship between co�ee prices and guerrillaviolence: increases in co�ee prices reduce the number of guerrilla victims per districtin co�ee export zones. In the case of guerrilla attacks, the results show that a 10% de-crease implies an increase of 33 percentage more attacks evaluated at the mean. Similarresults are obtained for the case of army attacks, attacks against peasants and politicalauthorities � the signature action of the guerrillas. I also detect a di�erential increasein the number of killings, as opposed to other types of attacks, in co�ee producing areasrelative to non-producing ones.
In Table 4 I present a robustness check of the results by regressing the price shocktreatment on the onset of violence by the guerrilla, the army, and other types of violenceto analyze whether co�ee districts were also more likley to see any kind of violence,regardless of its intensity. The co�ee price shock di�erentially a�ects the likelihood ofall types of violence, particularly guerrilla violence as well as of attacks against peasantsand political authorities in the form of killings. In the case of army violence the coe�cientis still negative, yet not so precisely estimated.
Overall, these �ndings are encouraging to the identi�cation strategy adopted: neg-ative exogenous price shocks are associated with increased violence committed by therebels group yet less so in the case of the government violence. This result is also consis-tent with previous literature �nding that income shocks increase the likelihood of civilwar onset (Miguel et. Al 2004) potentially lowering the opportunity cost of �ghting(Collier and Hoe�er 2004).
5.2 Price shocks and Coca production
Since the 1970's Peru has become an increasingly prominent supplier of coca in theworld market. Unlike other cases (e.g. Colombian guerrilla movements), it is stillunclear whether Shining Path �nanced its activities by taxing coca production. Forinstance, it appears that Shining Path's functioning did not depend on the revenuesobtained through coca trade. Rather, taxes obtained remained in the region where theywere generated (Huallaga) and did not serve to wage the war elsewhere (McClinctock1998). Other studies are more cautious and highlight the lack of conclusive evidencein that regard (Weinstein 2007: 93). Nonetheless, given the correlation between cocaand violence found in other cases (Angrist and Kugler 2008) the illicit drug trade canbe regarded as a confounding factor. Therefore, in Table 5 I include an indicator forthe presence of coca cultivated in 1972 interacted with the international price of co�ee.This term would then assess whether the increase in violence due to falling co�ee-pricesare related to coca production areas and not due to lower opportunity costs of �ghtingin co�ee production. To account for this possibility, I therefore estimate:
19

Attacksijt = αi + γt + β1(PriceShockt−1) + β2 · Log(CofPricet−1 × Cocai,1972) (3)
+Xijt + ηjt + εijt
The variable cocai1972 refers to an indicator for the presence of coca cultivation in1972. The interaction term between coca production levels and co�ee prices controlsfor changes in violence of coca areas occurring while co�ee prices are changing. Table5 shows that the estimate of the parameter (β1), that is, the co�ee price shock remainnegative and statistically signi�cant and similar in magnitude to the baseline results(Table 3). However, the interaction between coca intensity and the international priceof co�ee reveals that a drop in co�ee prices actually leads to an increase in violence,thus suggesting that a small part of the violence surge may be driven by districts cul-tivating coca. Table 5 and Panel C also shows the results when I exclude from thesample major coca production zones (Huallaga Valley Province)9 to make sure that theincrease in violence is not driven by drug-tra�cking activities, for example. As shown inTable 5 Panel C� drops in co�ee prices are still associated with increased violence afterexcluding major coca production areas. The coe�cients remain practically identical inmagnitude and statistical signi�cance to the baseline results shown in Table 3, if notlarger. However, the coe�cient on the coca interaction is still negative and signi�cantindicating that guerrilla attacks do increase in coca areas when co�ee prices drop, thusin all further speci�cations I will include an indicator for coca production interactedwith the lagged co�ee price.
5.3 Price shocks, Land Tenure and Con�ict.
Peruvian politics have been characterized by the recurrence of land con�ict both on thehighlands and the coastal areas of Peru10. Especially in the 1960's, when the largestnumber of land invasions from peasants and communities occurred, their demands wereposed in terms of land tenure. In some cases the demands have been for redistributionfrom plantations and haciendas. In other cases peasants have lobbied for an expansion oflabor rights. These demands have often motivated land reforms to defuse and meet thedemands of peasants. On the other hand, it is possible that these areas were particularlybelligerent and would not be appeased by land reforms but rather support the presenceof guerrilla forces.11 To distinguish both I will look at whether indigenous communitiesappear to have a greater presence of Shining Path to a greater degree than other areas.
9For a complete treatment on the mechanisms through which coca and Shining Path related to eachother see Weinstein (2007)
10See Paige (1978) for a detailed account of peasants rebellions prior to 198011Guillet (1979: 97) provides some numbers regarding the distribution of land: 40.7% formed �coop-
eratives�; 34.8% SAIS, 17.8% Communities and only 6.7% were distributed to individuals.
20

Despite extensive land reform, Shining Path gained footing in the southern highlandsof Peru starting in the 1980s and spreading throughout the country in the followingyears. Many arguments have been put forward which can be summarized around twohypotheses. The �rst hypothesis is that increased economic vulnerability of peasantslead them to violent actions (Hobsbawn 1959; Wolf 1969; Scott 1977). Using the currentliterature on civil war, this is analogous to claim that �ghting is more likely in theaftermath of economic shocks that reduce income (Miguel et. al. 2004; Collier andHoe�er; Dube and Vargas 2012). As shown in the previous sections, there appears tobe strong evidence in this regard. Yet, I posit these e�ects will vary according to landpossession. First, as argued by Paige (1978) and Wickham-Crowley (1992) peasants notowning land are more prone to con�ict given they will be the �rst to be laid o� whenpro�ts from export crops is reduced. This hypothesis predicts that landless peasants(e.g. those working for a wage, usufructuaries, tenants) will be more prone to violencethan otherwise. The reason being their lack of ownership will render them unemployedin the face of lower returns from production and therefore more susceptible to �radicalappeals�. In contrast, individual landholders would be better able to face economic crisisby shifting to subsistence crops and in defense of their land plot therefore refraining fromviolence.
H2: Negative price shocks will increase violence more among those not indi-vidually owning land, than among individual land owners.
While it is possible that rural wage laborers are the most exposed to income price shocks,this view overlooks the role of long-term risk sharing contracts of these arrangementswhich would then shield these type of workers from radical appeals. In the case of com-munal land tenure, it is also unclear whether this type of arrangement has a disadvantagein facing international market shocks. On the one hand if the community is unable tocollectively switch to subsistence crops they may not be able to smooth income shocksand therefore be more prone to violence. That is, the collective nature of communalarrangements might interfere with collective action and decisions which is a problemnot faced by the small landowner. Similarly, as argued by Fearon (2007), it is possiblethat land tenure arrangements in which a proportion of the cultivation is divided amongvarious individuals (e.g. communal lands) re�ects this case: higher productivity of theplot provides them with a larger incentive to grab a larger portion of their share thanwhen land productivity is lower.12
On the other hand, it is possible that communal land arrangements based on sharedownership may be better in attenuating declining pro�ts by establishing collective orsocial insurance mechanisms. For instance, indigenous communities may be better atsmoothing income shocks will fuel less violent than those leaving peasant vulnerableto international markets via social safety nets. In sum, although price shocks changepeasant's opportunity costs of �ghting, it is largely contingent on the relationship to their
12This mechanism would be also similar to the �rapacious channel� described in Dube and Vargas(2012).
21

source of production (land). In this section I analyze whether the e�ect of commodityprice shocks on violence is di�erent under various tenure arrangements zones.
Table 6 shows the results of land tenure on the district level violence. The �rstrow presents the e�ect of the co�ee price shock on violent outcomes. Consistent withprevious tables, a decrease in the value of co�ee production tends to increase violenceintensity. However, this e�ect is attenuated by the type of land arrangement prevailingin the district. The following three rows presents the estimates of β, the term of interestcomparing the three main types of land tenure: ownership, communal and sharecropping.While the coe�cient on ownership suggests there is no di�erence across districts, that ofsharecropping is consistently positive and robust to controlling by the con�ict dynamicsof the other two types of land tenure. In the case of communal land tenure the e�ectsare positive and not within conventional levels of statistical signi�cancy when analyzingattacks commited by the army, yet, still consistent with the importance of shared formsof property rights on con�ict dynamics. However, communal land does appear to greatlyattenuate the e�ect of price shocks on peasant victims, political authorities and killingsmore generally as shown in Panel B.
Comparing the two coe�cients (ownership and tenant regimes) we can see that theincrease in guerrilla violence is smaller in districts with a majority of tenant regime.This di�erence entails that while the negative price shock increased violence, this e�ectwas smaller in tenant districts than otherwise, of which a majority is comprised byowner districts. That is, the increase in guerrilla attacks associated with the price-shock was lower in tenant districts. For instance, while a 10% decrease in the value ofco�ee production increases attacks by 0.16, this number is only 0.14 or 0.13 for eachadditional communal or sharecropping farm in the district. In contrast, there is littleto no di�erence depending on the number of farms owned by individuals in the district.These results suggest that districts with a greater prevalence of shared arrangements seea smaller increase in violence driven by drops in the value of co�ee productions.
The most likely explanation for this case lies in mechanisms of social insurance giventhe fact that these arrangements obliges the division of production among the membersof the community in return for lower risk. In particular, communal lands were obliged,by law, to operate under the express prohibition of selling, dividing or renting the landassigned (Guillet 1979). Similarly, their administrative councils are in charge of majorproductive decisions, thus shifting the economic decisions from the household unit to thecommunity council. These restrictions were intended to provide economic security topeasants during times of distress which suggests they were indeed more insulated fromchanges in the international market.
In the case of sharecropping, there is an arrangement between the landowner andthe peasant (tenant) which also involves some risk sharing such that in di�cult timesthe shared obligations might cushion these peasants from slipping into outright poverty.These sort of arrangements may reduce the radical appeal of movements such as those ofShining Path and explain why some regions actively resisted the presence of rebel groups
22

(often forming self-defense groups) while others at similar levels of income may �nd itmore appealing. One of those examples is that of Cajamarca, a state where povertyand sharecropping arrangements are prevalent, yet, Shining Path found it di�cult toin�ltrate and establish operational bases.
In terms of the price shock, we can observe that the estimates of PriceShockit−1,are negative and signi�cant, thus meaning that negative co�ee price shocks increasedoverall violence in co�ee intense districts relative to non-co�ee districts. For other exportcrops, such as sugar, the coe�cients of the two-way interaction turned out insigni�cant(not shown) suggesting that price shocks and land tenure arrangements do not inducedi�erential e�ects on the aggregate levels of violence. Also, the results corroborates thatviolence is responding to price shocks of co�ee crops, not to what is happening to othercrops or to economy-wide di�culties. In sum, the negative co�ee price shocks increasesoverall violence but such e�ect is smaller in sharecropping areas than otherwise, of whicha majority is formed by individual land ownership.
One concern with this approach is that these estimates compare owned farms, com-munal farms and sharecropping farms to the omitted category composed of mixed farmsand those which were granted ownership via the Agrarian Reform of 1969. To examinewhether these results are driven by the omitted category, in Table 7 I included all landtypes while omitting those of individual ownerhsip. As shown, results are consistentwith those of Table 6, whereby communal and sharecropping arrangements continue tohave an attenuating e�ect on violence compared to those of ownership. A second con-cern is whether these results are robust to measuring land tenure in terms of the shareof the total farms under each regime as opposed to using levels. In Table 8 I present theresults showing that the e�ects are similar to those of Table 6, however, the di�erencesamong types are less visible than when using levels. Yet, such pattern is reverse inTable 9, when I include an indicator for districts in which more than 50% belongs toa speci�c land tenure arrangements. Although the coe�cient of these share indicatorswill be higher than previous estimates (by construction), it is always much greater fordistricts with a majority of either communal or sharecropping arrangements.
A �nal robustness check is to analyze whether the patterns obtained using yearlyvariation in prices are also applicable when looking at the monthly variation in pricesprovided by the International Monetary Fund. As shown, in Table 10, the coe�cient onthe price shock is much smaller than that previously estimated since I am now exploitingmonthly variation in violence intensity. However, the same pattern emerges: districtswith a greater number of communal and sharecropping farms exhibit a lower increasein violence due to changes in the value of co�ee production. In contrast, there is nodi�erences for districts under ownership arrangements.
In sum, combining the results from Table 6 through 10 suggests that a negative co�eeprice shocks increases guerrilla attacks and violence in general, yet, such increase in muchsmaller in areas under sharecropping and communal land districts. The �ndings suggestthat thes property arrangements made them less vulnerable to price shocks suggesting
23

that the opportunity cost of �ghting changes little when the price of co�ee drops. In thenext section I assess whether price shocks e�ectively changed the opportunity cost ofresponding to increased unemployment and patterns of harvesting as a proxy for demandfor labor.
5.4. Price shocks, Land tenure and Demand for Agricultural Labor: A
Mechanism.
The e�ect of price shocks has been interpreted as a�ecting the returns from export cropcultivation: when prices are higher the returns from export crop cultivation are higherthus increasing the amount of labor demanded and wages in crop cultivation areas. Em-ployment and higher returns from crop cultivation increase the costs of participating inthe guerrilla movement therefore reducing violence. In this section I take two approachesto assess whether employment or occupation in agricultural activities might explain thepatterns of violence observed in districts with di�erent land arrangements. I begin byexploiting variation in the yearly co�ee cultivation cycle. As shown in Figure 6 be-low, major co�ee producing states in Peru have a speci�c calendar for harvesting co�eewhich varies in its length and timing. As an example, in the state of Junin, the criticalmonths for co�ee harvesting is April, May and June. However, this is di�erent fromother co�ee producing areas in which the harvesting period is either later or shorter.Since these dates are given by the agro-climatic conditions prevailing in the state, theyare considered exogenous to the timing of Peruvian violence.
Figure 6: Crop Harvest Season: State of Junin
Source: Ministerio de Agricultura Peru (2014)
Exploiting variation in the monthly harvesting season per state and monthly changesin the international price of co�ee, I estimate the following:
24

Attacksijm = αi + δm + β1(PriceShockim−1 ×Harvestjm) (4)
+β2(PriceShockim−1 × LandTypei,1972)+
β3(PriceShockim−1 × LandTypei,1972 ×Harvestjm) + ρim + ηjm + εijm
Where Attacksijm represent the number of violent attacks in district i, state j andmonth m. As before, I include district �xed e�ects (αi) but given now the source oftime variation is monthly, I control for potential factors that may afect violence acrossall districts in a given month (δm). The terms of interest is the sum of the coe�cients β2and β3 for each land type. Other sub-interactions are included in the main speci�cation,yet not shown.
Table11 show the estimates from Equation 4. Speci�cally, it shows how a decreasein the value of co�ee production is associated with greater violence. Yet, such e�ect ismuch larger if the downturn occurs during the harvesting season, consistent with theidea that there will be lower payment and less work opportunities for co�ee agriculturalproducers thus reducing the opportunity cost of violence. Conversely, increases in thevalue of co�ee production lowers the intensity of violence and this e�ect is even largerin months in which co�ee is being harvested. The co�ee calendar appears to have amajor e�ect in the prevalence of violence in general, violence by guerrillas and killings.However, these estimates may be masking di�erential e�ects the harvesting season mayhave according to the type of land tenure prevailing. Therefore, in Table 12 I exploit themonthly variation in the agricultural cycle to assess how it a�ects violence depending onthe type of land tenure in the district. Consistent with previous �ndings, a decrease inthe value of co�ee production increases violence. Yet, such e�ect is smaller in places witha greater number of communal and sharecropper farms. While this pattern shows nodi�erence depending on the number of owned farms, it does exhibit a larger e�ect amongdistricts with a greater number of sharecropping farms. That is, sharecropping farmsexhibit even less violent outbreaks at times of economic downturns during the harvestseasons, suggesting they are better able to attenuate the e�ect of the price shock. Sincesharecropping arrangements are known for relying on a great number of seasonal andtemporary workers, the result is consistent with this pattern.
The next exercise is to use individual level data aggregated collected from di�erenthousehold surveys to assess the e�ect of co�ee price shocks on employment in the agri-cultural sector per type of land arrangement. Speci�cally, I pooled national householdsurveys from the years 1986, 1991, 1993, 1994, 1996, 1997, 1998, 1999 and 2000. Un-fortunately, these surveys only use a sample of districts and the pooled cross-sectionnature of this data does not allow me to include a district �xed e�ect. Therefore, these
25

estimates should be take as indicative rather than causally. However, if the mechanismdescribed above is true, I should see a larger negative e�ect of a drop in co�ee prices onemployment in co�ee producing areas areas with high number of individual landowners.I estimate the following model:
AgricEmploymentcijt = δt + PriceShockit−1 (5)
+β1(PriceShockit−1 ×Owneri,1972) + β2(PriceShockit−1 × Commi,1972)
β3(PriceShockit−1 × Sharecropi,1972)+Xcijt + ρit + ηjt + εijt
Where AgricEmploymentcijt is the di�erence in the percentage of individuals in thedistrict working in the agricultural sector per district i in department j as a share ofthose employed; PriceShockit−1 × Owneri,1972 is level of exposure to changes in co�eeprices during the period interacted with the type of land tenure prevailing; Xcijt areother individual level controls that may in�uence employment decisions: gender andage. An additional control variable is the log of the district population per year. Unlikeprevious estimations, district �xed e�ects cannot be included due to the cross-sectionalnature of the data, yet I cluster the standard errors at the district level. However, Iinclude year e�ects to account for potential national trends in employment. Finally,the data distinguishes the percentage of agricultural workers dedicated to cultivation ingeneral, thus I estimate equation (4) using as dependent variable the share of agriculturalworks from those employed. I am interested in whether the interaction term exhibitsa positive coe�cient: exposure to price shocks increased unemployment in certain landtenure arrangements districts than otherwise.
Table 13 presents the estimates for districts exposed to co�ee price shocks: the coef-�cient shows that an increase in the exposure to co�ee price shocks leads to a di�erentialincrease in employment in places with higher ownership relative to those non-owners.However, this e�ect is much smaller than the one observed for tenant regimes, and muchless to those places with communal land tenure. In fact, areas under tenant or commu-nal land tenure exhibit no di�erence in employment measures in general. This �ndingfavors the channel proposed: the increase in the exposure to negative co�ee prices showsa negative e�ect on the employment rates of ownership districts, thus mirroring theireconomic response to violence and consistent with the idea tha these arrangements maybe better insured against market risk.
6 Conclusion and Extensions.
This paper has examined how export crop prices shocks a�ect violence during an armedcon�ict episode. I present evidence showing that co�ee price shocks have di�erent ef-fects on violence contingent on the type of land tenure involved. A reduction in the
26

price of co�ee increased violence overall and guerrilla violence in particular among co�eedistricts in comparison to non-co�ee districts. These results are robust to a variety ofspeci�cations, including the possibility that violence were to be fueled by coca produc-tion. However, the increase in violence appears to be mediated according to the typeof land tenure prevailing: tenant regimes exhibit a smaller increase in violence duringnegative price shocks than districts with individual ownership land tenure arrangements.This pattern suggests that communal and tenant land districts appear to provide betterinsurance mechanisms to smooth income shocks in the presence of an exogenous changein co�ee rents.
I also present evidence on a plausible mechanism of how commodity price shocksmight increase violence: an increase in unemployment rates. I �nd that this mechanismwas particularly applicable to districts with greater exposure to price shocks from inter-national prices of co�ee and under individual ownership arrangements. That is, in theface of drops in the international prices of co�ee, unemployment levels were higher indistricts with greater ownership than otherwise. The opposite was true for shared landarrangements (communal and tenant). In addition, given that the type of violence thatincreased in co�ee-owner districts was guerrilla violence, these �ndings support the ideaof a greater ability to participate in armed groups among those owning land than amongthose not owning it in co�ee districts. Additional evidence from the timing of violenceshows that these mostly occurred outside the harvesting period for co�ee, precisely whenthe demand for labor and job opportunities were lower. As a placebo test, I show thereis no price shock e�ect at times when harvesting is on.
One implication of these �ndings is that the land reform of 1969 may have been quitesuccessful in de-radicalizing demands of communal land peasants. Given these areaswere the most bene�ted from the reform, it could be the case that these peasants wereparticularly prone to con�ict and after the reform they were not. A second implicationis that small co�ee landowners appear vulnerable to price-shocks and therefore tend tobe recruited in radical rebel groups such as Shining Path. Thus, insurance against badharvesting should be included as a part of agrarian policy. Third, the absence of armyviolence in co�ee areas suggest that their response to violence was motivated by otherdynamics and not due to the agricultural cycle.
Finally, these �ndings encourage further research in three directions: i) The season-ality of violence. One plausible extension of this paper is to look into the seasonalityof the crops cultivated to �nd whether violent crimes follow periods of crop harvesting,when peasants dedicate to other activities rather than the land. Since one of my �ndingsis that the e�ect of price shocks can vary by crop and type of land tenure an additionalfactor to look at is the timing of the attacks. ii) The role of private con�icts in the extentof violence. Although much is said about the violence perpetrated from Shining Path, itis well known that selective killing was more the norm than the exception which can onlyoperate in situation of peasant collaboration. Finding out whether distribution of co�eerents fueled violence will be further explored. iii) The historical dimension of peasant
27

rebellions. It is well established (Dell 2010) how colonial policy of certain areas his-torically undermined further development. Whether these past policies induced certaindistricts to be more con�ict prone or not nowadays, is a topic to be further explored.
28

References
[1] Angrist, Joshua D. and Adriana Kugler. 2008. �Rural Windfall or a NewResource Curse? Coca, Income and Civil Con�ict in Colombia� Review of
Economics and Statistics 90.2 (2008): 191-215.
[2] Bazzi, S., & Blattman, C. (2011). Economic shocks and con�ict: the (Ab-sence of?) Evidence from commodity prices. Center for Global Develop-ment.
[3] Banerjee, Abhijit, Gertler, Paul, Ghatak, Maaitresh, 2002. Empowermentand e�ciency: Tenancy reform in West Bengal. Journal of Political Econ-omy 110 (2), 239�280.
[4] Bannon and Collier. 2003. Natural resources and violent con�ict: Optionsand actions. World Bank Publications.
[5] Blattman, Christopher and Edward Miguel. 2010. Civil War. Journal ofEconomic Literature 48(1): 3-57.
[6] Blattman, C., & Annan, J. (2014). Can Employment Reduce Lawlessnessand Rebellion? A Field Experiment with High-Risk Youth in a FragileState. A Field Experiment with High-Risk Youth in a Fragile State (May9, 2014).
[7] Berman, E., Callen, M., Felter, J. H., & Shapiro, J. N. (2011). Do workingmen rebel? Insurgency and unemployment in Afghanistan, Iraq, and thePhilippines. Journal of Con�ict Resolution, 55(4), 496-528.
[8] Boloña, C. & Illescas, J. 1997. Políticas Arancelarias en el Perú 1980-1997.Lima, Instituto de Economía de Libre Mercado y Universidad San Ignaciode Loyola.
[9] Chassang, Sylvain and Gerard Padro-i-Miquel. 2009. "Economic Shocksand Civil War". Quarterly Journal of Political Science, 4(3): 211-28.
[10] Collier, Paul and Anke Hoe�er. 2004. �Greed and Grievance in Civil War�Oxford Economic Papers 56: 563-595
[11] Collier, Paul and Anke Hoe�er. 1998. �On Economic Causes of Civil War�Oxford Economic Papers 50: 563-573.
[12] Comision de Verdad y Reconciliacion (CVR). 2004. Informe Final.
[13] Dal Bo, E., & Dal Bo, P. (2011). Workers, warriors, and criminals: socialcon�ict in general equilibrium. Journal of the European Economic Associ-ation, 9(4), 646-677.
29
[14] Dell, Melissa. The Persistent E�ects of Peru's Mining Mita. Econometrica(forthcoming).
[15] Dube, Oeindrila and Juan F. Vargas. 2008. Commodity Price Shocks andCivil Con�ict: Evidence from Colombia. Mimeo.
[16] Fairlie, A. & Torres Zorrilla, J. 2002. Nuevas protecciones efectivas en Peru.PUCP report. Lima (mimeo).
[17] Feder, Gerschon, Onchan, Tongroj, Chalamwong, Yongyuth, Hongladarom,Chira, 1988. Land Policies and Farm Productivity in Thailand. Johns Hop-kins University Press, Baltimore.
[18] Fearon, James D. 2005. Primary Commodity Exports and Civil War 49(4):483-507
[19] Fearon, James D., and David D. Laitin. 2003. �Ethnicity, Insurgency, andCivil War�, American Political Science Review 97(1): 75-90.
[20] Fearon, James D., 2007. �Economic Development, Insurgency, and CivilWar�. Helpman, in Elhanan, ed. Institutions and Economic Performance.Cambridge, MA: Harvard University Press.
[21] Field, Erica. 2007. �Entitled to Work: Urban Property Rights and LaborSupply in Peru�. Quarterly Journal of Economics 112(4), 1561-1602.
[22] Gates, Scott. 2002. Recruitment and Allegiance: The Microfoundations ofRebellion. The Journal of Con�ict Resolution. 46(1):111-129.
[23] Guillet, David. 1979. Agrarian Reform and Peasant Economy in SouthernPeru. Columbia: University of Missouri Press. References Iyer and Baner-jee. 2004. History, Institutions and Economic Performance: The Legacy ofColonial Land Tenure Systems in India. American Economic Review 95(4):1190-1213.
[24] Hidalgo, F. D., Naidu, S., Nichter, S., & Richardson, N. (2010). Economicdeterminants of land invasions. The Review of Economics and Statistics,92(3), 505-523.
[25] Hofheinz, Roy. The Broken Wave: The Chinese Communist Peasant Move-ment. 1922-1928. Vol. 90. Harvard University Press, 1977.
[26] Kapsoli, Wilfredo. 1987. Los Movimientos Campesinos En El Peru. Lima:Ediciones Atusparia.
[27] Kocher, Adam and Stathis N. Kalyvas. 2007. How Free is Free Ridingin Civil Wars? Violence, Insurgency, and the Collective Action Problem.World Politics 59 (January 2007): 177-216.
30

[28] Libecap, Gary, Lueck, D., 2008. The Demarcation of Land: Patterns andEconomic E�ects. Mimeo, UCSD
[29] McClintock, Cynthia. 1984. Why Peasants Rebel: The Case of Peru'sSendero Luminoso. World Politics 37(1):48-84.
[30] McClintock, Cynthia. 1998. Revolutionary Movements in Latin America:El Salvador's FMLN and Peru's Shining Path. Washington, DC: UnitedStates Institute of peace Press.
[31] Miguel, Edward, Shanker Satyanath and Ernest Sergenti. 2004. �EconomicShocks and Civil Con�ict: An Instrumental Variables Approach� Journalof Political Economy 112(4): 725-753.
[32] Polo, Michele. 1995. Internal cohesion and competition among criminalorganizations. In "The Economics of Organized crime", Gianluca Fiorentiniand Sam Peltzman (ed.). Cambridge, UK: Cambridge University Press.
[33] Paige, Je�rey. 1978. Agrarian revolution: Social movements and export
agriculture in the developing world. New York: The Free Press.
[34] Popkin, Samuel L. 1979. The rational peasant: The political economy of
rural society in Vietnam. University of California Press
[35] Sambanis, Nicholas. 2004. Poverty and the Organization of Political Vio-lence: A Review and Some Conjectures. Mimeo.
[36] Sambanis, Nicholas and Annalisa Zinn. 2006. From Protest to Violence:Con�ict Escalation in Self-Determination Movements. Mimeo.
[37] Scott, James C. 1977. The Moral Economy of the Peasant: Rebellion andSubsistence in Southeast Asia. New Haven: Yale University Press.
[38] Nillesen, Eleonora and Philip Verwimp. 2009. Grievance, Commodity Pricesand Rainfall: A Village-level analysis of Rebel Recruitment in Burundi.MICROCON Research Working Paper 11, Brighton: MICROCON.
[39] Wickham-Crowley, Timothy P. 1992. Guerrillas and Revolution in LatinAmerica: A Comparative Study of Insurgents and Regimes Since 1956.Princeton: Princeton University Press.
[40] Wantchekon, Leonard et. al. 2009. Underground Insurgency and Demo-cratic Revolution. Mimeo.
[41] Weinstein, Jeremy. 2007. Inside Rebellion: The Politics of Insurgent Vio-lence. Cambridge: Cambridge University press.
[42] Wolf, Eric R. 1969. Peasant Wars of the Twentieth Century. New York:Harper & Row.
31

Appendix A
32

Figure 7: Value of Exports (in thousands of dollars) of Latin American countries.
33

Figure 8: International Prices of Main Crops (US real dollars per kilo)
34

Figure 9: Real International and Local Prices in Peruvian Soles: 1980-2000
35

Table 1: Co�ee Production by Land Tenure
Obs Mean % Owner Di�erence
No Co�ee 26670 0.987Co�ee 7056 0.994T-Stat -4.71
Obs Mean % Communal Di�erence
No Co�ee 26670 0.506Co�ee 7056 0.574T-Stat -10.19
Obs Mean % Sharecropper Di�erence
No Co�ee 26670 0.803Co�ee 7056 0.893T-Stat -18.8
Obs Mean % Owner Reform Di�erence
Low Value 26670 0.493High Value 7056 0.684T-Stat -28.9
36

Table 2: Summary statistics
Variable Mean Std. Dev. N
% Owner Farms 38.755 22.449 33936% Communal Farms 3.671 11.436 33936% Sharecropping Farms 3.662 8.173 33936% Owner-Reform Farms 3.441 9.800 33936% Other Farms 50.472 21.356 33936TotalFarms 866.085 1259.534 33936Owner Farms (per 100) 3.44 5.226 33936Communal Farms (per 100) 0.298 1.105 33936Tenant Farms (per 100) 0.268 0.809 33936Owner - Reform Farms (per 100) 0.332 1.324 33936Co�ee Price (US Cents per kg) 275.116 74.121 43890Co�ee Farms 45.293 210.516 33726Co�ee Value - Log(Price $/Kg * Production) 0.372 1.116 32120Co�ee Hectares 0.085 0.641 33726Co�ee Indicator 0.209 0.407 33726Co�ee Tons (Kg) 0.034 0.265 33726Coca Farms 10.923 86.605 33726Coca Tons 4.335 40.775 33726Coca Hectares 10.748 107.455 33726All Attacks 0.353 4.512 43890Guerrilla Attacks 0.137 1.821 43890Army Attacks 0.195 3.048 43890Peasant Victim 0.083 1.172 43890Killings 0.139 1.999 43890Authority Victim 0.039 0.507 43890Log(Pop) 1990-2000 8.428 1.315 18887Log(Pop) 1980 8.276 1.267 1496Year 1990 6.055 43890
37

Table 3: Co�ee Price Shocks and Violent Attacks: OLSPanel A: Perpetrators
All Attacks Guerrilla Attacks Army Attacks
Log(CofPricet−1 × CofProduction) -1.55*** -0.85*** -0.67**(0.55) (0.31) (0.33)
Observations 17,589 17,589 17,589Number of coddist 1,599 1,599 1,599
Panel B: Victims and Type
Peasants Killings Political Authority
Log(CofPricet−1 × CofProduction) -0.53*** -0.84*** -0.080**(0.20) (0.32) (0.036)
Observations 17,589 17,589 17,589Number of coddist 1,599 1,599 1,599
District FE YES YES YESYear FE YES YES YES
Robust standard errors in parentheses clustered at the district levelAll speci�cations include log(population) and linear state level trends*** p<0.01, ** p<0.05, * p<0.1
38

Table 4: Co�ee Price Shocks and Violence Onset: LPMPanel A: Perpetrators
All Attacks Guerrilla Attacks Army Attacks
Log(CofPricet−1 × CofProduction) -0.039* -0.054*** -0.024(0.020) (0.016) (0.018)
Observations 17,589 17,589 17,589Number of coddist 1,599 1,599 1,599
Panel B: Victims and Type
Peasant Killings Political Authorities
Log(CofPricet−1 × CofProduction) -0.043*** -0.043*** -0.021**(0.013) (0.016) (0.011)
Observations 17,589 17,589 17,589Number of coddist 1,599 1,599 1,599
District FE YES YES YESYear FE YES YES YES
Robust standard errors in parentheses clustered at the district levelAll speci�cations include log(population) and state level time trends*** p<0.01, ** p<0.05, * p<0.1
39
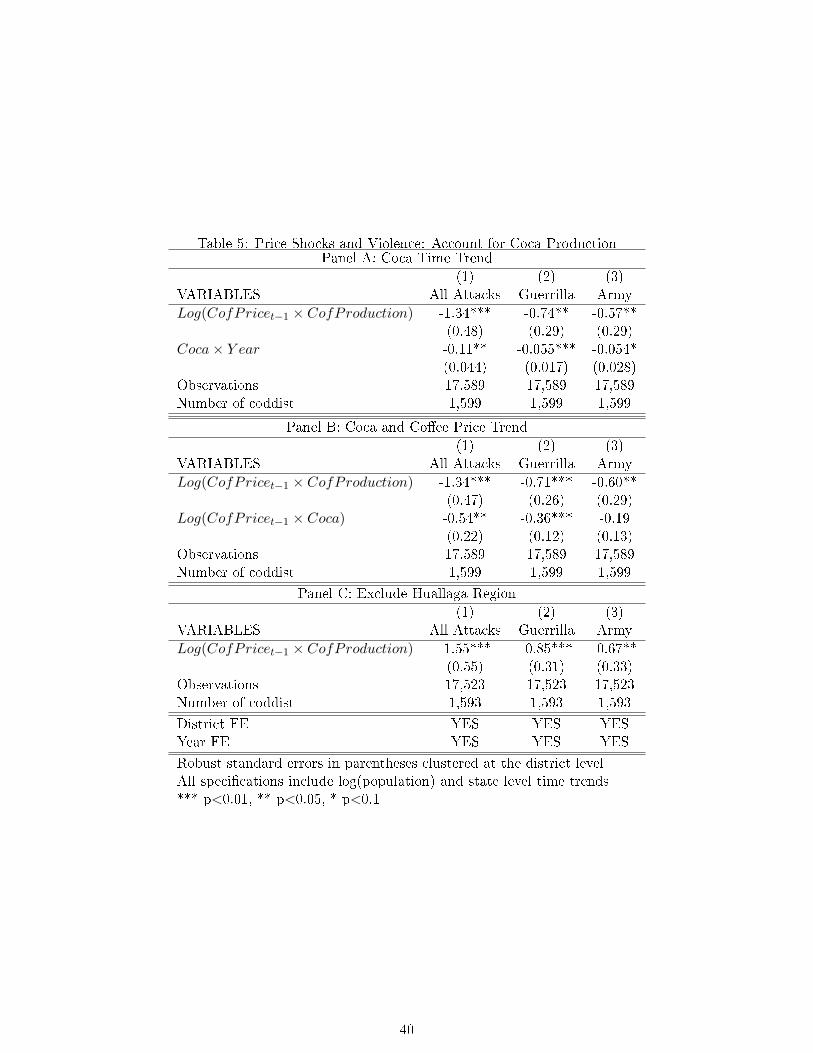
Table 5: Price Shocks and Violence: Account for Coca ProductionPanel A: Coca Time Trend
(1) (2) (3)VARIABLES All Attacks Guerrilla Army
Log(CofPricet−1 × CofProduction) -1.34*** -0.74** -0.57**(0.48) (0.29) (0.29)
Coca× Y ear -0.11** -0.055*** -0.054*(0.044) (0.017) (0.028)
Observations 17,589 17,589 17,589Number of coddist 1,599 1,599 1,599
Panel B: Coca and Co�ee Price Trend
(1) (2) (3)VARIABLES All Attacks Guerrilla Army
Log(CofPricet−1 × CofProduction) -1.34*** -0.71*** -0.60**(0.47) (0.26) (0.29)
Log(CofPricet−1 × Coca) -0.54** -0.36*** -0.19(0.22) (0.12) (0.13)
Observations 17,589 17,589 17,589Number of coddist 1,599 1,599 1,599
Panel C: Exclude Huallaga Region
(1) (2) (3)VARIABLES All Attacks Guerrilla Army
Log(CofPricet−1 × CofProduction) -1.55*** -0.85*** -0.67**(0.55) (0.31) (0.33)
Observations 17,523 17,523 17,523Number of coddist 1,593 1,593 1,593
District FE YES YES YESYear FE YES YES YES
Robust standard errors in parentheses clustered at the district levelAll speci�cations include log(population) and state level time trends*** p<0.01, ** p<0.05, * p<0.1
40

Table 6: Price Shocks, Violence and Land Tenure: FarmsPanel A: Violence Perpetrators
All Attacks Guerrilla Army
(1) (2) (3)
PriceShockt−1 -1.64** -0.85* -0.73(0.77) (0.44) (0.47)
PriceShockt−1 ×OwnerFarms -0.0060 -0.013 0.0030(0.069) (0.045) (0.047)
PriceShockt−1 × CommunalFarms 0.12* 0.063** 0.049(0.067) (0.030) (0.048)
PriceShockt−1 × SharecroppingFarms 0.27*** 0.16** 0.10**(0.094) (0.070) (0.050)
βShock + βShock ∗Owner -1.64** -0.86** -0.73*βShock + βShock ∗ Communal -1.48** -0.75* -0.68βV alue+ βV alue ∗ Sharecrop -1.37* -0.68 -0.63
Observations 17,589 17,589 17,589Number of coddist 1,599 1,599 1,599
Panel B: Violence Type and Victims
Peasant Victim Killings Authority Victim
PriceShockt−1 -0.52* -0.84* -0.087(0.28) (0.46) (0.053)
PriceShockt−1 ×OwnerFarms -0.0074 -0.016 -0.0022(0.027) (0.043) (0.0060)
PriceShockt−1 × CommunalFarms 0.057** 0.092** 0.014***(0.026) (0.044) (0.0053)
PriceShockt−1 × SharecroppingFarms 0.084** 0.17** 0.015*(0.033) (0.067) (0.0082)
βShock + βShock ∗Owner -0.52** -0.85** -0.089*βShock + βShock ∗ Communal -0.46* -0.74* -0.07βV alue+ βV alue ∗ Sharecrop -0.43 -0.67 -0.07
Observations 17,589 17,589 17,589Number of coddist 1,599 1,599 1,599
District FE YES YES YESYear FE YES YES YES
Robust standard errors in parentheses clustered at the district levelAll speci�cations include log(population), linear state time trends and linear district coca producing trends*** p<0.01, ** p<0.05, * p<0.1
41

Table 7: Price Shocks, Violence and Land Tenure: Compared to OwnerPanel A: Violence Perpetrators
All Attacks Guerrilla Army
(1) (2) (3)
PriceShockt−1 -1.28*** -0.76** -0.47*(0.48) (0.36) (0.25)
PriceShockt−1 × CommunalFarms 0.16** 0.10** 0.053(0.076) (0.041) (0.053)
PriceShockt−1 × SharecroppingFarms 0.29** 0.16** 0.12**(0.11) (0.069) (0.058)
PriceShockt−1 ×Owner −ReformFarms -0.11 -0.078 -0.0093(0.11) (0.11) (0.011)
PriceShockt−1 ×OtherFarms -0.0095 -0.0088 -0.0017(0.025) (0.013) (0.016)
Observations 17,589 17,589 17,589Number of coddist 1,599 1,599 1,599
Panel B: Violence Type and Victims
Peasant Victim Killings Authority Victim
PriceShockt−1 -0.38*** -0.76** -0.075*(0.14) (0.36) (0.042)
PriceShockt−1 × CommunalFarms 0.061** 0.097** 0.015***(0.026) (0.041) (0.0053)
PriceShockt−1 × SharecroppingFarms 0.088** 0.16** 0.016*(0.038) (0.071) (0.0083)
PriceShockt−1 ×Owner −ReformFarms -0.11 -0.078 -0.0093(0.11) (0.11) (0.011)
PriceShockt−1 ×OtherFarms -0.0049 -0.0095 -0.0024(0.012) (0.014) (0.0024)
Observations 17,589 17,589 17,589Number of coddist 1,599 1,599 1,599
District FE YES YES YESYear FE YES YES YES
Omitted category = individual ownershipRobust standard errors in parentheses clustered at the district levelAll speci�cations include log(population), linear state time trends and linear district coca producing trends*** p<0.01, ** p<0.05, * p<0.1
42

Table 8: Price Shocks, Violence and Land Tenure DistributionPanel A: Violence Perpetrators
All Attacks Guerrilla Army
(1) (2) (3)
PriceShockt−1 -4.33** -2.15** -2.16*(1.81) (0.88) (1.15)
PriceShockt−1 ×OwnerShare 0.051* 0.023* 0.028*(0.026) (0.012) (0.017)
PriceShockt−1 × CommunalShare 0.064** 0.034** 0.029(0.028) (0.014) (0.018)
PriceShockt−1 × SharecroppingShare 0.11*** 0.059** 0.049**(0.040) (0.024) (0.023)
βShock + βShock ∗Owner -4.28** -2.12** -2.13*βShock + βShock ∗ Communal -4.26** -2.11** -2.13*βV alue+ βV alue ∗ Sharecrop -4.22** -2.09** -2.11*
Observations 17,589 17,589 17,589Number of coddist 1,599 1,599 1,599
Panel B: Violence Type and Victims
Peasant Victim Killings Authority Victim
PriceShockt−1 -1.50** -2.13** -0.26**(0.70) (0.96) (0.11)
PriceShockt−1 ×OwnerShare 0.018* 0.023* 0.0030**(0.010) (0.013) (0.0015)
PriceShockt−1 × CommunalShare 0.024** 0.034** 0.0048***(0.010) (0.015) (0.0018)
PriceShockt−1 × SharecroppingShare 0.034** 0.059** 0.0060**(0.014) (0.025) (0.0027)
βShock + βShock ∗Owner -1.47** -2.1** -0.25**βShock + βShock ∗ Communal -1.47** -2.09** -0.25**βV alue+ βV alue ∗ Sharecrop -1.46** -2.07** -0.25**
Observations 17,589 17,589 17,589Number of coddist 1,599 1,599 1,599
District FE YES YES YESYear FE YES YES YES
Robust standard errors in parentheses clustered at the district levelAll speci�cations include log(population), linear state time trends and linear district coca producing trends*** p<0.01, ** p<0.05, * p<0.1
43

Table 9: Price Shocks, Violence and Land Tenure: Share IndicatorsPanel A: Violence Perpetrators
All Attacks Guerrilla Army
(1) (2) (3)
PriceShockt−1 -2.16*** -1.15** -0.98*(0.83) (0.47) (0.50)
PriceShockt−1 ×+50%Owner 1.82** 0.96* 0.89*(0.89) (0.52) (0.54)
PriceShockt−1 ×+50%Communal 1.57 1.28** 0.21(1.23) (0.50) (1.03)
PriceShockt−1 ×+50%Sharecropping 4.45*** 2.36*** 2.06***(1.24) (0.70) (0.75)
Observations 17,589 17,589 17,589Number of coddist 1,599 1,599 1,599
Panel B: Violence Type and Victims
Peasant Victim Killings Authority Victim
PriceShockt−1 -0.75** -1.13** -0.12**(0.31) (0.49) (0.055)
PriceShockt−1 ×+50%OwnerFarms 0.64** 0.90* 0.099*(0.32) (0.53) (0.060)
PriceShockt−1 ×+50%CommunalFarms 0.89*** 1.16** 0.18***(0.34) (0.55) (0.060)
PriceShockt−1 ×+50%SharecroppingFarms 1.45*** 2.31*** 0.29***(0.46) (0.73) (0.081)
Observations 17,589 17,589 17,589Number of coddist 1,599 1,599 1,599
District FE YES YES YESYear FE YES YES YES
Robust standard errors in parentheses clustered at the district levelAll speci�cations include log(population), linear state time trends and linear district coca producing trends*** p<0.01, ** p<0.05, * p<0.1
44

Table 10: Price Shocks, Violence and Land Tenure: Monthly VariationPanel A: Violence Perpetrators
All Attacks Guerrilla Army
(1) (2) (3)
PriceShockt−1 -0.13** -0.037* -0.088**(0.055) (0.022) (0.043)
PriceShockt−1 ×OwnerFarms -0.0025 -0.0044 0.0024(0.0051) (0.0030) (0.0031)
PriceShockt−1 × CommunalFarms 0.010* 0.0044* 0.0066(0.0058) (0.0023) (0.0045)
PriceShockt−1 × SharecroppingFarms 0.023*** 0.013** 0.0082**(0.0081) (0.0056) (0.0036)
Observations 211,992 211,992 211,992Number of coddist 1,599 1,599 1,599
Panel B: Violence Type and Victims
Killings Peasant Victim Authority Victim
PriceShockt−1 -0.051* -0.046* -0.0050*(0.027) (0.025) (0.0026)
PriceShockt−1 ×OwnerFarms 0.0010 -0.0036 -0.00043(0.0019) (0.0030) (0.00039)
PriceShockt−1 × CommunalFarms 0.0050** 0.0045* 0.00072***(0.0025) (0.0026) (0.00027)
PriceShockt−1 × SharecroppingFarms 0.0054** 0.013** 0.00072(0.0023) (0.0054) (0.00088)
Observations 211,992 211,992 211,992Number of coddist 1,599 1,599 1,599
District FE YES YES YESMonth FE YES YES YES
Robust standard errors in parentheses clustered at the district levelAll speci�cations include linear state time trends and linear district coca producing trends*** p<0.01, ** p<0.05, * p<0.1
45

Table 11: Mechanism: Price Shocks, Violence and Labor Demand during Co�ee HarvestPanel A: Violence Perpetrators
All Attacks Guerrilla Army
(1) (2) (3)
PriceShockt−1 -0.11*** -0.043*** -0.064**(0.033) (0.013) (0.025)
PriceShockt−1 ×Harvest -0.0068** -0.0033* -0.0028(0.0034) (0.0018) (0.0025)
Observations 211,992 211,992 211,992Number of coddist 1,606 1,606 1,606
Panel B: Violence Type and Victims
Killings Peasant Victim Authority Victim
PriceShockt−1 -0.037** -0.048*** -0.0058***(0.016) (0.015) (0.0019)
PriceShockt−1 ×Harvest -0.00034 -0.0038** -0.00019(0.0013) (0.0019) (0.00057)
Observations 211,992 211,992 211,992Number of coddist 1,606 1,606 1,606
District FE YES YES YESMonth FE YES YES YES
Robust standard errors in parentheses clustered at the district levelAll speci�cations include linear state time trends and linear district coca producing trends*** p<0.01, ** p<0.05, * p<0.1
46

Table 12: Mechanism: Price Shocks, Violence and Labor Demand during Co�ee HarvestPanel A: Violence Perpetrators
All Attacks Guerrilla Army
(1) (2) (3)
PriceShockt−1 -0.13** -0.036* -0.087**(0.054) (0.021) (0.042)
PriceShockt−1 ×OwnerFarms -0.0024 -0.0044 0.0024(0.0049) (0.0030) (0.0030)
PriceShockt−1 × CommunalFarms 0.011* 0.0042* 0.0075*(0.0058) (0.0022) (0.0045)
PriceShockt−1 × SharecropperFarms 0.021*** 0.013** 0.0072**(0.0079) (0.0055) (0.0035)
PriceShockt−1 ×Owner ×Harvest -0.000035 -0.000011 -0.000041(0.00070) (0.00041) (0.00041)
PriceShockt−1 × Communal ×Harvest -0.0036 0.00032 -0.0039(0.0028) (0.00023) (0.0028)
PriceShockt−1 × Sharecropper ×Harvest 0.0052*** 0.0012* 0.0039***(0.0018) (0.00064) (0.0015)
Observations 211,992 211,992 211,992Number of coddist 1,606 1,606 1,606
Panel B: Violence Type and Victims
Killings Peasant Victim Authority Victim
PriceShockt−1 -0.050* -0.044* -0.0048*(0.027) (0.024) (0.0026)
PriceShockt−1 ×OwnerFarms 0.0010 -0.0037 -0.00044(0.0019) (0.0029) (0.00040)
PriceShockt−1 × CommunalFarms 0.0053** 0.0046* 0.00075***(0.0025) (0.0026) (0.00028)
PriceShockt−1 × SharecropperFarms 0.0051** 0.013** 0.00053(0.0023) (0.0053) (0.00098)
PriceShockt−1 ×Owner ×Harvest -0.000018 0.00023 0.000026(0.00025) (0.00036) (0.000080)
PriceShockt−1 × Communal ×Harvest -0.0011 -0.00050 -0.00012(0.00078) (0.00088) (0.00016)
PriceShockt−1 × Sharecropper ×Harvest 0.0011** 0.0016** 0.00070(0.00056) (0.00072) (0.00047)
Observations 211,992 211,992 211,992Number of coddist 1,606 1,606 1,606
District FE YES YES YESMonth FE YES YES YES
Robust standard errors in parentheses clustered at the district levelAll speci�cations include linear state time trends and linear district coca producing trends*** p<0.01, ** p<0.05, * p<0.1
47

Table 13: Mechanism: Price Shocks, Violence and Labor Demand during Co�ee Harvest�Compared to Owner
Panel A: Violence Perpetrators
All Attacks Guerrilla Army
(1) (2) (3)
PriceShockt−1 -0.10*** -0.042** -0.055**(0.031) (0.017) (0.022)
PriceShockt−1 × CommunalFarms 0.012** 0.0053** 0.0073*(0.0057) (0.0022) (0.0044)
PriceShockt−1 × SharecropperFarms 0.022** 0.010** 0.011*(0.0090) (0.0044) (0.0059)
PriceShockt−1 × Communal ×Harvest -0.0036 0.00028 -0.0039(0.0028) (0.00022) (0.0028)
PriceShockt−1 × Sharecropper ×Harvest 0.0043*** 0.00079 0.0032**(0.0015) (0.00057) (0.0013)
Observations 211,992 211,992 211,992Number of coddist 1,606 1,606 1,606
Panel B: Violence Type and Victims
Killings Peasant Victim Authority Victim
PriceShockt−1 -0.029*** -0.046*** -0.0054***(0.011) (0.017) (0.0020)
PriceShockt−1 × CommunalFarms 0.0052** 0.0055** 0.00086***(0.0024) (0.0025) (0.00028)
PriceShockt−1 × SharecropperFarms 0.0075** 0.011** 0.00033(0.0038) (0.0046) (0.00072)
PriceShockt−1 × Communal ×Harvest 0.00076* 0.0011 0.00066(0.00045) (0.00068) (0.00044)
PriceShockt−1 × Sharecropper ×Harvest 0.00047*** 0.00064** 0.000022(0.00014) (0.00031) (0.00013)
Observations 211,992 211,992 211,992Number of coddist 1,606 1,606 1,606
District FE YES YES YESMonth FE YES YES YES
Robust standard errors in parentheses clustered at the district levelAll speci�cations include linear state time trends and linear district coca producing trends*** p<0.01, ** p<0.05, * p<0.1
48

Table 14: Mechanism � Employment in Agricultural Sector: Individual Survey DataDV: Share Employed in Agriculture
OLS OLS
(1) (2)
PriceShockt−1 1.79*** 1.31***(0.43) (0.24)
Observations 239,068 229,734Number of coddist 678 641
DV: Share Employed in Agriculture
OLS OLS
PriceShockt−1 1.61*** 0.65**(0.52) (0.27)
PriceShockt−1 ×OwnerFarm 0.0075 0.043***(0.015) (0.011)
PriceShockt−1 × CommunalFarm 0.17 0.091(0.16) (0.089)
PriceShockt−1 × Sharecropping 0.029 0.11(0.11) (0.073)
Observations 239,068 229,734Number of coddist 678 641
Year FE YES YES
Log Population NO YES
Robust standard errors in parentheses clustered at the district levelAll speci�cations include linear state time trends, individual controls (age, age square, gender),and linear coca price trends.*** p<0.01, ** p<0.05, * p<0.1
49