Land Surface Emissivity Characterizations for...
31
Land Surface Emissivity Characterizations for CRTM Applications Fuzhong Weng NOAA/NESDIS/Center for Satellite Applications and Research and Joint Center for Satellite Data Assimilation The 2 nd Workshop on Remote Sensing and Modeling of Surface Properties, Toulouse, France, June 8-11, 2009
Transcript of Land Surface Emissivity Characterizations for...

Land Surface Emissivity Characterizations for CRTM Applications
Fuzhong Weng NOAA/NESDIS/Center for Satellite Applications and Research
andJoint Center for Satellite Data Assimilation
The 2nd Workshop on Remote Sensing and Modeling of Surface Properties,
Toulouse, France, June 8-11, 2009
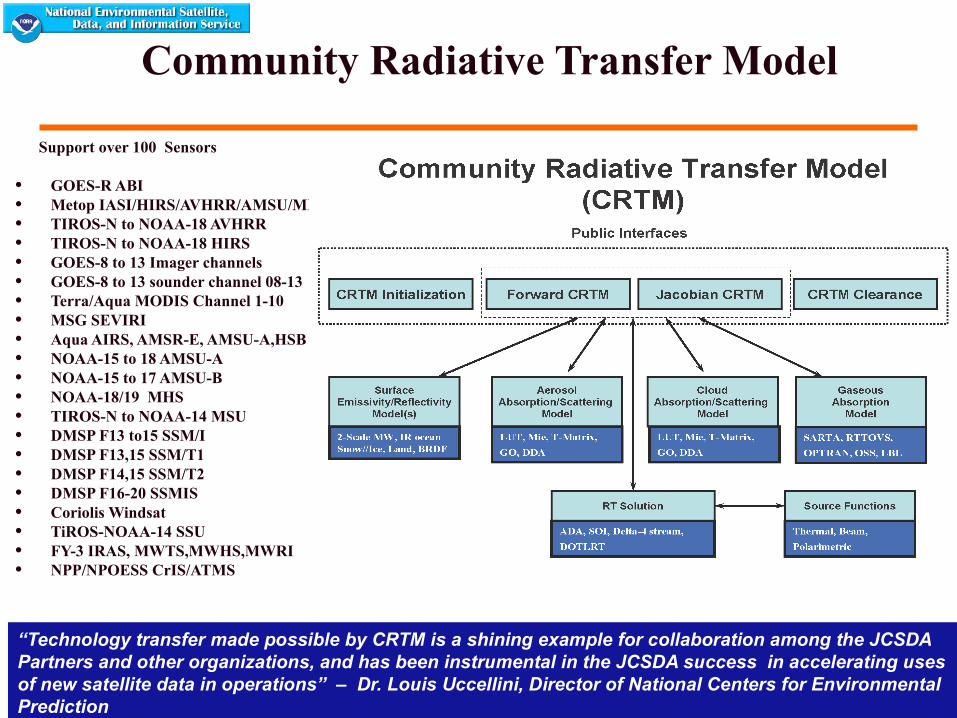
Community Radiative Transfer Model
Support over 100 Sensors
• GOES-R ABI• Metop IASI/HIRS/AVHRR/AMSU/MHS• TIROS-N to NOAA-18 AVHRR• TIROS-N to NOAA-18 HIRS• GOES-8 to 13 Imager channels• GOES-8 to 13 sounder channel 08-13 • Terra/Aqua MODIS Channel 1-10 • MSG SEVIRI • Aqua AIRS, AMSR-E, AMSU-A,HSB• NOAA-15 to 18 AMSU-A• NOAA-15 to 17 AMSU-B• NOAA-18/19 MHS • TIROS-N to NOAA-14 MSU• DMSP F13 to15 SSM/I• DMSP F13,15 SSM/T1• DMSP F14,15 SSM/T2• DMSP F16-20 SSMIS • Coriolis Windsat• TiROS-NOAA-14 SSU• FY-3 IRAS, MWTS,MWHS,MWRI• NPP/NPOESS CrIS/ATMS
“Technology transfer made possible by CRTM is a shining example for collaboration among the JCSDA Partners and other organizations, and has been instrumental in the JCSDA success in accelerating uses of new satellite data in operations” – Dr. Louis Uccellini, Director of National Centers for Environmental Prediction
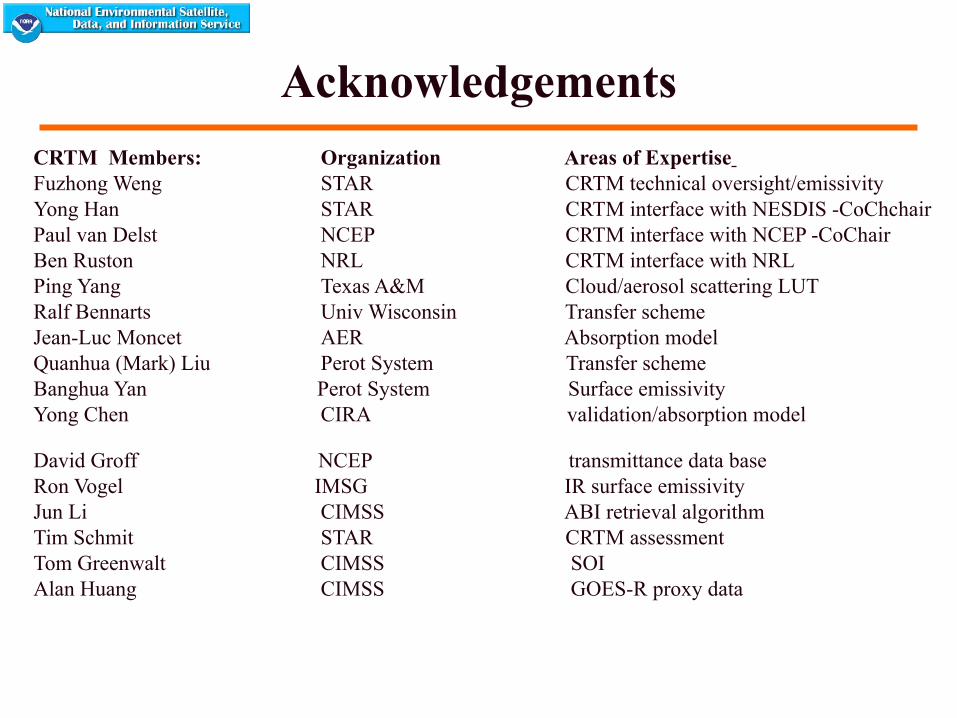
Acknowledgements
CRTM Members: Organization Areas of Expertise Fuzhong Weng STAR CRTM technical oversight/emissivityYong Han STAR CRTM interface with NESDIS -CoChchair Paul van Delst NCEP CRTM interface with NCEP -CoChairBen Ruston NRL CRTM interface with NRLPing Yang Texas A&M Cloud/aerosol scattering LUTRalf Bennarts Univ Wisconsin Transfer schemeJean-Luc Moncet AER Absorption modelQuanhua (Mark) Liu Perot System Transfer scheme Banghua Yan Perot System Surface emissivityYong Chen CIRA validation/absorption model
David Groff NCEP transmittance data baseRon Vogel IMSG IR surface emissivityJun Li CIMSS ABI retrieval algorithmTim Schmit STAR CRTM assessmentTom Greenwalt CIMSS SOIAlan Huang CIMSS GOES-R proxy data
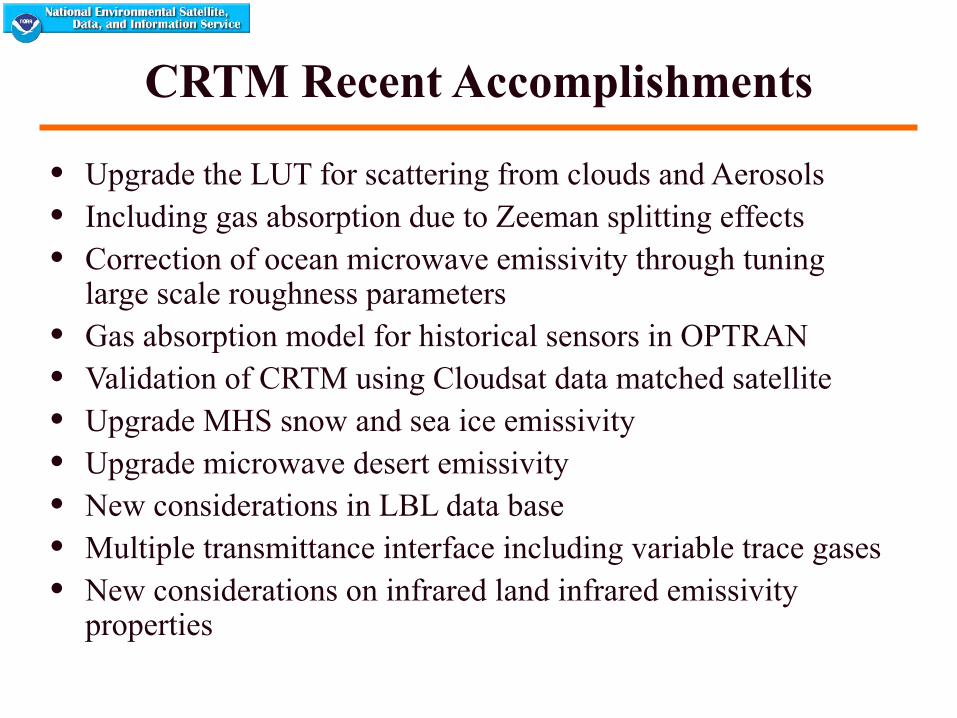
CRTM Recent Accomplishments
• Upgrade the LUT for scattering from clouds and Aerosols• Including gas absorption due to Zeeman splitting effects• Correction of ocean microwave emissivity through tuning
large scale roughness parameters • Gas absorption model for historical sensors in OPTRAN• Validation of CRTM using Cloudsat data matched satellite • Upgrade MHS snow and sea ice emissivity• Upgrade microwave desert emissivity • New considerations in LBL data base• Multiple transmittance interface including variable trace gases • New considerations on infrared land infrared emissivity
properties
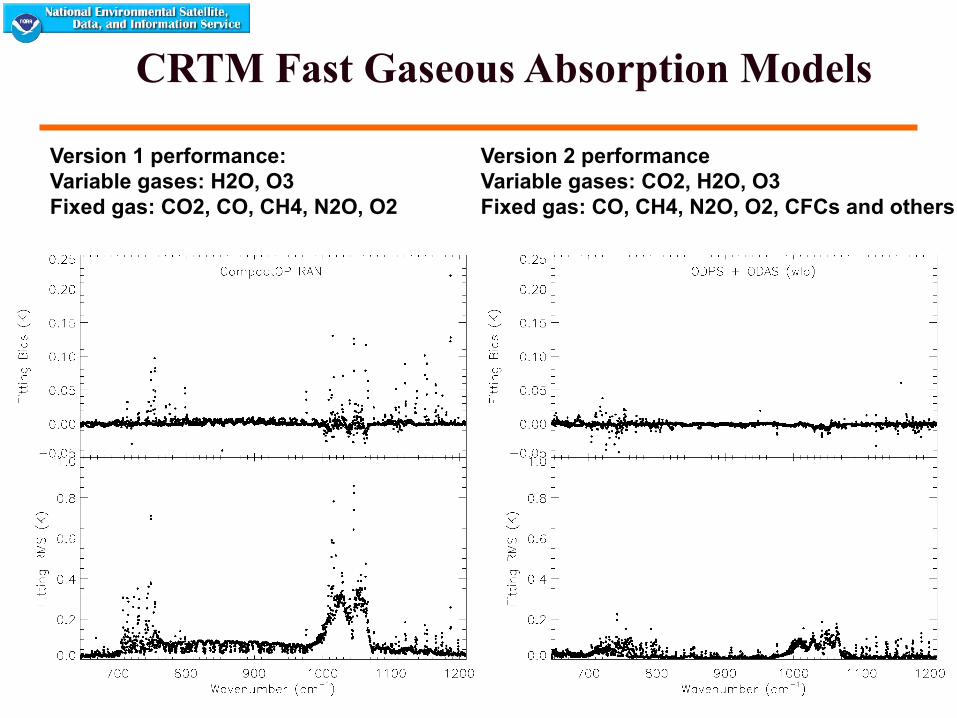
Version 2 performance Variable gases: CO2, H2O, O3Fixed gas: CO, CH4, N2O, O2, CFCs and others
Version 1 performance:Variable gases: H2O, O3Fixed gas: CO2, CO, CH4, N2O, O2
CRTM Fast Gaseous Absorption Models
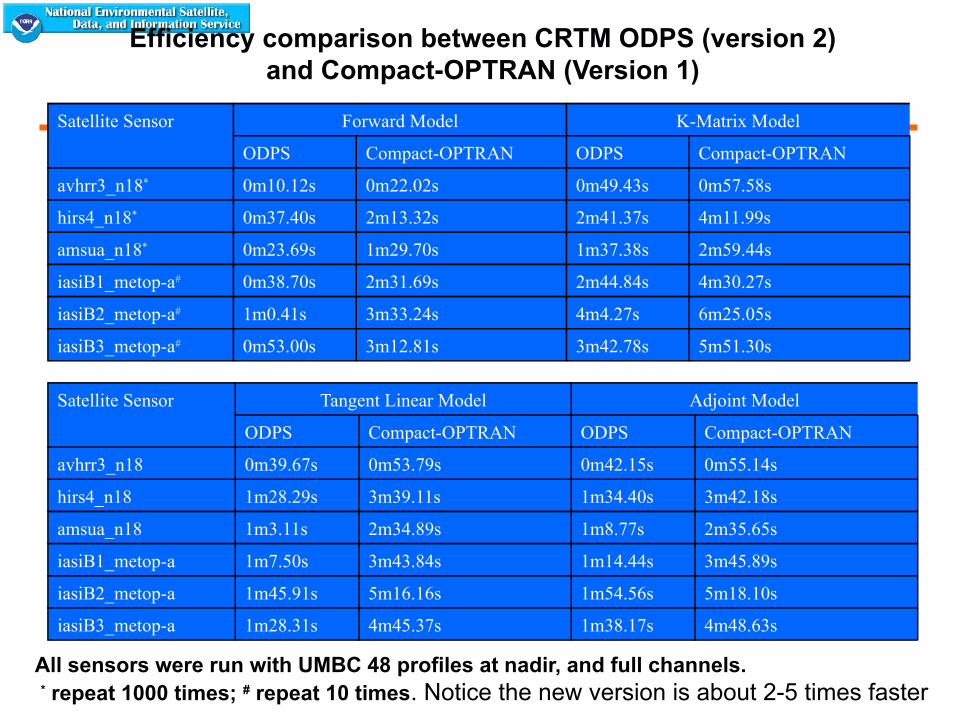
Efficiency comparison between CRTM ODPS (version 2) and Compact-OPTRAN (Version 1)
Satellite Sensor Forward Model K-Matrix Model
ODPS Compact-OPTRAN ODPS Compact-OPTRAN
avhrr3_n18* 0m10.12s 0m22.02s 0m49.43s 0m57.58s
hirs4_n18* 0m37.40s 2m13.32s 2m41.37s 4m11.99s
amsua_n18* 0m23.69s 1m29.70s 1m37.38s 2m59.44s
iasiB1_metop-a# 0m38.70s 2m31.69s 2m44.84s 4m30.27s
iasiB2_metop-a# 1m0.41s 3m33.24s 4m4.27s 6m25.05s
iasiB3_metop-a# 0m53.00s 3m12.81s 3m42.78s 5m51.30s
All sensors were run with UMBC 48 profiles at nadir, and full channels. * repeat 1000 times; # repeat 10 times. Notice the new version is about 2-5 times faster
Satellite Sensor Tangent Linear Model Adjoint Model
ODPS Compact-OPTRAN ODPS Compact-OPTRAN
avhrr3_n18 0m39.67s 0m53.79s 0m42.15s 0m55.14s
hirs4_n18 1m28.29s 3m39.11s 1m34.40s 3m42.18s
amsua_n18 1m3.11s 2m34.89s 1m8.77s 2m35.65s
iasiB1_metop-a 1m7.50s 3m43.84s 1m14.44s 3m45.89s
iasiB2_metop-a 1m45.91s 5m16.16s 1m54.56s 5m18.10s
iasiB3_metop-a 1m28.31s 4m45.37s 1m38.17s 4m48.63s

Microwave LBL (MonoRTM) Data Base
• Update to MT_CKD water vapor continuum in microwave
− Based on ARM ground-based radiometer data− Preliminary numbers for changes:
~10 % decrease in foreign ~20 % increase in self
• Additional features: − Extension beyond microwave region− Improved consistency with LBLRTM in terms of
coding and databases

Improvement of Infrared LBL Data Base
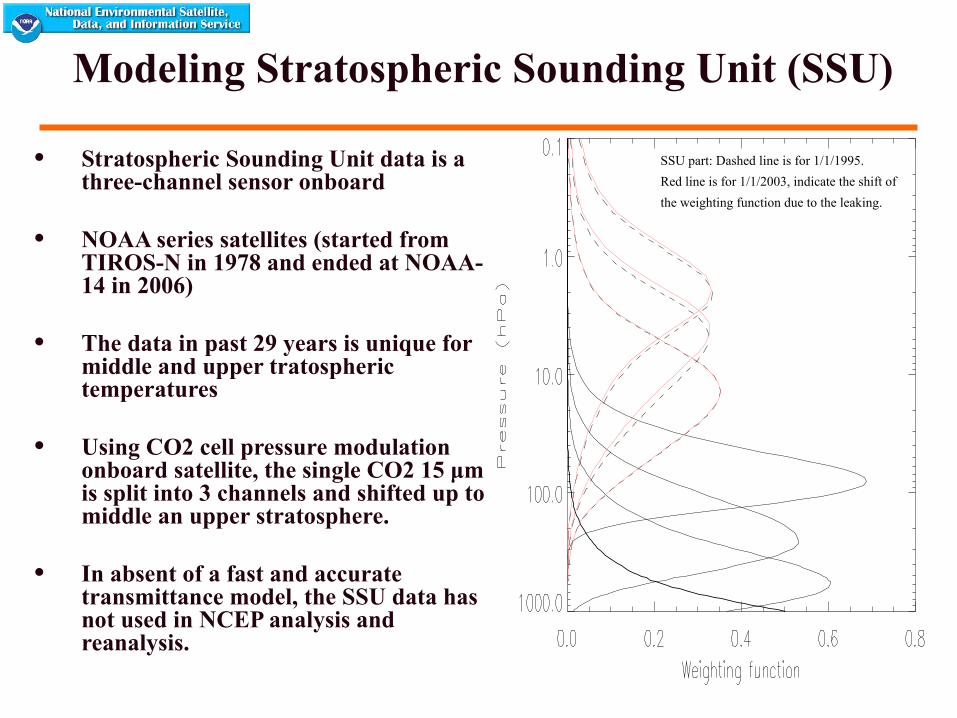
Modeling Stratospheric Sounding Unit (SSU)
• Stratospheric Sounding Unit data is a three-channel sensor onboard
• NOAA series satellites (started from TIROS-N in 1978 and ended at NOAA-14 in 2006)
• The data in past 29 years is unique for middle and upper tratospheric temperatures
• Using CO2 cell pressure modulation onboard satellite, the single CO2 15 μm is split into 3 channels and shifted up to middle an upper stratosphere.
• In absent of a fast and accurate transmittance model, the SSU data has not used in NCEP analysis and reanalysis.
SSU part: Dashed line is for 1/1/1995.
Red line is for 1/1/2003, indicate the shift of
the weighting function due to the leaking.

Comparisons between observation and modeling
The peaks of the SSU weighting function
approximately locate at 15, 5, and 1.5 hPa.
The simulated BT bias at channels 1 and 2 could be caused by a cold bias in stratosphere in the NCEP analysis.
The large scatters for channel 3 is partly
due to the limited top height (~ 0.2 hPa)
in analysis.
190
200
210
220
230
240
250
260
190 200 210 220 230 240 250 260
SSU ch.1 Obs
SS
U c
h.1
Cal
.
std=0.87bias=2.21
200
210
220
230
240
250
260
270
200 210 220 230 240 250 260 270
SSU ch.2 Obs
SS
U c
h.2
Cal
.
std=1.78bias=3.85
21 0
220
230
240
250
260
270
280
210 220 230 240 250 260 270 280
SSU ch.3 Obs
SS
U c
h.3
Cal
.
std=3.11bias=0.74
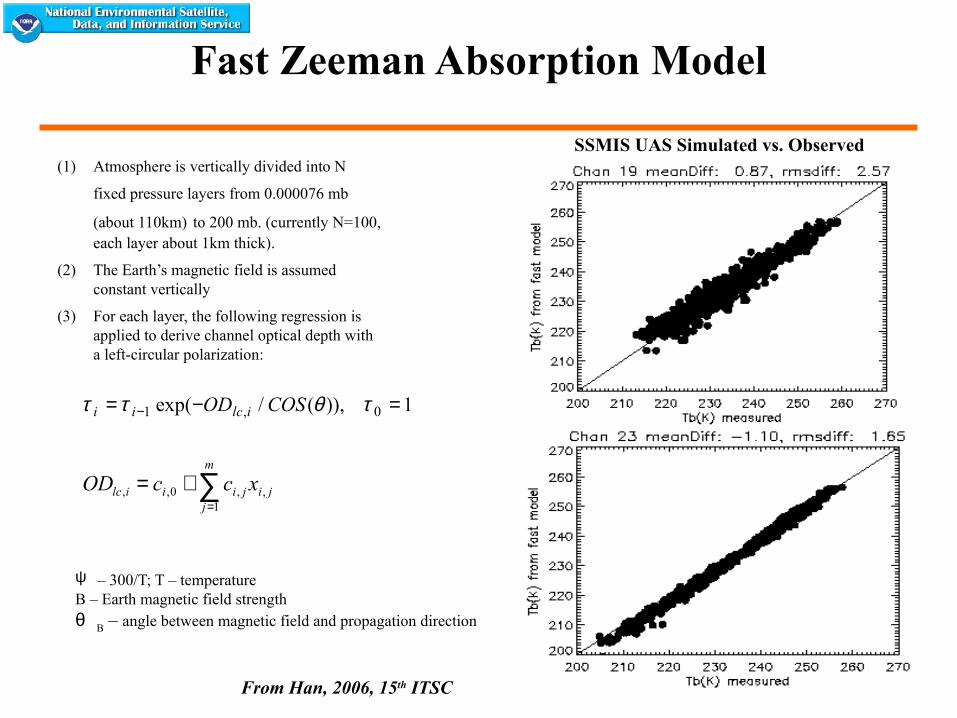
Fast Zeeman Absorption Model
1)),(/exp( 0,1 =−= − τθττ COSOD ilcii
(1) Atmosphere is vertically divided into N
fixed pressure layers from 0.000076 mb (about 110km) to 200 mb. (currently N=100, each layer about 1km thick).
(2) The Earth’s magnetic field is assumed constant vertically
(3) For each layer, the following regression is applied to derive channel optical depth with a left-circular polarization:
∑=
+=m
jjijiiilc xccOD
1,,0,,
ψ – 300/T; T – temperatureB – Earth magnetic field strengthθ B – angle between magnetic field and propagation direction
SSMIS UAS Simulated vs. Observed
From Han, 2006, 15th ITSC
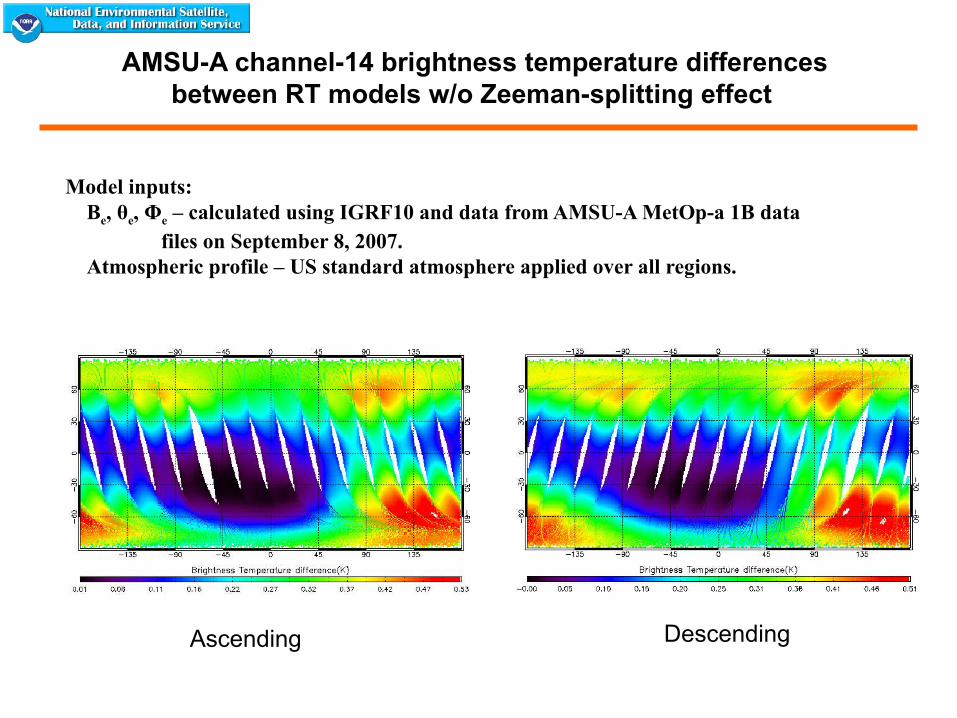
AMSU-A channel-14 brightness temperature differences between RT models w/o Zeeman-splitting effect
Model inputs: Be, θe, Φe – calculated using IGRF10 and data from AMSU-A MetOp-a 1B data
files on September 8, 2007. Atmospheric profile – US standard atmosphere applied over all regions.
Ascending Descending
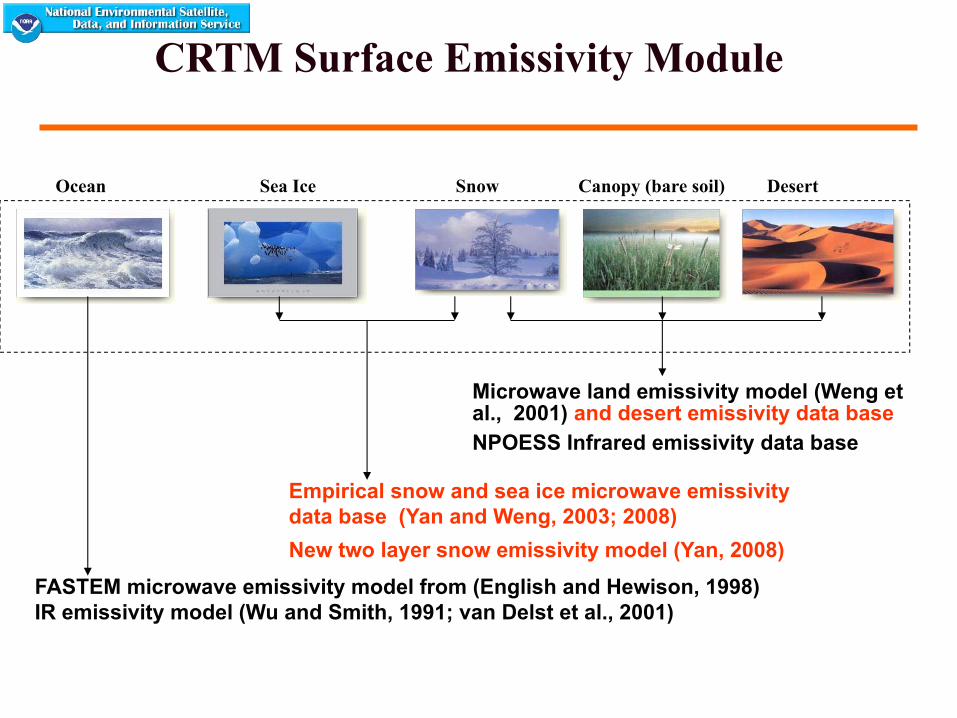
CRTM Surface Emissivity Module
Microwave land emissivity model (Weng et al., 2001) and desert emissivity data baseNPOESS Infrared emissivity data base
Ocean Sea Ice Snow Canopy (bare soil) Desert
Empirical snow and sea ice microwave emissivity data base (Yan and Weng, 2003; 2008)
New two layer snow emissivity model (Yan, 2008)
FASTEM microwave emissivity model from (English and Hewison, 1998)IR emissivity model (Wu and Smith, 1991; van Delst et al., 2001)
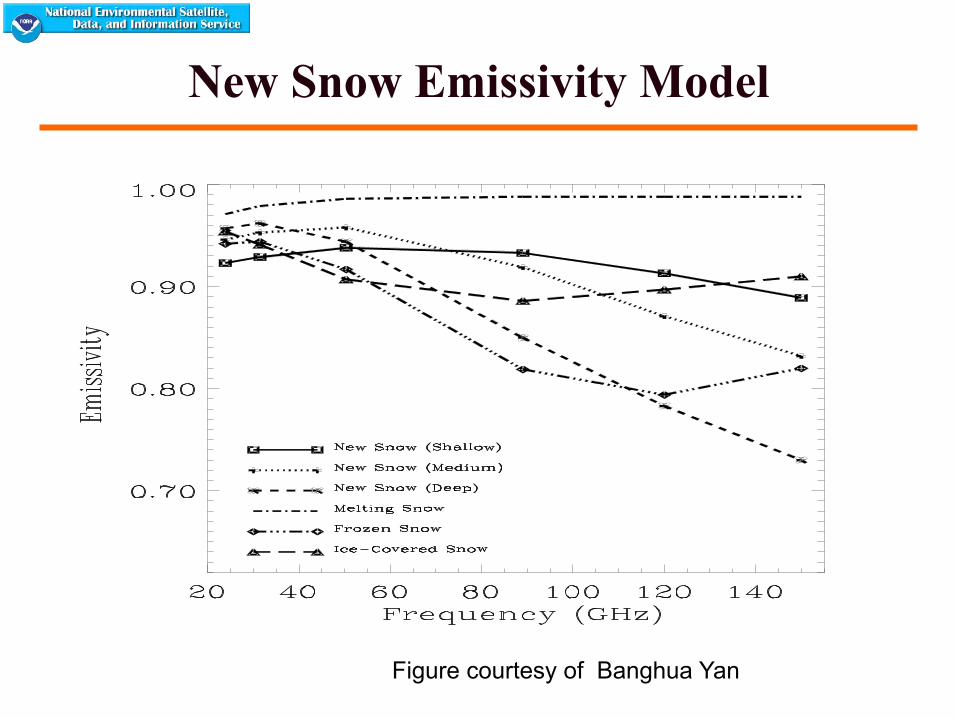
New Snow Emissivity Model
Figure courtesy of Banghua Yan
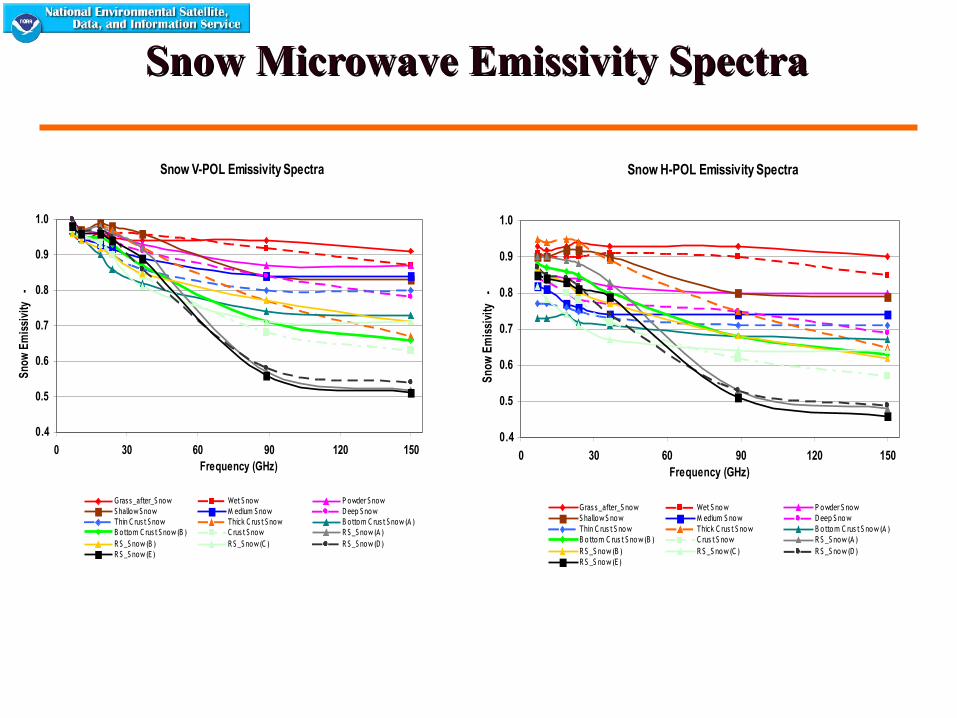
Snow Microwave Emissivity SpectraSnow Microwave Emissivity Spectra
Snow H-POL Emissivity Spectra
0.4
0.5
0.6
0.7
0.8
0.9
1.0
0 30 60 90 120 150Frequency (GHz)
Snow
Em
issi
vity
-
Gras s _after_S now Wet S no w P owder S nowS hallow S now M edium S now D eep S no wThin C rus t S now Thick C rus t S now B ottom C rus t S now (A )B o ttom C rus t S no w (B ) C rus t S now R S _S now (A )R S _S now (B ) R S _S now (C ) R S _S now (D )R S _S now (E)
Snow V-POL Emissivity Spectra
0.4
0.5
0.6
0.7
0.8
0.9
1.0
0 30 60 90 120 150Frequency (GHz)
Snow
Em
issi
vity
-
Gras s _after_S now Wet S now P owder S nowS hallow S now M edium S now D eep S nowThin C rus t S now Thick C rus t S now B ottom C rus t S now (A )B ottom C rus t S now (B ) C rus t S now R S _S now (A )R S _S now (B ) R S _S now (C ) R S _S now (D )R S _S now (E )
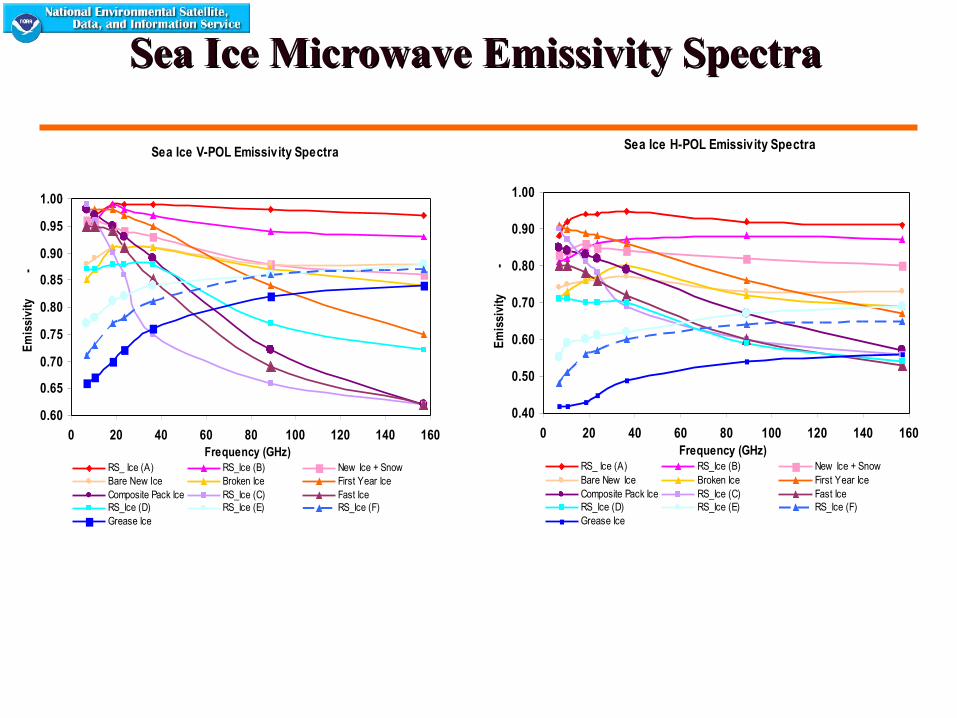
Sea Ice Microwave Emissivity SpectraSea Ice Microwave Emissivity Spectra
Sea Ice H-POL Emissivity Spectra
0.40
0.50
0.60
0.70
0.80
0.90
1.00
0 20 40 60 80 100 120 140 160Frequency (GHz)
Em
issi
vity
-
RS_ Ice (A) RS_Ice (B) New Ice + SnowBare New Ice Broken Ice First Year IceComposite Pack Ice RS_Ice (C) Fast IceRS_Ice (D) RS_Ice (E) RS_Ice (F)Grease Ice
Sea Ice V-POL Emissivity Spectra
0.60
0.65
0.70
0.75
0.80
0.85
0.90
0.95
1.00
0 20 40 60 80 100 120 140 160Frequency (GHz)
Em
issi
vity
-
RS_ Ice (A) RS_Ice (B) New Ice + SnowBare New Ice Broken Ice First Year IceComposite Pack Ice RS_Ice (C) Fast IceRS_Ice (D) RS_Ice (E) RS_Ice (F)Grease Ice
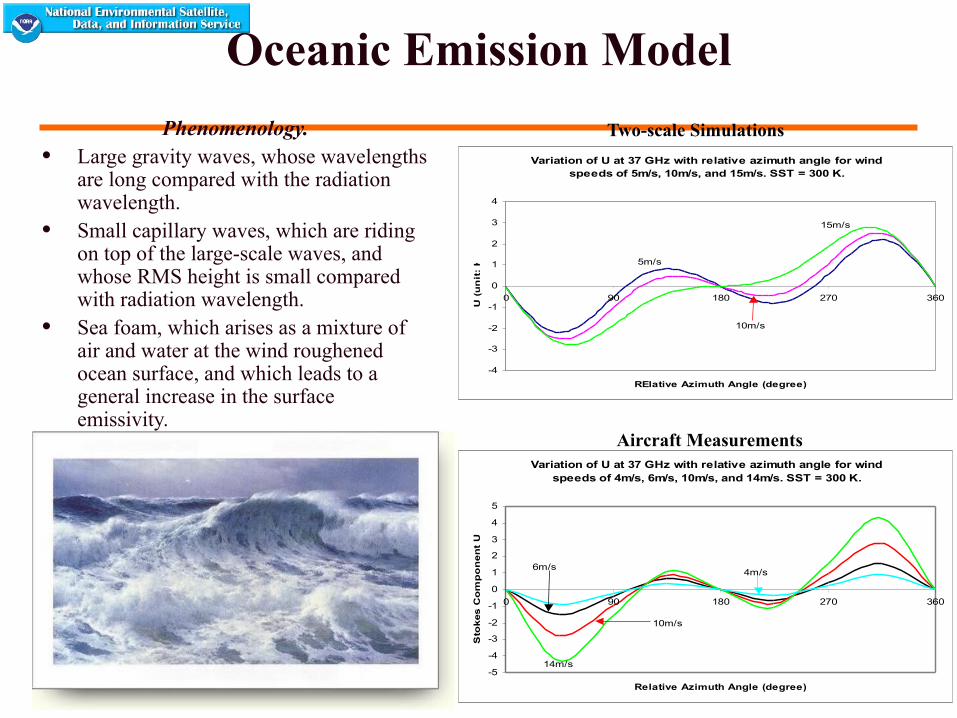
Oceanic Emission Model
Variation of U at 37 GHz with relative azimuth angle for wind speeds of 5m/s, 10m/s, and 15m/s. SST = 300 K.
-4
-3
-2
-1
0
1
2
3
4
0 90 180 270 360
RElative Azimuth Angle (degree)
U (
un
it:
K)
5m/s
15m/s
10m/s
Phenomenology.• Large gravity waves, whose wavelengths
are long compared with the radiation wavelength.
• Small capillary waves, which are riding on top of the large-scale waves, and whose RMS height is small compared with radiation wavelength.
• Sea foam, which arises as a mixture of air and water at the wind roughened ocean surface, and which leads to a general increase in the surface emissivity.
Variation of U at 37 GHz with relative azimuth angle for wind speeds of 4m/s, 6m/s, 10m/s, and 14m/s. SST = 300 K.
-5
-4
-3
-2
-1
0
1
2
3
4
5
0 90 180 270 360
Relative Azimuth Angle (degree)
Sto
kes C
om
po
nen
t U
(K
)
6m/s
10m/s
14m/s
4m/s
Two-scale Simulations
Aircraft Measurements
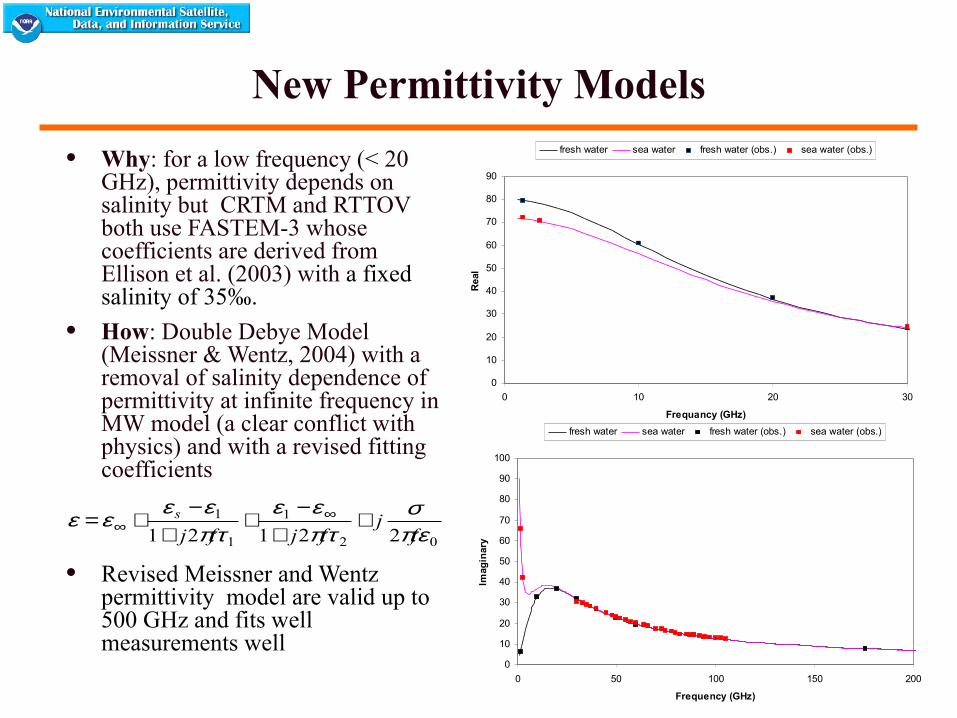
New Permittivity Models
• Why: for a low frequency (< 20 GHz), permittivity depends on salinity but CRTM and RTTOV both use FASTEM-3 whose coefficients are derived from Ellison et al. (2003) with a fixed salinity of 35‰.
• How: Double Debye Model (Meissner & Wentz, 2004) with a removal of salinity dependence of permittivity at infinite frequency in MW model (a clear conflict with physics) and with a revised fitting coefficients
• Revised Meissner and Wentz permittivity model are valid up to 500 GHz and fits well measurements well
0
10
20
30
40
50
60
70
80
90
0 10 20 30
Frequancy (GHz)
Rea
l
fresh water sea water fresh water (obs.) sea water (obs.)
0
10
20
30
40
50
60
70
80
90
100
0 50 100 150 200
Frequency (GHz)
Imag
inar
y
fresh water sea water fresh water (obs.) sea water (obs.)
02
1
1
1
22121 επσ
τπεε
τπεε
εεf
jfjfj
s ++
−+
+−
+= ∞∞
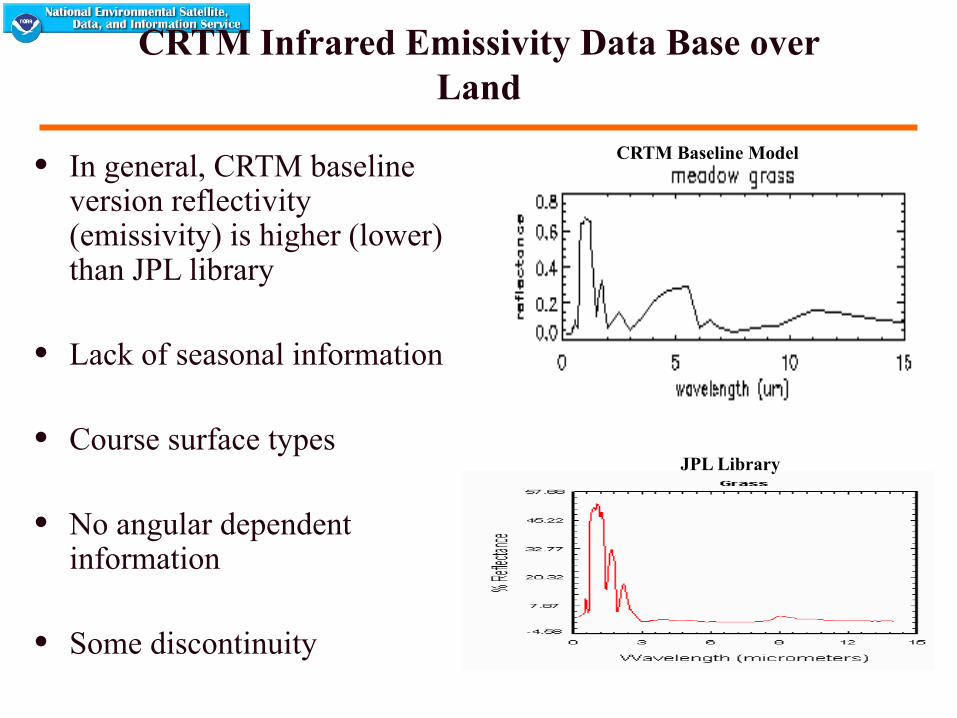
CRTM Infrared Emissivity Data Base over Land
• In general, CRTM baseline version reflectivity (emissivity) is higher (lower) than JPL library
• Lack of seasonal information
• Course surface types
• No angular dependent information
• Some discontinuity
CRTM Baseline Model
JPL Library
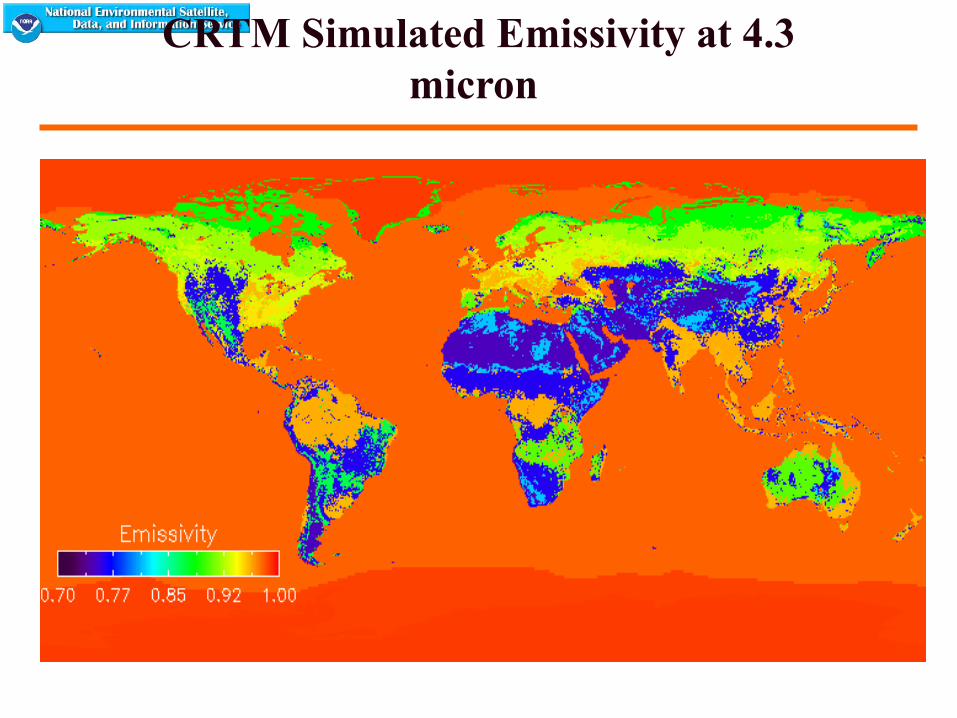
CRTM Simulated Emissivity at 4.3 micron
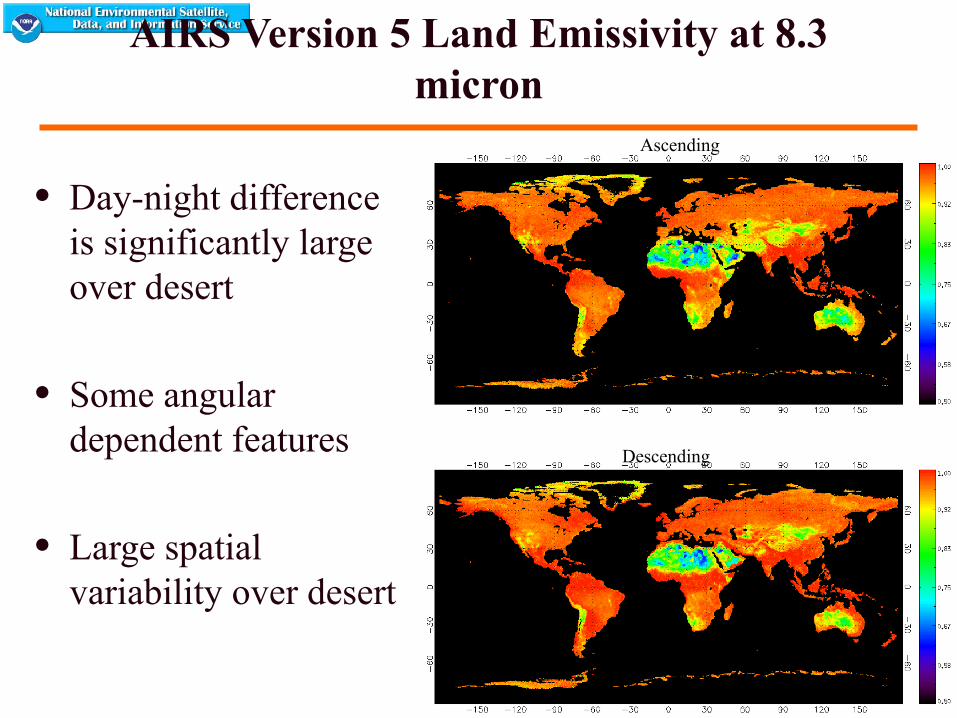
AIRS Version 5 Land Emissivity at 8.3 micron
• Day-night difference is significantly large over desert
• Some angular dependent features
• Large spatial variability over desert
Ascending
Descending
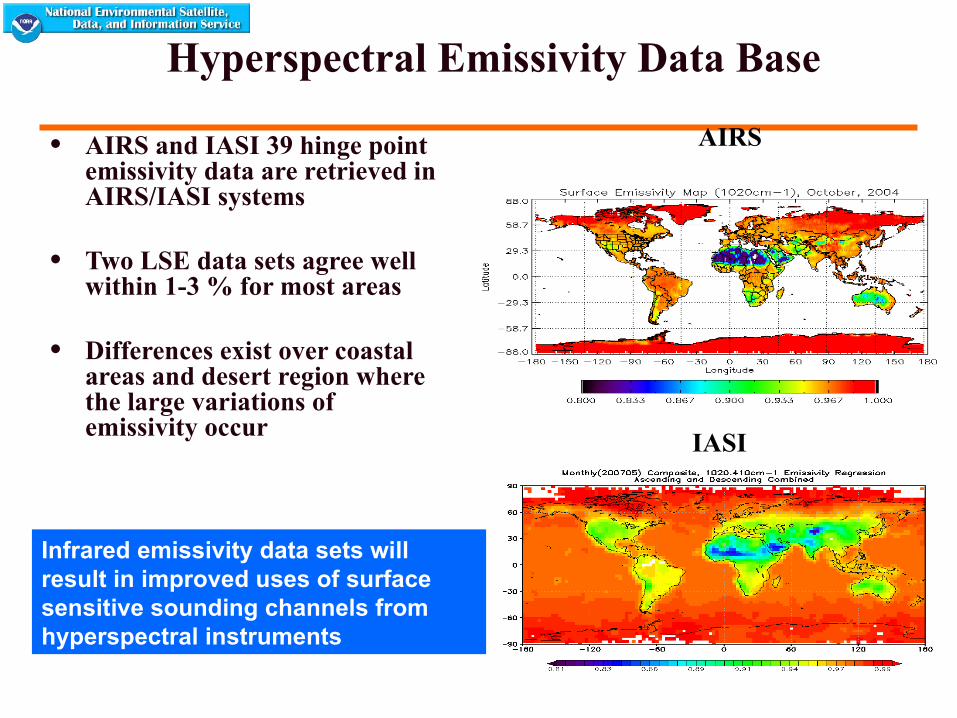
AIRS
IASI
Hyperspectral Emissivity Data Base
• AIRS and IASI 39 hinge point emissivity data are retrieved in AIRS/IASI systems
• Two LSE data sets agree well within 1-3 % for most areas
• Differences exist over coastal areas and desert region where the large variations of emissivity occur
Infrared emissivity data sets will result in improved uses of surface sensitive sounding channels from hyperspectral instruments
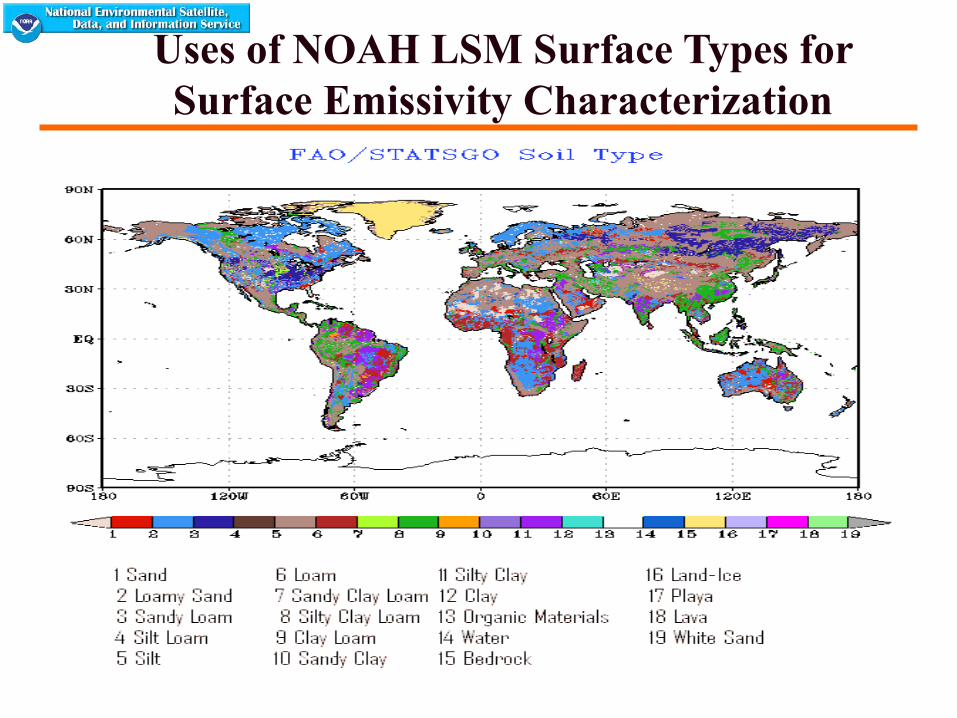
Uses of NOAH LSM Surface Types for Surface Emissivity Characterization

Infrared Emissivity vs. Scan Angle
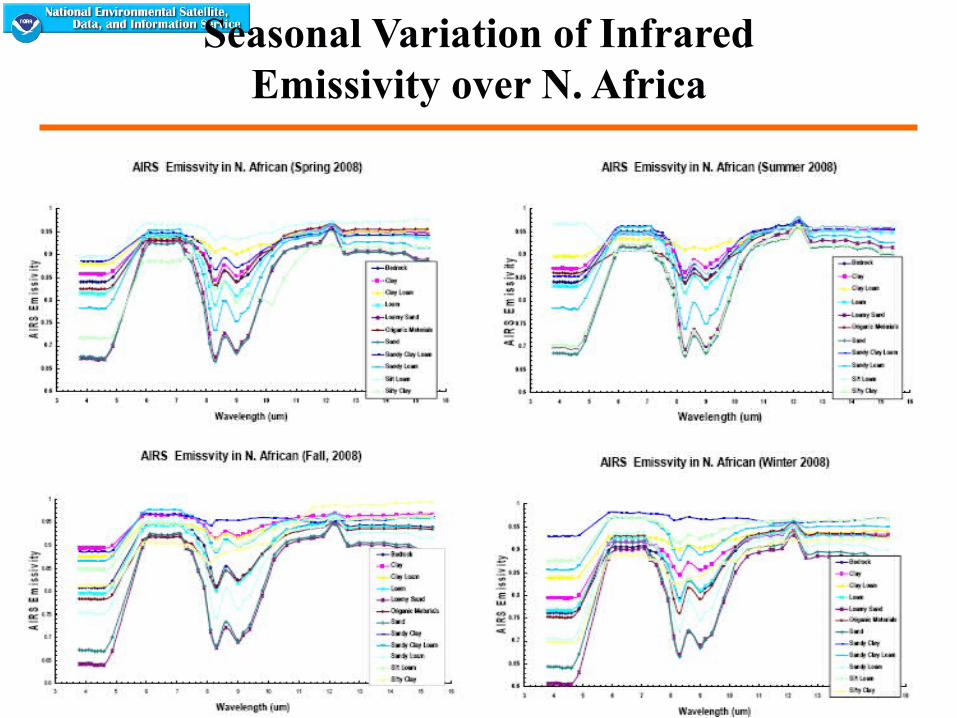
Seasonal Variation of Infrared Emissivity over N. Africa

Infrared Emissivity vs. Soil Structure (N. Africa, Jan – Mar 0-12, 2008)
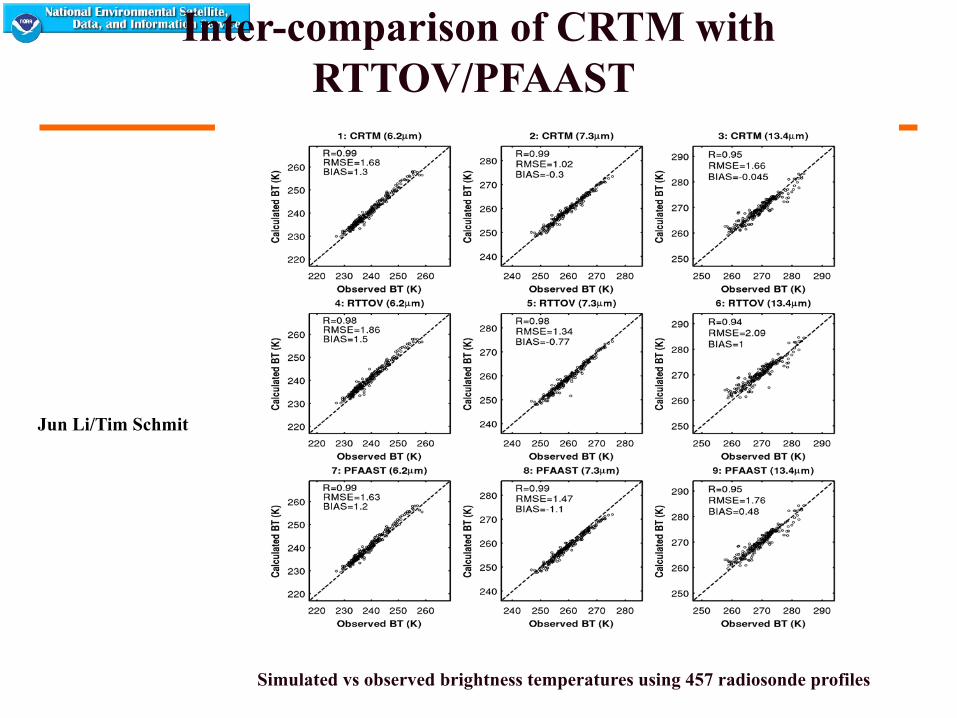
Inter-comparison of CRTM with RTTOV/PFAAST
Simulated vs observed brightness temperatures using 457 radiosonde profiles
Jun Li/Tim Schmit
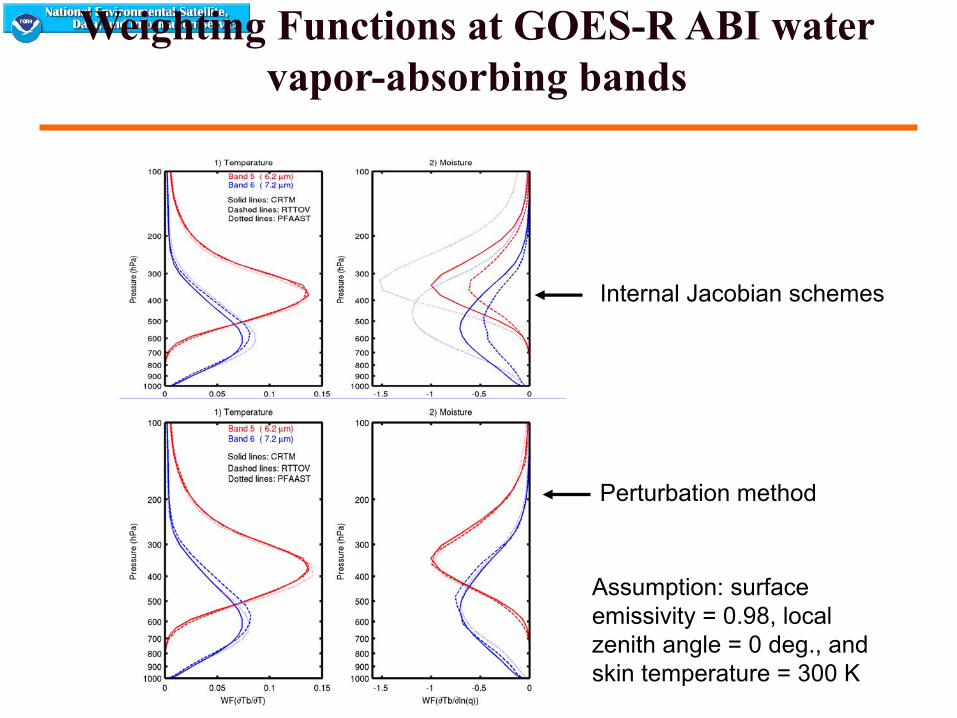
Weighting Functions at GOES-R ABI water vapor-absorbing bands
Assumption: surface emissivity = 0.98, local zenith angle = 0 deg., and skin temperature = 300 K
Internal Jacobian schemes
Perturbation method
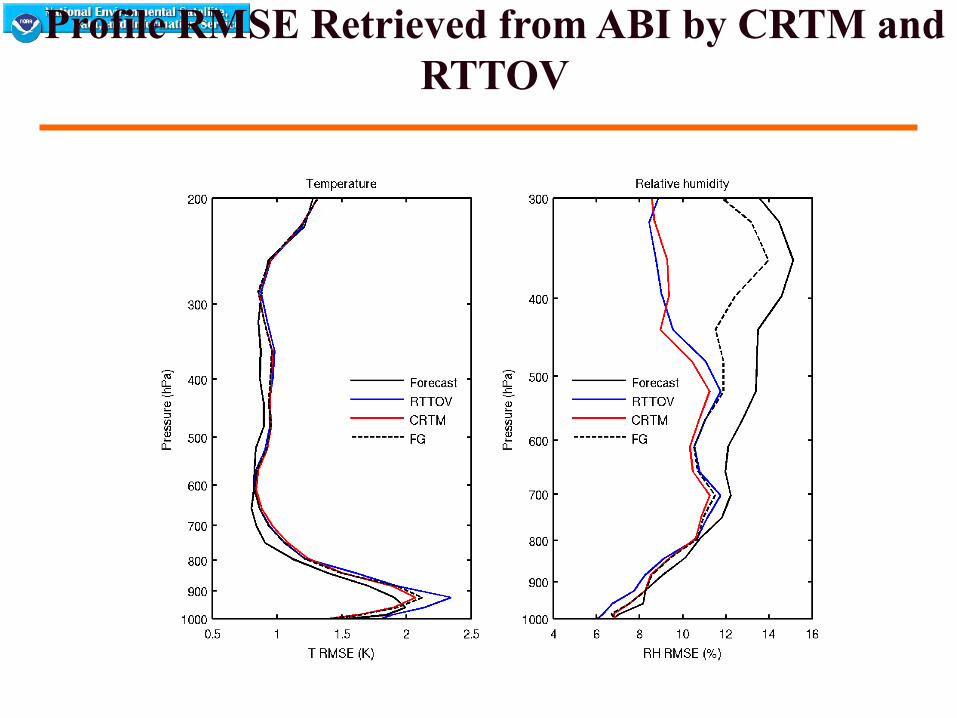
Profile RMSE Retrieved from ABI by CRTM and RTTOV
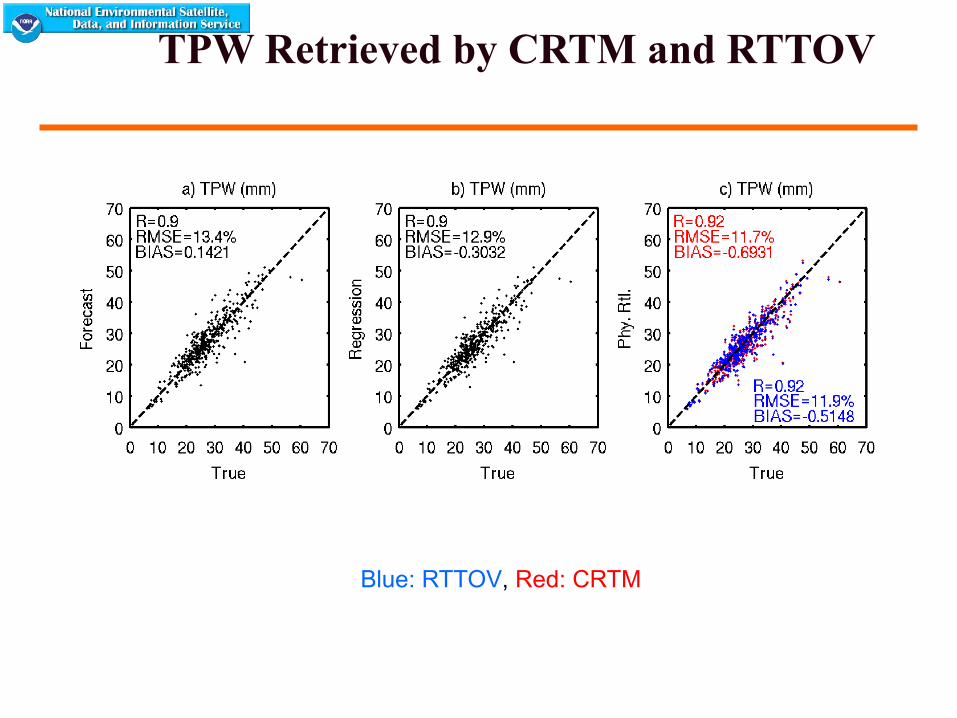
TPW Retrieved by CRTM and RTTOV
Blue: RTTOV, Red: CRTM
Summary
• US Joint center for satellite data assimilation (JCSDA) program has developed a new generation of radiative transfer model (community radiative transfer model, CRTM) for uses in NWP data assimilation system
• Currently, CRTM has been used by JCSDA partners NCEP, NRL, GMAO, NCAR/AFWA, GOES-R Program.
• Version 2 CRTM upgrades include ODPS, MW land emissivity, aerosols, and other advanced algorithms
• Independent assessments of CRTM by CIMSS team show excellent performance for several applications, i.e., ABI and SEVERI retrievals, and NWP applications
• Impacts of CRTM on GFS analysis and other data assimilation systems are positive. Impacts of the emissivity models alone on global 6-7 forecasts are also assessed and significant.
• Infrared emissivity analysis from AIRS retrievals demonstrates large variability depending on surface type, and scan angle, etc. LSE diurnal variability over deserts seem to be too large and unreal.