Land Inequality and Rural Unrest: Theory and Evidence from...
63
Land Inequality and Rural Unrest: Theory and Evidence from Brazil Michael Albertus ∗ Thomas Brambor † Ricardo Ceneviva ‡ Abstract What is the relationship between landholding inequality and rural unrest? And why does land reform that ostensibly addresses rural grievances sometimes exacerbate unrest? We advance the understanding of these longstanding questions by shifting the emphasis from how landholding inequality fuels rural grievances to how it captures the collective action capacity of landowners. Using municipal-level data from Brazil’s large land reform program from 1988 – 2013, we demonstrate that the relationship between landholding inequality and unrest is conditional. Isolated threats to landed elites in the form of land invasions are difficult to repel, generating a positive relationship between landholding inequality and one- off land invasions. By contrast, sustained, broader local threats triggered by nearby land reforms catalyze landowner organization to repel land invasions, leading to the reverse rela- tionship. The findings provide a novel answer for why a straightforward link between land inequality and rural unrest is elusive, and may generalize to a broad range of similar cases. Word count: 10,991 ∗ Department of Political Science, University of Chicago, 5828 S. University Avenue, Pick Hall 426, Chicago, IL 60637, phone: (773) 702-8056, email: [email protected]. † Department of Political Science, Lund University, PO Box 52221 00 Lund, Sweden. Phone: +46 (0)46-2224554. Email: [email protected]. ‡ Departamento de Ciˆ encia Pol´ ıtica, Instituto de Estudos Sociais e Pol´ ıticos, Universidade do Estado do Rio de Janeiro, Rua da Matriz, 82, Botafogo, Rio de Janeiro, RJ, 22260-100, Brazil. Phone: +55 21 2266-8300. E-mail: [email protected].
Transcript of Land Inequality and Rural Unrest: Theory and Evidence from...

Land Inequality and Rural Unrest:Theory and Evidence from Brazil
Michael Albertus∗
Thomas Brambor†
Ricardo Ceneviva‡
Abstract
What is the relationship between landholding inequality and rural unrest? And why doesland reform that ostensibly addresses rural grievances sometimes exacerbate unrest? Weadvance the understanding of these longstanding questions by shifting the emphasis fromhow landholding inequality fuels rural grievances to how it captures the collective actioncapacity of landowners. Using municipal-level data from Brazil’s large land reform programfrom 1988 – 2013, we demonstrate that the relationship between landholding inequalityand unrest is conditional. Isolated threats to landed elites in the form of land invasions aredifficult to repel, generating a positive relationship between landholding inequality and one-off land invasions. By contrast, sustained, broader local threats triggered by nearby landreforms catalyze landowner organization to repel land invasions, leading to the reverse rela-tionship. The findings provide a novel answer for why a straightforward link between landinequality and rural unrest is elusive, and may generalize to a broad range of similar cases.
Word count: 10,991
∗Department of Political Science, University of Chicago, 5828 S. University Avenue, Pick Hall 426, Chicago,IL 60637, phone: (773) 702-8056, email: [email protected].
†Department of Political Science, Lund University, PO Box 52221 00 Lund, Sweden. Phone: +46(0)46-2224554. Email: [email protected].
‡Departamento de Ciencia Polıtica, Instituto de Estudos Sociais e Polıticos, Universidade do Estado doRio de Janeiro, Rua da Matriz, 82, Botafogo, Rio de Janeiro, RJ, 22260-100, Brazil. Phone: +55 21 2266-8300.E-mail: [email protected].

What is the relationship between inequality in landownership and rural unrest? And
why does land reform that is aimed at undercutting potential grievances sometimes inflame the
countryside? These questions have a long intellectual pedigree, rooted in the idea that because
access to land is the cornerstone of rural life, a skewed distribution of landholdings can fuel rural
grievances and unrest (Brockett, 1992; Russett, 1964; Verwimp, 2005). At the same time, land
reform – the chief policy tool available to ameliorate land inequality and address rural grievances
– should have the potential to successfully mitigate rural unrest (e.g. Wood, 2003).
Early attempts to establish a relationship between landholding inequality and political vio-
lence nonetheless yielded inconclusive results. Whereas Russett’s seminal work uncovered a positive
link between land inequality and unrest (Russett, 1964), a finding echoed by Midlarsky (1988) and
Binswanger, Deininger, and Feder (1995), other scholars have found little systematic relationship
(Brockett, 1992; Collier and Hoeffler, 2004; Cramer, 2003; Lichbach, 1989; Moore, Lindstrom, and
O’Regan, 1996; Muller and Seligson, 1987). Furthermore, there is mixed evidence as to whether
land reform always has the intended consequences of generating stability in the countryside (e.g.
Albertus and Kaplan, 2013; Alston, Libecap, and Mueller, 2000; Mason, 1998; Moore et al., 1996).
This paper revisits these important debates, motivated by persistent high land inequality
alongside land squatting and organized land invasions in many developing countries, as well as
ongoing efforts to stamp out these problems through land reform. While doing so, we advance
the literature by addressing central issues of measurement and theory construction – key concerns
that bedeviled earlier conclusions on the subject (see, e.g., Cramer, 2003; Lichbach, 1989).1
We focus on how and when land reforms spill over geographically into more unrest in the
case of Brazil’s ongoing land reform program. Brazil’s Gini coefficient of landholding was 0.857
in 2006, one of the highest in the world. During the period 1988–2013, the National Institute of
Colonization and Agrarian Reform (INCRA) transferred almost 77 million hectares of land, an area
larger than the size of Texas, to almost one million families (INCRA, 2011).2 At the same time,
1Indeed, the prominent debate in the 1980s and 1990s on landholding inequality and violence petered outdue to the contradictory and ultimately inconclusive nature of earlier findings, driven largely by insuperabledata quality problems and resultant measurement disagreements.
2While Brazil’s land reform is massive in absolute size, it is smaller in relative terms – though hardlyinsubstantial. Over the period 1930-2008, Brazil ranks sixth within Latin America in terms of the amount ofland distributed for reform purposes relative to cultivable land area after Bolivia, Chile, Colombia, Cuba, andMexico (see Albertus 2015). Over the period 1988–2013, it ranks second within Latin America in terms of theamount of land reform relative to cultivable area.
1

there were over 9,400 land invasions in rural areas – staged by several million individuals – and
1,200 killings of peasants and peasant leaders (CPT, 2014; Girardi, 2014). Some of these invasions
have occurred in highly unequal municipalities. Yet other unequal municipalities have entirely
avoided land invasions and some of the most conflict-prone municipalities are not highly unequal.
Addressing this puzzling pattern yields a novel answer as to why a straightforward
relationship between land inequality and rural conflict is elusive. In contrast to most studies
that posit an unconditional, linear relationship between landholding inequality and unrest, we
argue instead that this relationship is a conditional one that depends on when inequality activates
collective action among landowners rather than the landless. Scholars have long noted that the
rural grievances and landlessness associated with land inequality often fail to translate into collective
action among peasants given the steep barriers to organization in sparsely populated rural areas
where landowners dominate many aspects of rural life and the rural workforce (Muller, Seligson,
et al., 1989; Paige, 1975). Yet consistent with the broader literature on elite collective action (e.g.
Acemoglu and Robinson, 2006; Albertus, 2015), high land inequality typically does enable large
landowners to act collectively (Galor, Moav, and Vollrath, 2009; Ziblatt, 2008). A small, wealthy
landowning class is conducive to social coherence: landed families disproportionately intermarry,
collaborate in business, and are in contact at exclusive social events (e.g. Costa, 2012; Gilbert, 1977).
We explore the collective action capacity of landowners as a mechanism that mediates the
relationship between landholding inequality and rural unrest as expressed through land invasions.
Land invasions are typically well-organized and pre-planned incursions into large, unproductive
estates by landless or land-poor agrarian workers (Hidalgo et al., 2010); the modal incursion
involves several hundred families. Workers typically set up temporary tents immediately and
squat on the property until either the government comes to negotiate a land claim with them
or they are forcibly expelled from the property. Land invasions often occur late at night in order
to avoid preemptive action to block their activities by landowners or the government.
We consequently find that isolated land invasions (initial invasions in areas where the land
reform program is not active) that take place in municipalities with high landholding inequality are
difficult for large landowners to protect against. There is thus a positive link between landholding
inequality and isolated land invasions. But land reform allocation in Brazil is largely a demand-
driven process. Land reform grants, which settle hundreds of landless families typically on either
2

public lands or on private lands that the government expropriates from underproductive landowners,
result from land invasions and therefore incentivize them.3 There are therefore substantial spillover
effects whereby successful land reforms in a region lead to further land invasions in neighboring
areas. These broader threats are more easily perceived and defended against. When the impulse
among landowners to organize to repel invasions is triggered by nearby reforms that threaten
to spill over into land invasions on their property, we therefore anticipate that the hypothesized
link between land inequality and higher conflict will flip: large landowners in highly unequal
municipalities will coordinate to fight off an imminent threat of land invasions. Common tactics
to repel invasions include organized violence and intimidation (Bruno, 2003), leveraging influence
with the police or judiciary to break up squatter settlements and make land invasions more costly
and difficult, and campaigns of disinformation about the effects of land reform (Costa, 2012).4
Additional empirical tests enable us to demonstrate that these findings are causal. We
address concerns about endogeneity between land invasions and reforms by identifying a selected
set of state-level public lands reforms that do not spur further land invasions across state borders,
and hence elicit no organizational response from neighboring landowners over the border. Concerns
about endogeneity between land inequality and land invasions are addressed by focusing on
municipalities where landholding inequality effectively does not change throughout the period.
We also provide two pieces of evidence to demonstrate that landowner organization is the
key mechanism repelling land invasions when regional reforms threaten to spill over. We first
test an alternative measure of landowner organization: the selective deployment of violence (often
via militias) against squatters and peasant activists. This measure behaves in a similar manner
to landholding inequality in stemming spillover land invasion threats from neighboring reforms.
Next, we demonstrate that when landowners in municipalities under threat of land invasion have
generated political ties to members of the congressional bloc representing rural interests (the
bancada ruralista), a powerful sign of dense landowner business and kinship networks (Costa,
2012), they are systematically more likely to elide land invasions.
Though this paper focuses empirically on Brazil – itself an important case – it also has
3The government does not always settle land invaders through its land reforms on the same property wherethey are squatting.
4In an egregious recent case, the son of Senator Ivo Cassol used a helicopter of the state government toshoot at a settlement of 200 families squatting on land near his property in Alta Floresta (Costa, 2012).
3

implications for the developing world more broadly. Land reform has affected at least 1.5 billion
people since 1945 in countries spanning every region of the world (Lipton, 2009, p. 1), and
continues to advance in Colombia, India, the Philippines, South Africa, Venezuela, and numerous
other countries in sub-Saharan Africa, Southeast Asia, and Latin America. Table 1 displays
the subset of these countries that have ongoing land reform programs, are characterized by
highly skewed distributions of land ownership, and are plagued by rural unrest in forms such
as organized land invasions, land squatting, protests, and rural assassinations. Together these
countries comprise over a quarter of the world’s population. Their rural populations are also
substantial. Yet despite the ongoing global prevalence of land inequality, rural unrest, and land
reform indicated in Table 1, there is relatively little scholarship analyzing how these phenomena
are interconnected from a political perspective. This paper aims to take a step to fill this gap.
Landholding Inequality, Land Reform, and Rural Conflict
The literature on landholding inequality, land reform, and rural unrest has offered important
insights into a host of forms of conflict and rebellion, the dynamics of distribution in the country-
side, and the role of powerful landowners in rural life. Yet it has long faced a series of obstacles
that has made empirically establishing a relationship between inequality and conflict surprisingly
difficult. Cramer (2003), for instance, notes that causal mechanisms are underspecified, the type
of inequality examined is not always tightly coupled theoretically to the type of conflict measured,
and that cross-national measures of land inequality have poor coverage.
Our theoretical argument and empirical strategy address each of these issues. Rather
than assuming that land inequality is just a proxy for grievances and hence a potential breeding
ground for political conflict, we theoretically develop the idea that high land inequality also
impacts the ability of landowners to organize. We are consequently able to predict under which
conditions high land inequality is likely to lead to land invasions. Furthermore, we generate
several additional, more direct measures of landowner organization and verify that these measures
behave in a similar fashion to landholding inequality.
We also tackle key empirical issues that have hampered the literature on land inequality and
unrest. Instead of trying to measure and explain heterogeneous forms of rural unrest (e.g., rebellion,
squatting, land invasions) simultaneously, which raises reliability and validity concerns (Brockett,
4

1992), this paper instead focuses on one specific type of rural unrest: organized land invasions. This
enables us to obtain a measure of unrest that is consistent across space and time. Our theoretical
argument regarding rural unrest calls for an empirical focus on inequality in the ownership of land
rather than income or wealth inequality. Cross-national data on land inequality are often based on
a mix of individual and household level surveys of income or ownership, differ in definitions and
quality, suffer high missingness, and consequently are difficult to compare across time and space
(Cowell, 2011; Deininger and Squire, 1996). We instead rely on high-quality subnational census-
based calculations of landholding inequality. Our data are also not subject to the nonrandom
missingness problem that plagues cross-national land inequality data. The substantial heterogeneity
of Brazilian municipalities with respect to land inequality and land invasions suggests that much
can be learned from a subnational approach. The remainder of this section builds from these
contributions in developing our theoretical argument and a series of empirically testable hypotheses.
Popular pressure for land redistribution has increased in Brazil since democratization,
particularly from Brazil’s Landless Rural Workers’ Movement, or MST. Land redistribution has
dramatically increased in response, notwithstanding large landowners’ successful attempts to win
important safeguards via constitutional provisions that bar the expropriation of productively used
land and mandate market-value compensation for seized property. There is an active land reform
program that has settled almost one million families on 77 million hectares from 1988–2013.
This program routinely targets the property of large landowners for land reform when local
land invasions – organized occupations of landed estates – pinpoint these properties.5 Since land
invasions are often directed at large properties that are perceived as “unproductive” per the
region-specific definitions of productive under the federal land reform law, municipalities with
high landholding inequality are especially susceptible to such conflict. Nonetheless, many of the
municipalities with the most unequal distributions of land rarely or never witness land invasions
or land reforms. Under what conditions, then, does existing landholding inequality translate into
land-based conflicts? How do landed elites prevent the local implementation of the land reform
law in spite of the legal machinery and public demand to redistribute land? And how has this
localized resistance contributed to the apparent failure to reduce rural inequality?
5For a simple formal model of land invasions wherein squatters and landowners contest land, and whichfurther elucidates the costs and benefits from invading or defending land, see Alston, Libecap, et al. (2000).
5

Land reform allocation in Brazil, as in many other countries, is largely a demand-driven
process. Though the government attempts to settle landless families on mostly remote public
lands, much more frequently it simply reacts and responds to land invasions on private land in
more desirable areas with expropriation and subsequent land reform grants. This framework
protects large landowners from broad, top-down land redistribution as occurred in countries such
as Japan, Peru, and Taiwan (Albertus, 2015). Nonetheless, it simultaneously creates incentives
for land invasions and other forms of rural conflict (Alston, Libecap, et al., 2000).
That the program encourages conflict parallels the outcomes of several other prominent
land reforms. In Colombia, for instance, land titling in conflictive rural areas led to spillover
effects in which nearby communities recognized the need to support rebel groups in order to
garner the attention of Colombia’s land reform agency (Albertus and Kaplan, 2013). Similarly
in Russia following the emancipation of serfs in 1861, land-based rural rebellion actually increased
as landlords hijacked the reform implementation process to win favorable land allotments (Finkel,
Gehlbach, and Olsen, 2015). And in southern Italy, tepid initial agrarian reforms just after WWII
led to an outpouring of land invasions in 1949 that was only addressed by major land redistribution
beginning in 1950 (King, 1973). Building on these other important contributions, we empirically
characterize the scale and scope of the spillover effects of reform on unrest. Furthermore, we
identify when and why these spillovers can be cauterized locally.
Rather than engaging in costly lobbying for one-off exemptions that may be a lightning
rod for public opposition, the nature of the threat of land-based conflict and land redistribution
requires local, extra-institutional organization by elites attempting to avoid losing their property.
Land invasions are generally well-planned occupations of large and frequently underproductive
estates by land-poor rural workers (Hidalgo et al., 2010). These often sudden invasions therefore
do not typically occur in areas where land inequality is low and relatively egalitarian smallholding
prevails. Instead, they target more unequal municipalities given the supply of land for potential
reform, and they are hard for large landowners to predict and avoid when they have little hint
that one is coming – typically due to a lack of land reform and land invasion activity in their area.
But because land grants come in response to invasions and therefore encourage this tactic,
there should be spillover effects such that successful land reforms in a particular area induce
additional land invasions in neighboring areas. Take the early MST land invasions in the state of
6

Santa Catarina. A small group of laborers occupied an estate in the municipality of Campo Ere
called Burro Branco after they “had discovered that INCRA was going to expropriate a farm in the
area, and they hoped to force their own settlement by occupying that area” (Wolford, 2010, p. 51).
Later that year INCRA expropriated the property and handed it over to squatters. This was an
important turning point in the rise of the MST and subsequent land invasions in Santa Catarina:
INCRA’s forced attention to the area led others to learn that their struggles could be victorious.
A similar scenario played out in Pernambuco’s southern Zona de Mata during the sugarcane
crisis in the 1990s. In 1992, the Camacari sugarcane plantation in the municipality of Rio Formoso
was successfully occupied (Sigaud, 2015, p. 188). INCRA’s activities radically changed the region’s
dynamics: “INCRA’s first land expropriations in the vicinity, in 1993, strengthened people’s faith
in the prospects of a positive outcome.” Land invasions then spread to neighboring municipalities
such as Tamandare and Barreiros with similar sugarcane plantations, as well as to neighboring
plantations within Rio Formoso (Sigaud, 2015). Importantly, “the land occupations organized
in the Zona de Mata region were not preceded by any local land conflicts that could have served
as an example for these mobilizations” (Sigaud, 2015, p. 193). Ondetti (2011, p. 142) makes the
point more broadly that “political opportunity” provides the best explanation for the expansion
of land invasions in the mid-late 1990s in Brazil: “the acceleration of land distribution ... had
the effect of stimulating mobilization and protest for land.”
These spillover threats stemming from neighboring land reforms act as a “shot across the bow”
of the landed elite, particularly within local neighborhoods where shared land tenure and similar
economic conditions (e.g., rural labor and crop markets) enable landowners to reasonably fear that
unrest could spread to their locale. Such spillover effects of reform are more readily repelled where
local landed elites are stronger and can organize to resist invasions – a circumstance found most com-
monly in more unequal municipalities. Large landowners in these unequal municipalities, typically
connected by dense networks and relationships (Brown, Brown, and Donaghy, 2011; Costa, 2012),
can coordinate reflexively against evident broad spillover threats from neighboring municipalities.
Take for example the municipality of Sertao in Rio Grande do Sul. In the aftermath of
democratization, a small number of landowners with sprawling properties organized under the
Pacto de Uniao e Resposta Rural (PURR) to repel land invaders and protect their property
(Bruno, 2003). As a wave of neighboring land reforms in the late 1990s and mid-2000s threatened
7

to catalyze nearby land invasions, these landowners successfully repelled local invasions to their
property via the PURR. Similarly, the municipality of Bela Vista do Maranhao, located in a
region of sustained land conflict, has not itself experienced any land invasions or reforms. Despite
fertile conditions for rural conflict, including very high land inequality (the land Gini was 0.91 in
2000), poverty (ranked in the bottom five percent in human development in Brazil), the abuse of
rural labor in slavery-like conditions (CPT, 2014), and several hundred land invasions in nearby
municipalities, landowners have successfully resisted invasions and calls for land redistribution.
There are thus two main features of the link between inequality and unrest that we examine.
The first is what causes land invaders to target specific areas, which when successful may yield
land redistribution. This is perhaps most easily understood by considering how land inequality
initially attracts land invasions in areas where the land reform program is not already active.
The second feature we examine is what mitigates whether land reform results in further land
invasions in neighboring areas. Here the organizational capacity of landowners is key in catalyzing
collective defense to spillovers, and such capacity is strongly linked to landholding inequality.
This discussion implies that land invasions tend to start first in places with higher inequality,
and in circumstances in which they spread to neighboring areas due to land reform, do so most
frequently in municipalities with only middling levels of inequality. These latter municipalities are
places where there is a sufficient supply of large landholdings to invade, and where landowners
are less effective at coordinating quickly and reflexively to defend their property collectively. This
leads to the following set of hypotheses:
Hypothesis 1. Land invasions are more likely in municipalities with higher landholding inequality.
Hypothesis 2. Land reforms in the region surrounding a municipality are likely to spur invasionsin that municipality. This effect should be reversed in municipalities with high landholding inequalitywhere elites have the capacity to organize in order to repel neighboring threats.
Identifying the causal direction of the relationship between land invasions and land reforms
presents an empirical challenge. To determine the effect of land reforms on subsequent land
invasions, we leverage the fact that there is consequential variation in the source of land obtained
for the purposes of land reforms. The two key methods of land obtainment (obtencao) are what we
term public land recognitions (in INCRA’s terms, reconhecimentos) and expropriations of privately
owned land (principally desapropriacaos). Privately owned land is almost always obtained by
8

INCRA at the federal level, whereas public lands for reform are overwhelmingly derived from
states.6 Critically, however states differ in their ability to use public lands to satisfy demands
for land redistribution for historical reasons. This ability to draw on public land for redistributive
purposes is rooted in the 1850 Land Law, the enforcement of which was delegated to the states
with the foundation of the republic in 1889. Depending on the demands and influence of the local
agricultural elite, the Land Law was legislated and enforced very differently across states, which in
turn left some of today’s state administrations with substantial stocks of public land to be used for
redistribution and others with dysfunctional land cadasters without clear identification of which
lands the state owns and which are privately held, throwing up costly legal roadblocks to distributing
ostensibly public lands (see Meszaros, 2013, Silva, 1996 and the discussion in the section below).
Variation in states’ ability to distribute public lands yields differential diffusion patterns
for different types of land reforms. Land grants based on publicly owned lands, usually executed
directly by state governments, may spur additional invasions in the same state but are unlikely
to affect neighboring municipalities across state borders where the process for public land grants
is run independently. We should observe no such spillovers across state borders because land
invaders learn little about their state authorities’ political willingness or ability to recognize
public land claims from a neighboring state’s proclivity to use public land for reforms. Given the
uncertain nature of some of the state land cadasters and the tedious and costly judicial process
to resolve historical land title disputes, in some states there is simply little room for the state
government to distribute public land. By contrast, land reform projects based on expropriated
private land, which are overwhelmingly implemented by the federal land agency INCRA, should
exhibit no such discontinuous border effects. Land invaders can reasonably expect to have a
higher chance of such grants of private land, even if located in a different state.
This discussion yields several predictions. If public lands are employed to meet specific
6Once land is obtained for the purposes of land reform, settlement projects can be administered in variousways. A variety of state, federal, and in select cases municipal agencies can be involved and even collaborate,as in the case of INCRA and ITESP in Sao Paulo. In general, however, the governmental level of the agencymanaging a specific land settlement project tends to map closely onto the origins of the land (see the Appendixfor a discussion and statistics on project administration). However, a key distinction remains the source of theland rather than the management of a project: because different levels of government have access to differenttools when it comes to obtaining land for the purposes of transferring it to squatters, would-be land invaderscare most about the likelihood that squatting will yield benefits in the form of access to land.
9

demands for land reform, we would only expect subsequent land invasions in neighboring mu-
nicipalities within the same state. By contrast, the use of expropriated private lands for reform
purposes should have spillover effects in the geographical neighborhood whether within or across
state borders.
To test our claim that land reforms spur additional subsequent land invasions, we formulate
the following hypotheses:
Hypothesis 3a. Land reforms based on expropriated private land increase the likelihood of landinvasions in neighboring municipalities.
Hypothesis 3b. Recognitions of public land claims increase the likelihood of land invasions inneighboring municipalities only within the same state but not across state borders.
Our hypotheses are depicted graphically in a diagram of the timing of land reforms and sub-
sequent land invasion spillovers in Figure 2. Consider the land reform that occurs via the expropri-
ation of private land in time t=1 in the unequal municipality at the bottom of the figure. The land
reform causes land invasion spillovers in nearby municipalities with middling levels of land inequal-
ity, regardless of any state or other administrative boundaries. In nearby municipalities with highly
unequal landholdings, elites organize to repel spillovers. In nearby municipalities with very equal
landholdings, there is little land available for reform and therefore little incentive for land invasions.
Next consider the land reform that occurs via a public land recognition in time t=1 in
the unequal municipality at the top of the figure. In this case, State A opens up public lands
in the municipality for land invaders to settle on. As with the land reform on expropriated
private land in Figure 2, this public land recognition then causes land invasion spillovers in nearby
municipalities in State A with middling levels of land inequality. However, and in contrast to the
land reform based on the expropriation of private land, this public land reform does not cause
invasion spillovers in nearby municipalities in State B that have middling levels of inequality.
Critically, if land reforms based on expropriations of private land and recognitions of public
land claims do indeed spill over differently to neighboring municipalities, we should also expect
a different response by private landowners. From the perspective of a landowner worried about
potential land invasions on their property, expropriations in the surrounding region are a threat to
their own landholdings via spillovers whereas recognitions across state borders are not. Hypothesis
2 can therefore be refined to examine whether local landowners have the capacity, as proxied by the
10
landholding Gini, to respond to the threat of land invasions spurred by “relevant” land reforms with
the potential to spill over: in-state recognitions of public land claims and private land expropriations.
To more directly test whether landowner organization is the mechanism repelling spillover
threats of land invasions, we also turn to additional alternative measures of landowner organization.
As with the landholding Gini, one of these measures – the perpetration of violence – takes higher
values in areas where both landowners have a capacity to organize and, by contrast, land invaders
find attractive tracts of land to invade. This measure should therefore behave in a similar way to
landholding inequality. In particular, while large landowners cannot always prevent isolated land
invasions, they should effectively forestall local land invasions when they are catalyzed to organize
by neighboring land reforms. We test the selective deployment of violence (mainly through
militias) against land squatters and peasant activists as a measure of landowner organization.
Tests of the previous hypotheses using this measure in place of the landholding Gini allow us
to provide further evidence that the landholding Gini in part captures landowner organization.
The landholding Gini and the deployment of violence tap the capacity of landowners to
organize reflexively to repel land invasions in the face of spillover threats. Yet they are also “contam-
inated” by information about the attractiveness of land to potential land invaders; these measures
are therefore hypothesized to be linked to isolated land invasions. Theoretically, a “purer” measure
of landowner organization or a measure that captures ex ante organization that serves as a deterrent
threat should be able to forestall even isolated land invasions. Political connections via represen-
tation in the national parliament meet both of these requirements. Political connections should
therefore make it less likely that there are land invasions in a municipality and should also cauterize
spillover effects induced by neighboring expropriations. We test this implication systematically later
in the paper to further tap whether landowner organization serves to undermine land invasions.
Land and Land Reform in the Brazilian Context
Rural poverty, a highly unequal distribution of land, and informal land ownership have been
salient issues in Brazil and Latin America more broadly since the creation of massive estates and
trusts during colonization. From the time of Brazil’s independence (1822) until 1850, there was no
land law regulating land access and use. This encouraged widespread squatting and land claiming
in frontier areas by large landowners who sought to expand their holdings (Alston, Harris, and
11

Mueller, 2012). In 1850, a major land law (Lei de Terras) was passed that gave de jure status to
existing de facto holdings, legitimized pre-independence imperial land grants, and mandated that
future land had to be acquired through purchase rather than squatting and enclosing. This law
was effectively an effort by the agricultural elite to preserve the initial unequal distribution of land
and prevent further land squatting and land grabbing by arriving immigrants, and was deliberately
designed to keep large landowners in a position to have continued access to the cheap labor of
landless people once slavery was abolished (Fernandes, Welch, and Goncalves, 2012; Meszaros,
2013; Silva, 1996). With the law, tracts of land that did not yet belong to private parties legally
became public or vacant land, known as devolved lands (terras devolutas) (Meszaros, 2013, p. 14).
When Brazil became a republic in 1889, land policy was decentralized to the newly created
states, responding to the demands of regional oligarchies to manage their own affairs. With the ex-
ception of lands of strategic importance, the federal government gave dominion over devolved public
lands to the states, which were controlled by an agricultural elite that had no interest in enabling
smallholders to succeed as independent cultivators (Silva, 1996, p. 249). Most states adopted
legislation into their constitutions that mirrored the 1850 Land Law, legally prohibiting squatting
of now public lands owned by the states but in practice enabling large landowners to enclose more
frontier lands (Silva, 1996). While a complete enforcement of the Land Law – including the official
registration of all private properties – was thus not in the interest of the regional agricultural
oligarchies, the law nonetheless became constitutionally enshrined in almost all state constitutions
from 1890 to 1891 (Silva, 1996, p. 250). The 1850 Land Law single-handedly transformed large de
facto land enclosures into legitimate landholdings, while at the same time blocking land access to
arriving immigrants and to slaves freed in 1888. Since state governors ultimately judged the legiti-
macy of land claims, the close relationship between the agricultural elite and political power-holders
– a system known as coronelismo – allowed the selective enforcement of the law against landless
invaders while simultaneously turning a blind eye to the enclosure of devolved, public land by con-
nected elites. Corrupt state officials, fake land titles, and inaccurate and incomplete land registries
allowed large landowners to illegally occupy substantial parts of the legally declared public devolved
lands belonging to the states. As Alston, Harris, et al. (2012, p. 763) write, “Local oligarchies
dominated access to land and power in their regions, usually through the figure of the all-powerful
coronel who presided with feudal-like rights and reigned through a mixture of paternalism and
12

violence, strengthened by his association to central state politicians to whom he could deliver votes.”
Importantly for the empirical analysis below, these differential state-level laws and subsequent
developments endowed some but not all states with large stocks of public lands (Silva, 1996).
Colonization programs on public lands were the principle axis of land policies in the 1950s.
In the late 1950s, the Peasant Leagues movement arose among poor tenant farmers in the
sugarcane region of Pernambuco and subsequently spread to other states. Another movement
arose in Rio Grande do Sul. These groups called for “radical” agrarian reform and threatened
violence if reform was not implemented (Ondetti, 2011, p. 11). Joao Goulart, a left-leaning
populist, was elected president in 1961. His agenda incorporated agrarian reform but shifted
the debate from colonization toward redistribution. Goulart’s reform proposals were stymied
by powerful landowners in Congress and he was overthrown in a military coup in 1964.
Land reform in Brazil began under military rule with the Land Statute and the creation
of the Brazilian Institute for Agrarian Reform (IBRA) and the National Institute for Agricultural
Development (INDA) in 1964 after Goulart was ousted. IBRA and INDA were intended to
undercut pressure for land redistribution levied by social movements such as peasant leagues
(Assuncao, 2006). In 1971, IBRA and INDA were merged into the National Institute for Rural
Settlement and Agrarian Reform (INCRA). INCRA is now a federal agency subordinated to
the Agrarian Development Ministry, which itself is subordinate to the executive. The Minister
of Agrarian Development appoints the head of INCRA.
Social protest reemerged in the late 1970s and early 1980s. The MST began at this time as
small groups of farmers in Brazil’s south occupied unproductive lands (Brown et al., 2011). The
group pledged to reduce inequality through the transfer of land to peasants in rural areas at its first
national conference in 1984. The military stepped down from power in 1985. The MST burgeoned
in subsequent years and has now spread across the country, becoming the most sophisticated
rural social movement with strong internal discipline and local chapters throughout Brazil.
Under popular pressure from social movements and against a backdrop of rural violence,
President Sarney made agrarian reform a priority at the outset of his administration in 1985.
Agrarian reform was nonetheless stifled during his term as landowners pressured for a focus
on incorporating public rather than private land into the reform sector, and an increase in
compensation. Landowners were simultaneously organizing to defeat land reform proposals in the
13

Constituent Assembly. Landholding interests within the National Confederation of Agriculture,
the state Federations of Agriculture, and the Brazilian Rural Society joined in 1986 to form the
Union of Rural Democracy (UDR) in the Constituent Assembly (Payne, 1992, p. 15). Cattle
ranchers in plains states were foundational to the UDR; they perceived themselves as particularly
vulnerable to land reform given greater difficulty in demonstrating that their land was being used
productively. The UDR successfully pushed for a provision in the 1988 Constitution that protects
productive private property from expropriation. The 1988 Constitution set the stage for the
structural incentives for land invasions and the processes of land reform that have persisted largely
unchanged until the present. Large landowners, some with links to the UDR, contemporaneously
unleashed a campaign of violence in the countryside, coordinating at a local level to create militias
and defend their farms from land invasions (Bruno, 2003).
Collor (1990-1992) continued policies that benefited large landowners. Notwithstanding
reformist campaign promises, he appointed a wealthy cattle rancher and member of the UDR
as his Minister of Agriculture. Little land was expropriated during his tenure. However, Collor
presided over the beginning of what would become a crisis decade for the sugarcane sector,
especially in the northeastern sugar zone. Plummeting international sugar prices and slashed
subsidies upended sugar production and employment in the region. This ultimately generated
an explosion of land invasions that the government would later react to with land reform.
Land reform resumed with Collor’s impeachment. A February 1993 amendment to the
Constitution stipulated that the government pay “market price” for land it expropriates. Reform
accelerated under Cardoso along with land conflicts and land invasions, primarily associated
with the MST. The northeast sugar zone remained a hotspot, especially as the MST sought
to use the crisis to transform itself from a regional to national movement. Between 1995 and
2002, Cardoso redistributed 21 million hectares of land through 4,300 land reform settlements, of
which 16 million hectares were expropriated. From 2003 to 2010, President Lula da Silva assigned
43.5 million hectares of land through INCRA for the purposes of land reform (INCRA, 2011).
The Workers’ Party presidents since 2003 have relied mostly on public land for settlement. Land
invasions and land reform nonetheless declined substantially in the late 2000s.
Land reform in Brazil since its democratic transition has been largely reactive. As (Carter,
2010, p. 19) summarizes, “[Land reform] has strived mainly to appease rural conflicts, rather than
14

promote family farming through proactive measures aimed at transforming the rural structure and
its power relations ... [A]ll governments have engaged in an ad hoc distribution process.” Yet while
landowners have avoided top-down large-scale redistribution, they have not halted a burgeoning
land reform program that incentivizes land invasions that target large landowners. Landowners
essentially uniformly seek to avoid the disruption, legal battles, and expropriation that may result
from invasions of their property. Consequently, large landowners seek to organize and coordinate
to repel imminent threats of land invasions and subsequent expropriation by INCRA.
Research Design and Data
The analysis examines the determinants of threats to landed elite interests in the form of
land invasions. It also provides evidence that elite organization amidst threats reduces spillovers of
neighboring reforms into additional land invasions. Our unit of analysis throughout the empirical
investigation is the municipality-year. Circa the year 2000, roughly in the middle of our sample,
the median municipality had 10,418 inhabitants (approximately 2,800 families given average family
size), with 40.7% of the population living in rural areas. Median farm count was 662 farms, with
just 8 properties larger than 500 hectares; median municipal land area is 417 square kilometers.
In short, these are quite small jurisdictions on average that enable us to pinpoint land reforms and
land invasions with precision. Importantly, municipalities do not have any legal authority over
land reform allocation. Municipalities are merely recipients of reforms or invasions, and landowners
are forced to do what they can locally in terms of organization in order to repel land invasions.
Dependent Variable: Land Invasions. The dependent variable is land invasions. We
identify distinct land invasions that occurred in each municipality-year in Brazil from 1988–2013.
The main measure is a count of the number of land invasions in each municipality-year. For
robustness checks we also use an indicator for whether any land invasion took place in a given
municipality-year, and a count for the number of families that took part in the invasions.7 Data
on land invasions are taken from Dataluta (Girardi, 2014), a database on land conflicts hosted
by Sao Paulo State University that is widely viewed as the most comprehensive and authoritative
source of data on land invasions. The bulk of the information on land invasions in Dataluta comes
from the Comissao Pastoral da Terra (CPT), an NGO with ties to the National Conference
7The results are similar throughout if land invasions are scaled by municipal population size.
15

of Bishops of Brazil, which collects data on land invasions from primary sources such as social
movements, trade unions, political parties, government agencies, and churches. It also gathers
data from local, state and national newspapers, and police records.
Dataluta records 9,425 land invasions from 1988–2013. Almost 1.25 million families
(constituting several million individuals) participated in land invasions during the period. Spatially,
land invasions have occurred principally at the fringes of Brazil’s continuing urban expansion, with
many land invasions in the states of Minas Gerais, Sao Paulo, and Rio Grande do Sul (see Figure 1a).
Key Independent Variables. The first key independent variable is land reform. INCRA
reports detailed data on the location, size, and type of all land reforms conducted regardless
of the source of land (e.g., expropriation of private land versus public land recognitions) and
the agencies involved in administering settlement projects. INCRA also reports the number of
beneficiaries settled through a particular land grant.
The majority of land acquisitions for distribution through INCRA’s land reform program
originate from the expropriation of private property. Under Brazil’s 1988 Constitution, only unpro-
ductive land is subject to expropriation. Of the 8,918 reform projects from 1988–2013, a total of
6,351 settlements (71%) were created on expropriated private land. The remainder of the land came
from the recognition of settlements on public lands (19%), negotiated purchases from the private
sector (7%), and transfers from other state agencies (4%).8 Examples of states heavily involved in
public land recognitions include Maranhao, Mato Grosso, Piauı, Rio Grande do Sul, and Sao Paulo.
Spatially, land reforms match the distribution of land invasions fairly well (see Figure 1b).
Nonetheless, there are also substantial spatial differences between these variables. Land invasions
have significantly outpaced land reform efforts in areas with the greatest pressures to reform, such as
the states of Minas Gerais, Rio Grande do Sul, and Sao Paulo. In the Amazonian states of Brazil’s
Northwest, large tracts of land have been offered for settlement despite the fact that there is much
less demand for land. These patterns are reflective of the fact that the government responds not
only to the land invaders themselves but also to public opinion and the media, which focus more on
the gross numbers than on who exactly gets settled and where. Consequently, a disproportionate
number of settlements are located in frontier areas at the fringes of regions where land invasions
8For a full description of the types of land reforms see the appendix.
16

are active. These are often areas where land is cheap and landowners tend to be politically weaker.
Land reform grants in Brazil are commonly made following an earlier land invasion. Similarly,
existing land reform projects are likely to affect the calculations of landless agrarian workers and
increase the risk of land invasions nearby. We contend that particular types of reforms will affect
private landowners differently, which enables us to identify the causal direction of the relationship
land invasions and land reforms. Reform projects based on public land recognitions in neighboring
municipalities across state borders should pose little threat to landowners and consequently elicit
no organizational response. By contrast, expropriation-based reforms in the region increase the
threat of additional land invasion spillovers regardless of state or other borders.
To test our claim, we calculate the number of these different types of reforms (expropriations
versus public recognitions) in a 100km radial region around a municipality, separately for in-state
and out-of-state neighbors. Information is more likely to diffuse via personal connections, regional
news, radio, and social movements within local neighborhoods. Furthermore, the shared climates,
crop types, and land tenure allow would-be invaders to reasonably infer that an invasion in their
locale might be treated by INCRA in a similar fashion to a nearby invasion. The results, however,
are not sensitive to this specific threshold choice of 100km. Because closer reforms may have
greater spillover effects, we weight neighboring reforms by their linear distance to the centroid
of the municipality in question, with reforms that are 100km away in distance weighted one-half
compared to immediately adjacent reforms.
The second main independent variable is land inequality. We use land inequality as an indi-
cator of the capacity of landholding elites to organize, though as discussed above, it also contains
information on the availability of land for potential grants to land invaders. Importantly, our mea-
sure taps landholding inequality and does not include the landless, which renders it a more accurate
measure of inequality among landowners and thus better taps coordination capacity while still
capturing the attractiveness of an area for possible land invasions. In highly unequal municipalities,
in which landowners are stronger and better organized, we expect landowners to organize against
looming threats and be better able to repel potential land invasions. Landowners may find it
harder to organize in more equal municipalities and thus more often will succumb to land invasions.
Land inequality is taken from the detailed agricultural censuses of 1995 and 2006 by the
17

Brazilian Institute of Geography and Statistics (IBGE) and measured using a Gini coefficient.9
Missing years of data during the period are interpolated. After 25 years of democratic rule,
landholding inequality in Brazil remains stubbornly high. Even in many areas where land reform
has already taken place, average landholding inequality has often barely changed. This is most
typically because the reform sector is small relative to the non-reform sector (the median land
reform affects only about 1% of a municipality’s land). Furthermore, substantial reforms are
at times offset by the growth of large agribusiness farming sugarcane or soybeans. As emphasized
by Hidalgo et al. (2010), the relative stasis of land inequality eliminates concerns of endogeneity
running between land inequality and land invasions – a point we return to in the analyses below.
Additional measures of landowner organization are discussed below as they arise.
Controls. The models include a series of other time-varying determinants of land invasions
whose omission may confound the results. The percentage of the rural population, taken from
IBGE, is measured as the percentage of a municipality’s population that is rural. We expect
the effect of this variable to be negative given that most land invasions occur not in remote,
rural areas but instead in peripheral zones of urban and semi-urban areas (Brown et al., 2011).
Income per capita, measured in thousands of constant log 2000 Reais and taken from IBGE,
is an indicator for local development and may capture the capacity to implement local reform or
the attractiveness of a land settlement with access to infrastructure and markets. We also include
a variable for agricultural production in millions of constant log 2000 Reais from IBGE. We scale
this variable by the cultivated land area in a municipality to capture productivity. Agricultural
productivity may affect invasions or reform since it proxies for a supply of underproductive land
for possible reform, as well as land productivity that makes property more attractive for squatters.
We also test the robustness of the results to including measures of cumulative reforms in
a municipality as well as a spatial lag of land invasions. We discuss these variables as they arise.
Summary statistics of the variables are found in the Appendix in Table A1.10
9Although insufficient data are available to create an alternative high-fidelity polarization measure of inequality,we did test a proxy using the number of small farms relative to large farms. The main results for Gini hold.See Appendix Table A7.
10A variable for change in log income per capita, to capture the possibility that negative economic shocksspur invasions (Hidalgo et al., 2010), did not impact the main results and was not robustly tied to invasions.
18
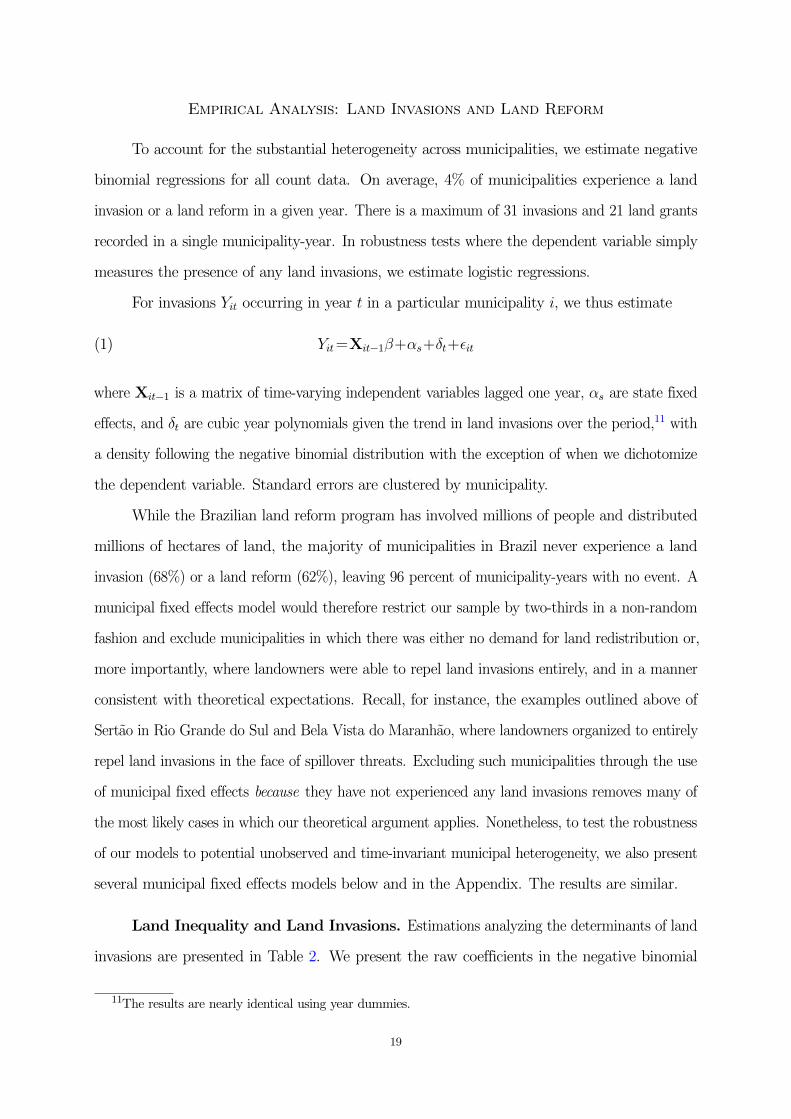
Empirical Analysis: Land Invasions and Land Reform
To account for the substantial heterogeneity across municipalities, we estimate negative
binomial regressions for all count data. On average, 4% of municipalities experience a land
invasion or a land reform in a given year. There is a maximum of 31 invasions and 21 land grants
recorded in a single municipality-year. In robustness tests where the dependent variable simply
measures the presence of any land invasions, we estimate logistic regressions.
For invasions Yit occurring in year t in a particular municipality i, we thus estimate
(1) Yit=Xit−1β+αs+δt+�it
where Xit−1 is a matrix of time-varying independent variables lagged one year, αs are state fixed
effects, and δt are cubic year polynomials given the trend in land invasions over the period,11 with
a density following the negative binomial distribution with the exception of when we dichotomize
the dependent variable. Standard errors are clustered by municipality.
While the Brazilian land reform program has involved millions of people and distributed
millions of hectares of land, the majority of municipalities in Brazil never experience a land
invasion (68%) or a land reform (62%), leaving 96 percent of municipality-years with no event. A
municipal fixed effects model would therefore restrict our sample by two-thirds in a non-random
fashion and exclude municipalities in which there was either no demand for land redistribution or,
more importantly, where landowners were able to repel land invasions entirely, and in a manner
consistent with theoretical expectations. Recall, for instance, the examples outlined above of
Sertao in Rio Grande do Sul and Bela Vista do Maranhao, where landowners organized to entirely
repel land invasions in the face of spillover threats. Excluding such municipalities through the use
of municipal fixed effects because they have not experienced any land invasions removes many of
the most likely cases in which our theoretical argument applies. Nonetheless, to test the robustness
of our models to potential unobserved and time-invariant municipal heterogeneity, we also present
several municipal fixed effects models below and in the Appendix. The results are similar.
Land Inequality and Land Invasions. Estimations analyzing the determinants of land
invasions are presented in Table 2. We present the raw coefficients in the negative binomial
11The results are nearly identical using year dummies.
19

models. Model 1 indicates that on average, municipalities with high landholding inequality are
substantially more likely to be targeted for land invasions, providing support for hypothesis 1.
The negative coefficient on the percentage of the population that is rural indicates that it is not
the municipalities with large empty tracts of land as in the Amazonian region in the Northwest
of Brazil that experience most invasions. Instead, it is on the fringes of smaller urban areas where
the interests of poor, landless families and rich, rural landowners collide.
Providing landless families with land grants through land reform projects is ostensibly polit-
ically oriented toward providing a pressure valve for landed conflict. However, in a demand-driven
land reform process such as Brazil’s, land invasions commonly respond to land grants, raising
the expectations that direct action will yield benefits. Past land reforms in neighboring areas
consequently often encourage further invasions. Model 2 tests this proposition by including a
variable for the number of neighboring land reforms (within 100km) in the previous year. As
expected, this variable is strongly positively linked to land invasions in the present. Invasions
in Model 2 are also more likely in municipalities with higher agricultural productivity, reflecting
the fact that land in these municipalities is in greater demand, and that invasions are infrequent
in far-flung frontier regions where production is lower.
Model 3 includes an interaction term between land inequality and neighboring reforms,
now enabling a direct test of both Hypotheses 1 and 2 simultaneously. Land inequality should
be associated with more land invasions absent neighboring reforms given the attractiveness of
land to potential land invaders alongside the steep barriers to effective coordination among
large landowners when it comes to predicting and forestalling isolated invasions. The positive
coefficient on the lower order term for land inequality supports Hypothesis 1 in this fashion.
Hypothesis 2 anticipates that well-organized landowners in highly unequal places should be most
able to coordinate to repel imminent neighboring “spillover” demands for land. As expected,
the interaction term is negative and highly statistically significant.
Figure 3 displays two graphs of the marginal effects of neighboring reforms on land invasions
across the observed range of landholding inequality. Figure 3a displays the marginal effects for
municipalities without neighboring land reforms in the previous period. Figure 3b displays the
marginal effects for municipalities with substantial ongoing land reform activities in the surrounding
20

region. For ease of interpretation, these figures use the Model 4 estimates, where the dependent vari-
able is an indicator for whether any land invasion occurred in a given year. Figure 3a demonstrates
that the marginal effect of moving from no neighboring reforms to a small number of neighboring
reforms on the probability of observing a land invasion is positive and increasing across much of the
range of landholding inequality. However, Figure 3a also shows that the spillover effects are smaller
at very high levels of landholding inequality. This implies that when land invasions spread due to
land reform, they do so most frequently in municipalities with only middling levels of inequality.
Theoretically, we expect landowners to organize more effectively once the threat of spillovers
from neighboring reforms is more visible and sustained. Figure 3b therefore displays the marginal
effect of additional neighboring reforms on the probability of observing a land invasion for
municipalities that are already surrounded by many neighboring reforms. These are places
in which landowners, faced with severe threats of spillover land invasions from neighboring
municipalities, should be most likely to organize quickly to repel spillovers. As anticipated, this
figure illustrates that the marginal effect declines across the range of landholding inequality,
indicating that spillover effects become weaker for every incremental change in landholding
inequality once the threat level from neighboring reforms is sufficiently high.12 Furthermore, the
marginal effect is lowest in municipalities with the highest levels of inequality.
To give a sense of the magnitude of these results, consider that there is a 3.7% chance of having
a land invasion in a given municipality-year across the dataset. The peak of the marginal effect in
Figure 3a, 1.6 percentage points, increases the likelihood of a land invasion over the baseline proba-
bility within the whole dataset by 46%. In a region with high reform activity, as illustrated by Figure
3b, the average probability of any municipality experiencing a land invasion increases substantially.
However, as predicted by the theory, increased higher landholding inequality is associated with
smaller spillover effects. In a municipality with a land Gini value at the median of the sample, the
marginal increase in the likelihood of a land invasion as a result of the increased levels of neighboring
reforms is 8.2%, compared to a marginal effect of 3.2% in a municipality at the highest level of land-
holding inequality. In short, while inequality attracts land invasions, spillover threats from neigh-
boring municipalities are weaker in municipalities with the highest levels of inequality. The Model 4
12That we estimate the spillover effects to still be net positive supports the notion that the landholding Ginialso contains information about the attractiveness of an area to potential land invaders.
21

results for the other variables are largely similar to the negative binomial specification in Model 3.13
Model 5 uses the number of families participating in land invasions as the dependent
variable to test whether spillover effects and landholding inequality are influencing the magnitude
as well as simply the occurrence of land invasions. All results remain similar.
Addressing Endogeneity in Land Inequality. Are the main results in Models 1-5 of Table 2
driven by an endogenous relationship between between landholding inequality and land invasions?
It could be the case, in particular, that land invasions, when met with land reform, drive down
the landholding Gini through the redistribution of large properties. This could yield a mechanical
positive link between baseline landholding inequality and land invasions.
Several pieces of evidence cast strong doubt on this possibility. First, the correlation between
land invasions and changes in the landholding Gini at the municipal-year level is a mere -0.002
(N=142,246). Similarly, lagged land invasions are a poor predictor of changes in the landholding
Gini. This is because only a small number of land invasions spurred reforms large enough to
drastically change the landholding Gini in a municipality over this time period. The representative
land invasion met with reform affects only about 1% of a municipality’s land. The average change
in the land Gini is essentially zero for municipalities without reforms, few reforms, or even many
reforms. But because some subset of land invasions may result in large changes to landholding
inequality, Models 6-8 of Table 2 replicate Models 3-5 but restrict the sample to municipalities
where landholding inequality changed by less than 0.05 between the agricultural censuses of 1995
and 2006, an annual change of less than 0.005.14 The results for the set of municipalities with
stability in landholding inequality are very similar to previous models. Indeed, the results in
all of the tables that follow are robust to this experiment. We can therefore be confident that
land inequality is affecting patterns of land invasions rather than the other way around.
Addressing Municipal-Level Unobserved Heterogeneity. Most of the regression models employ
state fixed effects to avoid throwing out municipalities that do not vary in the outcome of land
invasions. Many of these observations may be consistent with our theory. Nonetheless, it is
possible that unobserved and time-invariant municipal-level factors such as geography or colonial
13This is not particularly surprising given that of all the municipalities that experienced any land invasions,only 38% witnessed more than one invasion.
14Results are similar when restricting to annual land Gini changes of less than 0.003 or even 0.001 (seeAppendix Table A6).
22

legacies may impact the incidence of land invasions and also be correlated with land reform,
driving spurious findings. Models 9-11 of Table 2 replicate Models 6-8 but now include municipal
fixed effects. The results are robust to this experiment, though the substantive significance of the
coefficients is somewhat reduced, as expected given that some of the data dropped (i.e., highly
unequal municipalities with no land invasions) should support the theory.15
Identifying Spillover Effects of Land Reforms. Land invasions not only respond to
land reforms; indeed, in many cases land reforms respond to previous land invasions by settling
land invaders on public or private lands. We therefore need to address possible endogeneity
between land invasions and land reforms in order to identify the causal effects of recent neighboring
reforms on land invasions in a municipality. Our empirical strategy employs the fact that some
Brazilian states – mainly Acre, Maranhao, Mato Grosso, Piauı, Rio Grande do Sul, Sao Paulo
– use public lands for land reform projects while in other states the federal land agency INCRA is
the overwhelmingly dominant or sole provider of land grants through private land expropriations.
If land reforms in neighboring municipalities do indeed spill over and encourage land invasions,
such spillovers should be different depending on the type of reform.
The recognition of claims on public lands should only affect the likelihood of subsequent
invasions within the same state. No such diffusion effects should be observed across state borders
where the policy process for public land recognitions is run independently. Indeed, in some
states there is simply little ability or willingness of the state government to distribute public land.
By contrast, land reform projects relying on expropriated private land should exhibit no such
differential effects across state borders. We can therefore use the classification of land reform
projects as public recognitions or private expropriations for our empirical identification strategy.16
Table 3 presents the regression estimates of the spillover effects of land reforms on land
invasions. Models 1 to 3 indicate support for Hypotheses 3a and 3b. Neighboring expropriations,
both in the same state and across state borders, increase the risk of invasions. However, recogni-
tions of public land claims only diffuse within state borders but do not increase the likelihood of
invasions in other states. We interpret this as prima facie evidence that reforms indeed encourage
15All of the main results are consistent using municipal fixed effects models. See Table A4 in the Appendixfor a series of municipal random and fixed effects models.
16See the appendix for a detailed description of the typology of land reforms by INCRA.
23

additional invasions, but only if potential land invaders can reasonably expect to be the recipient
of a land grant of the same type. Model 4 of Table 3 combines neighboring reforms based on
expropriations and in-state public land grants into an overall count of “relevant neighboring
reforms.” As expected given the Model 3 results, “relevant neighboring reforms” encourage
additional land invasions whereas neighboring out of state land recognitions do not.
The fact that land reforms based on private expropriations and public land recognitions in
the same state encourage land invasions but out of state land recognitions do not enables a more
precise test of Hypothesis 2. Model 5 of Table 3 interacts the landholding Gini with the land
reform measures from Model 4. The results again support Hypothesis 2: relevant neighboring
reforms spur additional invasions, though to a much lesser degree in municipalities with very
high landholding inequality. There is no spillover effect of out of state public land recognitions
on land invasions, regardless of landholding inequality.17
Models 6-10 address several potential feedback loops between land reforms and land invasions
that may impact the results. Model 6 includes a spatial lag of land invasions in the neighboring
100km region to capture potential short-term spatial spillovers in invasions. It could be, for instance,
that invasions in a municipality are driven principally by neighboring invasions in the previous pe-
riod, which are only correlated with neighboring reforms. While the coefficient on neighboring land
invasions is positive and statistically significant, the main results for landholding inequality and land
reform hold: land inequality mitigates the spillover effects of neighboring relevant reforms, whereas
neighboring out of state land recognitions have no spillover effects. A series of further spatial
analyses presented in Tables A9 and A10 in the Appendix confirm these findings. These analyses
first cluster standard errors by mesoregion, and then test additional spatial lags of land invasions
while sequentially adding municipal fixed effects, year dummies, and state-specific time trends.
Model 7 instead introduces a cumulative land grant measure that taps the history of reform
in a municipality. The cumulative measure of land reform captures the number of past land
grants, which may either encourage further land invasions or diminish the number of encampments
prepared to invade land. Given that the stock of land in a municipality is rarely exhausted due to
land reform, we expect the former condition – an increase in invasions – to prevail. The positive
17We also check for the sensitivity of the results to further controls for the particular municipal agriculturaleconomy in Table A5 in the appendix. All results remain unchanged.
24
coefficient on cumulative reforms in Model 7 supports this notion, while the main results again hold.
It may be the case, however, that land invasions in a municipality spur or are correlated
with subsequent land reforms in the municipality’s neighborhood, which themselves catalyze
additional land invasions in that municipality. To address this concern with feedback and spatial
spillovers, Models 8-10 of Table 3 turn to first instances of land invasions. In cases of first
instances, we expect any spatial and temporal feedback system through residuals to be much
less problematic. Model 8 is specified similarly to Model 5 but excludes municipality-years that
correspond to municipalities that have previously experienced land invasions. In this case, we
can be certain that previous land invasions within a given municipality did not lead to further
invasions, whether via the mechanism of land reform demonstration effects or otherwise. Model
8 demonstrates that relevant neighboring reforms spur first instances of land invasions, thereby
increasing our confidence that we are indeed capturing spillover effects whereby neighboring
reforms lead to invasions rather than some cyclical invasion-reform relationship. The magnitudes
of the coefficients of interest decline somewhat but the results hold strong.
Model 9 only includes municipality-years that witnessed zero land invasions in the prior
period within a radius of 50km.18 For this model, we can be more sure that it is neighboring land
reforms in the prior period that are spilling over into land invasions within a given municipality
rather than there being some unobserved factor that drives spatial and temporal autocorrelation
in land invasions. The results hold. Model 10 only includes municipality-years that witnessed
zero land invasions in all prior periods within a radius of 50km. This model therefore focuses
on the effects of spillover land reforms in areas that have never directly witnessed a land invasion.
Such land reforms occur, for instance, if the state targets alternative sources of land for reform
settlements to alleviate land invasions elsewhere in the country. These are clear instances in
which neighboring reforms, and not invasions, are spilling over into instances of land invasions
in a given municipality. Again, the results are robust despite the reduced sample size.
Alternative Measures of Landowner Organization. Tables 2–3 indicate that recent,
“relevant” land reforms in geographically close municipalities encourage subsequent invasions by
landless peasants. Landowners in highly unequal municipalities, however, can reduce and even
18The data become sparse if we widen the radius much beyond this; nonetheless the results are not sensitiveto this specific threshold.
25

neutralize these threats of spillovers from neighboring reforms into potential invasions. This is
consistent with our argument that landowners in highly unequal places are better able to reflexively
mobilize their organizational capacity to thwart the threat of imminent invasions. The remaining
analyses test additional manifestations of landowners’ capacity to mobilize against reform spillovers.
The Deployment of Violence. If the Gini coefficient of landholding inequality is acting to
suppress land invasion spillovers by activating large landowners’ latent capacity to organize, then
we should expect other measures of landowner organization that is catalyzed by evident threats
to behave in a similar fashion. We first tap landowner organization in the countryside through
the selective deployment of violence: the formation of militia groups and the hiring of hit men
to intimidate and even murder peasant activists and land invaders. The heyday of rural violence
occurred in the first decade following Brazil’s 1985 democratization. As the UDR formed to
shield productive private property from expropriation in the Constituent Assembly, powerful
landowners coordinated locally to create militias and local defense groups and hire gunmen to
protect their property (Bruno, 2003). Yet violence hardly dissipated in the 1990s. To the contrary,
rural assassinations jumped in the early 2000s to levels close to those in the early 1990s. Between
1988 and 2013 there were 1,208 killings of peasants and peasant leaders (CPT, 2014).
In municipalities that have witnessed rural assassinations, we can infer that landowners
at least have the capacity to organize. To be sure, not all assassinations, or the mechanics of the
crime itself, require substantial organization. But creating an environment of impunity in which
landowners can get away with such heinous crimes does indeed typically require organization.
Landowners have to deploy a variety of tactics that are more costly and involved than the murder
itself. They need to plan and fund assassinations in advance (often through intermediaries) in order
to ensure they are not botched or traced to their source; they must evade, selectively bribe, or even
directly hire local police; and they need to cultivate connections or influence with local judges in the
event the cases reach local courts. Regarding the police, for instance, landowners often employ off-
duty police as a way to supplement their income and bias police investigations of rural murders (e.g.,
so that police deliver weak reports that cause the local judiciary to shelve cases rather than prosecute
them) (Payne, 2000, pp. 110-13). Consequently, the hired hit men that actually carry out murders
of squatters and peasant activists are often the tip of the iceberg of landowner organization. They
are merely the visible manifestation of some organized effort, and, to the extent that organization
26
is effective, they are explicitly intended to appear as unconnected to broader forces (Payne, 2000,
p. 112). Moreover, many of these contract killers and their employers have been successful in
evading punishment: according to the CPT, only 8% of all murder cases from 1985–2014 ever
reached trial and only about 4% of all hitmen and 2% of the contractors were ever convicted.
We create several measures of rural killings based on data from the CPT. We first code
municipalities that had any rural killings in the period 1988–2013 as having an organized landowner
presence. It is important to note that our measure of rural assassinations is specifically tied to
land-related conflict. Concretely, it captures the assassination of land squatters, rural workers, and
peasant and landless movement activists rather than violence in general. Because landowner organi-
zational capacity may develop in response to threats of invasions later in the period, we also recode
this variable as indicating landowner organization only in the years during and after a rural assassi-
nation. Finally, we create a measure that captures the logged number of previous assassinations up
to the present. These measures, of course, are imperfect. Landowners with the capacity to deploy
violence will not always need to use it, especially if it serves as an effective deterrent. Miscoding such
cases as indicating an absence of landowner organization, however, biases against our hypothesis.
We anticipate that rural assassinations in the absence of neighboring reforms should be
associated with additional invasions. This is not, of course, because land invaders want to risk
assassination in seizing land. Isolated land invasions are hard to defend against and may even
elicit a violent backlash from landowners trying to respond to invaders. Land invaders, for their
part, are nonetheless ceteris paribus attracted to sprawling landed estates vulnerable to potential
expropriation –– precisely the circumstances that provide landowners an incentive to organize
to protect their property. Land reforms in neighboring areas, by contrast, serve as a ‘warning
shot’ to landowners to step up their efforts to repel land invasions lest their municipality is
targeted by invaders next. We therefore anticipate that neighboring land reforms should spill over
into additional invasions, but this effect should be substantially reduced in the presence of the
demonstrated capacity of landowners to organize: namely, to inflict violence on land invaders. To
ensure that our violence measures are not simply picking up weak rule of law that could also be
correlated with land invasions, we include several additional controls and also conduct a placebo test.
Table 4 presents a series of models indicating how the deployment of violence in the presence
of neighboring land reforms influences land invasions. Given the insignificance of out of state
27

public land recognitions in Table 3, and to ease interpretation of the remaining interaction terms
and their constituent variables, we drop the indicator for out of state public land recognitions
in these and subsequent models.19
Models 1-3 of Table 4 introduce two new controls that proxy for the rule of law: whether or not
there is a municipal police guard and municipal police guard personnel per capita. While municipal
police are relatively new in Brazil and less powerful than the state police, a greater municipal police
presence may be negatively linked to land invasions and also suppress murders.20 Data on municipal
guards are taken from the municipal survey Perfil Dos Municıpios published by IBGE (2014). In
Models 1-3 of Table 4 we find that rural assassinations in municipalities that have no neighboring
land reforms are linked to additional invasions. Further supporting our argument, these models indi-
cate that the spillover effects of neighboring land reforms on land invasions are significantly lower in
municipalities where landowners have the demonstrated capacity to inflict violence on land invaders.
A sufficiently high capacity of landowner organization in Model 3 (around the 95th percentile for
municipalities with some violence during the period), measured by the logged count of previous as-
sassinations, substantially reduces any spillover effects of neighboring reforms. These results closely
mirror the results using landholding inequality as a measure of landowners’ organizational response
presented in Table 3. The municipal guard controls are not statistically significant in Models 1-3.
Models 4-6 of Table 4 conduct ‘placebo tests’ on the Model 1-3 findings as another way of
testing whether our rural violence measures are picking up landowner organization. We do so by in-
troducing a variable that captures the sum of non-land-related murders at the municipal-year level.21
If our rural violence measures are simply capturing rule of law rather than landowner organization,
then another measure of killings not linked to peasants and peasant activists should behave similarly.
The interaction between other types of murders and neighboring land reforms, however, is statisti-
cally insignificant across Models 4-6. Whereas spillover effects of neighboring land reforms on land
invasions are lower in municipalities with a history of rural murders, no such pattern exists in munici-
palities with other types of murders. Rural murders are therefore linked differently to land invasions
19This variable is consistently statistically insignificant and small in magnitude, and its omission does notinfluence the results.
20Municipal-level historical data on state police presence or deployment unfortunately are not available.
21The data on all homicides comes from the SIM-DATASUS (2014) register of Brazil’s Health Departmentand were provided by IPEA.
28

than other types of murders, and in a way that is consistent with landowner organizational capacity.
Models 7-9 remove the controls for the municipal guard and instead introduce a control for
whether the municipal guards aids the state military police in its operations. The state military
police are considerably more powerful than their municipal counterparts and are the chief players in
blocking or ousting land squatters. Municipal guards that work hand-in-hand with the state military
police may therefore be affiliated with greater rule of law presence in a way that the simple presence
of municipal guards is not. These data are only available annually since 2002 but suffer considerable
missingness, in part because municipal guards were recently introduced and only municipalities
which had a municipal guard responded to the survey question. As anticipated, and in contrast
to the insignificant coefficients on municipal guards in Models 1-6, municipal aid of the military
police is negative in Models 7-9 and statistically significantly tied to fewer land invasions in Models
7-8. Furthermore, the results for rural murders holds in these models, and the models also pass
the placebo test demonstrating that other types of murders behave differently than rural murders.
Political Connections to Parliament. We next investigate the role of political connections
– an eminent and powerful sign of organization – in stifling the spillover effects of neighboring
land reform on local land invasions. Arguably, the pinnacle of landowner organization is having a
connection to a member of parliament who is part of the powerful congressional bloc representing
landowner interests. Political connectedness also differs from the previous measures of organization
in several key ways: it captures landowner organization without necessarily capturing demand for
land by potential land invaders, and it represents ex ante rather than reflexive organization that
can serve to project an effective deterrent threat. Political connections should therefore make
it less likely that there are land invasions in a municipality and should also cauterize spillover
effects induced by neighboring expropriations.
Landowners that are politically and economically connected to – or that themselves are –
members of the powerful congressional bloc representing rural interests (the bancada ruralista) are
more capable of projecting power ex ante to would-be land invaders. Not only are these connections
themselves generative of organizational strength, but landowners with such ties can more effectively
exert personal influence within the bureaucracy, call attention and state resources (including the
police) to remove squatter settlements and act against rural unrest, and leverage a reputation of
political power that serves as a deterrent threat. Connected landowners are also likely to coordinate
29

with other local large landowners in an effort to forge a unified front against land invasions. In
municipalities where landowners have these connections and organizational tools at their disposal,
baseline rates of land invasions should be lower, and spillover effects should be absent.
Take for example the municipality of Coruripe in the state of Alagoas. Costa (2012)
demonstrates the strong connections between landowners in Coruripe and members of the bancada
ruralista such as Joaquim Beltrao. A congressman from the state of Alagoas, Joaquim Beltrao was
formerly the mayor of Coruripe as well as a significant landowner, and his nephew Max became
the Municipal Secretary for Housing and subsequently the Municipal Secretary for Planning
and Development – positions that brought him into close interaction with landowners in the
municipality. Max himself later became mayor of Coruripe. A wave of neighboring land reforms
crashed around Coruripe in the late 1990s and again in the mid-2000s, catalyzing an even greater
number of nearby land invasions. Yet land invasions never came to Coruripe itself despite high
landholding inequality (the land Gini was slightly over 0.91 in the mid-2000s) and the fact that
nearly half the population was rural.
From a theoretical and empirical perspective, political connections represent a “purer”
measure of landowner organization in that it is not necessarily coterminous with the attractiveness
of land to potential land invaders. Parliamentary members are elected within multimember state
districts, of which there are 26 – dramatically fewer than Brazil’s 5,500 municipalities. As a result,
it would be very difficult, though not impossible, for landowners in any given rural municipality
with few votes to place one of their own members in the parliament. There should thus be more of
a decoupling between economic and personal ties of parliamentarians represented in the bancada
ruralista and localized threats to the commercial property of these political representatives and their
business associates. Electoral influence is in no way deterministic of having a member of the bancada
ruralista elected who happens to have business-related landholdings in a particular municipality.
We measure political connections by capturing land ownership of businesses that are owned
by members of the bancada ruralista or have political ties to the bancada ruralista. Data are
taken from Costa (2012), who gathered details on business landholdings directly from INCRA
for the year 2003. We fill in the same data across municipalities for the remainder of that specific
parliamentary cohort for which the 2003 data on ties obtain (i.e., 2003-2007). This particular
analysis therefore only spans the years 2003-2007. We create three measures from the data
30

on business connections. The first is a simple dummy variable that flags municipalities where
businesses that are politically connected to the bancada ruralista own land. The second is a count
variable that measures the strength of these connections through the logged number of politically
connected businesses with landholdings in a municipality. Finally, we test a measure of the logged
area of land (in hectares) held by businesses with direct ties to the bancada ruralista.22
Table 5 displays the determinants of land invasions as a function of pressures due to
neighboring land reforms and ties to national parliamentarians in the bancada ruralista. In Models
1–3 we find that the presence of businesses that hold land and have political connections to the
bancada ruralista significantly tempers land invasions in a municipality. This is true whether we
operationalize political business ties as a simple indicator, a count of landholdings, or the area of
landholdings in a municipality. Past neighboring land reforms, for their part, continue to spill over
into additional invasions. Although this holds even in municipalities in which landowners have ties
to powerful politicians, the effect of political connections forestalls all but the most extreme waves
of neighboring reforms (corresponding to the 99th percentile of neighboring reforms in Model 1).
Alternative Explanations
There are two primary alternative explanations that could account for the patterns observed
in the analyses above. This section takes up these alternatives in turn.
Peasant Versus Landowner Organization. The first alternative explanation would
claim that peasant rather than landowner organizational capacity accounts for the observed
pattern of land invasions. Perhaps facing a hostile rural environment absent reform spillovers,
collective action barriers are high and can only be overcome when the most organized landless
social movement, the MST, is willing to aid peasants in order to call attention to landlessness
– a tactic that could be especially effective in unequal municipalities that shed a harsh light
on rural inequity. Then when there is a permissive environment in the form of neighboring
reforms, peasants find organizing invasions easier across the board and thus the most unequal
municipalities are no longer specifically targeted.
Table 6 tests this alternative explanation by differentiating highly organized land invasions
22Results are similar when measuring political connectedness through the self-reported personal or family-ownedlandholdings of members of the bancada ruralista, though somewhat weaker, perhaps due to well-documentedunderreporting of personal landholdings (Costa, 2012).
31

that involve the MST from those that are not supported by this key social movement. If we find that
the same patterns of land invasions obtain for both more and less organized land invasions, then
we can infer that it is the response side of landowner organization rather than peasant organization
that is driving the results. Models 1-2 of Table 6 are specified the same way as Model 3 of Table
2 and Model 5 of Table 3 but exclude municipality-years in which the MST was involved in land
invasions, with data taken from Dataluta as detailed above. These models also include controls for
the percentage of cultivated land planted with sugarcane and the log number of cattle relative to
cultivated land area to account for local agricultural economies that may impact whether the MST
is active in some places and not others.23 Economic crisis in the northeast sugar zone, for instance,
enabled the MST to make inroads into the north from its southern origins in an effort to transform
itself into a national movement (Wolford, 2010). Similarly, primarily southern cattle ranchers long
had difficulty proving productive use of their land, facilitating MST organization and associated
land invasions. The findings in Models 1-2 largely mirror those for the full sample presented in the
earlier tables. Models 3-4 instead exclude municipality-years in which the MST was not involved
in land invasions. Again the results mirror the previous results and those in Models 1-2 of Table 6.
In short, whether self-organized or aided by a powerful social movement, land invasions
follow similar patterns vis-a-vis landholding inequality and neighboring land reforms. This casts
doubt on peasant organization as a mechanism driving the results – perhaps not too surprising
given the presumptively much higher barriers to organization for several hundred landless peasant
families versus a small number of locally rooted large landowners.
Political Partisanship. The second alternative explanation for where land invasions
materialize is the partisan affiliation of political executives, namely governors and the president.
State governors are powerful actors in the Brazilian political system. The military police that
are typically used to evict squatter settlements are controlled at the state level. Furthermore,
governors can influence the agrarian reform process and the pace of land invasions through their
influence over the state INCRA office (Meszaros, 2013). The president indirectly appoints the
head of INCRA and can use her administrative clout to direct the land reform process. Political
23The Table 6 results also hold when introducing municipal fixed effects to account for unobservedmunicipal-level factors that may have differentially facilitated MST growth such as a history of social capitalor tight-knit communities.
32

partisanship could therefore provide an alternative explanation for the findings if, for instance,
one-off land invasions targeting unequal municipalities are hard to rebuff, but when there is an
evident threat of invasions due to neighboring reforms, governors on the right either deploy police
to protect powerful large landowners in unequal places or credibly signal to land invaders via the
state INCRA office that land grants will not be forthcoming in response to invasions. A similar
finding could obtain if governors and the president on the right agree on “law and order” policing
or an INCRA grant pullback in response to unrest – especially in municipalities where politically
powerful landowners have the clout to call a governor’s attention.
We test this alternative by examining the patterns of land invasions first directly controlling
for governor ideology, then through examining where there is political concordance between
governors and the president either on the right or on the left, and finally examining political
discordance.24 If the alternative is correct, we should expect leftwing governors or political
concordance on the left to yield either (i) more land invasions regardless of landholding inequality;
or (ii) the systematic targeting of more unequal municipalities with land invasions regardless
of spillover threats given a broader pool of sympathetic voters. The opposite should hold on
the right. Regardless, it is hard to countenance why unequal municipalities would face lower
rates of invasions in the face of spillover threats under left rule.
Table 7 reports the results. Models 1-2 indicate that, consistent with Meszaros (2013),
right-wing governors are tied to fewer land invasions relative to the omitted baseline category of
centrist governors. Left governors, however, are not tied to more land invasions. Most importantly,
the main results with respect to land inequality and spillover threats from neighboring reforms
hold even controlling for governor ideology. Models 3-8 examine partisan alignment between
governors and the president. The patterns of land invasions documented in previous tables again
obtain irrespective of whether governors and the president share political views on the left or the
right, or if their partisan affiliations conflict. These results suggest that landowner organization
rather than partisanship drives the results.
24We assign the ideological orientation of presidents and governors on a three point (left-center-right) scaleusing the ideological coding of Brazil’s splintered party system by Carreirao (2006). An examination of theimpact of partisan agreement between mayors and governors yielded similar results.
33

Conclusion
This paper investigates two prominent, interrelated questions. First, what is the relationship
between land inequality and rural unrest? And second, why does land reform aimed at undercut-
ting rural unrest sometimes fail? Previous research on these questions is mixed. We investigate
landowner organization as a mechanism that conditions the link between landholding inequality
and rural unrest. Earlier scholarship emphasized how land inequality generates rural discontent,
thereby spurring conflict. Our theoretical corrective emphasizes that land inequality also taps
the presence of large landowners – actors much more equipped to act collectively when prompted.
Using municipal-level data from Brazil’s land reform program and the universe of 9,400 land
invasions staged by several million individuals over the period 1988–2013, we demonstrate that
while isolated threats to large landowners via land invasions in highly unequal areas are difficult to
repel, landowners can successfully resist land invasions when broader local threats catalyze them to
organize. Spillover land invasions spurred by neighboring land reforms are cauterized where land
inequality is high. They are also forestalled where landowners have the demonstrable capacity to de-
ploy violence and where landowners have political connections to the bancada ruralista in parliament.
Landed elites in these municipalities coordinate to counteract potential invasions. The relationship
between landholding inequality and land invasions is therefore conditional on active landowner
organization. Future research might test whether a similar mechanism operates among business
and other economic elite groups whose property rights face sporadic and consequential threats.
While only further research can robustly demonstrate how our findings generalize, Table 1
indicates a broad set of potentially similar contemporary cases. Extant research on cases such as
Colombia, Italy, and Russia suggests that the dynamics we highlight are at play in at least some
of these cases. And given the demand-driven structure of land reform in cases like Chile, South
Africa, and Venezuela, it would hardly be surprising if not only do land invasions spur reform in
these countries, but landowners are also galvanized to act collectively in places where local threats
to their property are evident. Inequality, rural unrest, and land reform are unlikely to subside
in the near future in the countries listed in Table 1, and the growing rural populations and land
pressure in parts of the developing world imply that this list – and with it the importance of
the questions this paper engages – is likely to grow.
34

References
Acemoglu, Daron and James A. Robinson (2006). “Economic Backwardness in Political Perspective.”
American Political Science Review 100.
Albertus, Michael (2015). Autocracy and Redistribution: The Politics of Land Reform. New York:
Cambridge University Press.
Albertus, Michael and Oliver Kaplan (2013). “Land Reform as a Counterinsurgency: Policy
Evidence from Colombia.” Journal of Conflict Resolution 57.
Alston, Lee, Edwyna Harris, and Bernardo Mueller (2012). “The Development of Property Rights
on Frontiers.” The Journal of Economic History 72.
Alston, Lee, Gary Libecap, and Bernardo Mueller (2000). “Land Reform Policies, the Sources
of Violent Conflict, and Implications for Deforestation in the Brazilian Amazon.” Journal of
Environmental Economics and Management 39.
Assuncao, Juliano (2006). Land Reform and Landholdings in Brazil. Working Paper. World
Institute for Development Economic Research (UNU-WIDER).
Binswanger, Hans P., Klaus Deininger, and Gershon Feder (1995). “Power, Distortions, Revolt
and Reform in Agricultural Land Relations.” In: Handbook of Development Economics. Ed. by
Jere Behrman and T.N. Srinivasan. Vol. 3, Part B. Elsevier.
Brockett, Charles (1992). “Measuring Political Violence and Land Inequality in Central America.”
American Political Science Review 86.
Brown, David, Christopher Brown, and Maureen Donaghy (2011). “The Electoral Consequences
of Direct Political Action: Evidence from Brazil.” Latin American Politics and Society 53.
Bruno, Regina Angela Landim (2003). “Nova Republica: A violencia patronal rural como pratica
de classe.” Sociologias.
Carreirao, Yan de Souza (2006). “Ideologia e partidos polıticos.” Opiniao Publica 12.
Carter, Miguel (2010). “The Landless Rural Workers Movement and Democracy in Brazil.” Latin
American Research Review 45.
Collier, Paul and Anke Hoeffler (2004). “Greed and Grievance in Civil War.” Oxford Economic
Papers 56.
Costa, Sandra Helena Goncalves (2012). “A Questao Agraria no Brasil e a Bancada Ruralista no
35

Congresso Nacional.” Dissertation. Universidade de Sao Paulo.
Cowell, Frank (2011). Measuring inequality. Oxford University Press.
CPT (2014). Conflitos no campo. Tech. rep. Comissao Pastoral da Terra Nacional Brasil.
Cramer, Christopher (2003). “Does inequality cause conflict?” Journal of International Develop-
ment 15.
DATASUS/SIM (2014). O sistema de informacoes sobre mortalidade. Brasilia, Brazil.
Deininger, Klaus and Lyn Squire (1996). “A New Data Set Measuring Income Inequality.” World
Bank Economic Review 10.
Fernandes, Bernardo Mancano, Clifford Andrew Welch, and Elienai Constantino Goncalves (2012).
Polıticas Fundiarias No Brasil. Tech. rep. Rome: International Land Coalition.
Finkel, Evgeny, Scott Gehlbach, and Tricia Olsen (2015). “Does Reform Prevent Rebellion?
Evidence from Russia’s Emancipation of the Serfs.” Comparative Political Studies 48.
Galor, Oded, Omer Moav, and Dietrich Vollrath (2009). “Inequality in Landownership, the
Emergence of Human-Capital Promoting Institutions, and the Great Divergence.” Review of
Economic Studies 76.
Gilbert, Dennis (1977). The Oligarchy and the Old Regime in Peru. Cornell University Press.
Girardi, Eduardo Paulon (2014). DATALUTA - Banco De Dados Da Luta Pela Terra. Presidente
Prudente, Sao Paulo.
Hidalgo, F. Daniel et al. (2010). “Economic Determinants of Land Invasions.” The Review of
Economics and Statistics 92.
IBGE (2014). Perfil Dos Municıpios Brasileiros: Pesquisa De Informacoes Basicas Municipais.
Rio de Janeiro: IBGE, Departamento de Populacao e Indicadores Sociais.
INCRA (2011). Database on Land Reforms in Brazil. Tech. rep. Instituto Nacional de Colonizacao
e Reforma Agraria.
King, Russell (1973). Land reform: the Italian experience. Butterworths London.
Lichbach, Mark (1989). “An Evaluation of “Does Economic Inequality Breed Political Conflict?”
Studies.” World Politics 41.
Lipton, Michael (2009). Land Reform in Developing Countries. Routledge.
Mason, T. David (1998). “”Take Two Acres and Call Me in the Morning”: Is Land Reform a
Prescription for Peasant Unrest?” The Journal of Politics 60.
36

Meszaros, George (2013). Social Movements, Law and the Politics of Land Reform: Lessons from
Brazil. Routledge.
Midlarsky, Manus I. (1988). “Rulers and the Ruled: Patterned Inequality and the Onset of Mass
Political Violence.” The American Political Science Review 82.
Moore, Will, Ronny Lindstrom, and Valerie O’Regan (1996). “Land reform, political violence and
the economic inequality-political conflict nexus.” International Interactions 21.
Muller, Edward and Mitchell Seligson (1987). “Inequality and Insurgency.” The American Political
Science Review 81.
Muller, Edward, Mitchell Seligson, et al. (1989). “Land Inequality and Political Violence.” The
American Political Science Review 83.
Ondetti, Gabriel (2011). Land, Protest, and Politics: The Landless Movement and the Struggle
for Agrarian Reform in Brazil. University Park, PA: Penn State University Press.
Paige, Jeffrey M. (1975). Agrarian Revolution. New York, NY: Free Press.
Payne, Leigh (1992). “Brazilian Business and the Democratic Transition: New Attitudes and
Influence.” University of Notre Dame.
– (2000). Uncivil Movements: The Armed Right Wing and Democracy in Latin America. Baltimore,
USA: Johns Hopkins University Press.
Russett, Bruce M. (1964). “Inequality and Instability: The Relation of Land Tenure to Politics.”
World Politics 16.
Sigaud, Lygia Maria (2015). “Under the Black Tarp: The Dynamics of Legitimacy of Land
Occupations in Pernambuco.” In: Challenging Social Inequality. Ed. by Michael Carter. Duke
University Press.
Silva, Ligia Maria Osorio (1996). Terras Devolutas e Latifundio. Centro de Memoria Unicamp.
Verwimp, Philip (2005). “An economic profile of peasant perpetrators of genocide: Micro-level
evidence from Rwanda.” Journal of Development Economics 77.
Wolford, Wendy (2010). This Land Is Ours Now: Social Mobilization and the Meanings of Land
in Brazil. Durham, NC: Duke University Press.
Wood, Elisabeth (2003). Insurgent Collective Action and Civil War in El Salvador. New York,
NY: Cambridge University Press.
Ziblatt, Daniel (2008). “Does Landholding Inequality Block Democratization?” World Politics 60.
37

Table 1. OngoingLand Reforms and Types of Land Conflict in Countries with Highly Unequal Landholdings
Country Landholding Types of Land Conflict Land ReformInequality Ongoing Since
Bolivia 0.77 Land invasions, squatting, protests, strikes 1996Brazil 0.86 Land invasions, squatting, protests, rural
assassinations1964
Chile 0.91 Land invasions, protests 1993Colombia 0.80 Squatting, strikes, blockades 1961El Salvador 0.81 Land invasions, squatting 1992Guatemala 0.85 Land invasions, squatting 1998India 0.6 Squatting, protests, rallies 1947Kenya 0.77 Land invasions, squatting, protests 2009Philippines 0.55 Land invasions, protests, rural assassinations 1963South Africa 0.70 Land invasions, protests, strikes 1994Venezuela 0.88 Land invasions, squatting 2001Zimbabwe N/A Land invasions, squatting 1992
The data for landholding inequality come from Lipton (2009), the FAO’s World Censusof Agriculture, Brazil’s national statistics agency, Deininger and Squire (1996), and USAID.Inequality figures are from the most recent year available.
38

Table 2. Determinants of Land Invasions in Brazil, 1988–2013
Full Sample Municipalities where |∆Land Gini|<0.005
Invasion Invasion Invasion Invasion Invasion Invasion Invasion InvasionDependent Variable: Invasion Count Dummy Families Count Dummy Families Count Dummy Families
Model 1 Model 2 Model 3 Model 4 Model 5 Model 6 Model 7 Model 8 Model 9 Model 10 Model 11
Land Gini 5.603*** 5.424*** 6.225*** 5.493*** 8.930*** 7.834*** 7.403*** 11.256*** 2.503*** 3.276** 3.422***(0.353) (0.344) (0.409) (0.323) (0.687) (0.635) (0.505) (1.140) (0.596) (1.354) (0.397)
Neighboring Reforms 0.529*** 1.447*** 1.398*** 2.574*** 1.707*** 1.869*** 2.997*** 0.807*** 0.755*** 1.201***(0.032) (0.226) (0.170) (0.409) (0.320) (0.242) (0.542) (0.247) (0.292) (0.216)
Land Gini*Reforms -1.203*** -1.219*** -2.707*** -1.576*** -1.805*** -3.196*** -0.760** -0.642* -1.131***(0.294) (0.221) (0.518) (0.414) (0.315) (0.705) (0.316) (0.375) (0.274)
Percent Rural -0.731*** -0.651*** -0.657*** -0.557*** -1.067*** -1.047*** -0.911*** -1.507*** -0.559** -0.250 -0.648***(0.205) (0.198) (0.197) (0.171) (0.324) (0.294) (0.228) (0.411) (0.248) (0.505) (0.159)
log(Ag Productivity) 0.031 0.047* 0.051** 0.066*** 0.225*** 0.033 0.071* 0.243*** 0.044 0.057 0.108***(0.025) (0.025) (0.025) (0.024) (0.051) (0.038) (0.040) (0.072) (0.029) (0.035) (0.025)
log(Income per capita) 0.374** 0.525*** 0.531*** 0.589*** 0.303 0.486** 0.485*** 0.454* 0.405*** 0.293 0.306***(0.156) (0.153) (0.152) (0.121) (0.199) (0.193) (0.168) (0.260) (0.107) (0.212) (0.071)
Time Trend YES YES YES YES YES YES YES YES YES YES YESFixed Effects STATE STATE STATE STATE STATE STATE STATE STATE MUNI MUNI MUNIObservations 137141 137141 137141 137141 137141 77752 77650 77752 24338 24338 23884
* p<0.10, ** p<0.05, *** p<0.01 (two-tailed). Standard errors in parentheses (clustered by municipality). Constants estimated but not reported. All indepen-dent variables are lagged by one period. “Neighboring Reforms” are a weighted sum of all land grants in municipalities within a 100km radius. All reform countmeasures are log-transformed. Models 6-11 are restricted to municipalities in which the landholding Gini changed by less than 0.005 annually from 1996 to 2006.
39

Table 3. Identifying Spillover Effects of Land Reforms on Land Invasions, 1988–2013Dependent Variable: Number of Land Invasions
All Land Invasions First Instances of Land Invasions
Ever Prior Period Ever
in Muni in Region in Region
Model 1 Model 2 Model 3 Model 4 Model 5 Model 6 Model 7 Model 8 Model 9 Model 10
Neighboring Expropriations 0.559***
(0.034)
Neighboring Recognitions out of State 0.067 0.059 0.049 0.061 0.105 -0.221 -0.231 -0.952 -1.413 -5.224
(0.079) (0.079) (0.078) (0.076) (0.568) (0.678) (0.598) (0.794) (1.470) (4.033)
Neighboring Expropriations in State 0.478*** 0.469***
(0.036) (0.036)
Neighboring Expropriations out of State 0.392*** 0.372***
(0.070) (0.070)
Neighboring Recognitions in State 0.267***
(0.061)
Relevant Neighboring Reforms 0.459*** 1.520*** 1.108*** 1.363*** 1.194*** 1.739*** 1.882***
(0.029) (0.204) (0.200) (0.196) (0.276) (0.292) (0.439)
Land Gini*Relevant Neighboring Reforms -1.373*** -1.146*** -1.268*** -0.998*** -1.794*** -1.897***
(0.260) (0.258) (0.251) (0.355) (0.375) (0.558)
Land Gini*Neighboring Recognitions out of State -0.060 0.085 0.358 1.373 1.712 6.056
(0.743) (0.877) (0.776) (1.017) (1.667) (4.689)
Land Gini 5.486*** 5.477*** 5.418*** 5.400*** 6.253*** 6.007*** 5.611*** 4.995*** 6.269*** 5.484***
(0.345) (0.344) (0.342) (0.343) (0.392) (0.367) (0.383) (0.388) (0.448) (0.570)
Percent Rural -0.629*** -0.612*** -0.618*** -0.652*** -0.660*** -0.421** -0.818*** -0.740*** -0.486** -0.752**
(0.199) (0.200) (0.198) (0.197) (0.197) (0.185) (0.191) (0.191) (0.212) (0.316)
log(Ag Productivity) 0.046* 0.043* 0.043* 0.043* 0.048* 0.046* 0.030 0.062** 0.026 0.068*
(0.025) (0.025) (0.025) (0.025) (0.025) (0.026) (0.022) (0.025) (0.027) (0.036)
log(Income per capita) 0.518*** 0.524*** 0.539*** 0.526*** 0.533*** 0.659*** 0.425*** 0.297** 0.917*** 1.115***
(0.153) (0.154) (0.154) (0.153) (0.152) (0.143) (0.135) (0.128) (0.168) (0.208)
Neighboring Invasions 0.607***
(0.038)
Cumulative Reforms 0.201***
(0.012)
Time Trend YES YES YES YES YES YES YES YES YES YES
Fixed Effects YES YES YES YES YES YES YES YES YES YES
Observations 137141 137141 137141 137141 137141 137141 137141 112748 103399 58423
* p<0.10, ** p<0.05, *** p<0.01 (two-tailed). Standard errors in parentheses (clustered by municipality). Constants estimated but not reported. All independent variables
are lagged by one period. “Relevant Neighboring Reforms” are a weighted sum of all expropriations (in-state and out-of state) and in-state land grants in municipalities within
a 100km radius. All reform count measures are log-transformed. Model 8 is restricted to the subset of municpalities that have not previously experienced a land invasion.
Model 9 is restricted to the subset of municpalities that had no land invasions within a 50km radius in the previous year. Model 10 is restricted to the subset of municpalities
that have never had any land invasions within a 50km radius in prior years.
40

Table 4. Rural Assassinations and Spillover Effects of Land Reforms, 1988–2013Dependent Variable: Number of Land Invasions
Operationalization for Rural Murders: Any Past log(Count) Any Past log(Count) Any Past log(Count)
Model 1 Model 2 Model 3 Model 4 Model 5 Model 6 Model 7 Model 8 Model 9
Relevant Neighboring Reforms 0.472*** 0.486*** 0.479*** 0.473*** 0.488*** 0.486*** 0.383*** 0.392*** 0.377***(0.034) (0.032) (0.032) (0.039) (0.039) (0.039) (0.128) (0.127) (0.126)
Organized Violence 1.502*** 1.240*** 1.053*** 1.347*** 1.066*** 0.907*** 1.502*** 1.397*** 1.315***(0.098) (0.110) (0.095) (0.100) (0.108) (0.091) (0.245) (0.265) (0.222)
Organized Violence*Reforms -0.172*** -0.222*** -0.116** -0.157*** -0.208*** -0.115** -0.413*** -0.447*** -0.282**(0.054) (0.059) (0.053) (0.057) (0.061) (0.054) (0.145) (0.147) (0.143)
Other Murders 0.318*** 0.356*** 0.357*** 0.185*** 0.213*** 0.218***(0.031) (0.031) (0.031) (0.058) (0.058) (0.058)
Other Murders*Reforms 0.001 0.000 -0.004 0.014 0.012 0.001(0.019) (0.020) (0.020) (0.037) (0.037) (0.036)
Land Gini 4.839*** 5.170*** 5.208*** 4.365*** 4.605*** 4.640*** 2.859*** 2.916*** 3.030***(0.325) (0.339) (0.342) (0.314) (0.323) (0.326) (0.827) (0.823) (0.860)
Percent Rural -0.550*** -0.526*** -0.505*** -0.219 -0.162 -0.148 -1.268** -1.173** -1.192**(0.198) (0.194) (0.194) (0.197) (0.194) (0.194) (0.588) (0.584) (0.594)
log(Ag Productivity) 0.025 0.027 0.035 0.021 0.023 0.030 -0.026 -0.022 -0.022(0.024) (0.024) (0.024) (0.023) (0.024) (0.024) (0.054) (0.054) (0.053)
log(Income per capita) 0.486*** 0.562*** 0.548*** 0.132 0.161 0.150 -0.631** -0.589* -0.593*(0.136) (0.154) (0.153) (0.140) (0.154) (0.155) (0.320) (0.321) (0.322)
Municipal Guard Exists 0.052 0.087 0.107 -0.118 -0.102 -0.087(0.144) (0.148) (0.145) (0.147) (0.150) (0.147)
Municipal Guard Personnel per Capita 33.958 22.141 22.794 69.260 62.405 62.850(64.420) (64.211) (63.590) (66.494) (65.952) (64.878)
Municipal Guard Aids Military Police -0.227* -0.233* -0.202(0.132) (0.134) (0.132)
Time Trend YES YES YES YES YES YES YES YES YESFixed Effects YES YES YES YES YES YES YES YES YESObservations 131216 131216 131216 129898 129898 129898 7964 7964 7964
* p<0.10, ** p<0.05, *** p<0.01 (two-tailed). Standard errors in parentheses (clustered by municipality). Constants estimated but not reported.All independent variables are lagged by one period. “Neighboring Relevant Reforms” are a weighted sum of all expropriations (in-state and out-ofstate) and in-state land grants within a 100km radius. All reform count measures are log-transformed. “Other Murders” are all homicides that werenot recorded as related to land conflict.
41

Table 5. Political Connections and Spillover Effects of Land Reforms, 2003–2007Dependent Variable: Number of Land Invasions
Connectedness measure: Dummy log(Count) log(Area)
Model 1 Model 2 Model 3
Relevant Neighboring Reforms 0.377*** 0.376*** 0.375***(0.060) (0.060) (0.060)
Political Connection -0.773** -0.441* -0.120**(0.341) (0.226) (0.054)
Political Connection*Reforms -0.140 -0.144 -0.019(0.300) (0.203) (0.047)
Land Gini 5.691*** 5.671*** 5.691***(0.553) (0.553) (0.554)
Percent Rural -0.714** -0.708** -0.714**(0.322) (0.322) (0.322)
log(Ag Productivity) -0.085* -0.085* -0.085*(0.049) (0.049) (0.049)
log(Income per capita) 0.585** 0.582** 0.581**(0.240) (0.241) (0.240)
Time Trend YES YES YESFixed Effects YES YES YESObservations 21710 21710 21706
* p<0.10, ** p<0.05, *** p<0.01 (two-tailed). Standard errorsin parentheses (clustered by municipality). Constants estimated butnot reported. All independent variables are lagged by one period.“Relevant Neighboring Reforms” are a weighted sum of all expro-priations (in-state and out-of state) and in-state land grants withina 100km radius. All reform count measures are log-transformed.
42

Table 6. Peasant Organization as an Alternative Explanation for Land Invasions, 1988–2013Dependent Variable: Number of Land Invasions
Peasant Organizational Capacity: Non-MST Invasions MST supported Invasions
Model 1 Model 2 Model 3 Model 4
All Neighboring Reforms 1.245*** 2.224***(0.261) (0.400)
Relevant Neighboring Reforms 1.438*** 2.076***(0.229) (0.360)
Neighboring Recognitions out of State -1.503 0.861(0.985) (0.826)
Land Gini*All Neighboring Reforms -0.881*** -2.247***(0.338) (0.518)
Land Gini*Relevant Neighboring Reforms -1.240*** -2.109***(0.290) (0.459)
Land Gini*Neighboring Recognitions out of State 1.632 -0.898(1.231) (1.104)
Land Gini 5.585*** 5.719*** 9.187*** 8.972***(0.465) (0.452) (0.675) (0.627)
Percent Rural -0.143 -0.146 -0.753*** -0.759***(0.225) (0.225) (0.279) (0.277)
log(Ag Productivity) -0.127** -0.136*** -0.140** -0.149***(0.050) (0.050) (0.055) (0.055)
log(Income per capita) 1.048*** 1.050*** 0.585** 0.587**(0.160) (0.160) (0.248) (0.248)
Sugar Dependence 0.245 0.284 0.132 0.135(0.181) (0.181) (0.196) (0.196)
Cattle Dependence 0.127*** 0.126*** 0.162*** 0.160***(0.039) (0.039) (0.059) (0.059)
Time Trend YES YES YES YESFixed Effects YES YES YES YESObservations 114402 114402 114500 114500
* p < 0.10, ** p < 0.05, *** p < 0.01 (two-tailed). Standard errors in parentheses (clustered bymunicipality). Constants estimated but not reported. All independent variables are lagged by one period.“Relevant Neighboring Reforms” are a weighted sum of all expropriations (in-state and out-of state) andin-state land grants within a 100km radius. All reform count measures are log-transformed. Models 1-2include all observations without invasions and invasions not supported by Brazil’s landless movement(MST). Models 3-4 include all observations without invasions and invasions supported by the MST.
43

Table 7. PoliticalAffiliation of Governor and the President as an Alternative Explanation for Land Invasions, 1988–2010
Dependent Variable: Number of Land Invasions
Political Actors: Governors Ideological Agreement Between Governor and President
Political Alignment: N/A N/A Right Left None Right Left None
Model 1 Model 2 Model 3 Model 4 Model 5 Model 6 Model 7 Model 8
Land Gini 6.417*** 6.420*** 6.918*** 3.446*** 6.896*** 6.937*** 3.364*** 6.859***(0.410) (0.393) (0.694) (0.824) (0.556) (0.666) (0.781) (0.530)
All Neighboring Reforms 1.540*** 1.736*** 1.172** 1.065***(0.227) (0.361) (0.518) (0.288)
Relevant Neighboring Reforms 1.584*** 1.794*** 1.150** 1.010***(0.205) (0.328) (0.498) (0.273)
Neighboring Recognitions out of State 0.173 -0.780 -1.278 1.160(0.566) (1.062) (1.380) (0.727)
Land Gini*All Neighboring Reforms -1.315*** -1.500*** -1.319** -0.774**(0.296) (0.452) (0.670) (0.376)
Land Gini*Relevant Neighboring Reforms -1.453*** -1.668*** -1.355** -0.744**(0.262) (0.401) (0.636) (0.350)
Land Gini*Neighboring Recognitions out of State -0.121 0.934 2.077 -1.639*(0.739) (1.382) (1.837) (0.941)
Left Governor 0.016 -0.000 0.227 0.214(0.057) (0.057) (0.175) (0.176)
Right Governor -0.535*** -0.511*** -0.361** -0.382**(0.084) (0.083) (0.162) (0.162)
Percent Rural -0.661*** -0.663*** -0.623** -2.101*** -0.211 -0.655** -2.100*** -0.221(0.198) (0.197) (0.265) (0.410) (0.262) (0.264) (0.410) (0.262)
log(Ag Productivity) 0.055** 0.050** 0.126*** 0.143** -0.026 0.127*** 0.137** -0.032(0.025) (0.025) (0.029) (0.065) (0.035) (0.029) (0.065) (0.035)
log(Income per capita) 0.531*** 0.534*** 0.567** 0.413 0.497** 0.560** 0.405 0.498**(0.152) (0.152) (0.228) (0.333) (0.198) (0.228) (0.334) (0.198)
Time Trend YES YES YES YES YES YES YES YESFixed Effects YES YES YES YES YES YES YES YESObservations 131307 131307 57883 18703 54721 57883 18703 54721
* p<0.10, ** p<0.05, *** p<0.01 (two-tailed). Standard errors in parentheses (clustered by municipality). Constants estimated but not reported.All independent variables are lagged by one period. “All Neighboring Reforms” are a weighted sum of all land grants within a 100km radius.“Neighboring Relevant Reforms” include all expropriations (in-state and out-of state) and in-state land grants within a 100km radius. All reformcount measures are log-transformed. Political alignment indicates whether the political actors are ideologically both on the “Left”, the “Right”or not ideologically aligned (“None”).
44

Figure 1. Land Invasions and Land Reforms in Brazil, 1988–2013
(a) Land Invasions (b) Land Reforms
Note: Data on land invasions are from the Comissao Pastoral da Terra (CPT).Data on land reform are from the Instituto Nacional de Colonizacao e Reforma Agraria (INCRA).
45
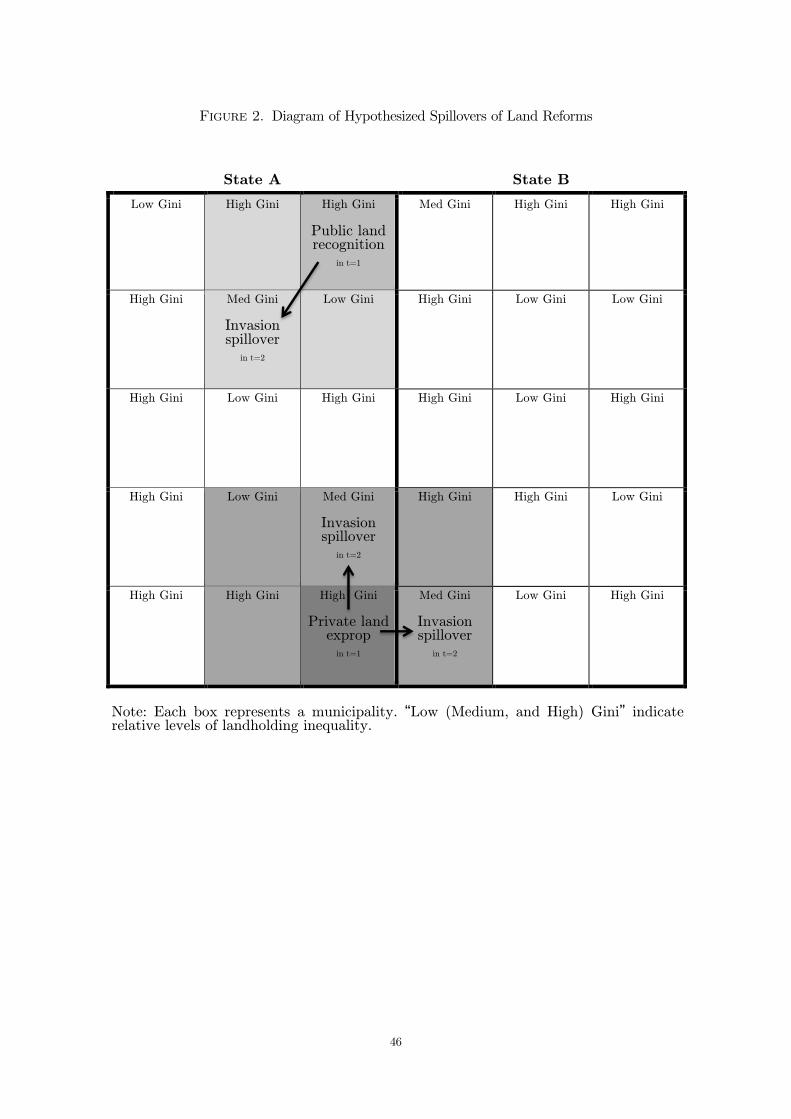
Figure 2. Diagram of Hypothesized Spillovers of Land Reforms
State A
State B
Low Gini
High Gini
High Gini
Public land recognition
in t=1
Med Gini
High Gini
High Gini
High Gini
Med Gini
Invasion spillover
in t=2
Low Gini
High Gini
Low Gini
Low Gini
High Gini
Low Gini
High Gini
High Gini
Low Gini
High Gini
High Gini
Low Gini
Med Gini
Invasion spillover
in t=2
High Gini
High Gini
Low Gini
High Gini
High Gini
High Gini Private land
exprop in t=1
Med Gini
Invasion spillover
in t=2
Low Gini
High Gini
Note: Each box represents a municipality. “Low (Medium, and High) Gini” indicate relative levels of landholding inequality. [XX – do we want to say this last bit? sometimes INCRA finds other nearby properties to use.]
46
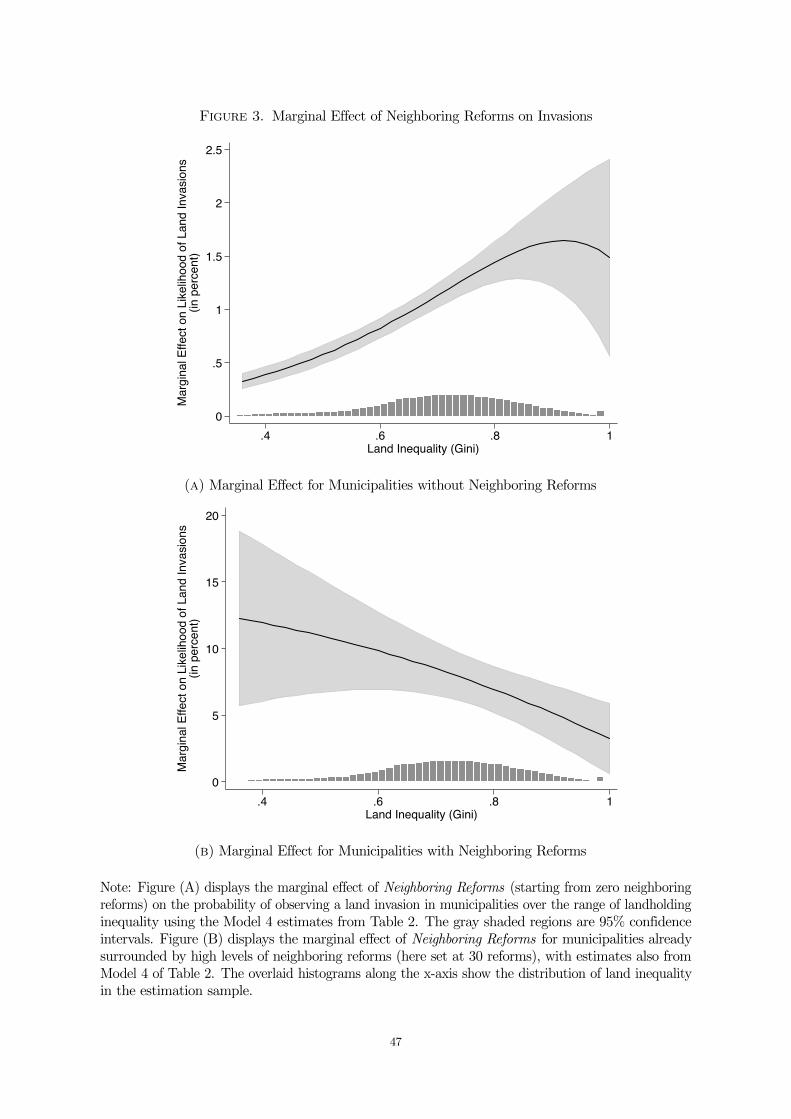
Figure 3. Marginal Effect of Neighboring Reforms on Invasions
0
.5
1
1.5
2
2.5
Mar
gina
l Effe
ct o
n Li
kelih
ood
of L
and
Inva
sion
s(in
per
cent
)
.4 .6 .8 1Land Inequality (Gini)
(a) Marginal Effect for Municipalities without Neighboring Reforms
0
5
10
15
20
Mar
gina
l Effe
ct o
n Li
kelih
ood
of L
and
Inva
sion
s(in
per
cent
)
.4 .6 .8 1Land Inequality (Gini)
(b) Marginal Effect for Municipalities with Neighboring Reforms
Note: Figure (A) displays the marginal effect of Neighboring Reforms (starting from zero neighboringreforms) on the probability of observing a land invasion in municipalities over the range of landholdinginequality using the Model 4 estimates from Table 2. The gray shaded regions are 95% confidenceintervals. Figure (B) displays the marginal effect of Neighboring Reforms for municipalities alreadysurrounded by high levels of neighboring reforms (here set at 30 reforms), with estimates also fromModel 4 of Table 2. The overlaid histograms along the x-axis show the distribution of land inequalityin the estimation sample.
47

Appendix
Tables
A1 Descriptive Statistics ............................................................................................. 49A2 Land Reform Typology ......................................................................................... 50A3 Land Reform Types by State ............................................................................... 53A4 Determinants of Land Invasions in Brazil, 1988–2013:
Including Municipal Fixed Effects as Robustness Check ..................................... 56A5 Sensitivity of Spillover Effects to Controls for Agricultural Production, 1988–2013
Dependent Variable: Number of Land Invasions ................................................... 57A6 Sensitivity to Potential Endogeneity in Land Inequality, 1988–2013................... 58A7 Sensitivity to Including Polarization Measure of Land Inequality, 1988–2013 .... 59A8 Sensitivity to Removing Interpolated Variables, 1988–2013................................. 60A9 Sensitivity to Clustering Standard Errors by Mesoregion, 1988–2013.................. 61A10 Sensitivity of Spillover Effects of Land Reforms on Land Invasions to Inclusion
of Spatial Lags, 1988–2013Dependent Variable: Number of Land Invasions .................................................. 62
Figures
A1 Land Invasions and Land Reforms in Brazil, 1988–2013....................................... 54A2 Public Recognitions vs. Private Expropriations by State, 1988–2013 ................. 55
48

Table A1. Descriptive Statistics
Variable Mean Std. Dev. Min. Max. NLand Invasions (Count) 0.07 0.49 0 31 144768Land Invasions (Dummy) 0.04 0.19 0 1 144768Land Invasions (Families) 8.6 91.66 0 12540 144768Land Grants (Count) 0.06 0.42 0 22 144768Land Grants (Families Settled) 6.05 74.22 0 7318 144768Land Grant Area 531.84 15897.28 0 2450381 144768Neighboring Reforms 2.08 4.22 0 81 144638Neighboring Expropriations 1.5 3.34 0 81 144638Neighboring Recognitions 0.38 1.73 0 49 144638Neighboring Expropriations In-State 1.15 2.72 0 81 144638Neighboring Expropriations Out-of-State 0.35 1.37 0 44 144638Neighboring Recognitions In-State 0.3 1.51 0 49 144638Neighboring Recognitions Out-of-State 0.08 0.77 0 29 144638Neighboring Invasions 3.43 9.13 0 152 144638Cumulative Reforms 0.83 2.63 0 78 144768Land Inequality (Gini) 0.71 0.13 0.01 0.99 142324Percent Rural 0.42 0.24 0 1 143188log(Agricultural Productivity) 4.18 1.46 0 9.13 144454log(Income Per Capita) 5.24 0.76 3.22 7.58 143190Municipality with Rural Assassinations (Dummy) 0.09 0.29 0 1 145490Rural Assassinations in the Past (Dummy) 0.06 0.23 0 1 145490Rural Assassinations (Count) 0.12 0.87 0 31.5 145490Municipal Guard Exists 0.12 0.33 0 1 145490Municipal Guard Personel per Capita 0 0 0 0.37 136915Municipal Guard Aids Military Police 0.64 0.48 0 1 8768Political Business Connection (Dummy) 0.01 0.12 0 1 61519Political Business Connection (Count) 0.07 1.06 0 48 61519Political Business Connection (Area) 76.01 2820.09 0 195309 61508MST supported Invasions 0.02 0.12 0 1 144768Sugar Dependence 0.09 0.21 0 1 117584Cattle Dependence 1.64 1.14 0 10.21 133979Soy Dependence 0.08 0.18 0 1 117621Coffee Dependence 0.06 0.16 0 1 117634Left Governor 0.21 0.41 0 1 138716Right Governor 0.16 0.37 0 1 138716∆ Land Gini 0.01 0.09 -0.74 0.73 142246Number of Farms smaller 1ha / larger 100ha 0.56 0.86 0 1.89 145490
49

Typology of Land Reforms
The way in which land is obtained for the purposes of distribution is key to our theoretical
argument and empirical strategy. We leverage two main types of land reform in the manuscript:
expropriations of private land and the recognition of settlements on public lands. Expropriations
are overwhelmingly conducted by the federal government, whereas recognitions largely stem from
public lands that are mostly held by states.
This broad distinction is made by categorizing the somewhat more diverse ways in which
land is obtained (forma obtencao) for the purposes of land reform. These data are collected for
each land grant both by INCRA as well as by the CPT (and, consequently, are in the Dataluta
dataset). Table A2 enumerates every way in which land can be obtained for the purpose of land
reform and how we categorize these ways for the purposes of our analysis. The overwhelming
number of land reforms that have been completed, 8,004 out of 8,918 (note that 305 of the 9,223
were still under review), come in the form of expropriations of private lands and recognitions
of public lands. Consider expropriations. Not only do 62% of transfers occur through typical
desapropriacoes in which private landowners are indemnified in cash and government bonds
according to the market value of their property, but in select cases expropriations occur via
confiscation (where no payment is made, typically due to involvement in illicit activities), collection
(when back taxes are owed and charged toward the indemnification payment), reversion (typically
due to illegal or fake land titles), or with payment in kind rather than cash.
Table A2. Land Reform Typology
Obtainment Obtainment Classification Frequency
Adjudicacao Adjudication Recognition 28Arrecadacao Collection Expropriation 734Cessao Cession Transfer/Incorp. 19Compra Purchase Purchase 532Confisco Confiscation Expropriation 38Dacao Payment in kind Expropriation 6Desapropriacao Expropriation Expropriation 5,544Discriminacao Reclamation Transfer/Incorp. 59Doacao Donation Transfer/Incorp. 141Em Obtencao Under Review N/A 305Incorporacao Incorporation Transfer/Incorp. 7Outros Other N/A 24Reconhecimento Recognition Recognition 1,625Reversao de Domınio Reversion Expropriation 29Transferencia Transfer Transfer/Incorp. 132
50

As discussed on p. 16 of the manuscript, Table A2 includes two categories – purchase and
transfer/incorporation – that we do not include in our analysis. This is for two reasons. First, it
is not a priori clear from a theoretical standpoint what invaders should learn from these activities
(and, therefore, whether they should yield spillover effects to land invasions or not). In some
cases, for instance, INCRA’s ex ante negotiated purchase of a private property for settlement may
incentivize more invasions; in other cases, because such purchases can either be very costly or arise
when a landowner has no heirs to pass the property onto and therefore voluntarily sells it to the
state, they can appear ad hoc in nature, such that similar circumstances are unlikely to transpire
in neighboring regions. Second, many purchases and transfers entail coordination between state
and federal actions (e.g., public land transfers between different levels of government). In any
case, these categories, along with unclassified reforms, only constitute 10% of all land reforms
that were completed from 1988–2013.
Table A3 displays the number of cases of land reform in each state according to how the
land was obtained for the purposes of reform. As is evident, different states demonstrate different
patterns when it comes to obtaining land. Figure A2 visualizes part of that information by
comparing the number of public recognitions and private expropriations by state over time.
Once land is obtained for the purposes of land reform, a diverse set of settlement/project
types can ensue. A variety of state, federal, and in select cases municipal agencies can be involved.
However, a key distinction remains the source of the land rather than the management of a
project: because different levels of government have access to different tools when it comes to
obtaining land for the purposes of transferring it to squatters, would-be land invaders care most
about the likelihood that squatting will yield benefits in the form of access to land.
The settlement/project types are as follows: Assentamento Federal, Assentamento Agroex-
trativista Federal, Assentamento Estadual, Assentamento Municipal, Programa Cedula Da
Terra, Assentamento Estadual Sem Convenio, Assentamento Casulo, Colonizacao, Assentamento
Dirigido, Assentamento Rapido, Especial De Assentamento, Colonizacao Oficial, Especial De
Colonizacao, Integrado De Colonizacao, Assentamento Conjunto, Area De Regularizacao Fundiaria,
Assentamento Quilombola, Projeto De Desenvolvimento Sustentavel, Reserva Extrativista, Ter-
ritorio Remanescentes De Quilombos, Assentamento Florestal, Floresta Nacional, Reserva De
Desenvolvimento Sustentavel, Reassentamento De Barragem, Reconhecimento De Assentamento
51

Fundo De Pasto, Terra Indıgena, Reconhecimento De Projeto Publicode Irrigacao, Assentamento
Agroindustrial, and Floresta Estadual. Generally speaking, the governmental level of the agency
managing a specific land settlement project maps closely onto the origins of the land itself.
For instance, of the 5,544 cases of desapropriacao, 5,521 projects were managed by the federal
government through INCRA. This is also true in every case of confisco, reversao de domınio,
and dacao, and in 703 of 734 cases of arrecadacao.
52

Table A3. Land Reform Types by State
StateReform Type AC AL AM AP BA CE DF ES GO MA MG MS MT PA PB PE PI PR RJ RN RO RR RS SC SE SP TO Total
Adjudication 1 23 1 1 1 1 28
Cession 1 1 1 1 4 11 19
Collection 50 62 33 1 37 3 93 230 8 3 1 79 63 4 67 734
Confiscation 1 1 33 2 1 38
Donation 1 2 8 8 6 2 5 10 7 3 1 4 42 21 5 2 2 3 6 2 1 141
Expropriation 61 111 11 503 399 1 66 349 525 312 120 305 435 252 414 239 257 52 276 80 133 112 167 98 266 5544
Incorporation 1 1 3 1 1 7
Other 1 3 1 5 1 6 1 1 1 4 24
Payment in kind 1 4 1 6
Purchase 2 57 2 8 5 4 43 13 22 64 29 33 15 30 45 33 10 12 49 21 12 7 16 532
Reclamation 1 21 1 1 34 1 59
Recognition 37 1 36 9 166 40 11 22 42 313 54 12 146 41 33 36 186 19 16 9 26 148 20 34 141 27 1625
Reversion 2 1 10 16 29
Transfer 2 3 2 3 92 2 8 1 3 5 6 1 4 132
Under Review 3 302 305
Total 156 175 144 45 689 450 14 95 444 990 402 205 576 1107 302 592 496 323 76 296 216 67 338 161 215 266 383 922353

Figure A1. Land Invasions and Land Reforms in Brazil, 1988–2013
0
200
400
600
800
Cou
nt o
f Inv
asio
ns a
nd R
efor
ms
1990 1995 2000 2005 2010 2015Year
Invasions Land Reforms
54

Figure A2. Public Recognitions vs. Private Expropriations by State, 1988–2013
05
101520
198819
8919
9019
9119
9219
9319
9419
9519
9619
9719
9819
9920
0020
0120
0220
0320
0420
0520
0620
0720
0820
0920
10201120
1220
13
AC
0
10
20
30
198819
8919
9019
9119
9219
9319
9419
9519
9619
9719
9819
9920
0020
0120
0220
0320
0420
0520
0620
0720
0820
0920
10201120
1220
13
AL
05
10152025
198819
8919
9019
9119
9219
9319
9419
9519
9619
9719
9819
9920
0020
0120
0220
0320
0420
0520
0620
0720
0820
0920
10201120
1220
13
AM
02468
10
198819
8919
9019
9119
9219
9319
9419
9519
9619
9719
9819
9920
0020
0120
0220
0320
0420
0520
0620
0720
0820
0920
10201120
1220
13
AP
020406080
100
198819
8919
9019
9119
9219
9319
9419
9519
9619
9719
9819
9920
0020
0120
0220
0320
0420
0520
0620
0720
0820
0920
10201120
1220
13
BA
020406080
198819
8919
9019
9119
9219
9319
9419
9519
9619
9719
9819
9920
0020
0120
0220
0320
0420
0520
0620
0720
0820
0920
10201120
1220
13
CE
05
101520
198819
8919
9019
9119
9219
9319
9419
9519
9619
9719
9819
9920
0020
0120
0220
0320
0420
0520
0620
0720
0820
0920
10201120
1220
13
ES
01020304050
198819
8919
9019
9119
9219
9319
9419
9519
9619
9719
9819
9920
0020
0120
0220
0320
0420
0520
0620
0720
0820
0920
10201120
1220
13
GO
020406080
100
198819
8919
9019
9119
9219
9319
9419
9519
9619
9719
9819
9920
0020
0120
0220
0320
0420
0520
0620
0720
0820
0920
10201120
1220
13
MA
020406080
198819
8919
9019
9119
9219
9319
9419
9519
9619
9719
9819
9920
0020
0120
0220
0320
0420
0520
0620
0720
0820
0920
10201120
1220
13
MG
05
10152025
198819
8919
9019
9119
9219
9319
9419
9519
9619
9719
9819
9920
0020
0120
0220
0320
0420
0520
0620
0720
0820
0920
10201120
1220
13
MS
0
20
40
60
198819
8919
9019
9119
9219
9319
9419
9519
9619
9719
9819
9920
0020
0120
0220
0320
0420
0520
0620
0720
0820
0920
10201120
1220
13
MT
050
100150200
198819
8919
9019
9119
9219
9319
9419
9519
9619
9719
9819
9920
0020
0120
0220
0320
0420
0520
0620
0720
0820
0920
10201120
1220
13
PA
0
10
20
30
198819
8919
9019
9119
9219
9319
9419
9519
9619
9719
9819
9920
0020
0120
0220
0320
0420
0520
0620
0720
0820
0920
10201120
1220
13
PB
0
20
40
60
198819
8919
9019
9119
9219
9319
9419
9519
9619
9719
9819
9920
0020
0120
0220
0320
0420
0520
0620
0720
0820
0920
10201120
1220
13
PE
020406080
198819
8919
9019
9119
9219
9319
9419
9519
9619
9719
9819
9920
0020
0120
0220
0320
0420
0520
0620
0720
0820
0920
10201120
1220
13
PI
010203040
198819
8919
9019
9119
9219
9319
9419
9519
9619
9719
9819
9920
0020
0120
0220
0320
0420
0520
0620
0720
0820
0920
10201120
1220
13
PR
02468
10
198819
8919
9019
9119
9219
9319
9419
9519
9619
9719
9819
9920
0020
0120
0220
0320
0420
0520
0620
0720
0820
0920
10201120
1220
13
RJ
010203040
198819
8919
9019
9119
9219
9319
9419
9519
9619
9719
9819
9920
0020
0120
0220
0320
0420
0520
0620
0720
0820
0920
10201120
1220
13
RN
05
101520
198819
8919
9019
9119
9219
9319
9419
9519
9619
9719
9819
9920
0020
0120
0220
0320
0420
0520
0620
0720
0820
0920
10201120
1220
13
RO
05
101520
198819
8919
9019
9119
9219
9319
9419
9519
9619
9719
9819
9920
0020
0120
0220
0320
0420
0520
0620
0720
0820
0920
10201120
1220
13
RR
0
20
40
60
198819
8919
9019
9119
9219
9319
9419
9519
9619
9719
9819
9920
0020
0120
0220
0320
0420
0520
0620
0720
0820
0920
10201120
1220
13
RS
0
5
10
15
198819
8919
9019
9119
9219
9319
9419
9519
9619
9719
9819
9920
0020
0120
0220
0320
0420
0520
0620
0720
0820
0920
10201120
1220
13
SC
05
10152025
198819
8919
9019
9119
9219
9319
9419
9519
9619
9719
9819
9920
0020
0120
0220
0320
0420
0520
0620
0720
0820
0920
10201120
1220
13
SE
01020304050
198819
8919
9019
9119
9219
9319
9419
9519
9619
9719
9819
9920
0020
0120
0220
0320
0420
0520
0620
0720
0820
0920
10201120
1220
13
SP
01020304050
198819
8919
9019
9119
9219
9319
9419
9519
9619
9719
9819
9920
0020
0120
0220
0320
0420
0520
0620
0720
0820
0920
10201120
1220
13
TO
Public Land Recognitions Private Expropriations
55

Table A4. Determinants of Land Invasions in Brazil, 1988–2013:Including Municipal Fixed Effects as Robustness Check
Full Sample |∆Land Gini|<0.005
Invasions Measure as DV: Count Families Count Families Count Families Count Families
Model 1 Model 2 Model 3 Model 4 Model 5 Model 6 Model 7 Model 8
Land Gini 4.062*** 3.920*** 1.247*** 1.989*** 1.671*** 2.437*** 2.503*** 3.422***(0.268) (0.240) (0.262) (0.227) (0.304) (0.249) (0.596) (0.397)
Neighboring Reforms 1.075*** 1.274*** 0.902*** 1.016*** 0.595*** 0.825*** 0.807*** 1.201***(0.152) (0.139) (0.156) (0.138) (0.165) (0.147) (0.247) (0.216)
Land Gini*Neighboring Reforms -1.007*** -1.190*** -0.587*** -0.690*** -0.505** -0.691*** -0.760** -1.131***(0.193) (0.177) (0.199) (0.176) (0.211) (0.186) (0.316) (0.274)
Percent Rural -0.693*** -0.575*** -0.803*** -0.612*** -0.203 -0.354*** -0.559** -0.648***(0.138) (0.107) (0.151) (0.101) (0.178) (0.113) (0.248) (0.159)
log(Ag Productivity) 0.058*** 0.095*** 0.091*** 0.126*** 0.053** 0.101*** 0.044 0.108***(0.019) (0.017) (0.018) (0.016) (0.021) (0.018) (0.029) (0.025)
log(Income per capita) 0.302*** 0.290*** 0.234*** 0.258*** 0.395*** 0.302*** 0.405*** 0.306***(0.062) (0.048) (0.031) (0.028) (0.077) (0.050) (0.107) (0.071)
Time Trend YES YES NO NO YES YES YES YESFixed Effects NO NO YES YES YES YES YES YESObservations 137141 137141 43004 42226 43004 42226 24338 23884
* p < 0.10, ** p < 0.05, *** p < 0.01 (two-tailed). Standard errors in parentheses (clustered by municipality for regressionwithout municipal fixed effects). Constants estimated but not reported. All independent variables are lagged by one period.“Neighboring Reforms” are a weighted sum of all land grants in municipalities within a 100km radius. All reform count measuresare log-transformed. Models 7 – 8 are restricted to municipalities in which the landholding gini changed by less than 0.005 annuallyfrom 1996 to 2006. Models 1 – 2 include municipal random effects and models 3 – 8 include municipal fixed effects.
56

Table A5. Sensitivity of Spillover Effects to Controls for Agricultural Production, 1988–2013Dependent Variable: Number of Land Invasions
Model 1 Model 2 Model 3 Model 4 Model 5
Neighboring Recognitions out of State 0.087 0.497 0.318 0.320 0.276(0.579) (0.579) (0.577) (0.571) (0.592)
Relevant Neighboring Reforms 1.445*** 1.573*** 1.623*** 1.544*** 1.517***(0.207) (0.211) (0.212) (0.211) (0.207)
Land Gini*Relevant Neighboring Reforms -1.289*** -1.450*** -1.516*** -1.418*** -1.406***(0.265) (0.270) (0.270) (0.270) (0.264)
Land Gini*Neighboring Recognitions out of State -0.030 -0.461 -0.296 -0.268 -0.229(0.757) (0.752) (0.752) (0.744) (0.771)
Land Gini 6.418*** 6.929*** 7.080*** 6.889*** 6.599***(0.405) (0.406) (0.421) (0.410) (0.398)
Percent Rural -0.600*** -0.650*** -0.496** -0.480** -0.467**(0.202) (0.196) (0.201) (0.197) (0.194)
log(Ag Productivity) -0.112*** -0.087** -0.146*** -0.113*** -0.092**(0.042) (0.041) (0.044) (0.041) (0.045)
log(Income per capita) 0.621*** 0.503*** 0.712*** 0.726*** 0.578***(0.154) (0.148) (0.158) (0.152) (0.144)
Cattle Dependence 0.119*** 0.245***(0.040) (0.046)
Soy Dependence 1.413*** 1.906***(0.202) (0.232)
Sugar Dependence 0.185 0.489***(0.158) (0.154)
Coffee Dependence -1.387*** -0.863***(0.323) (0.315)
Time Trend YES YES YES YES YESFixed Effects YES YES YES YES YESObservations 127608 116826 116791 116839 116776
* p<0.10, ** p<0.05, *** p<0.01 (two-tailed). Standard errors in parentheses (clustered by municipality).Constants estimated but not reported. All independent variables are lagged by one period. “Relevant NeighboringReforms” are a weighted sum of all expropriations (in-state and out-of state) and in-state land grants inmunicipalities within a 100km radius. All reform count measures are log-transformed. The agriculturaldependency measure for cattle production is the logged ratio of the number of cattle per square kilometer. Theremaining dependency measures are the shares of cultivated land in a municipality used to grow the respective crop.
57

Table A6. Sensitivity to Potential Endogeneity in Land Inequality, 1988–2013
Dependent Variable: Invasion Count Invasion Dummy Invasion Families
Change in Land Gini: |∆|<0.005 |∆|<0.003 |∆|<0.001 |∆|<0.005 |∆|<0.003 |∆|<0.001 |∆|<0.005 |∆|<0.003 |∆|<0.001
Model 1 Model 2 Model 3 Model 4 Model 5 Model 6 Model 7 Model 8 Model 9
Land Gini 7.834*** 8.027*** 8.135*** 7.403*** 7.380*** 7.513*** 11.256*** 10.962*** 16.257***(0.635) (0.824) (1.355) (0.505) (0.657) (1.251) (1.140) (1.217) (1.770)
Neighboring Reforms 1.707*** 1.803*** 2.291*** 1.869*** 1.972*** 2.221*** 2.997*** 3.055*** 4.357***(0.320) (0.405) (0.523) (0.242) (0.298) (0.491) (0.542) (0.605) (0.689)
Land Gini*Neighboring Reforms -1.576*** -1.628*** -2.354*** -1.805*** -1.867*** -2.245*** -3.196*** -3.173*** -5.310***(0.414) (0.521) (0.667) (0.315) (0.387) (0.640) (0.705) (0.783) (0.886)
Percent Rural -1.047*** -1.516*** -1.208** -0.911*** -1.256*** -0.958** -1.507*** -2.042*** -3.472***(0.294) (0.355) (0.470) (0.228) (0.259) (0.410) (0.411) (0.493) (0.960)
log(Ag Productivity) 0.033 -0.026 -0.128** 0.071* 0.028 -0.044 0.243*** 0.214** 0.082(0.038) (0.042) (0.064) (0.040) (0.046) (0.067) (0.072) (0.087) (0.117)
log(Income per capita) 0.486** 0.492** 1.322*** 0.485*** 0.451** 1.003*** 0.454* 0.312 0.593(0.193) (0.233) (0.389) (0.168) (0.192) (0.309) (0.260) (0.299) (0.588)
Time Trend YES YES YES YES YES YES YES YES YESFixed Effects YES YES YES YES YES YES YES YES YESObservations 77752 52704 18040 77650 52628 17913 77752 52704 18040
* p<0.10, ** p<0.05, *** p<0.01 (two-tailed). Standard errors in parentheses (clustered by municipality). Constants estimated but not reported. Allindependent variables are lagged by one period. “Neighboring Reforms” are a weighted sum of all land grants in municipalities within a 100km radius.All reform count measures are log-transformed.
58

Table A7. Sensitivity to Including Polarization Measure of Land Inequality, 1988–2013
Full Sample Municipalities where |∆Land Gini|<0.005
Invasion Invasion Invasion Invasion Invasion Invasion InvasionDependent Variable: Invasion Count Dummy Families Count Dummy Families Count Families
Model 1 Model 2 Model 3 Model 4 Model 5 Model 6 Model 7 Model 8 Model 9 Model 10
Land Gini 5.552*** 5.366*** 6.167*** 5.480*** 8.906*** 7.768*** 7.352*** 11.068*** 2.214*** 3.347***(0.353) (0.342) (0.404) (0.326) (0.691) (0.630) (0.506) (1.175) (0.601) (0.403)
Neighboring Reforms 0.530*** 1.445*** 1.427*** 2.836*** 1.678*** 1.866*** 3.144*** 0.775*** 1.258***(0.032) (0.228) (0.174) (0.429) (0.326) (0.249) (0.568) (0.254) (0.225)
Land Gini*Neighboring Reforms -1.205*** -1.249*** -2.952*** -1.549*** -1.806*** -3.312*** -0.736** -1.198***(0.295) (0.223) (0.534) (0.418) (0.322) (0.722) (0.321) (0.283)
Farm Ratio 1ha/100ha -0.046 -0.054 -0.062 -0.036 -0.002 -0.061 -0.093 -0.069 -0.233*** -0.104**(0.055) (0.053) (0.061) (0.048) (0.087) (0.080) (0.063) (0.111) (0.063) (0.048)
Farm Ratio*Neighboring Reforms 0.007 -0.012 -0.149** 0.026 0.013 -0.094 0.028 -0.022(0.036) (0.032) (0.063) (0.048) (0.044) (0.087) (0.038) (0.038)
Percent Rural -0.730*** -0.649*** -0.655*** -0.555*** -1.068*** -1.045*** -0.902*** -1.510*** -0.521** -0.611***(0.206) (0.199) (0.200) (0.172) (0.321) (0.296) (0.229) (0.406) (0.248) (0.161)
log(Ag Productivity) 0.027 0.043* 0.047* 0.063** 0.223*** 0.030 0.064 0.243*** 0.042 0.105***(0.025) (0.025) (0.026) (0.025) (0.050) (0.039) (0.041) (0.071) (0.030) (0.026)
log(Income per capita) 0.359** 0.508*** 0.514*** 0.580*** 0.277 0.471** 0.469*** 0.401 0.413*** 0.320***(0.159) (0.156) (0.155) (0.122) (0.199) (0.191) (0.168) (0.260) (0.107) (0.072)
Time Trend YES YES YES YES YES YES YES YES YES YESFixed Effects STATE STATE STATE STATE STATE STATE STATE STATE MUNI MUNIObservations 137141 137141 137141 137141 137141 77752 77650 77752 24338 23884
* p<0.10, ** p<0.05, *** p<0.01 (two-tailed). Standard errors in parentheses (clustered by municipality). Constants estimated but not reported. All independentvariables are lagged by one period. “Neighboring Reforms” are a weighted sum of all land grants in municipalities within a 100km radius. All reform countmeasures are log-transformed. Models 6-10 are restricted to municipalities in which the landholding Gini changed by less than 0.005 annually from 1996 to 2006.
59

Table A8. Sensitivity to Removing Interpolated Variables, 1988–2013
Non-Interpolated Land Gini Dropping Interpolated Variables ”Percent Rural” and ”log(Income per capita)”
Sample: Years 1996 and 2006 only Full Sample Municipalities where |∆Land Gini|<0.005
Invasion Invasion Invasion Invasion Invasion Invasion Invasion Invasion Invasion Invasion Invasion Invasion
Dependent Variable: Count Dummy Families Count Dummy Families Count Dummy Families Count Dummy Families
Model 1 Model 2 Model 3 Model 4 Model 5 Model 6 Model 7 Model 8 Model 9 Model 10 Model 11 Model 12
Land Gini 7.715*** 5.981*** 16.111*** 6.168*** 5.504*** 9.291*** 7.774*** 7.425*** 11.739*** 2.220*** 3.150** 3.026***
(0.744) (0.627) (1.285) (0.398) (0.317) (0.675) (0.597) (0.490) (1.115) (0.581) (1.350) (0.384)
Neighboring Reforms 1.981*** 1.630*** 4.335*** 1.324*** 1.327*** 2.733*** 1.526*** 1.701*** 3.346*** 0.813*** 0.760*** 1.150***
(0.463) (0.366) (0.678) (0.222) (0.166) (0.424) (0.319) (0.241) (0.540) (0.248) (0.292) (0.214)
Land Gini*Neighboring Reforms -2.104*** -1.801*** -5.274*** -1.091*** -1.161*** -2.942*** -1.383*** -1.617*** -3.702*** -0.806** -0.655* -1.142***
(0.589) (0.466) (0.891) (0.289) (0.216) (0.538) (0.414) (0.315) (0.705) (0.317) (0.375) (0.272)
log(Ag Productivity) 0.057 0.077* 0.242*** 0.106*** 0.115*** 0.282*** 0.107*** 0.126*** 0.334*** 0.068** 0.061* 0.171***
(0.047) (0.043) (0.094) (0.025) (0.025) (0.047) (0.038) (0.039) (0.067) (0.029) (0.035) (0.025)
Percent Rural -0.423 -0.744** -0.405
(0.330) (0.298) (0.636)
log(Income per capita) 0.431* 0.234 0.756*
(0.243) (0.206) (0.450)
Time Trend YES YES YES YES YES YES YES YES YES YES YES YES
Fixed Effects STATE STATE STATE STATE STATE STATE STATE STATE STATE MUNI MUNI MUNI
Observations 10878 10846 10878 137197 137197 137197 77752 77650 77752 24338 24338 23884
* p<0.10, ** p<0.05, *** p<0.01 (two-tailed). Standard errors in parentheses (clustered by municipality). Constants estimated but not reported. All independent variables
are lagged by one period. “Neighboring Reforms” are a weighted sum of all land grants in municipalities within a 100km radius. All reform count measures are log-transformed.
Models 1–3 are restricted to agricultural census years in which the land Gini is available. Models 7–12 are restricted to municipalities in which the landholding Gini changed
by less than 0.005 annually from 1996 to 2006.
60

Table A9. Sensitivity to Clustering Standard Errors by Mesoregion, 1988–2013
Full Sample Municipalities where |∆Land Gini|<0.005
Invasion Invasion Invasion Invasion Invasion Invasion InvasionDependent Variable: Invasion Count Dummy Families Count Dummy Families Count Families
Model 1 Model 2 Model 3 Model 4 Model 5 Model 6 Model 7 Model 8 Model 9 Model 10
Land Gini 5.603*** 5.424*** 6.225*** 5.493*** 8.930*** 7.834*** 7.403*** 11.256*** 2.503*** 3.422***(0.688) (0.660) (0.753) (0.592) (0.824) (1.253) (1.000) (0.911) (0.596) (0.397)
Neighboring Reforms 0.529*** 1.447*** 1.398*** 2.574*** 1.707*** 1.869*** 2.997*** 0.807*** 1.201***(0.055) (0.331) (0.261) (0.422) (0.458) (0.368) (0.597) (0.247) (0.216)
Land Gini*Neighboring Reforms -1.203*** -1.219*** -2.707*** -1.576*** -1.805*** -3.196*** -0.760** -1.131***(0.407) (0.331) (0.516) (0.593) (0.472) (0.769) (0.316) (0.274)
Percent Rural -0.731*** -0.651** -0.657** -0.557** -1.067** -1.047*** -0.911*** -1.507*** -0.559** -0.648***(0.278) (0.261) (0.259) (0.226) (0.416) (0.375) (0.293) (0.503) (0.248) (0.159)
log(Ag Productivity) 0.031 0.047 0.051 0.066* 0.225*** 0.033 0.071 0.243*** 0.044 0.108***(0.038) (0.037) (0.037) (0.035) (0.062) (0.053) (0.051) (0.066) (0.029) (0.025)
log(Income per capita) 0.374 0.525** 0.531** 0.589*** 0.303 0.486 0.485* 0.454 0.405*** 0.306***(0.275) (0.263) (0.259) (0.225) (0.334) (0.303) (0.270) (0.432) (0.107) (0.071)
Time Trend YES YES YES YES YES YES YES YES YES YESFixed Effects STATE STATE STATE STATE STATE STATE STATE STATE MUNI MUNIObservations 137141 137141 137141 137141 137141 77752 77650 77752 24338 23884
* p<0.10, ** p<0.05, *** p<0.01 (two-tailed). Standard errors in parentheses (clustered by mesoregion). Constants estimated but not reported. All indepen-dent variables are lagged by one period. “Neighboring Reforms” are a weighted sum of all land grants in municipalities within a 100km radius. All reform countmeasures are log-transformed. Models 6-10 are restricted to municipalities in which the landholding Gini changed by less than 0.005 annually from 1996 to 2006.
61

Table A10. Sensitivityof Spillover Effects of Land Reforms on Land Invasions to Inclusion of Spatial Lags, 1988–2013
Dependent Variable: Number of Land Invasions
Model 1 Model 2 Model 3 Model 4 Model 5 Model 6
Neighboring Land Invasions (t-1) 0.607*** 0.499*** 0.475*** 0.269*** 0.182*** 0.378***(0.038) (0.036) (0.037) (0.022) (0.024) (0.023)
Neighboring Land Invasions (t-2) 0.192*** 0.191*** 0.032 0.092*** 0.047**(0.035) (0.033) (0.024) (0.024) (0.023)
Neighboring Land Invasions (t-3) 0.031 -0.099***(0.033) (0.022)
Neighboring Recognitions out of State -0.221 -0.260 -0.261 0.887 0.867 0.694(0.678) (0.701) (0.708) (0.586) (0.584) (0.594)
Relevant Neighboring Reforms 1.108*** 1.066*** 1.032*** 0.380** 0.354** 0.536***(0.200) (0.202) (0.205) (0.155) (0.154) (0.150)
Land Gini*Neighboring Recognitions out of State 0.085 0.104 0.111 -1.109 -1.124 -0.807(0.877) (0.904) (0.913) (0.759) (0.757) (0.769)
Land Gini*Relevant Neighboring Reforms -1.146*** -1.136*** -1.117*** -0.333* -0.415** -0.389**(0.258) (0.259) (0.262) (0.196) (0.195) (0.189)
Land Gini 6.007*** 5.988*** 5.993*** 1.423*** 1.502*** 1.100***(0.367) (0.367) (0.374) (0.299) (0.293) (0.289)
Percent Rural -0.421** -0.397** -0.345* 0.051 -0.173 -1.115***(0.185) (0.185) (0.190) (0.186) (0.186) (0.181)
log(Ag Productivity) 0.046* 0.045* 0.033 0.041* 0.053** 0.107***(0.026) (0.027) (0.027) (0.021) (0.021) (0.020)
log(Income per capita) 0.659*** 0.678*** 0.737*** 0.547*** 0.355*** -0.326***(0.143) (0.144) (0.150) (0.081) (0.083) (0.093)
Time Trend TREND TREND TREND TREND YEAR FE STATSPECFixed Effects STATE STATE STATE MUNI MUNI MUNIObservations 137141 135819 130350 40645 42642 42642
* p<0.10, ** p<0.05, *** p<0.01 (two-tailed). Standard errors in parentheses (clustered by municipality). Constants estimatedbut not reported. All independent variables are lagged by one period. “Relevant Neighboring Reforms” are a weighted sumof all expropriations (in-state and out-of state) and in-state land grants in municipalities within a 100km radius. All reformcount measures are log-transformed. Model 6 contains state-specific time trends.
62